Shipman, VA Map & Demographics
Shipman Map
Shipman Overview
$15,366
PER CAPITA INCOME
$47,000
AVG FAMILY INCOME
0.46
INEQUALITY / GINI INDEX
439
TOTAL POPULATION
199
MALE POPULATION
240
FEMALE POPULATION
82.92
MALES / 100 FEMALES
120.60
FEMALES / 100 MALES
46.1
MEDIAN AGE
2.8
AVG FAMILY SIZE
2.4
AVG HOUSEHOLD SIZE
170
LABOR FORCE [ PEOPLE ]
48.4%
PERCENT IN LABOR FORCE
10.0%
UNEMPLOYMENT RATE
Shipman Zip Codes
Shipman Area Codes
Income in Shipman
Income Overview in Shipman
| Characteristic | Number | Measure |
| Per Capita Income | 439 | $15,366 |
| Median Family Income | 122 | $47,000 |
| Mean Family Income | 122 | $44,561 |
| Median Household Income | 184 | $0 |
| Mean Household Income | 184 | $36,344 |
| Income Deficit | 122 | $0 |
| Wage / Income Gap (%) | 439 | 0.00% |
| Wage / Income Gap ($) | 439 | 100.00¢ per $1 |
| Gini / Inequality Index | 439 | 0.46 |
Earnings by Sex in Shipman
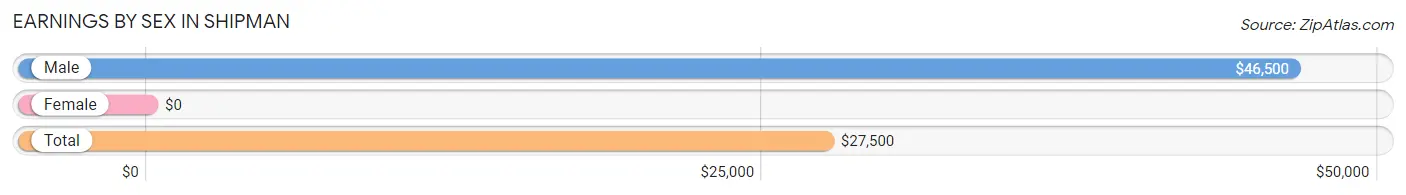
| Sex | Number | Average Earnings |
| Male | 94 (55.3%) | $46,500 |
| Female | 76 (44.7%) | $0 |
| Total | 170 (100.0%) | $27,500 |
Earnings by Sex by Income Bracket in Shipman
The most common earnings brackets in Shipman are $45,000 to $49,999 for men (41 | 43.6%) and $15,000 to $17,499 for women (22 | 28.9%).
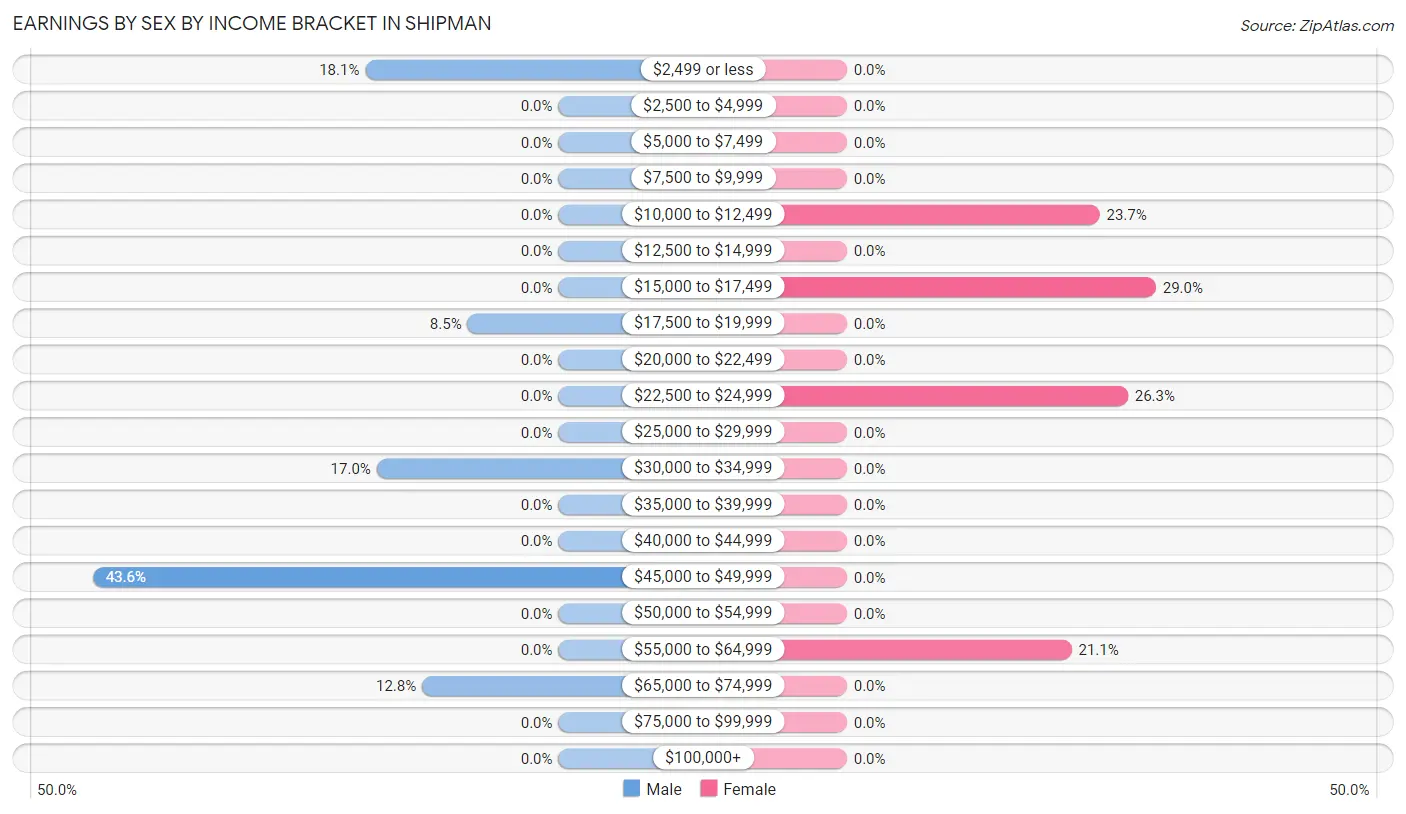
| Income | Male | Female |
| $2,499 or less | 17 (18.1%) | 0 (0.0%) |
| $2,500 to $4,999 | 0 (0.0%) | 0 (0.0%) |
| $5,000 to $7,499 | 0 (0.0%) | 0 (0.0%) |
| $7,500 to $9,999 | 0 (0.0%) | 0 (0.0%) |
| $10,000 to $12,499 | 0 (0.0%) | 18 (23.7%) |
| $12,500 to $14,999 | 0 (0.0%) | 0 (0.0%) |
| $15,000 to $17,499 | 0 (0.0%) | 22 (28.9%) |
| $17,500 to $19,999 | 8 (8.5%) | 0 (0.0%) |
| $20,000 to $22,499 | 0 (0.0%) | 0 (0.0%) |
| $22,500 to $24,999 | 0 (0.0%) | 20 (26.3%) |
| $25,000 to $29,999 | 0 (0.0%) | 0 (0.0%) |
| $30,000 to $34,999 | 16 (17.0%) | 0 (0.0%) |
| $35,000 to $39,999 | 0 (0.0%) | 0 (0.0%) |
| $40,000 to $44,999 | 0 (0.0%) | 0 (0.0%) |
| $45,000 to $49,999 | 41 (43.6%) | 0 (0.0%) |
| $50,000 to $54,999 | 0 (0.0%) | 0 (0.0%) |
| $55,000 to $64,999 | 0 (0.0%) | 16 (21.0%) |
| $65,000 to $74,999 | 12 (12.8%) | 0 (0.0%) |
| $75,000 to $99,999 | 0 (0.0%) | 0 (0.0%) |
| $100,000+ | 0 (0.0%) | 0 (0.0%) |
| Total | 94 (100.0%) | 76 (100.0%) |
Earnings by Sex by Educational Attainment in Shipman
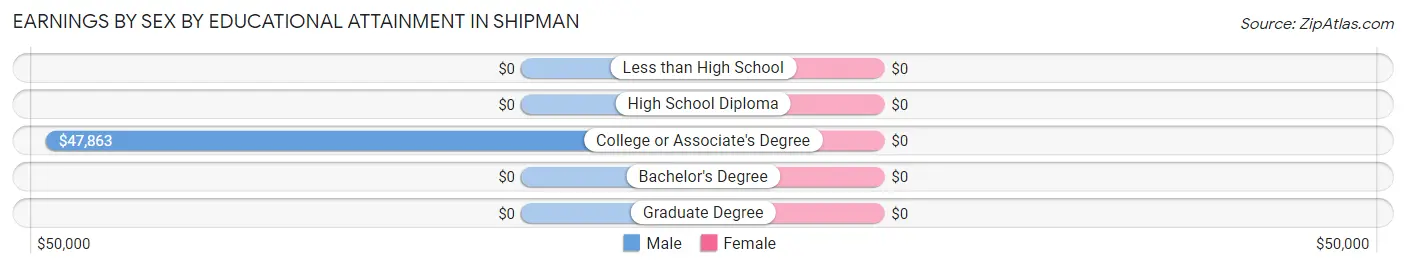
| Educational Attainment | Male Income | Female Income |
| Less than High School | - | - |
| High School Diploma | - | - |
| College or Associate's Degree | $47,863 | $0 |
| Bachelor's Degree | - | - |
| Graduate Degree | - | - |
| Total | $46,500 | $0 |
Family Income in Shipman
Family Income Brackets in Shipman
According to the Shipman family income data, there are 32 families falling into the $15,000 to $24,999 income range, which is the most common income bracket and makes up 26.2% of all families.
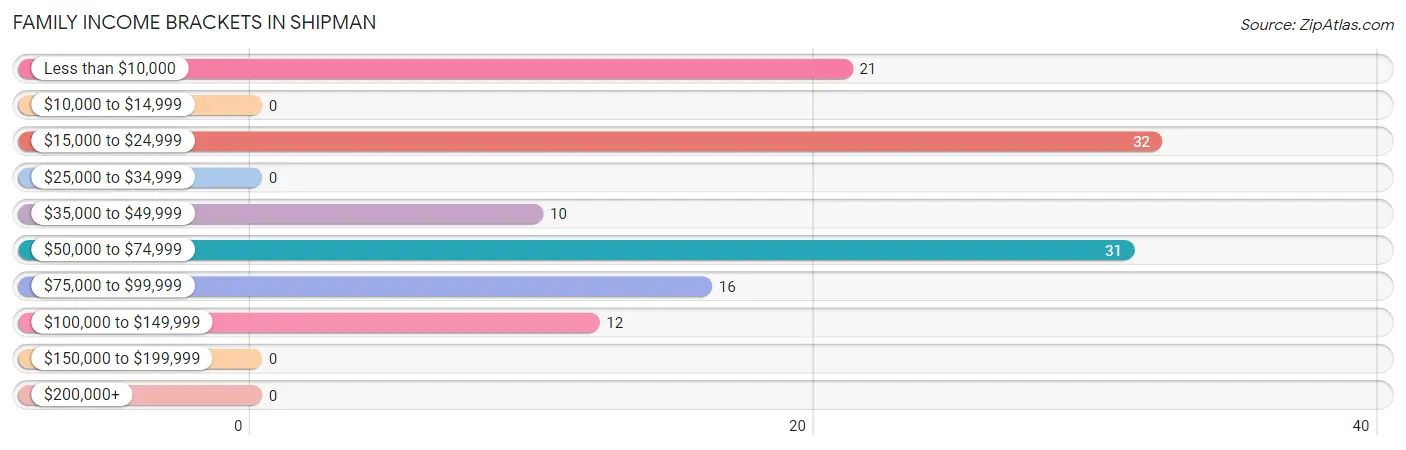
| Income Bracket | # Families | % Families |
| Less than $10,000 | 21 | 17.2% |
| $10,000 to $14,999 | 0 | 0.0% |
| $15,000 to $24,999 | 32 | 26.2% |
| $25,000 to $34,999 | 0 | 0.0% |
| $35,000 to $49,999 | 10 | 8.2% |
| $50,000 to $74,999 | 31 | 25.4% |
| $75,000 to $99,999 | 16 | 13.1% |
| $100,000 to $149,999 | 12 | 9.8% |
| $150,000 to $199,999 | 0 | 0.0% |
| $200,000+ | 0 | 0.0% |
Family Income by Famaliy Size in Shipman
| Income Bracket | # Families | Median Income |
| 2-Person Families | 58 (47.5%) | $0 |
| 3-Person Families | 33 (27.1%) | $0 |
| 4-Person Families | 31 (25.4%) | $0 |
| 5-Person Families | 0 (0.0%) | $0 |
| 6-Person Families | 0 (0.0%) | $0 |
| 7+ Person Families | 0 (0.0%) | $0 |
| Total | 122 (100.0%) | $47,000 |
Family Income by Number of Earners in Shipman
| Number of Earners | # Families | Median Income |
| No Earners | 32 (26.2%) | $0 |
| 1 Earner | 62 (50.8%) | $0 |
| 2 Earners | 16 (13.1%) | $0 |
| 3+ Earners | 12 (9.8%) | $0 |
| Total | 122 (100.0%) | $47,000 |
Household Income in Shipman
Household Income Brackets in Shipman
With 61 households falling in the category, the $15,000 to $24,999 income range is the most frequent in Shipman, accounting for 33.2% of all households.
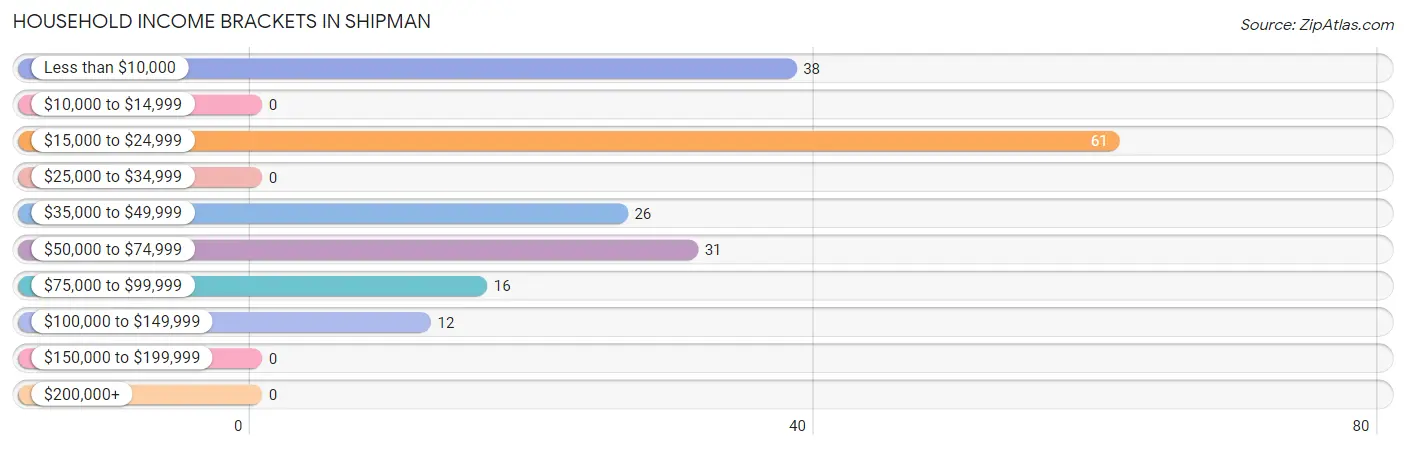
| Income Bracket | # Households | % Households |
| Less than $10,000 | 38 | 20.7% |
| $10,000 to $14,999 | 0 | 0.0% |
| $15,000 to $24,999 | 61 | 33.2% |
| $25,000 to $34,999 | 0 | 0.0% |
| $35,000 to $49,999 | 26 | 14.1% |
| $50,000 to $74,999 | 31 | 16.8% |
| $75,000 to $99,999 | 16 | 8.7% |
| $100,000 to $149,999 | 12 | 6.5% |
| $150,000 to $199,999 | 0 | 0.0% |
| $200,000+ | 0 | 0.0% |
Household Income by Householder Age in Shipman
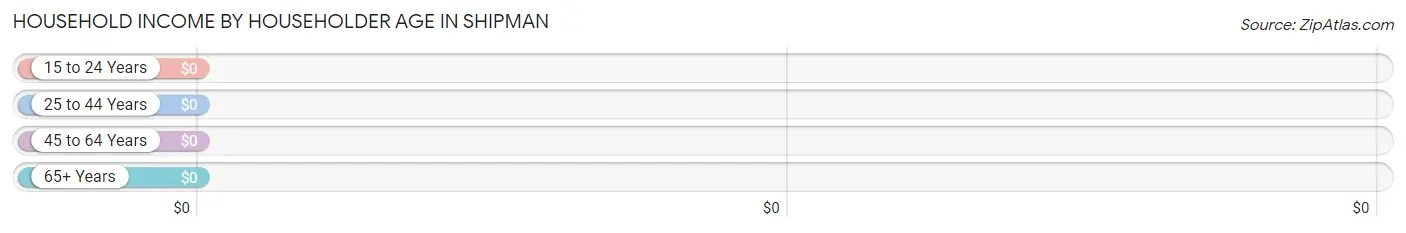
| Income Bracket | # Households | Median Income |
| 15 to 24 Years | 0 (0.0%) | $0 |
| 25 to 44 Years | 26 (14.1%) | $0 |
| 45 to 64 Years | 113 (61.4%) | $0 |
| 65+ Years | 45 (24.5%) | $0 |
| Total | 184 (100.0%) | $0 |
Poverty in Shipman
Income Below Poverty by Sex and Age in Shipman
With 33.7% poverty level for males and 17.9% for females among the residents of Shipman, 12 to 14 year old males and 45 to 54 year old females are the most vulnerable to poverty, with 17 males (100.0%) and 21 females (44.7%) in their respective age groups living below the poverty level.
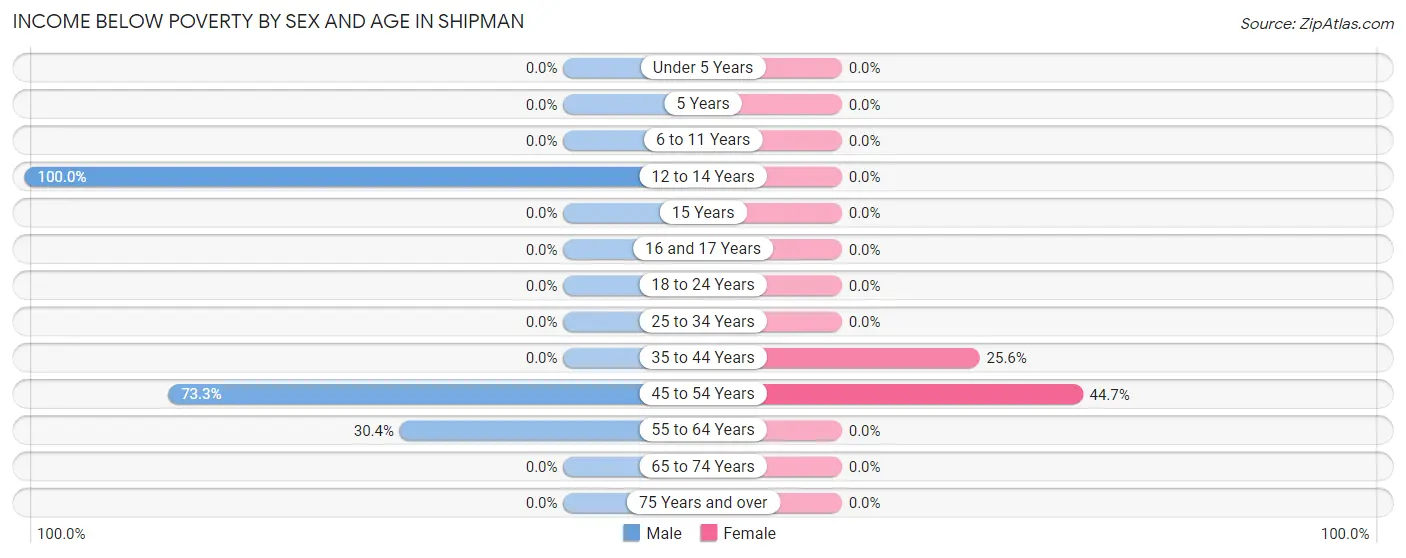
| Age Bracket | Male | Female |
| Under 5 Years | 0 (0.0%) | 0 (0.0%) |
| 5 Years | 0 (0.0%) | 0 (0.0%) |
| 6 to 11 Years | 0 (0.0%) | 0 (0.0%) |
| 12 to 14 Years | 17 (100.0%) | 0 (0.0%) |
| 15 Years | 0 (0.0%) | 0 (0.0%) |
| 16 and 17 Years | 0 (0.0%) | 0 (0.0%) |
| 18 to 24 Years | 0 (0.0%) | 0 (0.0%) |
| 25 to 34 Years | 0 (0.0%) | 0 (0.0%) |
| 35 to 44 Years | 0 (0.0%) | 22 (25.6%) |
| 45 to 54 Years | 33 (73.3%) | 21 (44.7%) |
| 55 to 64 Years | 17 (30.4%) | 0 (0.0%) |
| 65 to 74 Years | 0 (0.0%) | 0 (0.0%) |
| 75 Years and over | 0 (0.0%) | 0 (0.0%) |
| Total | 67 (33.7%) | 43 (17.9%) |
Income Above Poverty by Sex and Age in Shipman
According to the poverty statistics in Shipman, males aged 6 to 11 years and females aged under 5 years are the age groups that are most secure financially, with 100.0% of males and 100.0% of females in these age groups living above the poverty line.
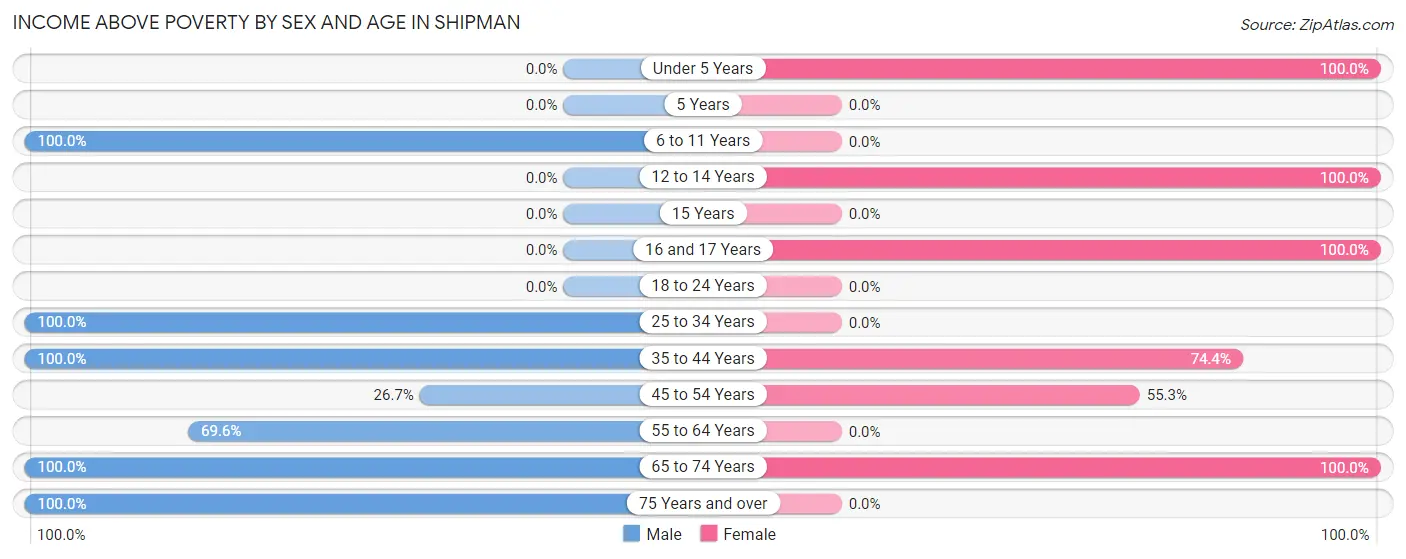
| Age Bracket | Male | Female |
| Under 5 Years | 0 (0.0%) | 29 (100.0%) |
| 5 Years | 0 (0.0%) | 0 (0.0%) |
| 6 to 11 Years | 10 (100.0%) | 0 (0.0%) |
| 12 to 14 Years | 0 (0.0%) | 32 (100.0%) |
| 15 Years | 0 (0.0%) | 0 (0.0%) |
| 16 and 17 Years | 0 (0.0%) | 18 (100.0%) |
| 18 to 24 Years | 0 (0.0%) | 0 (0.0%) |
| 25 to 34 Years | 16 (100.0%) | 0 (0.0%) |
| 35 to 44 Years | 10 (100.0%) | 64 (74.4%) |
| 45 to 54 Years | 12 (26.7%) | 26 (55.3%) |
| 55 to 64 Years | 39 (69.6%) | 0 (0.0%) |
| 65 to 74 Years | 32 (100.0%) | 28 (100.0%) |
| 75 Years and over | 13 (100.0%) | 0 (0.0%) |
| Total | 132 (66.3%) | 197 (82.1%) |
Income Below Poverty Among Married-Couple Families in Shipman
The poverty statistics for married-couple families in Shipman show that 18.8% or 21 of the total 112 families live below the poverty line. Families with 1 or 2 children have the highest poverty rate of 32.8%, comprising of 21 families. On the other hand, families with no children have the lowest poverty rate of 0.0%, which includes 0 families.
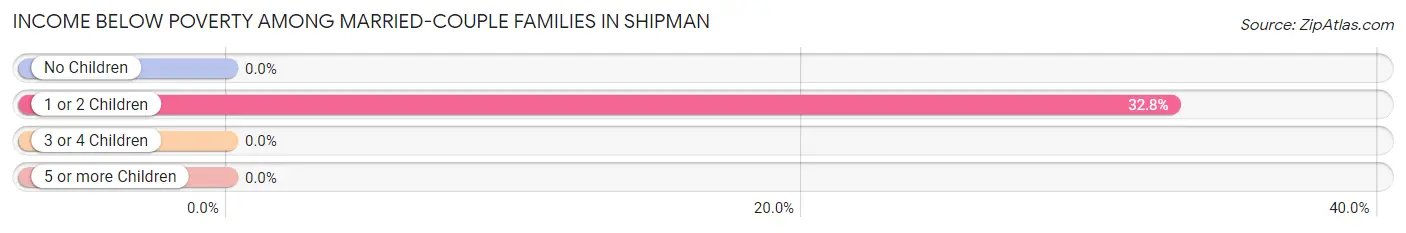
| Children | Above Poverty | Below Poverty |
| No Children | 48 (100.0%) | 0 (0.0%) |
| 1 or 2 Children | 43 (67.2%) | 21 (32.8%) |
| 3 or 4 Children | 0 (0.0%) | 0 (0.0%) |
| 5 or more Children | 0 (0.0%) | 0 (0.0%) |
| Total | 91 (81.2%) | 21 (18.8%) |
Income Below Poverty Among Single-Parent Households in Shipman
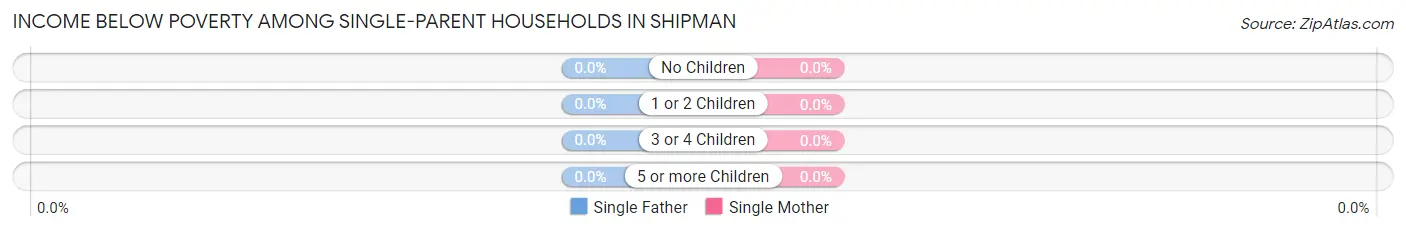
| Children | Single Father | Single Mother |
| No Children | 0 (0.0%) | 0 (0.0%) |
| 1 or 2 Children | 0 (0.0%) | 0 (0.0%) |
| 3 or 4 Children | 0 (0.0%) | 0 (0.0%) |
| 5 or more Children | 0 (0.0%) | 0 (0.0%) |
| Total | 0 (0.0%) | 0 (0.0%) |
Income Below Poverty Among Married-Couple vs Single-Parent Households in Shipman
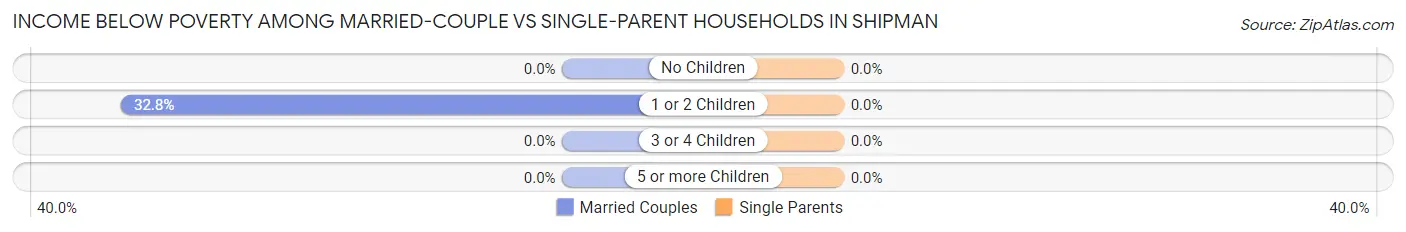
| Children | Married-Couple Families | Single-Parent Households |
| No Children | 0 (0.0%) | 0 (0.0%) |
| 1 or 2 Children | 21 (32.8%) | 0 (0.0%) |
| 3 or 4 Children | 0 (0.0%) | 0 (0.0%) |
| 5 or more Children | 0 (0.0%) | 0 (0.0%) |
| Total | 21 (18.8%) | 0 (0.0%) |
Race in Shipman
The most populous races in Shipman are White / Caucasian (286 | 65.1%), Black / African American (136 | 31.0%), and Hispanic or Latino (25 | 5.7%).
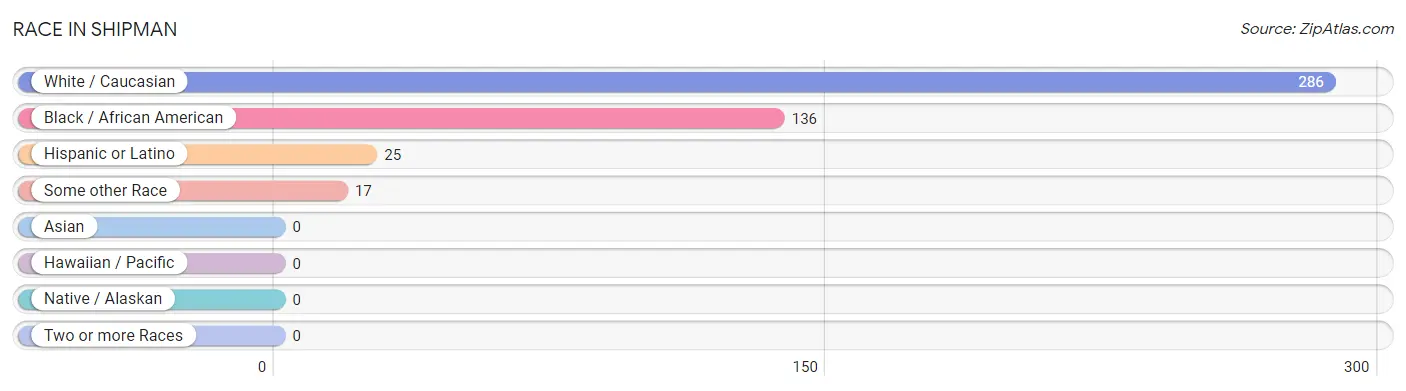
| Race | # Population | % Population |
| Asian | 0 | 0.0% |
| Black / African American | 136 | 31.0% |
| Hawaiian / Pacific | 0 | 0.0% |
| Hispanic or Latino | 25 | 5.7% |
| Native / Alaskan | 0 | 0.0% |
| White / Caucasian | 286 | 65.1% |
| Two or more Races | 0 | 0.0% |
| Some other Race | 17 | 3.9% |
| Total | 439 | 100.0% |
Ancestry in Shipman
The most populous ancestries reported in Shipman are Kenyan (107 | 24.4%), Subsaharan African (107 | 24.4%), English (102 | 23.2%), Irish (51 | 11.6%), and American (49 | 11.2%), together accounting for 94.8% of all Shipman residents.
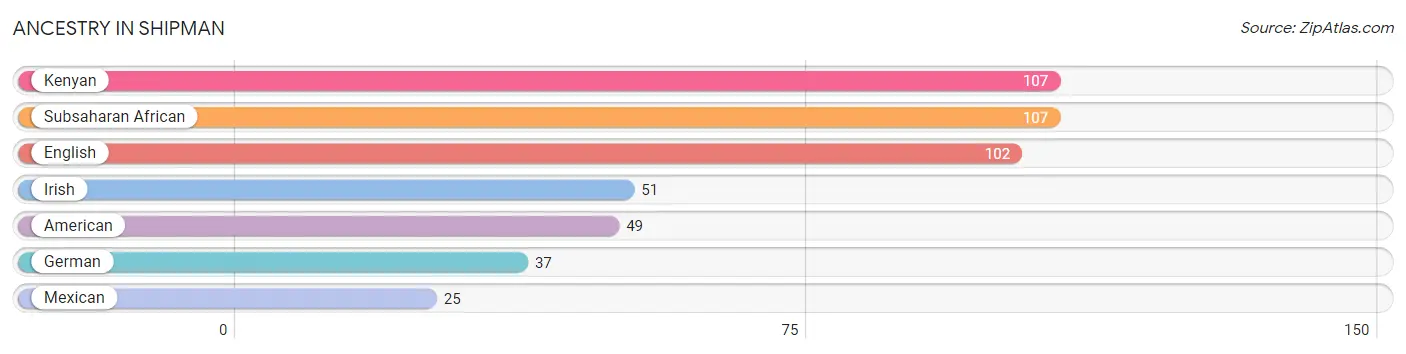
| Ancestry | # Population | % Population |
| American | 49 | 11.2% |
| English | 102 | 23.2% |
| German | 37 | 8.4% |
| Irish | 51 | 11.6% |
| Kenyan | 107 | 24.4% |
| Mexican | 25 | 5.7% |
| Subsaharan African | 107 | 24.4% | View All 7 Rows |
Immigrants in Shipman
The most numerous immigrant groups reported in Shipman came from Africa (107 | 24.4%), Eastern Africa (107 | 24.4%), and Kenya (107 | 24.4%), together accounting for 73.1% of all Shipman residents.
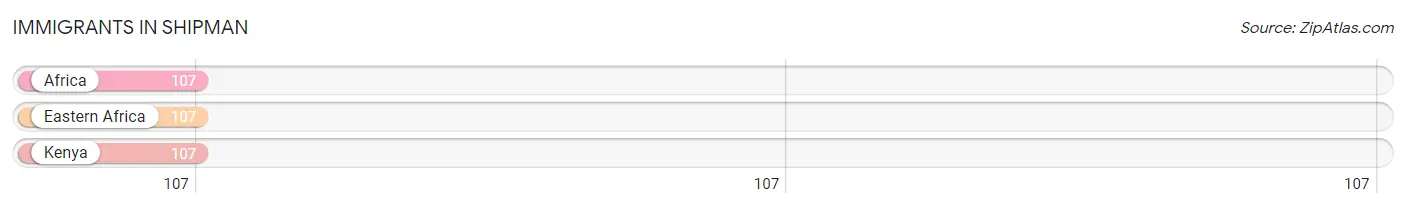
| Immigration Origin | # Population | % Population |
| Africa | 107 | 24.4% |
| Eastern Africa | 107 | 24.4% |
| Kenya | 107 | 24.4% | View All 3 Rows |
Sex and Age in Shipman
Sex and Age in Shipman
The most populous age groups in Shipman are 70 to 74 Years (32 | 16.1%) for men and 40 to 44 Years (44 | 18.3%) for women.
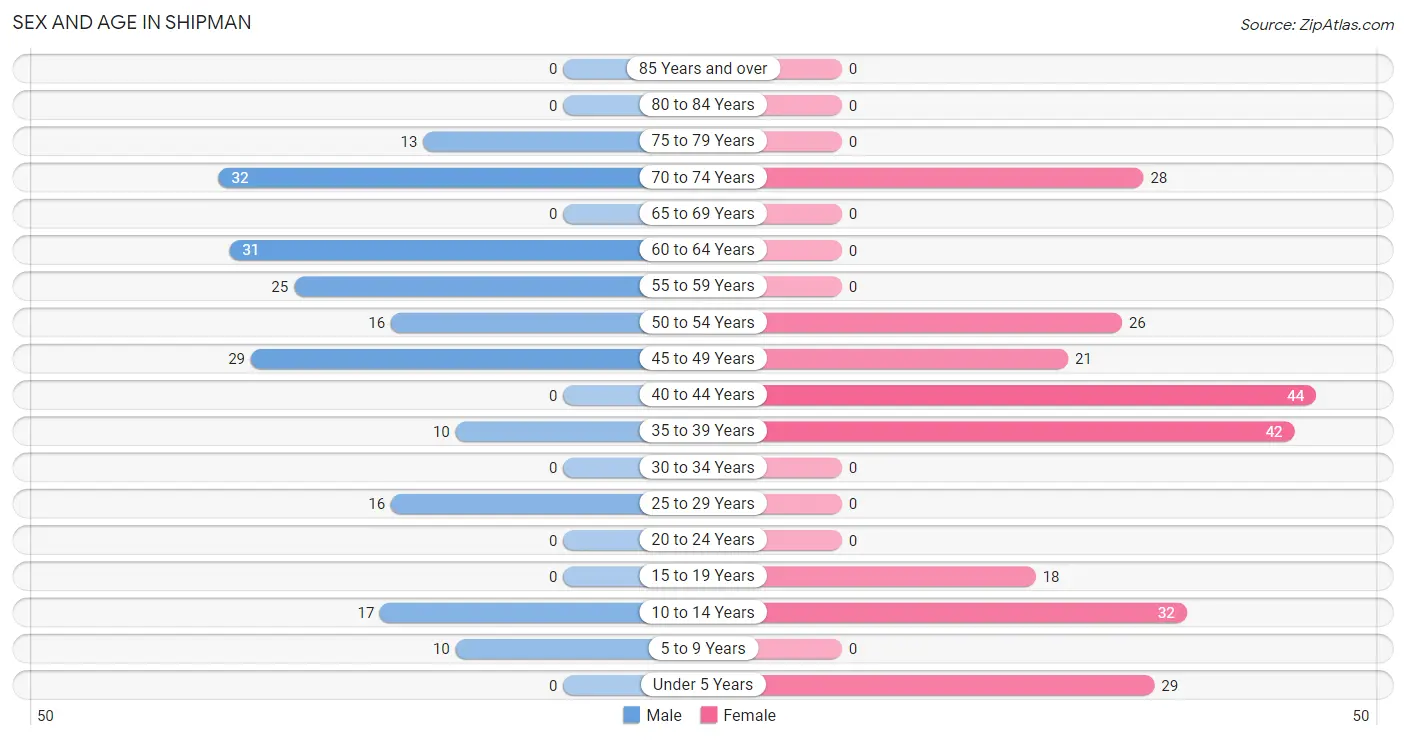
| Age Bracket | Male | Female |
| Under 5 Years | 0 (0.0%) | 29 (12.1%) |
| 5 to 9 Years | 10 (5.0%) | 0 (0.0%) |
| 10 to 14 Years | 17 (8.5%) | 32 (13.3%) |
| 15 to 19 Years | 0 (0.0%) | 18 (7.5%) |
| 20 to 24 Years | 0 (0.0%) | 0 (0.0%) |
| 25 to 29 Years | 16 (8.0%) | 0 (0.0%) |
| 30 to 34 Years | 0 (0.0%) | 0 (0.0%) |
| 35 to 39 Years | 10 (5.0%) | 42 (17.5%) |
| 40 to 44 Years | 0 (0.0%) | 44 (18.3%) |
| 45 to 49 Years | 29 (14.6%) | 21 (8.7%) |
| 50 to 54 Years | 16 (8.0%) | 26 (10.8%) |
| 55 to 59 Years | 25 (12.6%) | 0 (0.0%) |
| 60 to 64 Years | 31 (15.6%) | 0 (0.0%) |
| 65 to 69 Years | 0 (0.0%) | 0 (0.0%) |
| 70 to 74 Years | 32 (16.1%) | 28 (11.7%) |
| 75 to 79 Years | 13 (6.5%) | 0 (0.0%) |
| 80 to 84 Years | 0 (0.0%) | 0 (0.0%) |
| 85 Years and over | 0 (0.0%) | 0 (0.0%) |
| Total | 199 (100.0%) | 240 (100.0%) |
Families and Households in Shipman
Median Family Size in Shipman
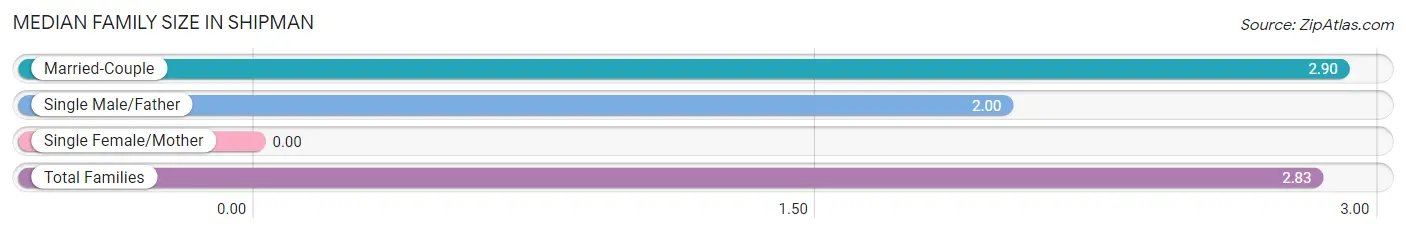
| Family Type | # Families | Family Size |
| Married-Couple | 112 (91.8%) | 2.90 |
| Single Male/Father | 10 (8.2%) | 2.00 |
| Single Female/Mother | 0 (0.0%) | - |
| Total Families | 122 (100.0%) | 2.83 |
Median Household Size in Shipman
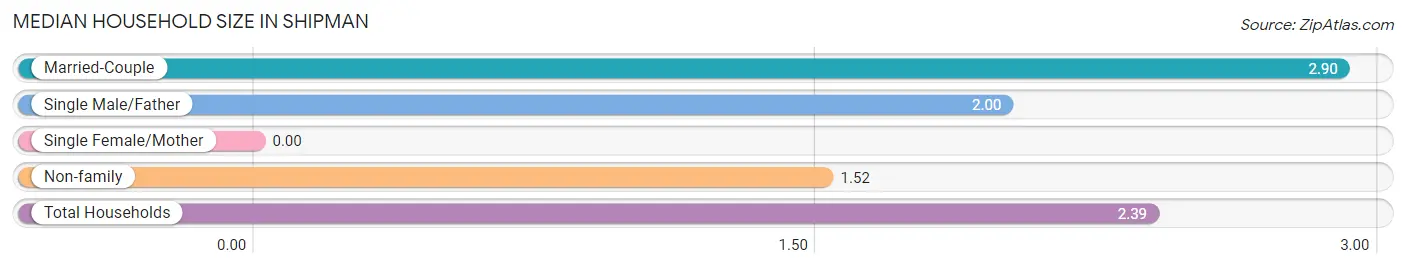
| Household Type | # Households | Household Size |
| Married-Couple | 112 (60.9%) | 2.90 |
| Single Male/Father | 10 (5.4%) | 2.00 |
| Single Female/Mother | 0 (0.0%) | - |
| Non-family | 62 (33.7%) | 1.52 |
| Total Households | 184 (100.0%) | 2.39 |
Household Size by Marriage Status in Shipman
Out of a total of 184 households in Shipman, 122 (66.3%) are family households, while 62 (33.7%) are nonfamily households. The most numerous type of family households are 2-person households, comprising 58, and the most common type of nonfamily households are 2-person households, comprising 32.
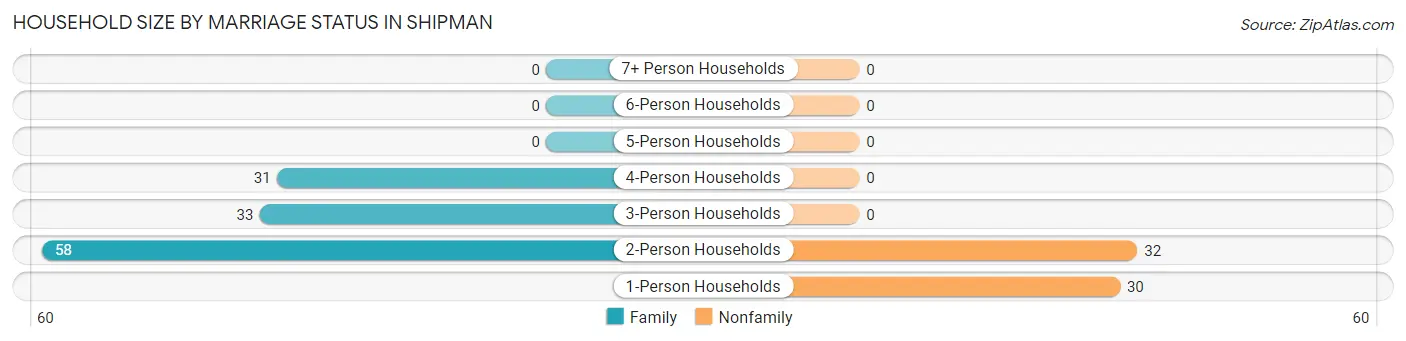
| Household Size | Family Households | Nonfamily Households |
| 1-Person Households | - | 30 (16.3%) |
| 2-Person Households | 58 (31.5%) | 32 (17.4%) |
| 3-Person Households | 33 (17.9%) | 0 (0.0%) |
| 4-Person Households | 31 (16.9%) | 0 (0.0%) |
| 5-Person Households | 0 (0.0%) | 0 (0.0%) |
| 6-Person Households | 0 (0.0%) | 0 (0.0%) |
| 7+ Person Households | 0 (0.0%) | 0 (0.0%) |
| Total | 122 (66.3%) | 62 (33.7%) |
Female Fertility in Shipman
Fertility by Age in Shipman
| Age Bracket | Women with Births | Births / 1,000 Women |
| 15 to 19 years | 0 (0.0%) | 0.0 |
| 20 to 34 years | 0 (0.0%) | 0.0 |
| 35 to 50 years | 0 (0.0%) | 0.0 |
| Total | 0 (0.0%) | 0.0 |
Fertility by Age by Marriage Status in Shipman
| Age Bracket | Married | Unmarried |
| 15 to 19 years | 0 (0.0%) | 0 (0.0%) |
| 20 to 34 years | 0 (0.0%) | 0 (0.0%) |
| 35 to 50 years | 0 (0.0%) | 0 (0.0%) |
| Total | 0 (0.0%) | 0 (0.0%) |
Fertility by Education in Shipman
| Educational Attainment | Women with Births | Births / 1,000 Women |
| Less than High School | 0 (0.0%) | 0.0 |
| High School Diploma | 0 (0.0%) | 0.0 |
| College or Associate's Degree | 0 (0.0%) | 0.0 |
| Bachelor's Degree | 0 (0.0%) | 0.0 |
| Graduate Degree | 0 (0.0%) | 0.0 |
| Total | 0 (0.0%) | 0.0 |
Fertility by Education by Marriage Status in Shipman
| Educational Attainment | Married | Unmarried |
| Less than High School | 0 (0.0%) | 0 (0.0%) |
| High School Diploma | 0 (0.0%) | 0 (0.0%) |
| College or Associate's Degree | 0 (0.0%) | 0 (0.0%) |
| Bachelor's Degree | 0 (0.0%) | 0 (0.0%) |
| Graduate Degree | 0 (0.0%) | 0 (0.0%) |
| Total | 0 (0.0%) | 0 (0.0%) |
Employment Characteristics in Shipman
Employment by Class of Employer in Shipman
Among the 153 employed individuals in Shipman, private company employees (125 | 81.7%), self-employed (not incorporated) (16 | 10.5%), and local government employees (12 | 7.8%) make up the most common classes of employment.
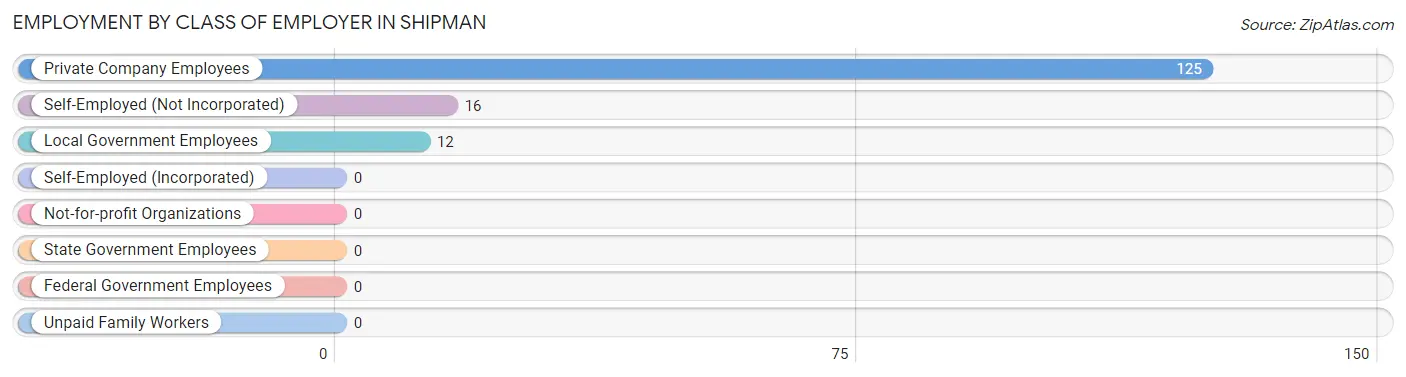
| Employer Class | # Employees | % Employees |
| Private Company Employees | 125 | 81.7% |
| Self-Employed (Incorporated) | 0 | 0.0% |
| Self-Employed (Not Incorporated) | 16 | 10.5% |
| Not-for-profit Organizations | 0 | 0.0% |
| Local Government Employees | 12 | 7.8% |
| State Government Employees | 0 | 0.0% |
| Federal Government Employees | 0 | 0.0% |
| Unpaid Family Workers | 0 | 0.0% |
| Total | 153 | 100.0% |
Employment Status by Age in Shipman
According to the labor force statistics for Shipman, out of the total population over 16 years of age (351), 48.4% or 170 individuals are in the labor force, with 10.0% or 17 of them unemployed. The age group with the highest labor force participation rate is 16 to 19 years, with 100.0% or 18 individuals in the labor force. Within the labor force, the 55 to 59 years age range has the highest percentage of unemployed individuals, with 68.0% or 17 of them being unemployed.
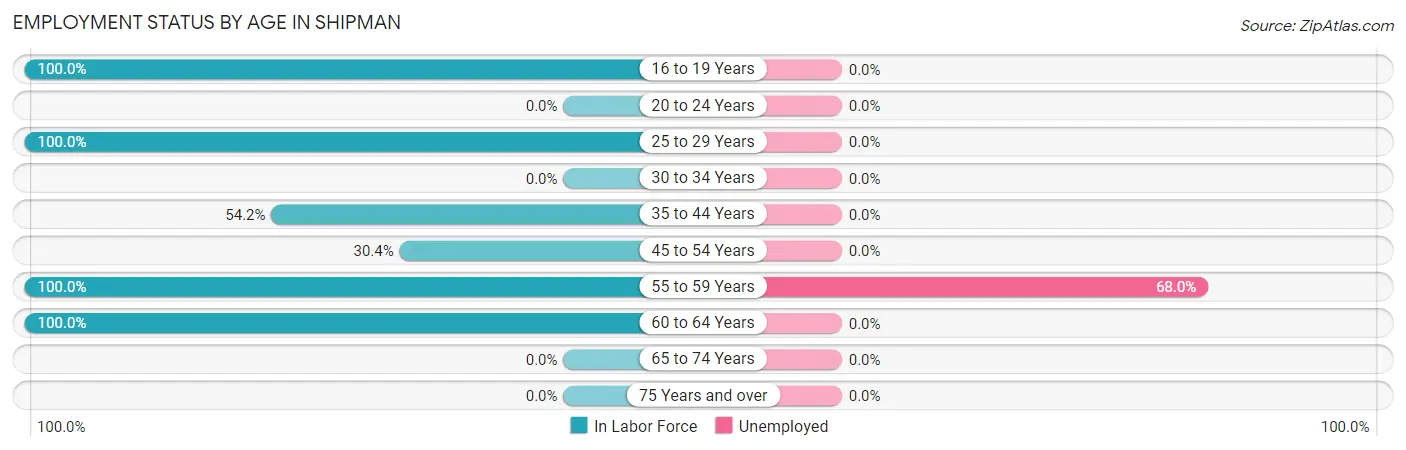
| Age Bracket | In Labor Force | Unemployed |
| 16 to 19 Years | 18 (100.0%) | 0 (0.0%) |
| 20 to 24 Years | 0 (0.0%) | 0 (0.0%) |
| 25 to 29 Years | 16 (100.0%) | 0 (0.0%) |
| 30 to 34 Years | 0 (0.0%) | 0 (0.0%) |
| 35 to 44 Years | 52 (54.2%) | 0 (0.0%) |
| 45 to 54 Years | 28 (30.4%) | 0 (0.0%) |
| 55 to 59 Years | 25 (100.0%) | 17 (68.0%) |
| 60 to 64 Years | 31 (100.0%) | 0 (0.0%) |
| 65 to 74 Years | 0 (0.0%) | 0 (0.0%) |
| 75 Years and over | 0 (0.0%) | 0 (0.0%) |
| Total | 170 (48.4%) | 17 (10.0%) |
Employment Status by Educational Attainment in Shipman
According to labor force statistics for Shipman, 58.5% of individuals (152) out of the total population between 25 and 64 years of age (260) are in the labor force, with 11.2% or 17 of them being unemployed. The group with the highest labor force participation rate are those with the educational attainment of less than high school, with 100.0% or 17 individuals in the labor force. Within the labor force, individuals with less than high school education have the highest percentage of unemployment, with 100.0% or 17 of them being unemployed.
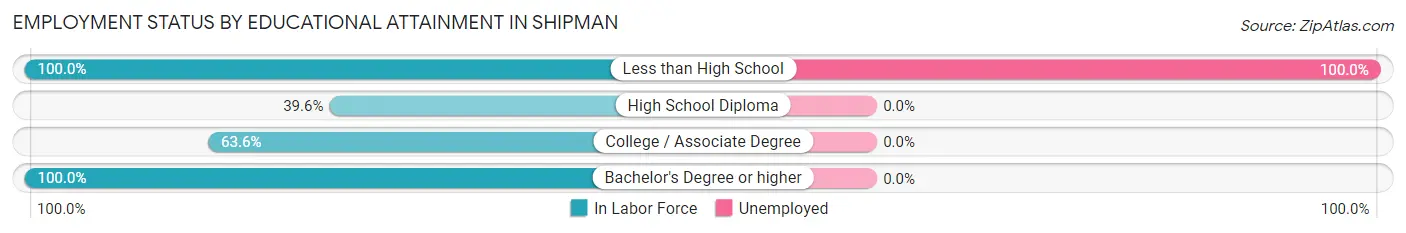
| Educational Attainment | In Labor Force | Unemployed |
| Less than High School | 17 (100.0%) | 17 (100.0%) |
| High School Diploma | 42 (39.6%) | 0 (0.0%) |
| College / Associate Degree | 77 (63.6%) | 0 (0.0%) |
| Bachelor's Degree or higher | 16 (100.0%) | 0 (0.0%) |
| Total | 152 (58.5%) | 29 (11.2%) |
Employment Occupations by Sex in Shipman
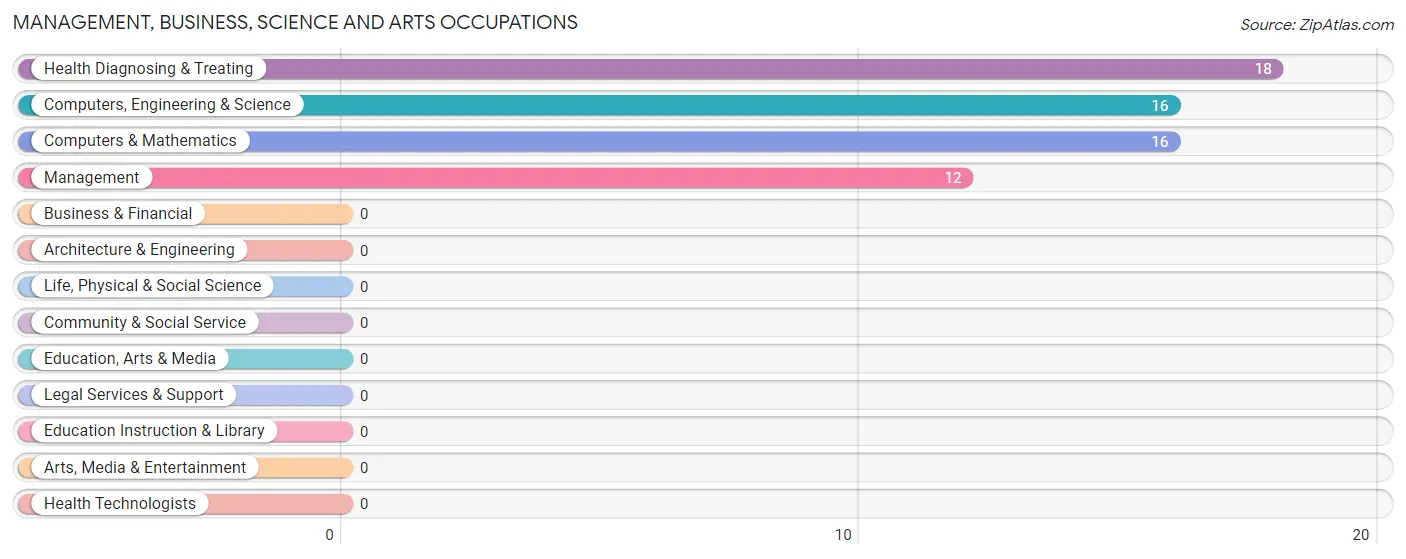
Management, Business, Science and Arts Occupations
The most common Management, Business, Science and Arts occupations in Shipman are Health Diagnosing & Treating (18 | 11.8%), Computers, Engineering & Science (16 | 10.5%), Computers & Mathematics (16 | 10.5%), and Management (12 | 7.8%).
Management, Business, Science and Arts Occupations by Sex
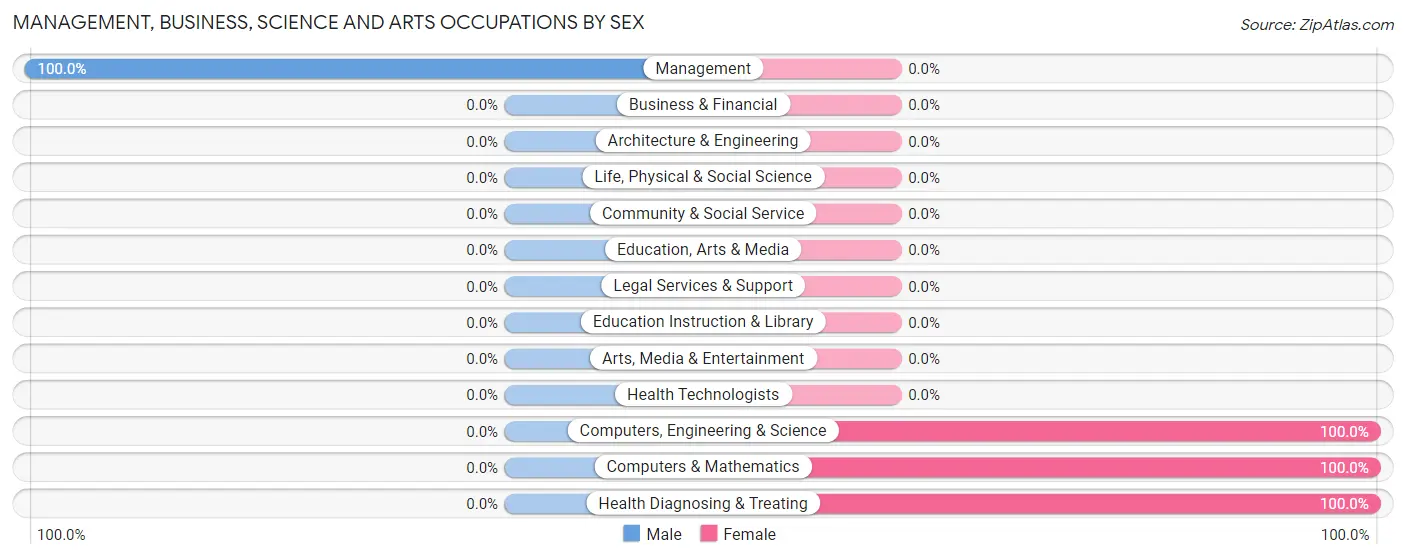
| Occupation | Male | Female |
| Management | 12 (100.0%) | 0 (0.0%) |
| Business & Financial | 0 (0.0%) | 0 (0.0%) |
| Computers, Engineering & Science | 0 (0.0%) | 16 (100.0%) |
| Computers & Mathematics | 0 (0.0%) | 16 (100.0%) |
| Architecture & Engineering | 0 (0.0%) | 0 (0.0%) |
| Life, Physical & Social Science | 0 (0.0%) | 0 (0.0%) |
| Community & Social Service | 0 (0.0%) | 0 (0.0%) |
| Education, Arts & Media | 0 (0.0%) | 0 (0.0%) |
| Legal Services & Support | 0 (0.0%) | 0 (0.0%) |
| Education Instruction & Library | 0 (0.0%) | 0 (0.0%) |
| Arts, Media & Entertainment | 0 (0.0%) | 0 (0.0%) |
| Health Diagnosing & Treating | 0 (0.0%) | 18 (100.0%) |
| Health Technologists | 0 (0.0%) | 0 (0.0%) |
| Total (Category) | 12 (26.1%) | 34 (73.9%) |
| Total (Overall) | 77 (50.3%) | 76 (49.7%) |
Services Occupations
Services Occupations by Sex
| Occupation | Male | Female |
| Healthcare Support | 0 (0.0%) | 0 (0.0%) |
| Security & Protection | 0 (0.0%) | 0 (0.0%) |
| Firefighting & Prevention | 0 (0.0%) | 0 (0.0%) |
| Law Enforcement | 0 (0.0%) | 0 (0.0%) |
| Food Preparation & Serving | 0 (0.0%) | 0 (0.0%) |
| Cleaning & Maintenance | 0 (0.0%) | 0 (0.0%) |
| Personal Care & Service | 0 (0.0%) | 0 (0.0%) |
| Total (Category) | 0 (0.0%) | 0 (0.0%) |
| Total (Overall) | 77 (50.3%) | 76 (49.7%) |
Sales and Office Occupations
The most common Sales and Office occupations in Shipman are Sales & Related (22 | 14.4%), and Office & Administration (20 | 13.1%).
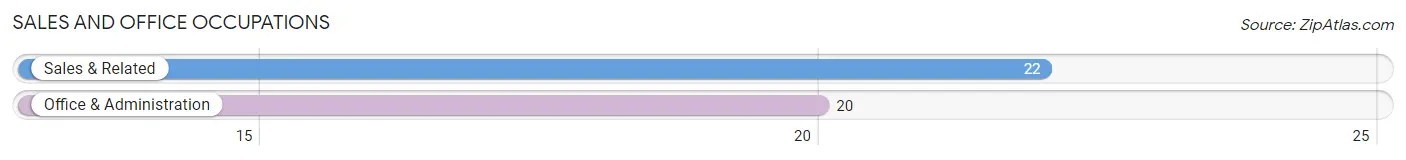
Sales and Office Occupations by Sex
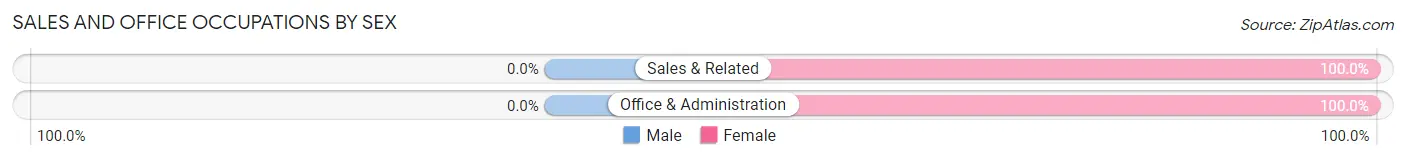
| Occupation | Male | Female |
| Sales & Related | 0 (0.0%) | 22 (100.0%) |
| Office & Administration | 0 (0.0%) | 20 (100.0%) |
| Total (Category) | 0 (0.0%) | 42 (100.0%) |
| Total (Overall) | 77 (50.3%) | 76 (49.7%) |
Natural Resources, Construction and Maintenance Occupations
The most common Natural Resources, Construction and Maintenance occupations in Shipman are , and Installation, Maintenance & Repair (41 | 26.8%).
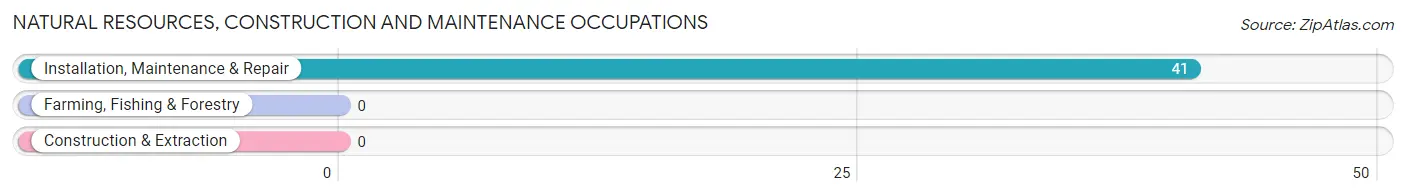
Natural Resources, Construction and Maintenance Occupations by Sex
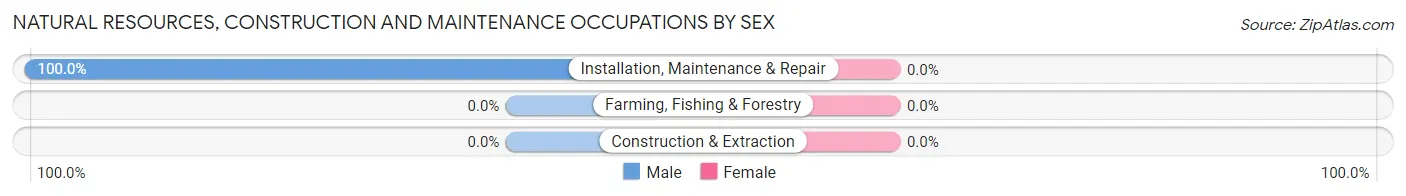
| Occupation | Male | Female |
| Farming, Fishing & Forestry | 0 (0.0%) | 0 (0.0%) |
| Construction & Extraction | 0 (0.0%) | 0 (0.0%) |
| Installation, Maintenance & Repair | 41 (100.0%) | 0 (0.0%) |
| Total (Category) | 41 (100.0%) | 0 (0.0%) |
| Total (Overall) | 77 (50.3%) | 76 (49.7%) |
Production, Transportation and Moving Occupations
The most common Production, Transportation and Moving occupations in Shipman are , and Material Moving (24 | 15.7%).
Production, Transportation and Moving Occupations by Sex
| Occupation | Male | Female |
| Production | 0 (0.0%) | 0 (0.0%) |
| Transportation | 0 (0.0%) | 0 (0.0%) |
| Material Moving | 24 (100.0%) | 0 (0.0%) |
| Total (Category) | 24 (100.0%) | 0 (0.0%) |
| Total (Overall) | 77 (50.3%) | 76 (49.7%) |
Employment Industries by Sex in Shipman
Employment Industries in Shipman
The major employment industries in Shipman include Professional & Scientific (49 | 32.0%), Retail Trade (46 | 30.1%), Agriculture, Fishing & Hunting (20 | 13.1%), Information (16 | 10.5%), and Educational Services (12 | 7.8%).
Employment Industries by Sex in Shipman
The Shipman industries that see more men than women are Construction (100.0%), Educational Services (100.0%), and Professional & Scientific (63.3%), whereas the industries that tend to have a higher number of women are Agriculture, Fishing & Hunting (100.0%), Information (100.0%), and Retail Trade (47.8%).
| Industry | Male | Female |
| Agriculture, Fishing & Hunting | 0 (0.0%) | 20 (100.0%) |
| Mining, Quarrying, & Extraction | 0 (0.0%) | 0 (0.0%) |
| Construction | 10 (100.0%) | 0 (0.0%) |
| Manufacturing | 0 (0.0%) | 0 (0.0%) |
| Wholesale Trade | 0 (0.0%) | 0 (0.0%) |
| Retail Trade | 24 (52.2%) | 22 (47.8%) |
| Transportation & Warehousing | 0 (0.0%) | 0 (0.0%) |
| Utilities | 0 (0.0%) | 0 (0.0%) |
| Information | 0 (0.0%) | 16 (100.0%) |
| Finance & Insurance | 0 (0.0%) | 0 (0.0%) |
| Real Estate, Rental & Leasing | 0 (0.0%) | 0 (0.0%) |
| Professional & Scientific | 31 (63.3%) | 18 (36.7%) |
| Enterprise Management | 0 (0.0%) | 0 (0.0%) |
| Administrative & Support | 0 (0.0%) | 0 (0.0%) |
| Educational Services | 12 (100.0%) | 0 (0.0%) |
| Health Care & Social Assistance | 0 (0.0%) | 0 (0.0%) |
| Arts, Entertainment & Recreation | 0 (0.0%) | 0 (0.0%) |
| Accommodation & Food Services | 0 (0.0%) | 0 (0.0%) |
| Public Administration | 0 (0.0%) | 0 (0.0%) |
| Total | 77 (50.3%) | 76 (49.7%) |
Education in Shipman
School Enrollment in Shipman
The most common levels of schooling among the 90 students in Shipman are middle school (49 | 54.4%), college / undergraduate (31 | 34.4%), and elementary school (10 | 11.1%).
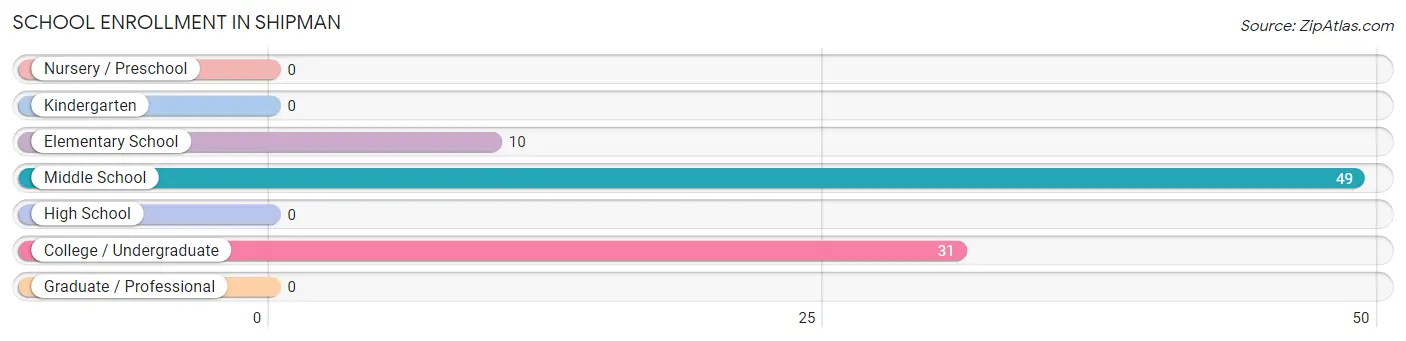
| School Level | # Students | % Students |
| Nursery / Preschool | 0 | 0.0% |
| Kindergarten | 0 | 0.0% |
| Elementary School | 10 | 11.1% |
| Middle School | 49 | 54.4% |
| High School | 0 | 0.0% |
| College / Undergraduate | 31 | 34.4% |
| Graduate / Professional | 0 | 0.0% |
| Total | 90 | 100.0% |
School Enrollment by Age by Funding Source in Shipman
Out of a total of 90 students who are enrolled in schools in Shipman, 31 (34.4%) attend a private institution, while the remaining 59 (65.6%) are enrolled in public schools. The age group of 35 years and over has the highest likelihood of being enrolled in private schools, with 31 (100.0% in the age bracket) enrolled. Conversely, the age group of 5 to 9 year old has the lowest likelihood of being enrolled in a private school, with 10 (100.0% in the age bracket) attending a public institution.
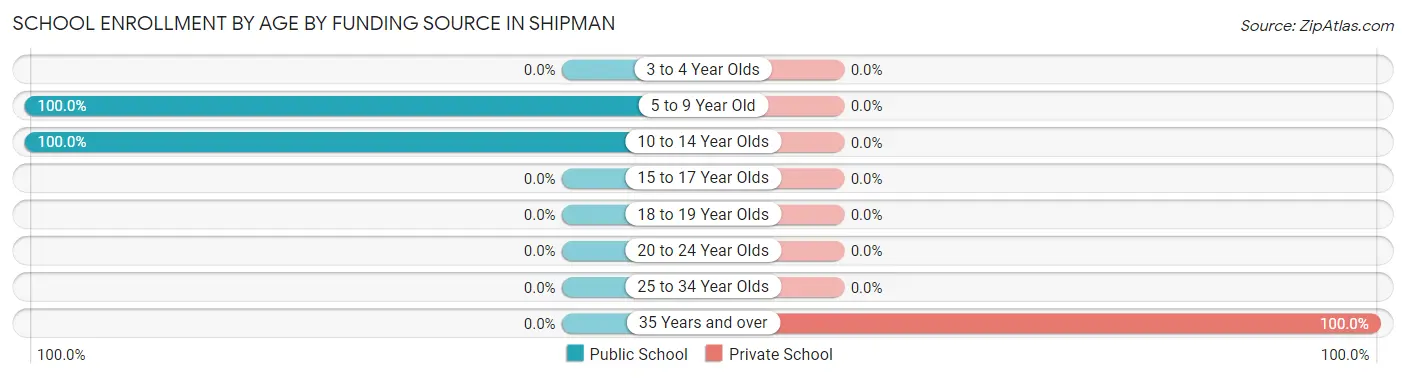
| Age Bracket | Public School | Private School |
| 3 to 4 Year Olds | 0 (0.0%) | 0 (0.0%) |
| 5 to 9 Year Old | 10 (100.0%) | 0 (0.0%) |
| 10 to 14 Year Olds | 49 (100.0%) | 0 (0.0%) |
| 15 to 17 Year Olds | 0 (0.0%) | 0 (0.0%) |
| 18 to 19 Year Olds | 0 (0.0%) | 0 (0.0%) |
| 20 to 24 Year Olds | 0 (0.0%) | 0 (0.0%) |
| 25 to 34 Year Olds | 0 (0.0%) | 0 (0.0%) |
| 35 Years and over | 0 (0.0%) | 31 (100.0%) |
| Total | 59 (65.6%) | 31 (34.4%) |
Educational Attainment by Field of Study in Shipman
Social sciences (16 | 55.2%), and physical & health sciences (13 | 44.8%) are the most common fields of study among 29 individuals in Shipman who have obtained a bachelor's degree or higher.
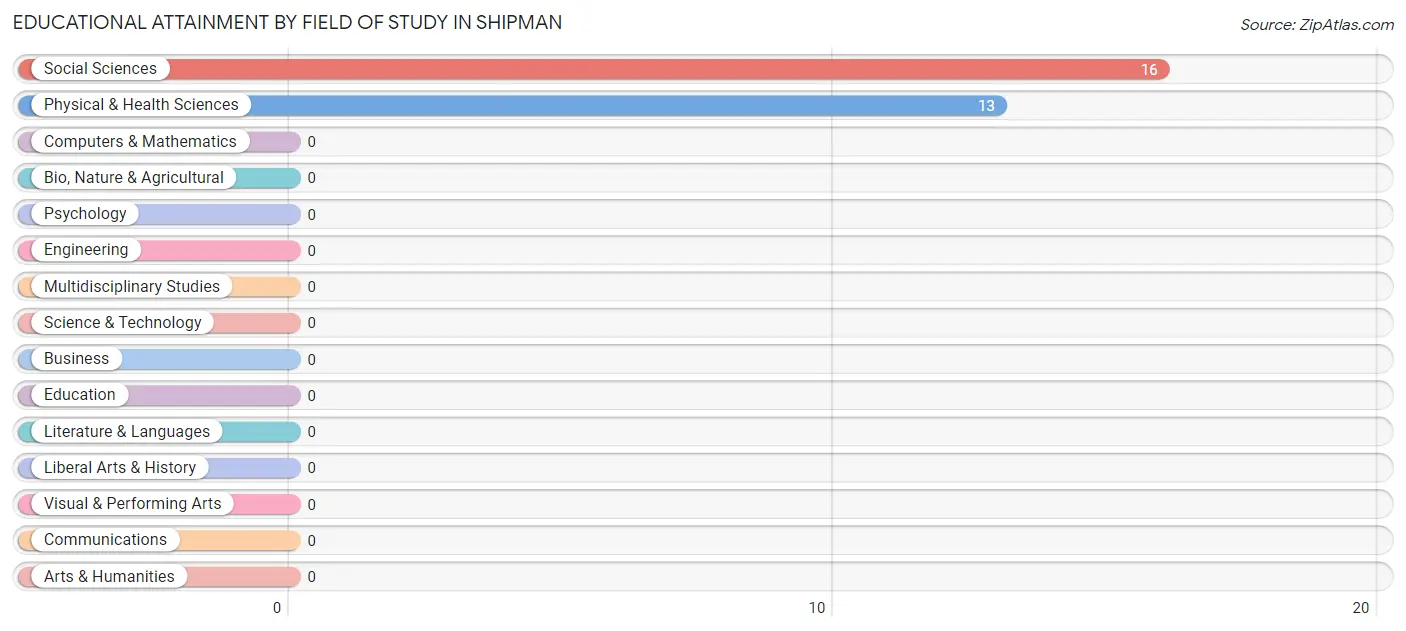
| Field of Study | # Graduates | % Graduates |
| Computers & Mathematics | 0 | 0.0% |
| Bio, Nature & Agricultural | 0 | 0.0% |
| Physical & Health Sciences | 13 | 44.8% |
| Psychology | 0 | 0.0% |
| Social Sciences | 16 | 55.2% |
| Engineering | 0 | 0.0% |
| Multidisciplinary Studies | 0 | 0.0% |
| Science & Technology | 0 | 0.0% |
| Business | 0 | 0.0% |
| Education | 0 | 0.0% |
| Literature & Languages | 0 | 0.0% |
| Liberal Arts & History | 0 | 0.0% |
| Visual & Performing Arts | 0 | 0.0% |
| Communications | 0 | 0.0% |
| Arts & Humanities | 0 | 0.0% |
| Total | 29 | 100.0% |
Transportation & Commute in Shipman
Vehicle Availability by Sex in Shipman
The most prevalent vehicle ownership categories in Shipman are males with 3 vehicles (43, accounting for 55.8%) and females with 3 vehicles (38, making up 56.6%).
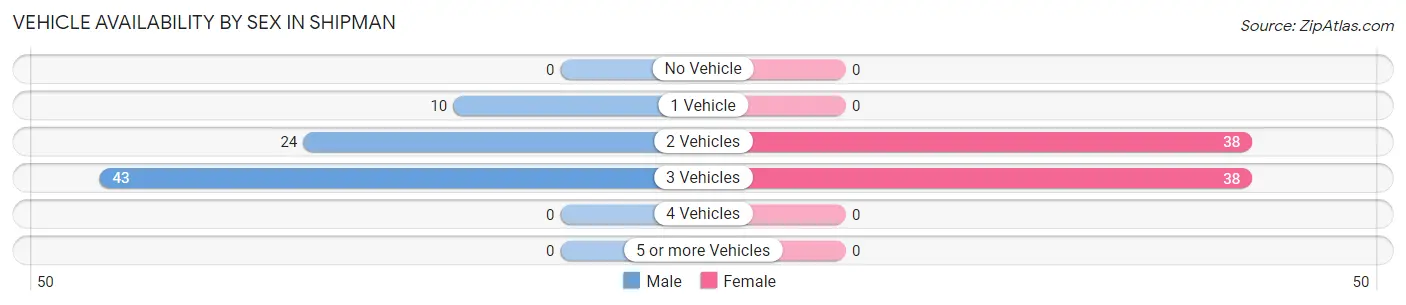
| Vehicles Available | Male | Female |
| No Vehicle | 0 (0.0%) | 0 (0.0%) |
| 1 Vehicle | 10 (13.0%) | 0 (0.0%) |
| 2 Vehicles | 24 (31.2%) | 38 (50.0%) |
| 3 Vehicles | 43 (55.8%) | 38 (50.0%) |
| 4 Vehicles | 0 (0.0%) | 0 (0.0%) |
| 5 or more Vehicles | 0 (0.0%) | 0 (0.0%) |
| Total | 77 (100.0%) | 76 (100.0%) |
Commute Time in Shipman
The most frequently occuring commute durations in Shipman are 15 to 19 minutes (50 commuters, 36.5%), 45 to 59 minutes (32 commuters, 23.4%), and 60 to 89 minutes (31 commuters, 22.6%).
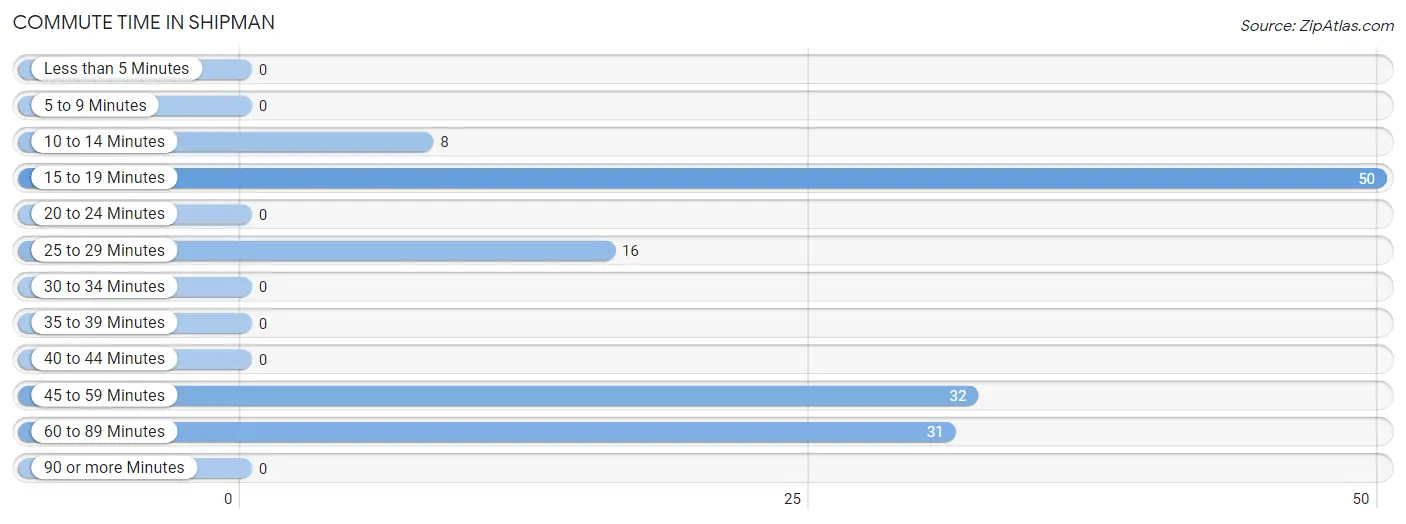
| Commute Time | # Commuters | % Commuters |
| Less than 5 Minutes | 0 | 0.0% |
| 5 to 9 Minutes | 0 | 0.0% |
| 10 to 14 Minutes | 8 | 5.8% |
| 15 to 19 Minutes | 50 | 36.5% |
| 20 to 24 Minutes | 0 | 0.0% |
| 25 to 29 Minutes | 16 | 11.7% |
| 30 to 34 Minutes | 0 | 0.0% |
| 35 to 39 Minutes | 0 | 0.0% |
| 40 to 44 Minutes | 0 | 0.0% |
| 45 to 59 Minutes | 32 | 23.4% |
| 60 to 89 Minutes | 31 | 22.6% |
| 90 or more Minutes | 0 | 0.0% |
Commute Time by Sex in Shipman
The most common commute times in Shipman are 60 to 89 minutes (31 commuters, 40.3%) for males and 15 to 19 minutes (38 commuters, 63.3%) for females.
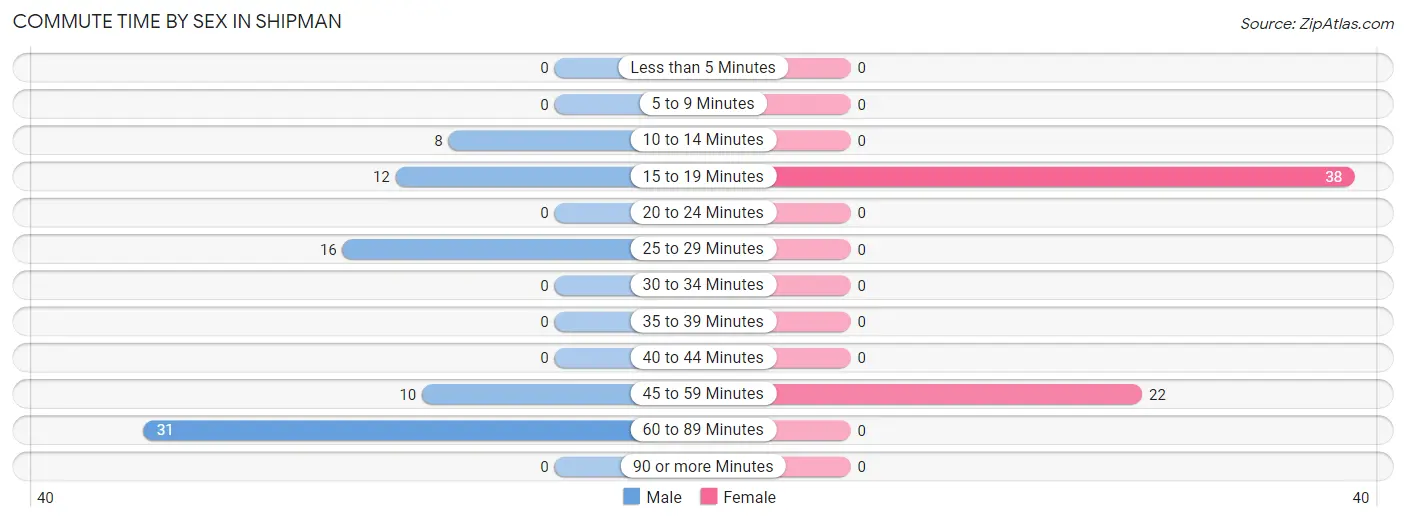
| Commute Time | Male | Female |
| Less than 5 Minutes | 0 (0.0%) | 0 (0.0%) |
| 5 to 9 Minutes | 0 (0.0%) | 0 (0.0%) |
| 10 to 14 Minutes | 8 (10.4%) | 0 (0.0%) |
| 15 to 19 Minutes | 12 (15.6%) | 38 (63.3%) |
| 20 to 24 Minutes | 0 (0.0%) | 0 (0.0%) |
| 25 to 29 Minutes | 16 (20.8%) | 0 (0.0%) |
| 30 to 34 Minutes | 0 (0.0%) | 0 (0.0%) |
| 35 to 39 Minutes | 0 (0.0%) | 0 (0.0%) |
| 40 to 44 Minutes | 0 (0.0%) | 0 (0.0%) |
| 45 to 59 Minutes | 10 (13.0%) | 22 (36.7%) |
| 60 to 89 Minutes | 31 (40.3%) | 0 (0.0%) |
| 90 or more Minutes | 0 (0.0%) | 0 (0.0%) |
Time of Departure to Work by Sex in Shipman
The most frequent times of departure to work in Shipman are 12:00 PM to 3:59 PM (31, 40.3%) for males and 8:00 AM to 8:29 AM (22, 36.7%) for females.
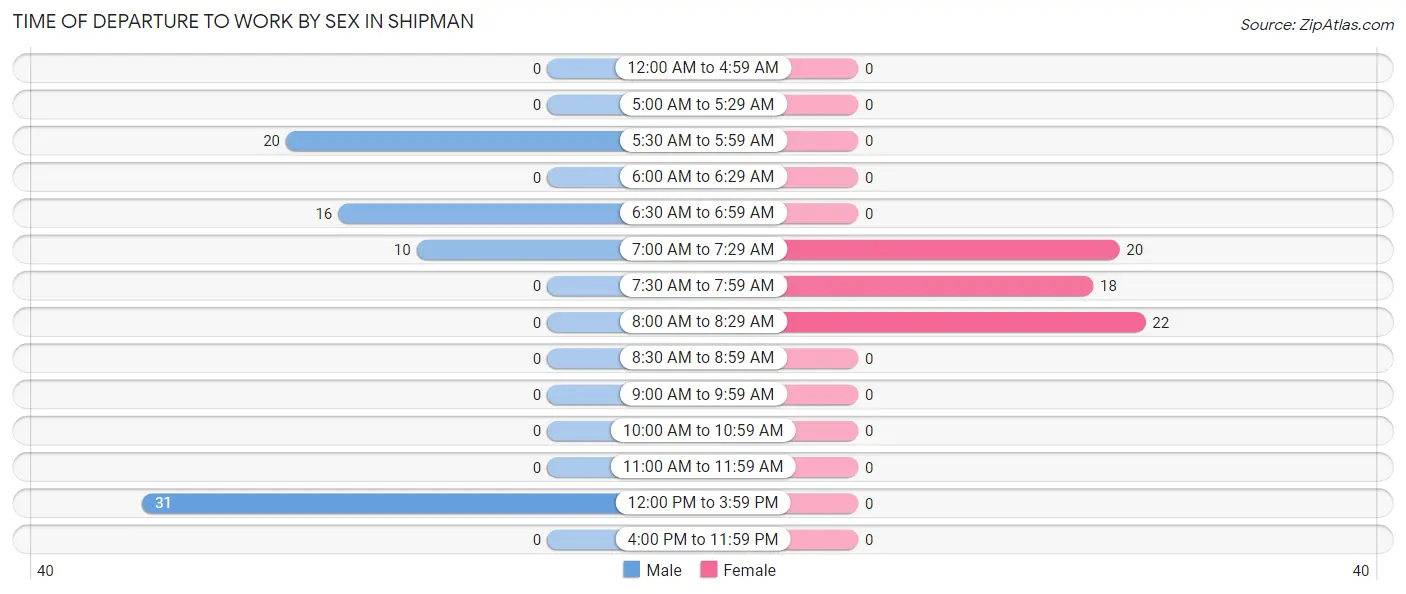
| Time of Departure | Male | Female |
| 12:00 AM to 4:59 AM | 0 (0.0%) | 0 (0.0%) |
| 5:00 AM to 5:29 AM | 0 (0.0%) | 0 (0.0%) |
| 5:30 AM to 5:59 AM | 20 (26.0%) | 0 (0.0%) |
| 6:00 AM to 6:29 AM | 0 (0.0%) | 0 (0.0%) |
| 6:30 AM to 6:59 AM | 16 (20.8%) | 0 (0.0%) |
| 7:00 AM to 7:29 AM | 10 (13.0%) | 20 (33.3%) |
| 7:30 AM to 7:59 AM | 0 (0.0%) | 18 (30.0%) |
| 8:00 AM to 8:29 AM | 0 (0.0%) | 22 (36.7%) |
| 8:30 AM to 8:59 AM | 0 (0.0%) | 0 (0.0%) |
| 9:00 AM to 9:59 AM | 0 (0.0%) | 0 (0.0%) |
| 10:00 AM to 10:59 AM | 0 (0.0%) | 0 (0.0%) |
| 11:00 AM to 11:59 AM | 0 (0.0%) | 0 (0.0%) |
| 12:00 PM to 3:59 PM | 31 (40.3%) | 0 (0.0%) |
| 4:00 PM to 11:59 PM | 0 (0.0%) | 0 (0.0%) |
| Total | 77 (100.0%) | 60 (100.0%) |
Housing Occupancy in Shipman
Occupancy by Ownership in Shipman
Of the total 184 dwellings in Shipman, owner-occupied units account for 139 (75.5%), while renter-occupied units make up 45 (24.5%).
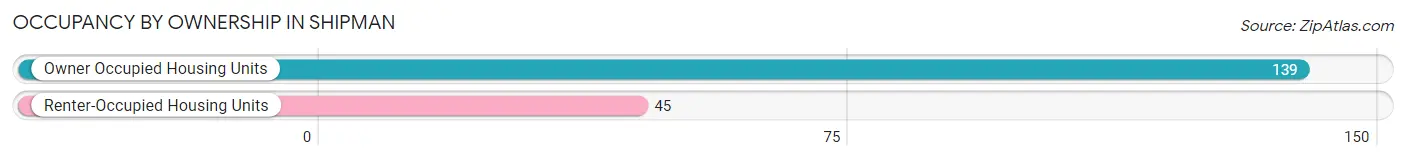
| Occupancy | # Housing Units | % Housing Units |
| Owner Occupied Housing Units | 139 | 75.5% |
| Renter-Occupied Housing Units | 45 | 24.5% |
| Total Occupied Housing Units | 184 | 100.0% |
Occupancy by Household Size in Shipman
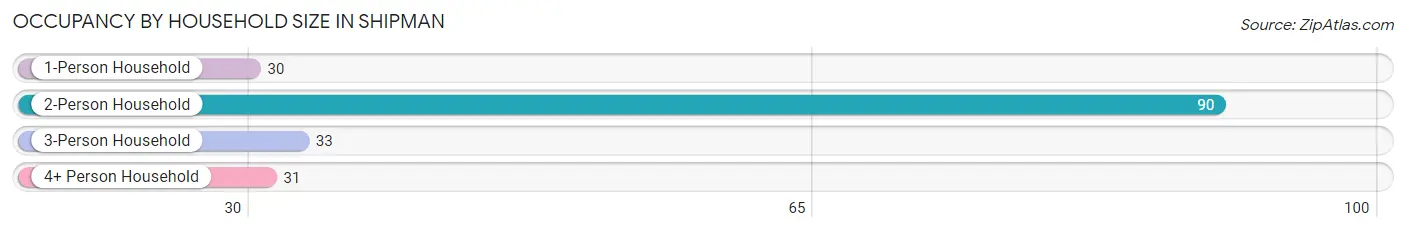
| Household Size | # Housing Units | % Housing Units |
| 1-Person Household | 30 | 16.3% |
| 2-Person Household | 90 | 48.9% |
| 3-Person Household | 33 | 17.9% |
| 4+ Person Household | 31 | 16.9% |
| Total Housing Units | 184 | 100.0% |
Occupancy by Ownership by Household Size in Shipman
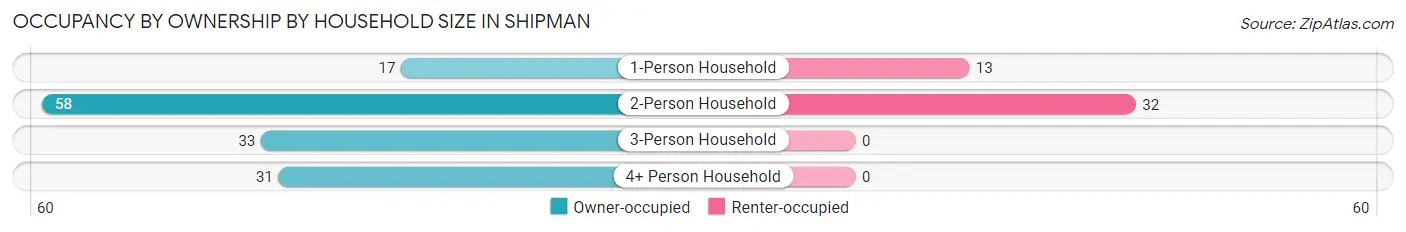
| Household Size | Owner-occupied | Renter-occupied |
| 1-Person Household | 17 (56.7%) | 13 (43.3%) |
| 2-Person Household | 58 (64.4%) | 32 (35.6%) |
| 3-Person Household | 33 (100.0%) | 0 (0.0%) |
| 4+ Person Household | 31 (100.0%) | 0 (0.0%) |
| Total Housing Units | 139 (75.5%) | 45 (24.5%) |
Occupancy by Educational Attainment in Shipman
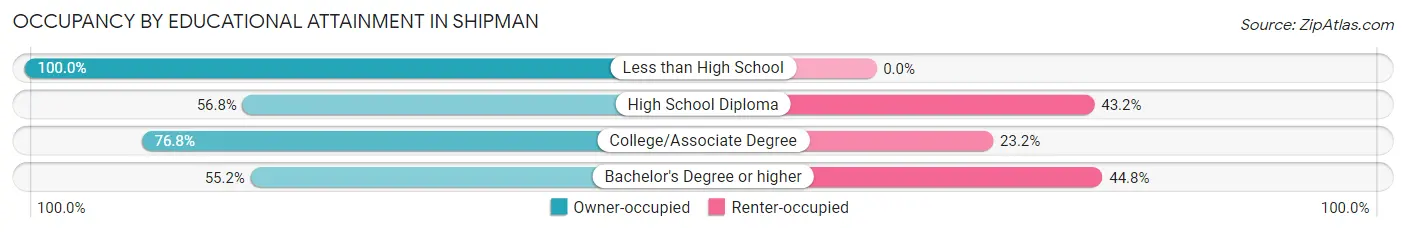
| Household Size | Owner-occupied | Renter-occupied |
| Less than High School | 49 (100.0%) | 0 (0.0%) |
| High School Diploma | 21 (56.8%) | 16 (43.2%) |
| College/Associate Degree | 53 (76.8%) | 16 (23.2%) |
| Bachelor's Degree or higher | 16 (55.2%) | 13 (44.8%) |
Occupancy by Age of Householder in Shipman
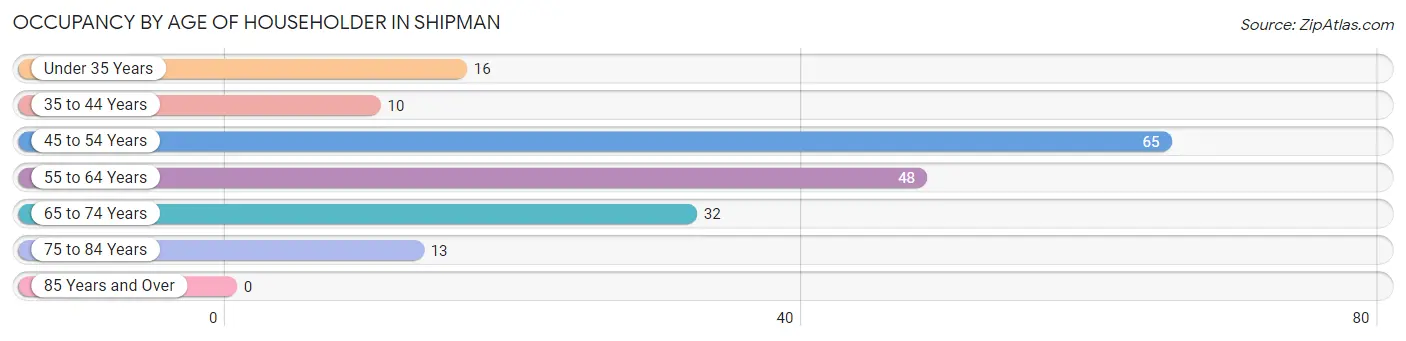
| Age Bracket | # Households | % Households |
| Under 35 Years | 16 | 8.7% |
| 35 to 44 Years | 10 | 5.4% |
| 45 to 54 Years | 65 | 35.3% |
| 55 to 64 Years | 48 | 26.1% |
| 65 to 74 Years | 32 | 17.4% |
| 75 to 84 Years | 13 | 7.1% |
| 85 Years and Over | 0 | 0.0% |
| Total | 184 | 100.0% |
Housing Finances in Shipman
Median Income by Occupancy in Shipman
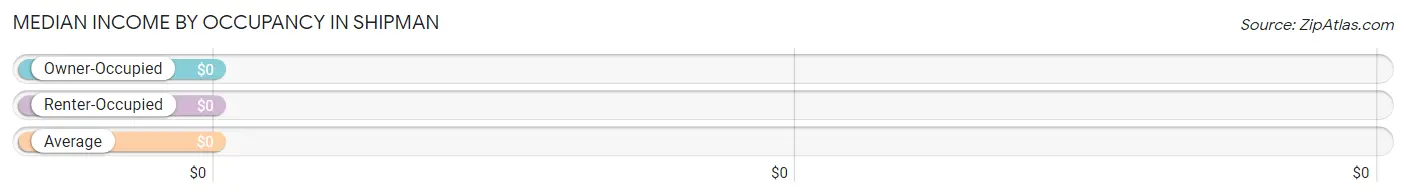
| Occupancy Type | # Households | Median Income |
| Owner-Occupied | 139 (75.5%) | $0 |
| Renter-Occupied | 45 (24.5%) | $0 |
| Average | 184 (100.0%) | $0 |
Occupancy by Householder Income Bracket in Shipman
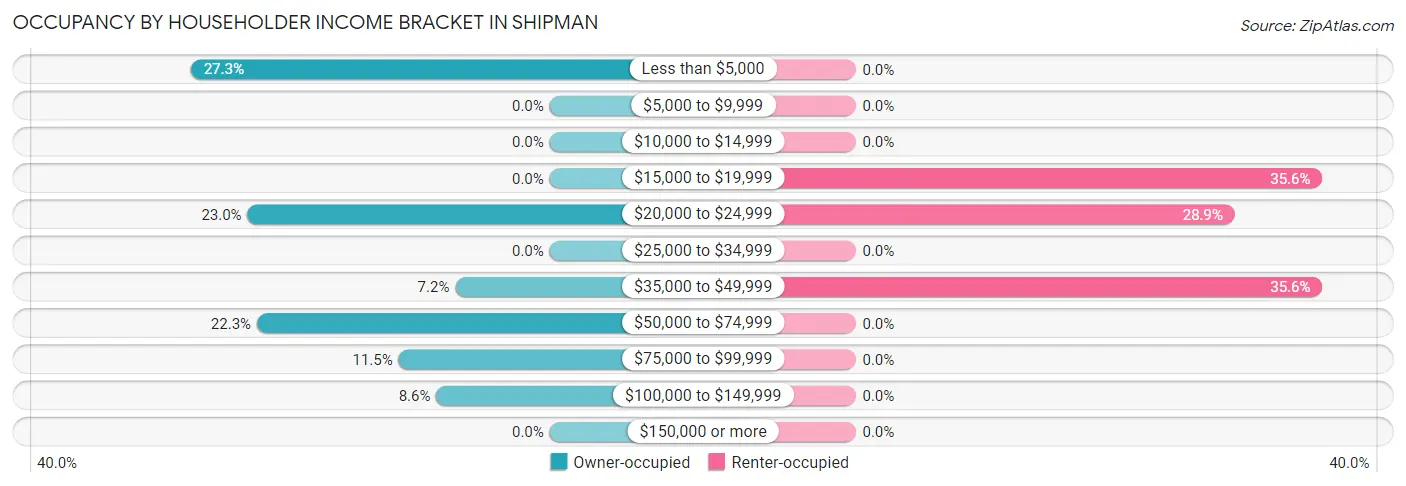
| Income Bracket | Owner-occupied | Renter-occupied |
| Less than $5,000 | 38 (27.3%) | 0 (0.0%) |
| $5,000 to $9,999 | 0 (0.0%) | 0 (0.0%) |
| $10,000 to $14,999 | 0 (0.0%) | 0 (0.0%) |
| $15,000 to $19,999 | 0 (0.0%) | 16 (35.6%) |
| $20,000 to $24,999 | 32 (23.0%) | 13 (28.9%) |
| $25,000 to $34,999 | 0 (0.0%) | 0 (0.0%) |
| $35,000 to $49,999 | 10 (7.2%) | 16 (35.6%) |
| $50,000 to $74,999 | 31 (22.3%) | 0 (0.0%) |
| $75,000 to $99,999 | 16 (11.5%) | 0 (0.0%) |
| $100,000 to $149,999 | 12 (8.6%) | 0 (0.0%) |
| $150,000 or more | 0 (0.0%) | 0 (0.0%) |
| Total | 139 (100.0%) | 45 (100.0%) |
Monthly Housing Cost Tiers in Shipman
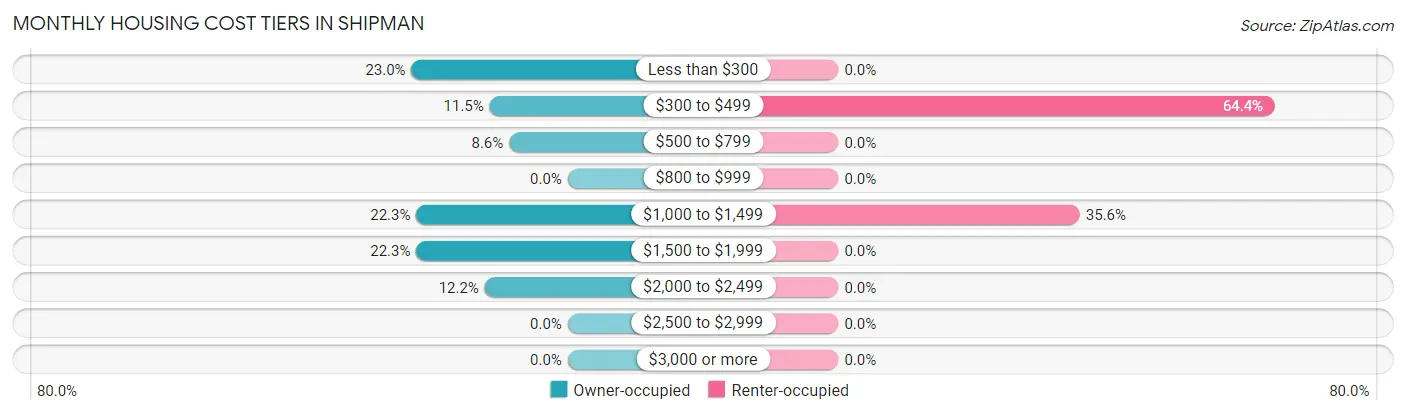
| Monthly Cost | Owner-occupied | Renter-occupied |
| Less than $300 | 32 (23.0%) | 0 (0.0%) |
| $300 to $499 | 16 (11.5%) | 29 (64.4%) |
| $500 to $799 | 12 (8.6%) | 0 (0.0%) |
| $800 to $999 | 0 (0.0%) | 0 (0.0%) |
| $1,000 to $1,499 | 31 (22.3%) | 16 (35.6%) |
| $1,500 to $1,999 | 31 (22.3%) | 0 (0.0%) |
| $2,000 to $2,499 | 17 (12.2%) | 0 (0.0%) |
| $2,500 to $2,999 | 0 (0.0%) | 0 (0.0%) |
| $3,000 or more | 0 (0.0%) | 0 (0.0%) |
| Total | 139 (100.0%) | 45 (100.0%) |
Physical Housing Characteristics in Shipman
Housing Structures in Shipman
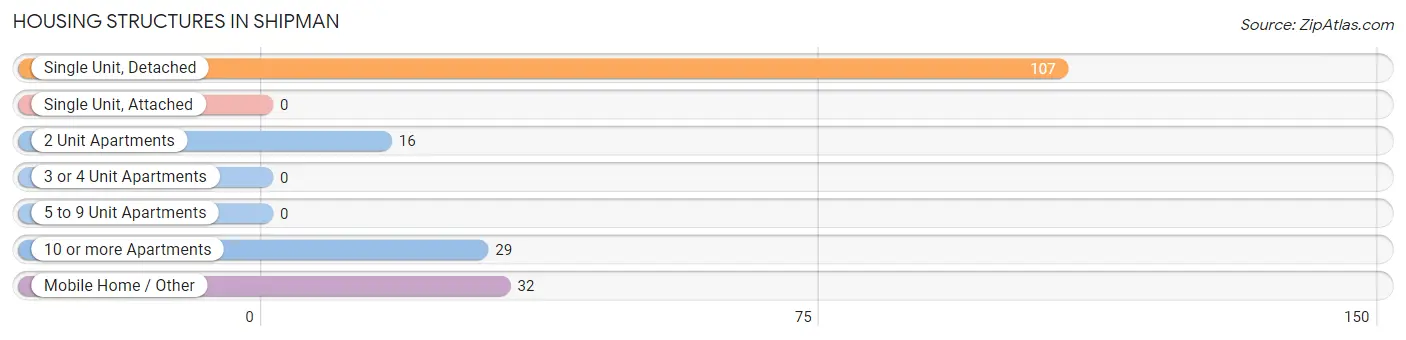
| Structure Type | # Housing Units | % Housing Units |
| Single Unit, Detached | 107 | 58.2% |
| Single Unit, Attached | 0 | 0.0% |
| 2 Unit Apartments | 16 | 8.7% |
| 3 or 4 Unit Apartments | 0 | 0.0% |
| 5 to 9 Unit Apartments | 0 | 0.0% |
| 10 or more Apartments | 29 | 15.8% |
| Mobile Home / Other | 32 | 17.4% |
| Total | 184 | 100.0% |
Housing Structures by Occupancy in Shipman
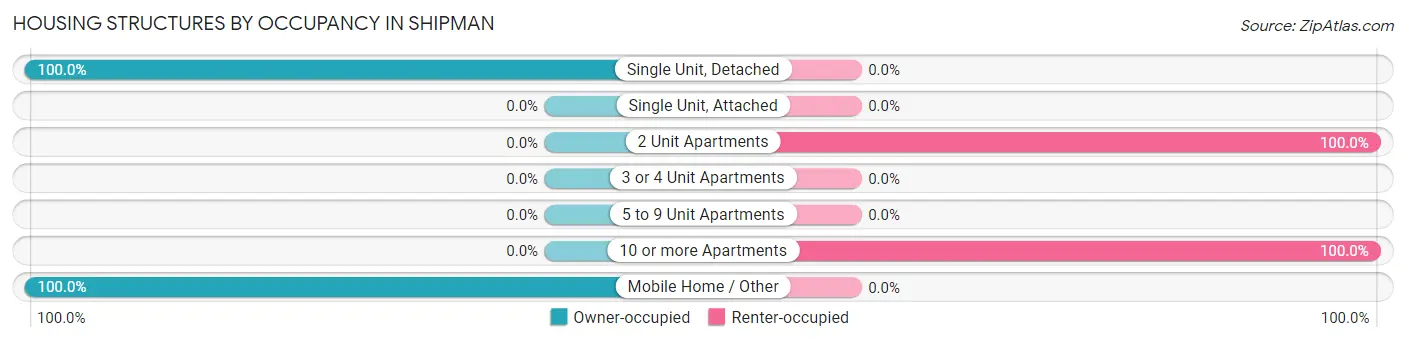
| Structure Type | Owner-occupied | Renter-occupied |
| Single Unit, Detached | 107 (100.0%) | 0 (0.0%) |
| Single Unit, Attached | 0 (0.0%) | 0 (0.0%) |
| 2 Unit Apartments | 0 (0.0%) | 16 (100.0%) |
| 3 or 4 Unit Apartments | 0 (0.0%) | 0 (0.0%) |
| 5 to 9 Unit Apartments | 0 (0.0%) | 0 (0.0%) |
| 10 or more Apartments | 0 (0.0%) | 29 (100.0%) |
| Mobile Home / Other | 32 (100.0%) | 0 (0.0%) |
| Total | 139 (75.5%) | 45 (24.5%) |
Housing Structures by Number of Rooms in Shipman
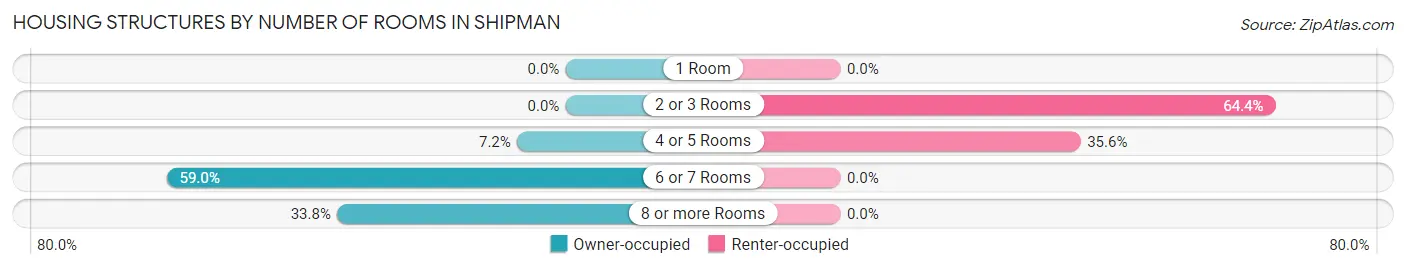
| Number of Rooms | Owner-occupied | Renter-occupied |
| 1 Room | 0 (0.0%) | 0 (0.0%) |
| 2 or 3 Rooms | 0 (0.0%) | 29 (64.4%) |
| 4 or 5 Rooms | 10 (7.2%) | 16 (35.6%) |
| 6 or 7 Rooms | 82 (59.0%) | 0 (0.0%) |
| 8 or more Rooms | 47 (33.8%) | 0 (0.0%) |
| Total | 139 (100.0%) | 45 (100.0%) |
Housing Structure by Heating Type in Shipman
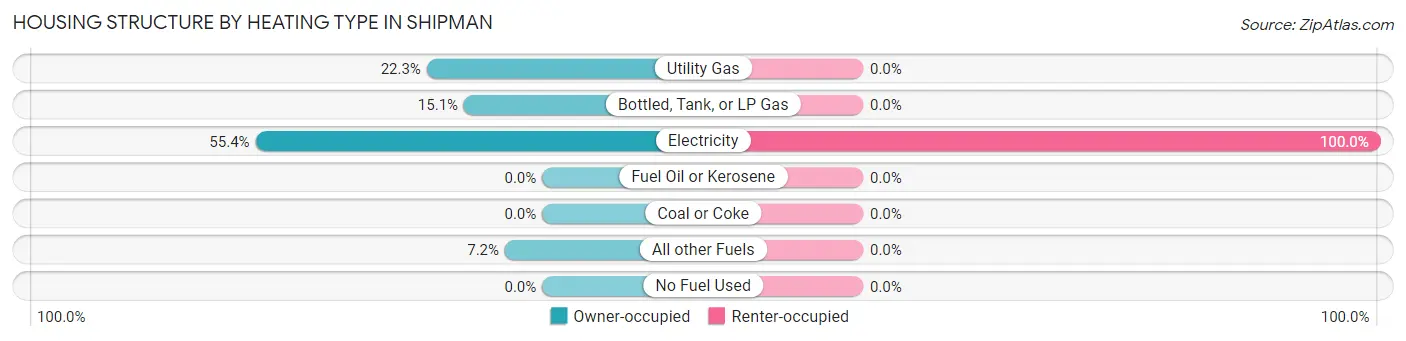
| Heating Type | Owner-occupied | Renter-occupied |
| Utility Gas | 31 (22.3%) | 0 (0.0%) |
| Bottled, Tank, or LP Gas | 21 (15.1%) | 0 (0.0%) |
| Electricity | 77 (55.4%) | 45 (100.0%) |
| Fuel Oil or Kerosene | 0 (0.0%) | 0 (0.0%) |
| Coal or Coke | 0 (0.0%) | 0 (0.0%) |
| All other Fuels | 10 (7.2%) | 0 (0.0%) |
| No Fuel Used | 0 (0.0%) | 0 (0.0%) |
| Total | 139 (100.0%) | 45 (100.0%) |
Household Vehicle Usage in Shipman
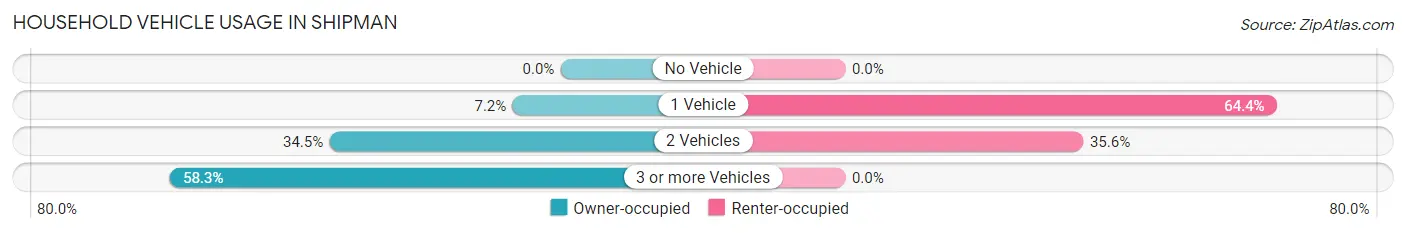
| Vehicles per Household | Owner-occupied | Renter-occupied |
| No Vehicle | 0 (0.0%) | 0 (0.0%) |
| 1 Vehicle | 10 (7.2%) | 29 (64.4%) |
| 2 Vehicles | 48 (34.5%) | 16 (35.6%) |
| 3 or more Vehicles | 81 (58.3%) | 0 (0.0%) |
| Total | 139 (100.0%) | 45 (100.0%) |
Real Estate & Mortgages in Shipman
Real Estate and Mortgage Overview in Shipman
| Characteristic | Without Mortgage | With Mortgage |
| Housing Units | 48 | 91 |
| Median Property Value | - | - |
| Median Household Income | - | - |
| Monthly Housing Costs | - | - |
| Real Estate Taxes | - | - |
Property Value by Mortgage Status in Shipman
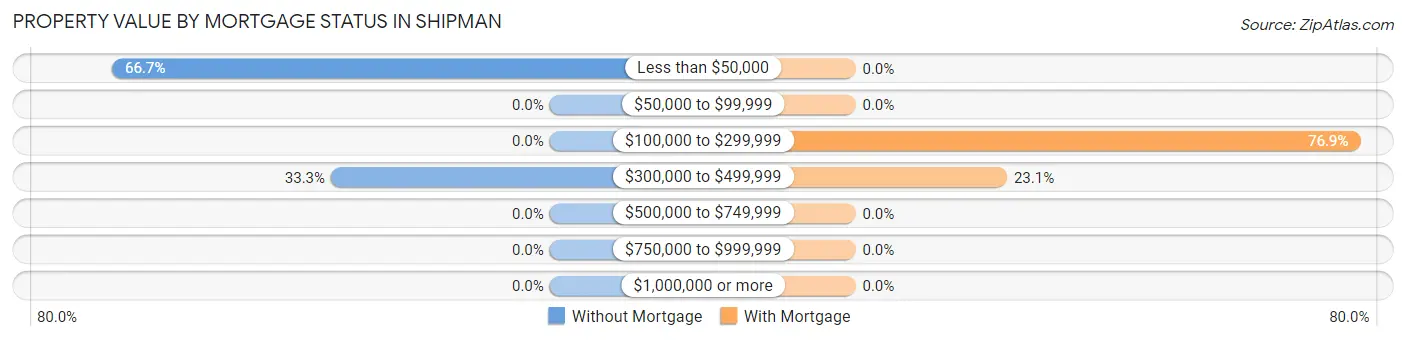
| Property Value | Without Mortgage | With Mortgage |
| Less than $50,000 | 32 (66.7%) | 0 (0.0%) |
| $50,000 to $99,999 | 0 (0.0%) | 0 (0.0%) |
| $100,000 to $299,999 | 0 (0.0%) | 70 (76.9%) |
| $300,000 to $499,999 | 16 (33.3%) | 21 (23.1%) |
| $500,000 to $749,999 | 0 (0.0%) | 0 (0.0%) |
| $750,000 to $999,999 | 0 (0.0%) | 0 (0.0%) |
| $1,000,000 or more | 0 (0.0%) | 0 (0.0%) |
| Total | 48 (100.0%) | 91 (100.0%) |
Household Income by Mortgage Status in Shipman
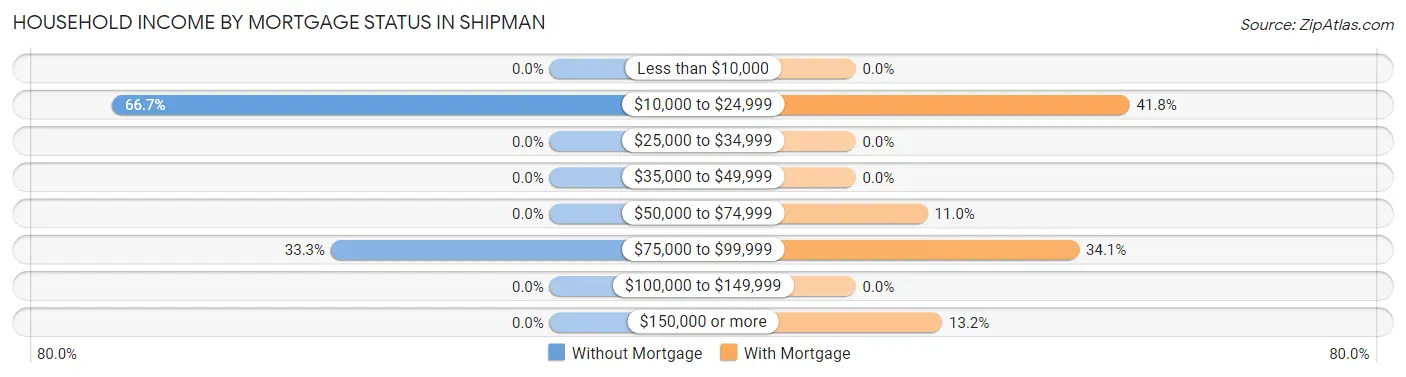
| Household Income | Without Mortgage | With Mortgage |
| Less than $10,000 | 0 (0.0%) | 0 (0.0%) |
| $10,000 to $24,999 | 32 (66.7%) | 38 (41.8%) |
| $25,000 to $34,999 | 0 (0.0%) | 0 (0.0%) |
| $35,000 to $49,999 | 0 (0.0%) | 0 (0.0%) |
| $50,000 to $74,999 | 0 (0.0%) | 10 (11.0%) |
| $75,000 to $99,999 | 16 (33.3%) | 31 (34.1%) |
| $100,000 to $149,999 | 0 (0.0%) | 0 (0.0%) |
| $150,000 or more | 0 (0.0%) | 12 (13.2%) |
| Total | 48 (100.0%) | 91 (100.0%) |
Property Value to Household Income Ratio in Shipman
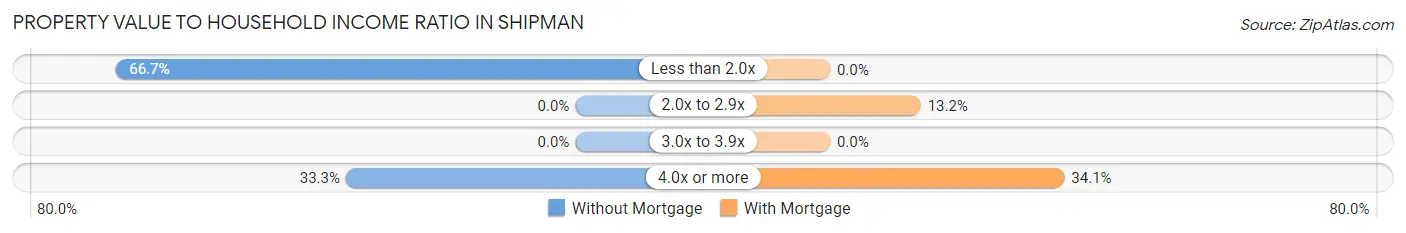
| Value-to-Income Ratio | Without Mortgage | With Mortgage |
| Less than 2.0x | 32 (66.7%) | 0 (0.0%) |
| 2.0x to 2.9x | 0 (0.0%) | 12 (13.2%) |
| 3.0x to 3.9x | 0 (0.0%) | 0 (0.0%) |
| 4.0x or more | 16 (33.3%) | 31 (34.1%) |
| Total | 48 (100.0%) | 91 (100.0%) |
Real Estate Taxes by Mortgage Status in Shipman
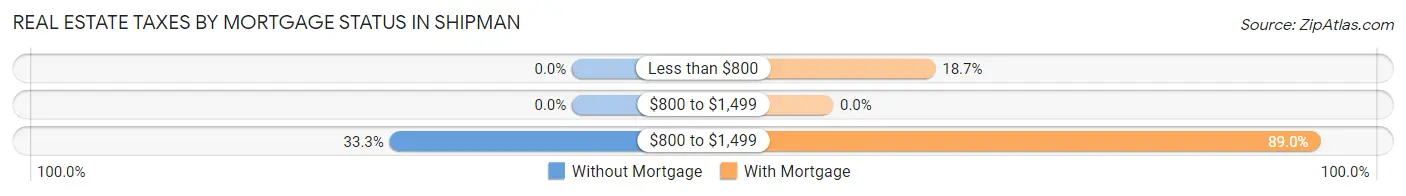
| Property Taxes | Without Mortgage | With Mortgage |
| Less than $800 | 0 (0.0%) | 17 (18.7%) |
| $800 to $1,499 | 0 (0.0%) | 0 (0.0%) |
| $800 to $1,499 | 16 (33.3%) | 81 (89.0%) |
| Total | 48 (100.0%) | 91 (100.0%) |
Health & Disability in Shipman
Health Insurance Coverage by Age in Shipman
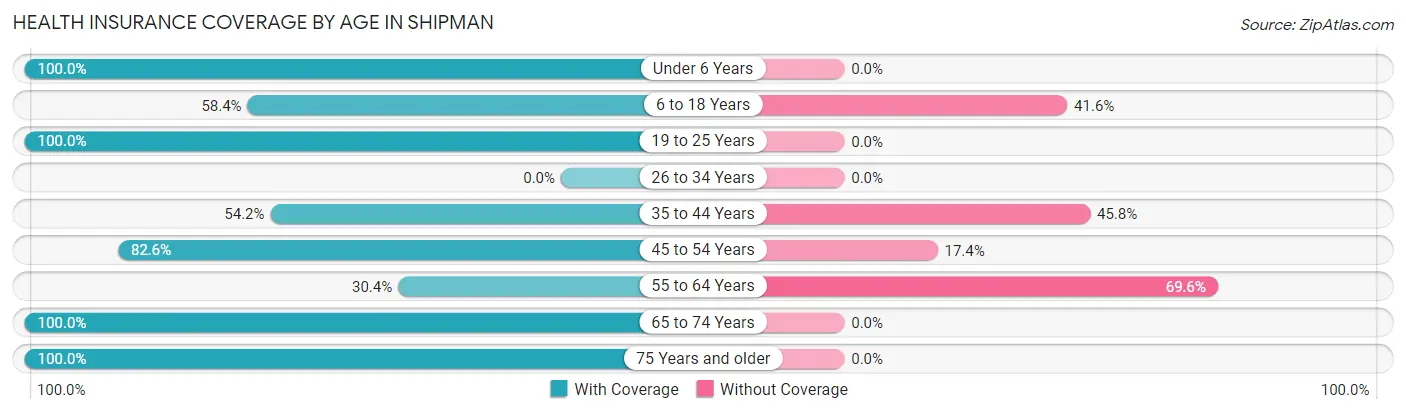
| Age Bracket | With Coverage | Without Coverage |
| Under 6 Years | 29 (100.0%) | 0 (0.0%) |
| 6 to 18 Years | 45 (58.4%) | 32 (41.6%) |
| 19 to 25 Years | 16 (100.0%) | 0 (0.0%) |
| 26 to 34 Years | 0 (0.0%) | 0 (0.0%) |
| 35 to 44 Years | 52 (54.2%) | 44 (45.8%) |
| 45 to 54 Years | 76 (82.6%) | 16 (17.4%) |
| 55 to 64 Years | 17 (30.4%) | 39 (69.6%) |
| 65 to 74 Years | 60 (100.0%) | 0 (0.0%) |
| 75 Years and older | 13 (100.0%) | 0 (0.0%) |
| Total | 308 (70.2%) | 131 (29.8%) |
Health Insurance Coverage by Citizenship Status in Shipman
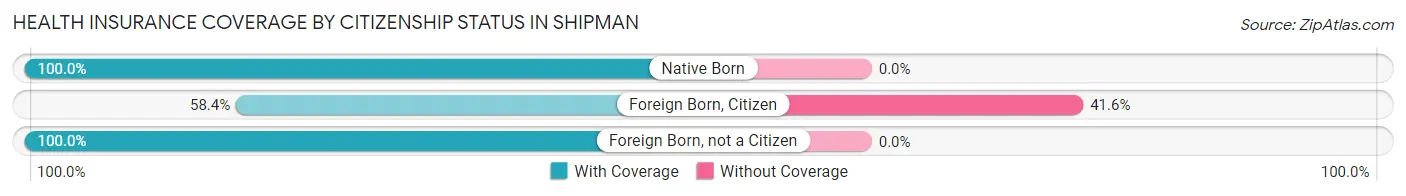
| Citizenship Status | With Coverage | Without Coverage |
| Native Born | 29 (100.0%) | 0 (0.0%) |
| Foreign Born, Citizen | 45 (58.4%) | 32 (41.6%) |
| Foreign Born, not a Citizen | 16 (100.0%) | 0 (0.0%) |
Health Insurance Coverage by Household Income in Shipman
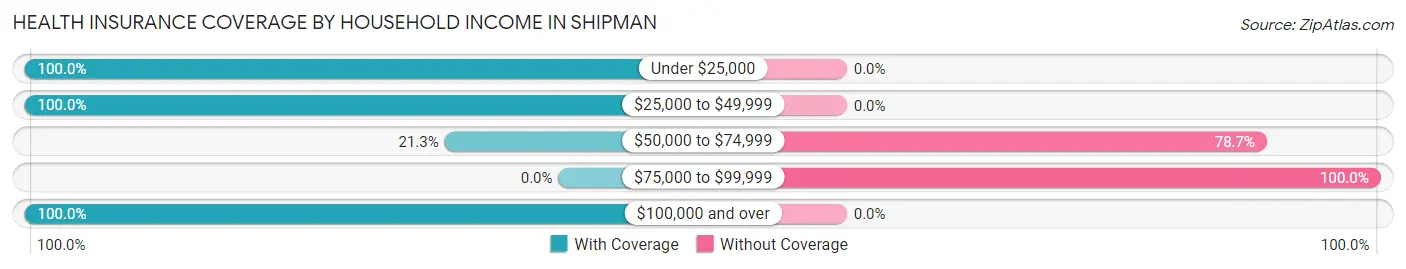
| Household Income | With Coverage | Without Coverage |
| Under $25,000 | 171 (100.0%) | 0 (0.0%) |
| $25,000 to $49,999 | 58 (100.0%) | 0 (0.0%) |
| $50,000 to $74,999 | 29 (21.3%) | 107 (78.7%) |
| $75,000 to $99,999 | 0 (0.0%) | 24 (100.0%) |
| $100,000 and over | 50 (100.0%) | 0 (0.0%) |
Public vs Private Health Insurance Coverage by Age in Shipman
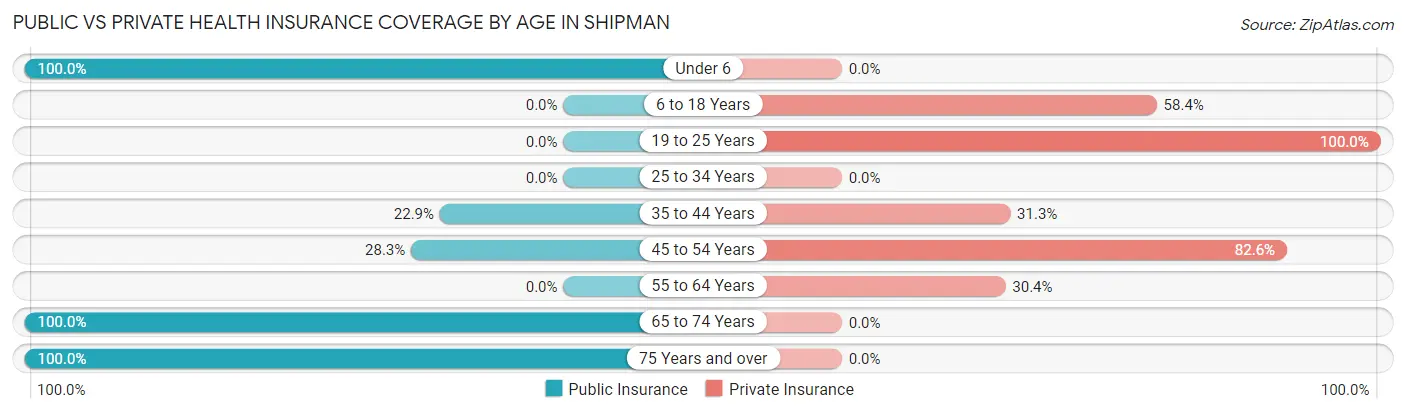
| Age Bracket | Public Insurance | Private Insurance |
| Under 6 | 29 (100.0%) | 0 (0.0%) |
| 6 to 18 Years | 0 (0.0%) | 45 (58.4%) |
| 19 to 25 Years | 0 (0.0%) | 16 (100.0%) |
| 25 to 34 Years | 0 (0.0%) | 0 (0.0%) |
| 35 to 44 Years | 22 (22.9%) | 30 (31.2%) |
| 45 to 54 Years | 26 (28.3%) | 76 (82.6%) |
| 55 to 64 Years | 0 (0.0%) | 17 (30.4%) |
| 65 to 74 Years | 60 (100.0%) | 0 (0.0%) |
| 75 Years and over | 13 (100.0%) | 0 (0.0%) |
| Total | 150 (34.2%) | 184 (41.9%) |
Disability Status by Sex by Age in Shipman
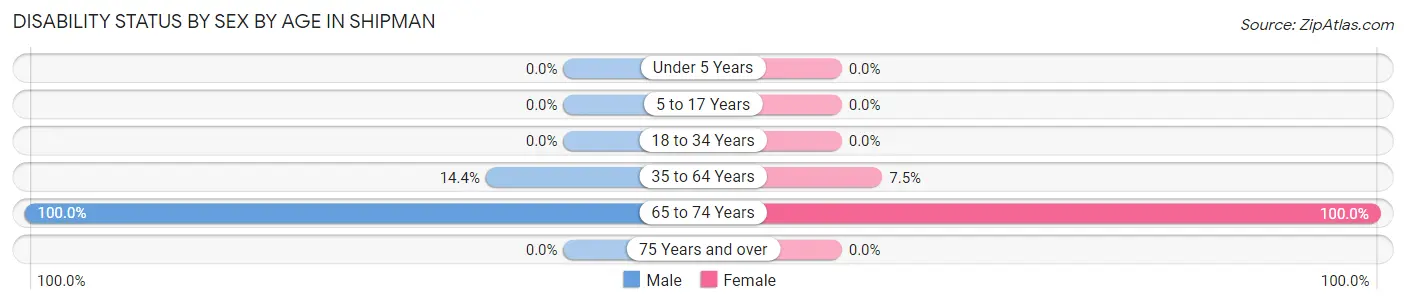
| Age Bracket | Male | Female |
| Under 5 Years | 0 (0.0%) | 0 (0.0%) |
| 5 to 17 Years | 0 (0.0%) | 0 (0.0%) |
| 18 to 34 Years | 0 (0.0%) | 0 (0.0%) |
| 35 to 64 Years | 16 (14.4%) | 10 (7.5%) |
| 65 to 74 Years | 32 (100.0%) | 28 (100.0%) |
| 75 Years and over | 0 (0.0%) | 0 (0.0%) |
Disability Class by Sex by Age in Shipman
Disability Class: Hearing Difficulty
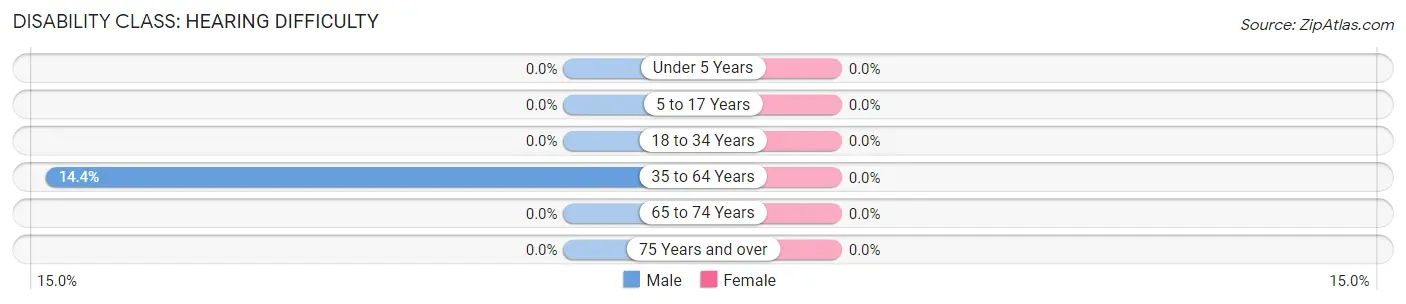
| Age Bracket | Male | Female |
| Under 5 Years | 0 (0.0%) | 0 (0.0%) |
| 5 to 17 Years | 0 (0.0%) | 0 (0.0%) |
| 18 to 34 Years | 0 (0.0%) | 0 (0.0%) |
| 35 to 64 Years | 16 (14.4%) | 0 (0.0%) |
| 65 to 74 Years | 0 (0.0%) | 0 (0.0%) |
| 75 Years and over | 0 (0.0%) | 0 (0.0%) |
Disability Class: Vision Difficulty
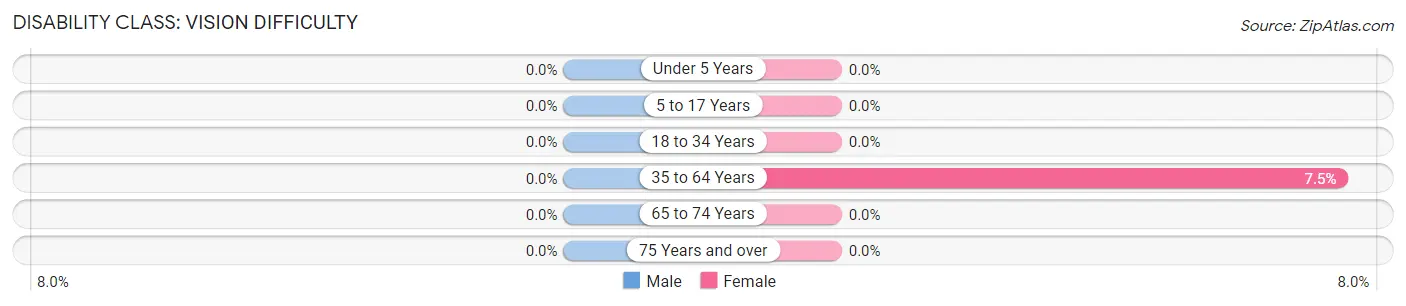
| Age Bracket | Male | Female |
| Under 5 Years | 0 (0.0%) | 0 (0.0%) |
| 5 to 17 Years | 0 (0.0%) | 0 (0.0%) |
| 18 to 34 Years | 0 (0.0%) | 0 (0.0%) |
| 35 to 64 Years | 0 (0.0%) | 10 (7.5%) |
| 65 to 74 Years | 0 (0.0%) | 0 (0.0%) |
| 75 Years and over | 0 (0.0%) | 0 (0.0%) |
Disability Class: Cognitive Difficulty
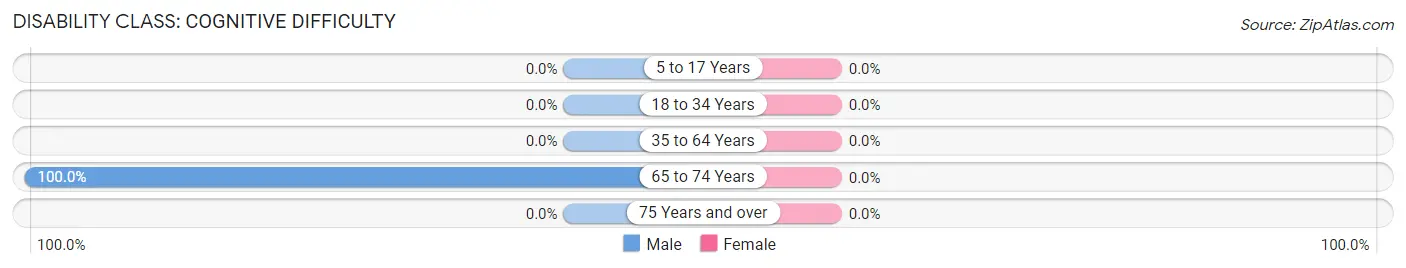
| Age Bracket | Male | Female |
| 5 to 17 Years | 0 (0.0%) | 0 (0.0%) |
| 18 to 34 Years | 0 (0.0%) | 0 (0.0%) |
| 35 to 64 Years | 0 (0.0%) | 0 (0.0%) |
| 65 to 74 Years | 32 (100.0%) | 0 (0.0%) |
| 75 Years and over | 0 (0.0%) | 0 (0.0%) |
Disability Class: Ambulatory Difficulty
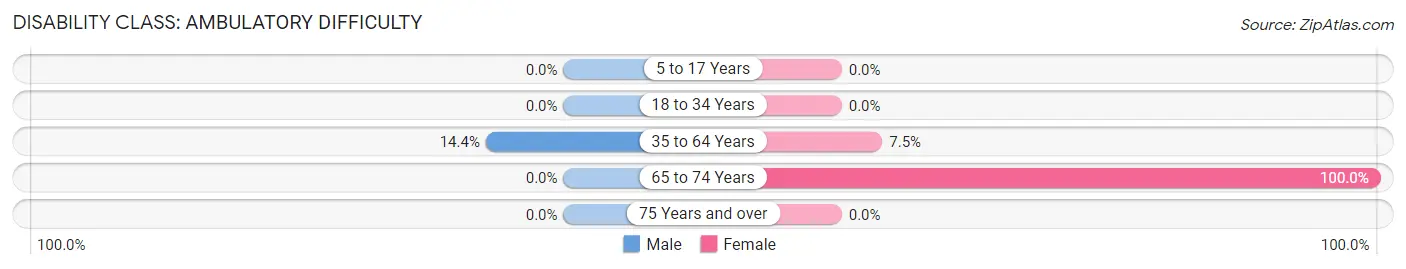
| Age Bracket | Male | Female |
| 5 to 17 Years | 0 (0.0%) | 0 (0.0%) |
| 18 to 34 Years | 0 (0.0%) | 0 (0.0%) |
| 35 to 64 Years | 16 (14.4%) | 10 (7.5%) |
| 65 to 74 Years | 0 (0.0%) | 28 (100.0%) |
| 75 Years and over | 0 (0.0%) | 0 (0.0%) |
Disability Class: Self-Care Difficulty
| Age Bracket | Male | Female |
| 5 to 17 Years | 0 (0.0%) | 0 (0.0%) |
| 18 to 34 Years | 0 (0.0%) | 0 (0.0%) |
| 35 to 64 Years | 0 (0.0%) | 0 (0.0%) |
| 65 to 74 Years | 0 (0.0%) | 0 (0.0%) |
| 75 Years and over | 0 (0.0%) | 0 (0.0%) |
Technology Access in Shipman
Computing Device Access in Shipman
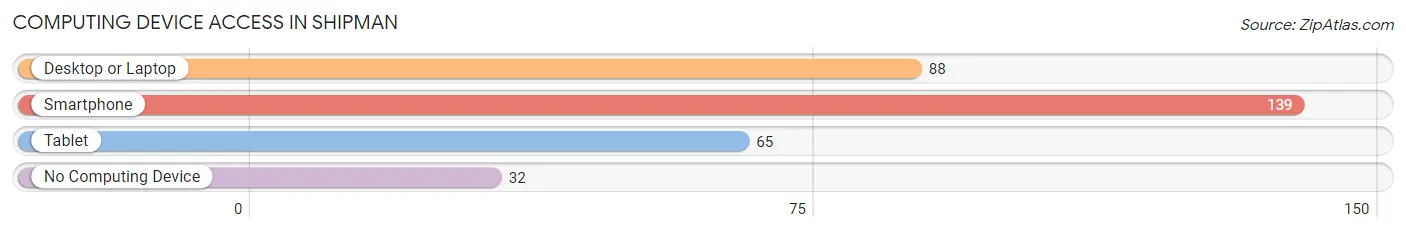
| Device Type | # Households | % Households |
| Desktop or Laptop | 88 | 47.8% |
| Smartphone | 139 | 75.5% |
| Tablet | 65 | 35.3% |
| No Computing Device | 32 | 17.4% |
| Total | 184 | 100.0% |
Internet Access in Shipman
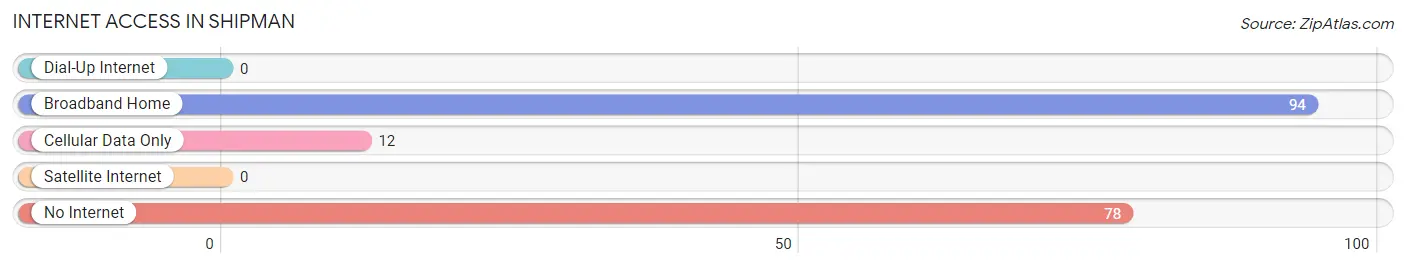
| Internet Type | # Households | % Households |
| Dial-Up Internet | 0 | 0.0% |
| Broadband Home | 94 | 51.1% |
| Cellular Data Only | 12 | 6.5% |
| Satellite Internet | 0 | 0.0% |
| No Internet | 78 | 42.4% |
| Total | 184 | 100.0% |
Shipman Summary
Shipman is a small unincorporated community located in Nelson County, Virginia. It is situated in the foothills of the Blue Ridge Mountains, approximately 20 miles south of Charlottesville. The population of Shipman was estimated to be around 500 in 2020.
History
Shipman was first settled in the late 1700s by a group of German immigrants. The town was named after the Shipman family, who were among the first settlers. The town was originally known as Shipman’s Crossroads, as it was located at the intersection of two major roads.
In the early 1800s, the town was a major stop on the stagecoach route between Charlottesville and Lynchburg. The town was also a popular stop for travelers on the James River and Kanawha Canal.
In the late 1800s, the town was home to a number of businesses, including a general store, a blacksmith shop, a grist mill, and a sawmill. The town also had a post office, a school, and a church.
In the early 1900s, the town began to decline as the railroad bypassed it. The town’s population decreased and many of the businesses closed.
Geography
Shipman is located in the foothills of the Blue Ridge Mountains in Nelson County, Virginia. The town is situated at an elevation of 1,000 feet above sea level. The town is located approximately 20 miles south of Charlottesville and is bordered by the James River to the east and the Blue Ridge Mountains to the west.
The town is located in a rural area and is surrounded by rolling hills and farmland. The town is also located near several state parks, including James River State Park and Shenandoah National Park.
Economy
Shipman’s economy is largely based on agriculture and tourism. The town is home to several farms, including a dairy farm, a beef farm, and a vegetable farm. The town is also home to several wineries and a brewery.
The town is also home to several small businesses, including a general store, a hardware store, and a restaurant. The town is also home to a number of bed and breakfasts, as well as a few small inns.
Demographics
The population of Shipman was estimated to be around 500 in 2020. The town is predominantly white, with a small African American population. The median household income in the town is around $50,000. The town has a low unemployment rate and a high rate of home ownership.
Shipman is a small, rural community with a rich history and a strong sense of community. The town is home to a number of small businesses and is a popular destination for tourists looking to explore the area’s natural beauty. The town is also home to a number of farms and wineries, making it a great place to visit for those looking to experience the area’s agricultural heritage.
Common Questions
What is Per Capita Income in Shipman?
Per Capita income in Shipman is $15,366.
What is the Median Family Income in Shipman?
Median Family Income in Shipman is $47,000.
What is Inequality or Gini Index in Shipman?
Inequality or Gini Index in Shipman is 0.46.
What is the Total Population of Shipman?
Total Population of Shipman is 439.
What is the Total Male Population of Shipman?
Total Male Population of Shipman is 199.
What is the Total Female Population of Shipman?
Total Female Population of Shipman is 240.
What is the Ratio of Males per 100 Females in Shipman?
There are 82.92 Males per 100 Females in Shipman.
What is the Ratio of Females per 100 Males in Shipman?
There are 120.60 Females per 100 Males in Shipman.
What is the Median Population Age in Shipman?
Median Population Age in Shipman is 46.1 Years.
What is the Average Family Size in Shipman
Average Family Size in Shipman is 2.8 People.
What is the Average Household Size in Shipman
Average Household Size in Shipman is 2.4 People.
How Large is the Labor Force in Shipman?
There are 170 People in the Labor Forcein in Shipman.
What is the Percentage of People in the Labor Force in Shipman?
48.4% of People are in the Labor Force in Shipman.
What is the Unemployment Rate in Shipman?
Unemployment Rate in Shipman is 10.0%.