Zip Codes with the Highest Percentage of Population with a Degree in Multidisciplinary Studies in Cincinnati, OH
RELATED REPORTS & OPTIONS
Multidisciplinary Studies
Cincinnati
Compare Zip Codes
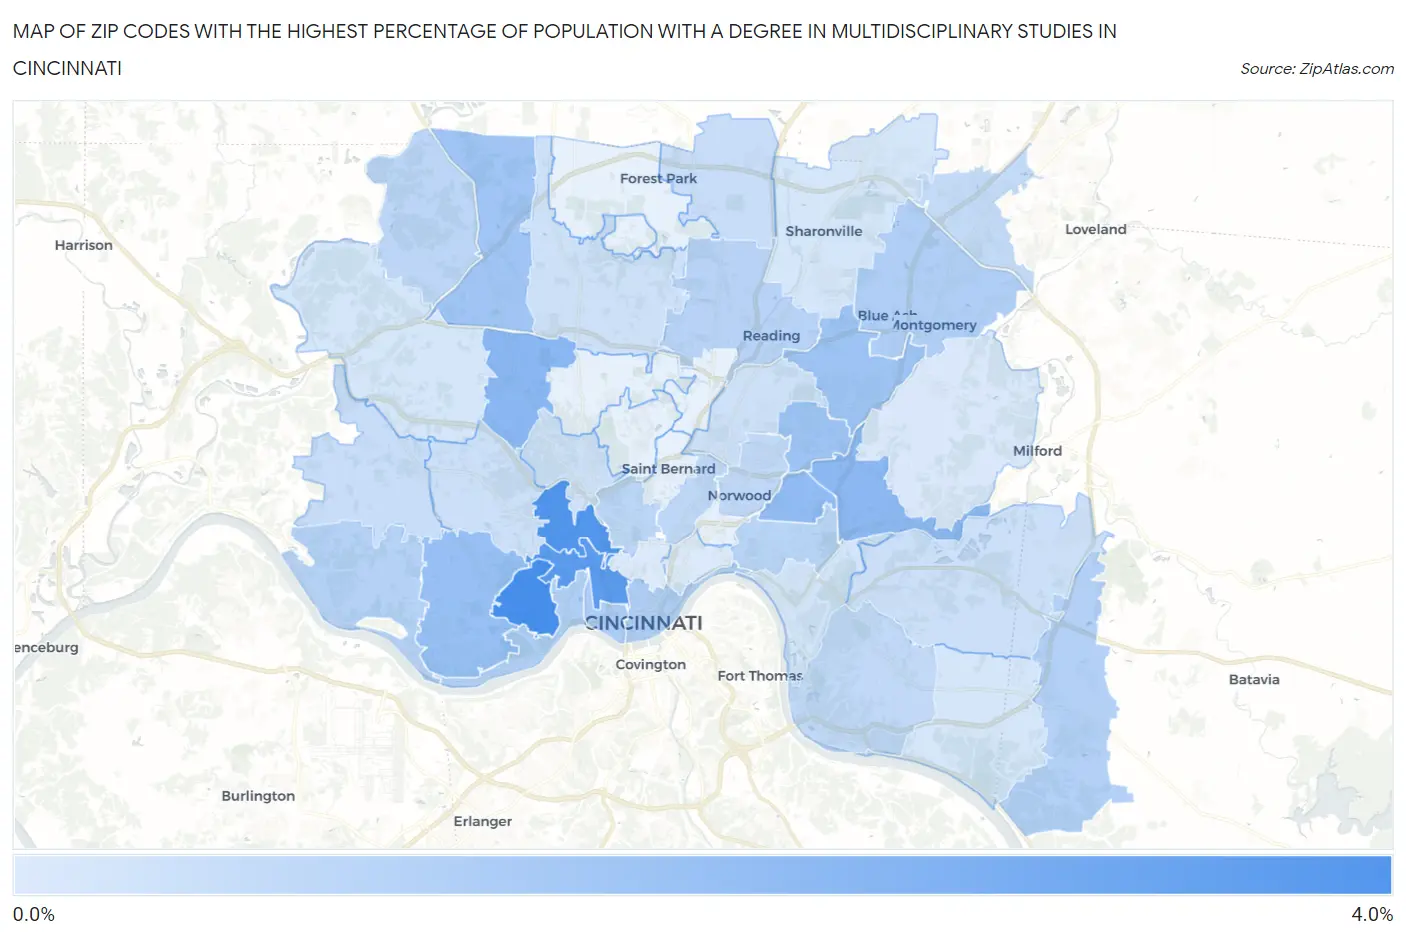
Map of Zip Codes with the Highest Percentage of Population with a Degree in Multidisciplinary Studies in Cincinnati
0.073%
3.1%
Zip Codes with the Highest Percentage of Population with a Degree in Multidisciplinary Studies in Cincinnati, OH
| Zip Code | % Graduates | vs State | vs National | |
| 1. | 45205 | 3.1% | 0.77%(+2.33)#35 | 0.88%(+2.23)#1,340 |
| 2. | 45225 | 2.9% | 0.77%(+2.10)#45 | 0.88%(+1.99)#1,509 |
| 3. | 45214 | 2.7% | 0.77%(+1.94)#49 | 0.88%(+1.84)#1,644 |
| 4. | 45239 | 1.8% | 0.77%(+0.982)#105 | 0.88%(+0.874)#3,177 |
| 5. | 45227 | 1.7% | 0.77%(+0.919)#110 | 0.88%(+0.811)#3,336 |
| 6. | 45209 | 1.6% | 0.77%(+0.840)#121 | 0.88%(+0.732)#3,556 |
| 7. | 45238 | 1.5% | 0.77%(+0.683)#141 | 0.88%(+0.575)#4,124 |
| 8. | 45213 | 1.3% | 0.77%(+0.558)#152 | 0.88%(+0.450)#4,556 |
| 9. | 45236 | 1.3% | 0.77%(+0.557)#153 | 0.88%(+0.449)#4,559 |
| 10. | 45251 | 1.3% | 0.77%(+0.501)#159 | 0.88%(+0.393)#4,823 |
| 11. | 45203 | 1.0% | 0.77%(+0.264)#199 | 0.88%(+0.156)#6,128 |
| 12. | 45202 | 0.98% | 0.77%(+0.206)#206 | 0.88%(+0.098)#6,501 |
| 13. | 45242 | 0.95% | 0.77%(+0.179)#213 | 0.88%(+0.071)#6,686 |
| 14. | 45204 | 0.93% | 0.77%(+0.162)#219 | 0.88%(+0.054)#6,813 |
| 15. | 45245 | 0.92% | 0.77%(+0.145)#223 | 0.88%(+0.037)#6,942 |
| 16. | 45233 | 0.87% | 0.77%(+0.099)#227 | 0.88%(-0.009)#7,274 |
| 17. | 45215 | 0.81% | 0.77%(+0.039)#241 | 0.88%(-0.069)#7,748 |
| 18. | 45208 | 0.78% | 0.77%(+0.011)#247 | 0.88%(-0.097)#7,970 |
| 19. | 45252 | 0.74% | 0.77%(-0.030)#261 | 0.88%(-0.138)#8,286 |
| 20. | 45220 | 0.71% | 0.77%(-0.060)#269 | 0.88%(-0.168)#8,518 |
| 21. | 45229 | 0.68% | 0.77%(-0.093)#277 | 0.88%(-0.201)#8,798 |
| 22. | 45230 | 0.63% | 0.77%(-0.139)#290 | 0.88%(-0.247)#9,217 |
| 23. | 45212 | 0.60% | 0.77%(-0.167)#301 | 0.88%(-0.275)#9,512 |
| 24. | 45249 | 0.60% | 0.77%(-0.172)#303 | 0.88%(-0.280)#9,555 |
| 25. | 45246 | 0.48% | 0.77%(-0.289)#337 | 0.88%(-0.397)#10,591 |
| 26. | 45248 | 0.48% | 0.77%(-0.289)#338 | 0.88%(-0.397)#10,595 |
| 27. | 45244 | 0.39% | 0.77%(-0.385)#378 | 0.88%(-0.493)#11,479 |
| 28. | 45211 | 0.37% | 0.77%(-0.397)#384 | 0.88%(-0.505)#11,594 |
| 29. | 45231 | 0.37% | 0.77%(-0.404)#385 | 0.88%(-0.513)#11,664 |
| 30. | 45237 | 0.36% | 0.77%(-0.415)#389 | 0.88%(-0.523)#11,740 |
| 31. | 45223 | 0.35% | 0.77%(-0.417)#390 | 0.88%(-0.525)#11,760 |
| 32. | 45226 | 0.25% | 0.77%(-0.518)#419 | 0.88%(-0.626)#12,536 |
| 33. | 45241 | 0.22% | 0.77%(-0.554)#422 | 0.88%(-0.662)#12,775 |
| 34. | 45247 | 0.22% | 0.77%(-0.556)#423 | 0.88%(-0.664)#12,788 |
| 35. | 45255 | 0.21% | 0.77%(-0.560)#425 | 0.88%(-0.668)#12,819 |
| 36. | 45243 | 0.12% | 0.77%(-0.655)#440 | 0.88%(-0.763)#13,370 |
| 37. | 45206 | 0.087% | 0.77%(-0.685)#443 | 0.88%(-0.793)#13,466 |
| 38. | 45219 | 0.073% | 0.77%(-0.699)#444 | 0.88%(-0.807)#13,498 |
1
Common Questions
What are the Top 10 Zip Codes with the Highest Percentage of Population with a Degree in Multidisciplinary Studies in Cincinnati, OH?
Top 10 Zip Codes with the Highest Percentage of Population with a Degree in Multidisciplinary Studies in Cincinnati, OH are:
What zip code has the Highest Percentage of Population with a Degree in Multidisciplinary Studies in Cincinnati, OH?
45205 has the Highest Percentage of Population with a Degree in Multidisciplinary Studies in Cincinnati, OH with 3.1%.
What is the Percentage of Population with a Degree in Multidisciplinary Studies in Cincinnati, OH?
Percentage of Population with a Degree in Multidisciplinary Studies in Cincinnati is 0.96%.
What is the Percentage of Population with a Degree in Multidisciplinary Studies in Ohio?
Percentage of Population with a Degree in Multidisciplinary Studies in Ohio is 0.77%.
What is the Percentage of Population with a Degree in Multidisciplinary Studies in the United States?
Percentage of Population with a Degree in Multidisciplinary Studies in the United States is 0.88%.