Vanderbilt, MI Map & Demographics
Vanderbilt Map
Vanderbilt Overview
$29,345
PER CAPITA INCOME
$43,500
AVG FAMILY INCOME
$39,821
AVG HOUSEHOLD INCOME
29.1%
WAGE / INCOME GAP [ % ]
70.9¢/ $1
WAGE / INCOME GAP [ $ ]
0.54
INEQUALITY / GINI INDEX
495
TOTAL POPULATION
291
MALE POPULATION
204
FEMALE POPULATION
142.65
MALES / 100 FEMALES
70.10
FEMALES / 100 MALES
41.5
MEDIAN AGE
3.3
AVG FAMILY SIZE
2.4
AVG HOUSEHOLD SIZE
255
LABOR FORCE [ PEOPLE ]
61.9%
PERCENT IN LABOR FORCE
6.3%
UNEMPLOYMENT RATE
Vanderbilt Zip Codes
Vanderbilt Area Codes
Income in Vanderbilt
Income Overview in Vanderbilt
Per Capita Income in Vanderbilt is $29,345, while median incomes of families and households are $43,500 and $39,821 respectively.
| Characteristic | Number | Measure |
| Per Capita Income | 495 | $29,345 |
| Median Family Income | 112 | $43,500 |
| Mean Family Income | 112 | $78,737 |
| Median Household Income | 207 | $39,821 |
| Mean Household Income | 207 | $67,418 |
| Income Deficit | 112 | $0 |
| Wage / Income Gap (%) | 495 | 29.10% |
| Wage / Income Gap ($) | 495 | 70.90¢ per $1 |
| Gini / Inequality Index | 495 | 0.54 |
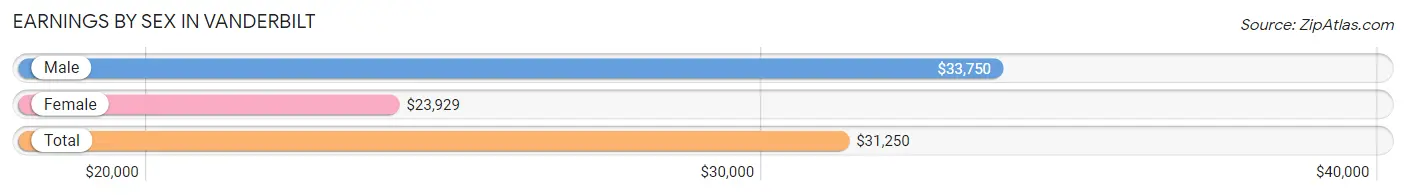
Earnings by Sex in Vanderbilt
Average Earnings in Vanderbilt are $31,250, $33,750 for men and $23,929 for women, a difference of 29.1%.
| Sex | Number | Average Earnings |
| Male | 157 (60.6%) | $33,750 |
| Female | 102 (39.4%) | $23,929 |
| Total | 259 (100.0%) | $31,250 |
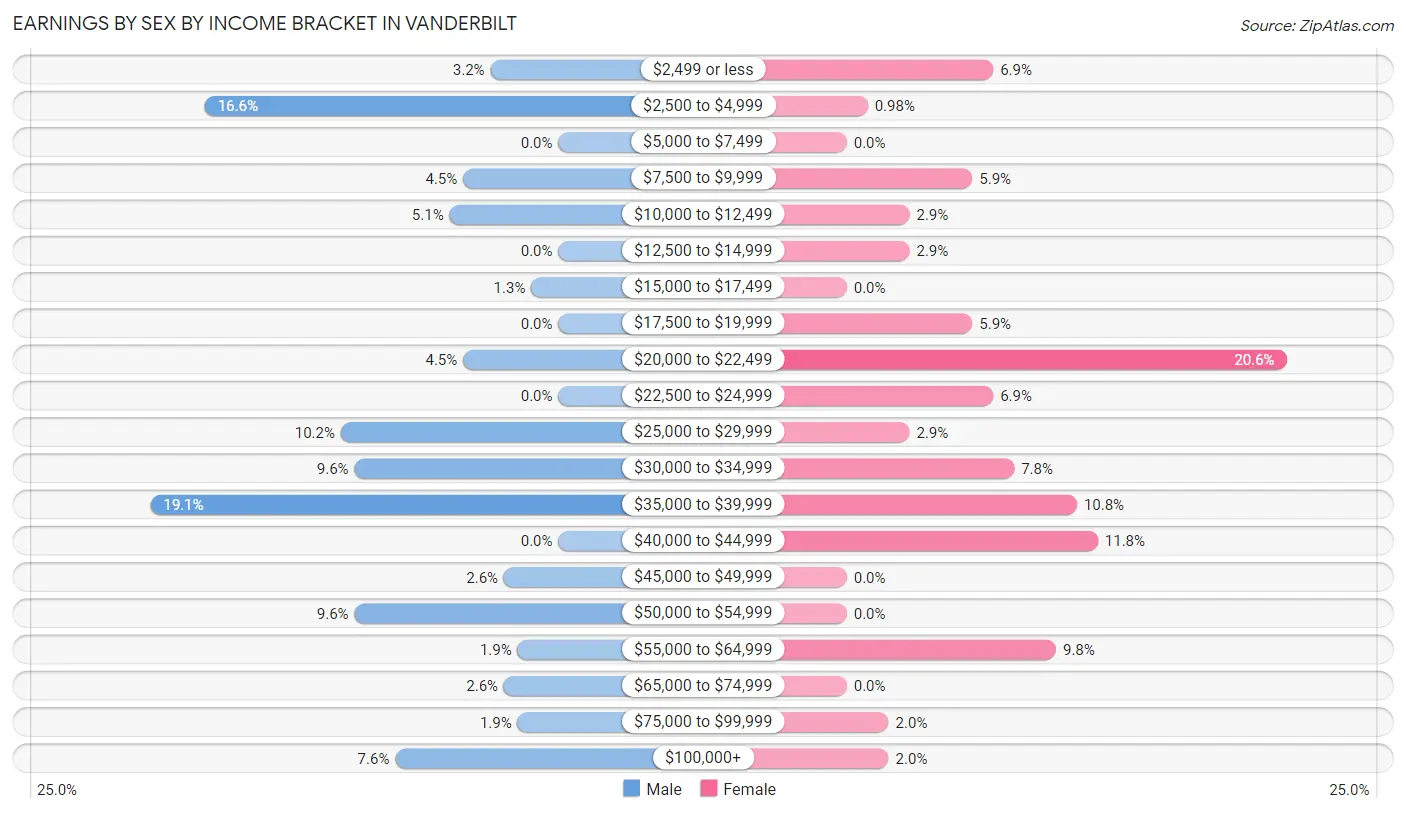
Earnings by Sex by Income Bracket in Vanderbilt
The most common earnings brackets in Vanderbilt are $35,000 to $39,999 for men (30 | 19.1%) and $20,000 to $22,499 for women (21 | 20.6%).
| Income | Male | Female |
| $2,499 or less | 5 (3.2%) | 7 (6.9%) |
| $2,500 to $4,999 | 26 (16.6%) | 1 (1.0%) |
| $5,000 to $7,499 | 0 (0.0%) | 0 (0.0%) |
| $7,500 to $9,999 | 7 (4.5%) | 6 (5.9%) |
| $10,000 to $12,499 | 8 (5.1%) | 3 (2.9%) |
| $12,500 to $14,999 | 0 (0.0%) | 3 (2.9%) |
| $15,000 to $17,499 | 2 (1.3%) | 0 (0.0%) |
| $17,500 to $19,999 | 0 (0.0%) | 6 (5.9%) |
| $20,000 to $22,499 | 7 (4.5%) | 21 (20.6%) |
| $22,500 to $24,999 | 0 (0.0%) | 7 (6.9%) |
| $25,000 to $29,999 | 16 (10.2%) | 3 (2.9%) |
| $30,000 to $34,999 | 15 (9.6%) | 8 (7.8%) |
| $35,000 to $39,999 | 30 (19.1%) | 11 (10.8%) |
| $40,000 to $44,999 | 0 (0.0%) | 12 (11.8%) |
| $45,000 to $49,999 | 4 (2.5%) | 0 (0.0%) |
| $50,000 to $54,999 | 15 (9.6%) | 0 (0.0%) |
| $55,000 to $64,999 | 3 (1.9%) | 10 (9.8%) |
| $65,000 to $74,999 | 4 (2.5%) | 0 (0.0%) |
| $75,000 to $99,999 | 3 (1.9%) | 2 (2.0%) |
| $100,000+ | 12 (7.6%) | 2 (2.0%) |
| Total | 157 (100.0%) | 102 (100.0%) |
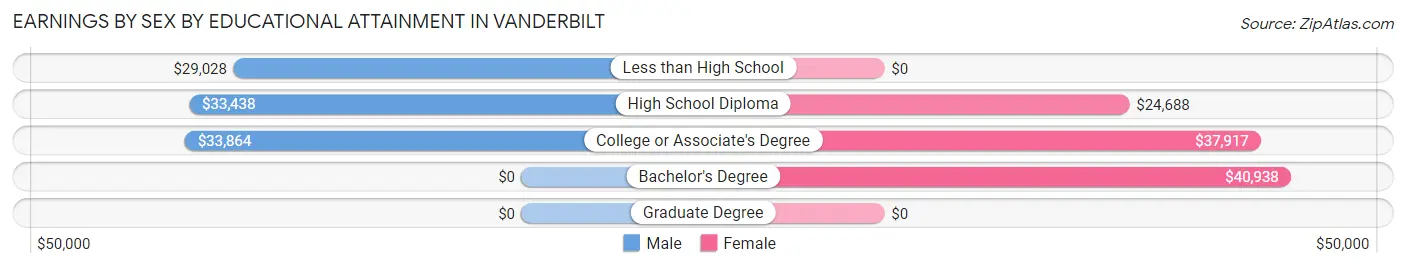
Earnings by Sex by Educational Attainment in Vanderbilt
Average earnings in Vanderbilt are $33,167 for men and $33,750 for women, a difference of 1.7%. Men with an educational attainment of college or associate's degree enjoy the highest average annual earnings of $33,864, while those with less than high school education earn the least with $29,028. Women with an educational attainment of bachelor's degree earn the most with the average annual earnings of $40,938, while those with high school diploma education have the smallest earnings of $24,688.
| Educational Attainment | Male Income | Female Income |
| Less than High School | $29,028 | $0 |
| High School Diploma | $33,438 | $24,688 |
| College or Associate's Degree | $33,864 | $37,917 |
| Bachelor's Degree | - | - |
| Graduate Degree | - | - |
| Total | $33,167 | $33,750 |
Family Income in Vanderbilt
Family Income Brackets in Vanderbilt
According to the Vanderbilt family income data, there are 24 families falling into the $50,000 to $74,999 income range, which is the most common income bracket and makes up 21.4% of all families.
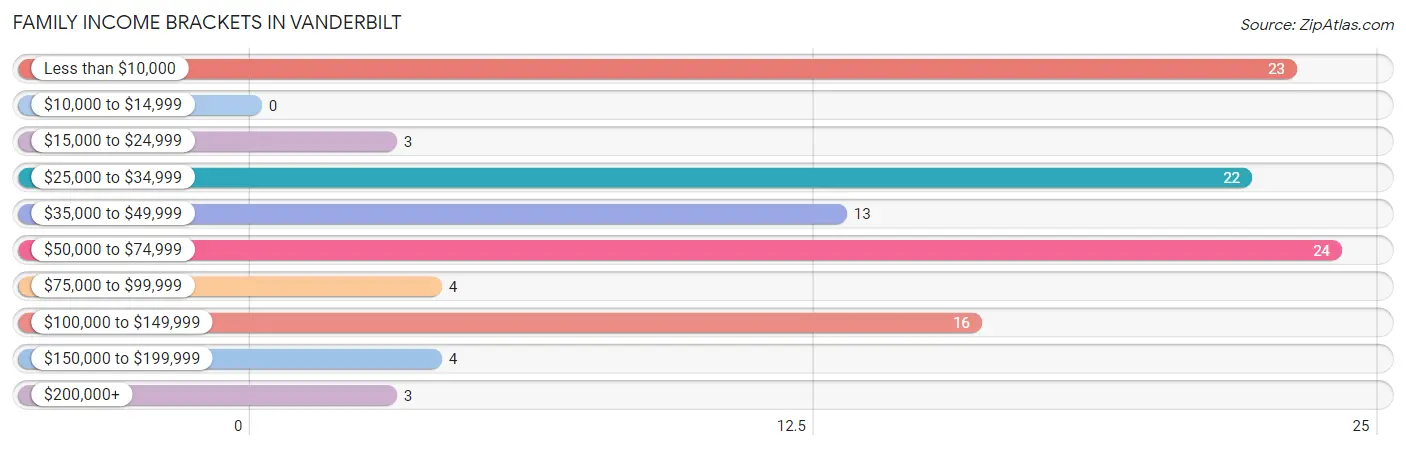
| Income Bracket | # Families | % Families |
| Less than $10,000 | 23 | 20.5% |
| $10,000 to $14,999 | 0 | 0.0% |
| $15,000 to $24,999 | 3 | 2.7% |
| $25,000 to $34,999 | 22 | 19.6% |
| $35,000 to $49,999 | 13 | 11.6% |
| $50,000 to $74,999 | 24 | 21.4% |
| $75,000 to $99,999 | 4 | 3.6% |
| $100,000 to $149,999 | 16 | 14.3% |
| $150,000 to $199,999 | 4 | 3.6% |
| $200,000+ | 3 | 2.7% |
Family Income by Famaliy Size in Vanderbilt
2-person families (59 | 52.7%) account for the highest median family income in Vanderbilt with $43,750 per family, while 2-person families (59 | 52.7%) have the highest median income of $21,875 per family member.
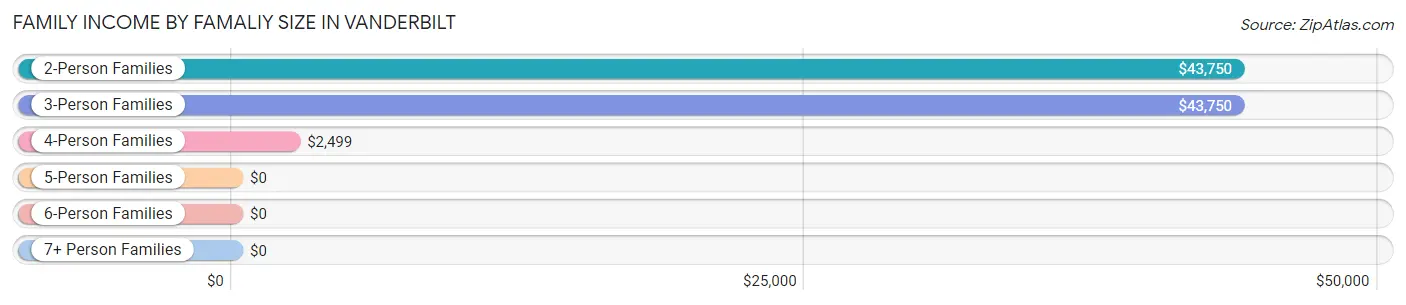
| Income Bracket | # Families | Median Income |
| 2-Person Families | 59 (52.7%) | $43,750 |
| 3-Person Families | 12 (10.7%) | $43,750 |
| 4-Person Families | 27 (24.1%) | $2,499 |
| 5-Person Families | 3 (2.7%) | $0 |
| 6-Person Families | 11 (9.8%) | $0 |
| 7+ Person Families | 0 (0.0%) | $0 |
| Total | 112 (100.0%) | $43,500 |
Family Income by Number of Earners in Vanderbilt
The median family income in Vanderbilt is $43,500, with families comprising 3+ earners (19) having the highest median family income of $115,938, while families with no earners (31) have the lowest median family income of $2,499, accounting for 17.0% and 27.7% of families, respectively.
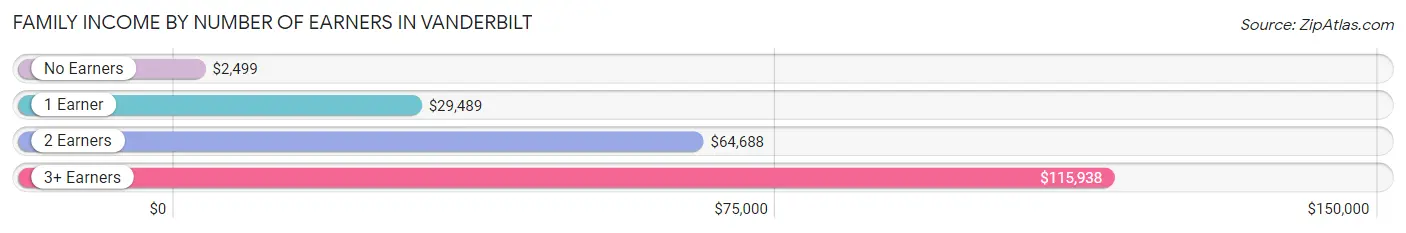
| Number of Earners | # Families | Median Income |
| No Earners | 31 (27.7%) | $2,499 |
| 1 Earner | 43 (38.4%) | $29,489 |
| 2 Earners | 19 (17.0%) | $64,688 |
| 3+ Earners | 19 (17.0%) | $115,938 |
| Total | 112 (100.0%) | $43,500 |
Household Income in Vanderbilt
Household Income Brackets in Vanderbilt
With 46 households falling in the category, the $50,000 to $74,999 income range is the most frequent in Vanderbilt, accounting for 22.2% of all households. In contrast, only 3 households (1.5%) fall into the $200,000+ income bracket, making it the least populous group.
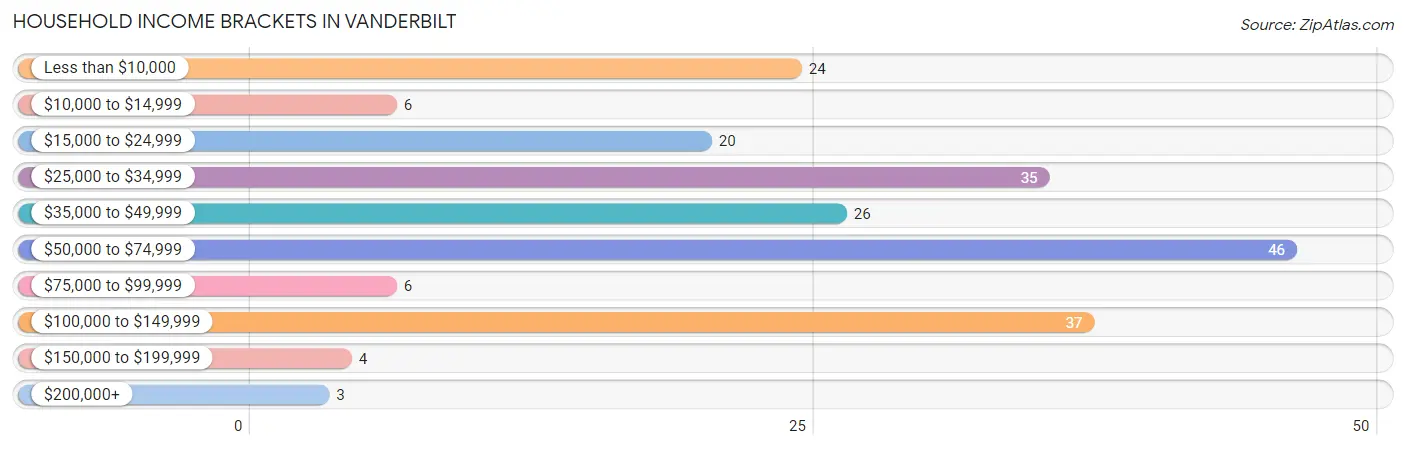
| Income Bracket | # Households | % Households |
| Less than $10,000 | 24 | 11.6% |
| $10,000 to $14,999 | 6 | 2.9% |
| $15,000 to $24,999 | 20 | 9.7% |
| $25,000 to $34,999 | 35 | 16.9% |
| $35,000 to $49,999 | 26 | 12.6% |
| $50,000 to $74,999 | 46 | 22.2% |
| $75,000 to $99,999 | 6 | 2.9% |
| $100,000 to $149,999 | 37 | 17.9% |
| $150,000 to $199,999 | 4 | 1.9% |
| $200,000+ | 3 | 1.4% |
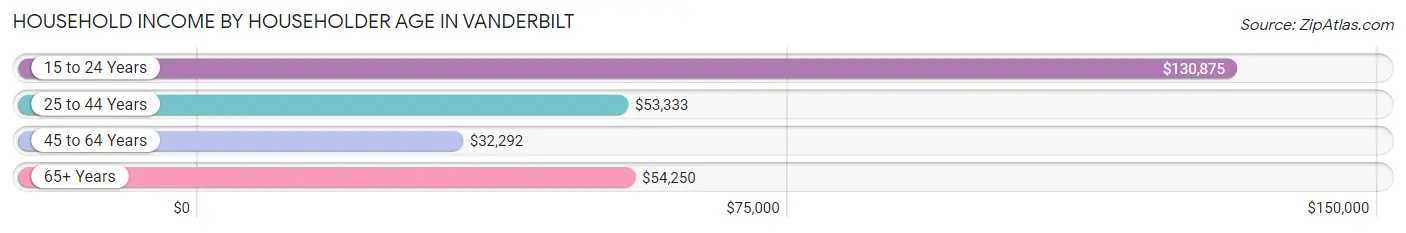
Household Income by Householder Age in Vanderbilt
The median household income in Vanderbilt is $39,821, with the highest median household income of $130,875 found in the 15 to 24 years age bracket for the primary householder. A total of 13 households (6.3%) fall into this category. Meanwhile, the 45 to 64 years age bracket for the primary householder has the lowest median household income of $32,292, with 91 households (44.0%) in this group.
| Income Bracket | # Households | Median Income |
| 15 to 24 Years | 13 (6.3%) | $130,875 |
| 25 to 44 Years | 62 (29.9%) | $53,333 |
| 45 to 64 Years | 91 (44.0%) | $32,292 |
| 65+ Years | 41 (19.8%) | $54,250 |
| Total | 207 (100.0%) | $39,821 |
Poverty in Vanderbilt
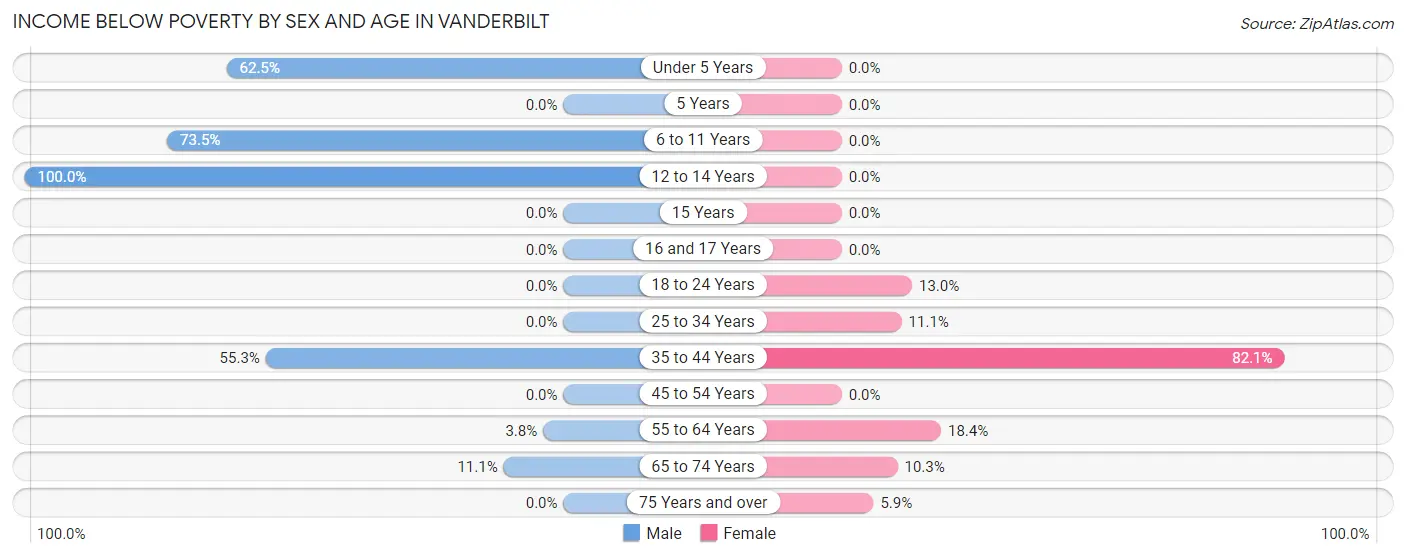
Income Below Poverty by Sex and Age in Vanderbilt
With 27.2% poverty level for males and 19.6% for females among the residents of Vanderbilt, 12 to 14 year old males and 35 to 44 year old females are the most vulnerable to poverty, with 24 males (100.0%) and 23 females (82.1%) in their respective age groups living below the poverty level.
| Age Bracket | Male | Female |
| Under 5 Years | 5 (62.5%) | 0 (0.0%) |
| 5 Years | 0 (0.0%) | 0 (0.0%) |
| 6 to 11 Years | 25 (73.5%) | 0 (0.0%) |
| 12 to 14 Years | 24 (100.0%) | 0 (0.0%) |
| 15 Years | 0 (0.0%) | 0 (0.0%) |
| 16 and 17 Years | 0 (0.0%) | 0 (0.0%) |
| 18 to 24 Years | 0 (0.0%) | 3 (13.0%) |
| 25 to 34 Years | 0 (0.0%) | 3 (11.1%) |
| 35 to 44 Years | 21 (55.3%) | 23 (82.1%) |
| 45 to 54 Years | 0 (0.0%) | 0 (0.0%) |
| 55 to 64 Years | 2 (3.8%) | 7 (18.4%) |
| 65 to 74 Years | 2 (11.1%) | 3 (10.3%) |
| 75 Years and over | 0 (0.0%) | 1 (5.9%) |
| Total | 79 (27.2%) | 40 (19.6%) |
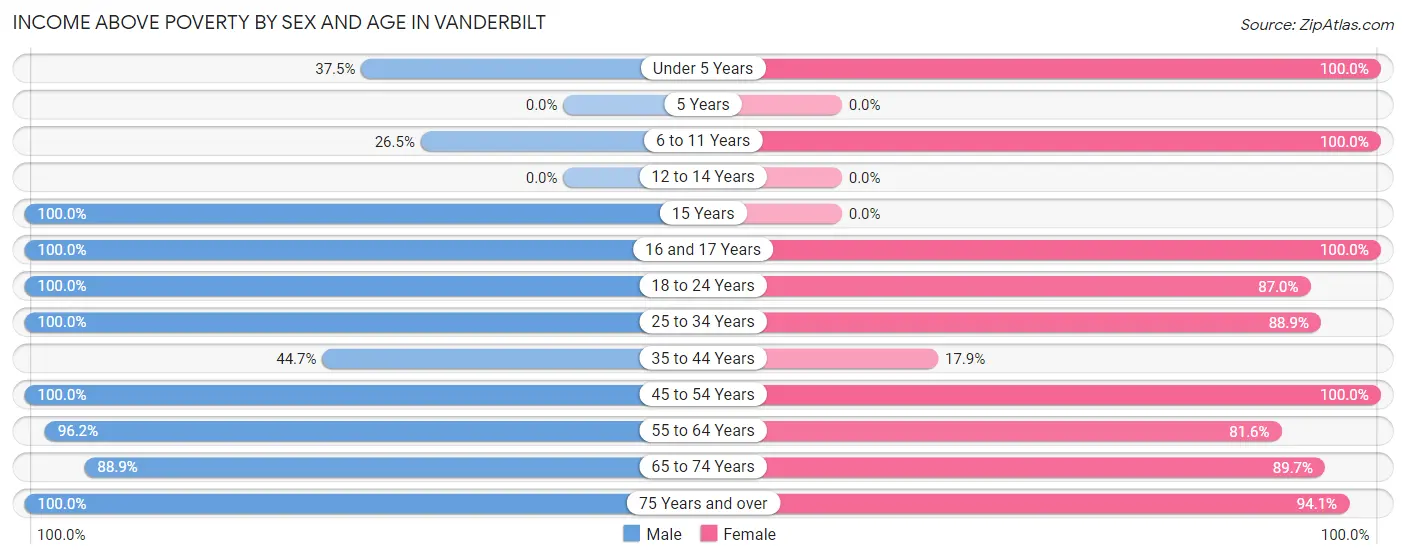
Income Above Poverty by Sex and Age in Vanderbilt
According to the poverty statistics in Vanderbilt, males aged 15 years and females aged under 5 years are the age groups that are most secure financially, with 100.0% of males and 100.0% of females in these age groups living above the poverty line.
| Age Bracket | Male | Female |
| Under 5 Years | 3 (37.5%) | 5 (100.0%) |
| 5 Years | 0 (0.0%) | 0 (0.0%) |
| 6 to 11 Years | 9 (26.5%) | 6 (100.0%) |
| 12 to 14 Years | 0 (0.0%) | 0 (0.0%) |
| 15 Years | 6 (100.0%) | 0 (0.0%) |
| 16 and 17 Years | 4 (100.0%) | 3 (100.0%) |
| 18 to 24 Years | 30 (100.0%) | 20 (87.0%) |
| 25 to 34 Years | 47 (100.0%) | 24 (88.9%) |
| 35 to 44 Years | 17 (44.7%) | 5 (17.9%) |
| 45 to 54 Years | 25 (100.0%) | 28 (100.0%) |
| 55 to 64 Years | 51 (96.2%) | 31 (81.6%) |
| 65 to 74 Years | 16 (88.9%) | 26 (89.7%) |
| 75 Years and over | 4 (100.0%) | 16 (94.1%) |
| Total | 212 (72.9%) | 164 (80.4%) |
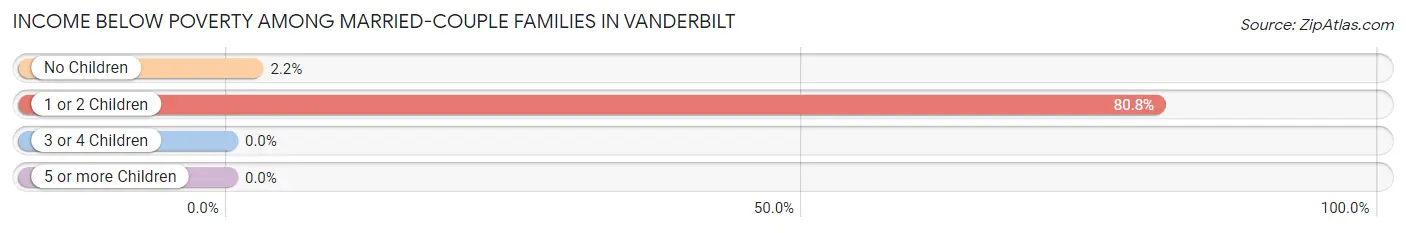
Income Below Poverty Among Married-Couple Families in Vanderbilt
The poverty statistics for married-couple families in Vanderbilt show that 31.0% or 22 of the total 71 families live below the poverty line. Families with 1 or 2 children have the highest poverty rate of 80.8%, comprising of 21 families. On the other hand, families with no children have the lowest poverty rate of 2.2%, which includes 1 families.
| Children | Above Poverty | Below Poverty |
| No Children | 44 (97.8%) | 1 (2.2%) |
| 1 or 2 Children | 5 (19.2%) | 21 (80.8%) |
| 3 or 4 Children | 0 (0.0%) | 0 (0.0%) |
| 5 or more Children | 0 (0.0%) | 0 (0.0%) |
| Total | 49 (69.0%) | 22 (31.0%) |
Income Below Poverty Among Single-Parent Households in Vanderbilt
According to the poverty data in Vanderbilt, 7.1% or 2 single-father households and 15.4% or 2 single-mother households are living below the poverty line. Among single-father households, those with 1 or 2 children have the highest poverty rate, with 2 households (40.0%) experiencing poverty. Likewise, among single-mother households, those with 1 or 2 children have the highest poverty rate, with 2 households (22.2%) falling below the poverty line.
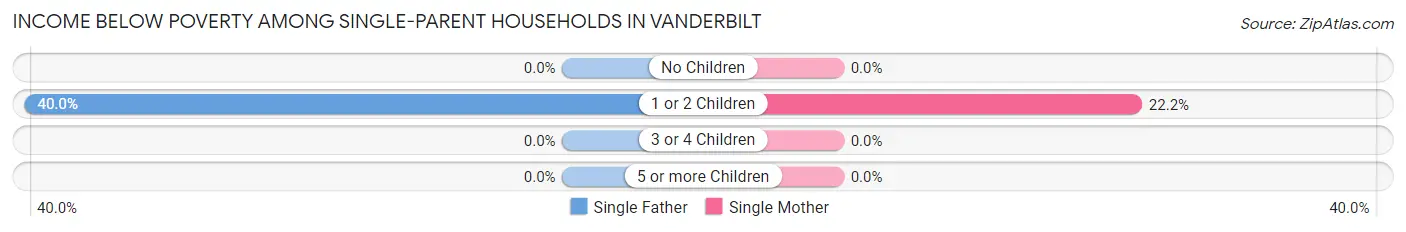
| Children | Single Father | Single Mother |
| No Children | 0 (0.0%) | 0 (0.0%) |
| 1 or 2 Children | 2 (40.0%) | 2 (22.2%) |
| 3 or 4 Children | 0 (0.0%) | 0 (0.0%) |
| 5 or more Children | 0 (0.0%) | 0 (0.0%) |
| Total | 2 (7.1%) | 2 (15.4%) |
Income Below Poverty Among Married-Couple vs Single-Parent Households in Vanderbilt
The poverty data for Vanderbilt shows that 22 of the married-couple family households (31.0%) and 4 of the single-parent households (9.8%) are living below the poverty level. Within the married-couple family households, those with 1 or 2 children have the highest poverty rate, with 21 households (80.8%) falling below the poverty line. Among the single-parent households, those with 1 or 2 children have the highest poverty rate, with 4 household (28.6%) living below poverty.
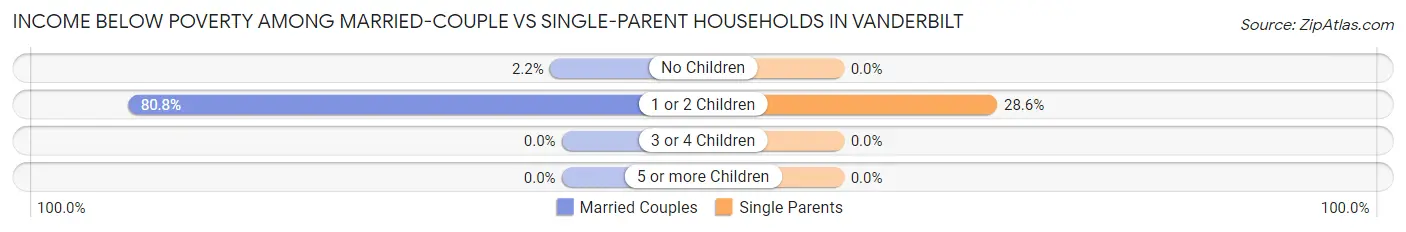
| Children | Married-Couple Families | Single-Parent Households |
| No Children | 1 (2.2%) | 0 (0.0%) |
| 1 or 2 Children | 21 (80.8%) | 4 (28.6%) |
| 3 or 4 Children | 0 (0.0%) | 0 (0.0%) |
| 5 or more Children | 0 (0.0%) | 0 (0.0%) |
| Total | 22 (31.0%) | 4 (9.8%) |
Race in Vanderbilt
The most populous races in Vanderbilt are White / Caucasian (475 | 96.0%), Two or more Races (13 | 2.6%), and Asian (3 | 0.6%).
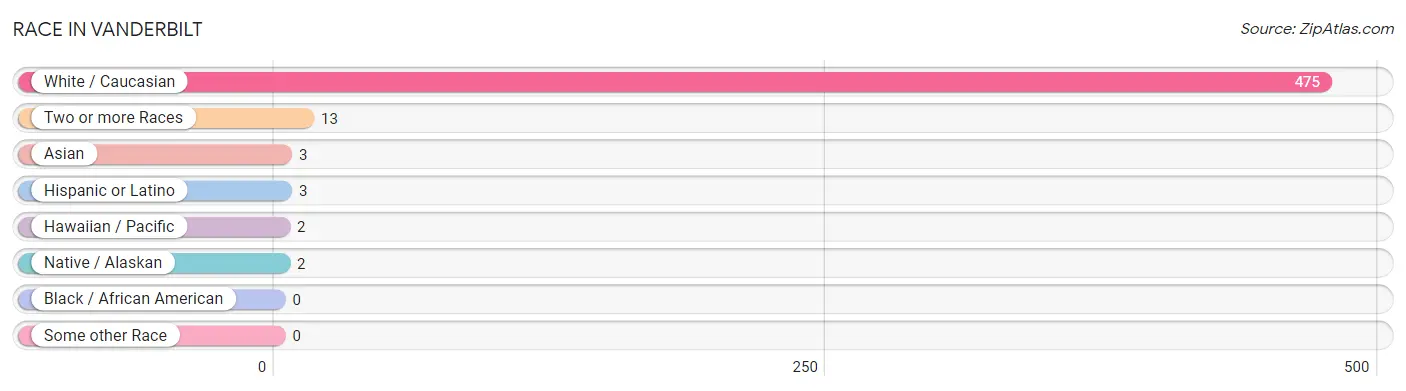
| Race | # Population | % Population |
| Asian | 3 | 0.6% |
| Black / African American | 0 | 0.0% |
| Hawaiian / Pacific | 2 | 0.4% |
| Hispanic or Latino | 3 | 0.6% |
| Native / Alaskan | 2 | 0.4% |
| White / Caucasian | 475 | 96.0% |
| Two or more Races | 13 | 2.6% |
| Some other Race | 0 | 0.0% |
| Total | 495 | 100.0% |
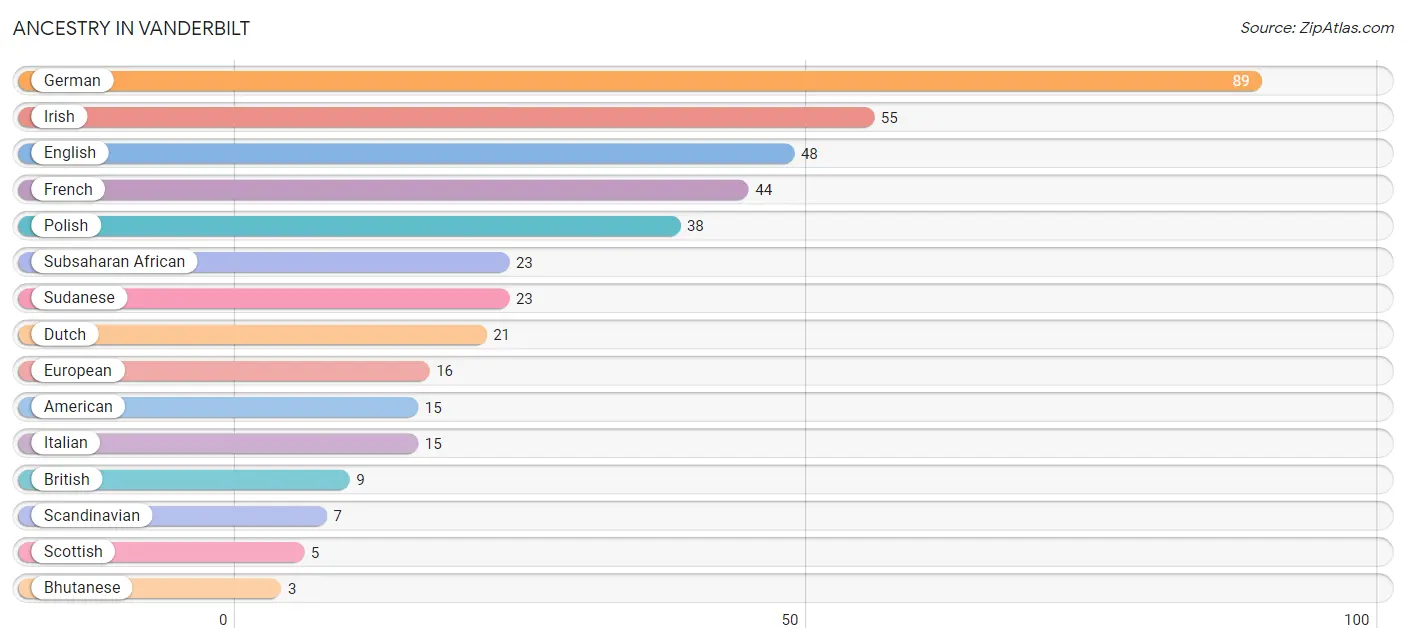
Ancestry in Vanderbilt
The most populous ancestries reported in Vanderbilt are German (89 | 18.0%), Irish (55 | 11.1%), English (48 | 9.7%), French (44 | 8.9%), and Polish (38 | 7.7%), together accounting for 55.4% of all Vanderbilt residents.
| Ancestry | # Population | % Population |
| American | 15 | 3.0% |
| Armenian | 2 | 0.4% |
| Bhutanese | 3 | 0.6% |
| British | 9 | 1.8% |
| Canadian | 2 | 0.4% |
| Cherokee | 3 | 0.6% |
| Chippewa | 1 | 0.2% |
| Danish | 2 | 0.4% |
| Dutch | 21 | 4.2% |
| English | 48 | 9.7% |
| European | 16 | 3.2% |
| French | 44 | 8.9% |
| French Canadian | 1 | 0.2% |
| German | 89 | 18.0% |
| Irish | 55 | 11.1% |
| Italian | 15 | 3.0% |
| Native Hawaiian | 2 | 0.4% |
| Ottawa | 2 | 0.4% |
| Pennsylvania German | 2 | 0.4% |
| Polish | 38 | 7.7% |
| Puerto Rican | 3 | 0.6% |
| Scandinavian | 7 | 1.4% |
| Scottish | 5 | 1.0% |
| Subsaharan African | 23 | 4.6% |
| Sudanese | 23 | 4.6% |
| Welsh | 2 | 0.4% | View All 26 Rows |
Immigrants in Vanderbilt
The most numerous immigrant groups reported in Vanderbilt came from Asia (3 | 0.6%), Eastern Asia (3 | 0.6%), and Korea (3 | 0.6%), together accounting for 1.8% of all Vanderbilt residents.
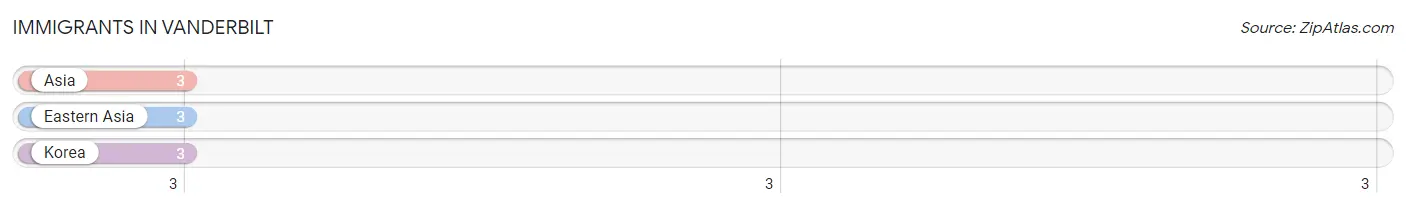
| Immigration Origin | # Population | % Population |
| Asia | 3 | 0.6% |
| Eastern Asia | 3 | 0.6% |
| Korea | 3 | 0.6% | View All 3 Rows |
Sex and Age in Vanderbilt
Sex and Age in Vanderbilt
The most populous age groups in Vanderbilt are 10 to 14 Years (52 | 17.9%) for men and 40 to 44 Years (28 | 13.7%) for women.
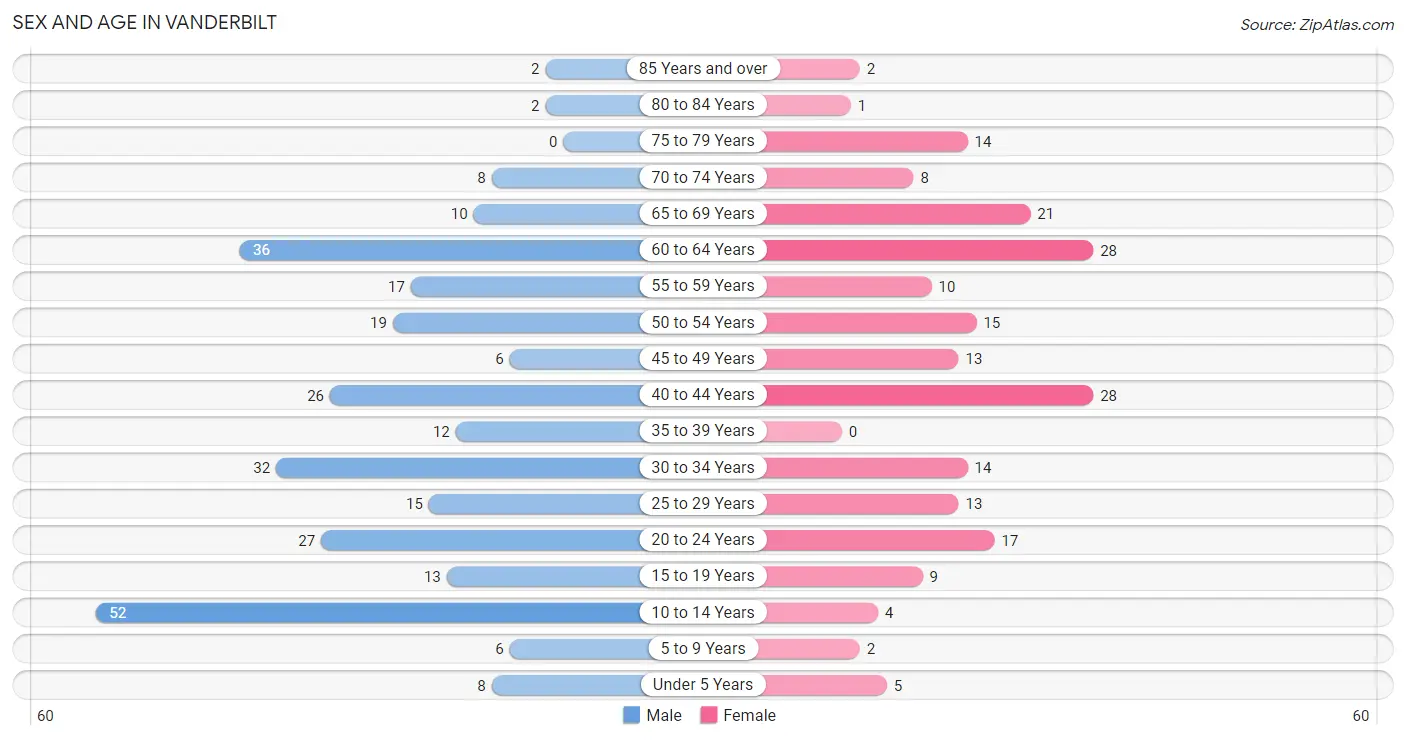
| Age Bracket | Male | Female |
| Under 5 Years | 8 (2.8%) | 5 (2.5%) |
| 5 to 9 Years | 6 (2.1%) | 2 (1.0%) |
| 10 to 14 Years | 52 (17.9%) | 4 (2.0%) |
| 15 to 19 Years | 13 (4.5%) | 9 (4.4%) |
| 20 to 24 Years | 27 (9.3%) | 17 (8.3%) |
| 25 to 29 Years | 15 (5.1%) | 13 (6.4%) |
| 30 to 34 Years | 32 (11.0%) | 14 (6.9%) |
| 35 to 39 Years | 12 (4.1%) | 0 (0.0%) |
| 40 to 44 Years | 26 (8.9%) | 28 (13.7%) |
| 45 to 49 Years | 6 (2.1%) | 13 (6.4%) |
| 50 to 54 Years | 19 (6.5%) | 15 (7.3%) |
| 55 to 59 Years | 17 (5.8%) | 10 (4.9%) |
| 60 to 64 Years | 36 (12.4%) | 28 (13.7%) |
| 65 to 69 Years | 10 (3.4%) | 21 (10.3%) |
| 70 to 74 Years | 8 (2.8%) | 8 (3.9%) |
| 75 to 79 Years | 0 (0.0%) | 14 (6.9%) |
| 80 to 84 Years | 2 (0.7%) | 1 (0.5%) |
| 85 Years and over | 2 (0.7%) | 2 (1.0%) |
| Total | 291 (100.0%) | 204 (100.0%) |
Families and Households in Vanderbilt
Median Family Size in Vanderbilt
The median family size in Vanderbilt is 3.29 persons per family, with single female/mother families (13 | 11.6%) accounting for the largest median family size of 4.54 persons per family. On the other hand, single male/father families (28 | 25.0%) represent the smallest median family size with 2.25 persons per family.
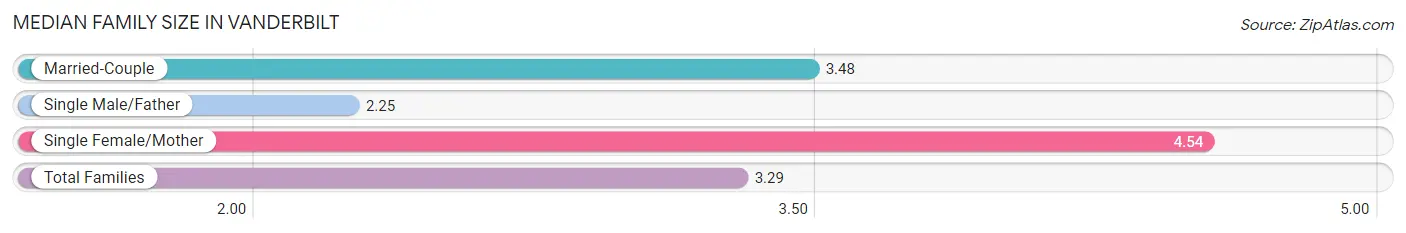
| Family Type | # Families | Family Size |
| Married-Couple | 71 (63.4%) | 3.48 |
| Single Male/Father | 28 (25.0%) | 2.25 |
| Single Female/Mother | 13 (11.6%) | 4.54 |
| Total Families | 112 (100.0%) | 3.29 |
Median Household Size in Vanderbilt
The median household size in Vanderbilt is 2.37 persons per household, with single female/mother households (13 | 6.3%) accounting for the largest median household size of 4.77 persons per household. non-family households (95 | 45.9%) represent the smallest median household size with 1.22 persons per household.
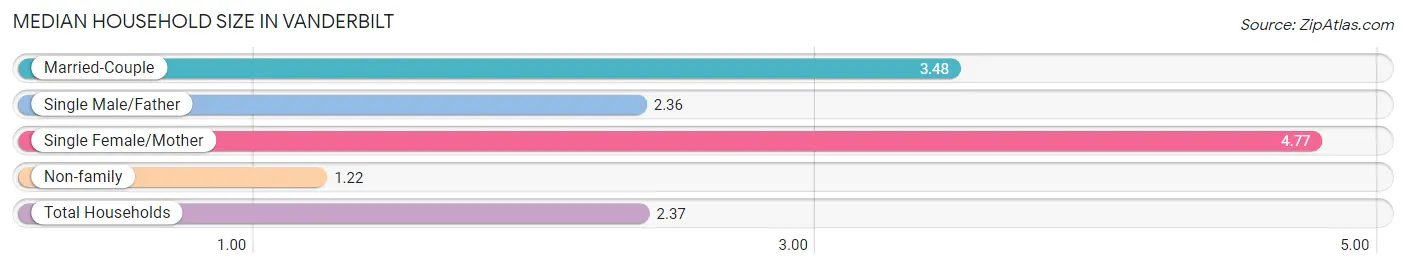
| Household Type | # Households | Household Size |
| Married-Couple | 71 (34.3%) | 3.48 |
| Single Male/Father | 28 (13.5%) | 2.36 |
| Single Female/Mother | 13 (6.3%) | 4.77 |
| Non-family | 95 (45.9%) | 1.22 |
| Total Households | 207 (100.0%) | 2.37 |
Household Size by Marriage Status in Vanderbilt
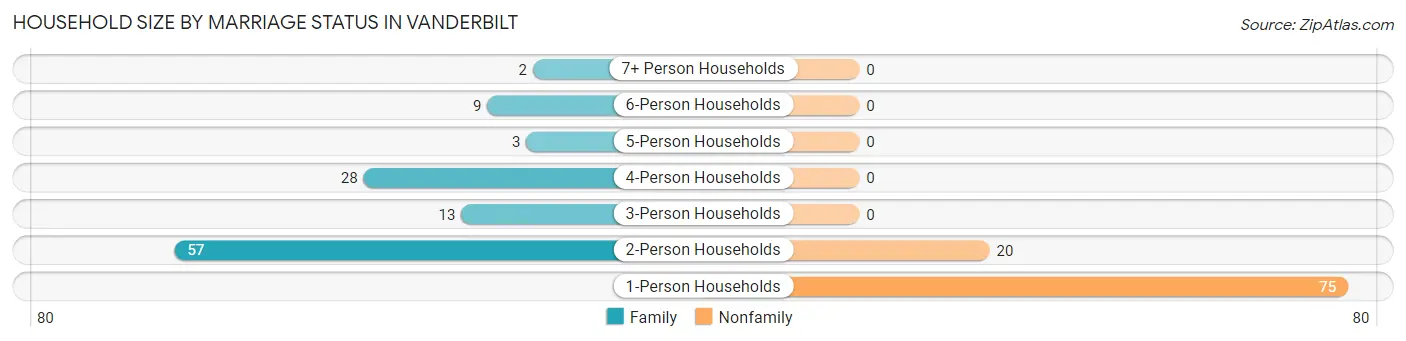
Out of a total of 207 households in Vanderbilt, 112 (54.1%) are family households, while 95 (45.9%) are nonfamily households. The most numerous type of family households are 2-person households, comprising 57, and the most common type of nonfamily households are 1-person households, comprising 75.
| Household Size | Family Households | Nonfamily Households |
| 1-Person Households | - | 75 (36.2%) |
| 2-Person Households | 57 (27.5%) | 20 (9.7%) |
| 3-Person Households | 13 (6.3%) | 0 (0.0%) |
| 4-Person Households | 28 (13.5%) | 0 (0.0%) |
| 5-Person Households | 3 (1.5%) | 0 (0.0%) |
| 6-Person Households | 9 (4.3%) | 0 (0.0%) |
| 7+ Person Households | 2 (1.0%) | 0 (0.0%) |
| Total | 112 (54.1%) | 95 (45.9%) |
Female Fertility in Vanderbilt
Fertility by Age in Vanderbilt
| Age Bracket | Women with Births | Births / 1,000 Women |
| 15 to 19 years | 0 (0.0%) | 0.0 |
| 20 to 34 years | 0 (0.0%) | 0.0 |
| 35 to 50 years | 0 (0.0%) | 0.0 |
| Total | 0 (0.0%) | 0.0 |
Fertility by Age by Marriage Status in Vanderbilt
| Age Bracket | Married | Unmarried |
| 15 to 19 years | 0 (0.0%) | 0 (0.0%) |
| 20 to 34 years | 0 (0.0%) | 0 (0.0%) |
| 35 to 50 years | 0 (0.0%) | 0 (0.0%) |
| Total | 0 (0.0%) | 0 (0.0%) |
Fertility by Education in Vanderbilt
| Educational Attainment | Women with Births | Births / 1,000 Women |
| Less than High School | 0 (0.0%) | 0.0 |
| High School Diploma | 0 (0.0%) | 0.0 |
| College or Associate's Degree | 0 (0.0%) | 0.0 |
| Bachelor's Degree | 0 (0.0%) | 0.0 |
| Graduate Degree | 0 (0.0%) | 0.0 |
| Total | 0 (0.0%) | 0.0 |
Fertility by Education by Marriage Status in Vanderbilt
| Educational Attainment | Married | Unmarried |
| Less than High School | 0 (0.0%) | 0 (0.0%) |
| High School Diploma | 0 (0.0%) | 0 (0.0%) |
| College or Associate's Degree | 0 (0.0%) | 0 (0.0%) |
| Bachelor's Degree | 0 (0.0%) | 0 (0.0%) |
| Graduate Degree | 0 (0.0%) | 0 (0.0%) |
| Total | 0 (0.0%) | 0 (0.0%) |
Employment Characteristics in Vanderbilt
Employment by Class of Employer in Vanderbilt
Among the 239 employed individuals in Vanderbilt, private company employees (177 | 74.1%), state government employees (19 | 8.0%), and self-employed (not incorporated) (16 | 6.7%) make up the most common classes of employment.
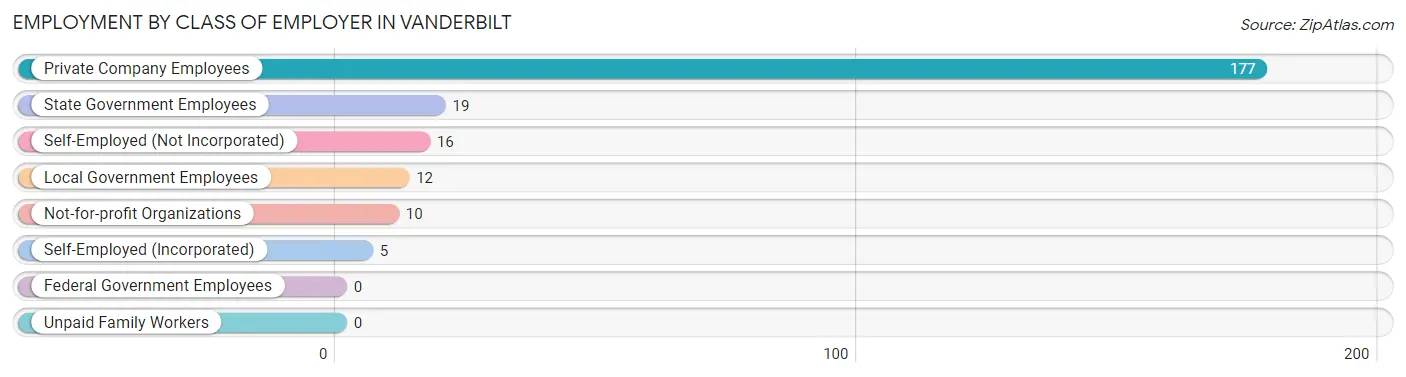
| Employer Class | # Employees | % Employees |
| Private Company Employees | 177 | 74.1% |
| Self-Employed (Incorporated) | 5 | 2.1% |
| Self-Employed (Not Incorporated) | 16 | 6.7% |
| Not-for-profit Organizations | 10 | 4.2% |
| Local Government Employees | 12 | 5.0% |
| State Government Employees | 19 | 8.0% |
| Federal Government Employees | 0 | 0.0% |
| Unpaid Family Workers | 0 | 0.0% |
| Total | 239 | 100.0% |
Employment Status by Age in Vanderbilt
According to the labor force statistics for Vanderbilt, out of the total population over 16 years of age (412), 61.9% or 255 individuals are in the labor force, with 6.3% or 16 of them unemployed. The age group with the highest labor force participation rate is 30 to 34 years, with 100.0% or 46 individuals in the labor force. Within the labor force, the 45 to 54 years age range has the highest percentage of unemployed individuals, with 21.2% or 7 of them being unemployed.
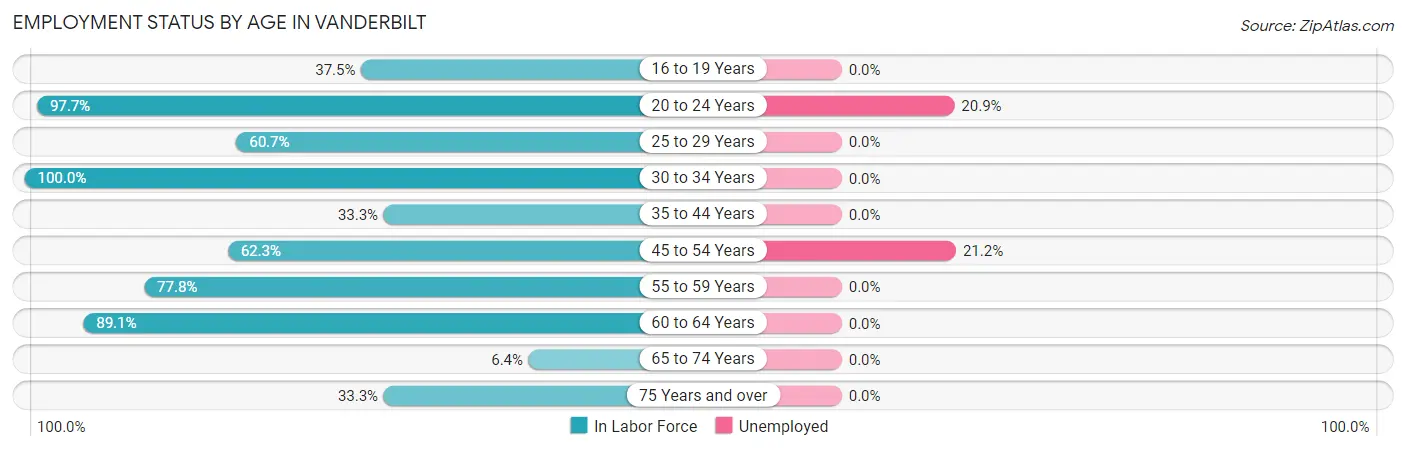
| Age Bracket | In Labor Force | Unemployed |
| 16 to 19 Years | 6 (37.5%) | 0 (0.0%) |
| 20 to 24 Years | 43 (97.7%) | 9 (20.9%) |
| 25 to 29 Years | 17 (60.7%) | 0 (0.0%) |
| 30 to 34 Years | 46 (100.0%) | 0 (0.0%) |
| 35 to 44 Years | 22 (33.3%) | 0 (0.0%) |
| 45 to 54 Years | 33 (62.3%) | 7 (21.2%) |
| 55 to 59 Years | 21 (77.8%) | 0 (0.0%) |
| 60 to 64 Years | 57 (89.1%) | 0 (0.0%) |
| 65 to 74 Years | 3 (6.4%) | 0 (0.0%) |
| 75 Years and over | 7 (33.3%) | 0 (0.0%) |
| Total | 255 (61.9%) | 16 (6.3%) |
Employment Status by Educational Attainment in Vanderbilt
According to labor force statistics for Vanderbilt, 69.0% of individuals (196) out of the total population between 25 and 64 years of age (284) are in the labor force, with 3.6% or 7 of them being unemployed. The group with the highest labor force participation rate are those with the educational attainment of less than high school, with 79.3% or 23 individuals in the labor force. Within the labor force, individuals with high school diploma education have the highest percentage of unemployment, with 6.3% or 7 of them being unemployed.
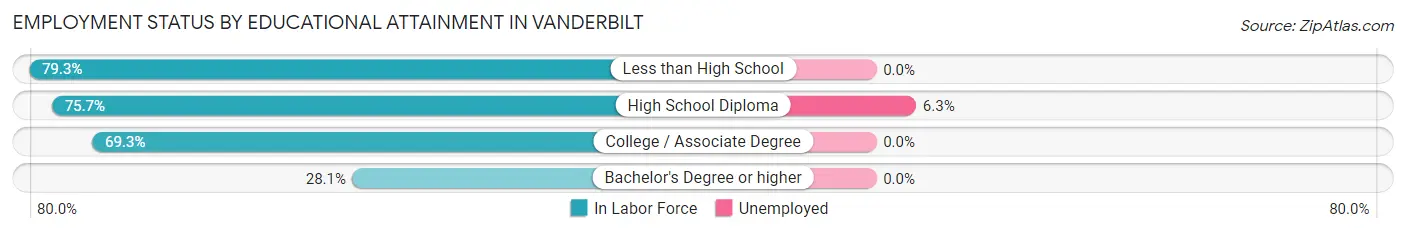
| Educational Attainment | In Labor Force | Unemployed |
| Less than High School | 23 (79.3%) | 0 (0.0%) |
| High School Diploma | 112 (75.7%) | 9 (6.3%) |
| College / Associate Degree | 52 (69.3%) | 0 (0.0%) |
| Bachelor's Degree or higher | 9 (28.1%) | 0 (0.0%) |
| Total | 196 (69.0%) | 10 (3.6%) |
Employment Occupations by Sex in Vanderbilt
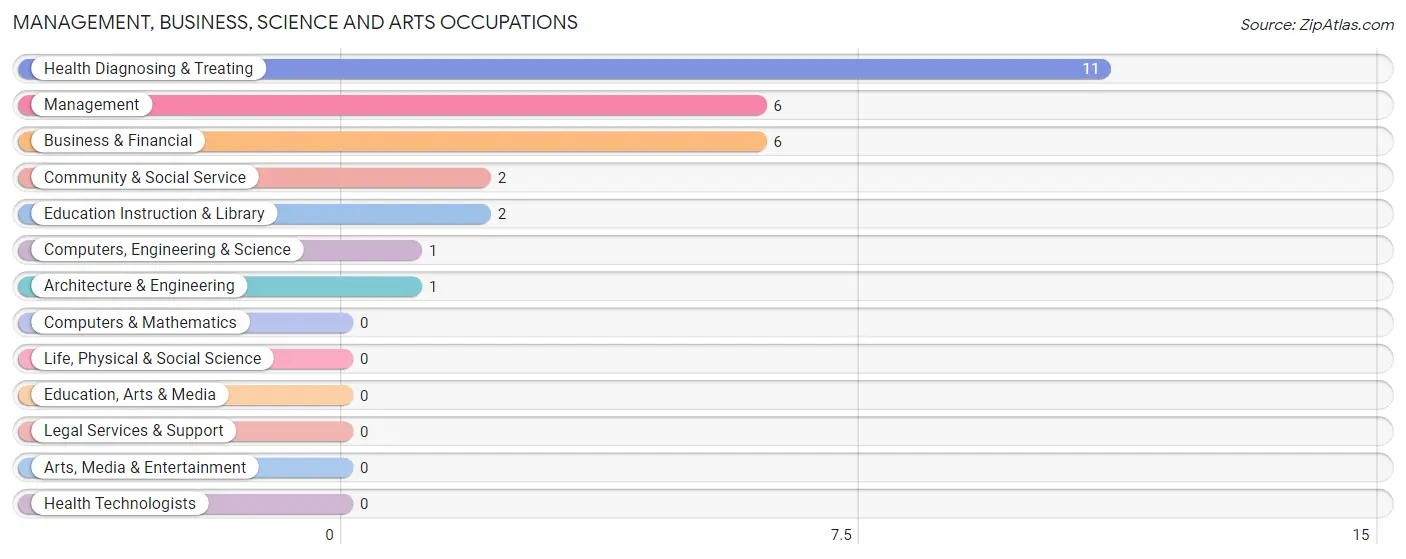
Management, Business, Science and Arts Occupations
The most common Management, Business, Science and Arts occupations in Vanderbilt are Health Diagnosing & Treating (11 | 4.6%), Management (6 | 2.5%), Business & Financial (6 | 2.5%), Community & Social Service (2 | 0.8%), and Education Instruction & Library (2 | 0.8%).
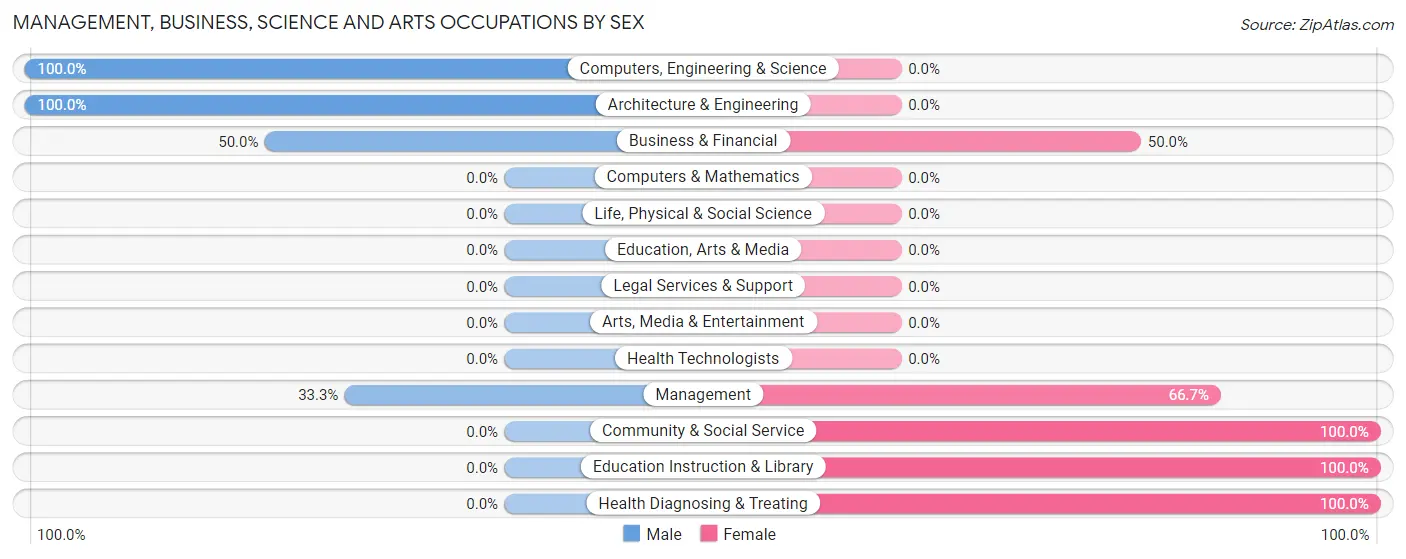
Management, Business, Science and Arts Occupations by Sex
Within the Management, Business, Science and Arts occupations in Vanderbilt, the most male-oriented occupations are Computers, Engineering & Science (100.0%), Architecture & Engineering (100.0%), and Business & Financial (50.0%), while the most female-oriented occupations are Community & Social Service (100.0%), Education Instruction & Library (100.0%), and Health Diagnosing & Treating (100.0%).
| Occupation | Male | Female |
| Management | 2 (33.3%) | 4 (66.7%) |
| Business & Financial | 3 (50.0%) | 3 (50.0%) |
| Computers, Engineering & Science | 1 (100.0%) | 0 (0.0%) |
| Computers & Mathematics | 0 (0.0%) | 0 (0.0%) |
| Architecture & Engineering | 1 (100.0%) | 0 (0.0%) |
| Life, Physical & Social Science | 0 (0.0%) | 0 (0.0%) |
| Community & Social Service | 0 (0.0%) | 2 (100.0%) |
| Education, Arts & Media | 0 (0.0%) | 0 (0.0%) |
| Legal Services & Support | 0 (0.0%) | 0 (0.0%) |
| Education Instruction & Library | 0 (0.0%) | 2 (100.0%) |
| Arts, Media & Entertainment | 0 (0.0%) | 0 (0.0%) |
| Health Diagnosing & Treating | 0 (0.0%) | 11 (100.0%) |
| Health Technologists | 0 (0.0%) | 0 (0.0%) |
| Total (Category) | 6 (23.1%) | 20 (76.9%) |
| Total (Overall) | 149 (62.3%) | 90 (37.7%) |
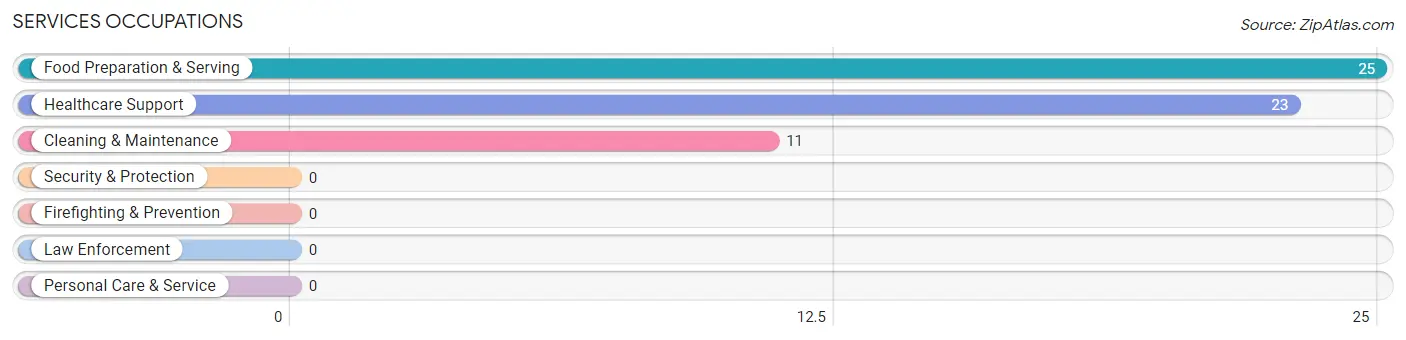
Services Occupations
The most common Services occupations in Vanderbilt are Food Preparation & Serving (25 | 10.5%), Healthcare Support (23 | 9.6%), and Cleaning & Maintenance (11 | 4.6%).
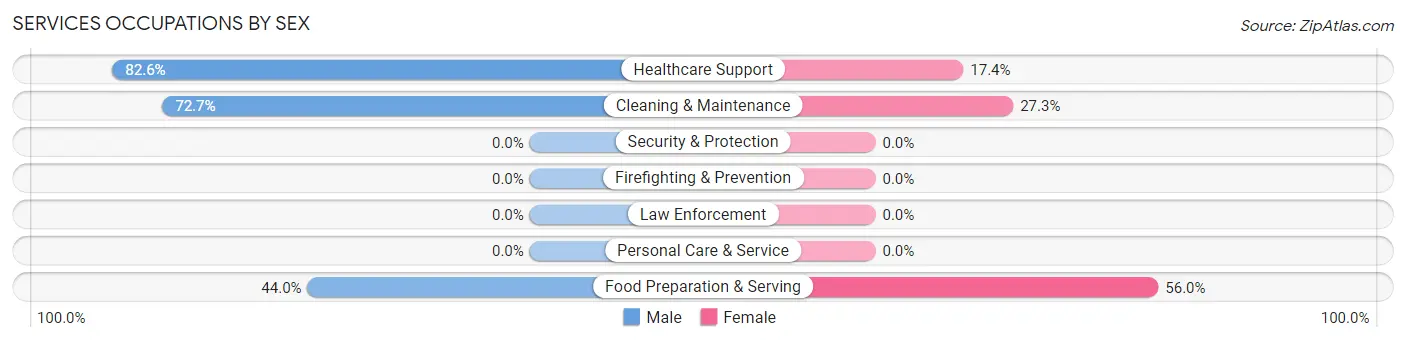
Services Occupations by Sex
Within the Services occupations in Vanderbilt, the most male-oriented occupations are Healthcare Support (82.6%), Cleaning & Maintenance (72.7%), and Food Preparation & Serving (44.0%), while the most female-oriented occupations are Food Preparation & Serving (56.0%), Cleaning & Maintenance (27.3%), and Healthcare Support (17.4%).
| Occupation | Male | Female |
| Healthcare Support | 19 (82.6%) | 4 (17.4%) |
| Security & Protection | 0 (0.0%) | 0 (0.0%) |
| Firefighting & Prevention | 0 (0.0%) | 0 (0.0%) |
| Law Enforcement | 0 (0.0%) | 0 (0.0%) |
| Food Preparation & Serving | 11 (44.0%) | 14 (56.0%) |
| Cleaning & Maintenance | 8 (72.7%) | 3 (27.3%) |
| Personal Care & Service | 0 (0.0%) | 0 (0.0%) |
| Total (Category) | 38 (64.4%) | 21 (35.6%) |
| Total (Overall) | 149 (62.3%) | 90 (37.7%) |
Sales and Office Occupations
The most common Sales and Office occupations in Vanderbilt are Office & Administration (38 | 15.9%), and Sales & Related (18 | 7.5%).
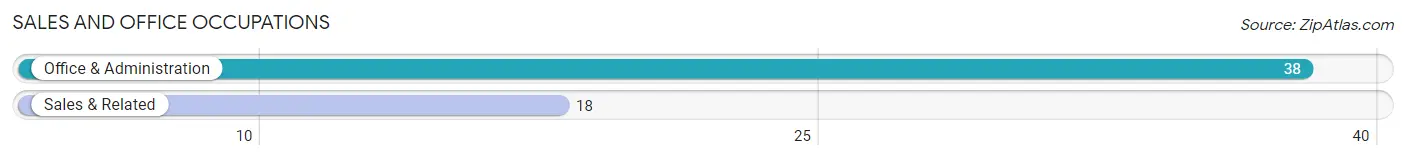
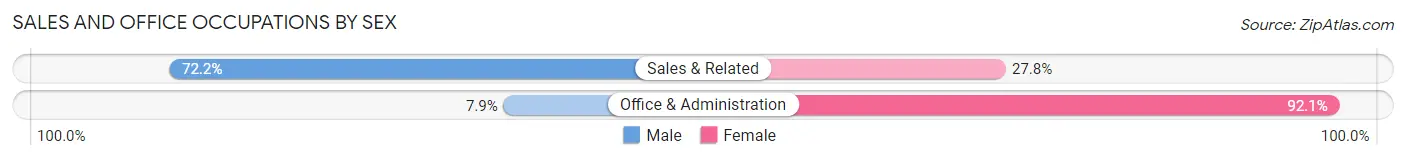
Sales and Office Occupations by Sex
| Occupation | Male | Female |
| Sales & Related | 13 (72.2%) | 5 (27.8%) |
| Office & Administration | 3 (7.9%) | 35 (92.1%) |
| Total (Category) | 16 (28.6%) | 40 (71.4%) |
| Total (Overall) | 149 (62.3%) | 90 (37.7%) |
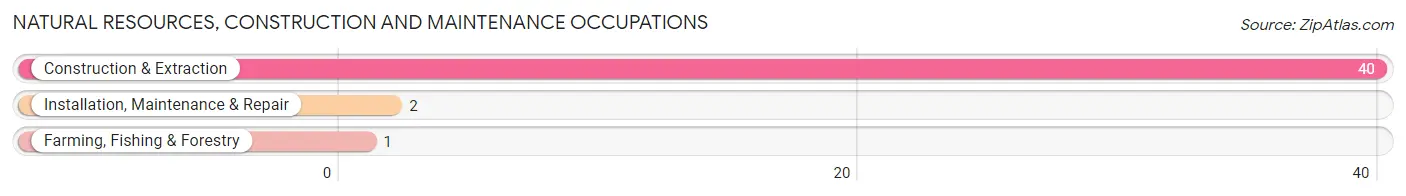
Natural Resources, Construction and Maintenance Occupations
The most common Natural Resources, Construction and Maintenance occupations in Vanderbilt are Construction & Extraction (40 | 16.7%), Installation, Maintenance & Repair (2 | 0.8%), and Farming, Fishing & Forestry (1 | 0.4%).
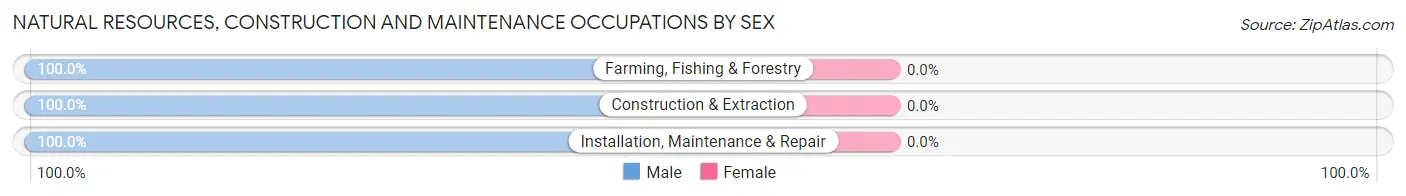
Natural Resources, Construction and Maintenance Occupations by Sex
| Occupation | Male | Female |
| Farming, Fishing & Forestry | 1 (100.0%) | 0 (0.0%) |
| Construction & Extraction | 40 (100.0%) | 0 (0.0%) |
| Installation, Maintenance & Repair | 2 (100.0%) | 0 (0.0%) |
| Total (Category) | 43 (100.0%) | 0 (0.0%) |
| Total (Overall) | 149 (62.3%) | 90 (37.7%) |
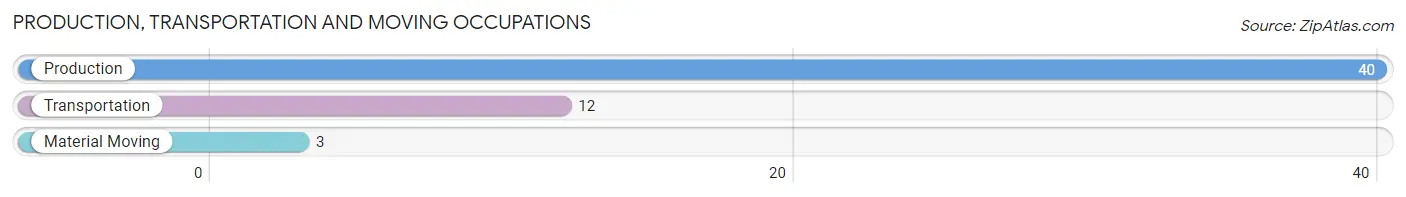
Production, Transportation and Moving Occupations
The most common Production, Transportation and Moving occupations in Vanderbilt are Production (40 | 16.7%), Transportation (12 | 5.0%), and Material Moving (3 | 1.3%).
Production, Transportation and Moving Occupations by Sex
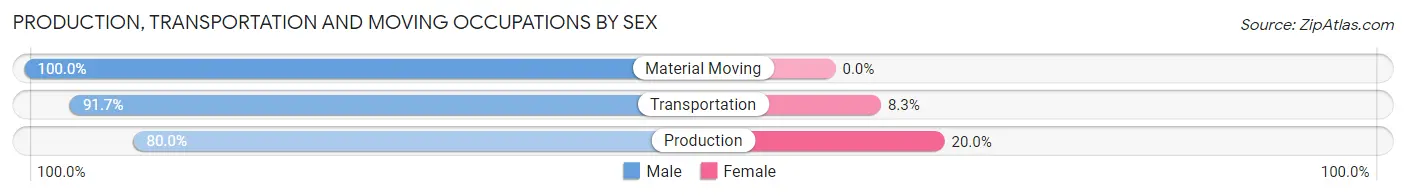
| Occupation | Male | Female |
| Production | 32 (80.0%) | 8 (20.0%) |
| Transportation | 11 (91.7%) | 1 (8.3%) |
| Material Moving | 3 (100.0%) | 0 (0.0%) |
| Total (Category) | 46 (83.6%) | 9 (16.4%) |
| Total (Overall) | 149 (62.3%) | 90 (37.7%) |
Employment Industries by Sex in Vanderbilt
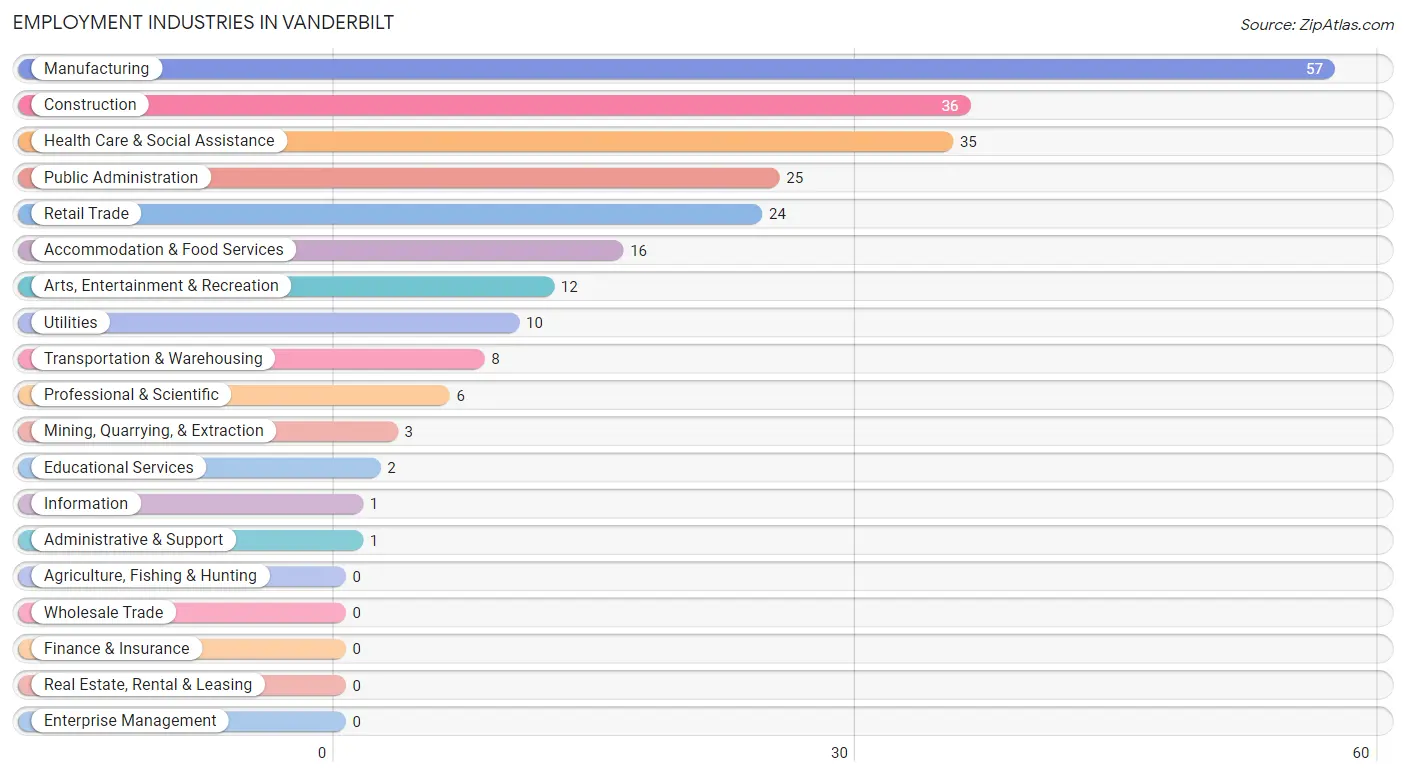
Employment Industries in Vanderbilt
The major employment industries in Vanderbilt include Manufacturing (57 | 23.8%), Construction (36 | 15.1%), Health Care & Social Assistance (35 | 14.6%), Public Administration (25 | 10.5%), and Retail Trade (24 | 10.0%).
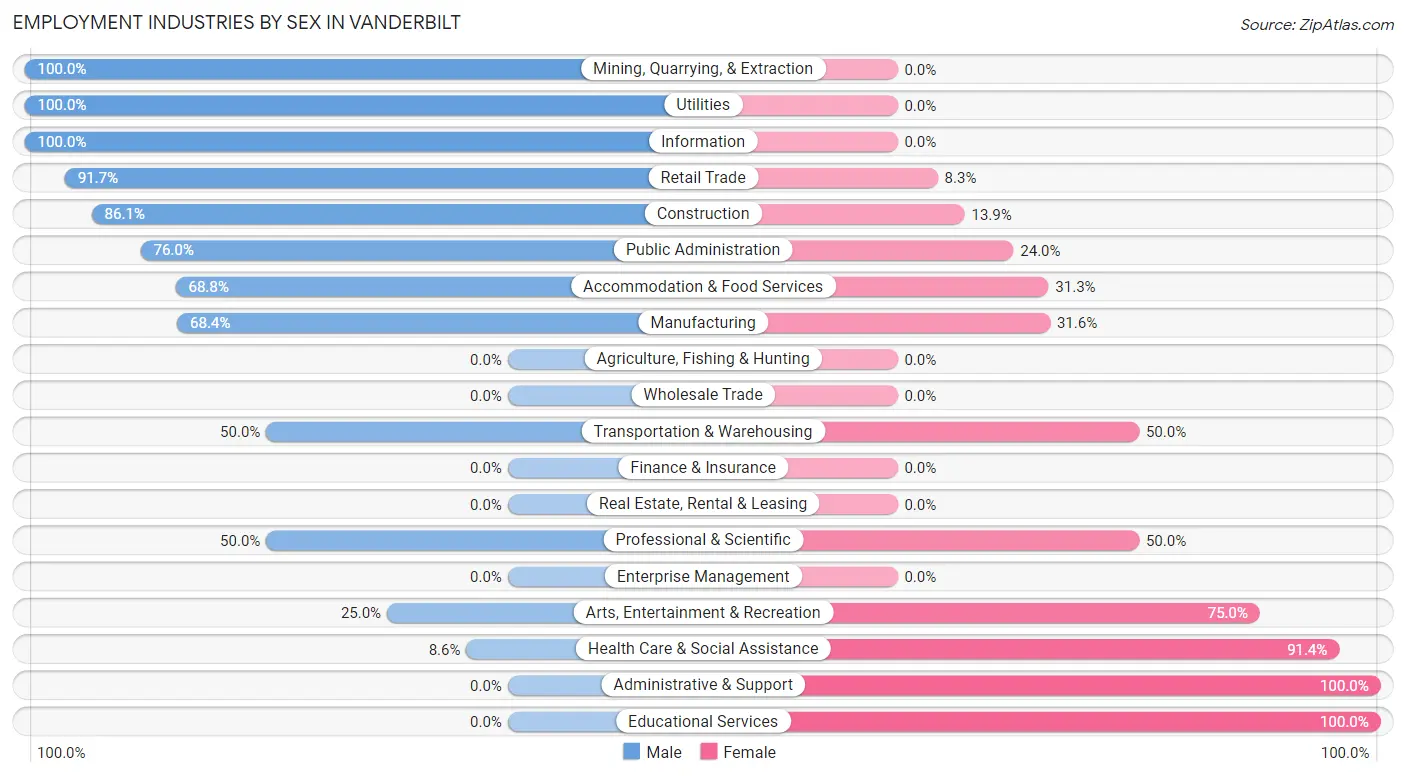
Employment Industries by Sex in Vanderbilt
The Vanderbilt industries that see more men than women are Mining, Quarrying, & Extraction (100.0%), Utilities (100.0%), and Information (100.0%), whereas the industries that tend to have a higher number of women are Administrative & Support (100.0%), Educational Services (100.0%), and Health Care & Social Assistance (91.4%).
| Industry | Male | Female |
| Agriculture, Fishing & Hunting | 0 (0.0%) | 0 (0.0%) |
| Mining, Quarrying, & Extraction | 3 (100.0%) | 0 (0.0%) |
| Construction | 31 (86.1%) | 5 (13.9%) |
| Manufacturing | 39 (68.4%) | 18 (31.6%) |
| Wholesale Trade | 0 (0.0%) | 0 (0.0%) |
| Retail Trade | 22 (91.7%) | 2 (8.3%) |
| Transportation & Warehousing | 4 (50.0%) | 4 (50.0%) |
| Utilities | 10 (100.0%) | 0 (0.0%) |
| Information | 1 (100.0%) | 0 (0.0%) |
| Finance & Insurance | 0 (0.0%) | 0 (0.0%) |
| Real Estate, Rental & Leasing | 0 (0.0%) | 0 (0.0%) |
| Professional & Scientific | 3 (50.0%) | 3 (50.0%) |
| Enterprise Management | 0 (0.0%) | 0 (0.0%) |
| Administrative & Support | 0 (0.0%) | 1 (100.0%) |
| Educational Services | 0 (0.0%) | 2 (100.0%) |
| Health Care & Social Assistance | 3 (8.6%) | 32 (91.4%) |
| Arts, Entertainment & Recreation | 3 (25.0%) | 9 (75.0%) |
| Accommodation & Food Services | 11 (68.8%) | 5 (31.2%) |
| Public Administration | 19 (76.0%) | 6 (24.0%) |
| Total | 149 (62.3%) | 90 (37.7%) |
Education in Vanderbilt
School Enrollment in Vanderbilt
The most common levels of schooling among the 97 students in Vanderbilt are middle school (56 | 57.7%), college / undergraduate (19 | 19.6%), and high school (14 | 14.4%).
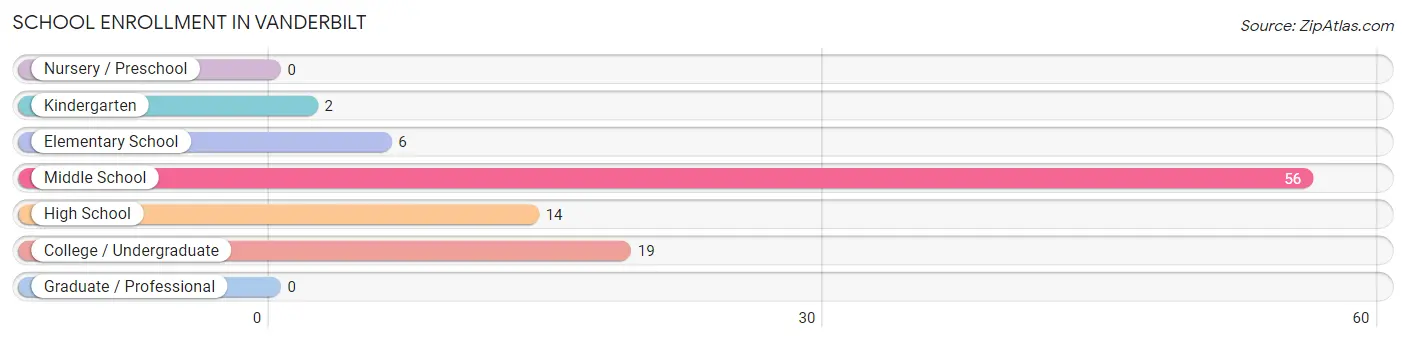
| School Level | # Students | % Students |
| Nursery / Preschool | 0 | 0.0% |
| Kindergarten | 2 | 2.1% |
| Elementary School | 6 | 6.2% |
| Middle School | 56 | 57.7% |
| High School | 14 | 14.4% |
| College / Undergraduate | 19 | 19.6% |
| Graduate / Professional | 0 | 0.0% |
| Total | 97 | 100.0% |
School Enrollment by Age by Funding Source in Vanderbilt
Out of a total of 97 students who are enrolled in schools in Vanderbilt, 5 (5.2%) attend a private institution, while the remaining 92 (94.8%) are enrolled in public schools. The age group of 15 to 17 year olds has the highest likelihood of being enrolled in private schools, with 2 (15.4% in the age bracket) enrolled. Conversely, the age group of 5 to 9 year old has the lowest likelihood of being enrolled in a private school, with 8 (100.0% in the age bracket) attending a public institution.
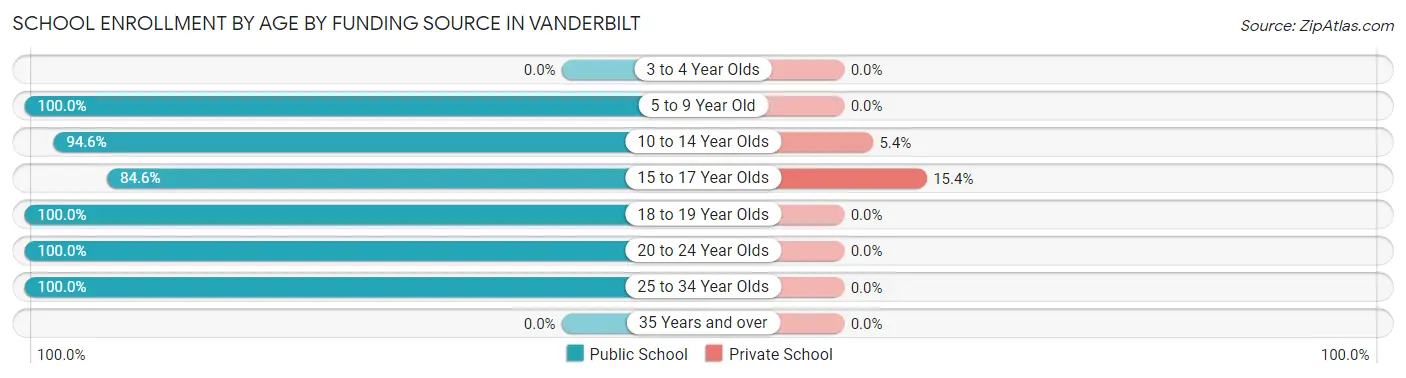
| Age Bracket | Public School | Private School |
| 3 to 4 Year Olds | 0 (0.0%) | 0 (0.0%) |
| 5 to 9 Year Old | 8 (100.0%) | 0 (0.0%) |
| 10 to 14 Year Olds | 53 (94.6%) | 3 (5.4%) |
| 15 to 17 Year Olds | 11 (84.6%) | 2 (15.4%) |
| 18 to 19 Year Olds | 6 (100.0%) | 0 (0.0%) |
| 20 to 24 Year Olds | 13 (100.0%) | 0 (0.0%) |
| 25 to 34 Year Olds | 1 (100.0%) | 0 (0.0%) |
| 35 Years and over | 0 (0.0%) | 0 (0.0%) |
| Total | 92 (94.8%) | 5 (5.2%) |
Educational Attainment by Field of Study in Vanderbilt
Bio, nature & agricultural (23 | 65.7%), business (4 | 11.4%), social sciences (3 | 8.6%), liberal arts & history (3 | 8.6%), and arts & humanities (2 | 5.7%) are the most common fields of study among 35 individuals in Vanderbilt who have obtained a bachelor's degree or higher.
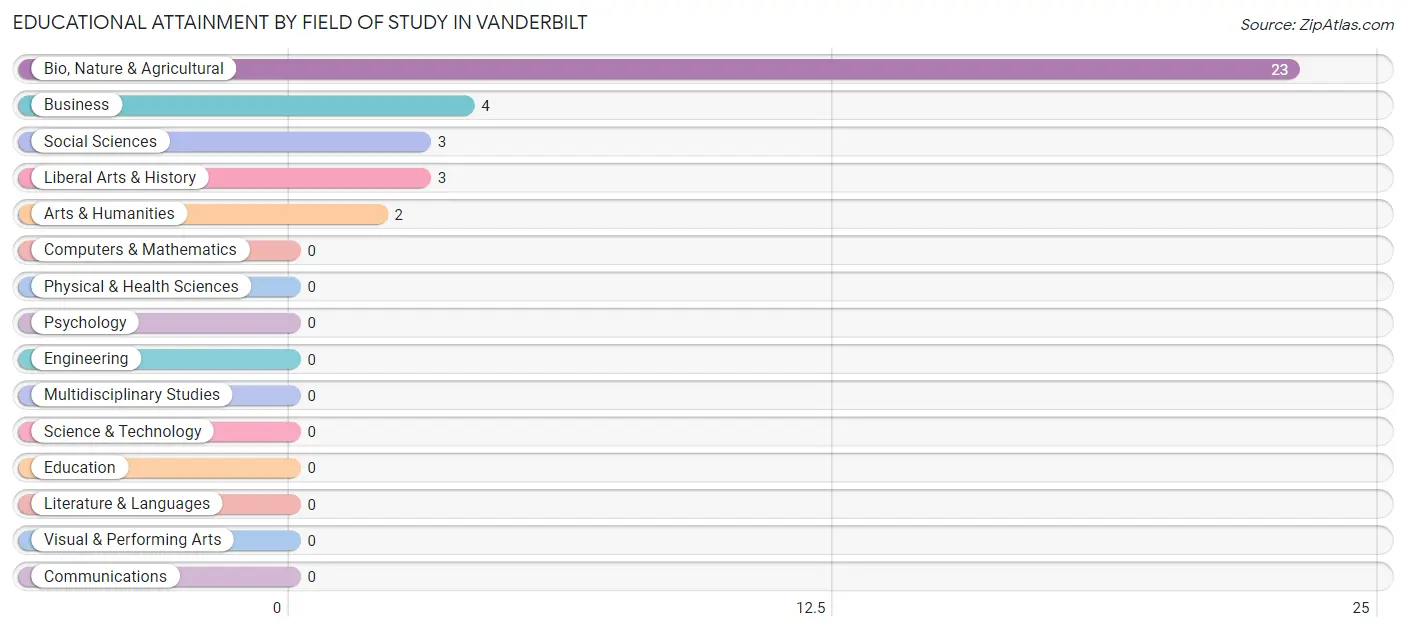
| Field of Study | # Graduates | % Graduates |
| Computers & Mathematics | 0 | 0.0% |
| Bio, Nature & Agricultural | 23 | 65.7% |
| Physical & Health Sciences | 0 | 0.0% |
| Psychology | 0 | 0.0% |
| Social Sciences | 3 | 8.6% |
| Engineering | 0 | 0.0% |
| Multidisciplinary Studies | 0 | 0.0% |
| Science & Technology | 0 | 0.0% |
| Business | 4 | 11.4% |
| Education | 0 | 0.0% |
| Literature & Languages | 0 | 0.0% |
| Liberal Arts & History | 3 | 8.6% |
| Visual & Performing Arts | 0 | 0.0% |
| Communications | 0 | 0.0% |
| Arts & Humanities | 2 | 5.7% |
| Total | 35 | 100.0% |
Transportation & Commute in Vanderbilt
Vehicle Availability by Sex in Vanderbilt
The most prevalent vehicle ownership categories in Vanderbilt are males with 2 vehicles (50, accounting for 33.6%) and females with 2 vehicles (27, making up 55.6%).
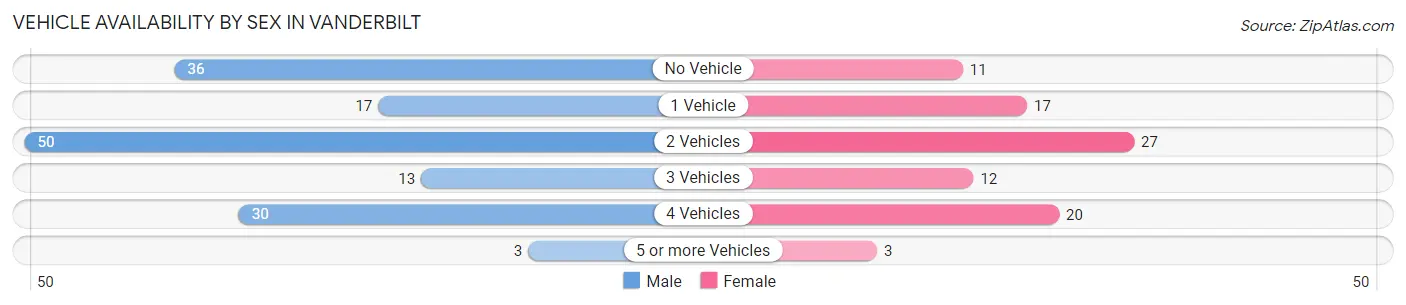
| Vehicles Available | Male | Female |
| No Vehicle | 36 (24.2%) | 11 (12.2%) |
| 1 Vehicle | 17 (11.4%) | 17 (18.9%) |
| 2 Vehicles | 50 (33.6%) | 27 (30.0%) |
| 3 Vehicles | 13 (8.7%) | 12 (13.3%) |
| 4 Vehicles | 30 (20.1%) | 20 (22.2%) |
| 5 or more Vehicles | 3 (2.0%) | 3 (3.3%) |
| Total | 149 (100.0%) | 90 (100.0%) |
Commute Time in Vanderbilt
The most frequently occuring commute durations in Vanderbilt are 10 to 14 minutes (57 commuters, 29.2%), 15 to 19 minutes (55 commuters, 28.2%), and 20 to 24 minutes (43 commuters, 22.1%).
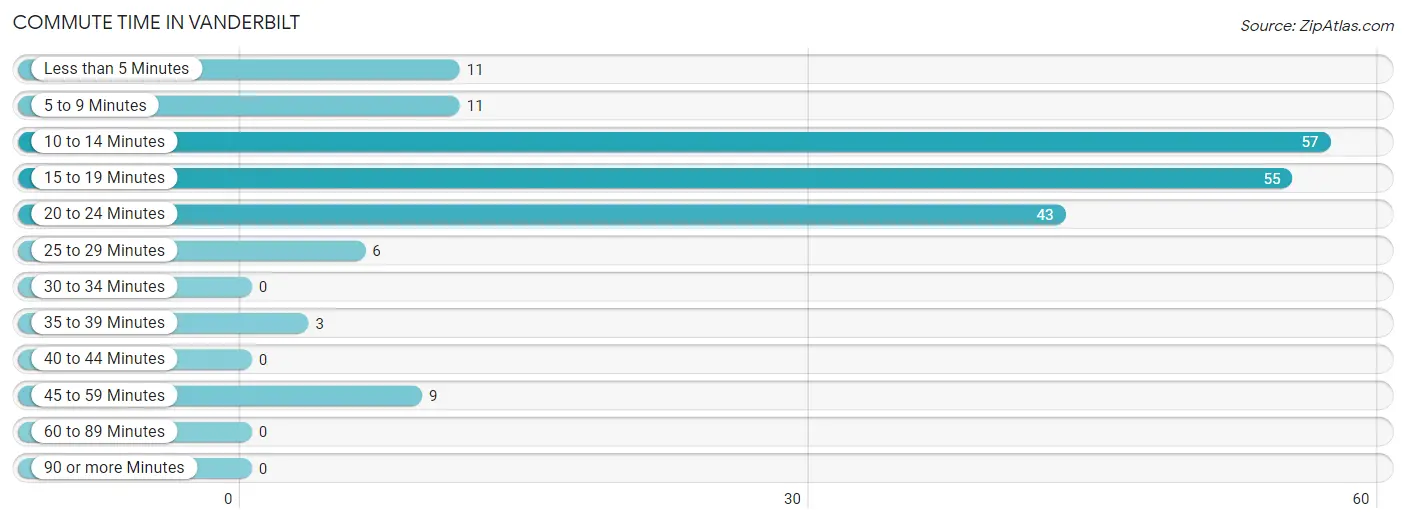
| Commute Time | # Commuters | % Commuters |
| Less than 5 Minutes | 11 | 5.6% |
| 5 to 9 Minutes | 11 | 5.6% |
| 10 to 14 Minutes | 57 | 29.2% |
| 15 to 19 Minutes | 55 | 28.2% |
| 20 to 24 Minutes | 43 | 22.1% |
| 25 to 29 Minutes | 6 | 3.1% |
| 30 to 34 Minutes | 0 | 0.0% |
| 35 to 39 Minutes | 3 | 1.5% |
| 40 to 44 Minutes | 0 | 0.0% |
| 45 to 59 Minutes | 9 | 4.6% |
| 60 to 89 Minutes | 0 | 0.0% |
| 90 or more Minutes | 0 | 0.0% |
Commute Time by Sex in Vanderbilt
The most common commute times in Vanderbilt are 15 to 19 minutes (42 commuters, 33.1%) for males and 10 to 14 minutes (31 commuters, 45.6%) for females.
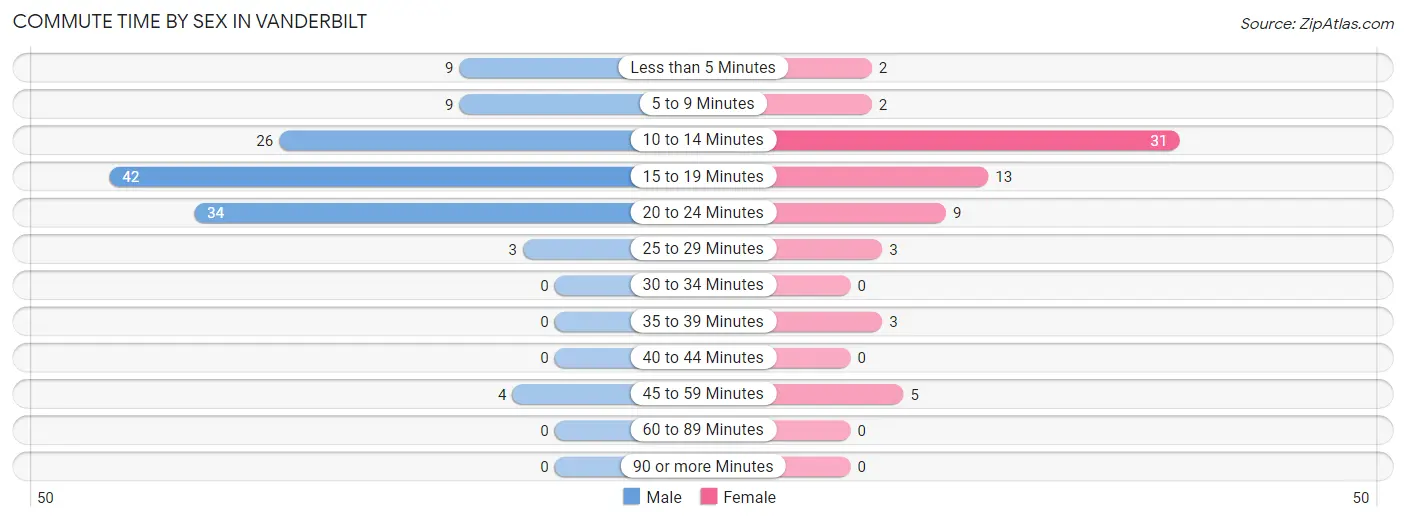
| Commute Time | Male | Female |
| Less than 5 Minutes | 9 (7.1%) | 2 (2.9%) |
| 5 to 9 Minutes | 9 (7.1%) | 2 (2.9%) |
| 10 to 14 Minutes | 26 (20.5%) | 31 (45.6%) |
| 15 to 19 Minutes | 42 (33.1%) | 13 (19.1%) |
| 20 to 24 Minutes | 34 (26.8%) | 9 (13.2%) |
| 25 to 29 Minutes | 3 (2.4%) | 3 (4.4%) |
| 30 to 34 Minutes | 0 (0.0%) | 0 (0.0%) |
| 35 to 39 Minutes | 0 (0.0%) | 3 (4.4%) |
| 40 to 44 Minutes | 0 (0.0%) | 0 (0.0%) |
| 45 to 59 Minutes | 4 (3.2%) | 5 (7.3%) |
| 60 to 89 Minutes | 0 (0.0%) | 0 (0.0%) |
| 90 or more Minutes | 0 (0.0%) | 0 (0.0%) |
Time of Departure to Work by Sex in Vanderbilt
The most frequent times of departure to work in Vanderbilt are 12:00 AM to 4:59 AM (27, 21.3%) for males and 7:30 AM to 7:59 AM (12, 17.6%) for females.
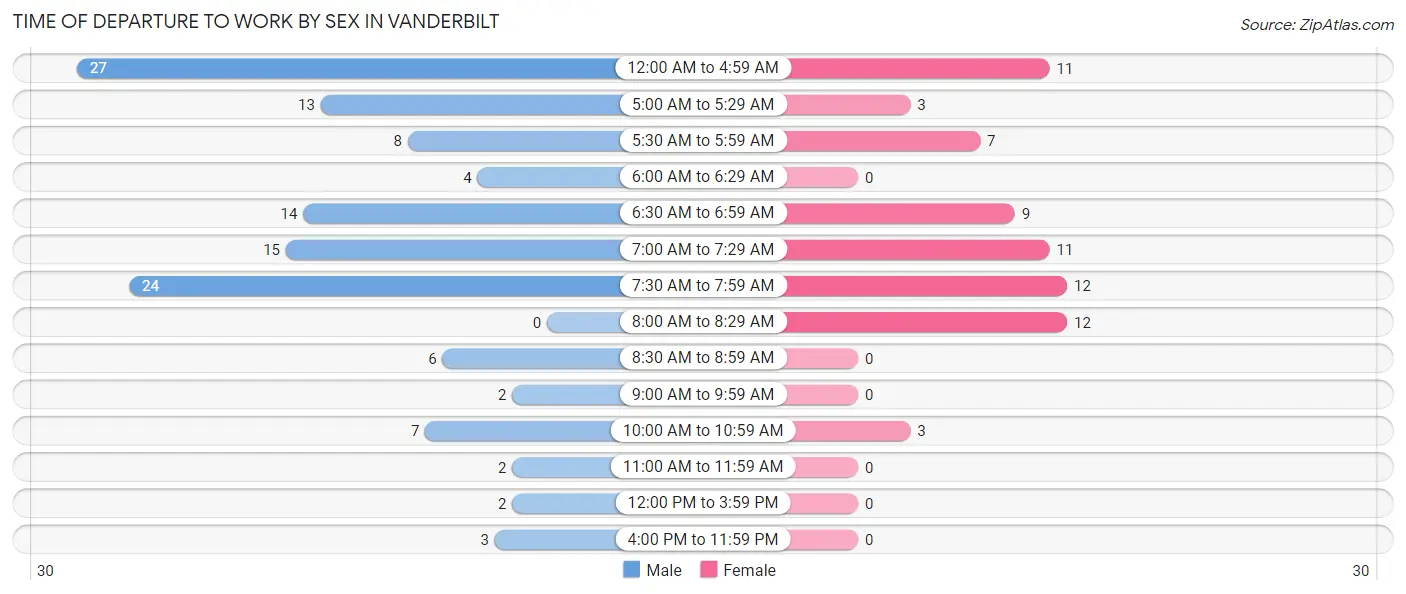
| Time of Departure | Male | Female |
| 12:00 AM to 4:59 AM | 27 (21.3%) | 11 (16.2%) |
| 5:00 AM to 5:29 AM | 13 (10.2%) | 3 (4.4%) |
| 5:30 AM to 5:59 AM | 8 (6.3%) | 7 (10.3%) |
| 6:00 AM to 6:29 AM | 4 (3.2%) | 0 (0.0%) |
| 6:30 AM to 6:59 AM | 14 (11.0%) | 9 (13.2%) |
| 7:00 AM to 7:29 AM | 15 (11.8%) | 11 (16.2%) |
| 7:30 AM to 7:59 AM | 24 (18.9%) | 12 (17.6%) |
| 8:00 AM to 8:29 AM | 0 (0.0%) | 12 (17.6%) |
| 8:30 AM to 8:59 AM | 6 (4.7%) | 0 (0.0%) |
| 9:00 AM to 9:59 AM | 2 (1.6%) | 0 (0.0%) |
| 10:00 AM to 10:59 AM | 7 (5.5%) | 3 (4.4%) |
| 11:00 AM to 11:59 AM | 2 (1.6%) | 0 (0.0%) |
| 12:00 PM to 3:59 PM | 2 (1.6%) | 0 (0.0%) |
| 4:00 PM to 11:59 PM | 3 (2.4%) | 0 (0.0%) |
| Total | 127 (100.0%) | 68 (100.0%) |
Housing Occupancy in Vanderbilt
Occupancy by Ownership in Vanderbilt
Of the total 207 dwellings in Vanderbilt, owner-occupied units account for 149 (72.0%), while renter-occupied units make up 58 (28.0%).
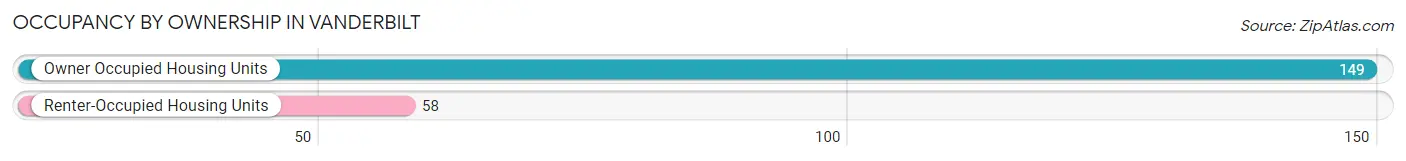
| Occupancy | # Housing Units | % Housing Units |
| Owner Occupied Housing Units | 149 | 72.0% |
| Renter-Occupied Housing Units | 58 | 28.0% |
| Total Occupied Housing Units | 207 | 100.0% |
Occupancy by Household Size in Vanderbilt
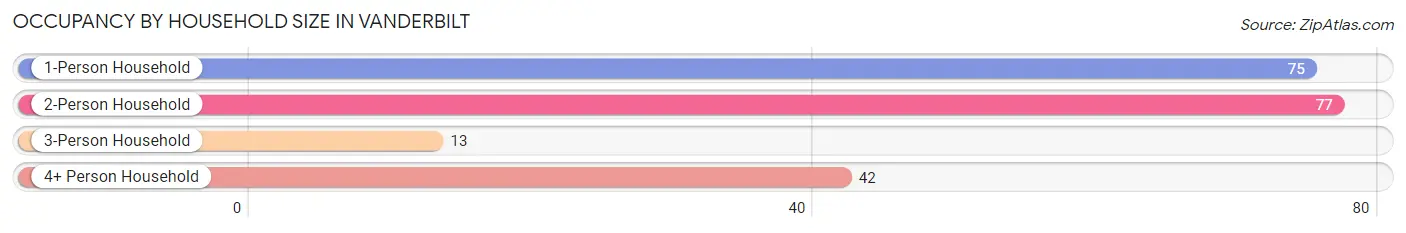
| Household Size | # Housing Units | % Housing Units |
| 1-Person Household | 75 | 36.2% |
| 2-Person Household | 77 | 37.2% |
| 3-Person Household | 13 | 6.3% |
| 4+ Person Household | 42 | 20.3% |
| Total Housing Units | 207 | 100.0% |
Occupancy by Ownership by Household Size in Vanderbilt
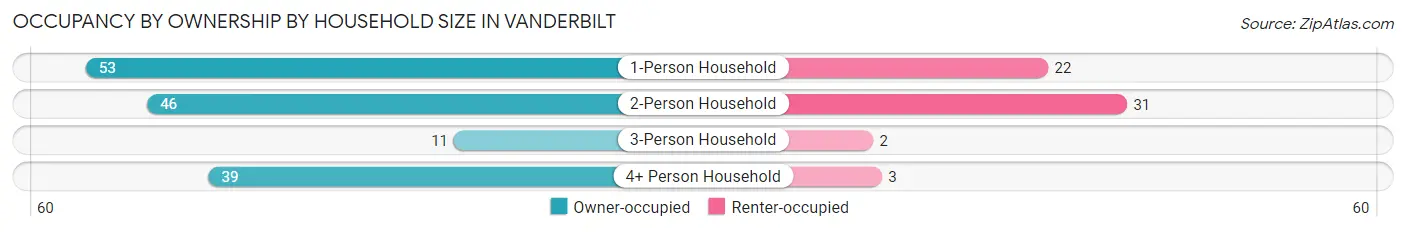
| Household Size | Owner-occupied | Renter-occupied |
| 1-Person Household | 53 (70.7%) | 22 (29.3%) |
| 2-Person Household | 46 (59.7%) | 31 (40.3%) |
| 3-Person Household | 11 (84.6%) | 2 (15.4%) |
| 4+ Person Household | 39 (92.9%) | 3 (7.1%) |
| Total Housing Units | 149 (72.0%) | 58 (28.0%) |
Occupancy by Educational Attainment in Vanderbilt
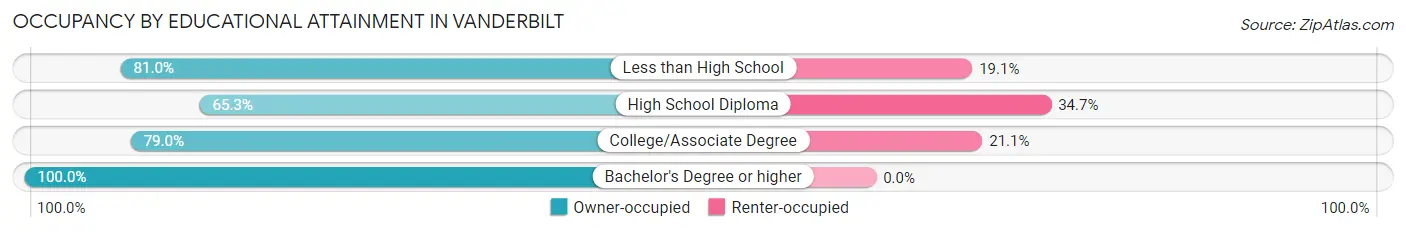
| Household Size | Owner-occupied | Renter-occupied |
| Less than High School | 17 (80.9%) | 4 (19.1%) |
| High School Diploma | 79 (65.3%) | 42 (34.7%) |
| College/Associate Degree | 45 (78.9%) | 12 (21.0%) |
| Bachelor's Degree or higher | 8 (100.0%) | 0 (0.0%) |
Occupancy by Age of Householder in Vanderbilt
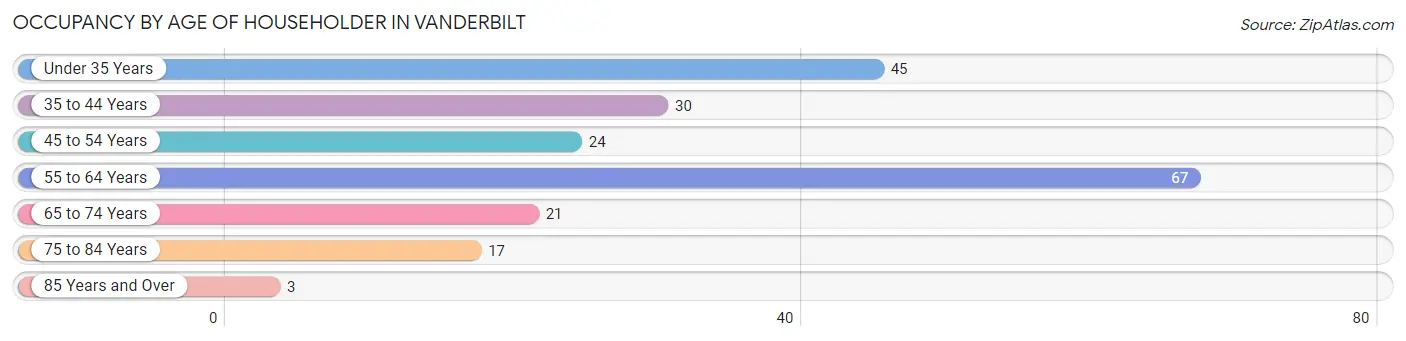
| Age Bracket | # Households | % Households |
| Under 35 Years | 45 | 21.7% |
| 35 to 44 Years | 30 | 14.5% |
| 45 to 54 Years | 24 | 11.6% |
| 55 to 64 Years | 67 | 32.4% |
| 65 to 74 Years | 21 | 10.1% |
| 75 to 84 Years | 17 | 8.2% |
| 85 Years and Over | 3 | 1.5% |
| Total | 207 | 100.0% |
Housing Finances in Vanderbilt
Median Income by Occupancy in Vanderbilt
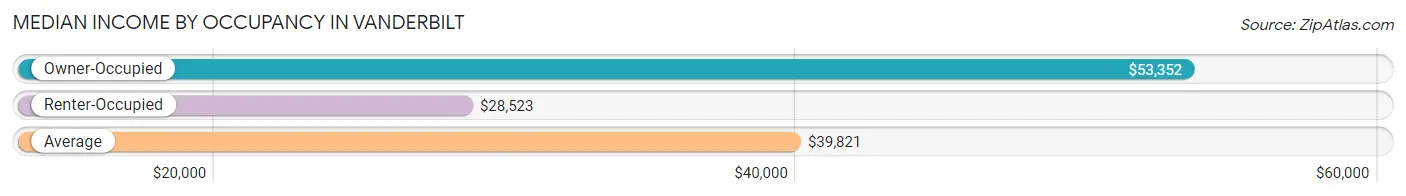
| Occupancy Type | # Households | Median Income |
| Owner-Occupied | 149 (72.0%) | $53,352 |
| Renter-Occupied | 58 (28.0%) | $28,523 |
| Average | 207 (100.0%) | $39,821 |
Occupancy by Householder Income Bracket in Vanderbilt
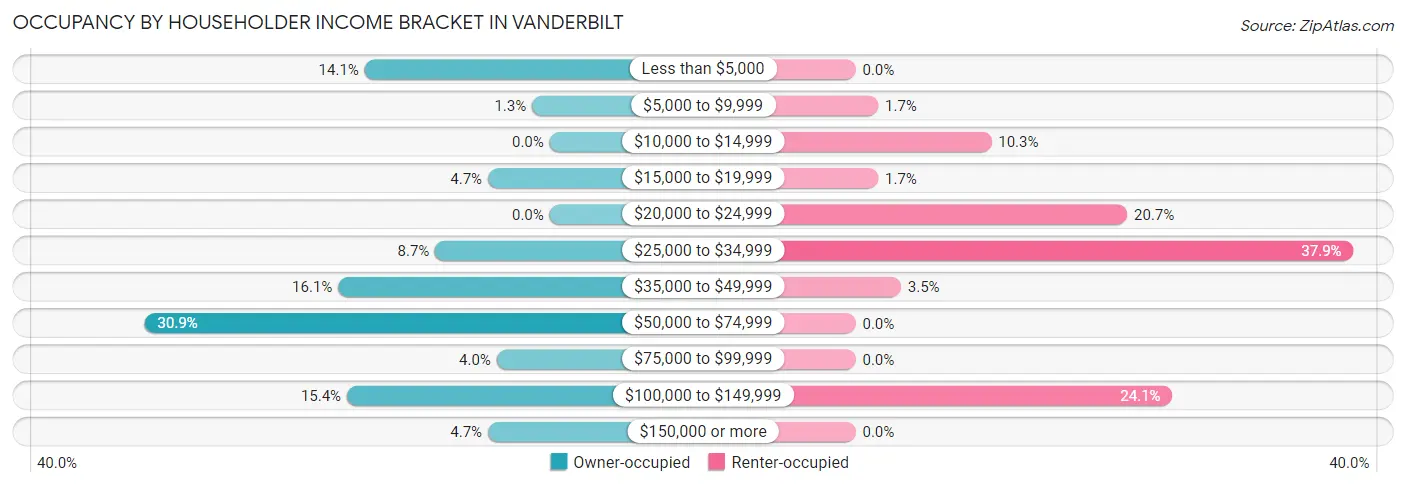
| Income Bracket | Owner-occupied | Renter-occupied |
| Less than $5,000 | 21 (14.1%) | 0 (0.0%) |
| $5,000 to $9,999 | 2 (1.3%) | 1 (1.7%) |
| $10,000 to $14,999 | 0 (0.0%) | 6 (10.3%) |
| $15,000 to $19,999 | 7 (4.7%) | 1 (1.7%) |
| $20,000 to $24,999 | 0 (0.0%) | 12 (20.7%) |
| $25,000 to $34,999 | 13 (8.7%) | 22 (37.9%) |
| $35,000 to $49,999 | 24 (16.1%) | 2 (3.5%) |
| $50,000 to $74,999 | 46 (30.9%) | 0 (0.0%) |
| $75,000 to $99,999 | 6 (4.0%) | 0 (0.0%) |
| $100,000 to $149,999 | 23 (15.4%) | 14 (24.1%) |
| $150,000 or more | 7 (4.7%) | 0 (0.0%) |
| Total | 149 (100.0%) | 58 (100.0%) |
Monthly Housing Cost Tiers in Vanderbilt
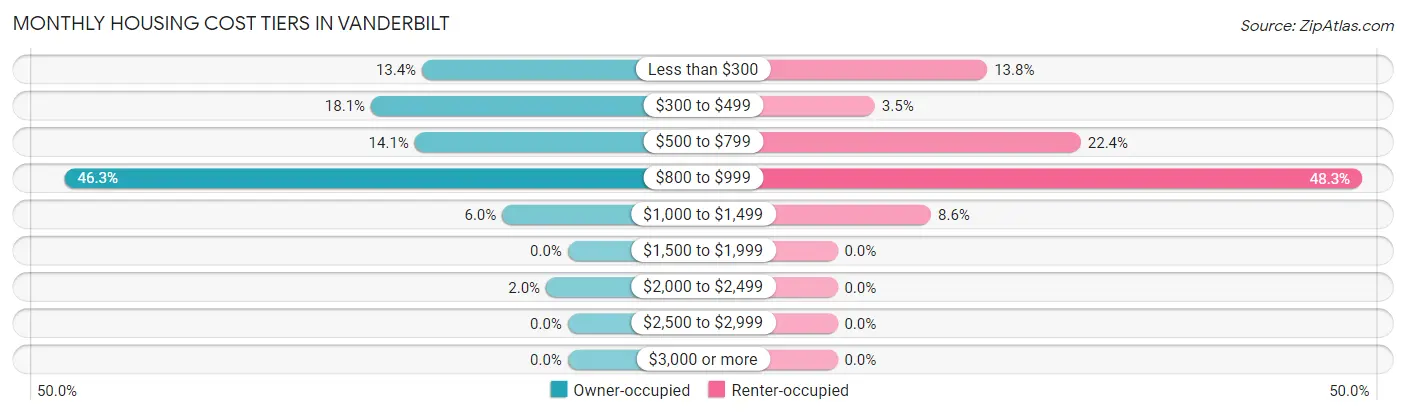
| Monthly Cost | Owner-occupied | Renter-occupied |
| Less than $300 | 20 (13.4%) | 8 (13.8%) |
| $300 to $499 | 27 (18.1%) | 2 (3.5%) |
| $500 to $799 | 21 (14.1%) | 13 (22.4%) |
| $800 to $999 | 69 (46.3%) | 28 (48.3%) |
| $1,000 to $1,499 | 9 (6.0%) | 5 (8.6%) |
| $1,500 to $1,999 | 0 (0.0%) | 0 (0.0%) |
| $2,000 to $2,499 | 3 (2.0%) | 0 (0.0%) |
| $2,500 to $2,999 | 0 (0.0%) | 0 (0.0%) |
| $3,000 or more | 0 (0.0%) | 0 (0.0%) |
| Total | 149 (100.0%) | 58 (100.0%) |
Physical Housing Characteristics in Vanderbilt
Housing Structures in Vanderbilt
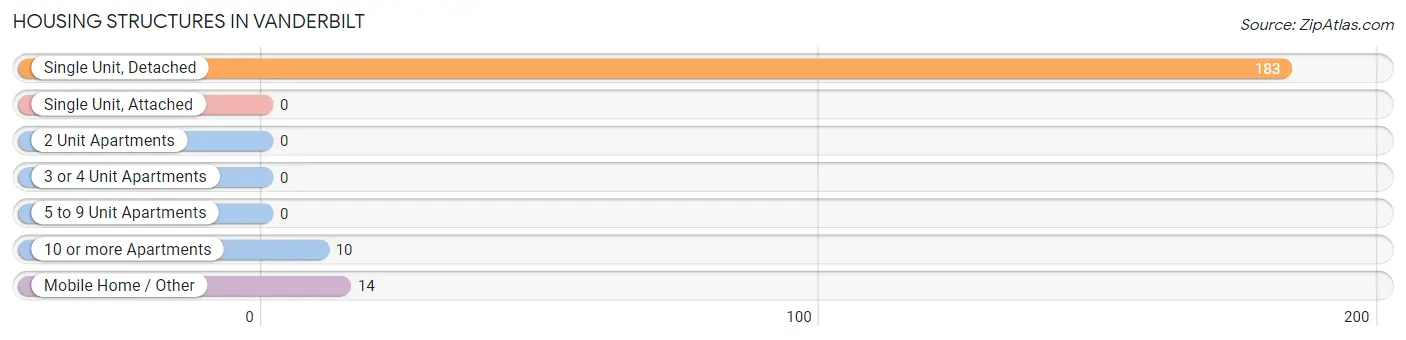
| Structure Type | # Housing Units | % Housing Units |
| Single Unit, Detached | 183 | 88.4% |
| Single Unit, Attached | 0 | 0.0% |
| 2 Unit Apartments | 0 | 0.0% |
| 3 or 4 Unit Apartments | 0 | 0.0% |
| 5 to 9 Unit Apartments | 0 | 0.0% |
| 10 or more Apartments | 10 | 4.8% |
| Mobile Home / Other | 14 | 6.8% |
| Total | 207 | 100.0% |
Housing Structures by Occupancy in Vanderbilt
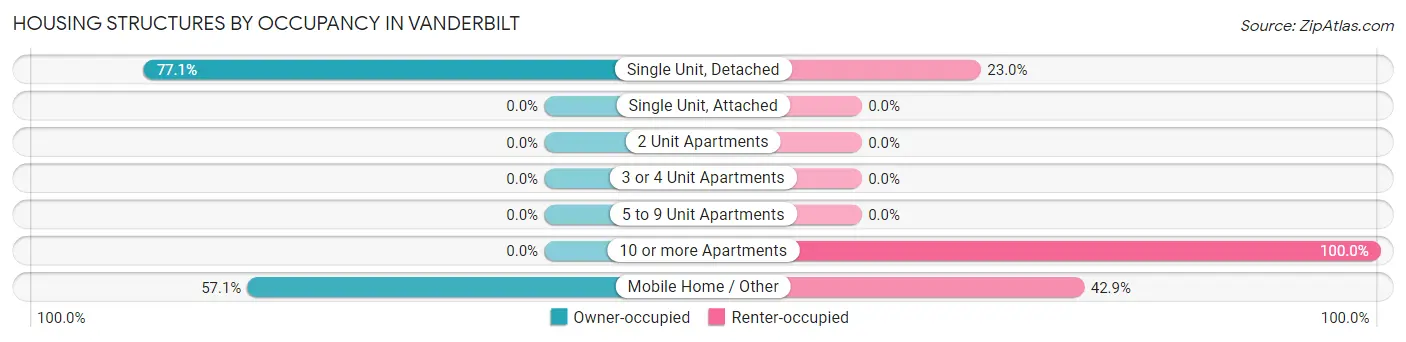
| Structure Type | Owner-occupied | Renter-occupied |
| Single Unit, Detached | 141 (77.0%) | 42 (23.0%) |
| Single Unit, Attached | 0 (0.0%) | 0 (0.0%) |
| 2 Unit Apartments | 0 (0.0%) | 0 (0.0%) |
| 3 or 4 Unit Apartments | 0 (0.0%) | 0 (0.0%) |
| 5 to 9 Unit Apartments | 0 (0.0%) | 0 (0.0%) |
| 10 or more Apartments | 0 (0.0%) | 10 (100.0%) |
| Mobile Home / Other | 8 (57.1%) | 6 (42.9%) |
| Total | 149 (72.0%) | 58 (28.0%) |
Housing Structures by Number of Rooms in Vanderbilt
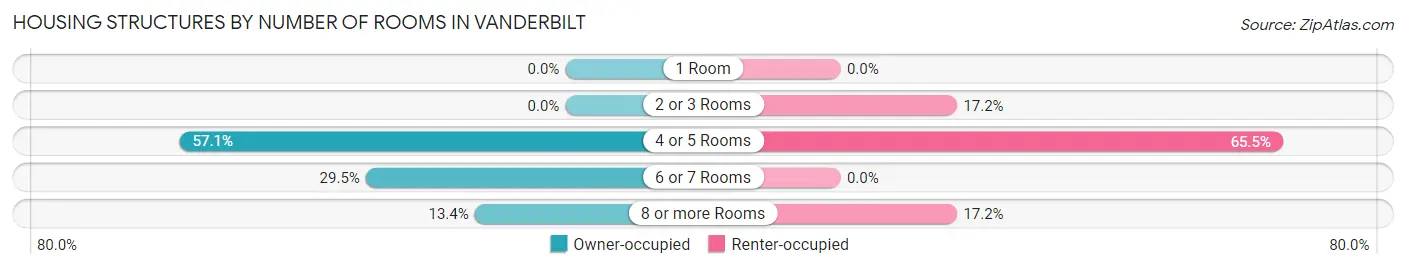
| Number of Rooms | Owner-occupied | Renter-occupied |
| 1 Room | 0 (0.0%) | 0 (0.0%) |
| 2 or 3 Rooms | 0 (0.0%) | 10 (17.2%) |
| 4 or 5 Rooms | 85 (57.1%) | 38 (65.5%) |
| 6 or 7 Rooms | 44 (29.5%) | 0 (0.0%) |
| 8 or more Rooms | 20 (13.4%) | 10 (17.2%) |
| Total | 149 (100.0%) | 58 (100.0%) |
Housing Structure by Heating Type in Vanderbilt
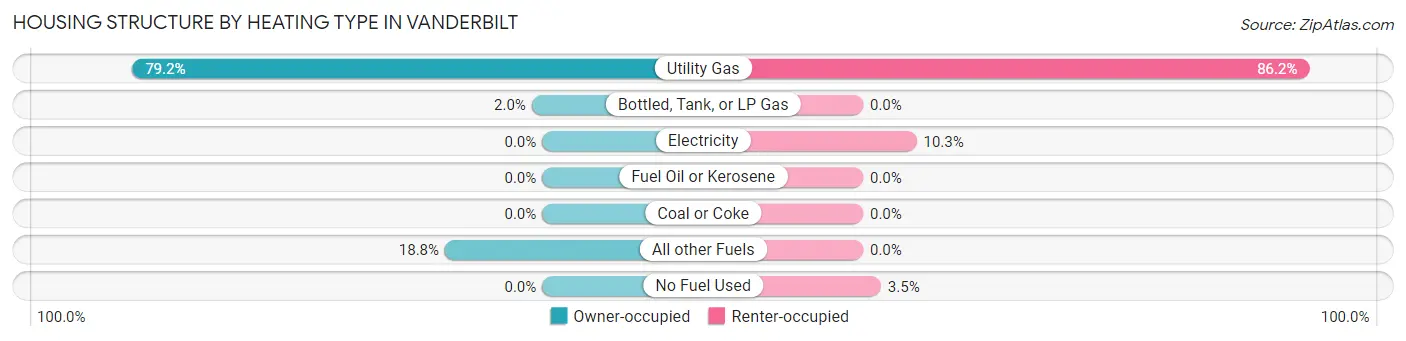
| Heating Type | Owner-occupied | Renter-occupied |
| Utility Gas | 118 (79.2%) | 50 (86.2%) |
| Bottled, Tank, or LP Gas | 3 (2.0%) | 0 (0.0%) |
| Electricity | 0 (0.0%) | 6 (10.3%) |
| Fuel Oil or Kerosene | 0 (0.0%) | 0 (0.0%) |
| Coal or Coke | 0 (0.0%) | 0 (0.0%) |
| All other Fuels | 28 (18.8%) | 0 (0.0%) |
| No Fuel Used | 0 (0.0%) | 2 (3.5%) |
| Total | 149 (100.0%) | 58 (100.0%) |
Household Vehicle Usage in Vanderbilt
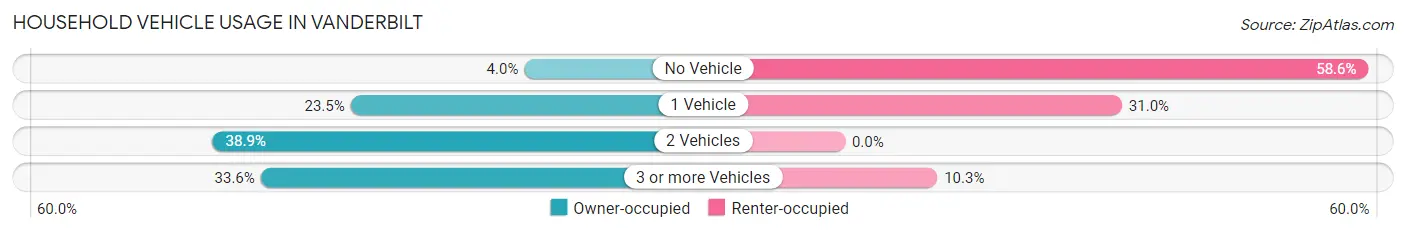
| Vehicles per Household | Owner-occupied | Renter-occupied |
| No Vehicle | 6 (4.0%) | 34 (58.6%) |
| 1 Vehicle | 35 (23.5%) | 18 (31.0%) |
| 2 Vehicles | 58 (38.9%) | 0 (0.0%) |
| 3 or more Vehicles | 50 (33.6%) | 6 (10.3%) |
| Total | 149 (100.0%) | 58 (100.0%) |
Real Estate & Mortgages in Vanderbilt
Real Estate and Mortgage Overview in Vanderbilt
| Characteristic | Without Mortgage | With Mortgage |
| Housing Units | 73 | 76 |
| Median Property Value | $152,900 | $92,300 |
| Median Household Income | $35,521 | $7 |
| Monthly Housing Costs | $381 | $0 |
| Real Estate Taxes | $862 | $0 |
Property Value by Mortgage Status in Vanderbilt
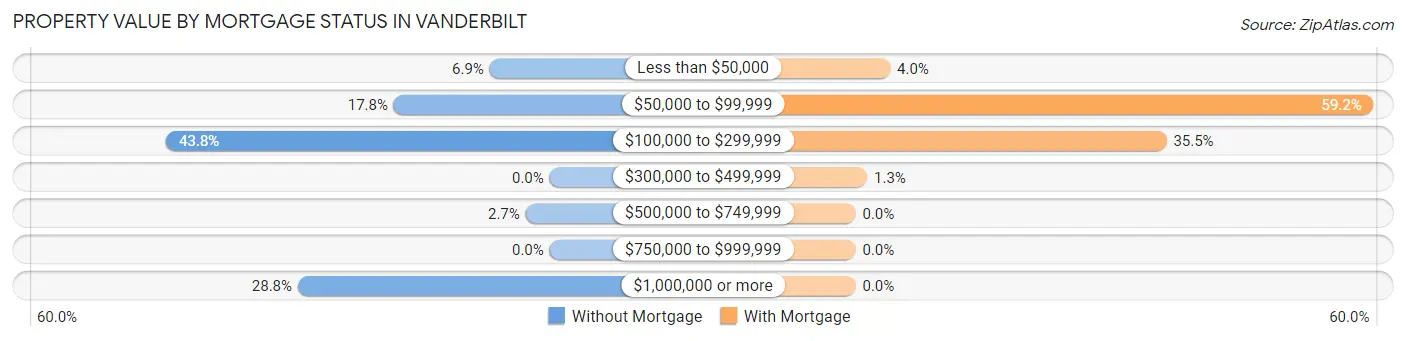
| Property Value | Without Mortgage | With Mortgage |
| Less than $50,000 | 5 (6.9%) | 3 (4.0%) |
| $50,000 to $99,999 | 13 (17.8%) | 45 (59.2%) |
| $100,000 to $299,999 | 32 (43.8%) | 27 (35.5%) |
| $300,000 to $499,999 | 0 (0.0%) | 1 (1.3%) |
| $500,000 to $749,999 | 2 (2.7%) | 0 (0.0%) |
| $750,000 to $999,999 | 0 (0.0%) | 0 (0.0%) |
| $1,000,000 or more | 21 (28.8%) | 0 (0.0%) |
| Total | 73 (100.0%) | 76 (100.0%) |
Household Income by Mortgage Status in Vanderbilt
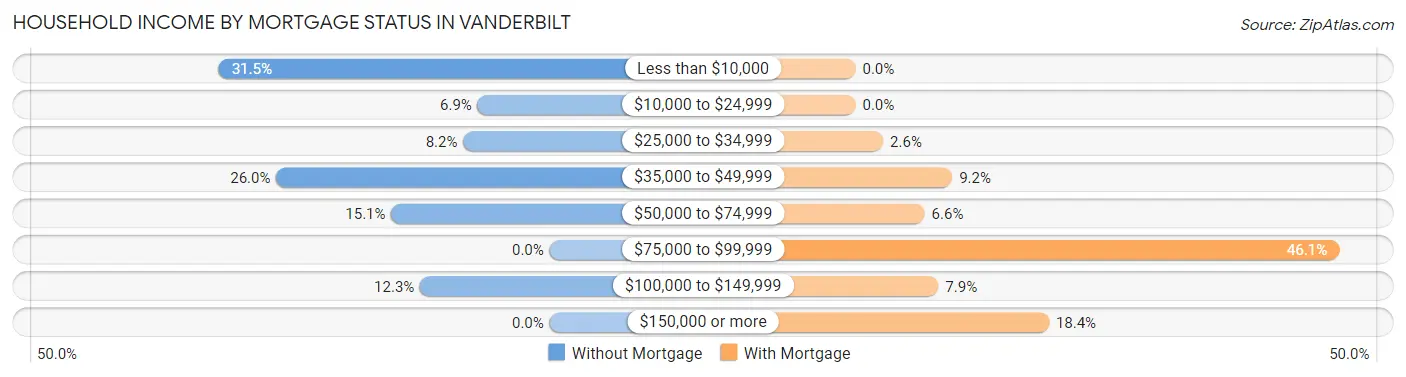
| Household Income | Without Mortgage | With Mortgage |
| Less than $10,000 | 23 (31.5%) | 0 (0.0%) |
| $10,000 to $24,999 | 5 (6.9%) | 0 (0.0%) |
| $25,000 to $34,999 | 6 (8.2%) | 2 (2.6%) |
| $35,000 to $49,999 | 19 (26.0%) | 7 (9.2%) |
| $50,000 to $74,999 | 11 (15.1%) | 5 (6.6%) |
| $75,000 to $99,999 | 0 (0.0%) | 35 (46.1%) |
| $100,000 to $149,999 | 9 (12.3%) | 6 (7.9%) |
| $150,000 or more | 0 (0.0%) | 14 (18.4%) |
| Total | 73 (100.0%) | 76 (100.0%) |
Property Value to Household Income Ratio in Vanderbilt
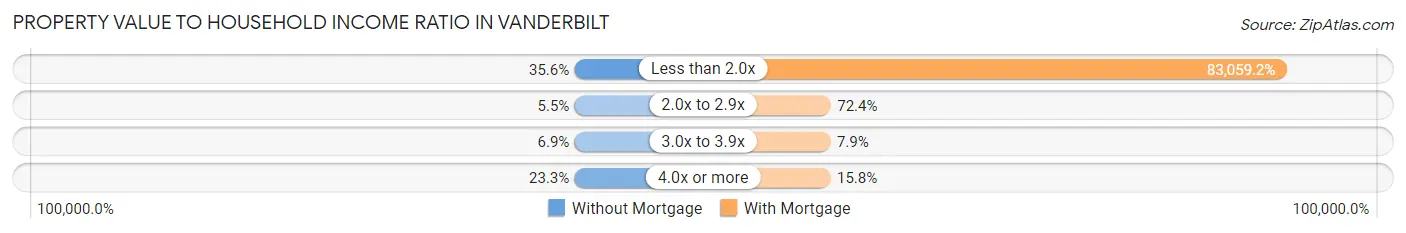
| Value-to-Income Ratio | Without Mortgage | With Mortgage |
| Less than 2.0x | 26 (35.6%) | 63,125 (83,059.2%) |
| 2.0x to 2.9x | 4 (5.5%) | 55 (72.4%) |
| 3.0x to 3.9x | 5 (6.9%) | 6 (7.9%) |
| 4.0x or more | 17 (23.3%) | 12 (15.8%) |
| Total | 73 (100.0%) | 76 (100.0%) |
Real Estate Taxes by Mortgage Status in Vanderbilt
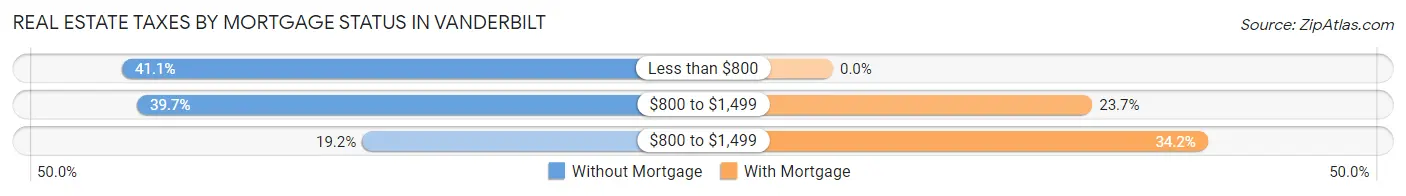
| Property Taxes | Without Mortgage | With Mortgage |
| Less than $800 | 30 (41.1%) | 0 (0.0%) |
| $800 to $1,499 | 29 (39.7%) | 18 (23.7%) |
| $800 to $1,499 | 14 (19.2%) | 26 (34.2%) |
| Total | 73 (100.0%) | 76 (100.0%) |
Health & Disability in Vanderbilt
Health Insurance Coverage by Age in Vanderbilt
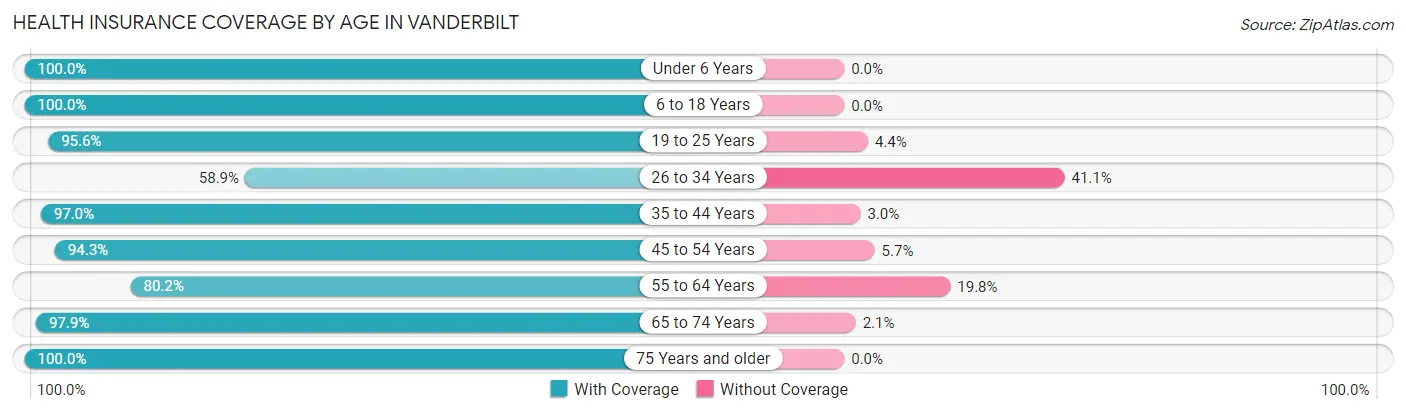
| Age Bracket | With Coverage | Without Coverage |
| Under 6 Years | 13 (100.0%) | 0 (0.0%) |
| 6 to 18 Years | 80 (100.0%) | 0 (0.0%) |
| 19 to 25 Years | 65 (95.6%) | 3 (4.4%) |
| 26 to 34 Years | 33 (58.9%) | 23 (41.1%) |
| 35 to 44 Years | 64 (97.0%) | 2 (3.0%) |
| 45 to 54 Years | 50 (94.3%) | 3 (5.7%) |
| 55 to 64 Years | 73 (80.2%) | 18 (19.8%) |
| 65 to 74 Years | 46 (97.9%) | 1 (2.1%) |
| 75 Years and older | 21 (100.0%) | 0 (0.0%) |
| Total | 445 (89.9%) | 50 (10.1%) |
Health Insurance Coverage by Citizenship Status in Vanderbilt
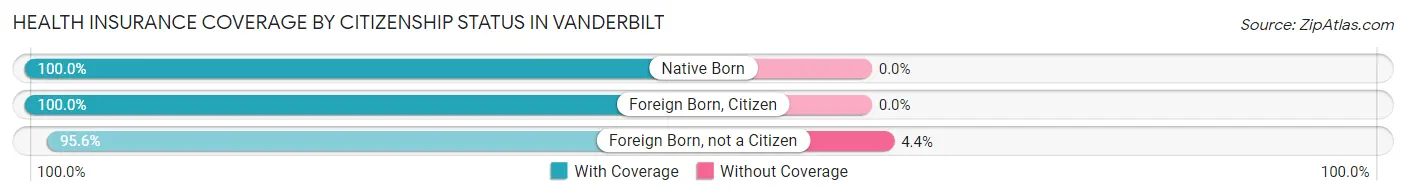
| Citizenship Status | With Coverage | Without Coverage |
| Native Born | 13 (100.0%) | 0 (0.0%) |
| Foreign Born, Citizen | 80 (100.0%) | 0 (0.0%) |
| Foreign Born, not a Citizen | 65 (95.6%) | 3 (4.4%) |
Health Insurance Coverage by Household Income in Vanderbilt
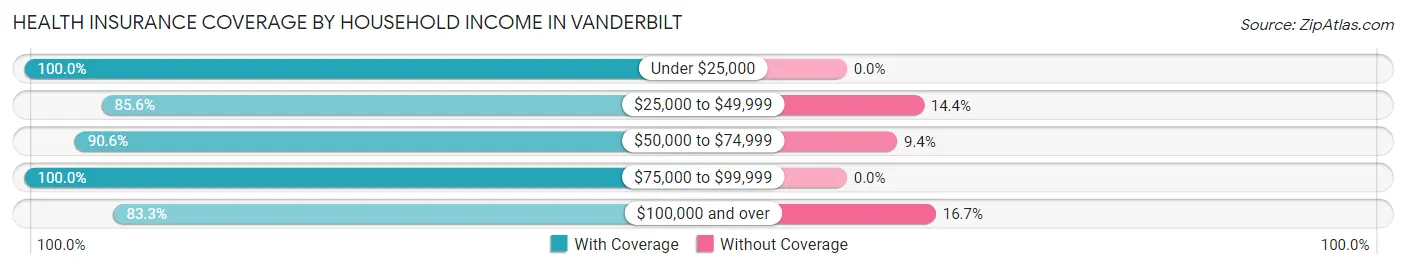
| Household Income | With Coverage | Without Coverage |
| Under $25,000 | 127 (100.0%) | 0 (0.0%) |
| $25,000 to $49,999 | 89 (85.6%) | 15 (14.4%) |
| $50,000 to $74,999 | 77 (90.6%) | 8 (9.4%) |
| $75,000 to $99,999 | 13 (100.0%) | 0 (0.0%) |
| $100,000 and over | 135 (83.3%) | 27 (16.7%) |
Public vs Private Health Insurance Coverage by Age in Vanderbilt
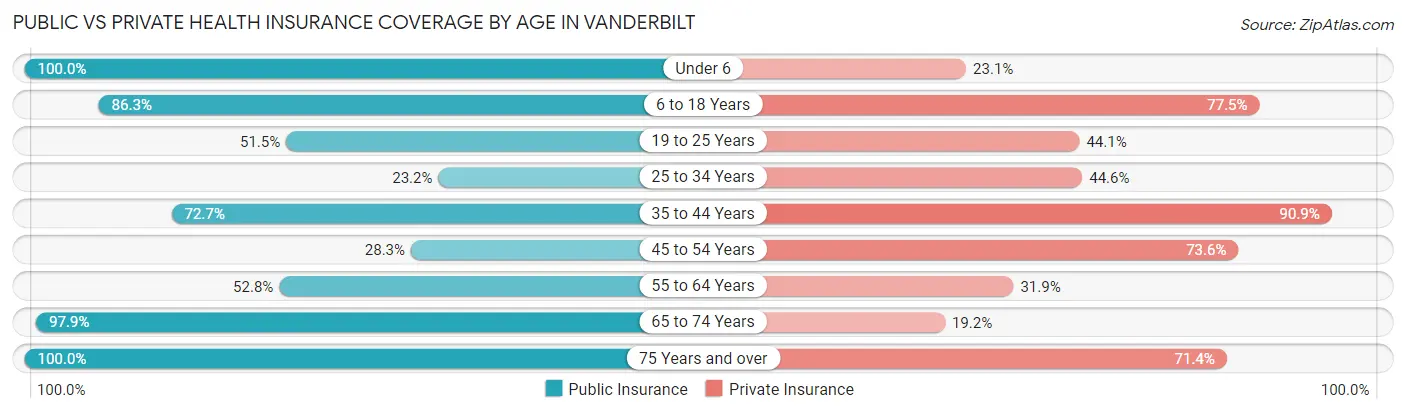
| Age Bracket | Public Insurance | Private Insurance |
| Under 6 | 13 (100.0%) | 3 (23.1%) |
| 6 to 18 Years | 69 (86.3%) | 62 (77.5%) |
| 19 to 25 Years | 35 (51.5%) | 30 (44.1%) |
| 25 to 34 Years | 13 (23.2%) | 25 (44.6%) |
| 35 to 44 Years | 48 (72.7%) | 60 (90.9%) |
| 45 to 54 Years | 15 (28.3%) | 39 (73.6%) |
| 55 to 64 Years | 48 (52.7%) | 29 (31.9%) |
| 65 to 74 Years | 46 (97.9%) | 9 (19.2%) |
| 75 Years and over | 21 (100.0%) | 15 (71.4%) |
| Total | 308 (62.2%) | 272 (54.9%) |
Disability Status by Sex by Age in Vanderbilt
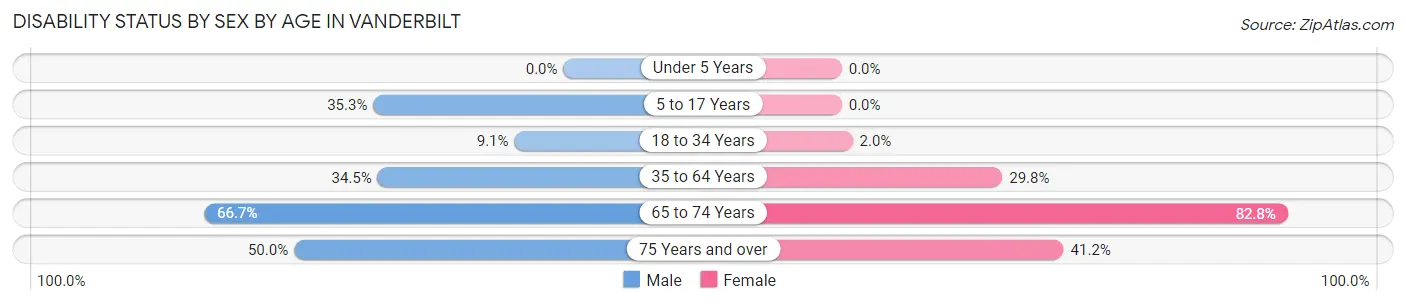
| Age Bracket | Male | Female |
| Under 5 Years | 0 (0.0%) | 0 (0.0%) |
| 5 to 17 Years | 24 (35.3%) | 0 (0.0%) |
| 18 to 34 Years | 7 (9.1%) | 1 (2.0%) |
| 35 to 64 Years | 40 (34.5%) | 28 (29.8%) |
| 65 to 74 Years | 12 (66.7%) | 24 (82.8%) |
| 75 Years and over | 2 (50.0%) | 7 (41.2%) |
Disability Class by Sex by Age in Vanderbilt
Disability Class: Hearing Difficulty
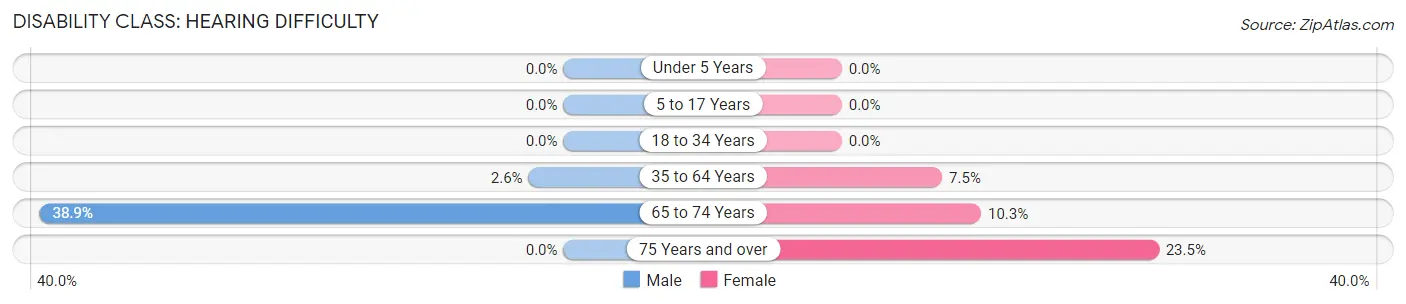
| Age Bracket | Male | Female |
| Under 5 Years | 0 (0.0%) | 0 (0.0%) |
| 5 to 17 Years | 0 (0.0%) | 0 (0.0%) |
| 18 to 34 Years | 0 (0.0%) | 0 (0.0%) |
| 35 to 64 Years | 3 (2.6%) | 7 (7.4%) |
| 65 to 74 Years | 7 (38.9%) | 3 (10.3%) |
| 75 Years and over | 0 (0.0%) | 4 (23.5%) |
Disability Class: Vision Difficulty
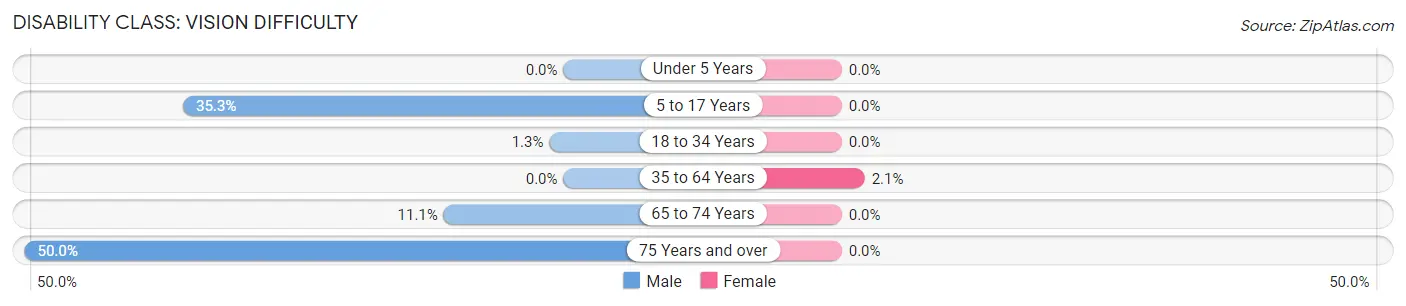
| Age Bracket | Male | Female |
| Under 5 Years | 0 (0.0%) | 0 (0.0%) |
| 5 to 17 Years | 24 (35.3%) | 0 (0.0%) |
| 18 to 34 Years | 1 (1.3%) | 0 (0.0%) |
| 35 to 64 Years | 0 (0.0%) | 2 (2.1%) |
| 65 to 74 Years | 2 (11.1%) | 0 (0.0%) |
| 75 Years and over | 2 (50.0%) | 0 (0.0%) |
Disability Class: Cognitive Difficulty
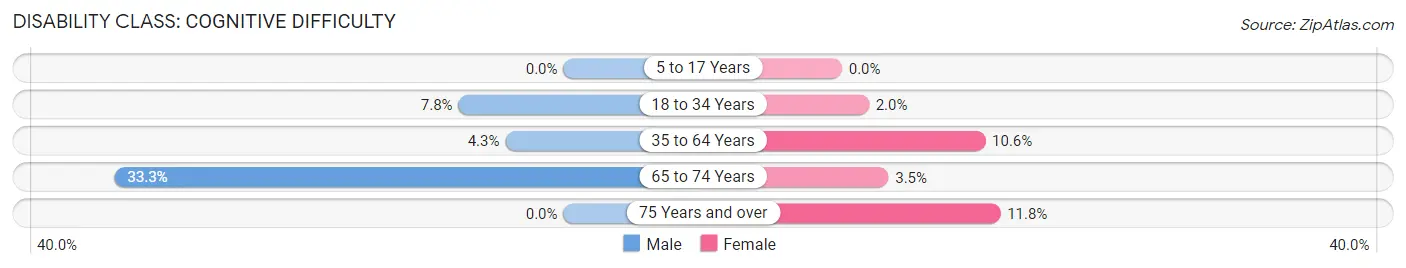
| Age Bracket | Male | Female |
| 5 to 17 Years | 0 (0.0%) | 0 (0.0%) |
| 18 to 34 Years | 6 (7.8%) | 1 (2.0%) |
| 35 to 64 Years | 5 (4.3%) | 10 (10.6%) |
| 65 to 74 Years | 6 (33.3%) | 1 (3.5%) |
| 75 Years and over | 0 (0.0%) | 2 (11.8%) |
Disability Class: Ambulatory Difficulty
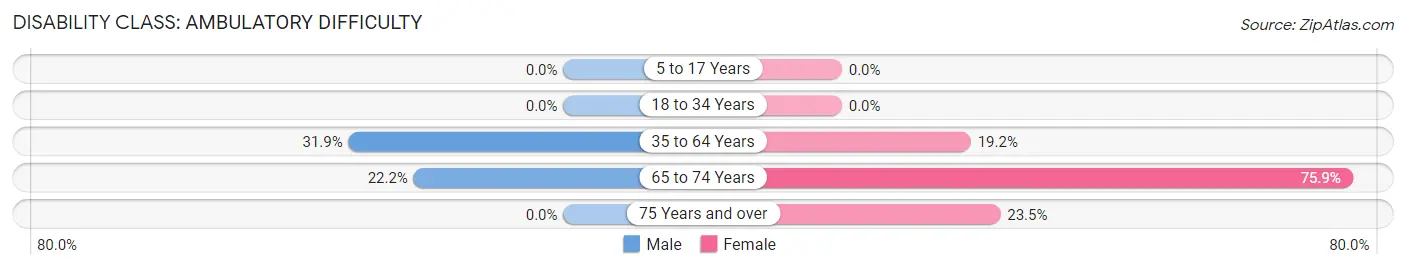
| Age Bracket | Male | Female |
| 5 to 17 Years | 0 (0.0%) | 0 (0.0%) |
| 18 to 34 Years | 0 (0.0%) | 0 (0.0%) |
| 35 to 64 Years | 37 (31.9%) | 18 (19.2%) |
| 65 to 74 Years | 4 (22.2%) | 22 (75.9%) |
| 75 Years and over | 0 (0.0%) | 4 (23.5%) |
Disability Class: Self-Care Difficulty
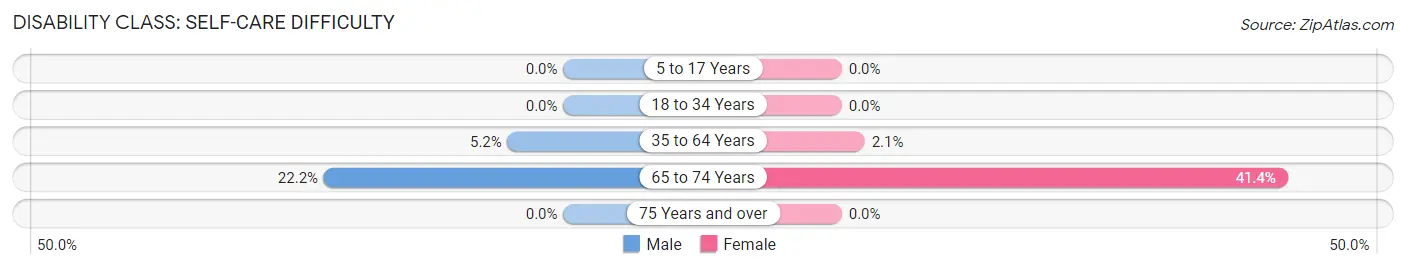
| Age Bracket | Male | Female |
| 5 to 17 Years | 0 (0.0%) | 0 (0.0%) |
| 18 to 34 Years | 0 (0.0%) | 0 (0.0%) |
| 35 to 64 Years | 6 (5.2%) | 2 (2.1%) |
| 65 to 74 Years | 4 (22.2%) | 12 (41.4%) |
| 75 Years and over | 0 (0.0%) | 0 (0.0%) |
Technology Access in Vanderbilt
Computing Device Access in Vanderbilt
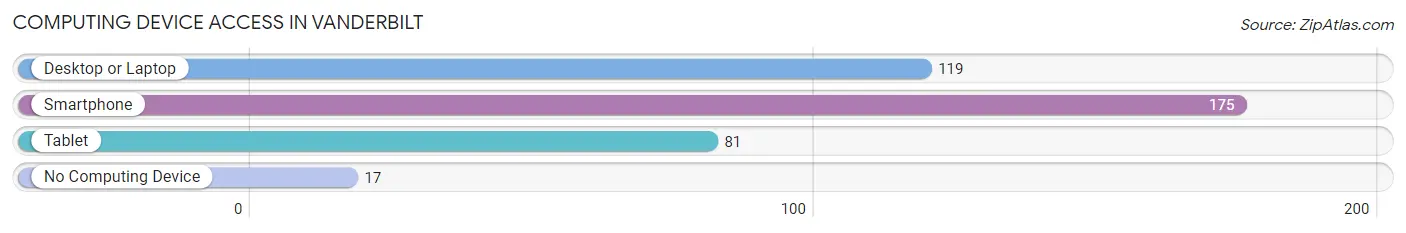
| Device Type | # Households | % Households |
| Desktop or Laptop | 119 | 57.5% |
| Smartphone | 175 | 84.5% |
| Tablet | 81 | 39.1% |
| No Computing Device | 17 | 8.2% |
| Total | 207 | 100.0% |
Internet Access in Vanderbilt
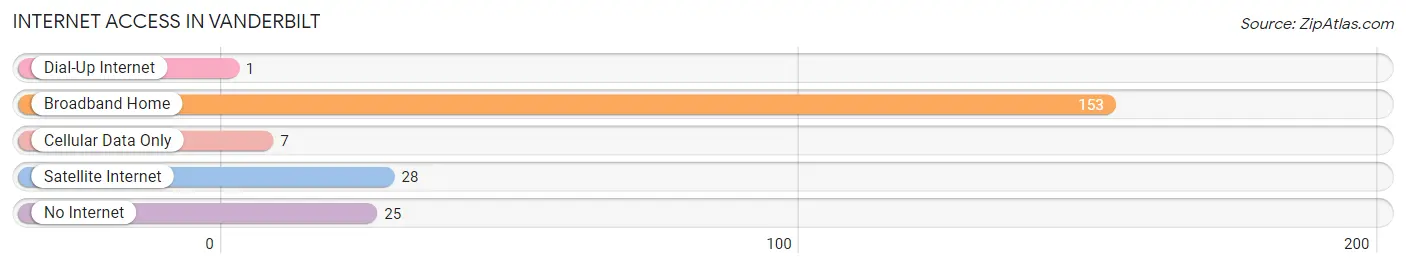
| Internet Type | # Households | % Households |
| Dial-Up Internet | 1 | 0.5% |
| Broadband Home | 153 | 73.9% |
| Cellular Data Only | 7 | 3.4% |
| Satellite Internet | 28 | 13.5% |
| No Internet | 25 | 12.1% |
| Total | 207 | 100.0% |
Vanderbilt Summary
Vanderbilt is a small unincorporated community located in the northern part of Otsego County, Michigan. It is situated in the middle of the state, about halfway between Gaylord and Petoskey. The community is located on the south side of the Sturgeon River, which flows through the area. The population of Vanderbilt was estimated to be around 1,000 in 2020.
History
Vanderbilt was first settled in 1875 by a group of settlers from New York. The town was named after Cornelius Vanderbilt, a prominent railroad magnate of the time. The town was originally a logging and farming community, but it soon became a popular tourist destination due to its proximity to the Sturgeon River. The town was incorporated in 1891 and the first post office was established in 1892.
Geography
Vanderbilt is located in the northern part of Otsego County, Michigan. It is situated in the middle of the state, about halfway between Gaylord and Petoskey. The community is located on the south side of the Sturgeon River, which flows through the area. The terrain is mostly flat, with some rolling hills in the area. The climate is generally mild, with cold winters and warm summers.
Economy
Vanderbilt’s economy is largely based on tourism. The town is home to several resorts and campgrounds, as well as a variety of restaurants and shops. The town is also home to a number of small businesses, including a lumber mill, a sawmill, and a few small manufacturing plants. The town is also home to a number of farms, which produce a variety of crops, including corn, soybeans, and wheat.
Demographics
The population of Vanderbilt was estimated to be around 1,000 in 2020. The racial makeup of the town is predominantly white, with a small percentage of African Americans, Native Americans, and other races. The median household income in Vanderbilt is around $45,000, and the median home value is around $150,000. The town has a high rate of homeownership, with around 80% of the population owning their own homes. The town also has a high rate of educational attainment, with around 90% of the population having at least a high school diploma.
Common Questions
What is Per Capita Income in Vanderbilt?
Per Capita income in Vanderbilt is $29,345.
What is the Median Family Income in Vanderbilt?
Median Family Income in Vanderbilt is $43,500.
What is the Median Household income in Vanderbilt?
Median Household Income in Vanderbilt is $39,821.
What is Income or Wage Gap in Vanderbilt?
Income or Wage Gap in Vanderbilt is 29.1%.
Women in Vanderbilt earn 70.9 cents for every dollar earned by a man.
What is Inequality or Gini Index in Vanderbilt?
Inequality or Gini Index in Vanderbilt is 0.54.
What is the Total Population of Vanderbilt?
Total Population of Vanderbilt is 495.
What is the Total Male Population of Vanderbilt?
Total Male Population of Vanderbilt is 291.
What is the Total Female Population of Vanderbilt?
Total Female Population of Vanderbilt is 204.
What is the Ratio of Males per 100 Females in Vanderbilt?
There are 142.65 Males per 100 Females in Vanderbilt.
What is the Ratio of Females per 100 Males in Vanderbilt?
There are 70.10 Females per 100 Males in Vanderbilt.
What is the Median Population Age in Vanderbilt?
Median Population Age in Vanderbilt is 41.5 Years.
What is the Average Family Size in Vanderbilt
Average Family Size in Vanderbilt is 3.3 People.
What is the Average Household Size in Vanderbilt
Average Household Size in Vanderbilt is 2.4 People.
How Large is the Labor Force in Vanderbilt?
There are 255 People in the Labor Forcein in Vanderbilt.
What is the Percentage of People in the Labor Force in Vanderbilt?
61.9% of People are in the Labor Force in Vanderbilt.
What is the Unemployment Rate in Vanderbilt?
Unemployment Rate in Vanderbilt is 6.3%.