Sparta, MI Map & Demographics
Sparta Map
Sparta Overview
$26,571
PER CAPITA INCOME
$68,141
AVG FAMILY INCOME
$55,033
AVG HOUSEHOLD INCOME
28.4%
WAGE / INCOME GAP [ % ]
71.6¢/ $1
WAGE / INCOME GAP [ $ ]
0.41
INEQUALITY / GINI INDEX
4,247
TOTAL POPULATION
1,921
MALE POPULATION
2,326
FEMALE POPULATION
82.59
MALES / 100 FEMALES
121.08
FEMALES / 100 MALES
35.0
MEDIAN AGE
3.1
AVG FAMILY SIZE
2.5
AVG HOUSEHOLD SIZE
2,025
LABOR FORCE [ PEOPLE ]
59.5%
PERCENT IN LABOR FORCE
3.6%
UNEMPLOYMENT RATE
Sparta Zip Codes
Sparta Area Codes
Income in Sparta
Income Overview in Sparta
Per Capita Income in Sparta is $26,571, while median incomes of families and households are $68,141 and $55,033 respectively.
| Characteristic | Number | Measure |
| Per Capita Income | 4,247 | $26,571 |
| Median Family Income | 1,086 | $68,141 |
| Mean Family Income | 1,086 | $74,709 |
| Median Household Income | 1,682 | $55,033 |
| Mean Household Income | 1,682 | $65,902 |
| Income Deficit | 1,086 | $0 |
| Wage / Income Gap (%) | 4,247 | 28.40% |
| Wage / Income Gap ($) | 4,247 | 71.60¢ per $1 |
| Gini / Inequality Index | 4,247 | 0.41 |
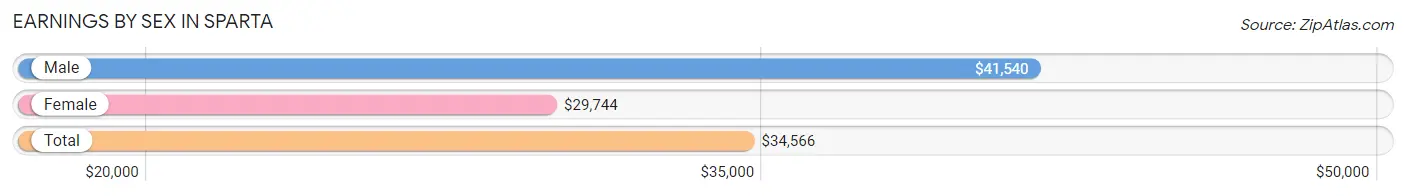
Earnings by Sex in Sparta
Average Earnings in Sparta are $34,566, $41,540 for men and $29,744 for women, a difference of 28.4%.
| Sex | Number | Average Earnings |
| Male | 953 (46.8%) | $41,540 |
| Female | 1,083 (53.2%) | $29,744 |
| Total | 2,036 (100.0%) | $34,566 |
Earnings by Sex by Income Bracket in Sparta
The most common earnings brackets in Sparta are $55,000 to $64,999 for men (156 | 16.4%) and $30,000 to $34,999 for women (123 | 11.4%).
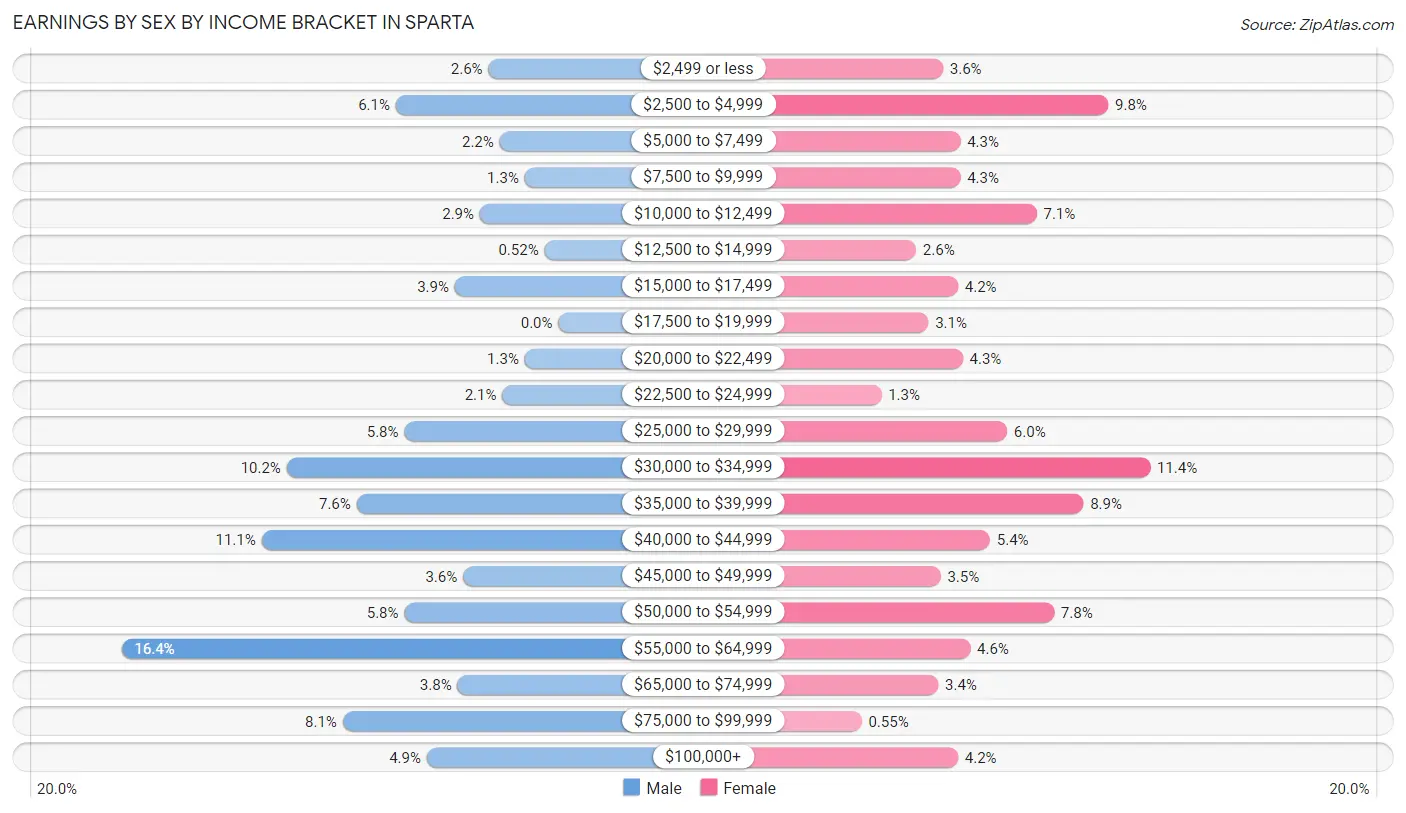
| Income | Male | Female |
| $2,499 or less | 25 (2.6%) | 39 (3.6%) |
| $2,500 to $4,999 | 58 (6.1%) | 106 (9.8%) |
| $5,000 to $7,499 | 21 (2.2%) | 46 (4.3%) |
| $7,500 to $9,999 | 12 (1.3%) | 46 (4.3%) |
| $10,000 to $12,499 | 28 (2.9%) | 77 (7.1%) |
| $12,500 to $14,999 | 5 (0.5%) | 28 (2.6%) |
| $15,000 to $17,499 | 37 (3.9%) | 45 (4.2%) |
| $17,500 to $19,999 | 0 (0.0%) | 33 (3.0%) |
| $20,000 to $22,499 | 12 (1.3%) | 47 (4.3%) |
| $22,500 to $24,999 | 20 (2.1%) | 14 (1.3%) |
| $25,000 to $29,999 | 55 (5.8%) | 65 (6.0%) |
| $30,000 to $34,999 | 97 (10.2%) | 123 (11.4%) |
| $35,000 to $39,999 | 72 (7.6%) | 96 (8.9%) |
| $40,000 to $44,999 | 106 (11.1%) | 58 (5.4%) |
| $45,000 to $49,999 | 34 (3.6%) | 38 (3.5%) |
| $50,000 to $54,999 | 55 (5.8%) | 84 (7.8%) |
| $55,000 to $64,999 | 156 (16.4%) | 50 (4.6%) |
| $65,000 to $74,999 | 36 (3.8%) | 37 (3.4%) |
| $75,000 to $99,999 | 77 (8.1%) | 6 (0.5%) |
| $100,000+ | 47 (4.9%) | 45 (4.2%) |
| Total | 953 (100.0%) | 1,083 (100.0%) |
Earnings by Sex by Educational Attainment in Sparta
Average earnings in Sparta are $45,000 for men and $34,024 for women, a difference of 24.4%. Men with an educational attainment of graduate degree enjoy the highest average annual earnings of $72,019, while those with high school diploma education earn the least with $41,378. Women with an educational attainment of bachelor's degree earn the most with the average annual earnings of $38,542, while those with college or associate's degree education have the smallest earnings of $31,106.
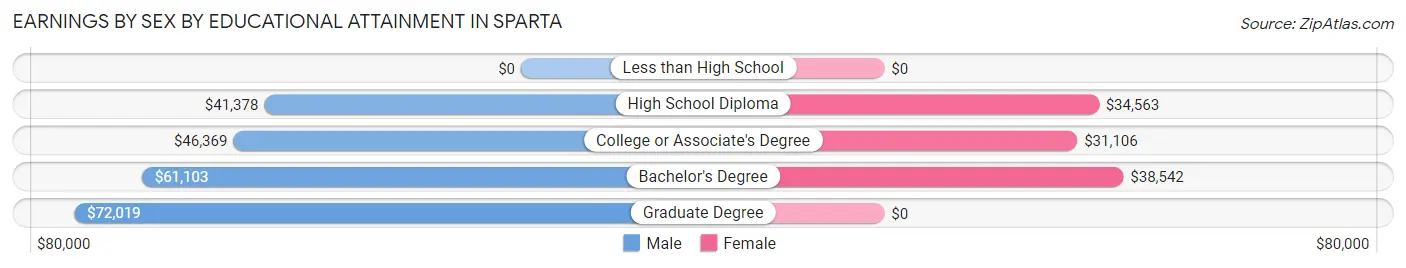
| Educational Attainment | Male Income | Female Income |
| Less than High School | - | - |
| High School Diploma | $41,378 | $34,563 |
| College or Associate's Degree | $46,369 | $31,106 |
| Bachelor's Degree | $61,103 | $38,542 |
| Graduate Degree | $72,019 | $0 |
| Total | $45,000 | $34,024 |
Family Income in Sparta
Family Income Brackets in Sparta
According to the Sparta family income data, there are 357 families falling into the $50,000 to $74,999 income range, which is the most common income bracket and makes up 32.9% of all families. Conversely, the $10,000 to $14,999 income bracket is the least frequent group with only 24 families (2.2%) belonging to this category.
| Income Bracket | # Families | % Families |
| Less than $10,000 | 54 | 5.0% |
| $10,000 to $14,999 | 24 | 2.2% |
| $15,000 to $24,999 | 42 | 3.9% |
| $25,000 to $34,999 | 64 | 5.9% |
| $35,000 to $49,999 | 125 | 11.5% |
| $50,000 to $74,999 | 357 | 32.9% |
| $75,000 to $99,999 | 184 | 16.9% |
| $100,000 to $149,999 | 135 | 12.4% |
| $150,000 to $199,999 | 70 | 6.4% |
| $200,000+ | 31 | 2.9% |
Family Income by Famaliy Size in Sparta
5-person families (44 | 4.1%) account for the highest median family income in Sparta with $78,125 per family, while 2-person families (472 | 43.5%) have the highest median income of $27,500 per family member.
| Income Bracket | # Families | Median Income |
| 2-Person Families | 472 (43.5%) | $55,000 |
| 3-Person Families | 302 (27.8%) | $57,386 |
| 4-Person Families | 186 (17.1%) | $76,250 |
| 5-Person Families | 44 (4.1%) | $78,125 |
| 6-Person Families | 82 (7.5%) | $75,000 |
| 7+ Person Families | 0 (0.0%) | $0 |
| Total | 1,086 (100.0%) | $68,141 |
Family Income by Number of Earners in Sparta
| Number of Earners | # Families | Median Income |
| No Earners | 169 (15.6%) | $0 |
| 1 Earner | 371 (34.2%) | $42,250 |
| 2 Earners | 446 (41.1%) | $75,761 |
| 3+ Earners | 100 (9.2%) | $181,579 |
| Total | 1,086 (100.0%) | $68,141 |
Household Income in Sparta
Household Income Brackets in Sparta
With 422 households falling in the category, the $50,000 to $74,999 income range is the most frequent in Sparta, accounting for 25.1% of all households. In contrast, only 39 households (2.3%) fall into the $200,000+ income bracket, making it the least populous group.
| Income Bracket | # Households | % Households |
| Less than $10,000 | 69 | 4.1% |
| $10,000 to $14,999 | 101 | 6.0% |
| $15,000 to $24,999 | 101 | 6.0% |
| $25,000 to $34,999 | 262 | 15.6% |
| $35,000 to $49,999 | 209 | 12.4% |
| $50,000 to $74,999 | 422 | 25.1% |
| $75,000 to $99,999 | 202 | 12.0% |
| $100,000 to $149,999 | 207 | 12.3% |
| $150,000 to $199,999 | 71 | 4.2% |
| $200,000+ | 39 | 2.3% |
Household Income by Householder Age in Sparta
The median household income in Sparta is $55,033, with the highest median household income of $58,848 found in the 25 to 44 years age bracket for the primary householder. A total of 529 households (31.5%) fall into this category. Meanwhile, the 15 to 24 years age bracket for the primary householder has the lowest median household income of $0, with 66 households (3.9%) in this group.
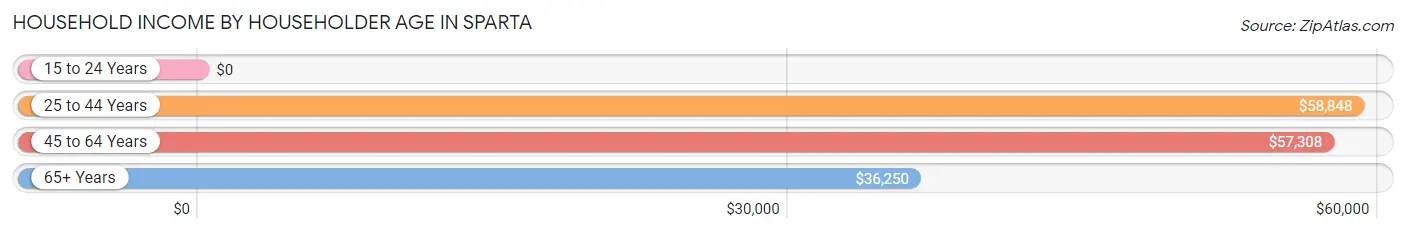
| Income Bracket | # Households | Median Income |
| 15 to 24 Years | 66 (3.9%) | $0 |
| 25 to 44 Years | 529 (31.5%) | $58,848 |
| 45 to 64 Years | 568 (33.8%) | $57,308 |
| 65+ Years | 519 (30.9%) | $36,250 |
| Total | 1,682 (100.0%) | $55,033 |
Poverty in Sparta
Income Below Poverty by Sex and Age in Sparta
With 4.3% poverty level for males and 17.7% for females among the residents of Sparta, 16 and 17 year old males and 5 year old females are the most vulnerable to poverty, with 16 males (21.0%) and 29 females (70.7%) in their respective age groups living below the poverty level.
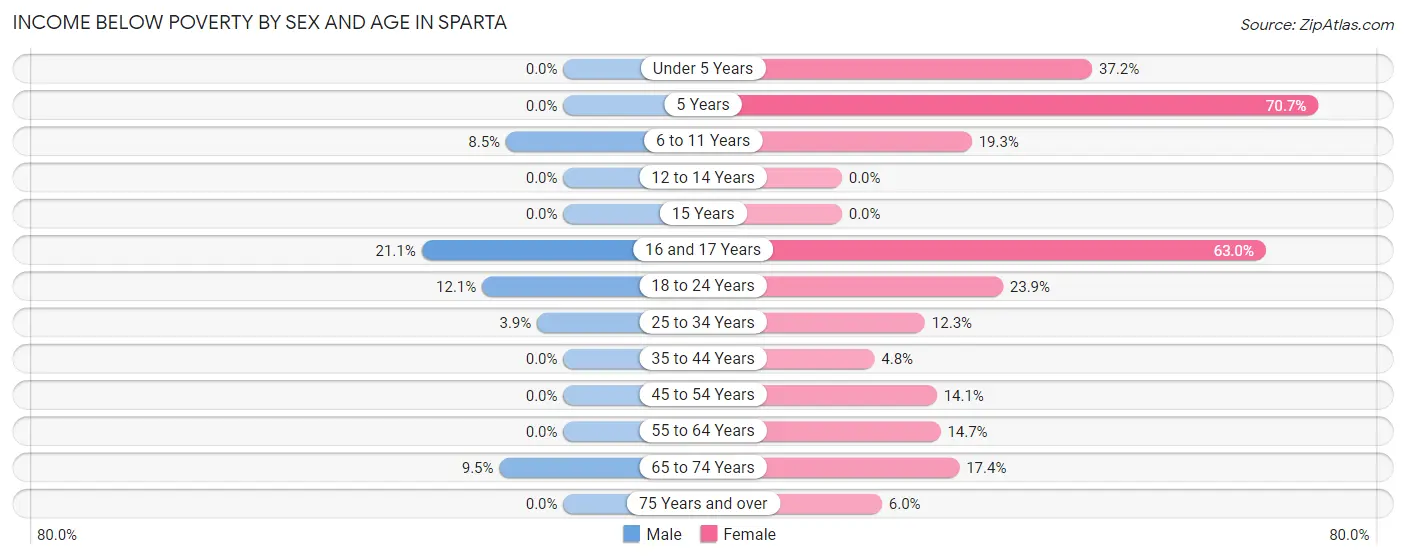
| Age Bracket | Male | Female |
| Under 5 Years | 0 (0.0%) | 55 (37.2%) |
| 5 Years | 0 (0.0%) | 29 (70.7%) |
| 6 to 11 Years | 11 (8.5%) | 27 (19.3%) |
| 12 to 14 Years | 0 (0.0%) | 0 (0.0%) |
| 15 Years | 0 (0.0%) | 0 (0.0%) |
| 16 and 17 Years | 16 (21.0%) | 51 (63.0%) |
| 18 to 24 Years | 24 (12.1%) | 50 (23.9%) |
| 25 to 34 Years | 13 (3.9%) | 47 (12.3%) |
| 35 to 44 Years | 0 (0.0%) | 12 (4.8%) |
| 45 to 54 Years | 0 (0.0%) | 41 (14.1%) |
| 55 to 64 Years | 0 (0.0%) | 40 (14.6%) |
| 65 to 74 Years | 19 (9.5%) | 49 (17.4%) |
| 75 Years and over | 0 (0.0%) | 11 (5.9%) |
| Total | 83 (4.3%) | 412 (17.7%) |
Income Above Poverty by Sex and Age in Sparta
According to the poverty statistics in Sparta, males aged under 5 years and females aged 12 to 14 years are the age groups that are most secure financially, with 100.0% of males and 100.0% of females in these age groups living above the poverty line.
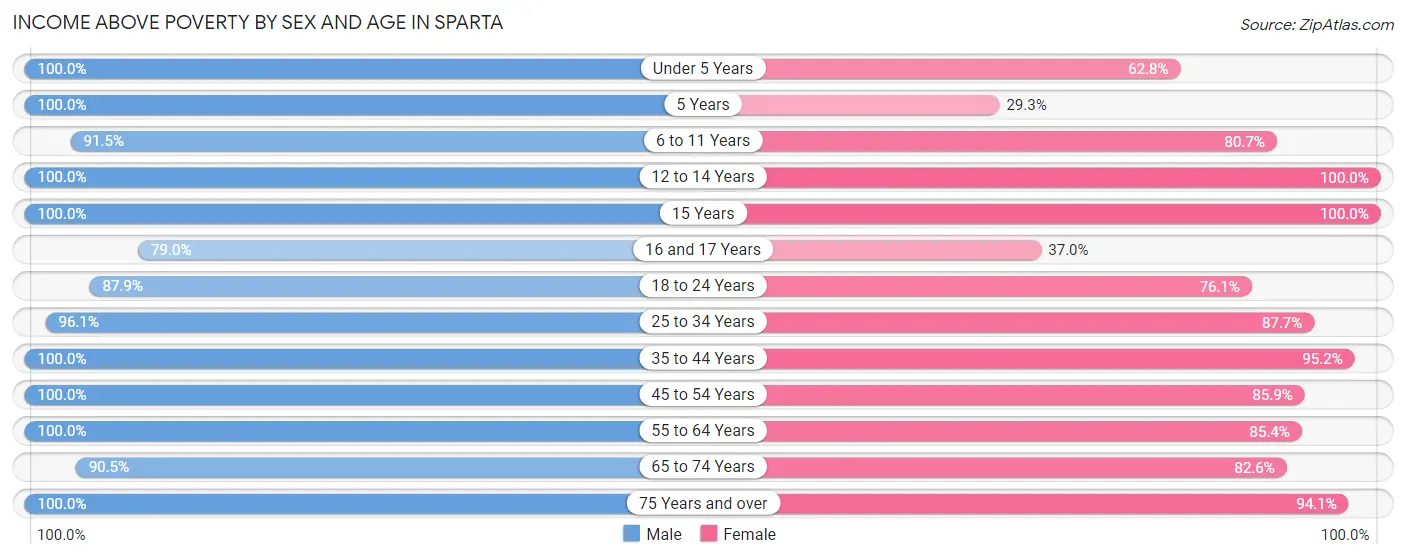
| Age Bracket | Male | Female |
| Under 5 Years | 158 (100.0%) | 93 (62.8%) |
| 5 Years | 31 (100.0%) | 12 (29.3%) |
| 6 to 11 Years | 118 (91.5%) | 113 (80.7%) |
| 12 to 14 Years | 97 (100.0%) | 44 (100.0%) |
| 15 Years | 41 (100.0%) | 4 (100.0%) |
| 16 and 17 Years | 60 (78.9%) | 30 (37.0%) |
| 18 to 24 Years | 175 (87.9%) | 159 (76.1%) |
| 25 to 34 Years | 320 (96.1%) | 334 (87.7%) |
| 35 to 44 Years | 213 (100.0%) | 236 (95.2%) |
| 45 to 54 Years | 189 (100.0%) | 250 (85.9%) |
| 55 to 64 Years | 184 (100.0%) | 233 (85.4%) |
| 65 to 74 Years | 181 (90.5%) | 232 (82.6%) |
| 75 Years and over | 61 (100.0%) | 174 (94.1%) |
| Total | 1,828 (95.7%) | 1,914 (82.3%) |
Income Below Poverty Among Married-Couple Families in Sparta
The poverty statistics for married-couple families in Sparta show that 1.2% or 8 of the total 680 families live below the poverty line. Families with no children have the highest poverty rate of 1.9%, comprising of 8 families. On the other hand, families with 1 or 2 children have the lowest poverty rate of 0.0%, which includes 0 families.
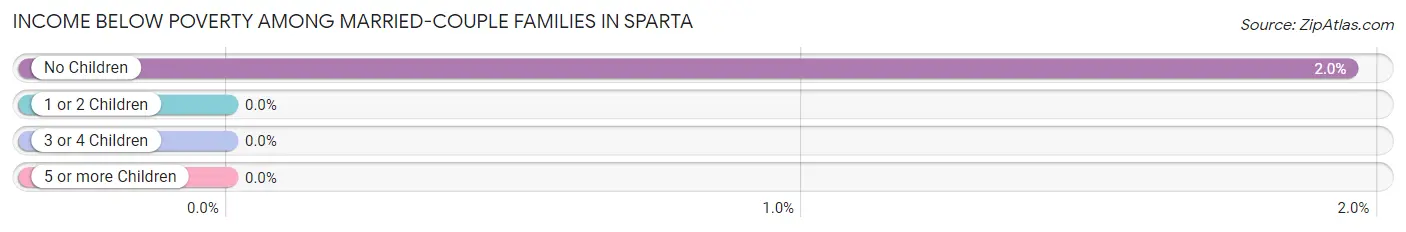
| Children | Above Poverty | Below Poverty |
| No Children | 402 (98.1%) | 8 (1.9%) |
| 1 or 2 Children | 211 (100.0%) | 0 (0.0%) |
| 3 or 4 Children | 59 (100.0%) | 0 (0.0%) |
| 5 or more Children | 0 (0.0%) | 0 (0.0%) |
| Total | 672 (98.8%) | 8 (1.2%) |
Income Below Poverty Among Single-Parent Households in Sparta
According to the poverty data in Sparta, 25.6% or 34 single-father households and 13.2% or 36 single-mother households are living below the poverty line. Among single-father households, those with no children have the highest poverty rate, with 10 households (25.6%) experiencing poverty. Likewise, among single-mother households, those with 1 or 2 children have the highest poverty rate, with 36 households (23.8%) falling below the poverty line.
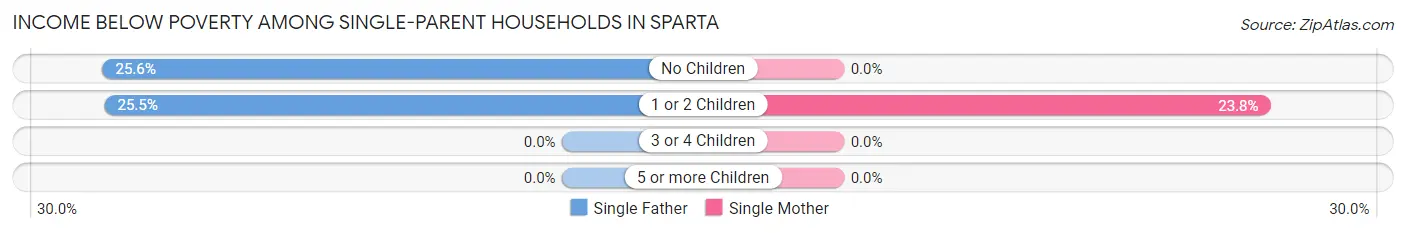
| Children | Single Father | Single Mother |
| No Children | 10 (25.6%) | 0 (0.0%) |
| 1 or 2 Children | 24 (25.5%) | 36 (23.8%) |
| 3 or 4 Children | 0 (0.0%) | 0 (0.0%) |
| 5 or more Children | 0 (0.0%) | 0 (0.0%) |
| Total | 34 (25.6%) | 36 (13.2%) |
Income Below Poverty Among Married-Couple vs Single-Parent Households in Sparta
The poverty data for Sparta shows that 8 of the married-couple family households (1.2%) and 70 of the single-parent households (17.2%) are living below the poverty level. Within the married-couple family households, those with no children have the highest poverty rate, with 8 households (1.9%) falling below the poverty line. Among the single-parent households, those with 1 or 2 children have the highest poverty rate, with 60 household (24.5%) living below poverty.
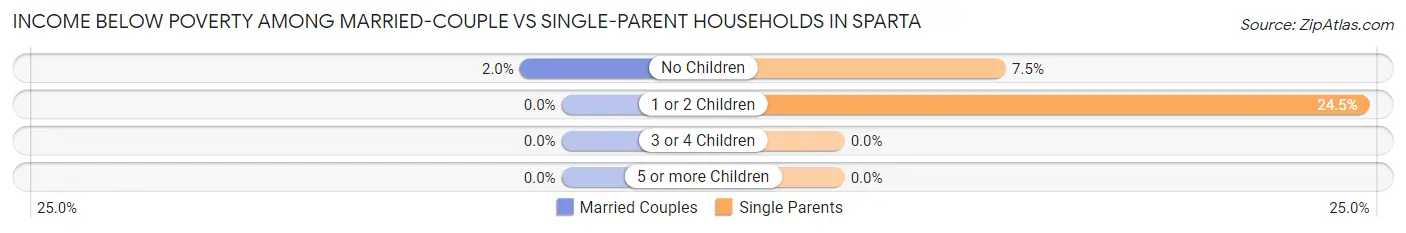
| Children | Married-Couple Families | Single-Parent Households |
| No Children | 8 (1.9%) | 10 (7.5%) |
| 1 or 2 Children | 0 (0.0%) | 60 (24.5%) |
| 3 or 4 Children | 0 (0.0%) | 0 (0.0%) |
| 5 or more Children | 0 (0.0%) | 0 (0.0%) |
| Total | 8 (1.2%) | 70 (17.2%) |
Race in Sparta
The most populous races in Sparta are White / Caucasian (4,010 | 94.4%), Two or more Races (180 | 4.2%), and Hispanic or Latino (84 | 2.0%).
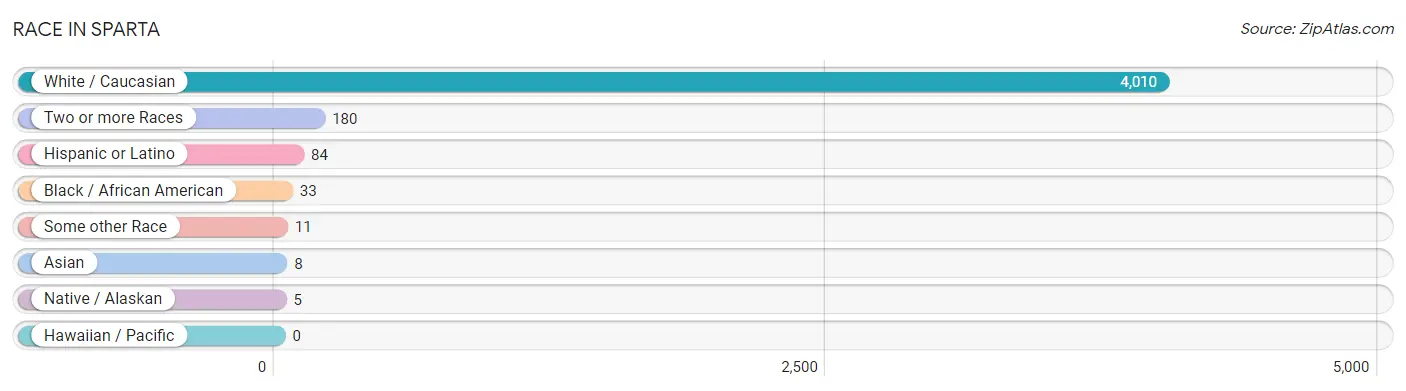
| Race | # Population | % Population |
| Asian | 8 | 0.2% |
| Black / African American | 33 | 0.8% |
| Hawaiian / Pacific | 0 | 0.0% |
| Hispanic or Latino | 84 | 2.0% |
| Native / Alaskan | 5 | 0.1% |
| White / Caucasian | 4,010 | 94.4% |
| Two or more Races | 180 | 4.2% |
| Some other Race | 11 | 0.3% |
| Total | 4,247 | 100.0% |
Ancestry in Sparta
The most populous ancestries reported in Sparta are Dutch (777 | 18.3%), German (683 | 16.1%), Irish (610 | 14.4%), English (384 | 9.0%), and Polish (369 | 8.7%), together accounting for 66.5% of all Sparta residents.
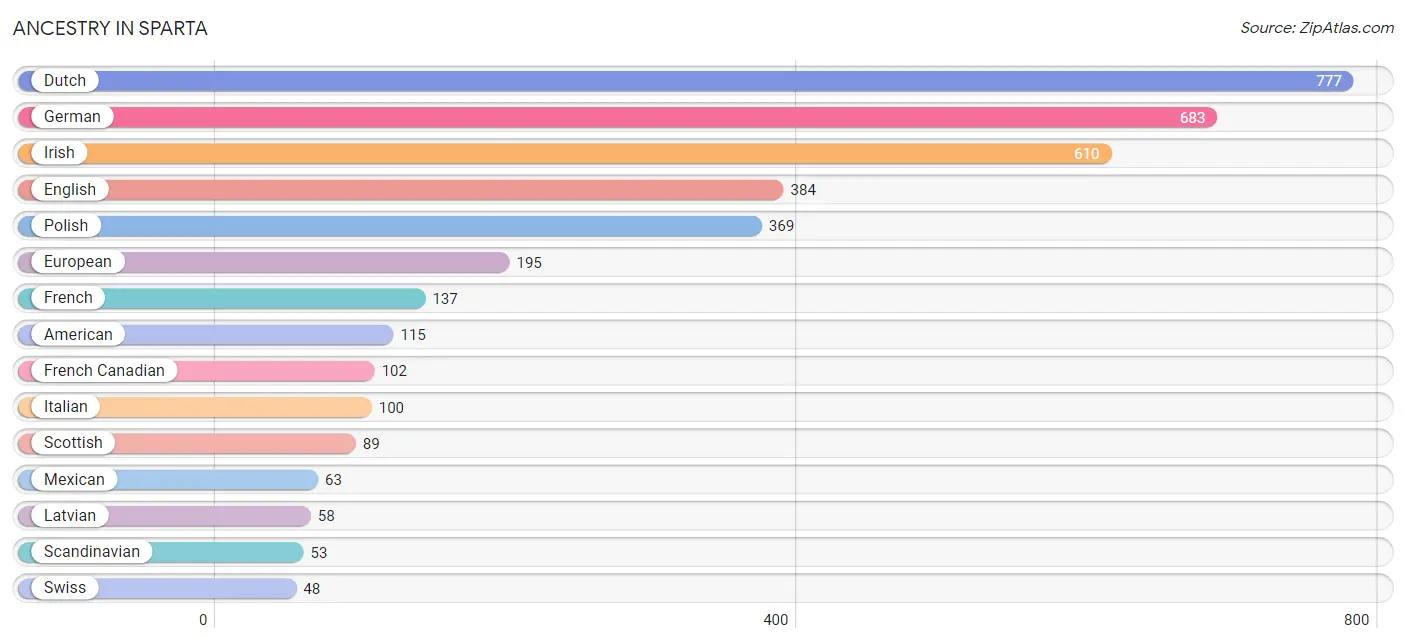
| Ancestry | # Population | % Population |
| American | 115 | 2.7% |
| Austrian | 24 | 0.6% |
| British | 8 | 0.2% |
| Canadian | 8 | 0.2% |
| Cherokee | 3 | 0.1% |
| Chippewa | 5 | 0.1% |
| Czech | 32 | 0.7% |
| Czechoslovakian | 8 | 0.2% |
| Danish | 21 | 0.5% |
| Dutch | 777 | 18.3% |
| English | 384 | 9.0% |
| European | 195 | 4.6% |
| Finnish | 1 | 0.0% |
| French | 137 | 3.2% |
| French Canadian | 102 | 2.4% |
| German | 683 | 16.1% |
| Ghanaian | 12 | 0.3% |
| Greek | 16 | 0.4% |
| Irish | 610 | 14.4% |
| Italian | 100 | 2.4% |
| Korean | 8 | 0.2% |
| Latvian | 58 | 1.4% |
| Mexican | 63 | 1.5% |
| Norwegian | 21 | 0.5% |
| Peruvian | 21 | 0.5% |
| Polish | 369 | 8.7% |
| Russian | 12 | 0.3% |
| Scandinavian | 53 | 1.3% |
| Scotch-Irish | 9 | 0.2% |
| Scottish | 89 | 2.1% |
| South American | 21 | 0.5% |
| Subsaharan African | 12 | 0.3% |
| Swedish | 22 | 0.5% |
| Swiss | 48 | 1.1% |
| Ukrainian | 24 | 0.6% |
| Welsh | 18 | 0.4% | View All 36 Rows |
Immigrants in Sparta
The most numerous immigrant groups reported in Sparta came from Europe (31 | 0.7%), Africa (12 | 0.3%), Central America (12 | 0.3%), Eastern Europe (12 | 0.3%), and Ghana (12 | 0.3%), together accounting for 1.8% of all Sparta residents.
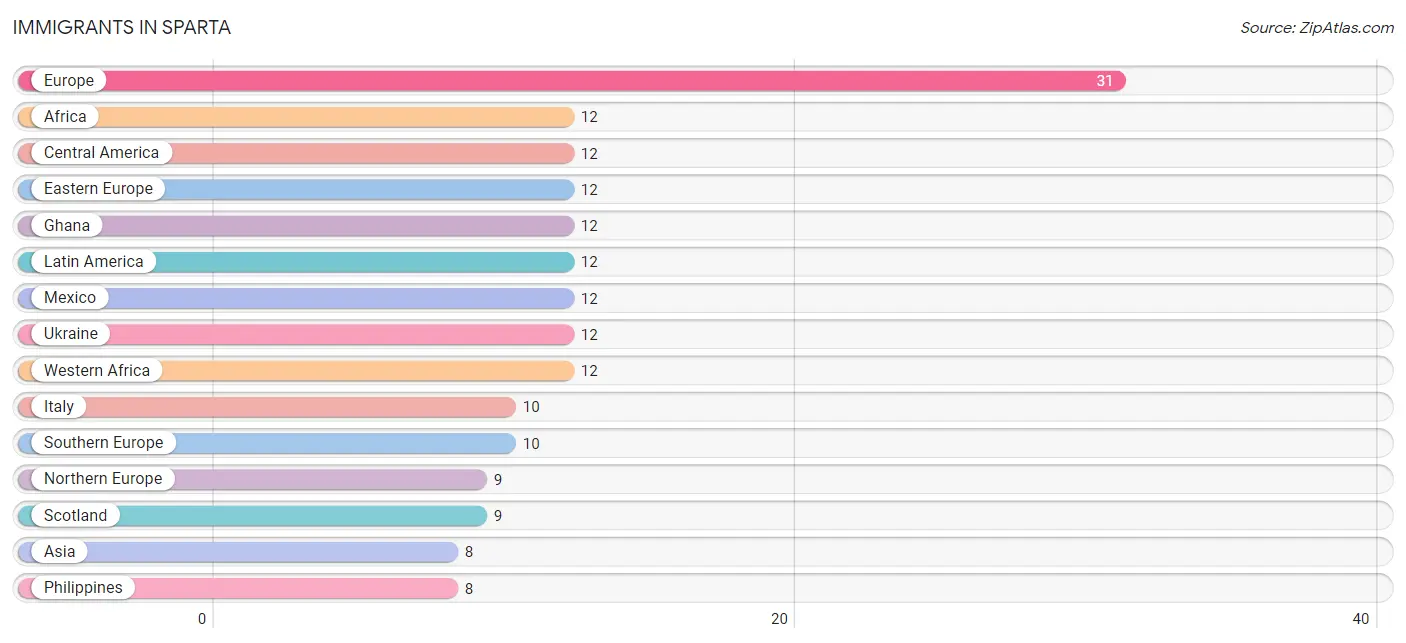
| Immigration Origin | # Population | % Population |
| Africa | 12 | 0.3% |
| Asia | 8 | 0.2% |
| Central America | 12 | 0.3% |
| Eastern Europe | 12 | 0.3% |
| Europe | 31 | 0.7% |
| Ghana | 12 | 0.3% |
| Italy | 10 | 0.2% |
| Latin America | 12 | 0.3% |
| Mexico | 12 | 0.3% |
| Northern Europe | 9 | 0.2% |
| Philippines | 8 | 0.2% |
| Scotland | 9 | 0.2% |
| South Eastern Asia | 8 | 0.2% |
| Southern Europe | 10 | 0.2% |
| Ukraine | 12 | 0.3% |
| Western Africa | 12 | 0.3% | View All 16 Rows |
Sex and Age in Sparta
Sex and Age in Sparta
The most populous age groups in Sparta are 20 to 24 Years (192 | 10.0%) for men and 25 to 29 Years (257 | 11.1%) for women.
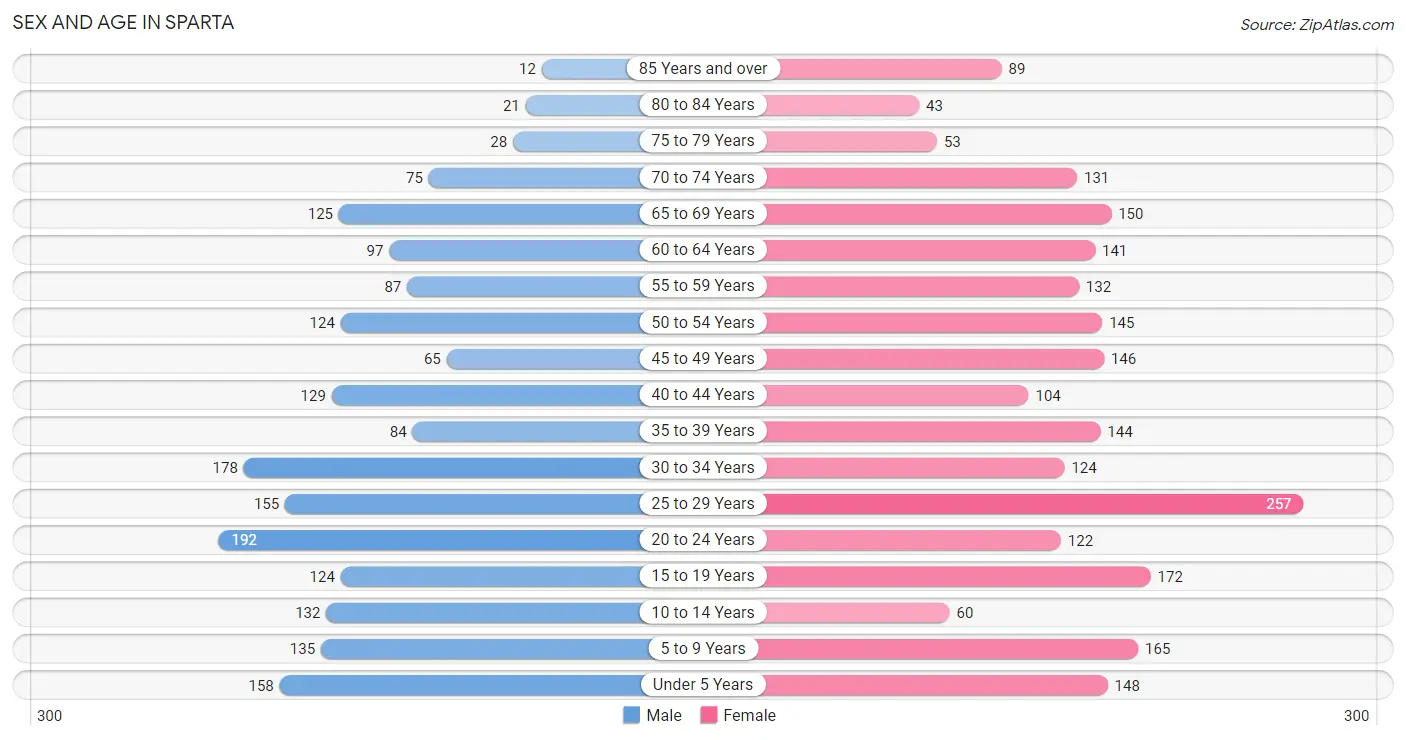
| Age Bracket | Male | Female |
| Under 5 Years | 158 (8.2%) | 148 (6.4%) |
| 5 to 9 Years | 135 (7.0%) | 165 (7.1%) |
| 10 to 14 Years | 132 (6.9%) | 60 (2.6%) |
| 15 to 19 Years | 124 (6.5%) | 172 (7.4%) |
| 20 to 24 Years | 192 (10.0%) | 122 (5.2%) |
| 25 to 29 Years | 155 (8.1%) | 257 (11.1%) |
| 30 to 34 Years | 178 (9.3%) | 124 (5.3%) |
| 35 to 39 Years | 84 (4.4%) | 144 (6.2%) |
| 40 to 44 Years | 129 (6.7%) | 104 (4.5%) |
| 45 to 49 Years | 65 (3.4%) | 146 (6.3%) |
| 50 to 54 Years | 124 (6.5%) | 145 (6.2%) |
| 55 to 59 Years | 87 (4.5%) | 132 (5.7%) |
| 60 to 64 Years | 97 (5.1%) | 141 (6.1%) |
| 65 to 69 Years | 125 (6.5%) | 150 (6.5%) |
| 70 to 74 Years | 75 (3.9%) | 131 (5.6%) |
| 75 to 79 Years | 28 (1.5%) | 53 (2.3%) |
| 80 to 84 Years | 21 (1.1%) | 43 (1.8%) |
| 85 Years and over | 12 (0.6%) | 89 (3.8%) |
| Total | 1,921 (100.0%) | 2,326 (100.0%) |
Families and Households in Sparta
Median Family Size in Sparta
The median family size in Sparta is 3.07 persons per family, with single female/mother families (273 | 25.1%) accounting for the largest median family size of 3.17 persons per family. On the other hand, single male/father families (133 | 12.2%) represent the smallest median family size with 2.51 persons per family.
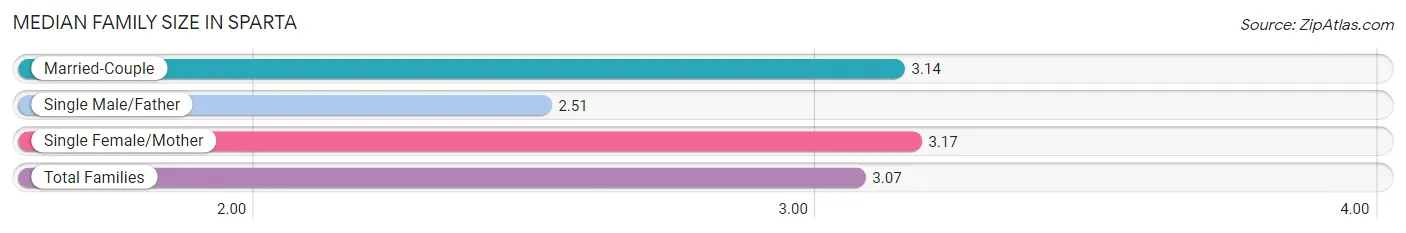
| Family Type | # Families | Family Size |
| Married-Couple | 680 (62.6%) | 3.14 |
| Single Male/Father | 133 (12.2%) | 2.51 |
| Single Female/Mother | 273 (25.1%) | 3.17 |
| Total Families | 1,086 (100.0%) | 3.07 |
Median Household Size in Sparta
The median household size in Sparta is 2.52 persons per household, with single female/mother households (273 | 16.2%) accounting for the largest median household size of 3.35 persons per household. non-family households (596 | 35.4%) represent the smallest median household size with 1.25 persons per household.
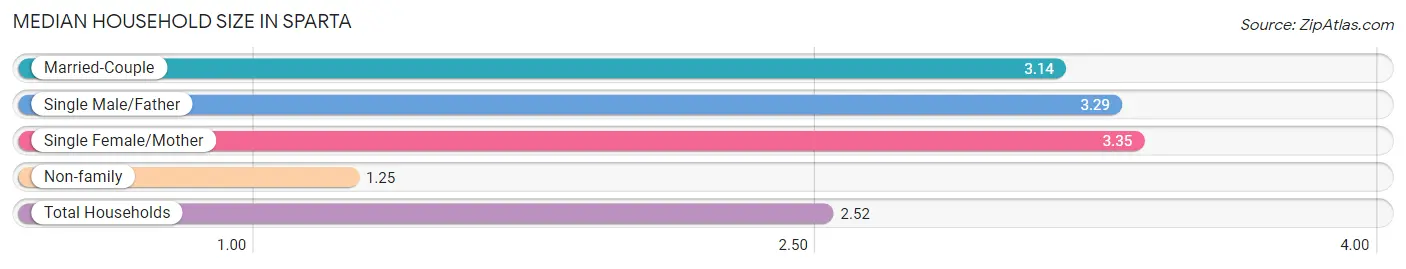
| Household Type | # Households | Household Size |
| Married-Couple | 680 (40.4%) | 3.14 |
| Single Male/Father | 133 (7.9%) | 3.29 |
| Single Female/Mother | 273 (16.2%) | 3.35 |
| Non-family | 596 (35.4%) | 1.25 |
| Total Households | 1,682 (100.0%) | 2.52 |
Household Size by Marriage Status in Sparta
Out of a total of 1,682 households in Sparta, 1,086 (64.6%) are family households, while 596 (35.4%) are nonfamily households. The most numerous type of family households are 2-person households, comprising 430, and the most common type of nonfamily households are 1-person households, comprising 505.
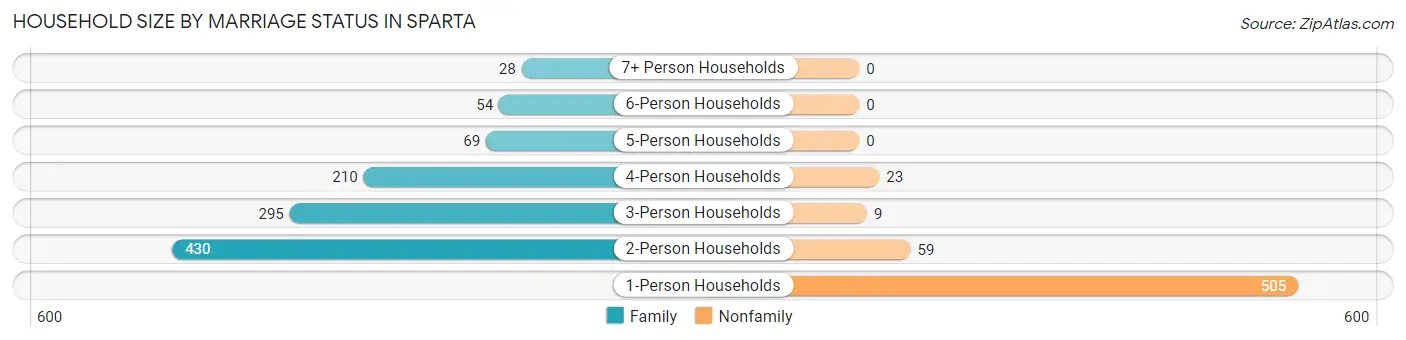
| Household Size | Family Households | Nonfamily Households |
| 1-Person Households | - | 505 (30.0%) |
| 2-Person Households | 430 (25.6%) | 59 (3.5%) |
| 3-Person Households | 295 (17.5%) | 9 (0.5%) |
| 4-Person Households | 210 (12.5%) | 23 (1.4%) |
| 5-Person Households | 69 (4.1%) | 0 (0.0%) |
| 6-Person Households | 54 (3.2%) | 0 (0.0%) |
| 7+ Person Households | 28 (1.7%) | 0 (0.0%) |
| Total | 1,086 (64.6%) | 596 (35.4%) |
Female Fertility in Sparta
Fertility by Age in Sparta
Average fertility rate in Sparta is 12.0 births per 1,000 women. Women in the age bracket of 35 to 50 years have the highest fertility rate with 16.0 births per 1,000 women. Women in the age bracket of 35 to 50 years acount for 53.8% of all women with births.
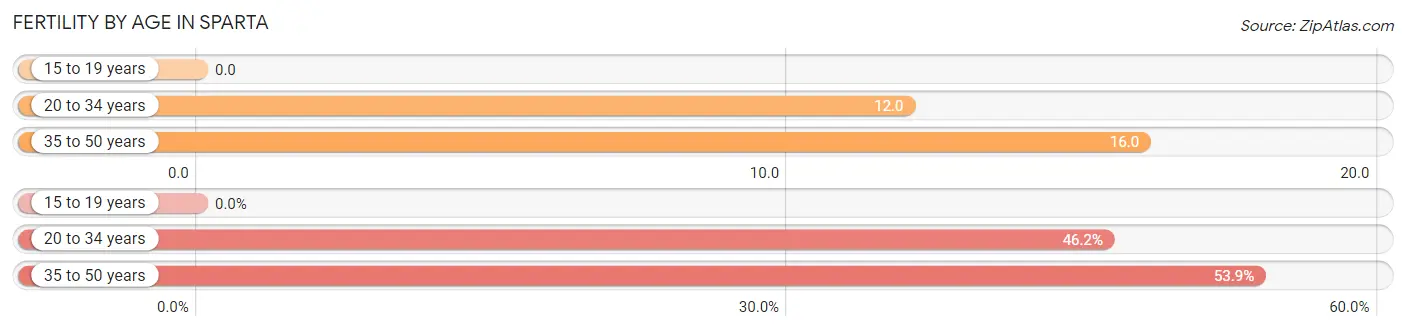
| Age Bracket | Women with Births | Births / 1,000 Women |
| 15 to 19 years | 0 (0.0%) | 0.0 |
| 20 to 34 years | 6 (46.2%) | 12.0 |
| 35 to 50 years | 7 (53.8%) | 16.0 |
| Total | 13 (100.0%) | 12.0 |
Fertility by Age by Marriage Status in Sparta
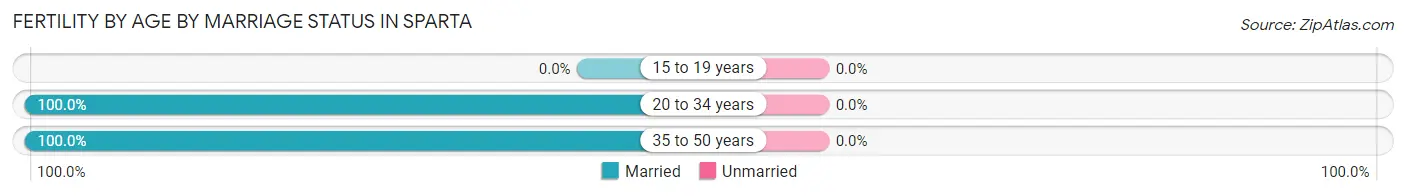
| Age Bracket | Married | Unmarried |
| 15 to 19 years | 0 (0.0%) | 0 (0.0%) |
| 20 to 34 years | 6 (100.0%) | 0 (0.0%) |
| 35 to 50 years | 7 (100.0%) | 0 (0.0%) |
| Total | 13 (100.0%) | 0 (0.0%) |
Fertility by Education in Sparta
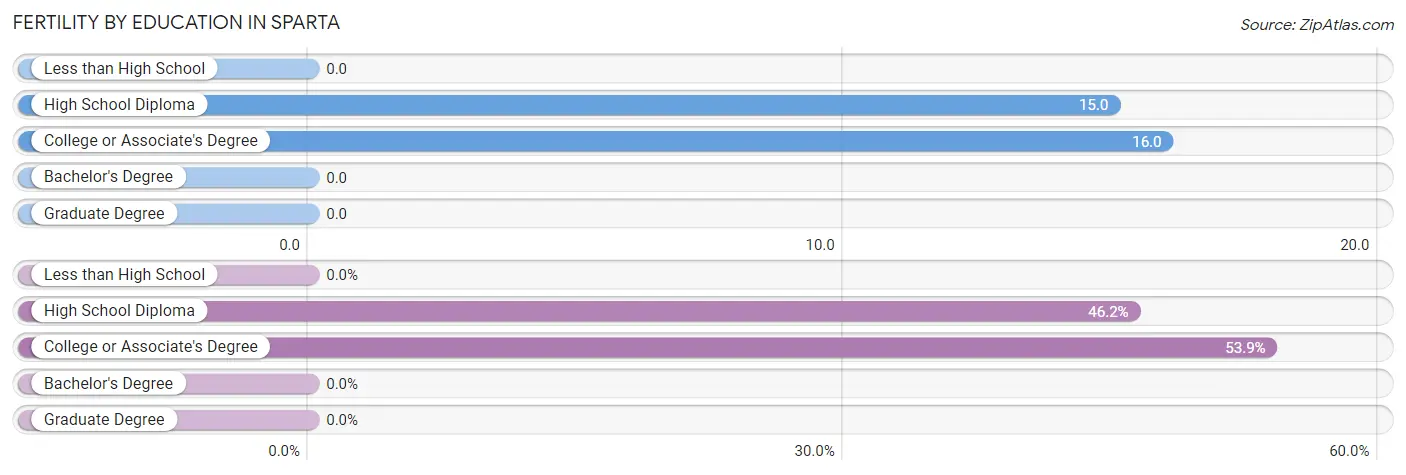
| Educational Attainment | Women with Births | Births / 1,000 Women |
| Less than High School | 0 (0.0%) | 0.0 |
| High School Diploma | 6 (46.2%) | 15.0 |
| College or Associate's Degree | 7 (53.8%) | 16.0 |
| Bachelor's Degree | 0 (0.0%) | 0.0 |
| Graduate Degree | 0 (0.0%) | 0.0 |
| Total | 13 (100.0%) | 12.0 |
Fertility by Education by Marriage Status in Sparta
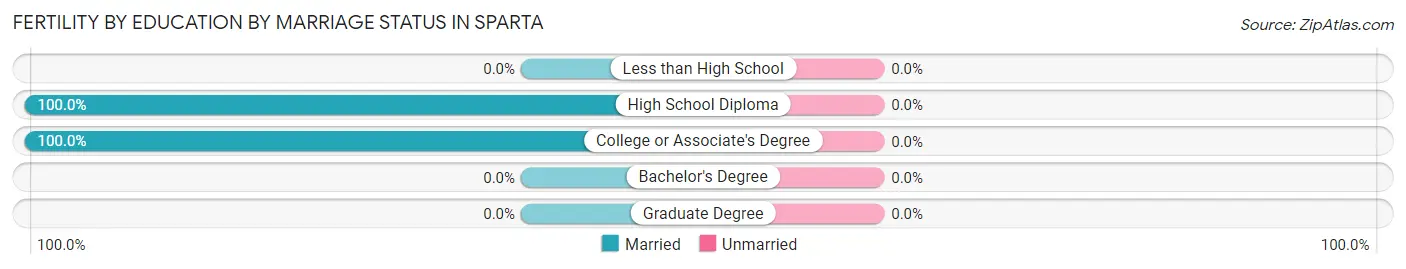
| Educational Attainment | Married | Unmarried |
| Less than High School | 0 (0.0%) | 0 (0.0%) |
| High School Diploma | 6 (100.0%) | 0 (0.0%) |
| College or Associate's Degree | 7 (100.0%) | 0 (0.0%) |
| Bachelor's Degree | 0 (0.0%) | 0 (0.0%) |
| Graduate Degree | 0 (0.0%) | 0 (0.0%) |
| Total | 13 (100.0%) | 0 (0.0%) |
Employment Characteristics in Sparta
Employment by Class of Employer in Sparta
Among the 1,940 employed individuals in Sparta, private company employees (1,608 | 82.9%), not-for-profit organizations (147 | 7.6%), and local government employees (62 | 3.2%) make up the most common classes of employment.
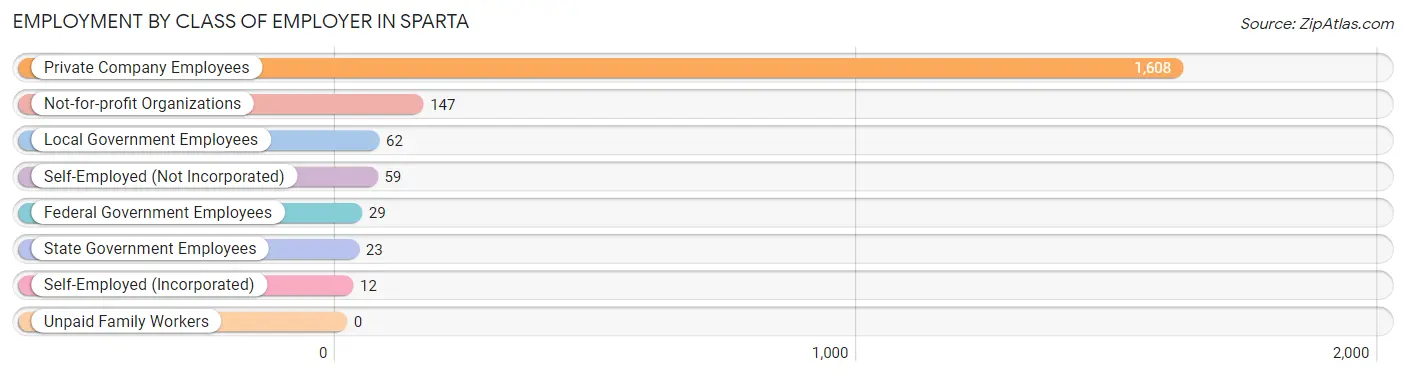
| Employer Class | # Employees | % Employees |
| Private Company Employees | 1,608 | 82.9% |
| Self-Employed (Incorporated) | 12 | 0.6% |
| Self-Employed (Not Incorporated) | 59 | 3.0% |
| Not-for-profit Organizations | 147 | 7.6% |
| Local Government Employees | 62 | 3.2% |
| State Government Employees | 23 | 1.2% |
| Federal Government Employees | 29 | 1.5% |
| Unpaid Family Workers | 0 | 0.0% |
| Total | 1,940 | 100.0% |
Employment Status by Age in Sparta
According to the labor force statistics for Sparta, out of the total population over 16 years of age (3,404), 59.5% or 2,025 individuals are in the labor force, with 3.6% or 73 of them unemployed. The age group with the highest labor force participation rate is 45 to 54 years, with 100.0% or 480 individuals in the labor force. Within the labor force, the 45 to 54 years age range has the highest percentage of unemployed individuals, with 12.7% or 61 of them being unemployed.
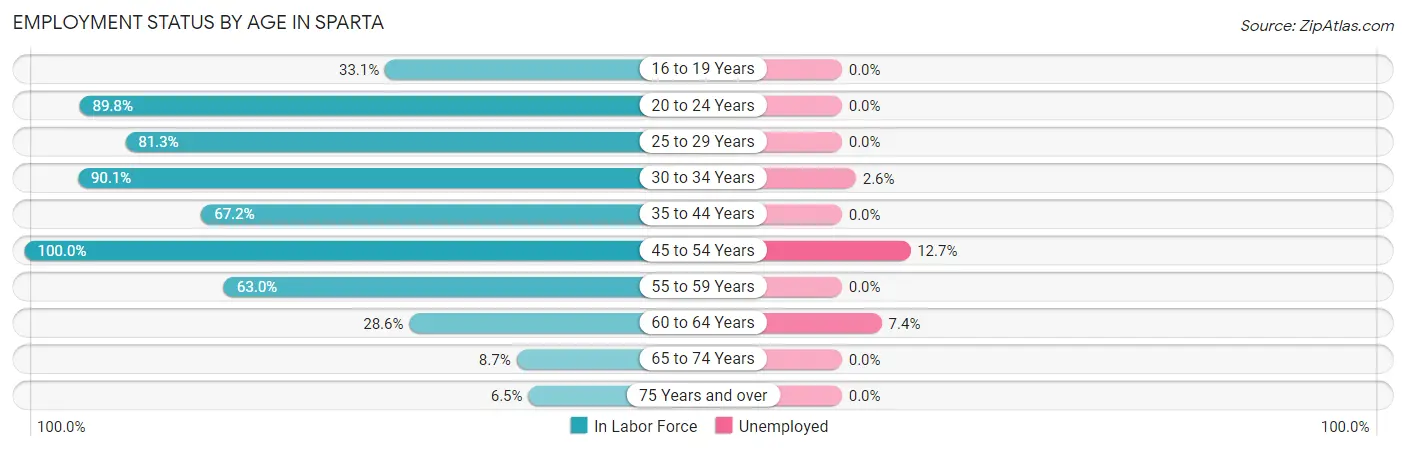
| Age Bracket | In Labor Force | Unemployed |
| 16 to 19 Years | 83 (33.1%) | 0 (0.0%) |
| 20 to 24 Years | 282 (89.8%) | 0 (0.0%) |
| 25 to 29 Years | 335 (81.3%) | 0 (0.0%) |
| 30 to 34 Years | 272 (90.1%) | 7 (2.6%) |
| 35 to 44 Years | 310 (67.2%) | 0 (0.0%) |
| 45 to 54 Years | 480 (100.0%) | 61 (12.7%) |
| 55 to 59 Years | 138 (63.0%) | 0 (0.0%) |
| 60 to 64 Years | 68 (28.6%) | 5 (7.4%) |
| 65 to 74 Years | 42 (8.7%) | 0 (0.0%) |
| 75 Years and over | 16 (6.5%) | 0 (0.0%) |
| Total | 2,025 (59.5%) | 73 (3.6%) |
Employment Status by Educational Attainment in Sparta
According to labor force statistics for Sparta, 75.9% of individuals (1,603) out of the total population between 25 and 64 years of age (2,112) are in the labor force, with 4.6% or 74 of them being unemployed. The group with the highest labor force participation rate are those with the educational attainment of bachelor's degree or higher, with 90.7% or 340 individuals in the labor force. Within the labor force, individuals with less than high school education have the highest percentage of unemployment, with 50.0% or 33 of them being unemployed.
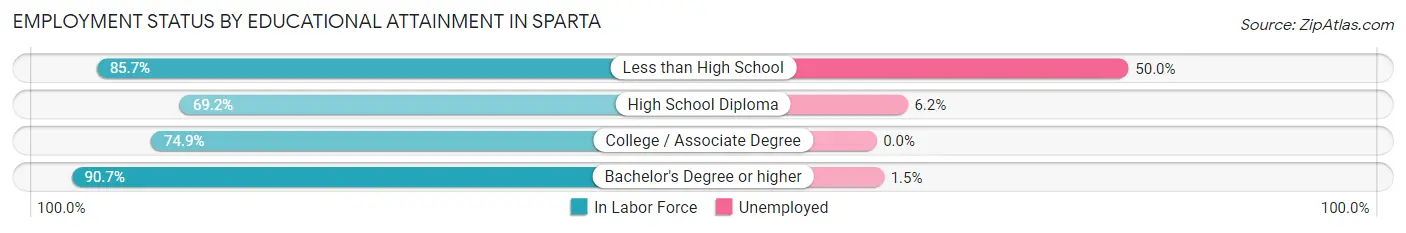
| Educational Attainment | In Labor Force | Unemployed |
| Less than High School | 66 (85.7%) | 38 (50.0%) |
| High School Diploma | 566 (69.2%) | 51 (6.2%) |
| College / Associate Degree | 631 (74.9%) | 0 (0.0%) |
| Bachelor's Degree or higher | 340 (90.7%) | 6 (1.5%) |
| Total | 1,603 (75.9%) | 97 (4.6%) |
Employment Occupations by Sex in Sparta
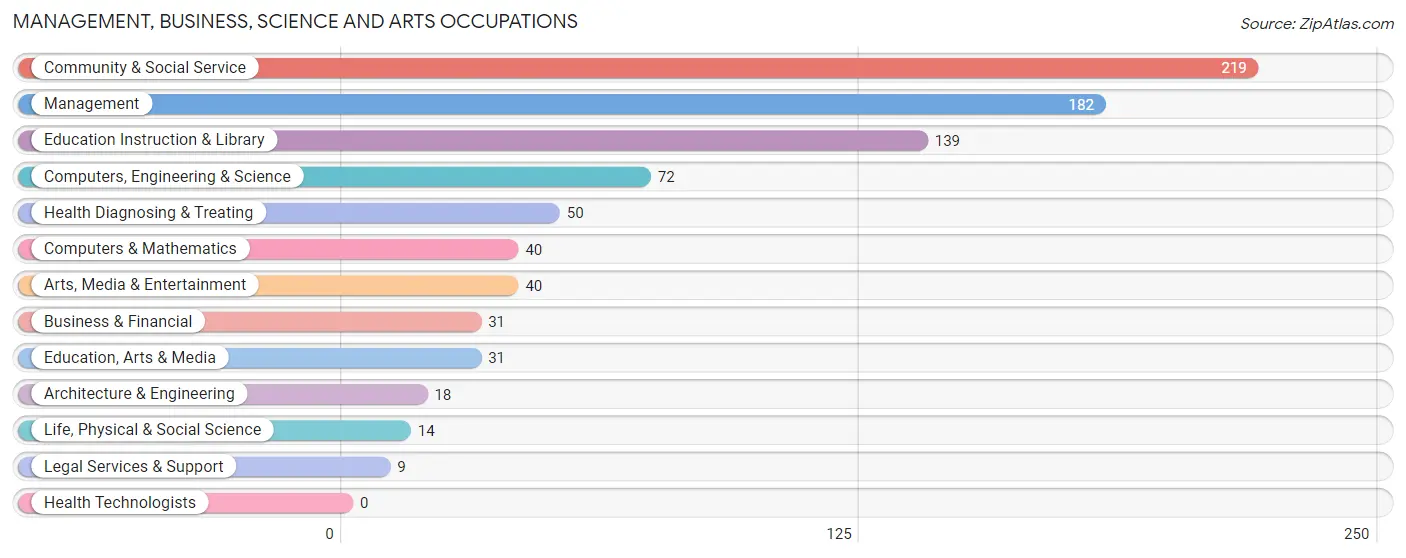
Management, Business, Science and Arts Occupations
The most common Management, Business, Science and Arts occupations in Sparta are Community & Social Service (219 | 11.2%), Management (182 | 9.3%), Education Instruction & Library (139 | 7.1%), Computers, Engineering & Science (72 | 3.7%), and Health Diagnosing & Treating (50 | 2.6%).
Management, Business, Science and Arts Occupations by Sex
Within the Management, Business, Science and Arts occupations in Sparta, the most male-oriented occupations are Architecture & Engineering (100.0%), Computers & Mathematics (60.0%), and Computers, Engineering & Science (58.3%), while the most female-oriented occupations are Business & Financial (100.0%), Life, Physical & Social Science (100.0%), and Education, Arts & Media (100.0%).
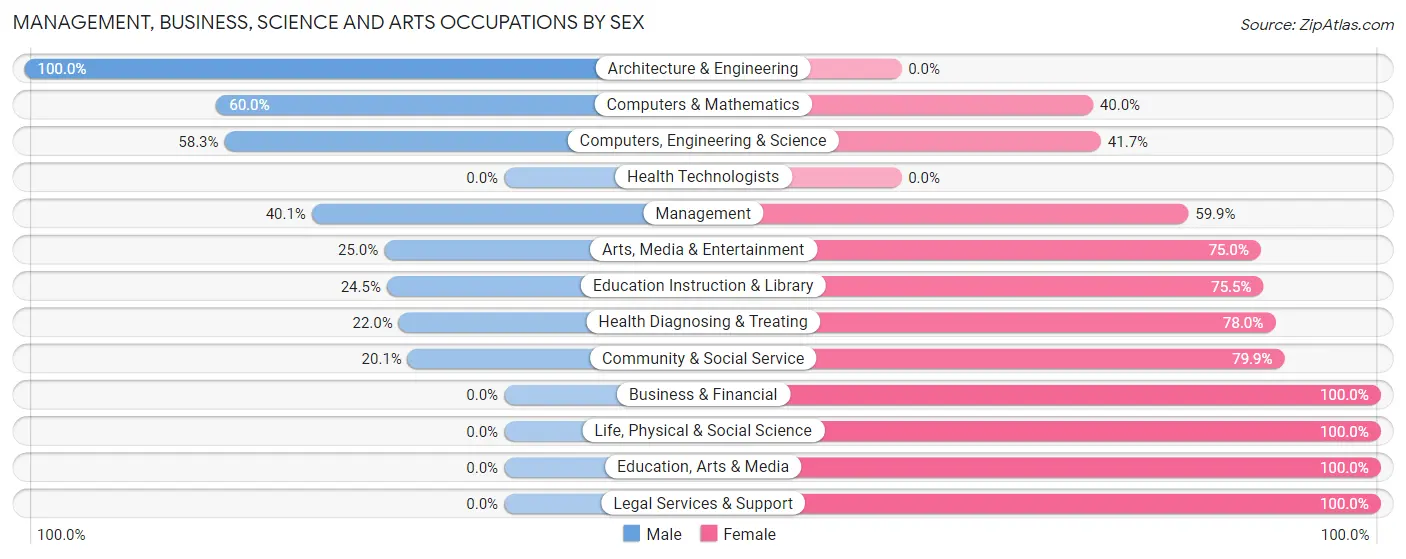
| Occupation | Male | Female |
| Management | 73 (40.1%) | 109 (59.9%) |
| Business & Financial | 0 (0.0%) | 31 (100.0%) |
| Computers, Engineering & Science | 42 (58.3%) | 30 (41.7%) |
| Computers & Mathematics | 24 (60.0%) | 16 (40.0%) |
| Architecture & Engineering | 18 (100.0%) | 0 (0.0%) |
| Life, Physical & Social Science | 0 (0.0%) | 14 (100.0%) |
| Community & Social Service | 44 (20.1%) | 175 (79.9%) |
| Education, Arts & Media | 0 (0.0%) | 31 (100.0%) |
| Legal Services & Support | 0 (0.0%) | 9 (100.0%) |
| Education Instruction & Library | 34 (24.5%) | 105 (75.5%) |
| Arts, Media & Entertainment | 10 (25.0%) | 30 (75.0%) |
| Health Diagnosing & Treating | 11 (22.0%) | 39 (78.0%) |
| Health Technologists | 0 (0.0%) | 0 (0.0%) |
| Total (Category) | 170 (30.7%) | 384 (69.3%) |
| Total (Overall) | 924 (47.3%) | 1,029 (52.7%) |
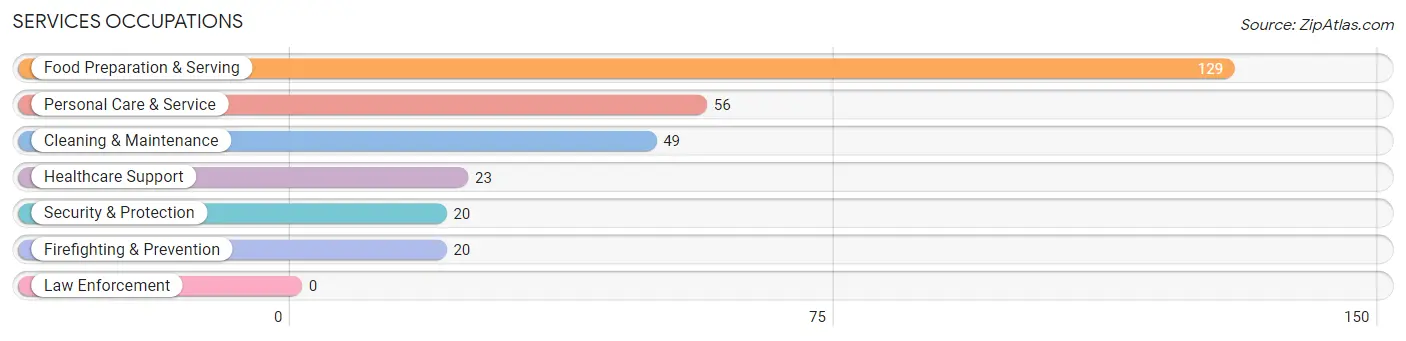
Services Occupations
The most common Services occupations in Sparta are Food Preparation & Serving (129 | 6.6%), Personal Care & Service (56 | 2.9%), Cleaning & Maintenance (49 | 2.5%), Healthcare Support (23 | 1.2%), and Security & Protection (20 | 1.0%).
Services Occupations by Sex
Within the Services occupations in Sparta, the most male-oriented occupations are Security & Protection (100.0%), Firefighting & Prevention (100.0%), and Cleaning & Maintenance (65.3%), while the most female-oriented occupations are Personal Care & Service (100.0%), Food Preparation & Serving (67.4%), and Healthcare Support (60.9%).
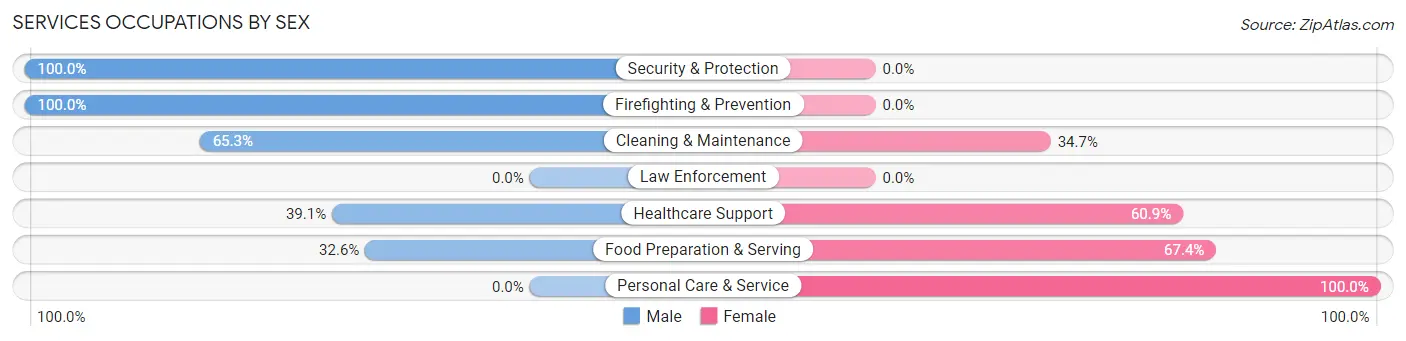
| Occupation | Male | Female |
| Healthcare Support | 9 (39.1%) | 14 (60.9%) |
| Security & Protection | 20 (100.0%) | 0 (0.0%) |
| Firefighting & Prevention | 20 (100.0%) | 0 (0.0%) |
| Law Enforcement | 0 (0.0%) | 0 (0.0%) |
| Food Preparation & Serving | 42 (32.6%) | 87 (67.4%) |
| Cleaning & Maintenance | 32 (65.3%) | 17 (34.7%) |
| Personal Care & Service | 0 (0.0%) | 56 (100.0%) |
| Total (Category) | 103 (37.2%) | 174 (62.8%) |
| Total (Overall) | 924 (47.3%) | 1,029 (52.7%) |
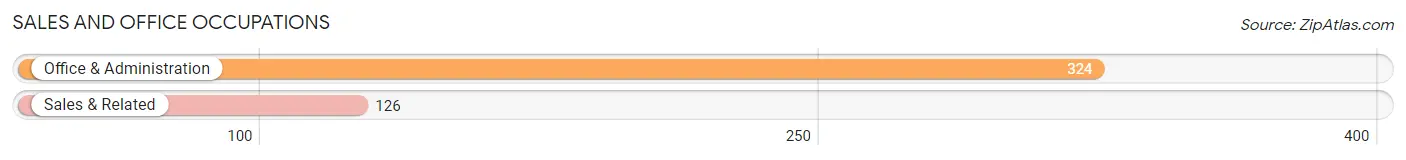
Sales and Office Occupations
The most common Sales and Office occupations in Sparta are Office & Administration (324 | 16.6%), and Sales & Related (126 | 6.5%).
Sales and Office Occupations by Sex
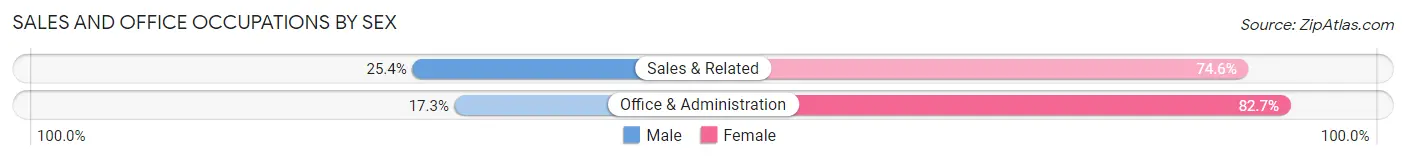
| Occupation | Male | Female |
| Sales & Related | 32 (25.4%) | 94 (74.6%) |
| Office & Administration | 56 (17.3%) | 268 (82.7%) |
| Total (Category) | 88 (19.6%) | 362 (80.4%) |
| Total (Overall) | 924 (47.3%) | 1,029 (52.7%) |
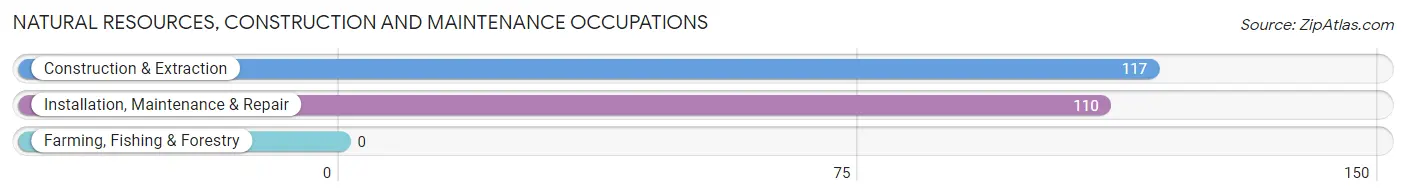
Natural Resources, Construction and Maintenance Occupations
The most common Natural Resources, Construction and Maintenance occupations in Sparta are Construction & Extraction (117 | 6.0%), and Installation, Maintenance & Repair (110 | 5.6%).
Natural Resources, Construction and Maintenance Occupations by Sex
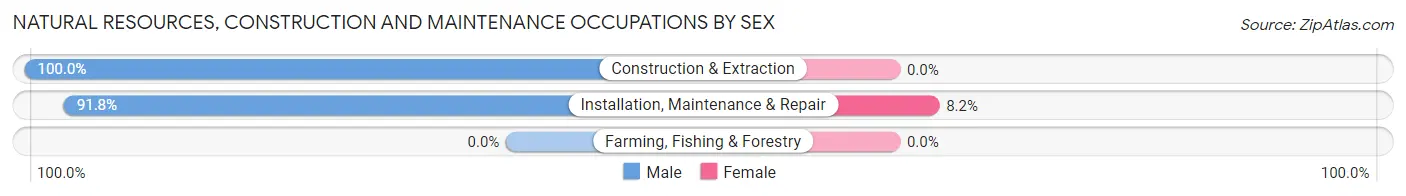
| Occupation | Male | Female |
| Farming, Fishing & Forestry | 0 (0.0%) | 0 (0.0%) |
| Construction & Extraction | 117 (100.0%) | 0 (0.0%) |
| Installation, Maintenance & Repair | 101 (91.8%) | 9 (8.2%) |
| Total (Category) | 218 (96.0%) | 9 (4.0%) |
| Total (Overall) | 924 (47.3%) | 1,029 (52.7%) |
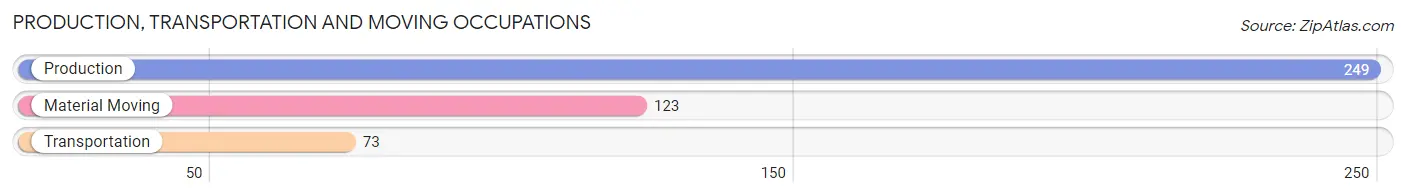
Production, Transportation and Moving Occupations
The most common Production, Transportation and Moving occupations in Sparta are Production (249 | 12.8%), Material Moving (123 | 6.3%), and Transportation (73 | 3.7%).
Production, Transportation and Moving Occupations by Sex
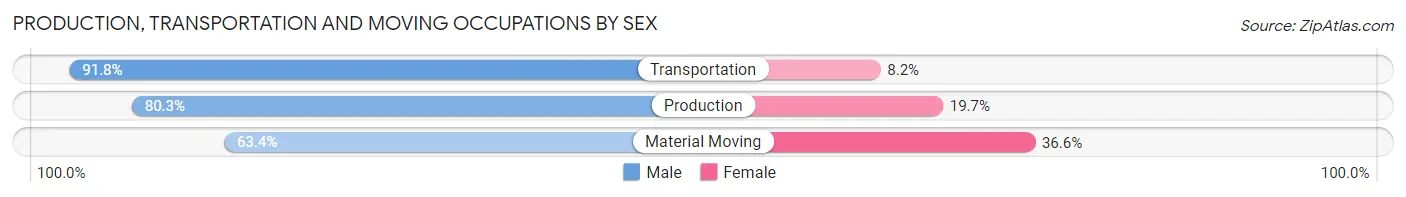
| Occupation | Male | Female |
| Production | 200 (80.3%) | 49 (19.7%) |
| Transportation | 67 (91.8%) | 6 (8.2%) |
| Material Moving | 78 (63.4%) | 45 (36.6%) |
| Total (Category) | 345 (77.5%) | 100 (22.5%) |
| Total (Overall) | 924 (47.3%) | 1,029 (52.7%) |
Employment Industries by Sex in Sparta
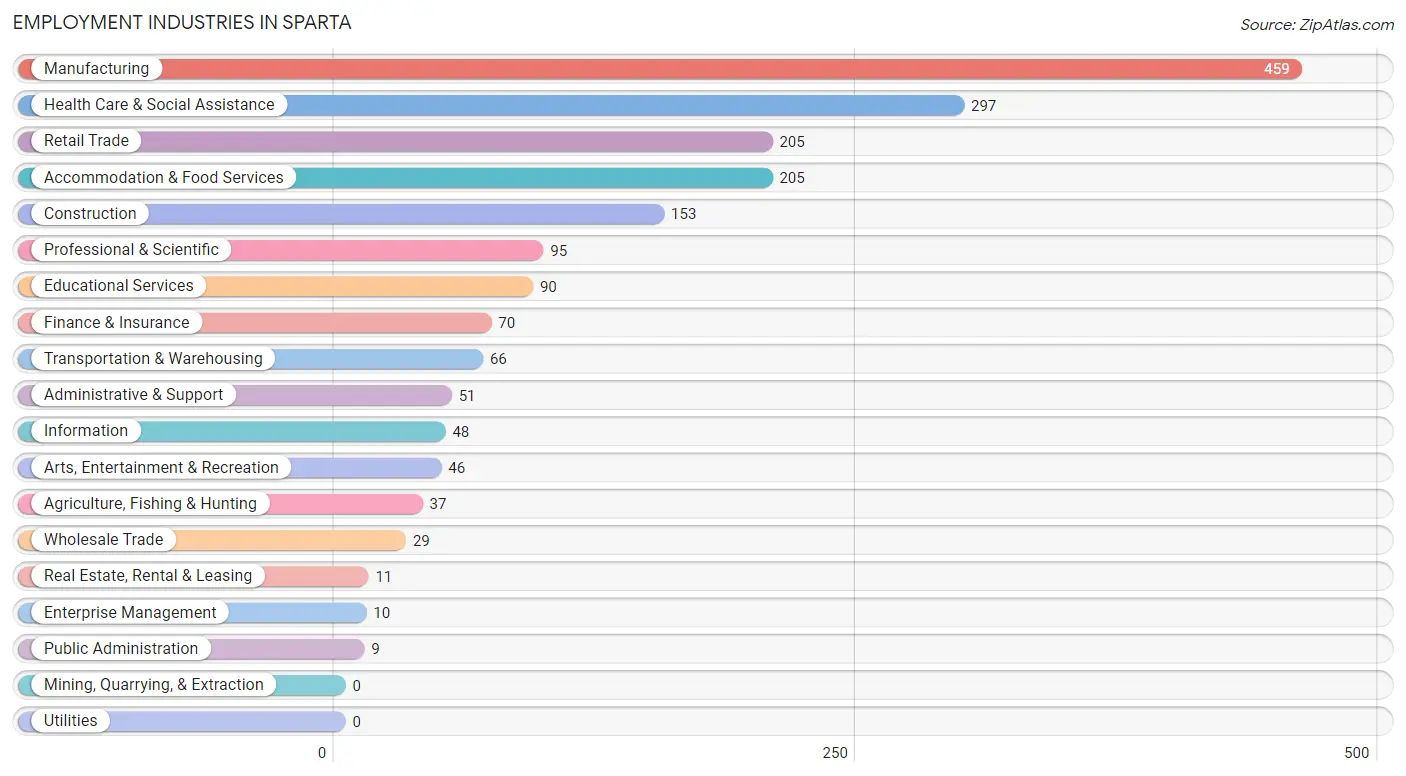
Employment Industries in Sparta
The major employment industries in Sparta include Manufacturing (459 | 23.5%), Health Care & Social Assistance (297 | 15.2%), Retail Trade (205 | 10.5%), Accommodation & Food Services (205 | 10.5%), and Construction (153 | 7.8%).
Employment Industries by Sex in Sparta
The Sparta industries that see more men than women are Real Estate, Rental & Leasing (100.0%), Public Administration (100.0%), and Construction (96.1%), whereas the industries that tend to have a higher number of women are Wholesale Trade (100.0%), Professional & Scientific (100.0%), and Enterprise Management (100.0%).
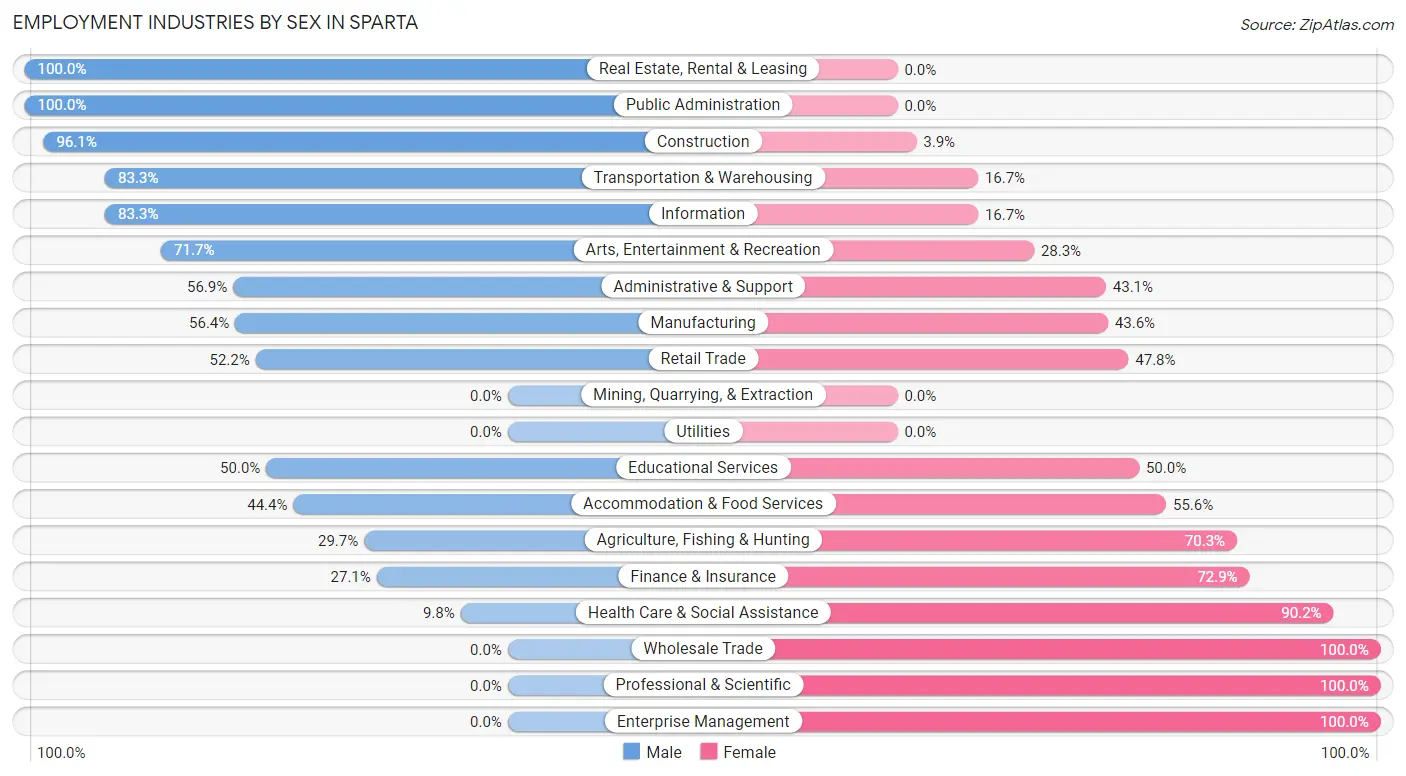
| Industry | Male | Female |
| Agriculture, Fishing & Hunting | 11 (29.7%) | 26 (70.3%) |
| Mining, Quarrying, & Extraction | 0 (0.0%) | 0 (0.0%) |
| Construction | 147 (96.1%) | 6 (3.9%) |
| Manufacturing | 259 (56.4%) | 200 (43.6%) |
| Wholesale Trade | 0 (0.0%) | 29 (100.0%) |
| Retail Trade | 107 (52.2%) | 98 (47.8%) |
| Transportation & Warehousing | 55 (83.3%) | 11 (16.7%) |
| Utilities | 0 (0.0%) | 0 (0.0%) |
| Information | 40 (83.3%) | 8 (16.7%) |
| Finance & Insurance | 19 (27.1%) | 51 (72.9%) |
| Real Estate, Rental & Leasing | 11 (100.0%) | 0 (0.0%) |
| Professional & Scientific | 0 (0.0%) | 95 (100.0%) |
| Enterprise Management | 0 (0.0%) | 10 (100.0%) |
| Administrative & Support | 29 (56.9%) | 22 (43.1%) |
| Educational Services | 45 (50.0%) | 45 (50.0%) |
| Health Care & Social Assistance | 29 (9.8%) | 268 (90.2%) |
| Arts, Entertainment & Recreation | 33 (71.7%) | 13 (28.3%) |
| Accommodation & Food Services | 91 (44.4%) | 114 (55.6%) |
| Public Administration | 9 (100.0%) | 0 (0.0%) |
| Total | 924 (47.3%) | 1,029 (52.7%) |
Education in Sparta
School Enrollment in Sparta
The most common levels of schooling among the 974 students in Sparta are high school (283 | 29.1%), elementary school (200 | 20.5%), and middle school (179 | 18.4%).
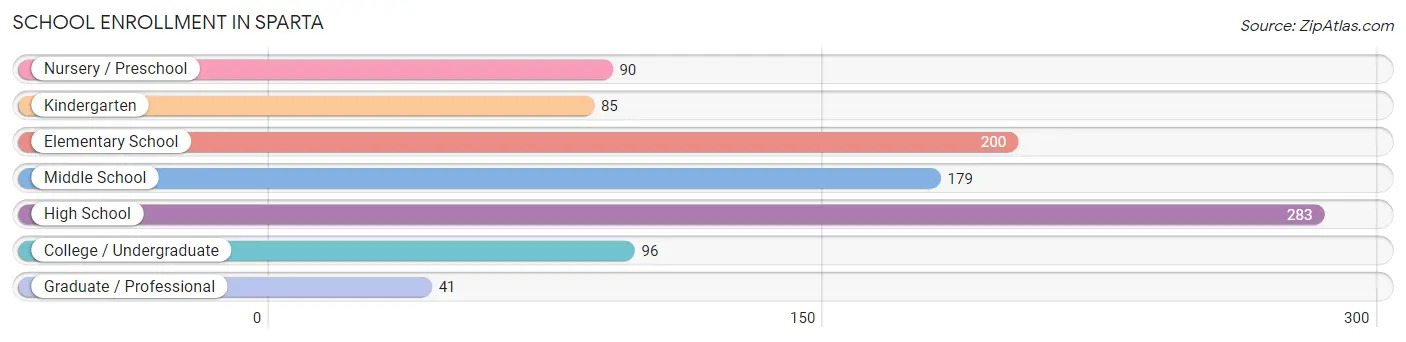
| School Level | # Students | % Students |
| Nursery / Preschool | 90 | 9.2% |
| Kindergarten | 85 | 8.7% |
| Elementary School | 200 | 20.5% |
| Middle School | 179 | 18.4% |
| High School | 283 | 29.1% |
| College / Undergraduate | 96 | 9.9% |
| Graduate / Professional | 41 | 4.2% |
| Total | 974 | 100.0% |
School Enrollment by Age by Funding Source in Sparta
Out of a total of 974 students who are enrolled in schools in Sparta, 108 (11.1%) attend a private institution, while the remaining 866 (88.9%) are enrolled in public schools. The age group of 20 to 24 year olds has the highest likelihood of being enrolled in private schools, with 26 (51.0% in the age bracket) enrolled. Conversely, the age group of 3 to 4 year olds has the lowest likelihood of being enrolled in a private school, with 69 (100.0% in the age bracket) attending a public institution.
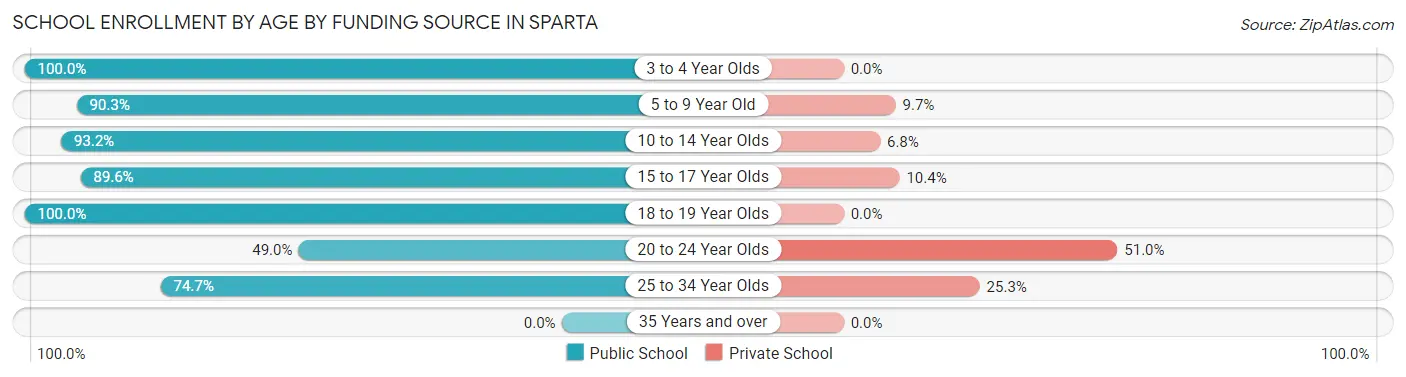
| Age Bracket | Public School | Private School |
| 3 to 4 Year Olds | 69 (100.0%) | 0 (0.0%) |
| 5 to 9 Year Old | 271 (90.3%) | 29 (9.7%) |
| 10 to 14 Year Olds | 179 (93.2%) | 13 (6.8%) |
| 15 to 17 Year Olds | 181 (89.6%) | 21 (10.4%) |
| 18 to 19 Year Olds | 85 (100.0%) | 0 (0.0%) |
| 20 to 24 Year Olds | 25 (49.0%) | 26 (51.0%) |
| 25 to 34 Year Olds | 56 (74.7%) | 19 (25.3%) |
| 35 Years and over | 0 (0.0%) | 0 (0.0%) |
| Total | 866 (88.9%) | 108 (11.1%) |
Educational Attainment by Field of Study in Sparta
Business (115 | 21.4%), education (98 | 18.2%), science & technology (42 | 7.8%), arts & humanities (42 | 7.8%), and computers & mathematics (39 | 7.3%) are the most common fields of study among 537 individuals in Sparta who have obtained a bachelor's degree or higher.
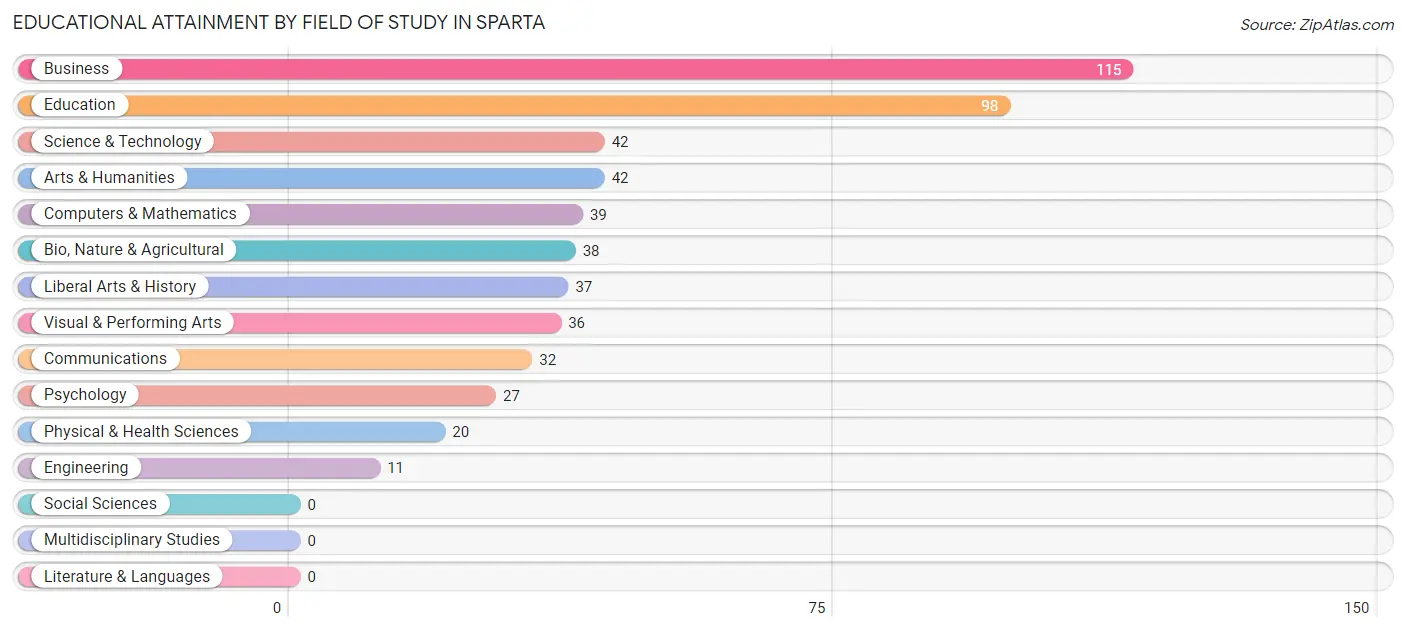
| Field of Study | # Graduates | % Graduates |
| Computers & Mathematics | 39 | 7.3% |
| Bio, Nature & Agricultural | 38 | 7.1% |
| Physical & Health Sciences | 20 | 3.7% |
| Psychology | 27 | 5.0% |
| Social Sciences | 0 | 0.0% |
| Engineering | 11 | 2.1% |
| Multidisciplinary Studies | 0 | 0.0% |
| Science & Technology | 42 | 7.8% |
| Business | 115 | 21.4% |
| Education | 98 | 18.2% |
| Literature & Languages | 0 | 0.0% |
| Liberal Arts & History | 37 | 6.9% |
| Visual & Performing Arts | 36 | 6.7% |
| Communications | 32 | 6.0% |
| Arts & Humanities | 42 | 7.8% |
| Total | 537 | 100.0% |
Transportation & Commute in Sparta
Vehicle Availability by Sex in Sparta
The most prevalent vehicle ownership categories in Sparta are males with 2 vehicles (358, accounting for 38.7%) and females with 2 vehicles (359, making up 35.2%).

| Vehicles Available | Male | Female |
| No Vehicle | 7 (0.8%) | 18 (1.8%) |
| 1 Vehicle | 145 (15.7%) | 240 (23.6%) |
| 2 Vehicles | 358 (38.7%) | 359 (35.3%) |
| 3 Vehicles | 330 (35.7%) | 295 (29.0%) |
| 4 Vehicles | 38 (4.1%) | 75 (7.4%) |
| 5 or more Vehicles | 46 (5.0%) | 29 (2.9%) |
| Total | 924 (100.0%) | 1,016 (100.0%) |
Commute Time in Sparta
The most frequently occuring commute durations in Sparta are 30 to 34 minutes (363 commuters, 20.6%), 20 to 24 minutes (348 commuters, 19.8%), and 15 to 19 minutes (194 commuters, 11.0%).
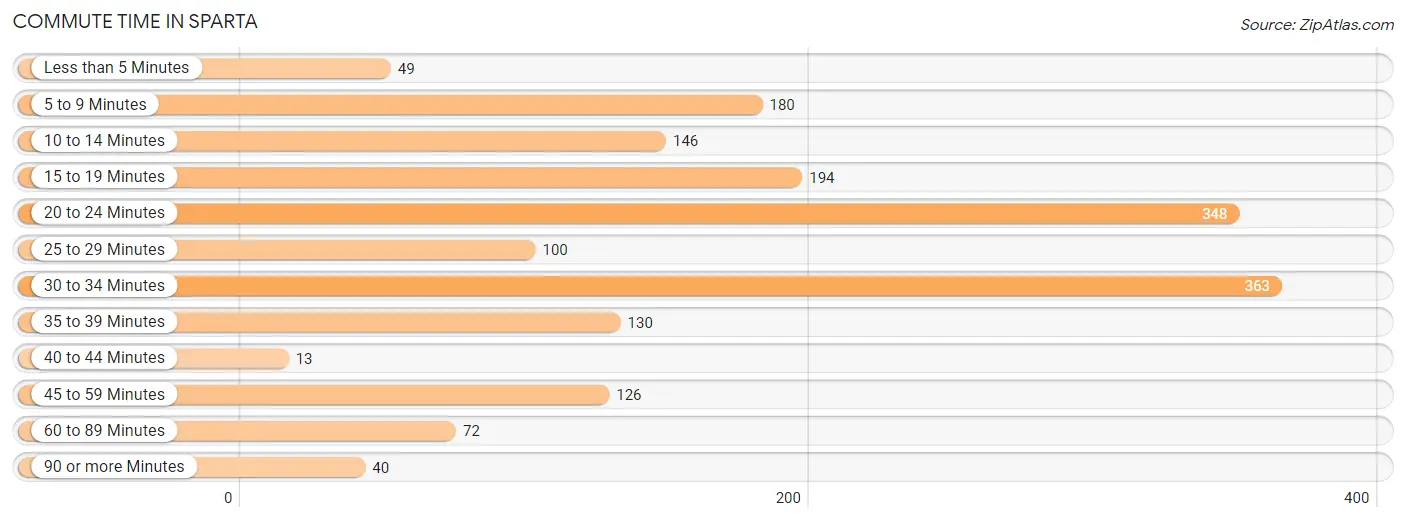
| Commute Time | # Commuters | % Commuters |
| Less than 5 Minutes | 49 | 2.8% |
| 5 to 9 Minutes | 180 | 10.2% |
| 10 to 14 Minutes | 146 | 8.3% |
| 15 to 19 Minutes | 194 | 11.0% |
| 20 to 24 Minutes | 348 | 19.8% |
| 25 to 29 Minutes | 100 | 5.7% |
| 30 to 34 Minutes | 363 | 20.6% |
| 35 to 39 Minutes | 130 | 7.4% |
| 40 to 44 Minutes | 13 | 0.7% |
| 45 to 59 Minutes | 126 | 7.2% |
| 60 to 89 Minutes | 72 | 4.1% |
| 90 or more Minutes | 40 | 2.3% |
Commute Time by Sex in Sparta
The most common commute times in Sparta are 30 to 34 minutes (178 commuters, 20.5%) for males and 20 to 24 minutes (242 commuters, 27.1%) for females.
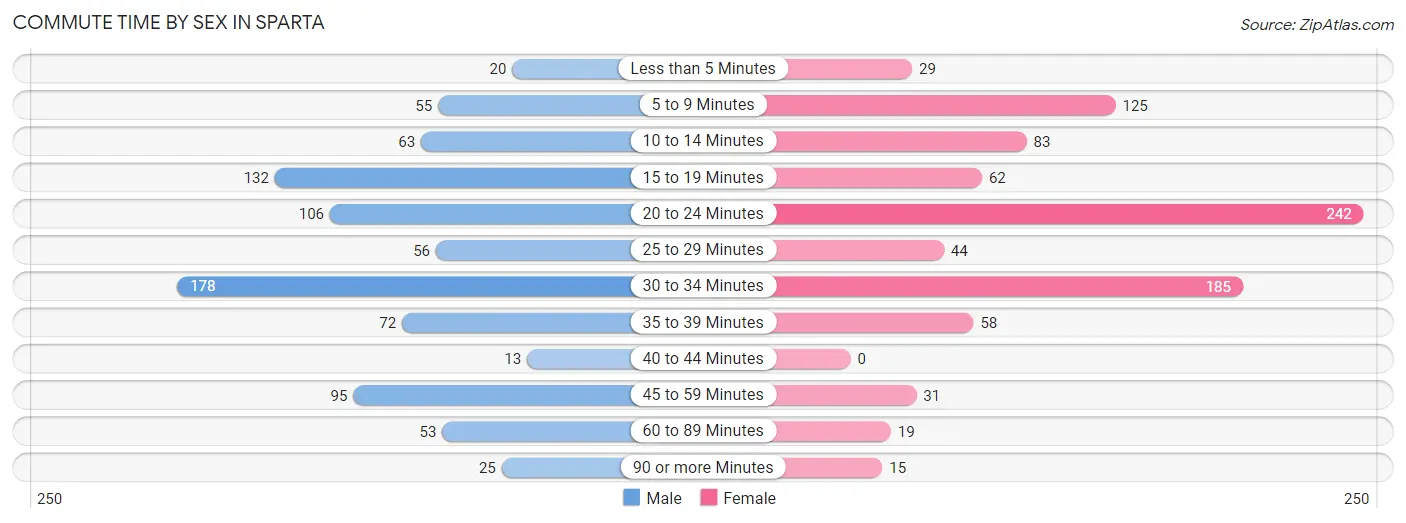
| Commute Time | Male | Female |
| Less than 5 Minutes | 20 (2.3%) | 29 (3.3%) |
| 5 to 9 Minutes | 55 (6.3%) | 125 (14.0%) |
| 10 to 14 Minutes | 63 (7.3%) | 83 (9.3%) |
| 15 to 19 Minutes | 132 (15.2%) | 62 (6.9%) |
| 20 to 24 Minutes | 106 (12.2%) | 242 (27.1%) |
| 25 to 29 Minutes | 56 (6.5%) | 44 (4.9%) |
| 30 to 34 Minutes | 178 (20.5%) | 185 (20.7%) |
| 35 to 39 Minutes | 72 (8.3%) | 58 (6.5%) |
| 40 to 44 Minutes | 13 (1.5%) | 0 (0.0%) |
| 45 to 59 Minutes | 95 (10.9%) | 31 (3.5%) |
| 60 to 89 Minutes | 53 (6.1%) | 19 (2.1%) |
| 90 or more Minutes | 25 (2.9%) | 15 (1.7%) |
Time of Departure to Work by Sex in Sparta
The most frequent times of departure to work in Sparta are 7:00 AM to 7:29 AM (103, 11.9%) for males and 7:00 AM to 7:29 AM (191, 21.4%) for females.
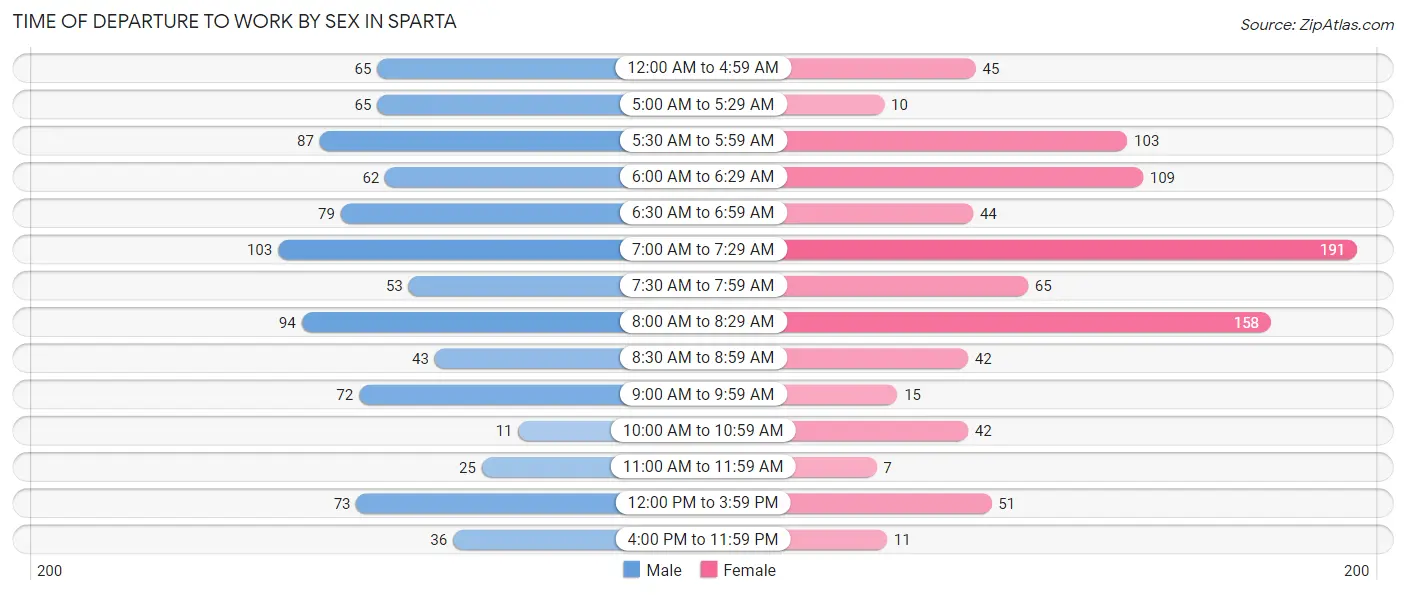
| Time of Departure | Male | Female |
| 12:00 AM to 4:59 AM | 65 (7.5%) | 45 (5.0%) |
| 5:00 AM to 5:29 AM | 65 (7.5%) | 10 (1.1%) |
| 5:30 AM to 5:59 AM | 87 (10.0%) | 103 (11.5%) |
| 6:00 AM to 6:29 AM | 62 (7.1%) | 109 (12.2%) |
| 6:30 AM to 6:59 AM | 79 (9.1%) | 44 (4.9%) |
| 7:00 AM to 7:29 AM | 103 (11.9%) | 191 (21.4%) |
| 7:30 AM to 7:59 AM | 53 (6.1%) | 65 (7.3%) |
| 8:00 AM to 8:29 AM | 94 (10.8%) | 158 (17.7%) |
| 8:30 AM to 8:59 AM | 43 (5.0%) | 42 (4.7%) |
| 9:00 AM to 9:59 AM | 72 (8.3%) | 15 (1.7%) |
| 10:00 AM to 10:59 AM | 11 (1.3%) | 42 (4.7%) |
| 11:00 AM to 11:59 AM | 25 (2.9%) | 7 (0.8%) |
| 12:00 PM to 3:59 PM | 73 (8.4%) | 51 (5.7%) |
| 4:00 PM to 11:59 PM | 36 (4.2%) | 11 (1.2%) |
| Total | 868 (100.0%) | 893 (100.0%) |
Housing Occupancy in Sparta
Occupancy by Ownership in Sparta
Of the total 1,682 dwellings in Sparta, owner-occupied units account for 1,172 (69.7%), while renter-occupied units make up 510 (30.3%).
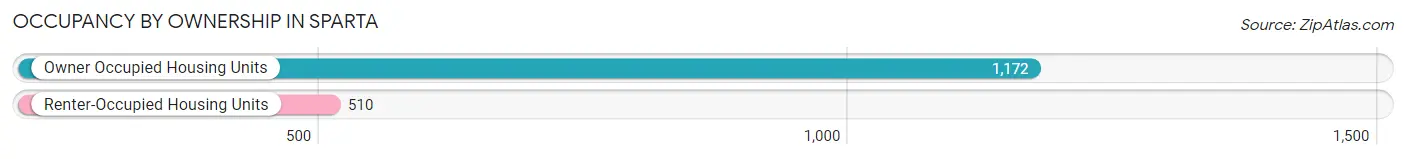
| Occupancy | # Housing Units | % Housing Units |
| Owner Occupied Housing Units | 1,172 | 69.7% |
| Renter-Occupied Housing Units | 510 | 30.3% |
| Total Occupied Housing Units | 1,682 | 100.0% |
Occupancy by Household Size in Sparta
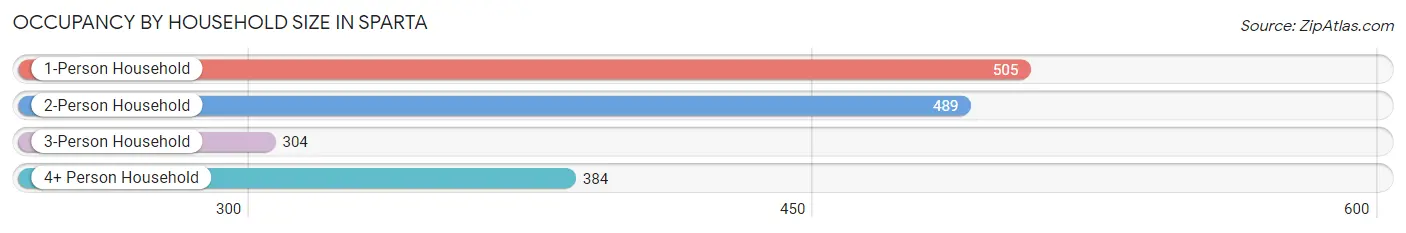
| Household Size | # Housing Units | % Housing Units |
| 1-Person Household | 505 | 30.0% |
| 2-Person Household | 489 | 29.1% |
| 3-Person Household | 304 | 18.1% |
| 4+ Person Household | 384 | 22.8% |
| Total Housing Units | 1,682 | 100.0% |
Occupancy by Ownership by Household Size in Sparta
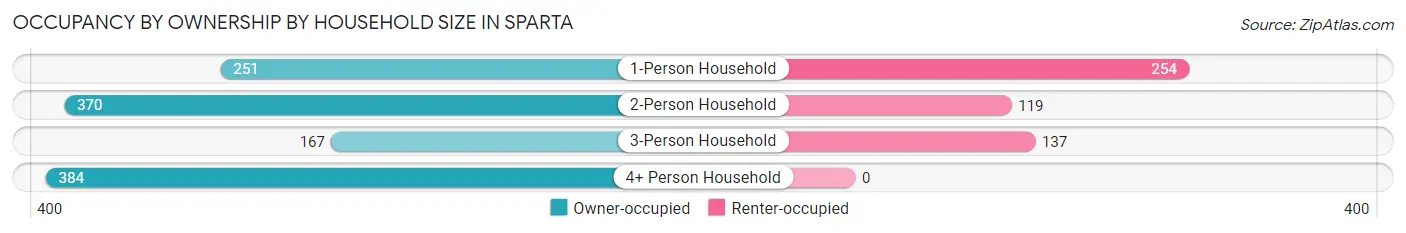
| Household Size | Owner-occupied | Renter-occupied |
| 1-Person Household | 251 (49.7%) | 254 (50.3%) |
| 2-Person Household | 370 (75.7%) | 119 (24.3%) |
| 3-Person Household | 167 (54.9%) | 137 (45.1%) |
| 4+ Person Household | 384 (100.0%) | 0 (0.0%) |
| Total Housing Units | 1,172 (69.7%) | 510 (30.3%) |
Occupancy by Educational Attainment in Sparta
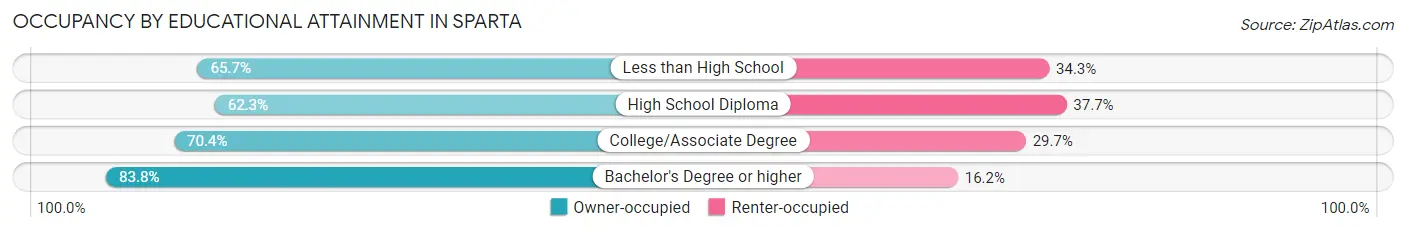
| Household Size | Owner-occupied | Renter-occupied |
| Less than High School | 46 (65.7%) | 24 (34.3%) |
| High School Diploma | 383 (62.3%) | 232 (37.7%) |
| College/Associate Degree | 484 (70.4%) | 204 (29.6%) |
| Bachelor's Degree or higher | 259 (83.8%) | 50 (16.2%) |
Occupancy by Age of Householder in Sparta
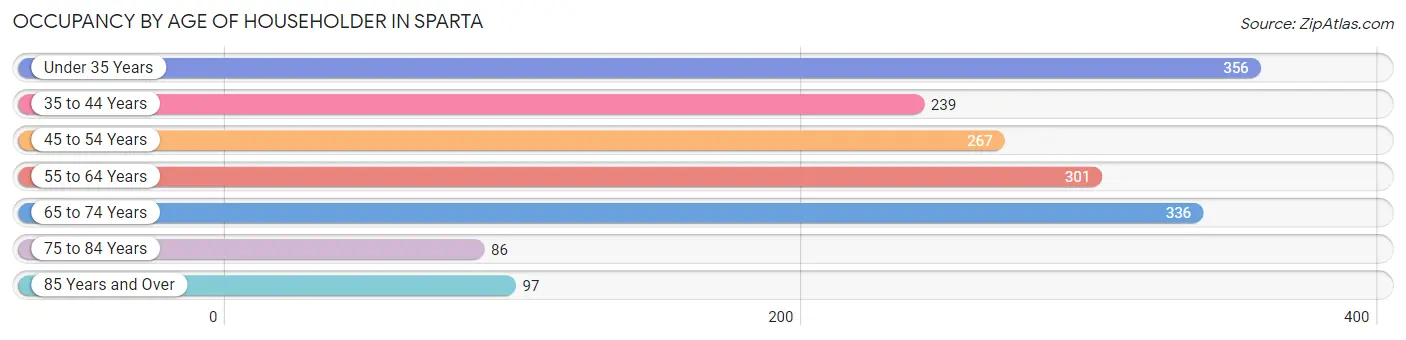
| Age Bracket | # Households | % Households |
| Under 35 Years | 356 | 21.2% |
| 35 to 44 Years | 239 | 14.2% |
| 45 to 54 Years | 267 | 15.9% |
| 55 to 64 Years | 301 | 17.9% |
| 65 to 74 Years | 336 | 20.0% |
| 75 to 84 Years | 86 | 5.1% |
| 85 Years and Over | 97 | 5.8% |
| Total | 1,682 | 100.0% |
Housing Finances in Sparta
Median Income by Occupancy in Sparta
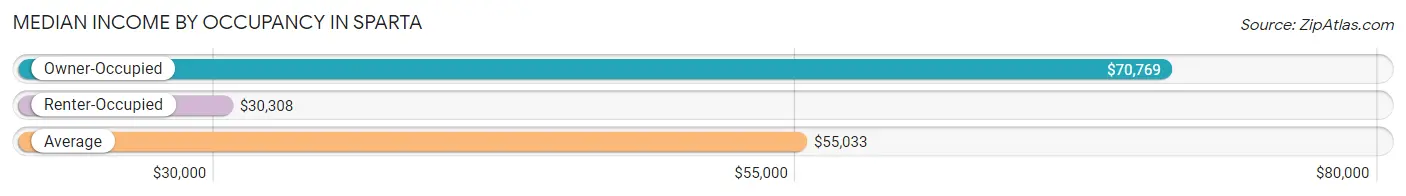
| Occupancy Type | # Households | Median Income |
| Owner-Occupied | 1,172 (69.7%) | $70,769 |
| Renter-Occupied | 510 (30.3%) | $30,308 |
| Average | 1,682 (100.0%) | $55,033 |
Occupancy by Householder Income Bracket in Sparta
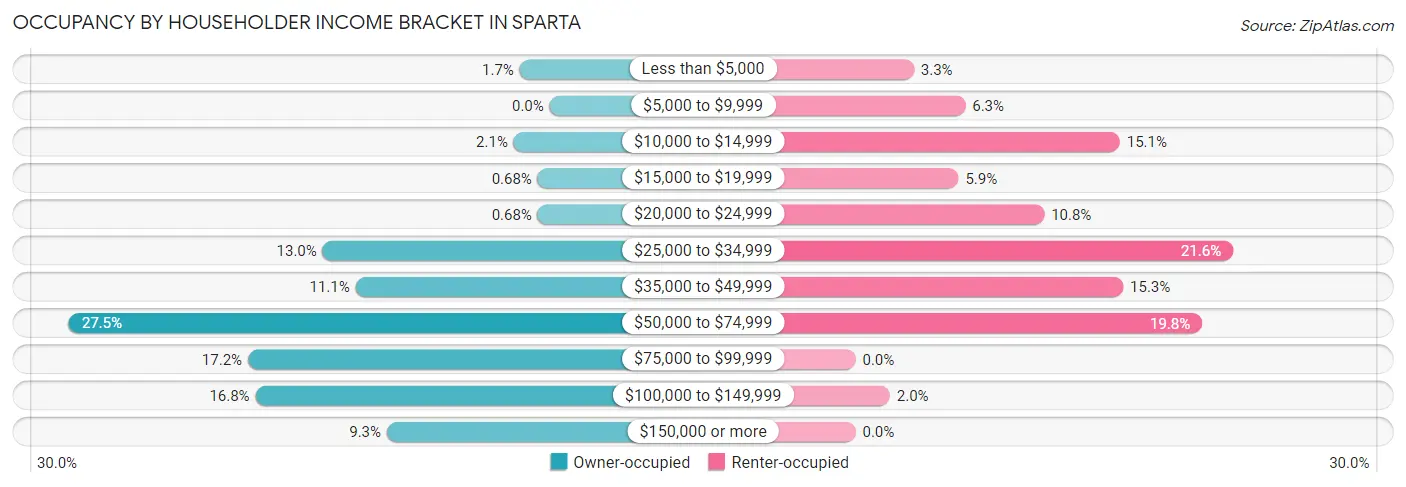
| Income Bracket | Owner-occupied | Renter-occupied |
| Less than $5,000 | 20 (1.7%) | 17 (3.3%) |
| $5,000 to $9,999 | 0 (0.0%) | 32 (6.3%) |
| $10,000 to $14,999 | 24 (2.1%) | 77 (15.1%) |
| $15,000 to $19,999 | 8 (0.7%) | 30 (5.9%) |
| $20,000 to $24,999 | 8 (0.7%) | 55 (10.8%) |
| $25,000 to $34,999 | 152 (13.0%) | 110 (21.6%) |
| $35,000 to $49,999 | 130 (11.1%) | 78 (15.3%) |
| $50,000 to $74,999 | 322 (27.5%) | 101 (19.8%) |
| $75,000 to $99,999 | 202 (17.2%) | 0 (0.0%) |
| $100,000 to $149,999 | 197 (16.8%) | 10 (2.0%) |
| $150,000 or more | 109 (9.3%) | 0 (0.0%) |
| Total | 1,172 (100.0%) | 510 (100.0%) |
Monthly Housing Cost Tiers in Sparta
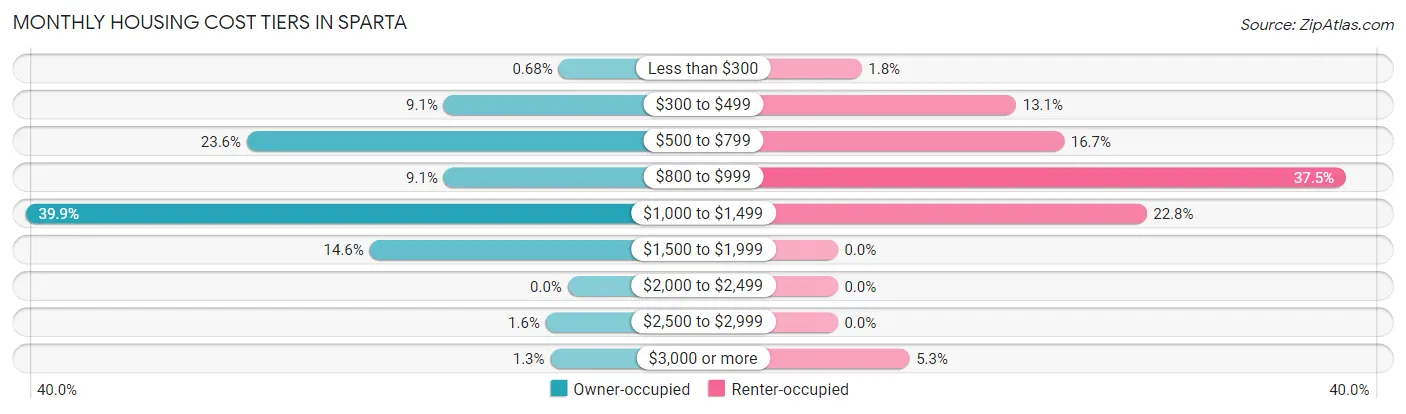
| Monthly Cost | Owner-occupied | Renter-occupied |
| Less than $300 | 8 (0.7%) | 9 (1.8%) |
| $300 to $499 | 107 (9.1%) | 67 (13.1%) |
| $500 to $799 | 277 (23.6%) | 85 (16.7%) |
| $800 to $999 | 107 (9.1%) | 191 (37.4%) |
| $1,000 to $1,499 | 468 (39.9%) | 116 (22.8%) |
| $1,500 to $1,999 | 171 (14.6%) | 0 (0.0%) |
| $2,000 to $2,499 | 0 (0.0%) | 0 (0.0%) |
| $2,500 to $2,999 | 19 (1.6%) | 0 (0.0%) |
| $3,000 or more | 15 (1.3%) | 27 (5.3%) |
| Total | 1,172 (100.0%) | 510 (100.0%) |
Physical Housing Characteristics in Sparta
Housing Structures in Sparta
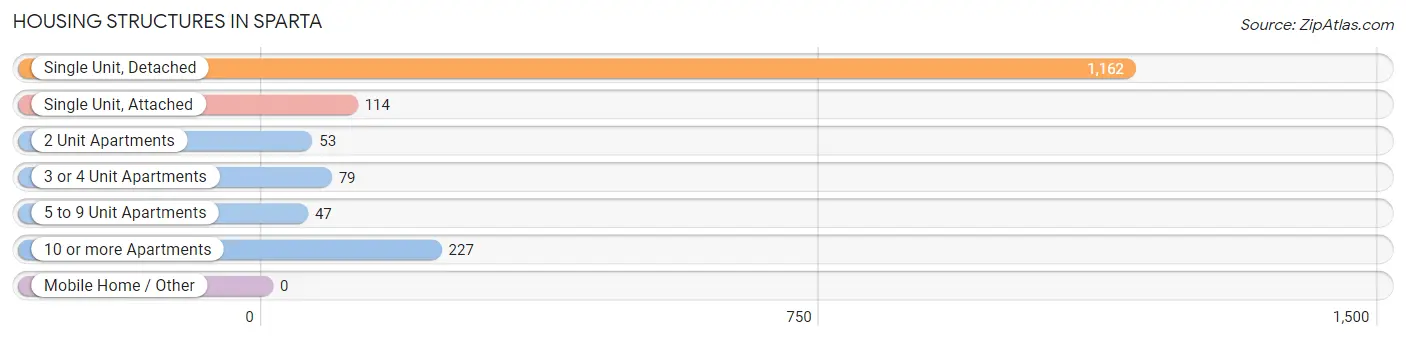
| Structure Type | # Housing Units | % Housing Units |
| Single Unit, Detached | 1,162 | 69.1% |
| Single Unit, Attached | 114 | 6.8% |
| 2 Unit Apartments | 53 | 3.2% |
| 3 or 4 Unit Apartments | 79 | 4.7% |
| 5 to 9 Unit Apartments | 47 | 2.8% |
| 10 or more Apartments | 227 | 13.5% |
| Mobile Home / Other | 0 | 0.0% |
| Total | 1,682 | 100.0% |
Housing Structures by Occupancy in Sparta
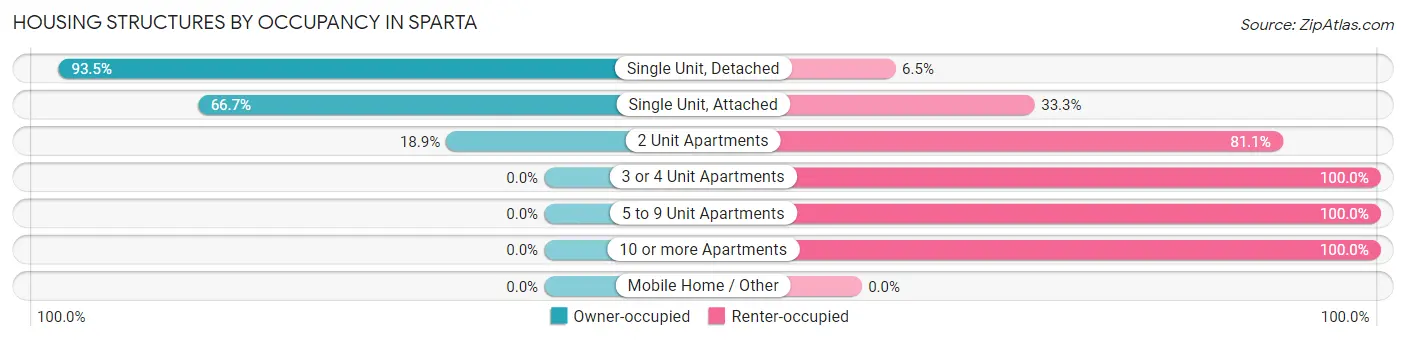
| Structure Type | Owner-occupied | Renter-occupied |
| Single Unit, Detached | 1,086 (93.5%) | 76 (6.5%) |
| Single Unit, Attached | 76 (66.7%) | 38 (33.3%) |
| 2 Unit Apartments | 10 (18.9%) | 43 (81.1%) |
| 3 or 4 Unit Apartments | 0 (0.0%) | 79 (100.0%) |
| 5 to 9 Unit Apartments | 0 (0.0%) | 47 (100.0%) |
| 10 or more Apartments | 0 (0.0%) | 227 (100.0%) |
| Mobile Home / Other | 0 (0.0%) | 0 (0.0%) |
| Total | 1,172 (69.7%) | 510 (30.3%) |
Housing Structures by Number of Rooms in Sparta
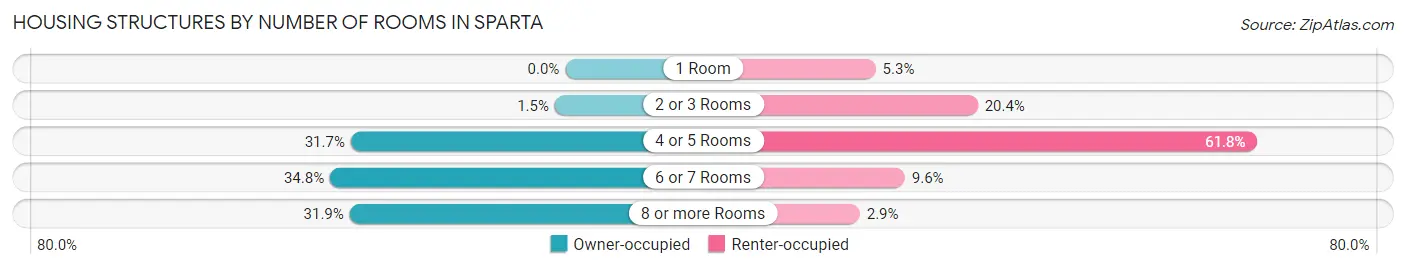
| Number of Rooms | Owner-occupied | Renter-occupied |
| 1 Room | 0 (0.0%) | 27 (5.3%) |
| 2 or 3 Rooms | 18 (1.5%) | 104 (20.4%) |
| 4 or 5 Rooms | 372 (31.7%) | 315 (61.8%) |
| 6 or 7 Rooms | 408 (34.8%) | 49 (9.6%) |
| 8 or more Rooms | 374 (31.9%) | 15 (2.9%) |
| Total | 1,172 (100.0%) | 510 (100.0%) |
Housing Structure by Heating Type in Sparta
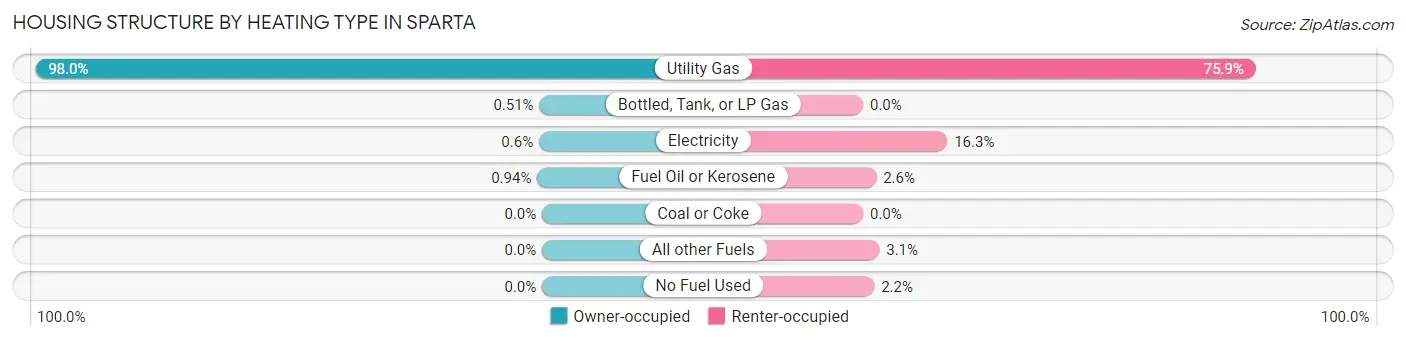
| Heating Type | Owner-occupied | Renter-occupied |
| Utility Gas | 1,148 (98.0%) | 387 (75.9%) |
| Bottled, Tank, or LP Gas | 6 (0.5%) | 0 (0.0%) |
| Electricity | 7 (0.6%) | 83 (16.3%) |
| Fuel Oil or Kerosene | 11 (0.9%) | 13 (2.5%) |
| Coal or Coke | 0 (0.0%) | 0 (0.0%) |
| All other Fuels | 0 (0.0%) | 16 (3.1%) |
| No Fuel Used | 0 (0.0%) | 11 (2.2%) |
| Total | 1,172 (100.0%) | 510 (100.0%) |
Household Vehicle Usage in Sparta
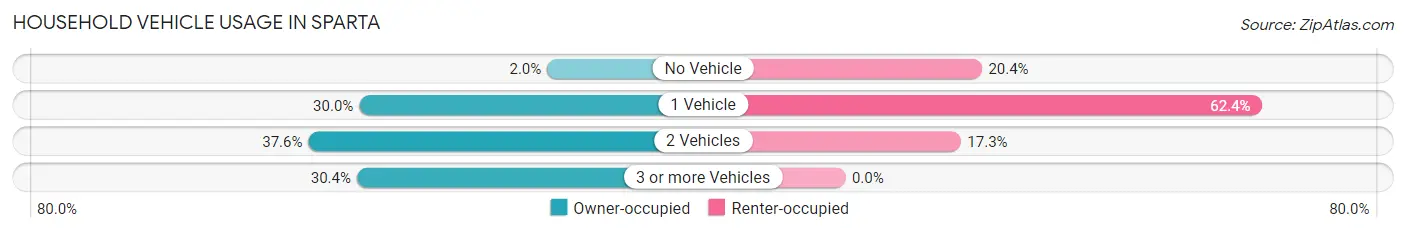
| Vehicles per Household | Owner-occupied | Renter-occupied |
| No Vehicle | 23 (2.0%) | 104 (20.4%) |
| 1 Vehicle | 352 (30.0%) | 318 (62.4%) |
| 2 Vehicles | 441 (37.6%) | 88 (17.2%) |
| 3 or more Vehicles | 356 (30.4%) | 0 (0.0%) |
| Total | 1,172 (100.0%) | 510 (100.0%) |
Real Estate & Mortgages in Sparta
Real Estate and Mortgage Overview in Sparta
| Characteristic | Without Mortgage | With Mortgage |
| Housing Units | 351 | 821 |
| Median Property Value | $179,300 | $178,500 |
| Median Household Income | $59,453 | $68 |
| Monthly Housing Costs | $564 | $15 |
| Real Estate Taxes | $2,685 | $18 |
Property Value by Mortgage Status in Sparta
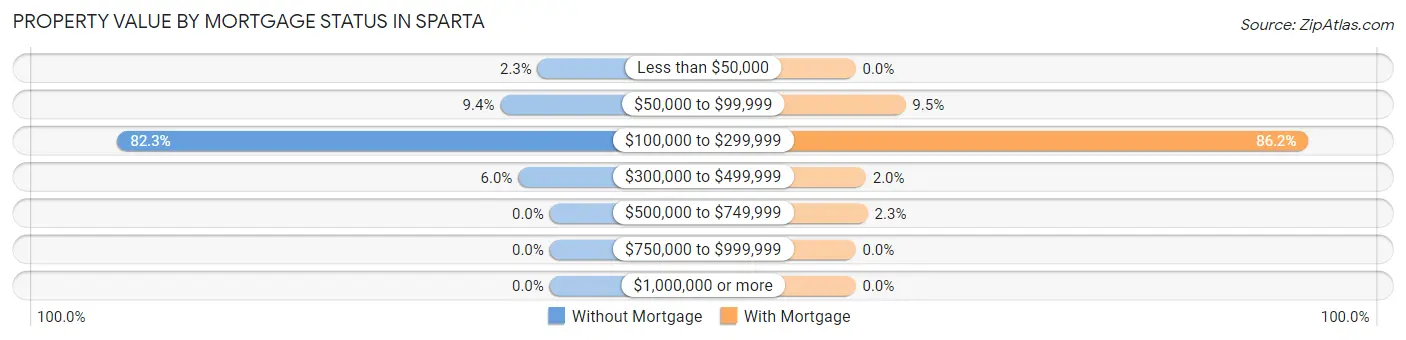
| Property Value | Without Mortgage | With Mortgage |
| Less than $50,000 | 8 (2.3%) | 0 (0.0%) |
| $50,000 to $99,999 | 33 (9.4%) | 78 (9.5%) |
| $100,000 to $299,999 | 289 (82.3%) | 708 (86.2%) |
| $300,000 to $499,999 | 21 (6.0%) | 16 (1.9%) |
| $500,000 to $749,999 | 0 (0.0%) | 19 (2.3%) |
| $750,000 to $999,999 | 0 (0.0%) | 0 (0.0%) |
| $1,000,000 or more | 0 (0.0%) | 0 (0.0%) |
| Total | 351 (100.0%) | 821 (100.0%) |
Household Income by Mortgage Status in Sparta
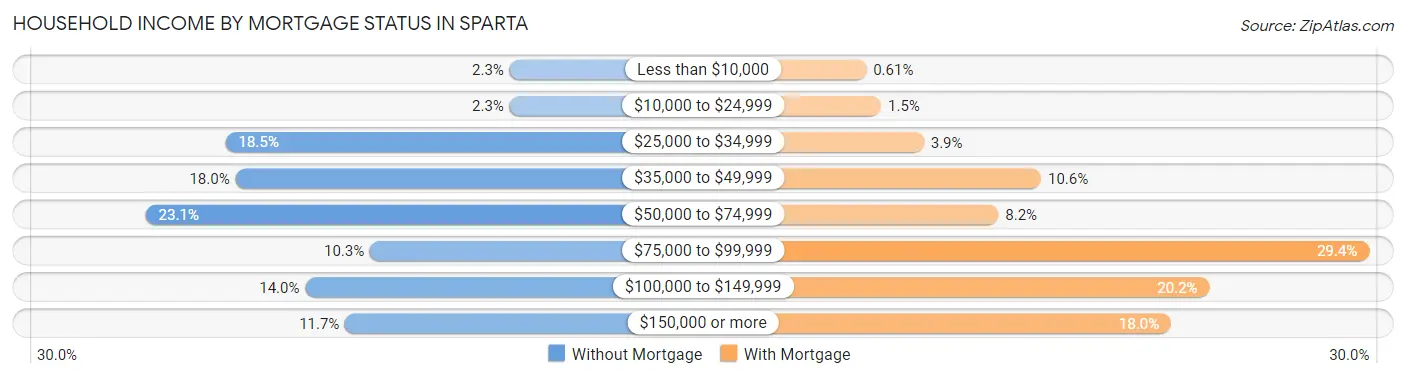
| Household Income | Without Mortgage | With Mortgage |
| Less than $10,000 | 8 (2.3%) | 5 (0.6%) |
| $10,000 to $24,999 | 8 (2.3%) | 12 (1.5%) |
| $25,000 to $34,999 | 65 (18.5%) | 32 (3.9%) |
| $35,000 to $49,999 | 63 (17.9%) | 87 (10.6%) |
| $50,000 to $74,999 | 81 (23.1%) | 67 (8.2%) |
| $75,000 to $99,999 | 36 (10.3%) | 241 (29.3%) |
| $100,000 to $149,999 | 49 (14.0%) | 166 (20.2%) |
| $150,000 or more | 41 (11.7%) | 148 (18.0%) |
| Total | 351 (100.0%) | 821 (100.0%) |
Property Value to Household Income Ratio in Sparta
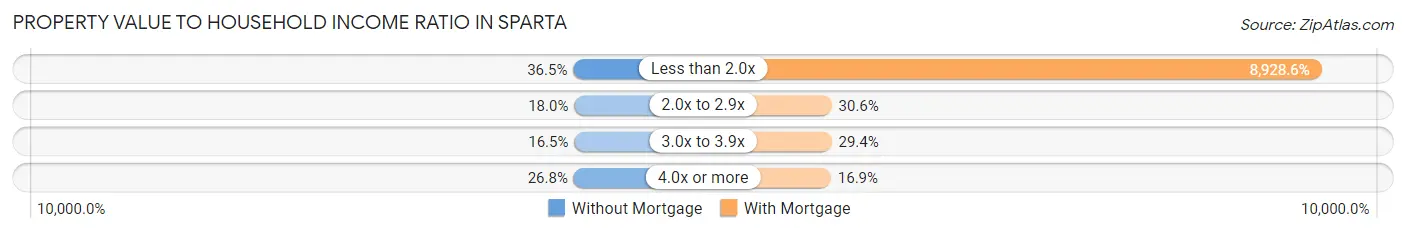
| Value-to-Income Ratio | Without Mortgage | With Mortgage |
| Less than 2.0x | 128 (36.5%) | 73,304 (8,928.6%) |
| 2.0x to 2.9x | 63 (17.9%) | 251 (30.6%) |
| 3.0x to 3.9x | 58 (16.5%) | 241 (29.3%) |
| 4.0x or more | 94 (26.8%) | 139 (16.9%) |
| Total | 351 (100.0%) | 821 (100.0%) |
Real Estate Taxes by Mortgage Status in Sparta
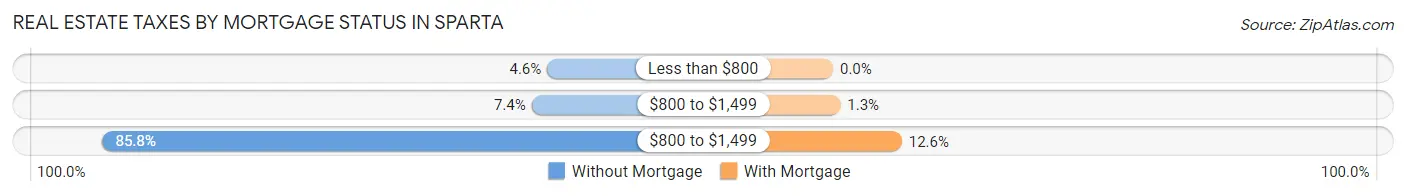
| Property Taxes | Without Mortgage | With Mortgage |
| Less than $800 | 16 (4.6%) | 0 (0.0%) |
| $800 to $1,499 | 26 (7.4%) | 11 (1.3%) |
| $800 to $1,499 | 301 (85.8%) | 103 (12.6%) |
| Total | 351 (100.0%) | 821 (100.0%) |
Health & Disability in Sparta
Health Insurance Coverage by Age in Sparta
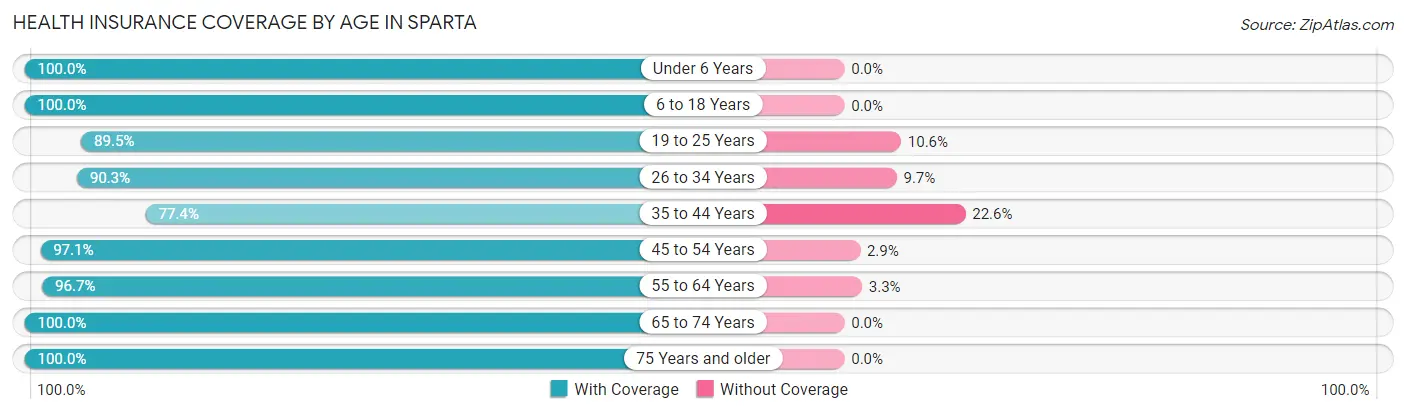
| Age Bracket | With Coverage | Without Coverage |
| Under 6 Years | 378 (100.0%) | 0 (0.0%) |
| 6 to 18 Years | 695 (100.0%) | 0 (0.0%) |
| 19 to 25 Years | 424 (89.4%) | 50 (10.5%) |
| 26 to 34 Years | 519 (90.3%) | 56 (9.7%) |
| 35 to 44 Years | 357 (77.4%) | 104 (22.6%) |
| 45 to 54 Years | 466 (97.1%) | 14 (2.9%) |
| 55 to 64 Years | 442 (96.7%) | 15 (3.3%) |
| 65 to 74 Years | 481 (100.0%) | 0 (0.0%) |
| 75 Years and older | 246 (100.0%) | 0 (0.0%) |
| Total | 4,008 (94.4%) | 239 (5.6%) |
Health Insurance Coverage by Citizenship Status in Sparta
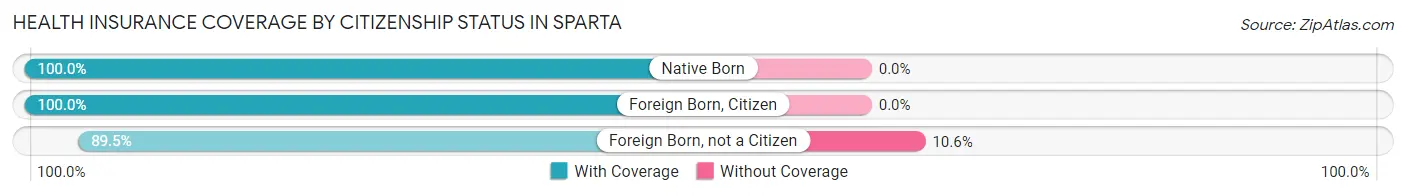
| Citizenship Status | With Coverage | Without Coverage |
| Native Born | 378 (100.0%) | 0 (0.0%) |
| Foreign Born, Citizen | 695 (100.0%) | 0 (0.0%) |
| Foreign Born, not a Citizen | 424 (89.4%) | 50 (10.5%) |
Health Insurance Coverage by Household Income in Sparta
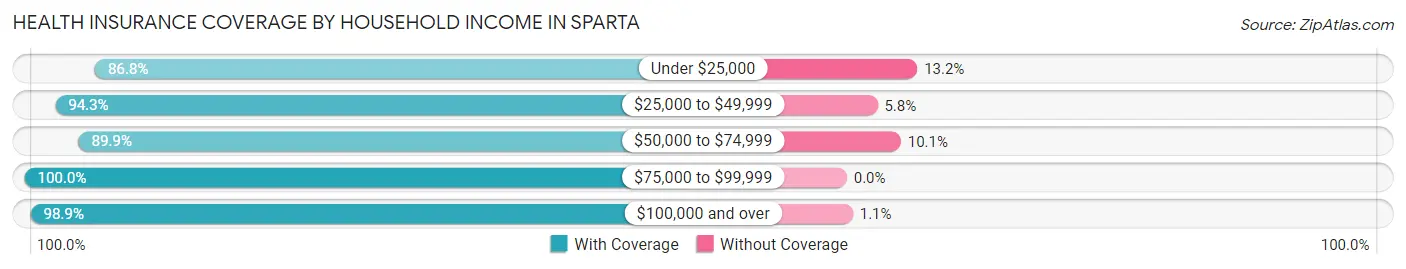
| Household Income | With Coverage | Without Coverage |
| Under $25,000 | 408 (86.8%) | 62 (13.2%) |
| $25,000 to $49,999 | 819 (94.3%) | 50 (5.8%) |
| $50,000 to $74,999 | 1,021 (89.9%) | 115 (10.1%) |
| $75,000 to $99,999 | 685 (100.0%) | 0 (0.0%) |
| $100,000 and over | 1,061 (98.9%) | 12 (1.1%) |
Public vs Private Health Insurance Coverage by Age in Sparta
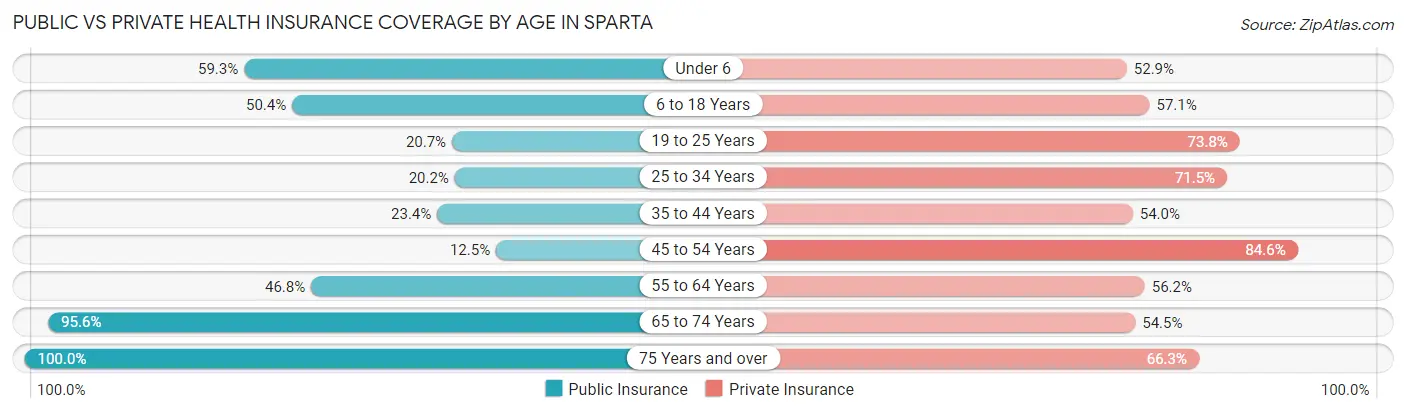
| Age Bracket | Public Insurance | Private Insurance |
| Under 6 | 224 (59.3%) | 200 (52.9%) |
| 6 to 18 Years | 350 (50.4%) | 397 (57.1%) |
| 19 to 25 Years | 98 (20.7%) | 350 (73.8%) |
| 25 to 34 Years | 116 (20.2%) | 411 (71.5%) |
| 35 to 44 Years | 108 (23.4%) | 249 (54.0%) |
| 45 to 54 Years | 60 (12.5%) | 406 (84.6%) |
| 55 to 64 Years | 214 (46.8%) | 257 (56.2%) |
| 65 to 74 Years | 460 (95.6%) | 262 (54.5%) |
| 75 Years and over | 246 (100.0%) | 163 (66.3%) |
| Total | 1,876 (44.2%) | 2,695 (63.5%) |
Disability Status by Sex by Age in Sparta
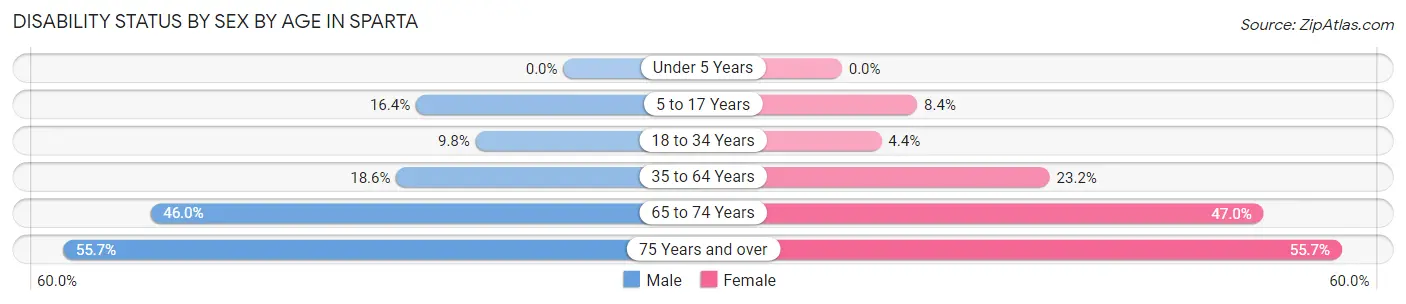
| Age Bracket | Male | Female |
| Under 5 Years | 0 (0.0%) | 0 (0.0%) |
| 5 to 17 Years | 63 (16.4%) | 26 (8.4%) |
| 18 to 34 Years | 52 (9.8%) | 26 (4.4%) |
| 35 to 64 Years | 109 (18.6%) | 188 (23.2%) |
| 65 to 74 Years | 92 (46.0%) | 132 (47.0%) |
| 75 Years and over | 34 (55.7%) | 103 (55.7%) |
Disability Class by Sex by Age in Sparta
Disability Class: Hearing Difficulty
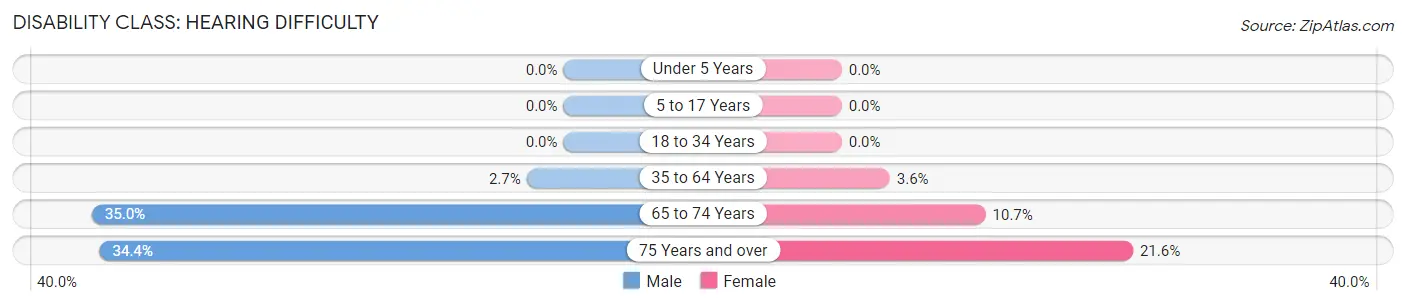
| Age Bracket | Male | Female |
| Under 5 Years | 0 (0.0%) | 0 (0.0%) |
| 5 to 17 Years | 0 (0.0%) | 0 (0.0%) |
| 18 to 34 Years | 0 (0.0%) | 0 (0.0%) |
| 35 to 64 Years | 16 (2.7%) | 29 (3.6%) |
| 65 to 74 Years | 70 (35.0%) | 30 (10.7%) |
| 75 Years and over | 21 (34.4%) | 40 (21.6%) |
Disability Class: Vision Difficulty
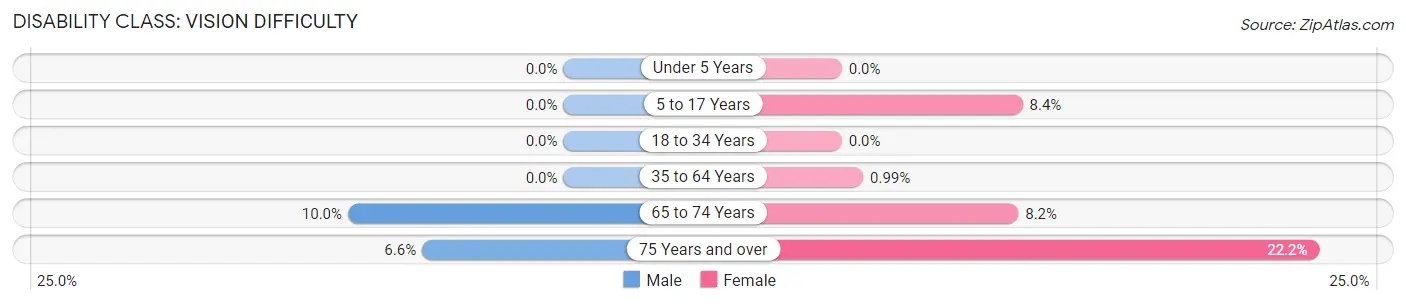
| Age Bracket | Male | Female |
| Under 5 Years | 0 (0.0%) | 0 (0.0%) |
| 5 to 17 Years | 0 (0.0%) | 26 (8.4%) |
| 18 to 34 Years | 0 (0.0%) | 0 (0.0%) |
| 35 to 64 Years | 0 (0.0%) | 8 (1.0%) |
| 65 to 74 Years | 20 (10.0%) | 23 (8.2%) |
| 75 Years and over | 4 (6.6%) | 41 (22.2%) |
Disability Class: Cognitive Difficulty
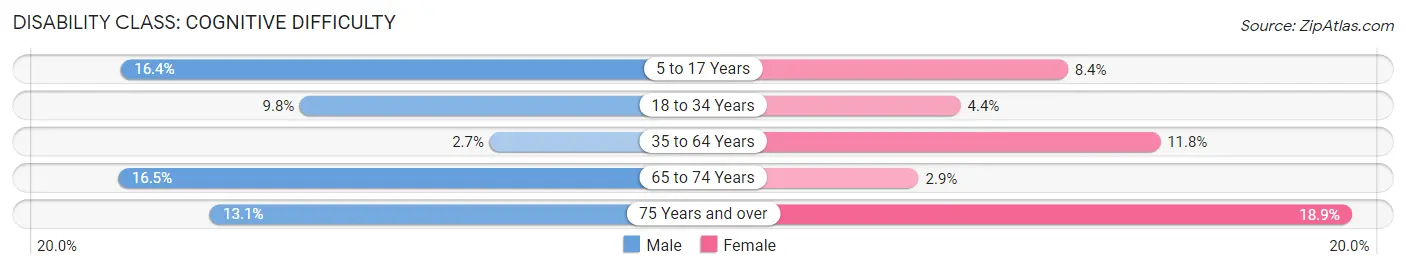
| Age Bracket | Male | Female |
| 5 to 17 Years | 63 (16.4%) | 26 (8.4%) |
| 18 to 34 Years | 52 (9.8%) | 26 (4.4%) |
| 35 to 64 Years | 16 (2.7%) | 96 (11.8%) |
| 65 to 74 Years | 33 (16.5%) | 8 (2.9%) |
| 75 Years and over | 8 (13.1%) | 35 (18.9%) |
Disability Class: Ambulatory Difficulty
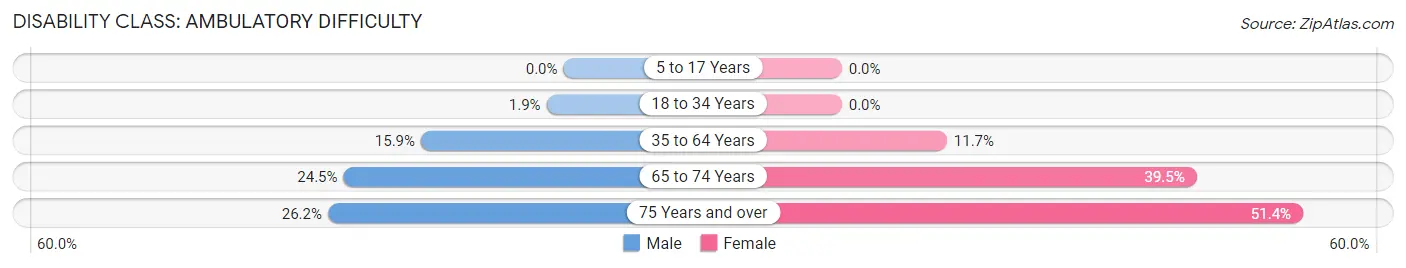
| Age Bracket | Male | Female |
| 5 to 17 Years | 0 (0.0%) | 0 (0.0%) |
| 18 to 34 Years | 10 (1.9%) | 0 (0.0%) |
| 35 to 64 Years | 93 (15.9%) | 95 (11.7%) |
| 65 to 74 Years | 49 (24.5%) | 111 (39.5%) |
| 75 Years and over | 16 (26.2%) | 95 (51.3%) |
Disability Class: Self-Care Difficulty
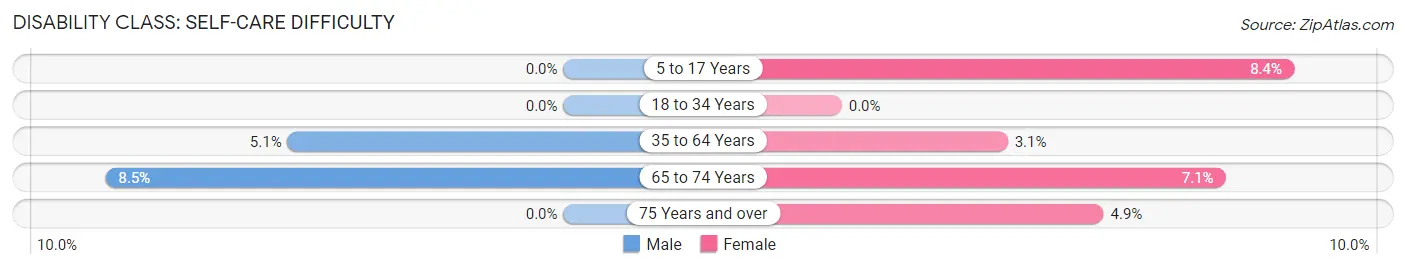
| Age Bracket | Male | Female |
| 5 to 17 Years | 0 (0.0%) | 26 (8.4%) |
| 18 to 34 Years | 0 (0.0%) | 0 (0.0%) |
| 35 to 64 Years | 30 (5.1%) | 25 (3.1%) |
| 65 to 74 Years | 17 (8.5%) | 20 (7.1%) |
| 75 Years and over | 0 (0.0%) | 9 (4.9%) |
Technology Access in Sparta
Computing Device Access in Sparta
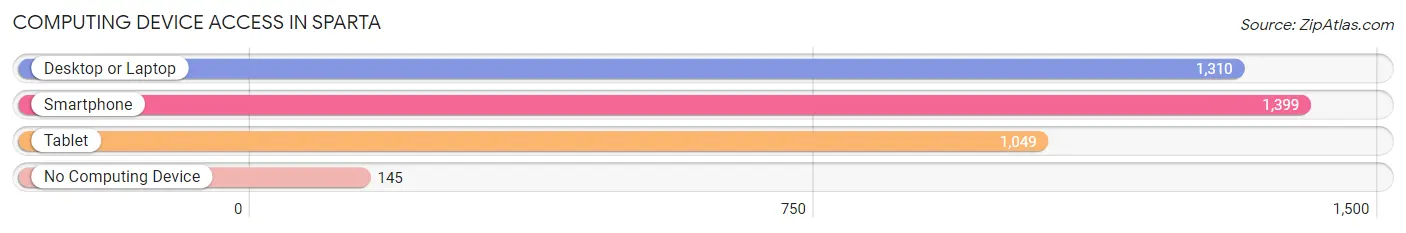
| Device Type | # Households | % Households |
| Desktop or Laptop | 1,310 | 77.9% |
| Smartphone | 1,399 | 83.2% |
| Tablet | 1,049 | 62.4% |
| No Computing Device | 145 | 8.6% |
| Total | 1,682 | 100.0% |
Internet Access in Sparta
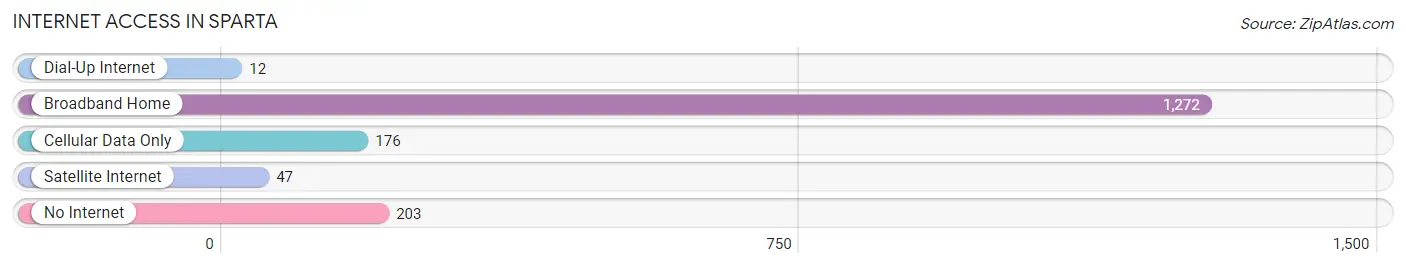
| Internet Type | # Households | % Households |
| Dial-Up Internet | 12 | 0.7% |
| Broadband Home | 1,272 | 75.6% |
| Cellular Data Only | 176 | 10.5% |
| Satellite Internet | 47 | 2.8% |
| No Internet | 203 | 12.1% |
| Total | 1,682 | 100.0% |
Sparta Summary
Sparta is a small city located in Kent County, Michigan, United States. It is situated in the Grand Rapids metropolitan area and is part of the larger Grand Rapids-Wyoming-Muskegon Combined Statistical Area. The city has a population of approximately 10,000 people and is located on the banks of the Thornapple River.
History
Sparta was first settled in 1836 by a group of settlers from New York. The settlement was originally known as Sparta Center, and was named after the ancient Greek city-state of Sparta. The settlement was incorporated as a village in 1867 and as a city in 1891.
In the late 19th century, Sparta was a major center for the lumber industry. The city was home to several sawmills and lumberyards, and the city's economy was largely dependent on the lumber industry. The city was also home to several other industries, including a brickyard, a grist mill, and a tannery.
In the early 20th century, Sparta's economy shifted away from the lumber industry and towards manufacturing. The city was home to several factories, including a furniture factory, a paper mill, and a canning factory. The city also had a thriving agricultural industry, with several farms located in the area.
Geography
Sparta is located in western Michigan, in Kent County. The city is situated on the banks of the Thornapple River, and is located approximately 25 miles east of Grand Rapids. The city has a total area of 4.3 square miles, all of which is land.
The city has a humid continental climate, with cold winters and hot, humid summers. The average annual temperature is 46°F, and the average annual precipitation is 33 inches.
Economy
Sparta's economy is largely based on manufacturing and agriculture. The city is home to several factories, including a furniture factory, a paper mill, and a canning factory. The city also has a thriving agricultural industry, with several farms located in the area.
The city is also home to several retail stores, restaurants, and other businesses. The city is served by several major highways, including Interstate 96 and US Route 131.
Demographics
As of the 2010 census, Sparta had a population of 10,000 people. The racial makeup of the city was 94.3% White, 1.3% African American, 0.7% Native American, 0.7% Asian, 0.1% Pacific Islander, 1.3% from other races, and 1.9% from two or more races. Hispanic or Latino of any race were 3.3% of the population.
The median household income in Sparta was $45,000, and the median family income was $51,000. The per capita income in Sparta was $20,000. About 8.3% of families and 10.3% of the population were below the poverty line, including 14.3% of those under age 18 and 6.3% of those age 65 or over.
Common Questions
What is Per Capita Income in Sparta?
Per Capita income in Sparta is $26,571.
What is the Median Family Income in Sparta?
Median Family Income in Sparta is $68,141.
What is the Median Household income in Sparta?
Median Household Income in Sparta is $55,033.
What is Income or Wage Gap in Sparta?
Income or Wage Gap in Sparta is 28.4%.
Women in Sparta earn 71.6 cents for every dollar earned by a man.
What is Inequality or Gini Index in Sparta?
Inequality or Gini Index in Sparta is 0.41.
What is the Total Population of Sparta?
Total Population of Sparta is 4,247.
What is the Total Male Population of Sparta?
Total Male Population of Sparta is 1,921.
What is the Total Female Population of Sparta?
Total Female Population of Sparta is 2,326.
What is the Ratio of Males per 100 Females in Sparta?
There are 82.59 Males per 100 Females in Sparta.
What is the Ratio of Females per 100 Males in Sparta?
There are 121.08 Females per 100 Males in Sparta.
What is the Median Population Age in Sparta?
Median Population Age in Sparta is 35.0 Years.
What is the Average Family Size in Sparta
Average Family Size in Sparta is 3.1 People.
What is the Average Household Size in Sparta
Average Household Size in Sparta is 2.5 People.
How Large is the Labor Force in Sparta?
There are 2,025 People in the Labor Forcein in Sparta.
What is the Percentage of People in the Labor Force in Sparta?
59.5% of People are in the Labor Force in Sparta.
What is the Unemployment Rate in Sparta?
Unemployment Rate in Sparta is 3.6%.