South Boardman, MI Map & Demographics
South Boardman Map
South Boardman Overview
$26,072
PER CAPITA INCOME
$55,000
AVG FAMILY INCOME
$56,111
AVG HOUSEHOLD INCOME
2.2%
WAGE / INCOME GAP [ % ]
97.8¢/ $1
WAGE / INCOME GAP [ $ ]
0.39
INEQUALITY / GINI INDEX
613
TOTAL POPULATION
327
MALE POPULATION
286
FEMALE POPULATION
114.34
MALES / 100 FEMALES
87.46
FEMALES / 100 MALES
37.4
MEDIAN AGE
3.1
AVG FAMILY SIZE
2.8
AVG HOUSEHOLD SIZE
320
LABOR FORCE [ PEOPLE ]
63.4%
PERCENT IN LABOR FORCE
2.5%
UNEMPLOYMENT RATE
South Boardman Zip Codes
South Boardman Area Codes
Income in South Boardman
Income Overview in South Boardman
Per Capita Income in South Boardman is $26,072, while median incomes of families and households are $55,000 and $56,111 respectively.
| Characteristic | Number | Measure |
| Per Capita Income | 613 | $26,072 |
| Median Family Income | 158 | $55,000 |
| Mean Family Income | 158 | $66,858 |
| Median Household Income | 222 | $56,111 |
| Mean Household Income | 222 | $72,840 |
| Income Deficit | 158 | $0 |
| Wage / Income Gap (%) | 613 | 2.22% |
| Wage / Income Gap ($) | 613 | 97.78¢ per $1 |
| Gini / Inequality Index | 613 | 0.39 |
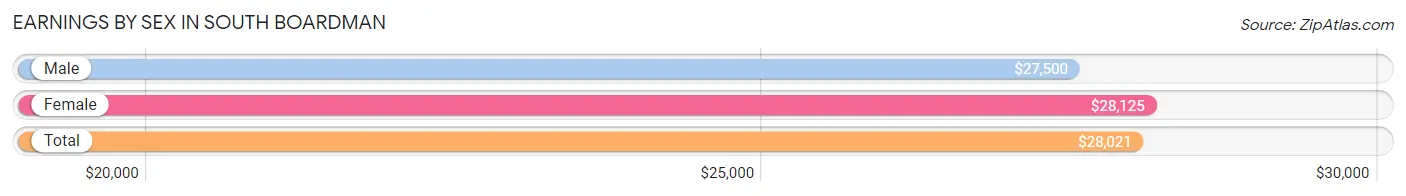
Earnings by Sex in South Boardman
Average Earnings in South Boardman are $28,021, $27,500 for men and $28,125 for women, a difference of 2.2%.
| Sex | Number | Average Earnings |
| Male | 190 (55.1%) | $27,500 |
| Female | 155 (44.9%) | $28,125 |
| Total | 345 (100.0%) | $28,021 |
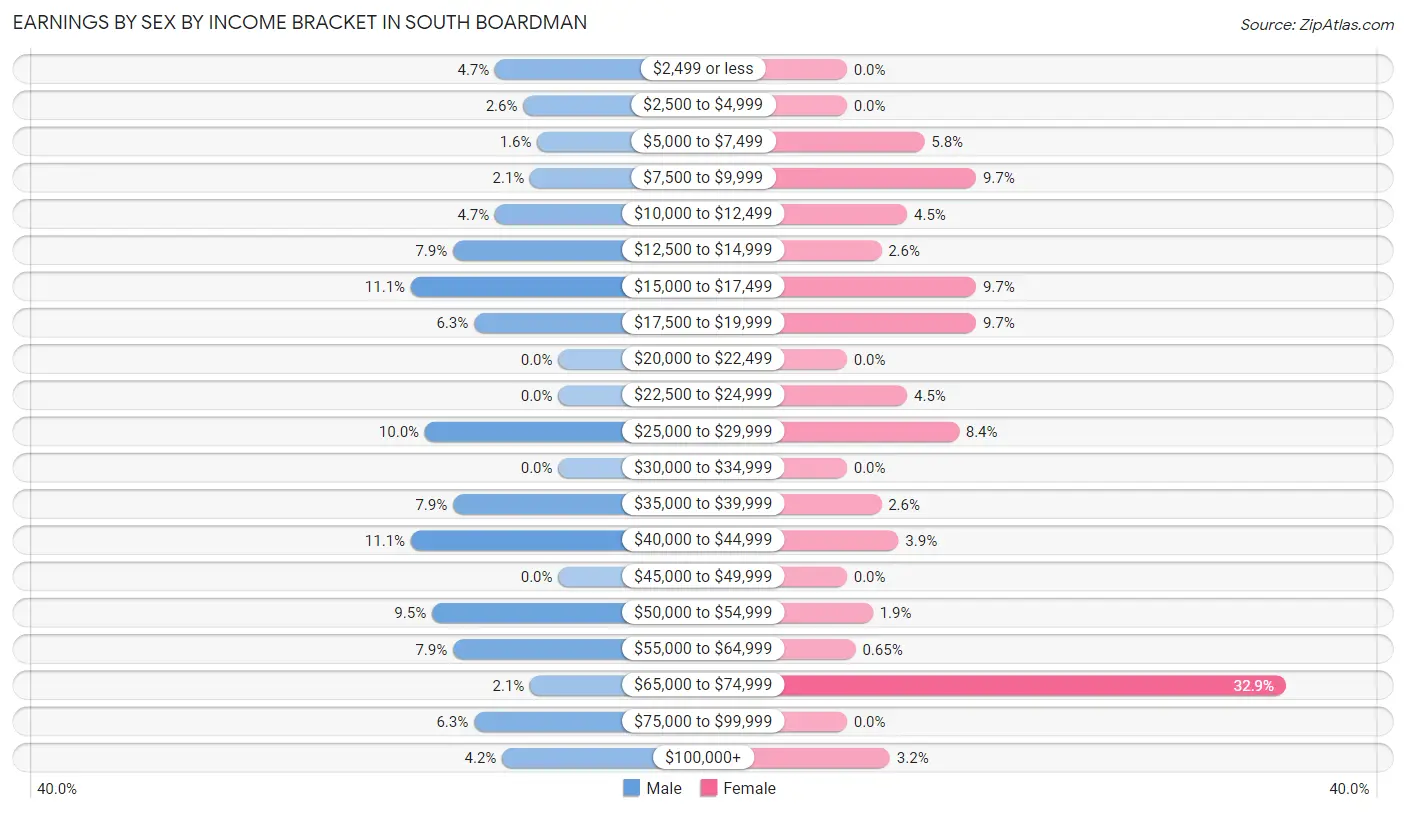
Earnings by Sex by Income Bracket in South Boardman
The most common earnings brackets in South Boardman are $15,000 to $17,499 for men (21 | 11.1%) and $65,000 to $74,999 for women (51 | 32.9%).
| Income | Male | Female |
| $2,499 or less | 9 (4.7%) | 0 (0.0%) |
| $2,500 to $4,999 | 5 (2.6%) | 0 (0.0%) |
| $5,000 to $7,499 | 3 (1.6%) | 9 (5.8%) |
| $7,500 to $9,999 | 4 (2.1%) | 15 (9.7%) |
| $10,000 to $12,499 | 9 (4.7%) | 7 (4.5%) |
| $12,500 to $14,999 | 15 (7.9%) | 4 (2.6%) |
| $15,000 to $17,499 | 21 (11.1%) | 15 (9.7%) |
| $17,500 to $19,999 | 12 (6.3%) | 15 (9.7%) |
| $20,000 to $22,499 | 0 (0.0%) | 0 (0.0%) |
| $22,500 to $24,999 | 0 (0.0%) | 7 (4.5%) |
| $25,000 to $29,999 | 19 (10.0%) | 13 (8.4%) |
| $30,000 to $34,999 | 0 (0.0%) | 0 (0.0%) |
| $35,000 to $39,999 | 15 (7.9%) | 4 (2.6%) |
| $40,000 to $44,999 | 21 (11.1%) | 6 (3.9%) |
| $45,000 to $49,999 | 0 (0.0%) | 0 (0.0%) |
| $50,000 to $54,999 | 18 (9.5%) | 3 (1.9%) |
| $55,000 to $64,999 | 15 (7.9%) | 1 (0.6%) |
| $65,000 to $74,999 | 4 (2.1%) | 51 (32.9%) |
| $75,000 to $99,999 | 12 (6.3%) | 0 (0.0%) |
| $100,000+ | 8 (4.2%) | 5 (3.2%) |
| Total | 190 (100.0%) | 155 (100.0%) |
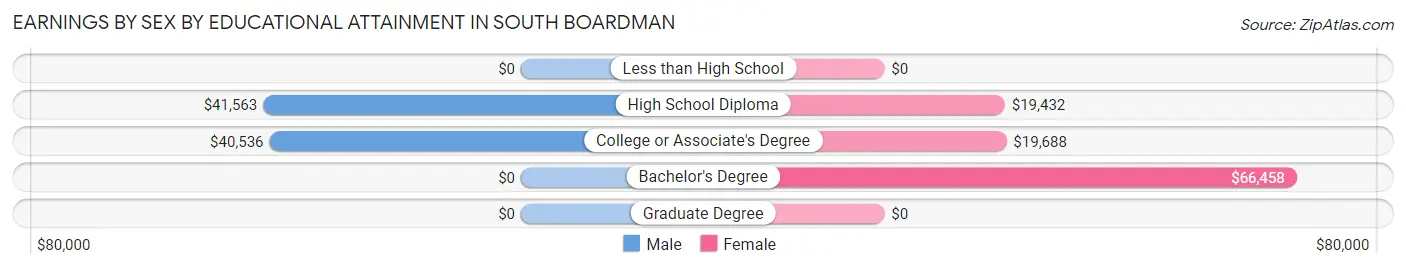
Earnings by Sex by Educational Attainment in South Boardman
Average earnings in South Boardman are $40,795 for men and $28,125 for women, a difference of 31.1%. Men with an educational attainment of high school diploma enjoy the highest average annual earnings of $41,563, while those with college or associate's degree education earn the least with $40,536. Women with an educational attainment of bachelor's degree earn the most with the average annual earnings of $66,458, while those with high school diploma education have the smallest earnings of $19,432.
| Educational Attainment | Male Income | Female Income |
| Less than High School | - | - |
| High School Diploma | $41,563 | $19,432 |
| College or Associate's Degree | $40,536 | $19,688 |
| Bachelor's Degree | - | - |
| Graduate Degree | - | - |
| Total | $40,795 | $28,125 |
Family Income in South Boardman
Family Income Brackets in South Boardman
According to the South Boardman family income data, there are 46 families falling into the $50,000 to $74,999 income range, which is the most common income bracket and makes up 29.1% of all families.
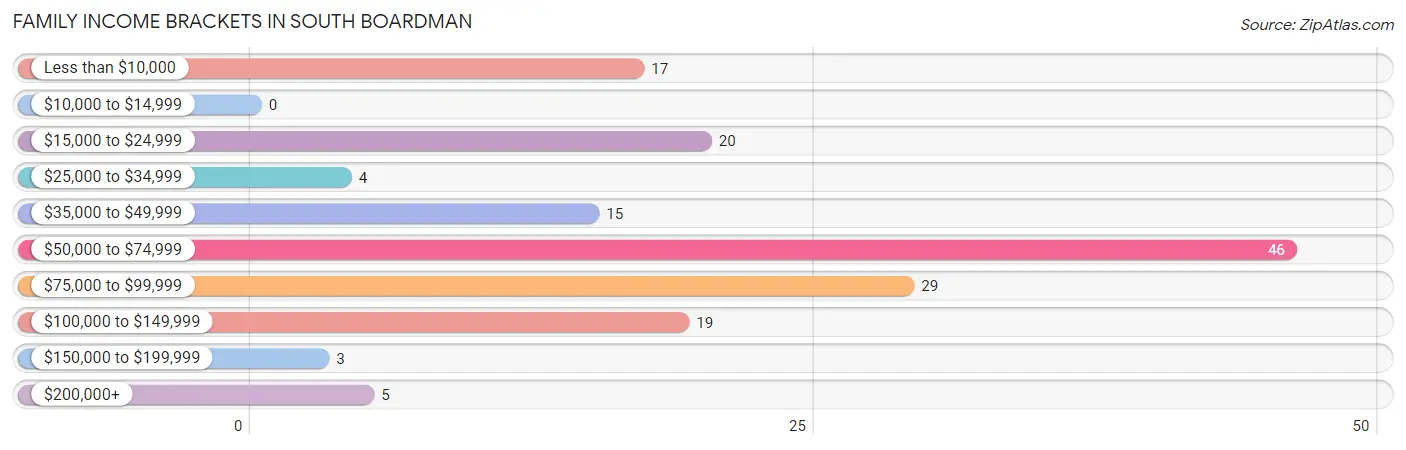
| Income Bracket | # Families | % Families |
| Less than $10,000 | 17 | 10.8% |
| $10,000 to $14,999 | 0 | 0.0% |
| $15,000 to $24,999 | 20 | 12.7% |
| $25,000 to $34,999 | 4 | 2.5% |
| $35,000 to $49,999 | 15 | 9.5% |
| $50,000 to $74,999 | 46 | 29.1% |
| $75,000 to $99,999 | 29 | 18.4% |
| $100,000 to $149,999 | 19 | 12.0% |
| $150,000 to $199,999 | 3 | 1.9% |
| $200,000+ | 5 | 3.2% |
Family Income by Famaliy Size in South Boardman
3-person families (37 | 23.4%) account for the highest median family income in South Boardman with $63,750 per family, while 2-person families (82 | 51.9%) have the highest median income of $26,250 per family member.
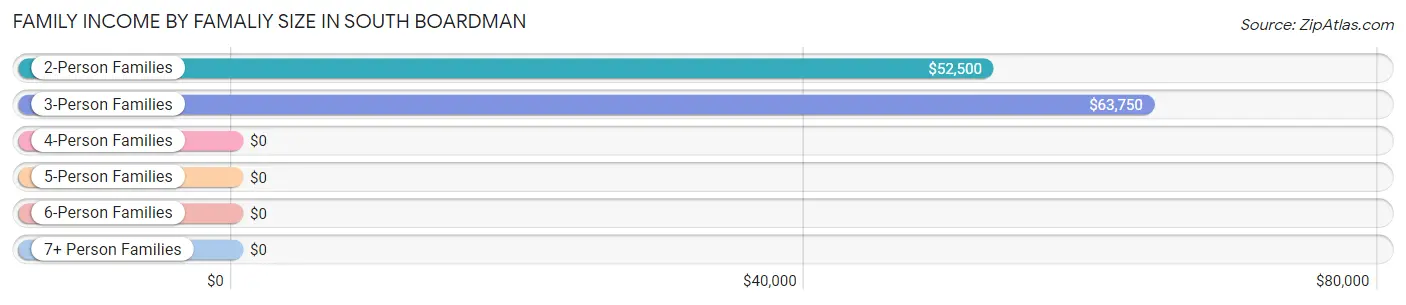
| Income Bracket | # Families | Median Income |
| 2-Person Families | 82 (51.9%) | $52,500 |
| 3-Person Families | 37 (23.4%) | $63,750 |
| 4-Person Families | 14 (8.9%) | $0 |
| 5-Person Families | 6 (3.8%) | $0 |
| 6-Person Families | 11 (7.0%) | $0 |
| 7+ Person Families | 8 (5.1%) | $0 |
| Total | 158 (100.0%) | $55,000 |
Family Income by Number of Earners in South Boardman
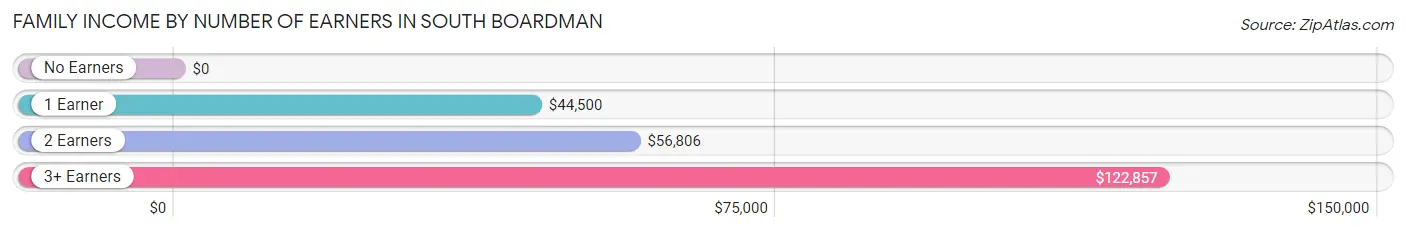
| Number of Earners | # Families | Median Income |
| No Earners | 49 (31.0%) | $0 |
| 1 Earner | 32 (20.3%) | $44,500 |
| 2 Earners | 47 (29.7%) | $56,806 |
| 3+ Earners | 30 (19.0%) | $122,857 |
| Total | 158 (100.0%) | $55,000 |
Household Income in South Boardman
Household Income Brackets in South Boardman
With 60 households falling in the category, the $100,000 to $149,999 income range is the most frequent in South Boardman, accounting for 27.0% of all households. In contrast, only 2 households (0.9%) fall into the $10,000 to $14,999 income bracket, making it the least populous group.
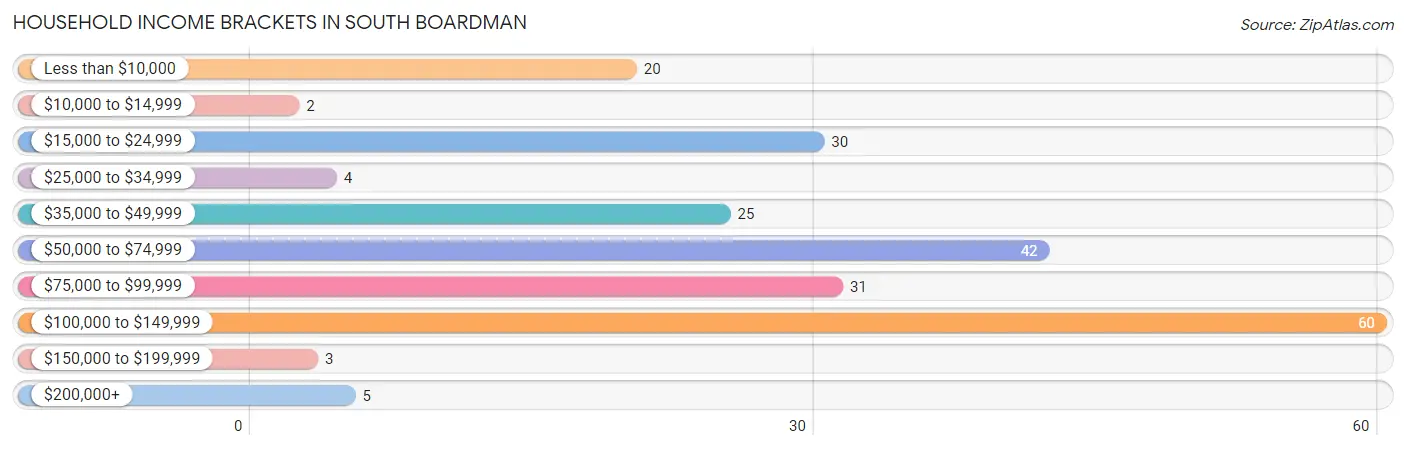
| Income Bracket | # Households | % Households |
| Less than $10,000 | 20 | 9.0% |
| $10,000 to $14,999 | 2 | 0.9% |
| $15,000 to $24,999 | 30 | 13.5% |
| $25,000 to $34,999 | 4 | 1.8% |
| $35,000 to $49,999 | 25 | 11.3% |
| $50,000 to $74,999 | 42 | 18.9% |
| $75,000 to $99,999 | 31 | 14.0% |
| $100,000 to $149,999 | 60 | 27.0% |
| $150,000 to $199,999 | 3 | 1.4% |
| $200,000+ | 5 | 2.3% |
Household Income by Householder Age in South Boardman
The median household income in South Boardman is $56,111, with the highest median household income of $118,583 found in the 25 to 44 years age bracket for the primary householder. A total of 80 households (36.0%) fall into this category.
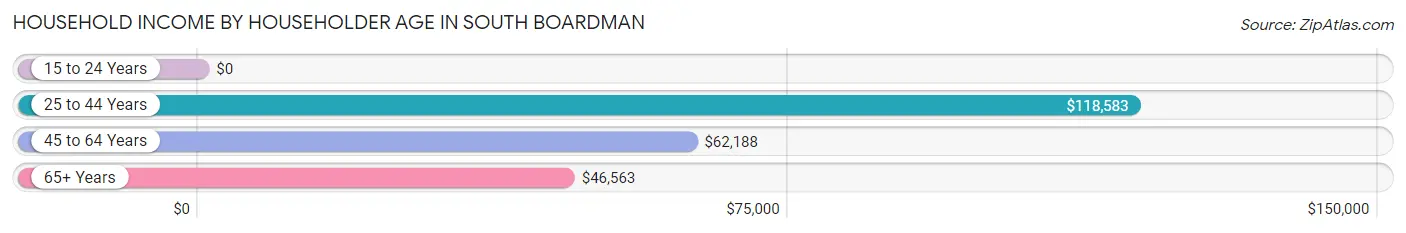
| Income Bracket | # Households | Median Income |
| 15 to 24 Years | 0 (0.0%) | $0 |
| 25 to 44 Years | 80 (36.0%) | $118,583 |
| 45 to 64 Years | 73 (32.9%) | $62,188 |
| 65+ Years | 69 (31.1%) | $46,563 |
| Total | 222 (100.0%) | $56,111 |
Poverty in South Boardman
Income Below Poverty by Sex and Age in South Boardman
With 10.4% poverty level for males and 11.5% for females among the residents of South Boardman, 18 to 24 year old males and 6 to 11 year old females are the most vulnerable to poverty, with 10 males (27.8%) and 7 females (46.7%) in their respective age groups living below the poverty level.
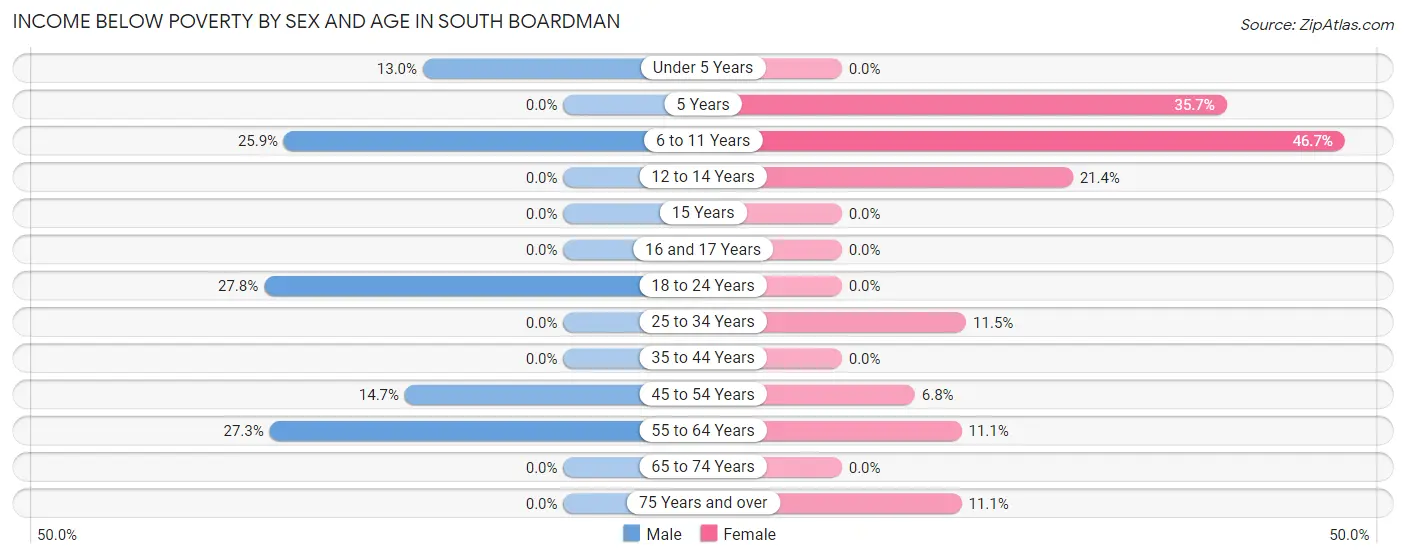
| Age Bracket | Male | Female |
| Under 5 Years | 3 (13.0%) | 0 (0.0%) |
| 5 Years | 0 (0.0%) | 5 (35.7%) |
| 6 to 11 Years | 7 (25.9%) | 7 (46.7%) |
| 12 to 14 Years | 0 (0.0%) | 3 (21.4%) |
| 15 Years | 0 (0.0%) | 0 (0.0%) |
| 16 and 17 Years | 0 (0.0%) | 0 (0.0%) |
| 18 to 24 Years | 10 (27.8%) | 0 (0.0%) |
| 25 to 34 Years | 0 (0.0%) | 9 (11.5%) |
| 35 to 44 Years | 0 (0.0%) | 0 (0.0%) |
| 45 to 54 Years | 5 (14.7%) | 4 (6.8%) |
| 55 to 64 Years | 9 (27.3%) | 3 (11.1%) |
| 65 to 74 Years | 0 (0.0%) | 0 (0.0%) |
| 75 Years and over | 0 (0.0%) | 2 (11.1%) |
| Total | 34 (10.4%) | 33 (11.5%) |
Income Above Poverty by Sex and Age in South Boardman
According to the poverty statistics in South Boardman, males aged 5 years and females aged under 5 years are the age groups that are most secure financially, with 100.0% of males and 100.0% of females in these age groups living above the poverty line.
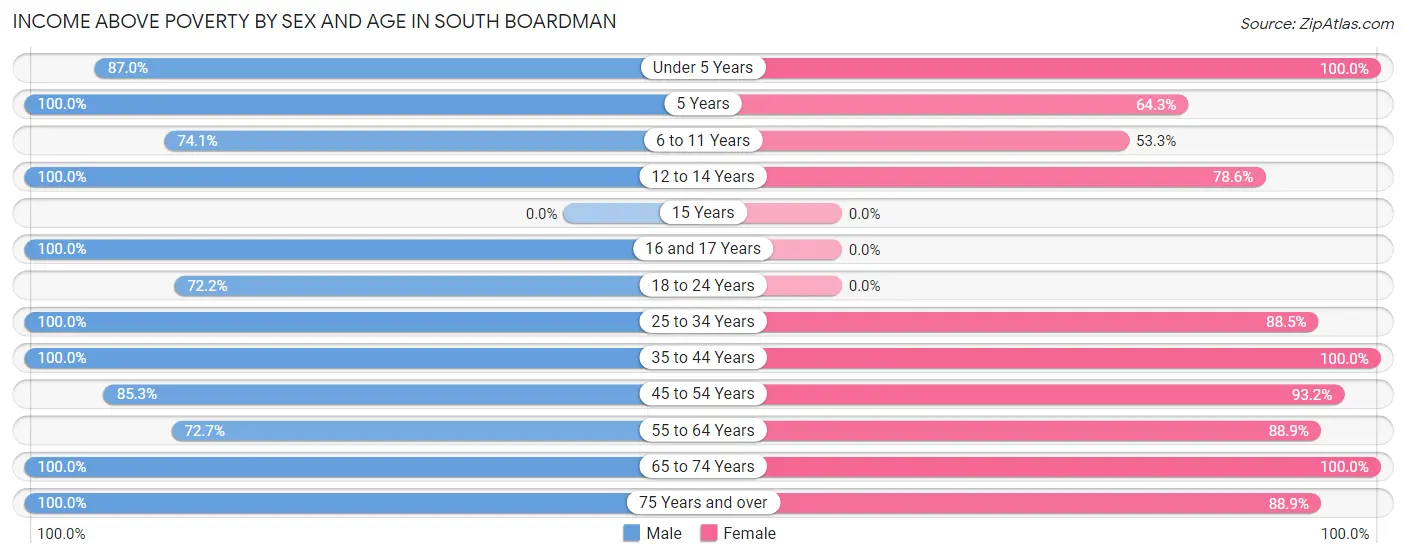
| Age Bracket | Male | Female |
| Under 5 Years | 20 (87.0%) | 4 (100.0%) |
| 5 Years | 4 (100.0%) | 9 (64.3%) |
| 6 to 11 Years | 20 (74.1%) | 8 (53.3%) |
| 12 to 14 Years | 7 (100.0%) | 11 (78.6%) |
| 15 Years | 0 (0.0%) | 0 (0.0%) |
| 16 and 17 Years | 22 (100.0%) | 0 (0.0%) |
| 18 to 24 Years | 26 (72.2%) | 0 (0.0%) |
| 25 to 34 Years | 56 (100.0%) | 69 (88.5%) |
| 35 to 44 Years | 29 (100.0%) | 31 (100.0%) |
| 45 to 54 Years | 29 (85.3%) | 55 (93.2%) |
| 55 to 64 Years | 24 (72.7%) | 24 (88.9%) |
| 65 to 74 Years | 35 (100.0%) | 26 (100.0%) |
| 75 Years and over | 21 (100.0%) | 16 (88.9%) |
| Total | 293 (89.6%) | 253 (88.5%) |
Income Below Poverty Among Married-Couple Families in South Boardman
The poverty statistics for married-couple families in South Boardman show that 3.4% or 4 of the total 119 families live below the poverty line. Families with no children have the highest poverty rate of 5.1%, comprising of 4 families. On the other hand, families with 1 or 2 children have the lowest poverty rate of 0.0%, which includes 0 families.
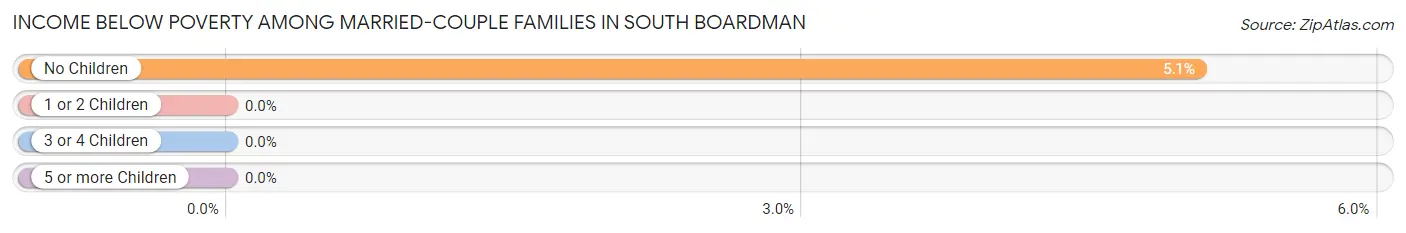
| Children | Above Poverty | Below Poverty |
| No Children | 75 (94.9%) | 4 (5.1%) |
| 1 or 2 Children | 29 (100.0%) | 0 (0.0%) |
| 3 or 4 Children | 6 (100.0%) | 0 (0.0%) |
| 5 or more Children | 5 (100.0%) | 0 (0.0%) |
| Total | 115 (96.6%) | 4 (3.4%) |
Income Below Poverty Among Single-Parent Households in South Boardman
According to the poverty data in South Boardman, 31.2% or 5 single-father households and 56.5% or 13 single-mother households are living below the poverty line. Among single-father households, those with 1 or 2 children have the highest poverty rate, with 5 households (31.2%) experiencing poverty. Likewise, among single-mother households, those with 3 or 4 children have the highest poverty rate, with 4 households (100.0%) falling below the poverty line.
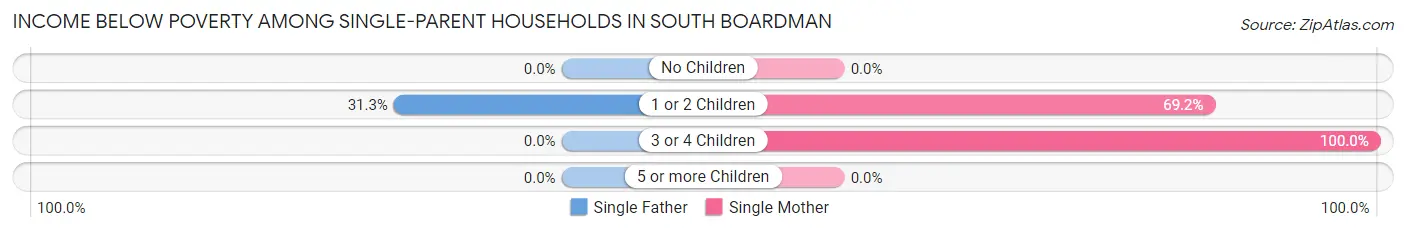
| Children | Single Father | Single Mother |
| No Children | 0 (0.0%) | 0 (0.0%) |
| 1 or 2 Children | 5 (31.2%) | 9 (69.2%) |
| 3 or 4 Children | 0 (0.0%) | 4 (100.0%) |
| 5 or more Children | 0 (0.0%) | 0 (0.0%) |
| Total | 5 (31.2%) | 13 (56.5%) |
Income Below Poverty Among Married-Couple vs Single-Parent Households in South Boardman
The poverty data for South Boardman shows that 4 of the married-couple family households (3.4%) and 18 of the single-parent households (46.2%) are living below the poverty level. Within the married-couple family households, those with no children have the highest poverty rate, with 4 households (5.1%) falling below the poverty line. Among the single-parent households, those with 3 or 4 children have the highest poverty rate, with 4 household (100.0%) living below poverty.
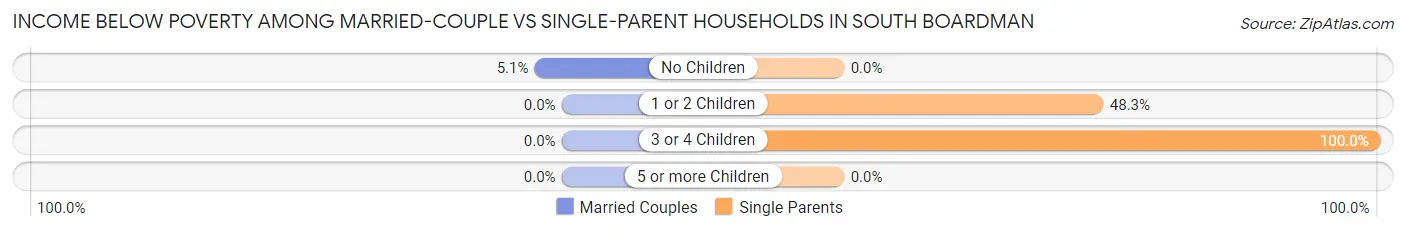
| Children | Married-Couple Families | Single-Parent Households |
| No Children | 4 (5.1%) | 0 (0.0%) |
| 1 or 2 Children | 0 (0.0%) | 14 (48.3%) |
| 3 or 4 Children | 0 (0.0%) | 4 (100.0%) |
| 5 or more Children | 0 (0.0%) | 0 (0.0%) |
| Total | 4 (3.4%) | 18 (46.2%) |
Race in South Boardman
The most populous races in South Boardman are White / Caucasian (570 | 93.0%), Two or more Races (21 | 3.4%), and Native / Alaskan (20 | 3.3%).
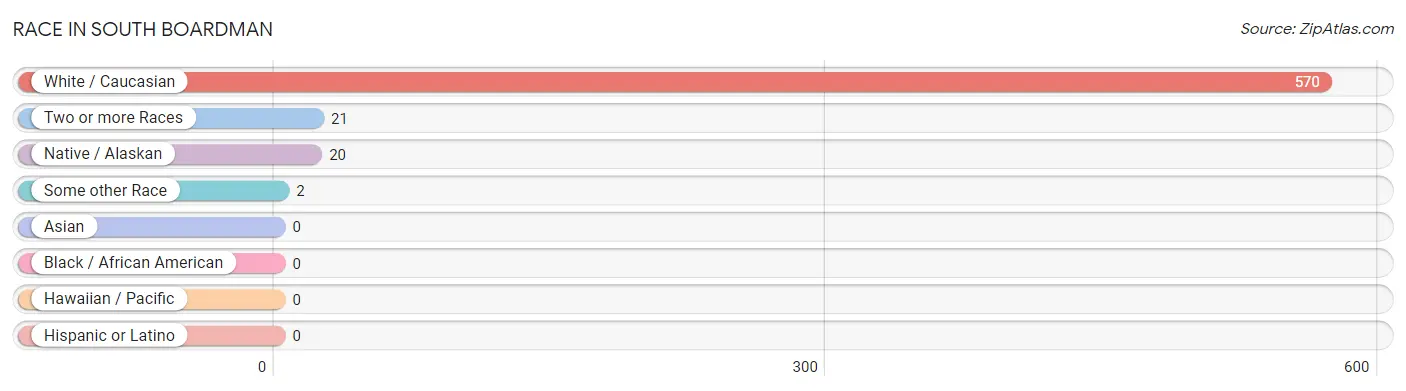
| Race | # Population | % Population |
| Asian | 0 | 0.0% |
| Black / African American | 0 | 0.0% |
| Hawaiian / Pacific | 0 | 0.0% |
| Hispanic or Latino | 0 | 0.0% |
| Native / Alaskan | 20 | 3.3% |
| White / Caucasian | 570 | 93.0% |
| Two or more Races | 21 | 3.4% |
| Some other Race | 2 | 0.3% |
| Total | 613 | 100.0% |
Ancestry in South Boardman
The most populous ancestries reported in South Boardman are German (152 | 24.8%), Dutch (88 | 14.4%), Irish (87 | 14.2%), English (65 | 10.6%), and Italian (38 | 6.2%), together accounting for 70.2% of all South Boardman residents.
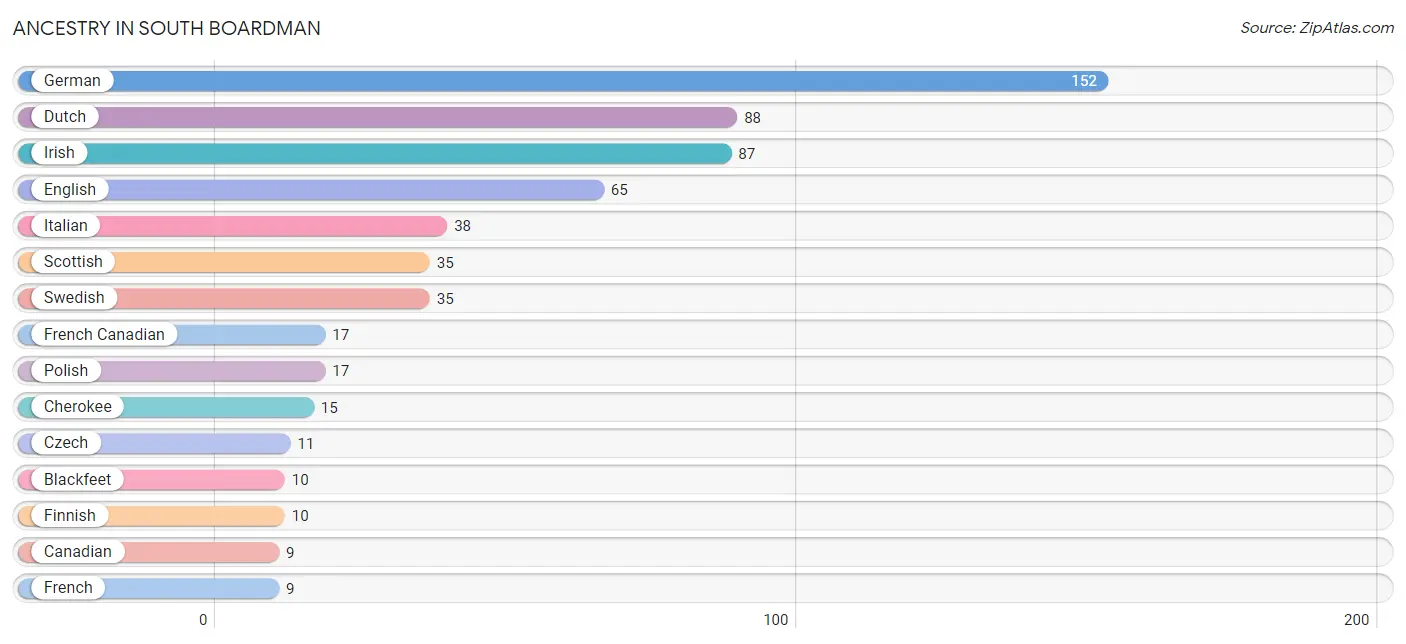
| Ancestry | # Population | % Population |
| American | 8 | 1.3% |
| Arab | 4 | 0.6% |
| Austrian | 5 | 0.8% |
| Blackfeet | 10 | 1.6% |
| British | 4 | 0.6% |
| Canadian | 9 | 1.5% |
| Cherokee | 15 | 2.5% |
| Chippewa | 5 | 0.8% |
| Czech | 11 | 1.8% |
| Danish | 3 | 0.5% |
| Dutch | 88 | 14.4% |
| English | 65 | 10.6% |
| European | 3 | 0.5% |
| Finnish | 10 | 1.6% |
| French | 9 | 1.5% |
| French Canadian | 17 | 2.8% |
| German | 152 | 24.8% |
| Iranian | 4 | 0.6% |
| Irish | 87 | 14.2% |
| Italian | 38 | 6.2% |
| Lebanese | 4 | 0.6% |
| Ottawa | 3 | 0.5% |
| Polish | 17 | 2.8% |
| Scottish | 35 | 5.7% |
| Swedish | 35 | 5.7% |
| Welsh | 2 | 0.3% | View All 26 Rows |
Immigrants in South Boardman
The most numerous immigrant groups reported in South Boardman came from , and Canada (2 | 0.3%), together accounting for 0.3% of all South Boardman residents.

| Immigration Origin | # Population | % Population |
| Canada | 2 | 0.3% | View All 1 Rows |
Sex and Age in South Boardman
Sex and Age in South Boardman
The most populous age groups in South Boardman are 25 to 29 Years (34 | 10.4%) for men and 25 to 29 Years (63 | 22.0%) for women.
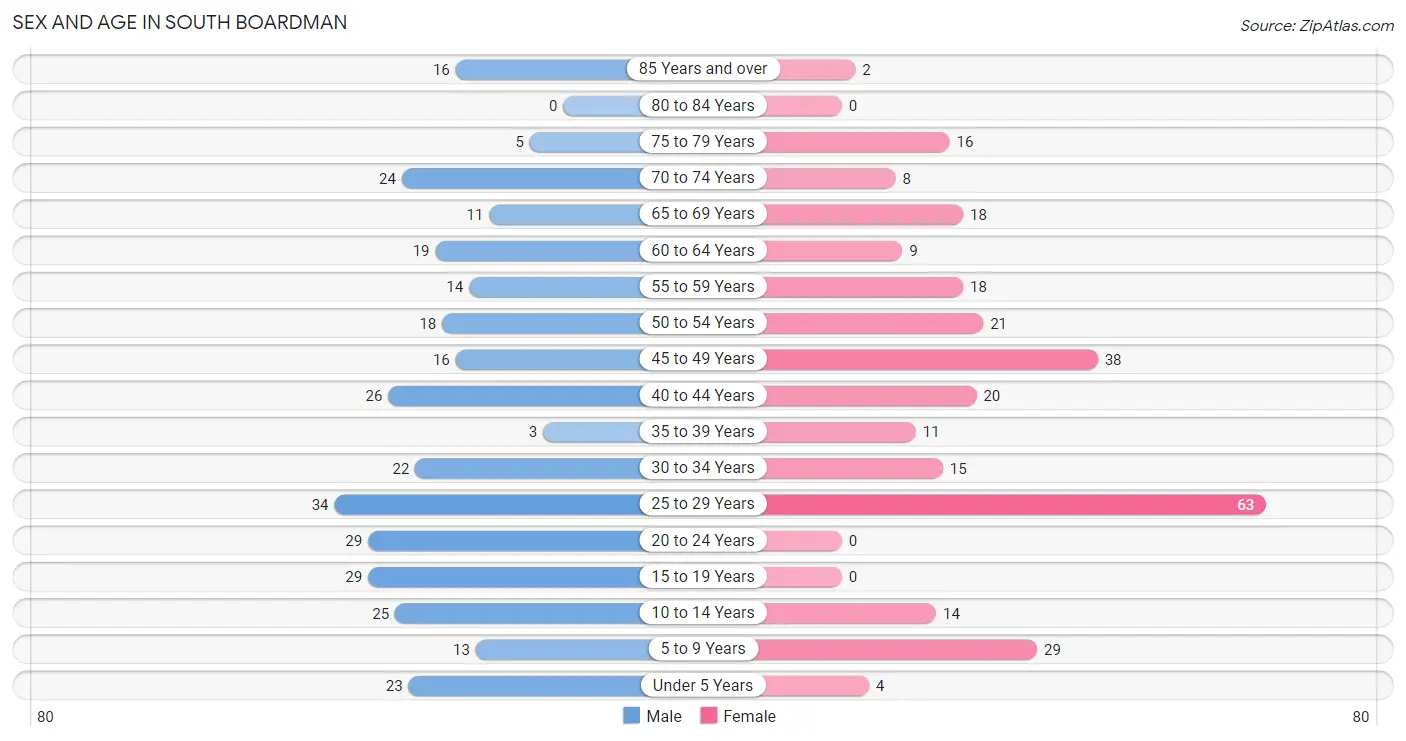
| Age Bracket | Male | Female |
| Under 5 Years | 23 (7.0%) | 4 (1.4%) |
| 5 to 9 Years | 13 (4.0%) | 29 (10.1%) |
| 10 to 14 Years | 25 (7.6%) | 14 (4.9%) |
| 15 to 19 Years | 29 (8.9%) | 0 (0.0%) |
| 20 to 24 Years | 29 (8.9%) | 0 (0.0%) |
| 25 to 29 Years | 34 (10.4%) | 63 (22.0%) |
| 30 to 34 Years | 22 (6.7%) | 15 (5.2%) |
| 35 to 39 Years | 3 (0.9%) | 11 (3.8%) |
| 40 to 44 Years | 26 (8.0%) | 20 (7.0%) |
| 45 to 49 Years | 16 (4.9%) | 38 (13.3%) |
| 50 to 54 Years | 18 (5.5%) | 21 (7.3%) |
| 55 to 59 Years | 14 (4.3%) | 18 (6.3%) |
| 60 to 64 Years | 19 (5.8%) | 9 (3.2%) |
| 65 to 69 Years | 11 (3.4%) | 18 (6.3%) |
| 70 to 74 Years | 24 (7.3%) | 8 (2.8%) |
| 75 to 79 Years | 5 (1.5%) | 16 (5.6%) |
| 80 to 84 Years | 0 (0.0%) | 0 (0.0%) |
| 85 Years and over | 16 (4.9%) | 2 (0.7%) |
| Total | 327 (100.0%) | 286 (100.0%) |
Families and Households in South Boardman
Median Family Size in South Boardman
The median family size in South Boardman is 3.13 persons per family, with married-couple families (119 | 75.3%) accounting for the largest median family size of 3.34 persons per family. On the other hand, single female/mother families (23 | 14.6%) represent the smallest median family size with 2.39 persons per family.
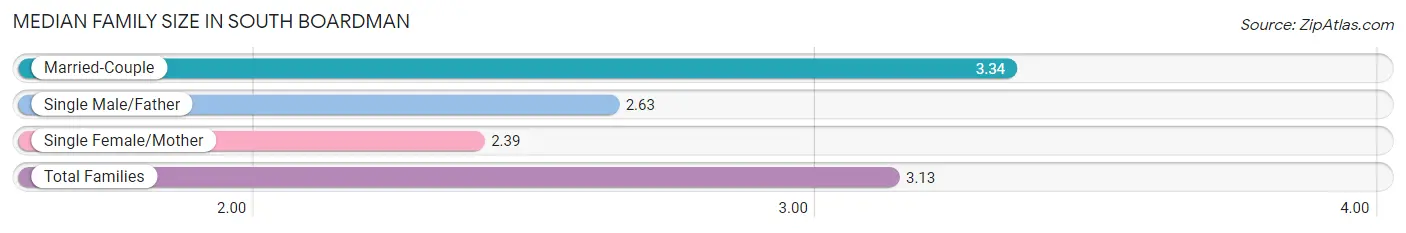
| Family Type | # Families | Family Size |
| Married-Couple | 119 (75.3%) | 3.34 |
| Single Male/Father | 16 (10.1%) | 2.63 |
| Single Female/Mother | 23 (14.6%) | 2.39 |
| Total Families | 158 (100.0%) | 3.13 |
Median Household Size in South Boardman
The median household size in South Boardman is 2.76 persons per household, with married-couple households (119 | 53.6%) accounting for the largest median household size of 3.39 persons per household. non-family households (64 | 28.8%) represent the smallest median household size with 1.45 persons per household.
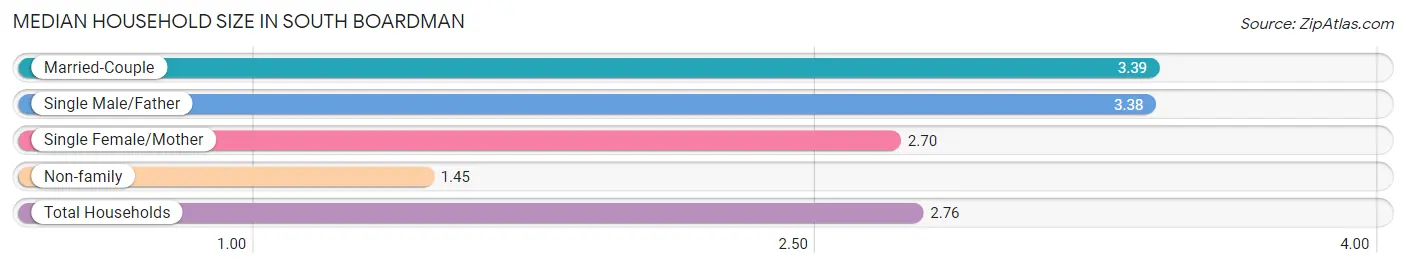
| Household Type | # Households | Household Size |
| Married-Couple | 119 (53.6%) | 3.39 |
| Single Male/Father | 16 (7.2%) | 3.38 |
| Single Female/Mother | 23 (10.4%) | 2.70 |
| Non-family | 64 (28.8%) | 1.45 |
| Total Households | 222 (100.0%) | 2.76 |
Household Size by Marriage Status in South Boardman
Out of a total of 222 households in South Boardman, 158 (71.2%) are family households, while 64 (28.8%) are nonfamily households. The most numerous type of family households are 2-person households, comprising 78, and the most common type of nonfamily households are 2-person households, comprising 37.
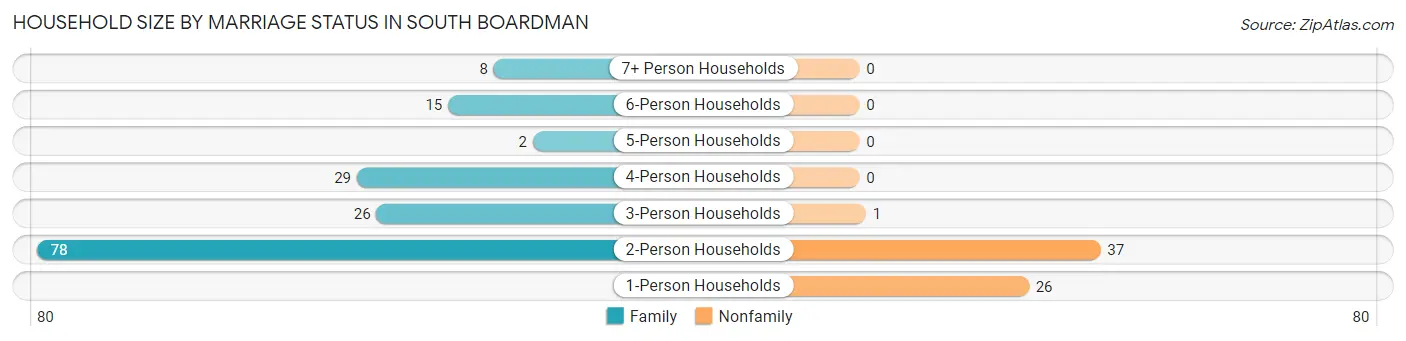
| Household Size | Family Households | Nonfamily Households |
| 1-Person Households | - | 26 (11.7%) |
| 2-Person Households | 78 (35.1%) | 37 (16.7%) |
| 3-Person Households | 26 (11.7%) | 1 (0.4%) |
| 4-Person Households | 29 (13.1%) | 0 (0.0%) |
| 5-Person Households | 2 (0.9%) | 0 (0.0%) |
| 6-Person Households | 15 (6.8%) | 0 (0.0%) |
| 7+ Person Households | 8 (3.6%) | 0 (0.0%) |
| Total | 158 (71.2%) | 64 (28.8%) |
Female Fertility in South Boardman
Fertility by Age in South Boardman
Average fertility rate in South Boardman is 19.0 births per 1,000 women. Women in the age bracket of 20 to 34 years have the highest fertility rate with 38.0 births per 1,000 women. Women in the age bracket of 20 to 34 years acount for 100.0% of all women with births.
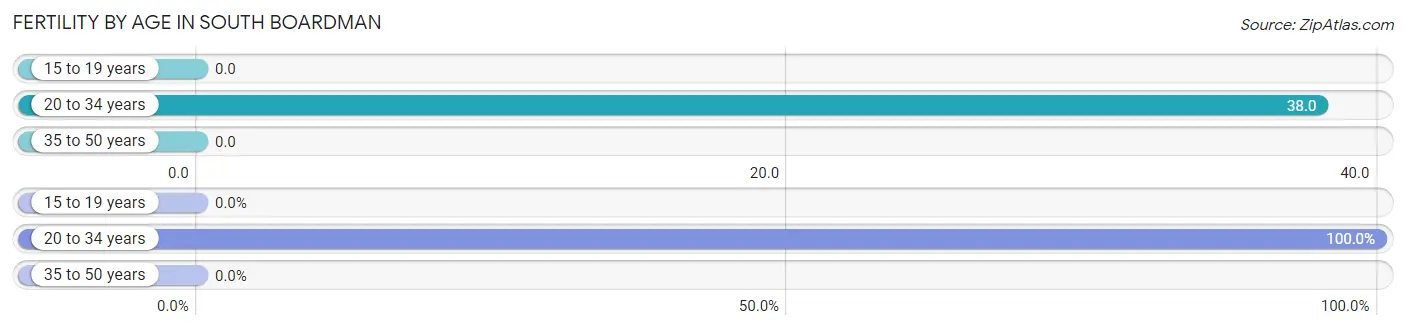
| Age Bracket | Women with Births | Births / 1,000 Women |
| 15 to 19 years | 0 (0.0%) | 0.0 |
| 20 to 34 years | 3 (100.0%) | 38.0 |
| 35 to 50 years | 0 (0.0%) | 0.0 |
| Total | 3 (100.0%) | 19.0 |
Fertility by Age by Marriage Status in South Boardman
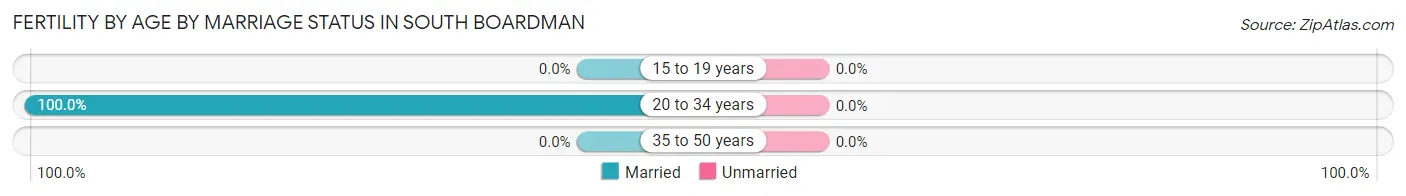
| Age Bracket | Married | Unmarried |
| 15 to 19 years | 0 (0.0%) | 0 (0.0%) |
| 20 to 34 years | 3 (100.0%) | 0 (0.0%) |
| 35 to 50 years | 0 (0.0%) | 0 (0.0%) |
| Total | 3 (100.0%) | 0 (0.0%) |
Fertility by Education in South Boardman
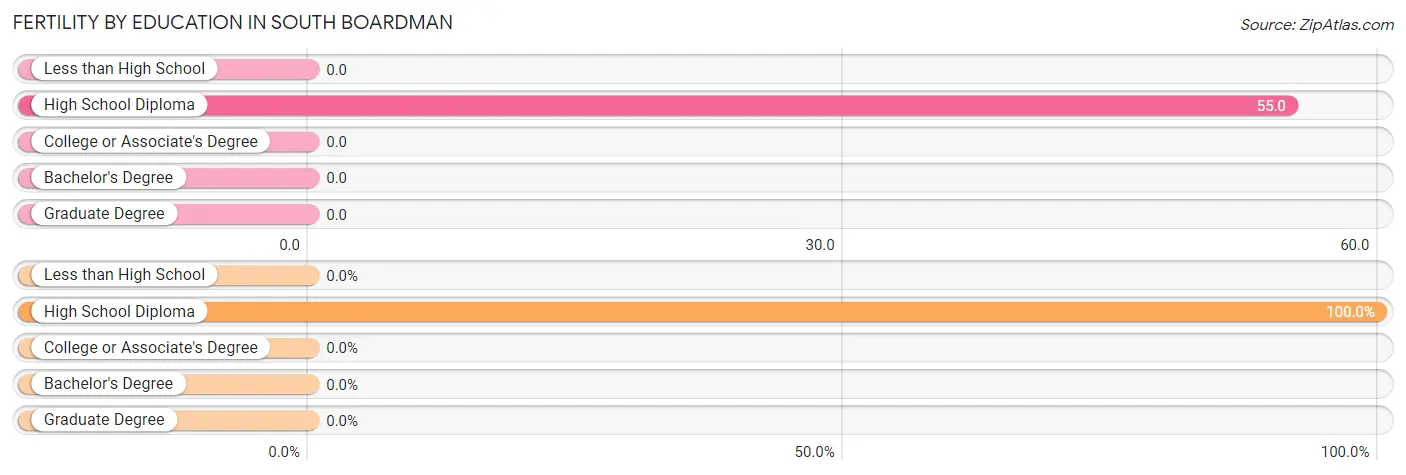
| Educational Attainment | Women with Births | Births / 1,000 Women |
| Less than High School | 0 (0.0%) | 0.0 |
| High School Diploma | 3 (100.0%) | 55.0 |
| College or Associate's Degree | 0 (0.0%) | 0.0 |
| Bachelor's Degree | 0 (0.0%) | 0.0 |
| Graduate Degree | 0 (0.0%) | 0.0 |
| Total | 3 (100.0%) | 19.0 |
Fertility by Education by Marriage Status in South Boardman
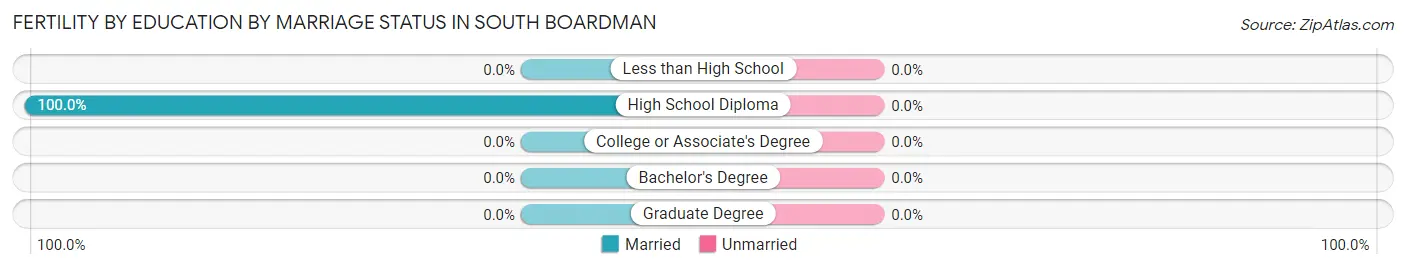
| Educational Attainment | Married | Unmarried |
| Less than High School | 0 (0.0%) | 0 (0.0%) |
| High School Diploma | 3 (100.0%) | 0 (0.0%) |
| College or Associate's Degree | 0 (0.0%) | 0 (0.0%) |
| Bachelor's Degree | 0 (0.0%) | 0 (0.0%) |
| Graduate Degree | 0 (0.0%) | 0 (0.0%) |
| Total | 3 (100.0%) | 0 (0.0%) |
Employment Characteristics in South Boardman
Employment by Class of Employer in South Boardman
Among the 292 employed individuals in South Boardman, private company employees (183 | 62.7%), not-for-profit organizations (56 | 19.2%), and self-employed (not incorporated) (15 | 5.1%) make up the most common classes of employment.
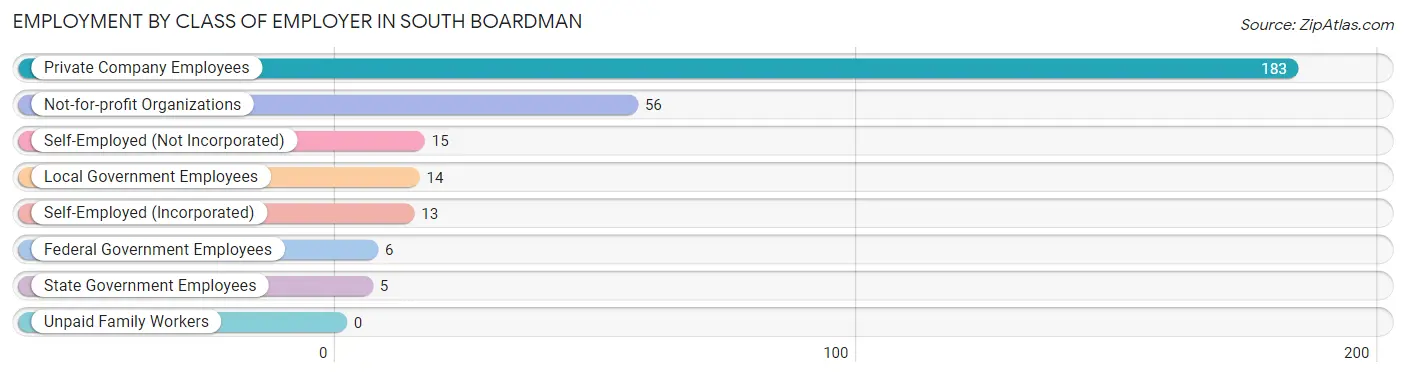
| Employer Class | # Employees | % Employees |
| Private Company Employees | 183 | 62.7% |
| Self-Employed (Incorporated) | 13 | 4.4% |
| Self-Employed (Not Incorporated) | 15 | 5.1% |
| Not-for-profit Organizations | 56 | 19.2% |
| Local Government Employees | 14 | 4.8% |
| State Government Employees | 5 | 1.7% |
| Federal Government Employees | 6 | 2.1% |
| Unpaid Family Workers | 0 | 0.0% |
| Total | 292 | 100.0% |
Employment Status by Age in South Boardman
According to the labor force statistics for South Boardman, out of the total population over 16 years of age (505), 63.4% or 320 individuals are in the labor force, with 2.5% or 8 of them unemployed. The age group with the highest labor force participation rate is 20 to 24 years, with 100.0% or 29 individuals in the labor force. Within the labor force, the 20 to 24 years age range has the highest percentage of unemployed individuals, with 20.7% or 6 of them being unemployed.
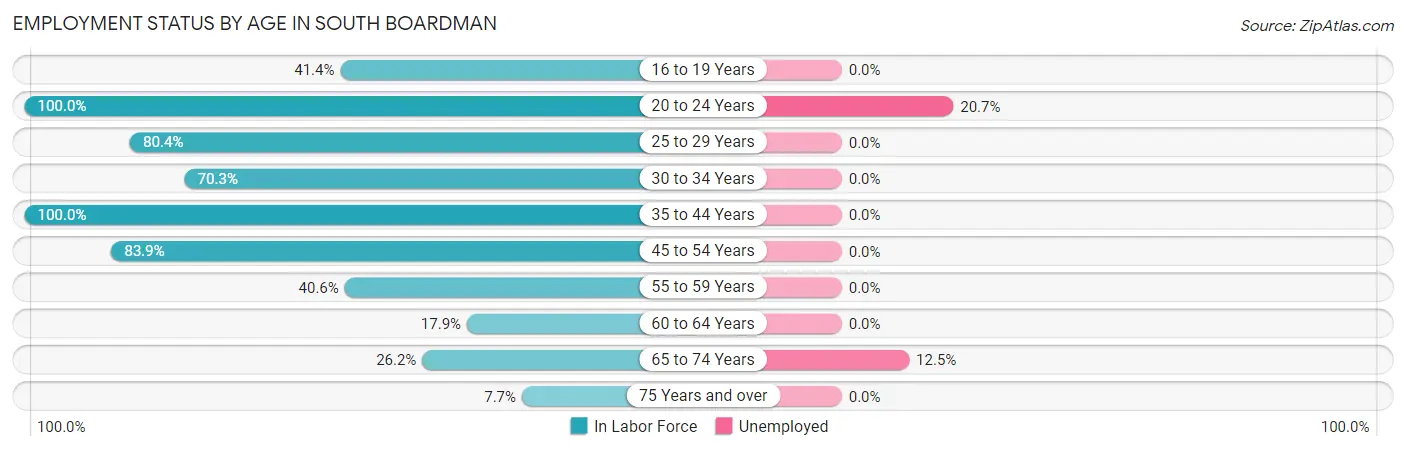
| Age Bracket | In Labor Force | Unemployed |
| 16 to 19 Years | 12 (41.4%) | 0 (0.0%) |
| 20 to 24 Years | 29 (100.0%) | 6 (20.7%) |
| 25 to 29 Years | 78 (80.4%) | 0 (0.0%) |
| 30 to 34 Years | 26 (70.3%) | 0 (0.0%) |
| 35 to 44 Years | 60 (100.0%) | 0 (0.0%) |
| 45 to 54 Years | 78 (83.9%) | 0 (0.0%) |
| 55 to 59 Years | 13 (40.6%) | 0 (0.0%) |
| 60 to 64 Years | 5 (17.9%) | 0 (0.0%) |
| 65 to 74 Years | 16 (26.2%) | 2 (12.5%) |
| 75 Years and over | 3 (7.7%) | 0 (0.0%) |
| Total | 320 (63.4%) | 8 (2.5%) |
Employment Status by Educational Attainment in South Boardman
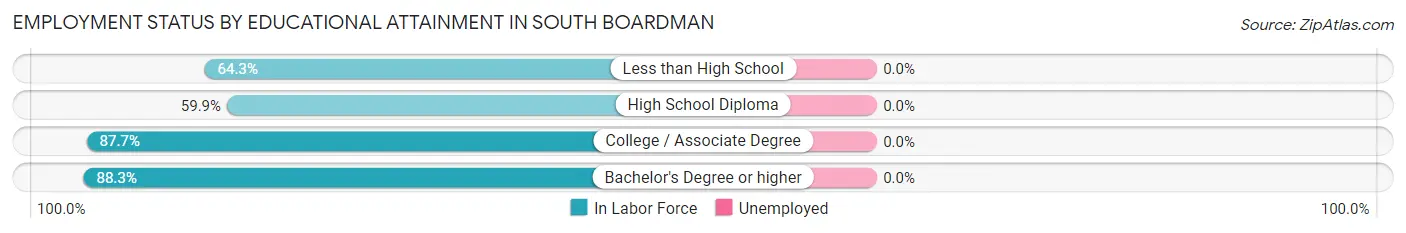
| Educational Attainment | In Labor Force | Unemployed |
| Less than High School | 18 (64.3%) | 0 (0.0%) |
| High School Diploma | 82 (59.9%) | 0 (0.0%) |
| College / Associate Degree | 107 (87.7%) | 0 (0.0%) |
| Bachelor's Degree or higher | 53 (88.3%) | 0 (0.0%) |
| Total | 260 (74.9%) | 0 (0.0%) |
Employment Occupations by Sex in South Boardman
Management, Business, Science and Arts Occupations
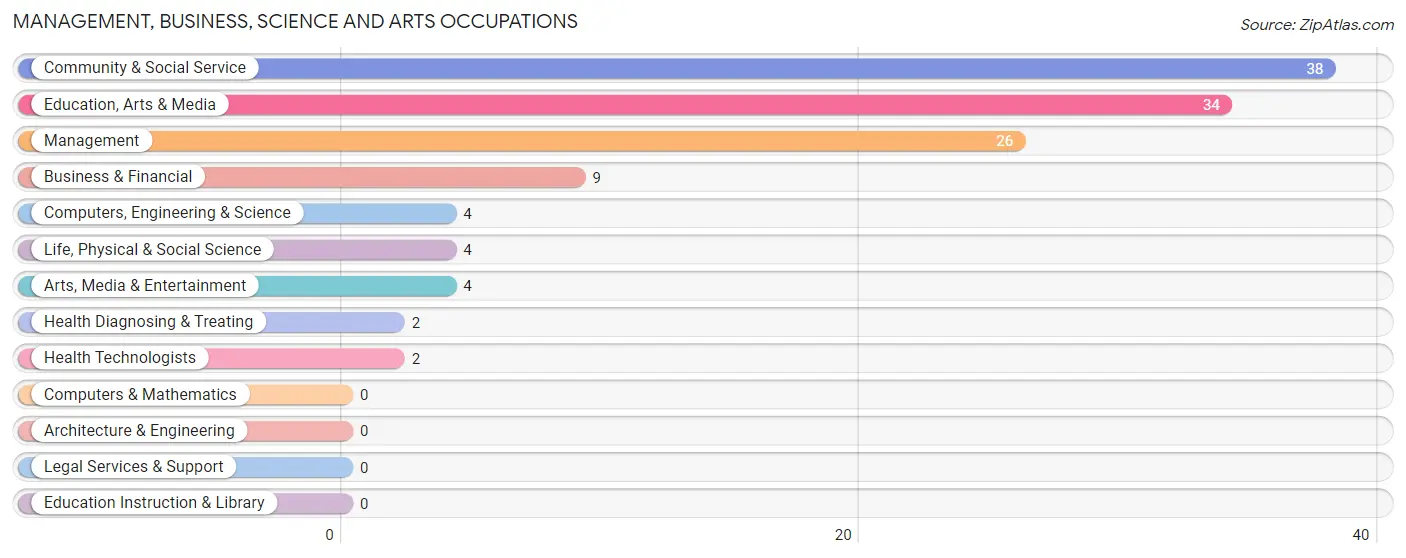
The most common Management, Business, Science and Arts occupations in South Boardman are Community & Social Service (38 | 12.4%), Education, Arts & Media (34 | 11.1%), Management (26 | 8.5%), Business & Financial (9 | 2.9%), and Computers, Engineering & Science (4 | 1.3%).
Management, Business, Science and Arts Occupations by Sex
Within the Management, Business, Science and Arts occupations in South Boardman, the most male-oriented occupations are Computers, Engineering & Science (100.0%), Life, Physical & Social Science (100.0%), and Arts, Media & Entertainment (100.0%), while the most female-oriented occupations are Business & Financial (100.0%), Education, Arts & Media (91.2%), and Community & Social Service (81.6%).
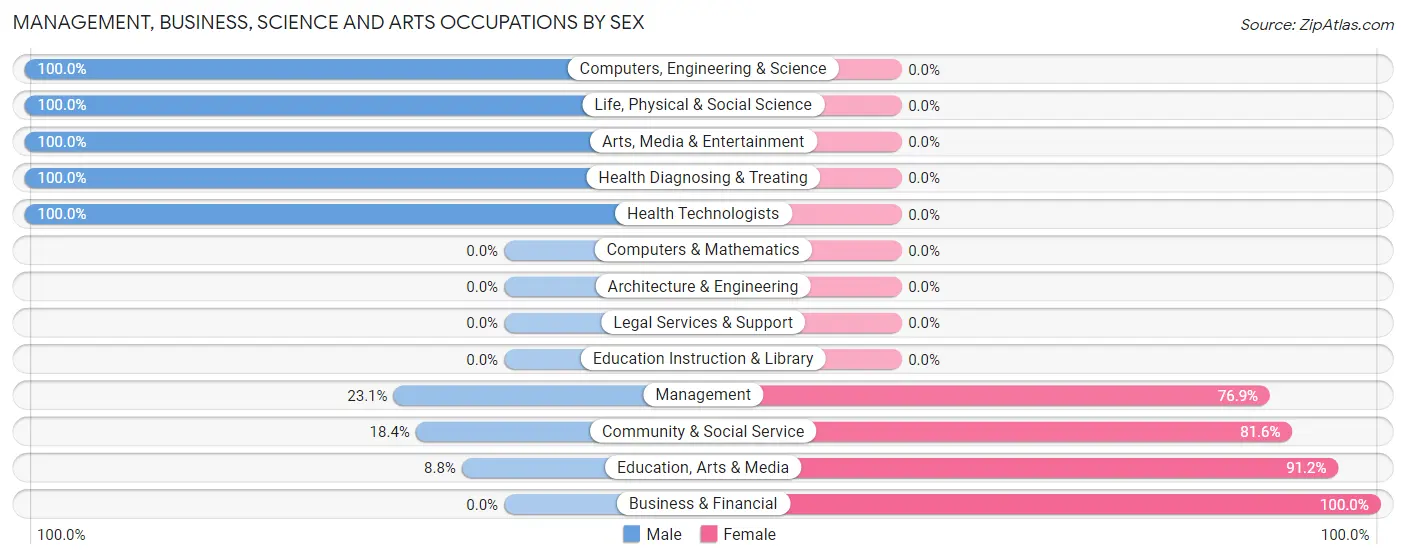
| Occupation | Male | Female |
| Management | 6 (23.1%) | 20 (76.9%) |
| Business & Financial | 0 (0.0%) | 9 (100.0%) |
| Computers, Engineering & Science | 4 (100.0%) | 0 (0.0%) |
| Computers & Mathematics | 0 (0.0%) | 0 (0.0%) |
| Architecture & Engineering | 0 (0.0%) | 0 (0.0%) |
| Life, Physical & Social Science | 4 (100.0%) | 0 (0.0%) |
| Community & Social Service | 7 (18.4%) | 31 (81.6%) |
| Education, Arts & Media | 3 (8.8%) | 31 (91.2%) |
| Legal Services & Support | 0 (0.0%) | 0 (0.0%) |
| Education Instruction & Library | 0 (0.0%) | 0 (0.0%) |
| Arts, Media & Entertainment | 4 (100.0%) | 0 (0.0%) |
| Health Diagnosing & Treating | 2 (100.0%) | 0 (0.0%) |
| Health Technologists | 2 (100.0%) | 0 (0.0%) |
| Total (Category) | 19 (24.0%) | 60 (75.9%) |
| Total (Overall) | 159 (52.0%) | 147 (48.0%) |
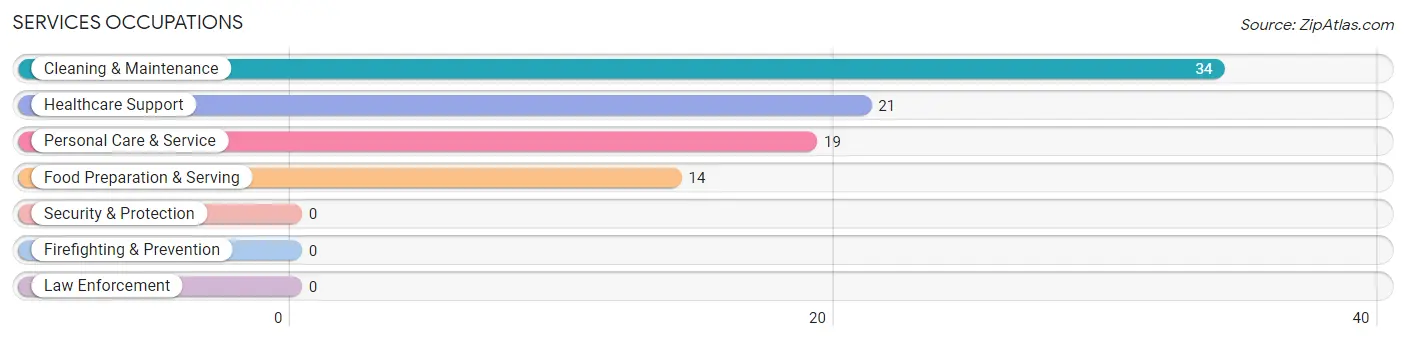
Services Occupations
The most common Services occupations in South Boardman are Cleaning & Maintenance (34 | 11.1%), Healthcare Support (21 | 6.9%), Personal Care & Service (19 | 6.2%), and Food Preparation & Serving (14 | 4.6%).
Services Occupations by Sex
Within the Services occupations in South Boardman, the most male-oriented occupations are Personal Care & Service (84.2%), and Cleaning & Maintenance (55.9%), while the most female-oriented occupations are Healthcare Support (100.0%), Food Preparation & Serving (100.0%), and Cleaning & Maintenance (44.1%).
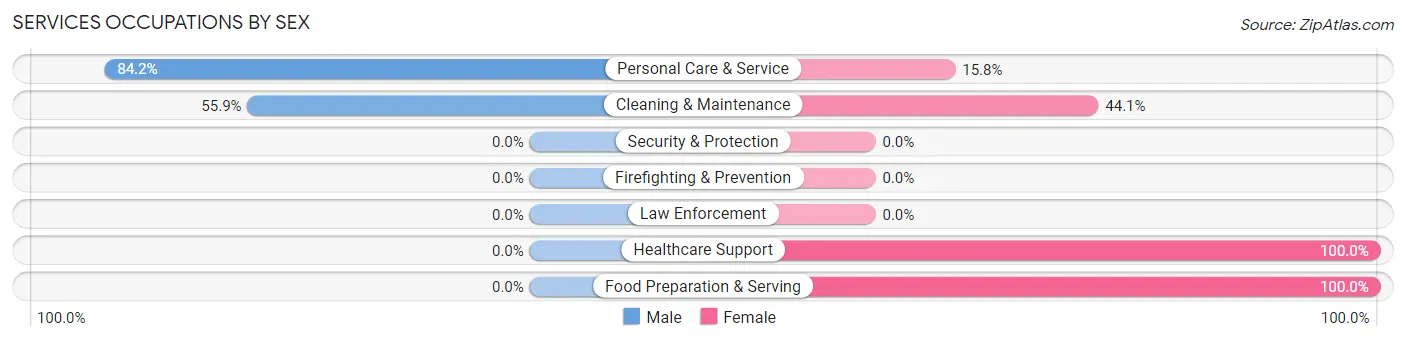
| Occupation | Male | Female |
| Healthcare Support | 0 (0.0%) | 21 (100.0%) |
| Security & Protection | 0 (0.0%) | 0 (0.0%) |
| Firefighting & Prevention | 0 (0.0%) | 0 (0.0%) |
| Law Enforcement | 0 (0.0%) | 0 (0.0%) |
| Food Preparation & Serving | 0 (0.0%) | 14 (100.0%) |
| Cleaning & Maintenance | 19 (55.9%) | 15 (44.1%) |
| Personal Care & Service | 16 (84.2%) | 3 (15.8%) |
| Total (Category) | 35 (39.8%) | 53 (60.2%) |
| Total (Overall) | 159 (52.0%) | 147 (48.0%) |
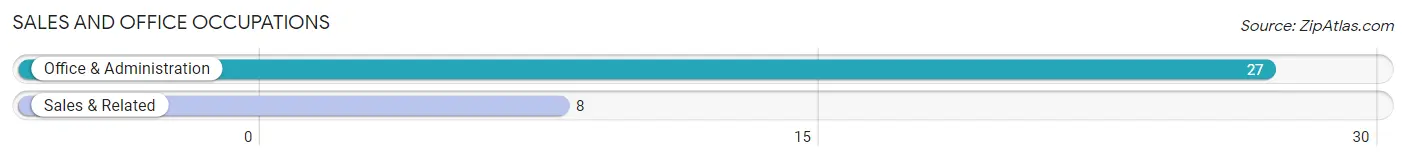
Sales and Office Occupations
The most common Sales and Office occupations in South Boardman are Office & Administration (27 | 8.8%), and Sales & Related (8 | 2.6%).
Sales and Office Occupations by Sex
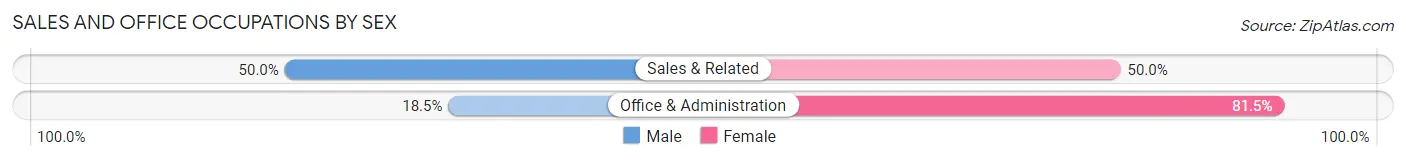
| Occupation | Male | Female |
| Sales & Related | 4 (50.0%) | 4 (50.0%) |
| Office & Administration | 5 (18.5%) | 22 (81.5%) |
| Total (Category) | 9 (25.7%) | 26 (74.3%) |
| Total (Overall) | 159 (52.0%) | 147 (48.0%) |
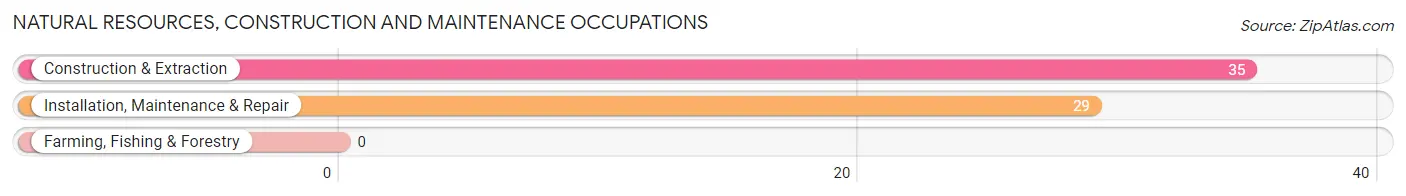
Natural Resources, Construction and Maintenance Occupations
The most common Natural Resources, Construction and Maintenance occupations in South Boardman are Construction & Extraction (35 | 11.4%), and Installation, Maintenance & Repair (29 | 9.5%).
Natural Resources, Construction and Maintenance Occupations by Sex
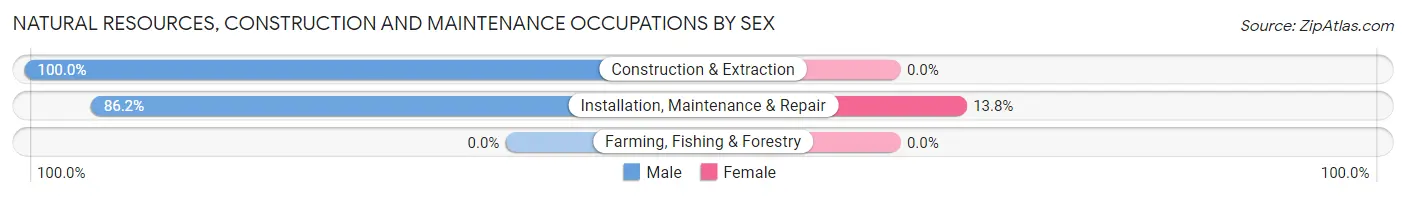
| Occupation | Male | Female |
| Farming, Fishing & Forestry | 0 (0.0%) | 0 (0.0%) |
| Construction & Extraction | 35 (100.0%) | 0 (0.0%) |
| Installation, Maintenance & Repair | 25 (86.2%) | 4 (13.8%) |
| Total (Category) | 60 (93.8%) | 4 (6.2%) |
| Total (Overall) | 159 (52.0%) | 147 (48.0%) |
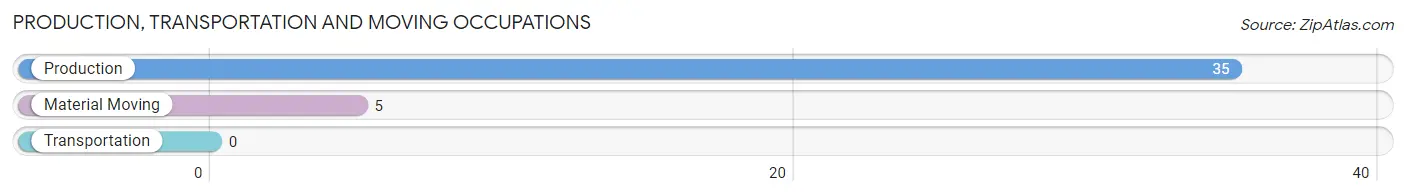
Production, Transportation and Moving Occupations
The most common Production, Transportation and Moving occupations in South Boardman are Production (35 | 11.4%), and Material Moving (5 | 1.6%).
Production, Transportation and Moving Occupations by Sex
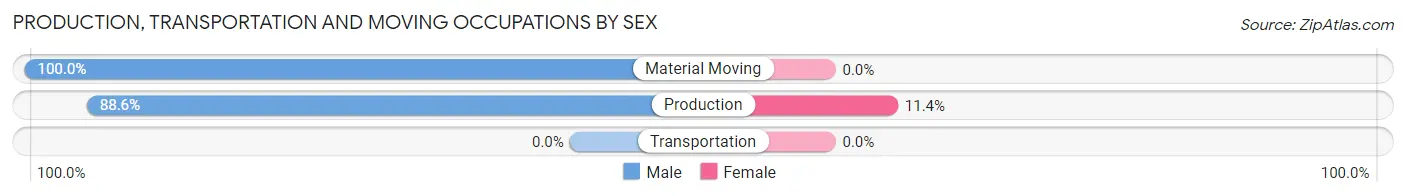
| Occupation | Male | Female |
| Production | 31 (88.6%) | 4 (11.4%) |
| Transportation | 0 (0.0%) | 0 (0.0%) |
| Material Moving | 5 (100.0%) | 0 (0.0%) |
| Total (Category) | 36 (90.0%) | 4 (10.0%) |
| Total (Overall) | 159 (52.0%) | 147 (48.0%) |
Employment Industries by Sex in South Boardman
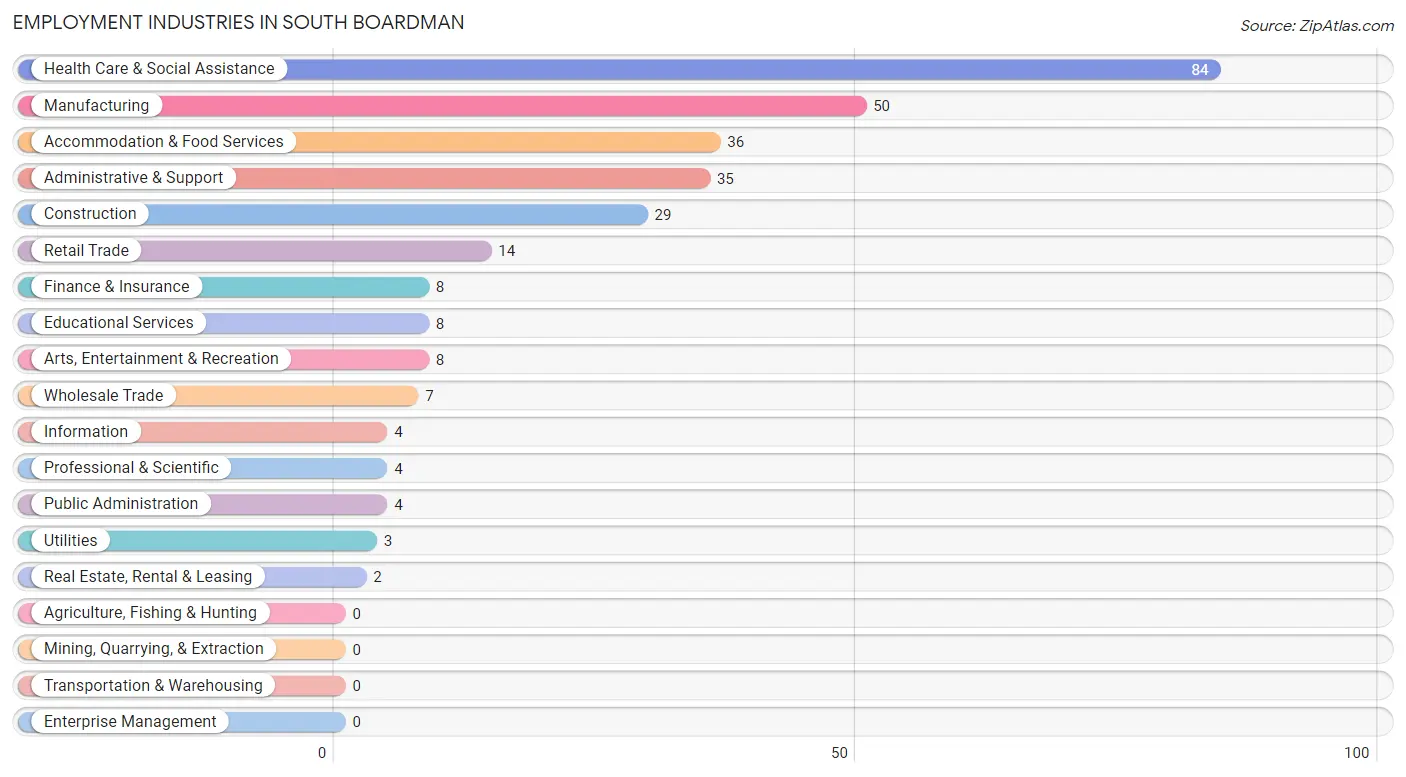
Employment Industries in South Boardman
The major employment industries in South Boardman include Health Care & Social Assistance (84 | 27.5%), Manufacturing (50 | 16.3%), Accommodation & Food Services (36 | 11.8%), Administrative & Support (35 | 11.4%), and Construction (29 | 9.5%).
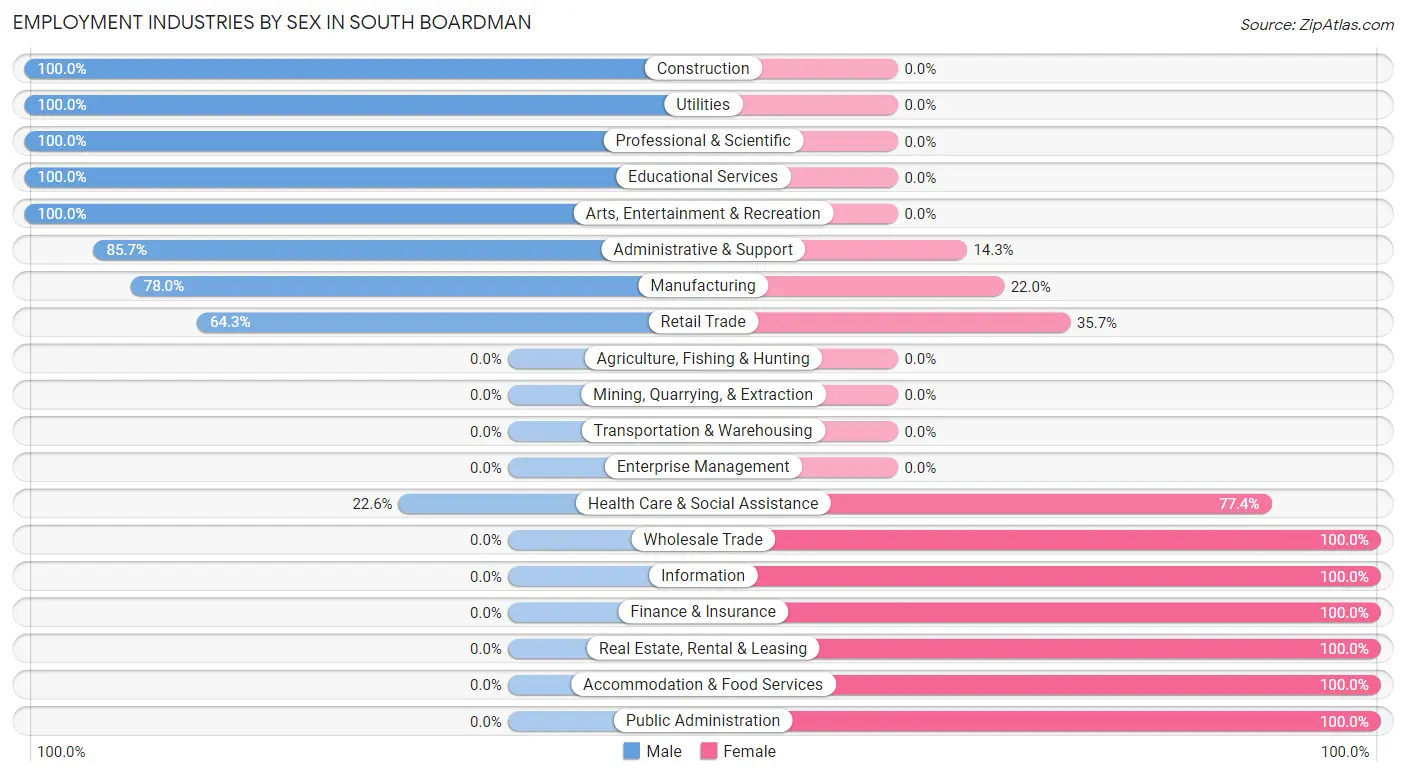
Employment Industries by Sex in South Boardman
The South Boardman industries that see more men than women are Construction (100.0%), Utilities (100.0%), and Professional & Scientific (100.0%), whereas the industries that tend to have a higher number of women are Wholesale Trade (100.0%), Information (100.0%), and Finance & Insurance (100.0%).
| Industry | Male | Female |
| Agriculture, Fishing & Hunting | 0 (0.0%) | 0 (0.0%) |
| Mining, Quarrying, & Extraction | 0 (0.0%) | 0 (0.0%) |
| Construction | 29 (100.0%) | 0 (0.0%) |
| Manufacturing | 39 (78.0%) | 11 (22.0%) |
| Wholesale Trade | 0 (0.0%) | 7 (100.0%) |
| Retail Trade | 9 (64.3%) | 5 (35.7%) |
| Transportation & Warehousing | 0 (0.0%) | 0 (0.0%) |
| Utilities | 3 (100.0%) | 0 (0.0%) |
| Information | 0 (0.0%) | 4 (100.0%) |
| Finance & Insurance | 0 (0.0%) | 8 (100.0%) |
| Real Estate, Rental & Leasing | 0 (0.0%) | 2 (100.0%) |
| Professional & Scientific | 4 (100.0%) | 0 (0.0%) |
| Enterprise Management | 0 (0.0%) | 0 (0.0%) |
| Administrative & Support | 30 (85.7%) | 5 (14.3%) |
| Educational Services | 8 (100.0%) | 0 (0.0%) |
| Health Care & Social Assistance | 19 (22.6%) | 65 (77.4%) |
| Arts, Entertainment & Recreation | 8 (100.0%) | 0 (0.0%) |
| Accommodation & Food Services | 0 (0.0%) | 36 (100.0%) |
| Public Administration | 0 (0.0%) | 4 (100.0%) |
| Total | 159 (52.0%) | 147 (48.0%) |
Education in South Boardman
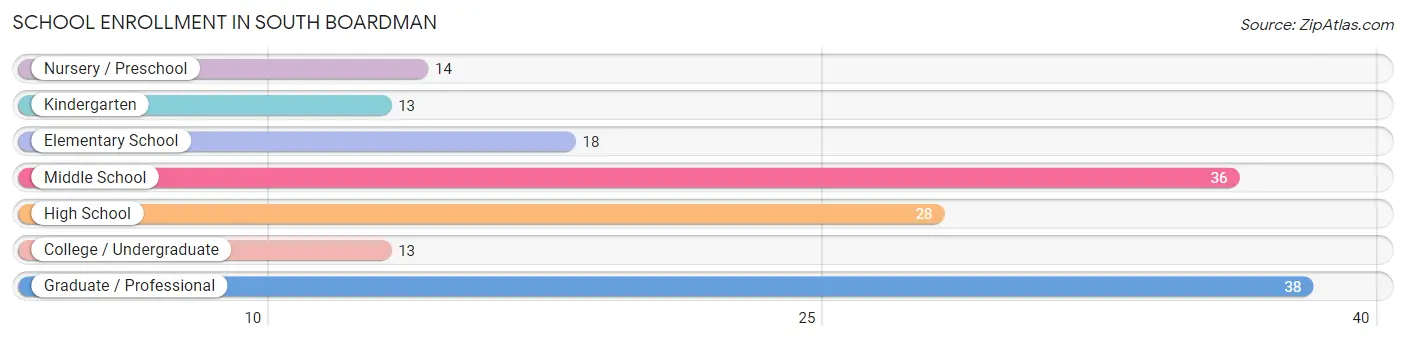
School Enrollment in South Boardman
The most common levels of schooling among the 160 students in South Boardman are graduate / professional (38 | 23.7%), middle school (36 | 22.5%), and high school (28 | 17.5%).
| School Level | # Students | % Students |
| Nursery / Preschool | 14 | 8.7% |
| Kindergarten | 13 | 8.1% |
| Elementary School | 18 | 11.3% |
| Middle School | 36 | 22.5% |
| High School | 28 | 17.5% |
| College / Undergraduate | 13 | 8.1% |
| Graduate / Professional | 38 | 23.7% |
| Total | 160 | 100.0% |
School Enrollment by Age by Funding Source in South Boardman
Out of a total of 160 students who are enrolled in schools in South Boardman, 45 (28.1%) attend a private institution, while the remaining 115 (71.9%) are enrolled in public schools. The age group of 25 to 34 year olds has the highest likelihood of being enrolled in private schools, with 38 (100.0% in the age bracket) enrolled. Conversely, the age group of 3 to 4 year olds has the lowest likelihood of being enrolled in a private school, with 3 (100.0% in the age bracket) attending a public institution.
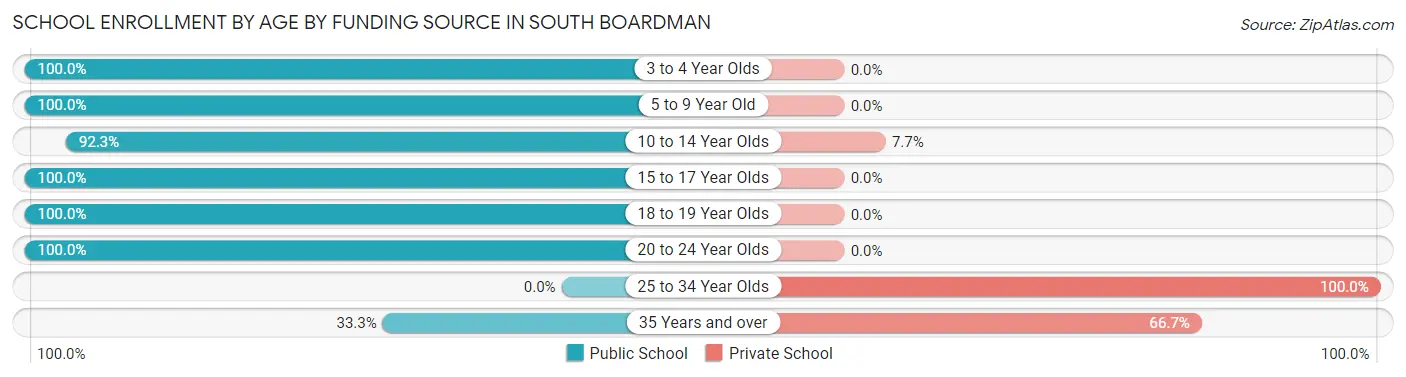
| Age Bracket | Public School | Private School |
| 3 to 4 Year Olds | 3 (100.0%) | 0 (0.0%) |
| 5 to 9 Year Old | 42 (100.0%) | 0 (0.0%) |
| 10 to 14 Year Olds | 36 (92.3%) | 3 (7.7%) |
| 15 to 17 Year Olds | 22 (100.0%) | 0 (0.0%) |
| 18 to 19 Year Olds | 3 (100.0%) | 0 (0.0%) |
| 20 to 24 Year Olds | 7 (100.0%) | 0 (0.0%) |
| 25 to 34 Year Olds | 0 (0.0%) | 38 (100.0%) |
| 35 Years and over | 2 (33.3%) | 4 (66.7%) |
| Total | 115 (71.9%) | 45 (28.1%) |
Educational Attainment by Field of Study in South Boardman
Science & technology (30 | 47.6%), business (8 | 12.7%), visual & performing arts (8 | 12.7%), education (5 | 7.9%), and bio, nature & agricultural (4 | 6.4%) are the most common fields of study among 63 individuals in South Boardman who have obtained a bachelor's degree or higher.
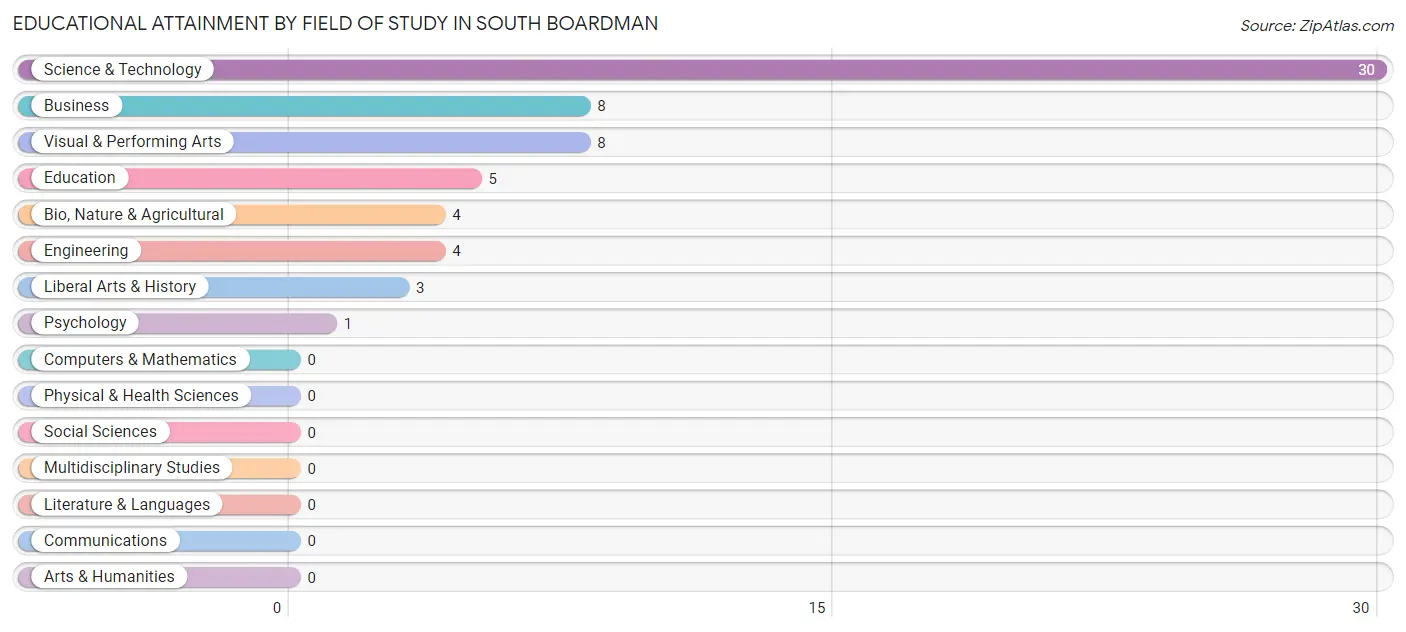
| Field of Study | # Graduates | % Graduates |
| Computers & Mathematics | 0 | 0.0% |
| Bio, Nature & Agricultural | 4 | 6.4% |
| Physical & Health Sciences | 0 | 0.0% |
| Psychology | 1 | 1.6% |
| Social Sciences | 0 | 0.0% |
| Engineering | 4 | 6.4% |
| Multidisciplinary Studies | 0 | 0.0% |
| Science & Technology | 30 | 47.6% |
| Business | 8 | 12.7% |
| Education | 5 | 7.9% |
| Literature & Languages | 0 | 0.0% |
| Liberal Arts & History | 3 | 4.8% |
| Visual & Performing Arts | 8 | 12.7% |
| Communications | 0 | 0.0% |
| Arts & Humanities | 0 | 0.0% |
| Total | 63 | 100.0% |
Transportation & Commute in South Boardman
Vehicle Availability by Sex in South Boardman
The most prevalent vehicle ownership categories in South Boardman are males with 2 vehicles (63, accounting for 41.2%) and females with 2 vehicles (56, making up 45.3%).
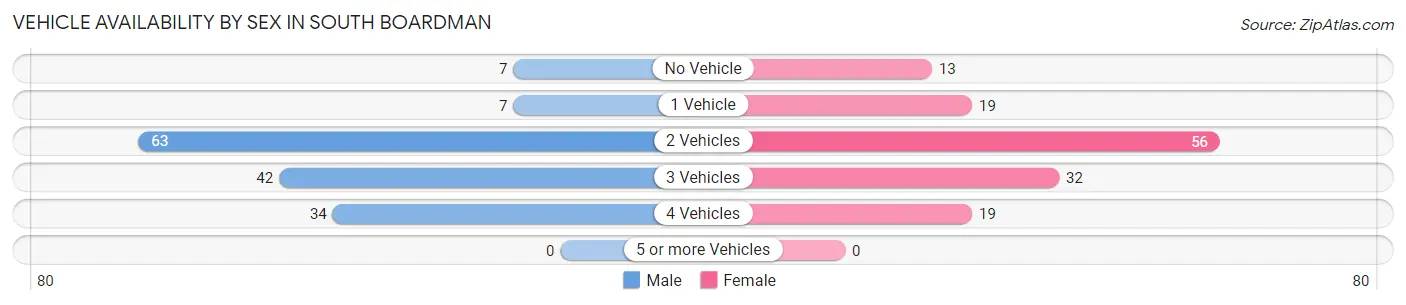
| Vehicles Available | Male | Female |
| No Vehicle | 7 (4.6%) | 13 (9.3%) |
| 1 Vehicle | 7 (4.6%) | 19 (13.7%) |
| 2 Vehicles | 63 (41.2%) | 56 (40.3%) |
| 3 Vehicles | 42 (27.5%) | 32 (23.0%) |
| 4 Vehicles | 34 (22.2%) | 19 (13.7%) |
| 5 or more Vehicles | 0 (0.0%) | 0 (0.0%) |
| Total | 153 (100.0%) | 139 (100.0%) |
Commute Time in South Boardman
The most frequently occuring commute durations in South Boardman are 45 to 59 minutes (94 commuters, 33.6%), 30 to 34 minutes (48 commuters, 17.1%), and 60 to 89 minutes (33 commuters, 11.8%).
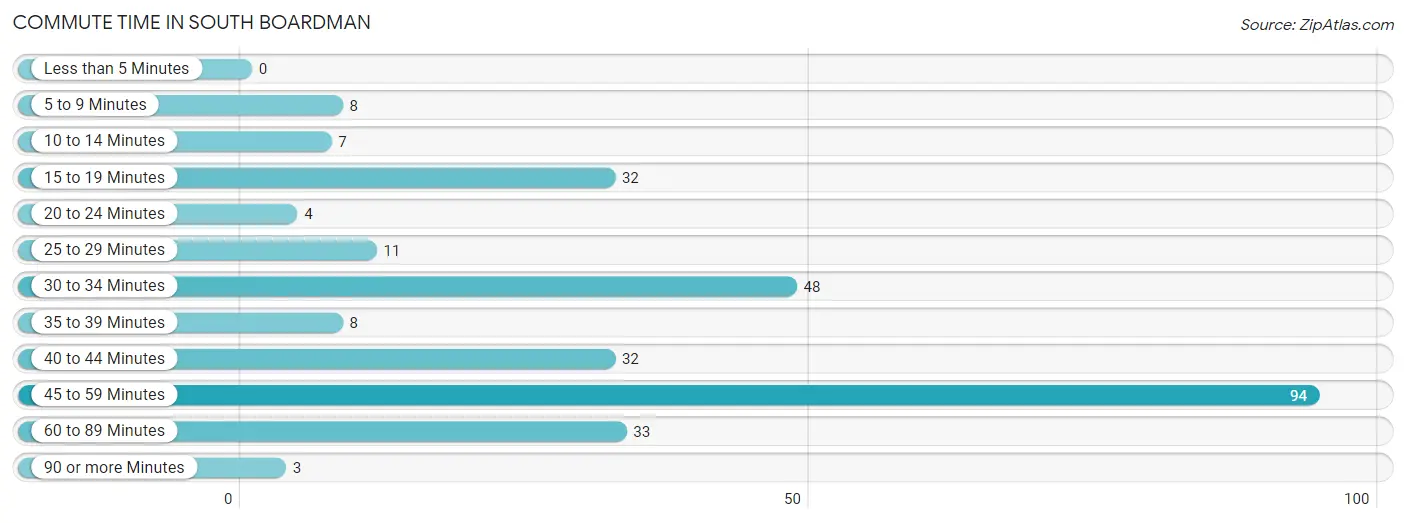
| Commute Time | # Commuters | % Commuters |
| Less than 5 Minutes | 0 | 0.0% |
| 5 to 9 Minutes | 8 | 2.9% |
| 10 to 14 Minutes | 7 | 2.5% |
| 15 to 19 Minutes | 32 | 11.4% |
| 20 to 24 Minutes | 4 | 1.4% |
| 25 to 29 Minutes | 11 | 3.9% |
| 30 to 34 Minutes | 48 | 17.1% |
| 35 to 39 Minutes | 8 | 2.9% |
| 40 to 44 Minutes | 32 | 11.4% |
| 45 to 59 Minutes | 94 | 33.6% |
| 60 to 89 Minutes | 33 | 11.8% |
| 90 or more Minutes | 3 | 1.1% |
Commute Time by Sex in South Boardman
The most common commute times in South Boardman are 45 to 59 minutes (41 commuters, 27.5%) for males and 45 to 59 minutes (53 commuters, 40.5%) for females.
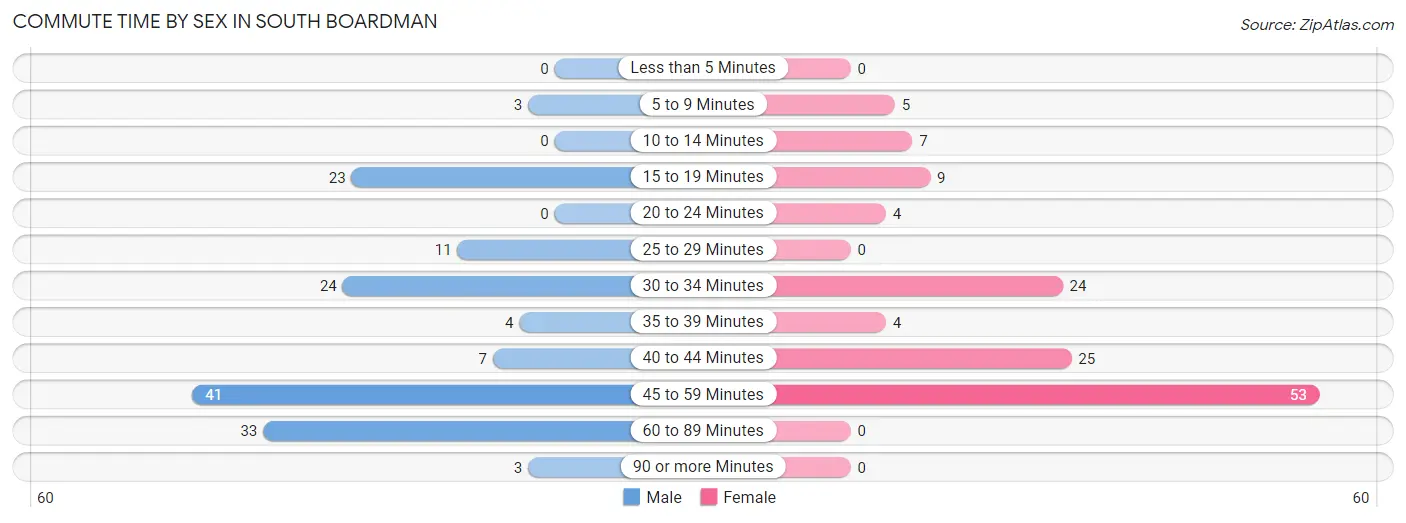
| Commute Time | Male | Female |
| Less than 5 Minutes | 0 (0.0%) | 0 (0.0%) |
| 5 to 9 Minutes | 3 (2.0%) | 5 (3.8%) |
| 10 to 14 Minutes | 0 (0.0%) | 7 (5.3%) |
| 15 to 19 Minutes | 23 (15.4%) | 9 (6.9%) |
| 20 to 24 Minutes | 0 (0.0%) | 4 (3.0%) |
| 25 to 29 Minutes | 11 (7.4%) | 0 (0.0%) |
| 30 to 34 Minutes | 24 (16.1%) | 24 (18.3%) |
| 35 to 39 Minutes | 4 (2.7%) | 4 (3.0%) |
| 40 to 44 Minutes | 7 (4.7%) | 25 (19.1%) |
| 45 to 59 Minutes | 41 (27.5%) | 53 (40.5%) |
| 60 to 89 Minutes | 33 (22.2%) | 0 (0.0%) |
| 90 or more Minutes | 3 (2.0%) | 0 (0.0%) |
Time of Departure to Work by Sex in South Boardman
The most frequent times of departure to work in South Boardman are 6:30 AM to 6:59 AM (29, 19.5%) for males and 7:00 AM to 7:29 AM (49, 37.4%) for females.
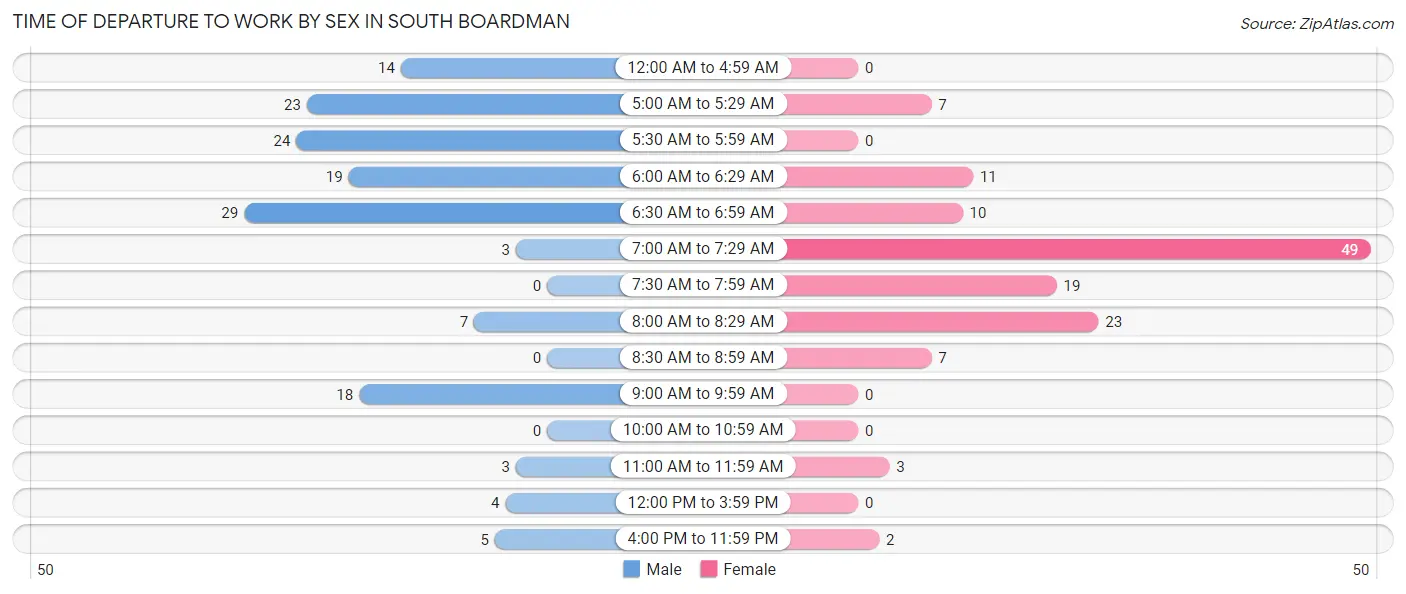
| Time of Departure | Male | Female |
| 12:00 AM to 4:59 AM | 14 (9.4%) | 0 (0.0%) |
| 5:00 AM to 5:29 AM | 23 (15.4%) | 7 (5.3%) |
| 5:30 AM to 5:59 AM | 24 (16.1%) | 0 (0.0%) |
| 6:00 AM to 6:29 AM | 19 (12.8%) | 11 (8.4%) |
| 6:30 AM to 6:59 AM | 29 (19.5%) | 10 (7.6%) |
| 7:00 AM to 7:29 AM | 3 (2.0%) | 49 (37.4%) |
| 7:30 AM to 7:59 AM | 0 (0.0%) | 19 (14.5%) |
| 8:00 AM to 8:29 AM | 7 (4.7%) | 23 (17.6%) |
| 8:30 AM to 8:59 AM | 0 (0.0%) | 7 (5.3%) |
| 9:00 AM to 9:59 AM | 18 (12.1%) | 0 (0.0%) |
| 10:00 AM to 10:59 AM | 0 (0.0%) | 0 (0.0%) |
| 11:00 AM to 11:59 AM | 3 (2.0%) | 3 (2.3%) |
| 12:00 PM to 3:59 PM | 4 (2.7%) | 0 (0.0%) |
| 4:00 PM to 11:59 PM | 5 (3.4%) | 2 (1.5%) |
| Total | 149 (100.0%) | 131 (100.0%) |
Housing Occupancy in South Boardman
Occupancy by Ownership in South Boardman
Of the total 222 dwellings in South Boardman, owner-occupied units account for 197 (88.7%), while renter-occupied units make up 25 (11.3%).
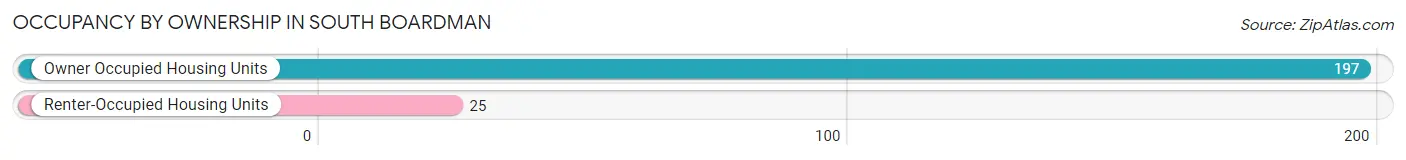
| Occupancy | # Housing Units | % Housing Units |
| Owner Occupied Housing Units | 197 | 88.7% |
| Renter-Occupied Housing Units | 25 | 11.3% |
| Total Occupied Housing Units | 222 | 100.0% |
Occupancy by Household Size in South Boardman

| Household Size | # Housing Units | % Housing Units |
| 1-Person Household | 26 | 11.7% |
| 2-Person Household | 115 | 51.8% |
| 3-Person Household | 27 | 12.2% |
| 4+ Person Household | 54 | 24.3% |
| Total Housing Units | 222 | 100.0% |
Occupancy by Ownership by Household Size in South Boardman
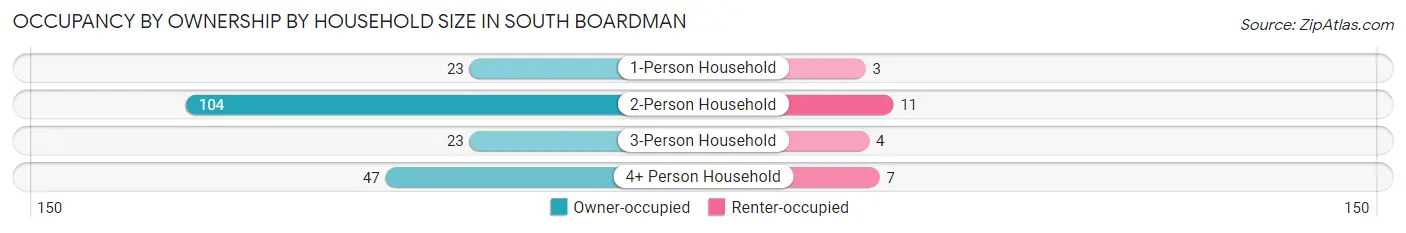
| Household Size | Owner-occupied | Renter-occupied |
| 1-Person Household | 23 (88.5%) | 3 (11.5%) |
| 2-Person Household | 104 (90.4%) | 11 (9.6%) |
| 3-Person Household | 23 (85.2%) | 4 (14.8%) |
| 4+ Person Household | 47 (87.0%) | 7 (13.0%) |
| Total Housing Units | 197 (88.7%) | 25 (11.3%) |
Occupancy by Educational Attainment in South Boardman
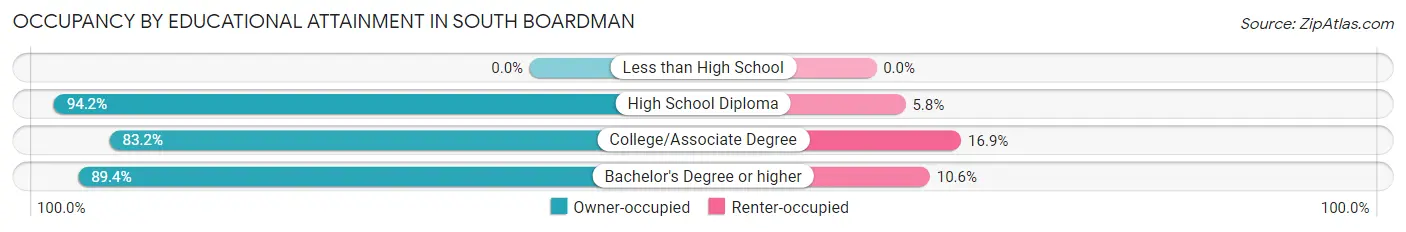
| Household Size | Owner-occupied | Renter-occupied |
| Less than High School | 0 (0.0%) | 0 (0.0%) |
| High School Diploma | 81 (94.2%) | 5 (5.8%) |
| College/Associate Degree | 74 (83.2%) | 15 (16.9%) |
| Bachelor's Degree or higher | 42 (89.4%) | 5 (10.6%) |
Occupancy by Age of Householder in South Boardman
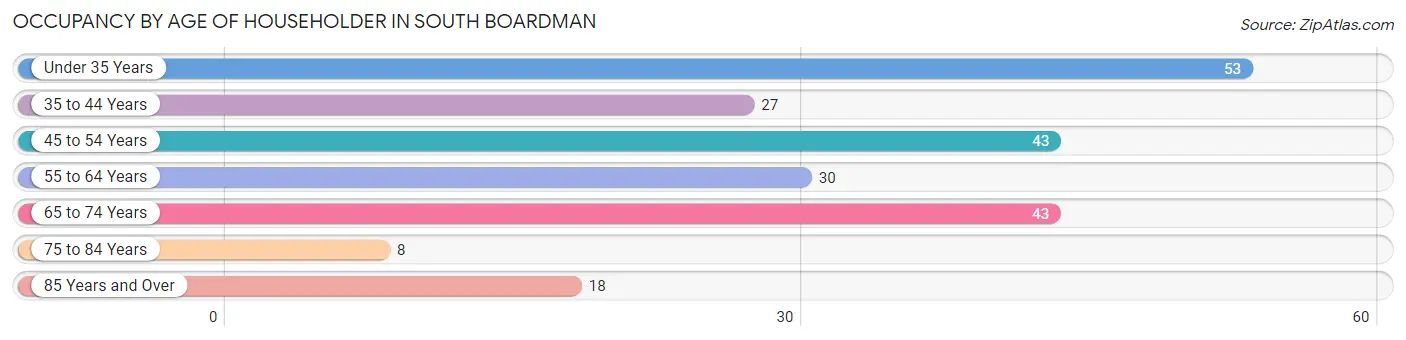
| Age Bracket | # Households | % Households |
| Under 35 Years | 53 | 23.9% |
| 35 to 44 Years | 27 | 12.2% |
| 45 to 54 Years | 43 | 19.4% |
| 55 to 64 Years | 30 | 13.5% |
| 65 to 74 Years | 43 | 19.4% |
| 75 to 84 Years | 8 | 3.6% |
| 85 Years and Over | 18 | 8.1% |
| Total | 222 | 100.0% |
Housing Finances in South Boardman
Median Income by Occupancy in South Boardman
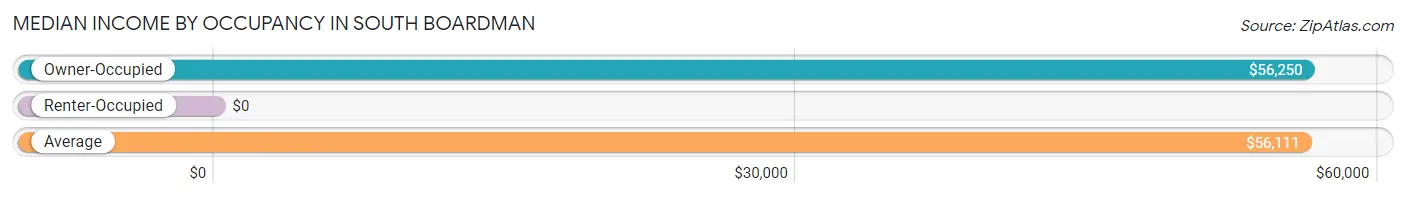
| Occupancy Type | # Households | Median Income |
| Owner-Occupied | 197 (88.7%) | $56,250 |
| Renter-Occupied | 25 (11.3%) | $0 |
| Average | 222 (100.0%) | $56,111 |
Occupancy by Householder Income Bracket in South Boardman
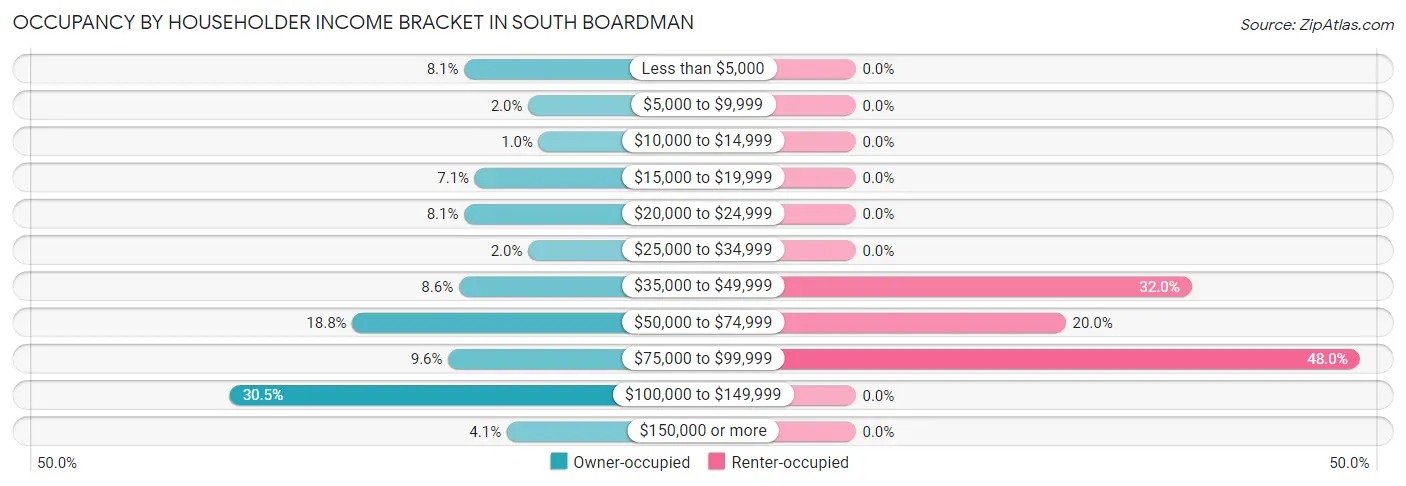
| Income Bracket | Owner-occupied | Renter-occupied |
| Less than $5,000 | 16 (8.1%) | 0 (0.0%) |
| $5,000 to $9,999 | 4 (2.0%) | 0 (0.0%) |
| $10,000 to $14,999 | 2 (1.0%) | 0 (0.0%) |
| $15,000 to $19,999 | 14 (7.1%) | 0 (0.0%) |
| $20,000 to $24,999 | 16 (8.1%) | 0 (0.0%) |
| $25,000 to $34,999 | 4 (2.0%) | 0 (0.0%) |
| $35,000 to $49,999 | 17 (8.6%) | 8 (32.0%) |
| $50,000 to $74,999 | 37 (18.8%) | 5 (20.0%) |
| $75,000 to $99,999 | 19 (9.6%) | 12 (48.0%) |
| $100,000 to $149,999 | 60 (30.5%) | 0 (0.0%) |
| $150,000 or more | 8 (4.1%) | 0 (0.0%) |
| Total | 197 (100.0%) | 25 (100.0%) |
Monthly Housing Cost Tiers in South Boardman
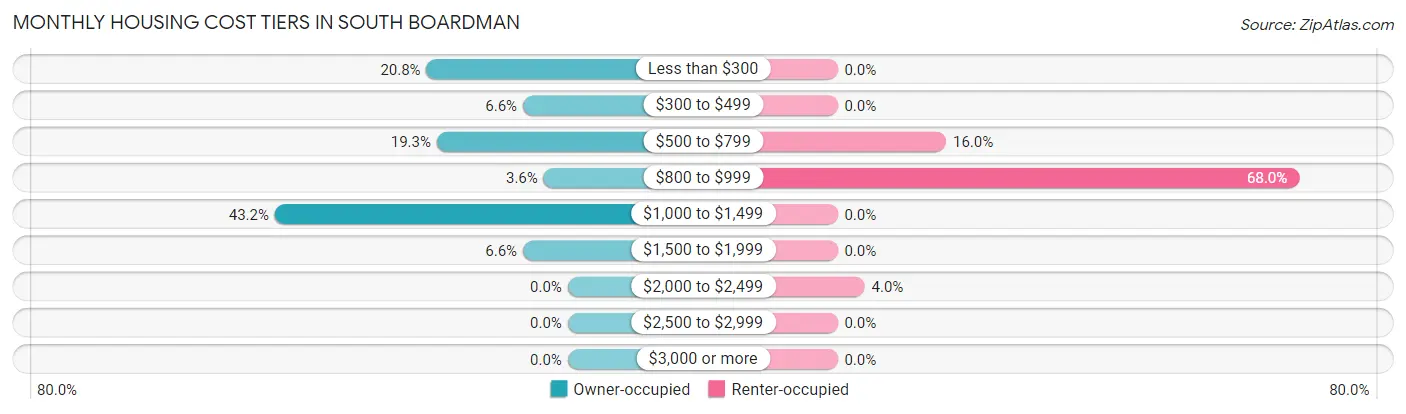
| Monthly Cost | Owner-occupied | Renter-occupied |
| Less than $300 | 41 (20.8%) | 0 (0.0%) |
| $300 to $499 | 13 (6.6%) | 0 (0.0%) |
| $500 to $799 | 38 (19.3%) | 4 (16.0%) |
| $800 to $999 | 7 (3.5%) | 17 (68.0%) |
| $1,000 to $1,499 | 85 (43.1%) | 0 (0.0%) |
| $1,500 to $1,999 | 13 (6.6%) | 0 (0.0%) |
| $2,000 to $2,499 | 0 (0.0%) | 1 (4.0%) |
| $2,500 to $2,999 | 0 (0.0%) | 0 (0.0%) |
| $3,000 or more | 0 (0.0%) | 0 (0.0%) |
| Total | 197 (100.0%) | 25 (100.0%) |
Physical Housing Characteristics in South Boardman
Housing Structures in South Boardman
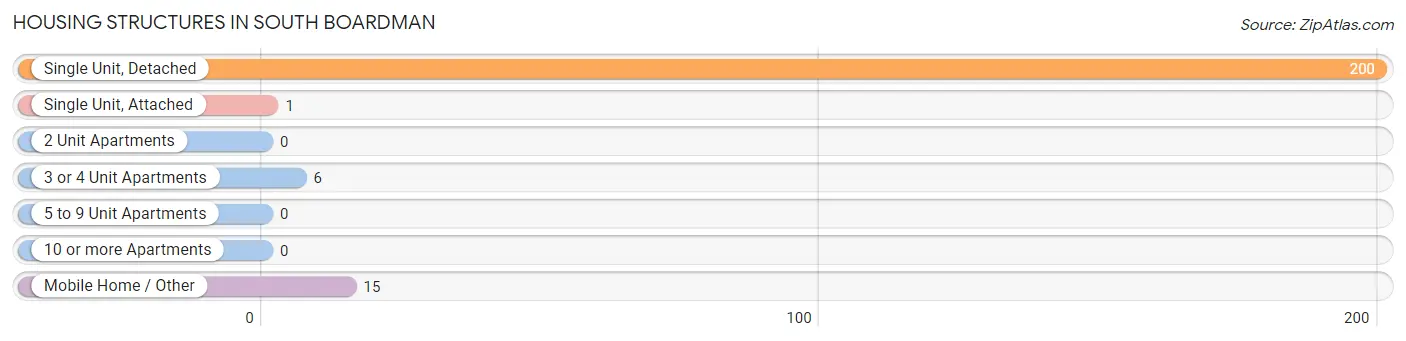
| Structure Type | # Housing Units | % Housing Units |
| Single Unit, Detached | 200 | 90.1% |
| Single Unit, Attached | 1 | 0.4% |
| 2 Unit Apartments | 0 | 0.0% |
| 3 or 4 Unit Apartments | 6 | 2.7% |
| 5 to 9 Unit Apartments | 0 | 0.0% |
| 10 or more Apartments | 0 | 0.0% |
| Mobile Home / Other | 15 | 6.8% |
| Total | 222 | 100.0% |
Housing Structures by Occupancy in South Boardman
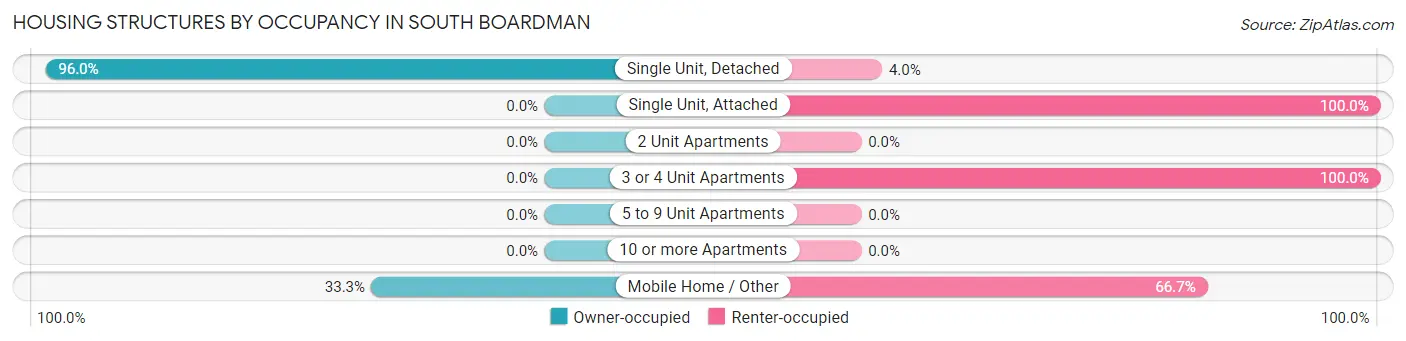
| Structure Type | Owner-occupied | Renter-occupied |
| Single Unit, Detached | 192 (96.0%) | 8 (4.0%) |
| Single Unit, Attached | 0 (0.0%) | 1 (100.0%) |
| 2 Unit Apartments | 0 (0.0%) | 0 (0.0%) |
| 3 or 4 Unit Apartments | 0 (0.0%) | 6 (100.0%) |
| 5 to 9 Unit Apartments | 0 (0.0%) | 0 (0.0%) |
| 10 or more Apartments | 0 (0.0%) | 0 (0.0%) |
| Mobile Home / Other | 5 (33.3%) | 10 (66.7%) |
| Total | 197 (88.7%) | 25 (11.3%) |
Housing Structures by Number of Rooms in South Boardman
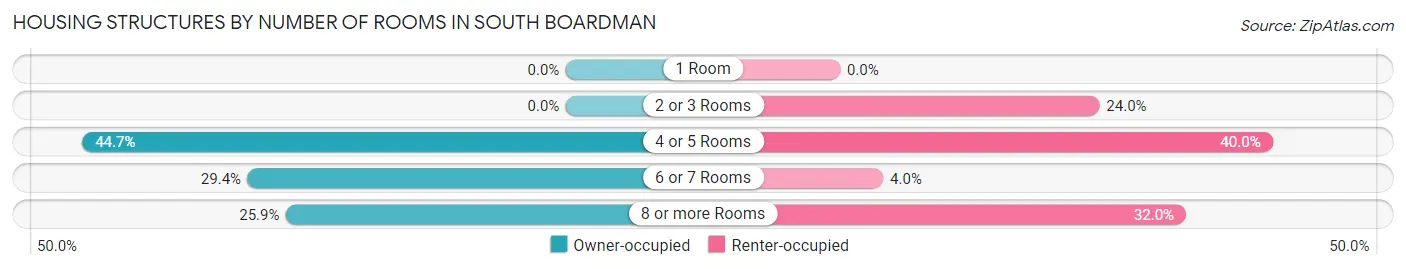
| Number of Rooms | Owner-occupied | Renter-occupied |
| 1 Room | 0 (0.0%) | 0 (0.0%) |
| 2 or 3 Rooms | 0 (0.0%) | 6 (24.0%) |
| 4 or 5 Rooms | 88 (44.7%) | 10 (40.0%) |
| 6 or 7 Rooms | 58 (29.4%) | 1 (4.0%) |
| 8 or more Rooms | 51 (25.9%) | 8 (32.0%) |
| Total | 197 (100.0%) | 25 (100.0%) |
Housing Structure by Heating Type in South Boardman
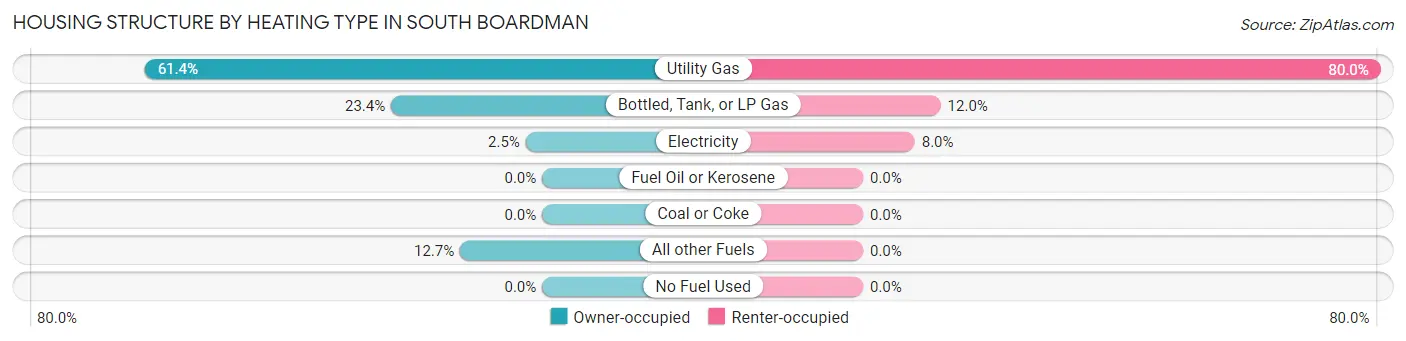
| Heating Type | Owner-occupied | Renter-occupied |
| Utility Gas | 121 (61.4%) | 20 (80.0%) |
| Bottled, Tank, or LP Gas | 46 (23.4%) | 3 (12.0%) |
| Electricity | 5 (2.5%) | 2 (8.0%) |
| Fuel Oil or Kerosene | 0 (0.0%) | 0 (0.0%) |
| Coal or Coke | 0 (0.0%) | 0 (0.0%) |
| All other Fuels | 25 (12.7%) | 0 (0.0%) |
| No Fuel Used | 0 (0.0%) | 0 (0.0%) |
| Total | 197 (100.0%) | 25 (100.0%) |
Household Vehicle Usage in South Boardman
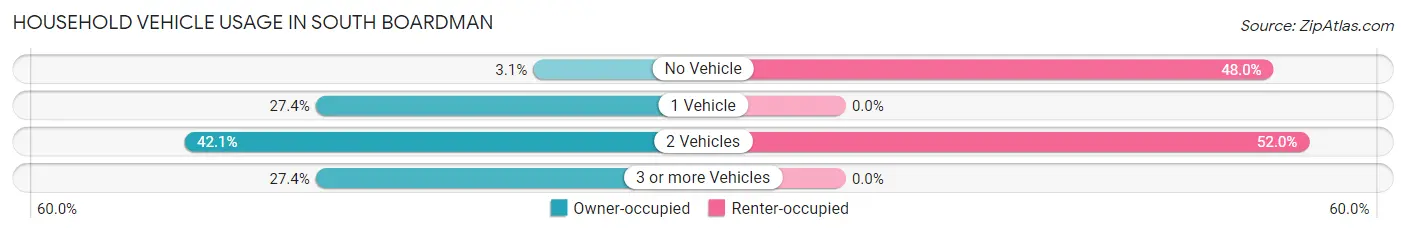
| Vehicles per Household | Owner-occupied | Renter-occupied |
| No Vehicle | 6 (3.0%) | 12 (48.0%) |
| 1 Vehicle | 54 (27.4%) | 0 (0.0%) |
| 2 Vehicles | 83 (42.1%) | 13 (52.0%) |
| 3 or more Vehicles | 54 (27.4%) | 0 (0.0%) |
| Total | 197 (100.0%) | 25 (100.0%) |
Real Estate & Mortgages in South Boardman
Real Estate and Mortgage Overview in South Boardman
| Characteristic | Without Mortgage | With Mortgage |
| Housing Units | 84 | 113 |
| Median Property Value | $103,600 | $169,300 |
| Median Household Income | $23,958 | $8 |
| Monthly Housing Costs | $313 | $0 |
| Real Estate Taxes | $1,061 | $10 |
Property Value by Mortgage Status in South Boardman
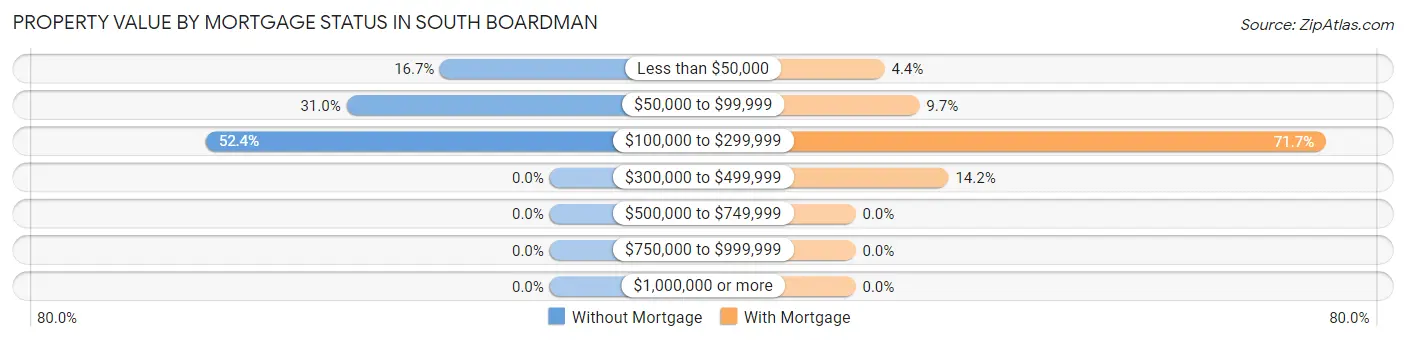
| Property Value | Without Mortgage | With Mortgage |
| Less than $50,000 | 14 (16.7%) | 5 (4.4%) |
| $50,000 to $99,999 | 26 (30.9%) | 11 (9.7%) |
| $100,000 to $299,999 | 44 (52.4%) | 81 (71.7%) |
| $300,000 to $499,999 | 0 (0.0%) | 16 (14.2%) |
| $500,000 to $749,999 | 0 (0.0%) | 0 (0.0%) |
| $750,000 to $999,999 | 0 (0.0%) | 0 (0.0%) |
| $1,000,000 or more | 0 (0.0%) | 0 (0.0%) |
| Total | 84 (100.0%) | 113 (100.0%) |
Household Income by Mortgage Status in South Boardman
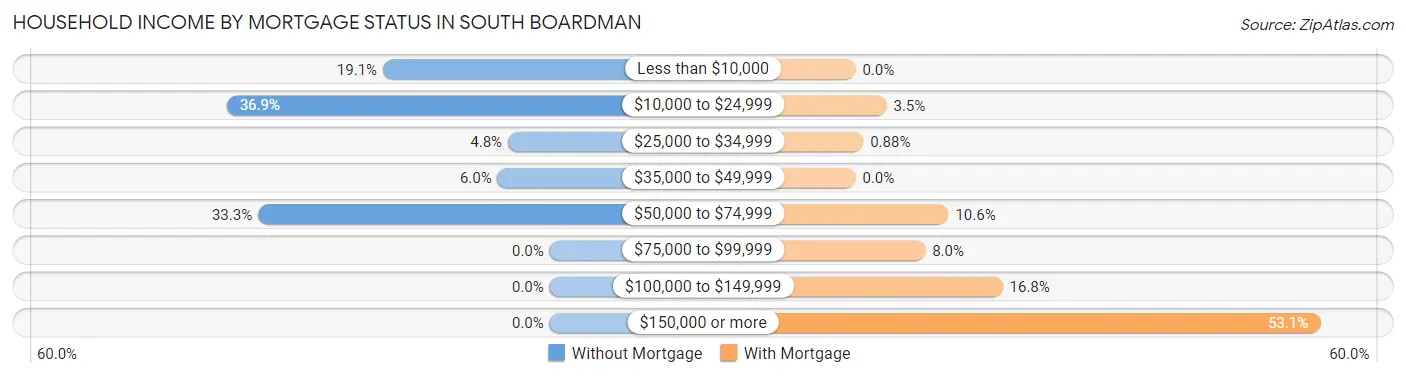
| Household Income | Without Mortgage | With Mortgage |
| Less than $10,000 | 16 (19.1%) | 0 (0.0%) |
| $10,000 to $24,999 | 31 (36.9%) | 4 (3.5%) |
| $25,000 to $34,999 | 4 (4.8%) | 1 (0.9%) |
| $35,000 to $49,999 | 5 (5.9%) | 0 (0.0%) |
| $50,000 to $74,999 | 28 (33.3%) | 12 (10.6%) |
| $75,000 to $99,999 | 0 (0.0%) | 9 (8.0%) |
| $100,000 to $149,999 | 0 (0.0%) | 19 (16.8%) |
| $150,000 or more | 0 (0.0%) | 60 (53.1%) |
| Total | 84 (100.0%) | 113 (100.0%) |
Property Value to Household Income Ratio in South Boardman
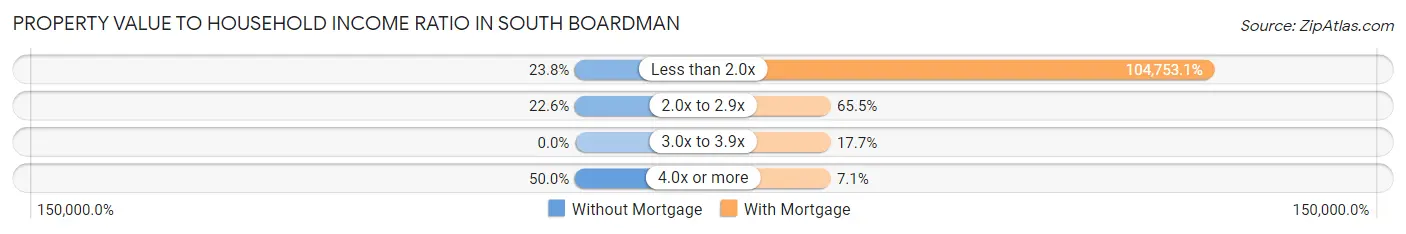
| Value-to-Income Ratio | Without Mortgage | With Mortgage |
| Less than 2.0x | 20 (23.8%) | 118,371 (104,753.1%) |
| 2.0x to 2.9x | 19 (22.6%) | 74 (65.5%) |
| 3.0x to 3.9x | 0 (0.0%) | 20 (17.7%) |
| 4.0x or more | 42 (50.0%) | 8 (7.1%) |
| Total | 84 (100.0%) | 113 (100.0%) |
Real Estate Taxes by Mortgage Status in South Boardman
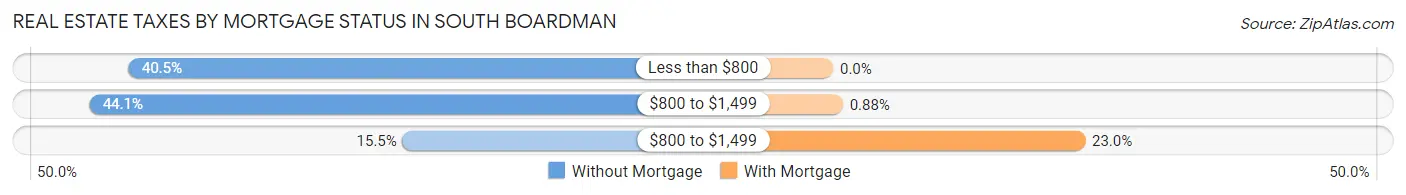
| Property Taxes | Without Mortgage | With Mortgage |
| Less than $800 | 34 (40.5%) | 0 (0.0%) |
| $800 to $1,499 | 37 (44.1%) | 1 (0.9%) |
| $800 to $1,499 | 13 (15.5%) | 26 (23.0%) |
| Total | 84 (100.0%) | 113 (100.0%) |
Health & Disability in South Boardman
Health Insurance Coverage by Age in South Boardman
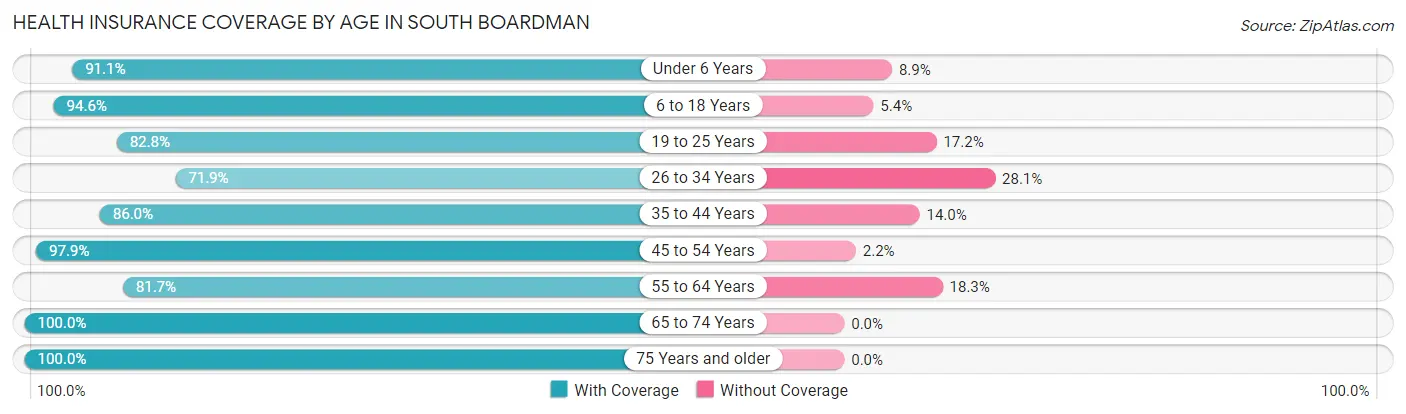
| Age Bracket | With Coverage | Without Coverage |
| Under 6 Years | 41 (91.1%) | 4 (8.9%) |
| 6 to 18 Years | 87 (94.6%) | 5 (5.4%) |
| 19 to 25 Years | 53 (82.8%) | 11 (17.2%) |
| 26 to 34 Years | 69 (71.9%) | 27 (28.1%) |
| 35 to 44 Years | 49 (86.0%) | 8 (14.0%) |
| 45 to 54 Years | 91 (97.9%) | 2 (2.1%) |
| 55 to 64 Years | 49 (81.7%) | 11 (18.3%) |
| 65 to 74 Years | 61 (100.0%) | 0 (0.0%) |
| 75 Years and older | 39 (100.0%) | 0 (0.0%) |
| Total | 539 (88.8%) | 68 (11.2%) |
Health Insurance Coverage by Citizenship Status in South Boardman
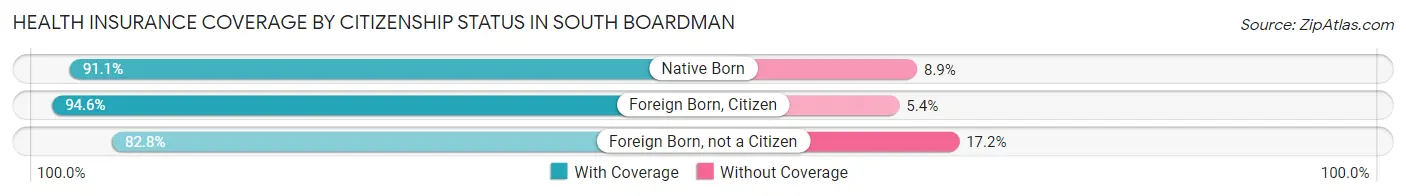
| Citizenship Status | With Coverage | Without Coverage |
| Native Born | 41 (91.1%) | 4 (8.9%) |
| Foreign Born, Citizen | 87 (94.6%) | 5 (5.4%) |
| Foreign Born, not a Citizen | 53 (82.8%) | 11 (17.2%) |
Health Insurance Coverage by Household Income in South Boardman
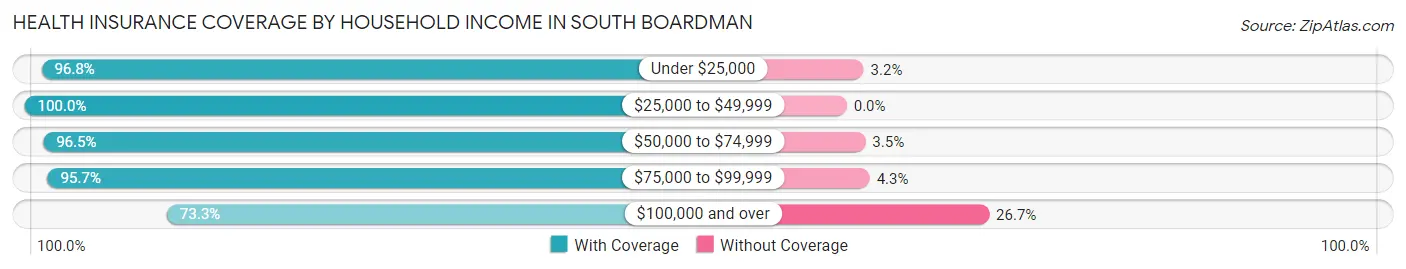
| Household Income | With Coverage | Without Coverage |
| Under $25,000 | 92 (96.8%) | 3 (3.2%) |
| $25,000 to $49,999 | 76 (100.0%) | 0 (0.0%) |
| $50,000 to $74,999 | 83 (96.5%) | 3 (3.5%) |
| $75,000 to $99,999 | 134 (95.7%) | 6 (4.3%) |
| $100,000 and over | 154 (73.3%) | 56 (26.7%) |
Public vs Private Health Insurance Coverage by Age in South Boardman
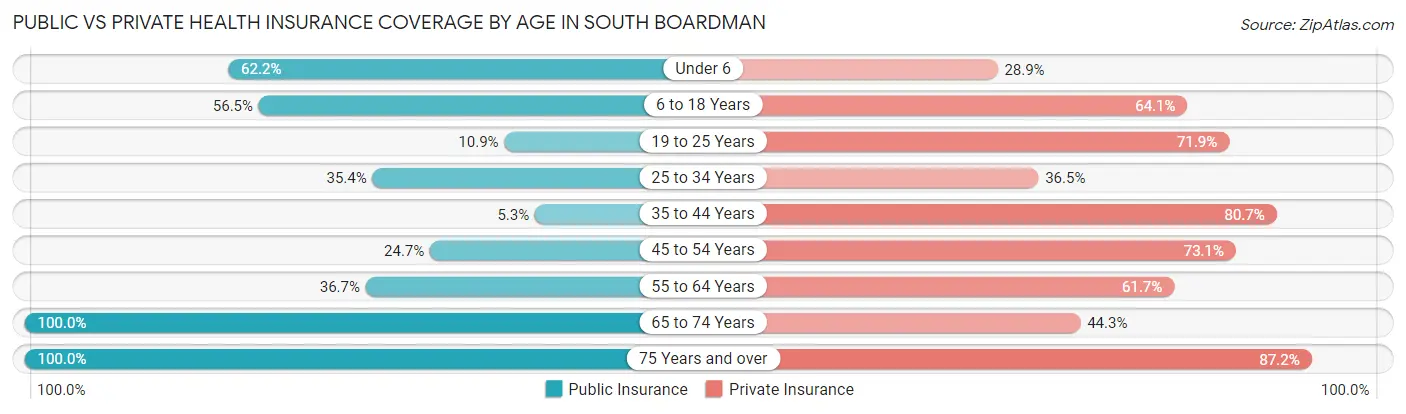
| Age Bracket | Public Insurance | Private Insurance |
| Under 6 | 28 (62.2%) | 13 (28.9%) |
| 6 to 18 Years | 52 (56.5%) | 59 (64.1%) |
| 19 to 25 Years | 7 (10.9%) | 46 (71.9%) |
| 25 to 34 Years | 34 (35.4%) | 35 (36.5%) |
| 35 to 44 Years | 3 (5.3%) | 46 (80.7%) |
| 45 to 54 Years | 23 (24.7%) | 68 (73.1%) |
| 55 to 64 Years | 22 (36.7%) | 37 (61.7%) |
| 65 to 74 Years | 61 (100.0%) | 27 (44.3%) |
| 75 Years and over | 39 (100.0%) | 34 (87.2%) |
| Total | 269 (44.3%) | 365 (60.1%) |
Disability Status by Sex by Age in South Boardman
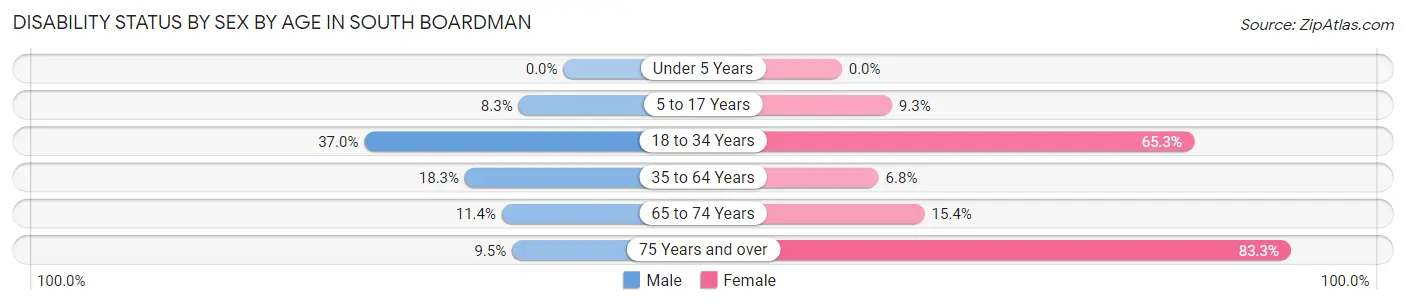
| Age Bracket | Male | Female |
| Under 5 Years | 0 (0.0%) | 0 (0.0%) |
| 5 to 17 Years | 5 (8.3%) | 4 (9.3%) |
| 18 to 34 Years | 34 (37.0%) | 49 (65.3%) |
| 35 to 64 Years | 17 (18.3%) | 8 (6.8%) |
| 65 to 74 Years | 4 (11.4%) | 4 (15.4%) |
| 75 Years and over | 2 (9.5%) | 15 (83.3%) |
Disability Class by Sex by Age in South Boardman
Disability Class: Hearing Difficulty
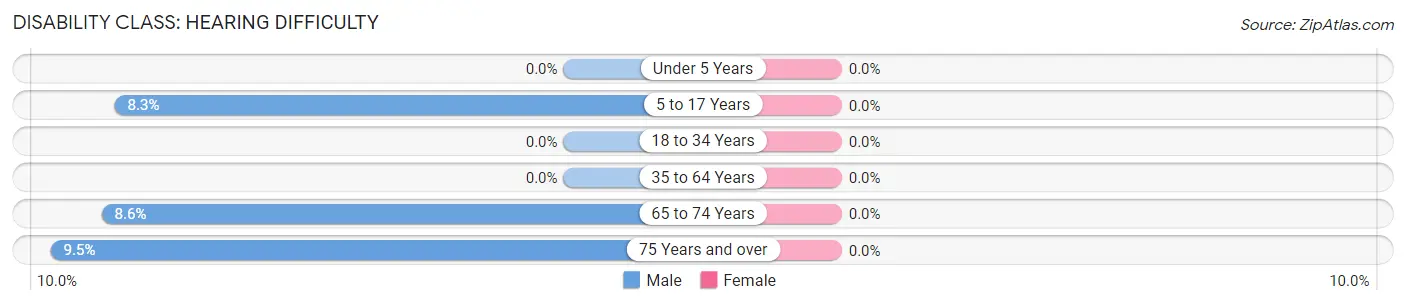
| Age Bracket | Male | Female |
| Under 5 Years | 0 (0.0%) | 0 (0.0%) |
| 5 to 17 Years | 5 (8.3%) | 0 (0.0%) |
| 18 to 34 Years | 0 (0.0%) | 0 (0.0%) |
| 35 to 64 Years | 0 (0.0%) | 0 (0.0%) |
| 65 to 74 Years | 3 (8.6%) | 0 (0.0%) |
| 75 Years and over | 2 (9.5%) | 0 (0.0%) |
Disability Class: Vision Difficulty
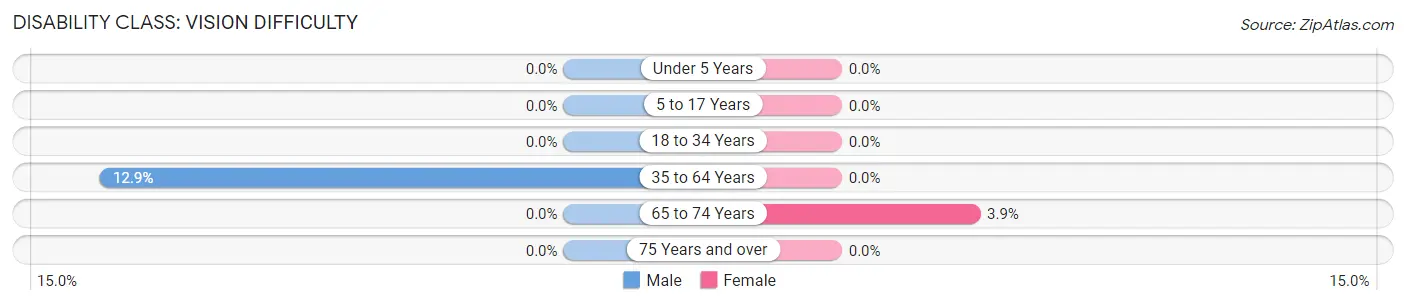
| Age Bracket | Male | Female |
| Under 5 Years | 0 (0.0%) | 0 (0.0%) |
| 5 to 17 Years | 0 (0.0%) | 0 (0.0%) |
| 18 to 34 Years | 0 (0.0%) | 0 (0.0%) |
| 35 to 64 Years | 12 (12.9%) | 0 (0.0%) |
| 65 to 74 Years | 0 (0.0%) | 1 (3.8%) |
| 75 Years and over | 0 (0.0%) | 0 (0.0%) |
Disability Class: Cognitive Difficulty
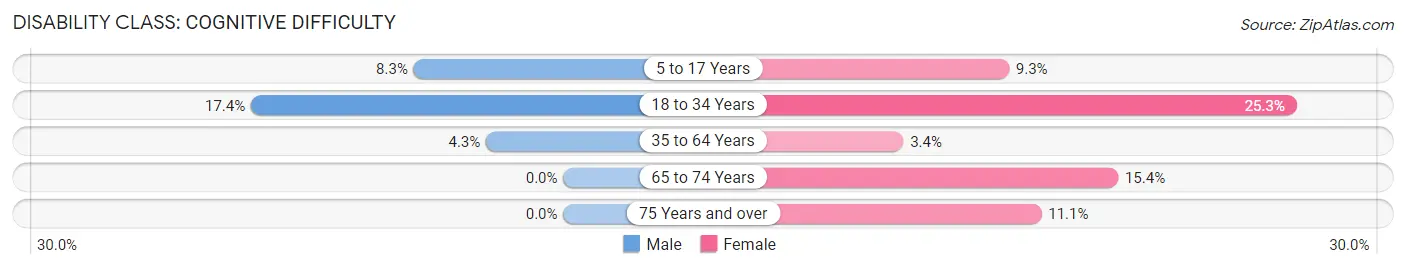
| Age Bracket | Male | Female |
| 5 to 17 Years | 5 (8.3%) | 4 (9.3%) |
| 18 to 34 Years | 16 (17.4%) | 19 (25.3%) |
| 35 to 64 Years | 4 (4.3%) | 4 (3.4%) |
| 65 to 74 Years | 0 (0.0%) | 4 (15.4%) |
| 75 Years and over | 0 (0.0%) | 2 (11.1%) |
Disability Class: Ambulatory Difficulty
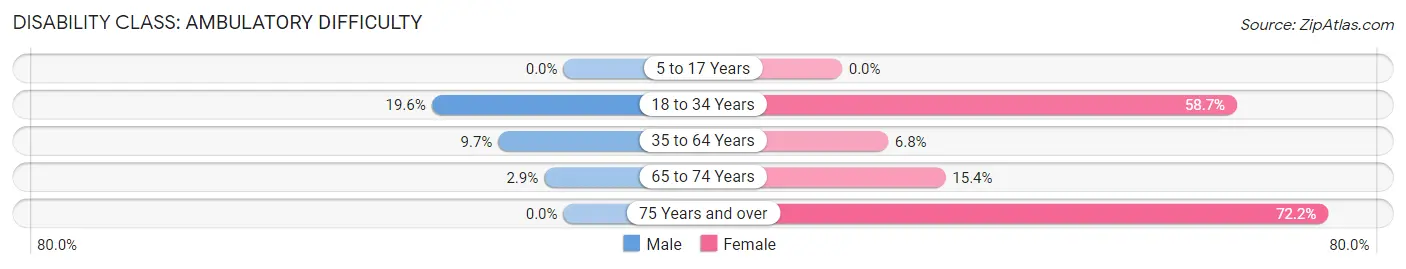
| Age Bracket | Male | Female |
| 5 to 17 Years | 0 (0.0%) | 0 (0.0%) |
| 18 to 34 Years | 18 (19.6%) | 44 (58.7%) |
| 35 to 64 Years | 9 (9.7%) | 8 (6.8%) |
| 65 to 74 Years | 1 (2.9%) | 4 (15.4%) |
| 75 Years and over | 0 (0.0%) | 13 (72.2%) |
Disability Class: Self-Care Difficulty
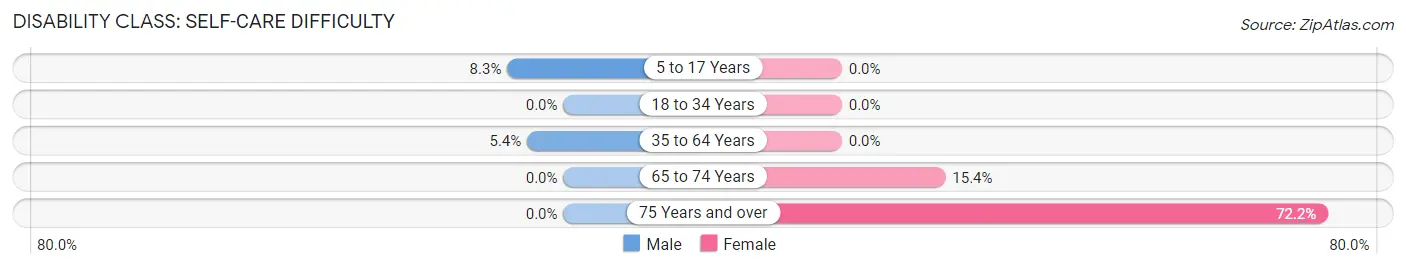
| Age Bracket | Male | Female |
| 5 to 17 Years | 5 (8.3%) | 0 (0.0%) |
| 18 to 34 Years | 0 (0.0%) | 0 (0.0%) |
| 35 to 64 Years | 5 (5.4%) | 0 (0.0%) |
| 65 to 74 Years | 0 (0.0%) | 4 (15.4%) |
| 75 Years and over | 0 (0.0%) | 13 (72.2%) |
Technology Access in South Boardman
Computing Device Access in South Boardman
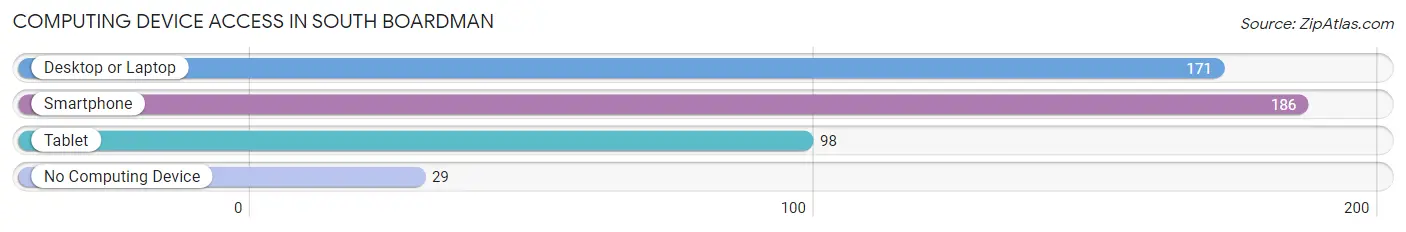
| Device Type | # Households | % Households |
| Desktop or Laptop | 171 | 77.0% |
| Smartphone | 186 | 83.8% |
| Tablet | 98 | 44.1% |
| No Computing Device | 29 | 13.1% |
| Total | 222 | 100.0% |
Internet Access in South Boardman
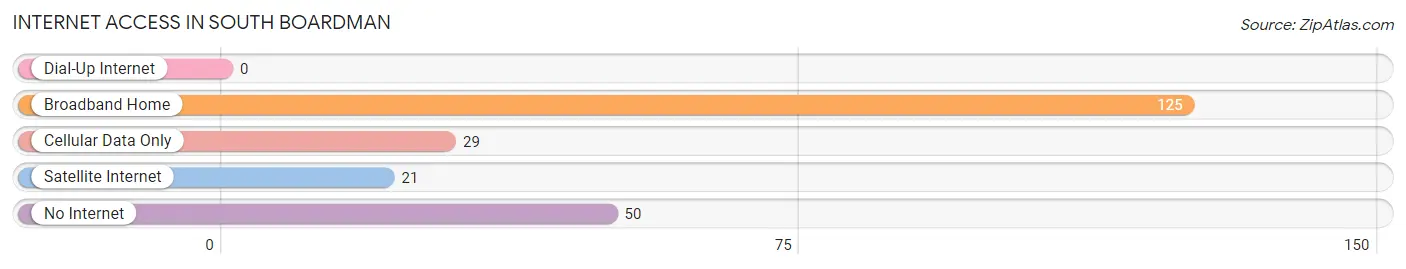
| Internet Type | # Households | % Households |
| Dial-Up Internet | 0 | 0.0% |
| Broadband Home | 125 | 56.3% |
| Cellular Data Only | 29 | 13.1% |
| Satellite Internet | 21 | 9.5% |
| No Internet | 50 | 22.5% |
| Total | 222 | 100.0% |
South Boardman Summary
Boardman, Michigan is a small unincorporated community located in Grand Traverse County, Michigan. It is situated on the south side of Boardman Lake, just south of Traverse City. The population of Boardman was estimated to be around 1,000 people in 2000.
History
Boardman was first settled in 1871 by a group of settlers from Ohio. The settlement was originally known as Boardmanville, named after the Boardman family who were among the first settlers. The Boardman family was originally from New York and had moved to Michigan in the late 1860s.
The Boardman family was instrumental in the development of the area. They built a sawmill and a grist mill, which helped to attract other settlers to the area. The Boardman family also built a hotel, which was the first hotel in the area.
In 1873, the Boardman family donated land for the construction of a school, which was the first school in the area. The Boardman family also donated land for the construction of a church, which was the first church in the area.
In 1876, the Boardman family donated land for the construction of a post office, which was the first post office in the area. The Boardman family also donated land for the construction of a cemetery, which was the first cemetery in the area.
In 1877, the Boardman family donated land for the construction of a railroad station, which was the first railroad station in the area. The Boardman family also donated land for the construction of a library, which was the first library in the area.
In 1878, the Boardman family donated land for the construction of a courthouse, which was the first courthouse in the area. The Boardman family also donated land for the construction of a jail, which was the first jail in the area.
In 1879, the Boardman family donated land for the construction of a fire station, which was the first fire station in the area. The Boardman family also donated land for the construction of a hospital, which was the first hospital in the area.
In 1881, the Boardman family donated land for the construction of a bank, which was the first bank in the area. The Boardman family also donated land for the construction of a newspaper, which was the first newspaper in the area.
In 1882, the Boardman family donated land for the construction of a hotel, which was the first hotel in the area. The Boardman family also donated land for the construction of a theater, which was the first theater in the area.
In 1883, the Boardman family donated land for the construction of a library, which was the first library in the area. The Boardman family also donated land for the construction of a school, which was the first school in the area.
In 1884, the Boardman family donated land for the construction of a church, which was the first church in the area. The Boardman family also donated land for the construction of a post office, which was the first post office in the area.
In 1885, the Boardman family donated land for the construction of a courthouse, which was the first courthouse in the area. The Boardman family also donated land for the construction of a jail, which was the first jail in the area.
In 1886, the Boardman family donated land for the construction of a fire station, which was the first fire station in the area. The Boardman family also donated land for the construction of a hospital, which was the first hospital in the area.
In 1887, the Boardman family donated land for the construction of a bank, which was the first bank in the area. The Boardman family also donated land for the construction of a newspaper, which was the first newspaper in the area.
In 1888, the Boardman family donated land for the construction of a hotel, which was the first hotel in the area. The Boardman family also donated land for the construction of a theater, which was the first theater in the area.
In 1889, the Boardman family donated land for the construction of a library, which was the first library in the area. The Boardman family also donated land for the construction of a school, which was the first school in the area.
In 1890, the Boardman family donated land for the construction of a church, which was the first church in the area. The Boardman family also donated land for the construction of a post office, which was the first post office in the area.
In 1891, the Boardman family donated land for the construction of a courthouse, which was the first courthouse in the area. The Boardman family also donated land for the construction of a jail, which was the first jail in the area.
In 1892, the Boardman family donated land for the construction of a fire station, which was the first fire station in the area. The Boardman family also donated land for the construction of a hospital, which was the first hospital in the area.
In 1893, the Boardman family donated land for the construction of a bank, which was the first bank in the area. The Boardman family also donated land for the construction of a newspaper, which was the first newspaper in the area.
In 1894, the Boardman family donated land for the construction of a hotel, which was the first hotel in the area. The Boardman family also donated land for the construction of a theater, which was the first theater in the area.
In 1895, the Boardman family donated land for the construction of a library, which was the first library in the area. The Boardman family also donated land for the construction of a school, which was the first school in the area.
In 1896, the Boardman family donated land for the construction of a church, which was the first church in the area. The Boardman family also donated land for the construction of a post office, which was the first post office in the area.
In 1897, the Boardman family donated land for the construction of a courthouse, which was the first courthouse in the area. The Boardman family also donated land for the construction of a jail, which was the first jail in the area.
In 1898, the Boardman family donated land for the construction of a fire station, which was the first fire station in the area. The Boardman family also donated land for the construction of a hospital, which was the first hospital in the area.
In 1899, the Boardman family donated land for the construction of a bank, which was the first bank in the area. The Boardman family also donated land for the construction of a newspaper, which was the first newspaper in the area.
In 1900, the Boardman family donated land for the construction of a hotel, which was the first hotel in the area. The Boardman family also donated land for the construction of a theater, which was the first theater in the area.
Geography
Boardman is located in Grand Traverse County, Michigan. It is situated on the south side of Boardman Lake, just south of Traverse City. The area is mostly rural, with a few small towns and villages scattered throughout the area. The terrain is mostly flat, with some rolling hills and valleys. The climate is generally mild, with cold winters and warm summers.
Economy
The economy of Boardman is largely based on agriculture and tourism. The area is home to several small farms, which produce a variety of crops, including apples, cherries, and other fruits and vegetables. The area is also home to several wineries, which produce a variety of wines.
Tourism is also an important part of the economy of Boardman. The area is home to several popular tourist attractions, including the Boardman Lake Nature Preserve, the Boardman River, and the Boardman Valley. The area is also home to several popular festivals, including the Boardman Apple Festival and the Boardman Blueberry Festival.
Demographics
In 2000, the population of Boardman was estimated to be around 1,000 people. The racial makeup of the town was 97.7% White, 0.7% African American, 0.3% Native American, 0.3% Asian, and 0.9% from other races. The median household income was $37,500, and the median family income was $45,000. The per capita income was $19,000.
Common Questions
What is Per Capita Income in South Boardman?
Per Capita income in South Boardman is $26,072.
What is the Median Family Income in South Boardman?
Median Family Income in South Boardman is $55,000.
What is the Median Household income in South Boardman?
Median Household Income in South Boardman is $56,111.
What is Income or Wage Gap in South Boardman?
Income or Wage Gap in South Boardman is 2.2%.
Women in South Boardman earn 97.8 cents for every dollar earned by a man.
What is Inequality or Gini Index in South Boardman?
Inequality or Gini Index in South Boardman is 0.39.
What is the Total Population of South Boardman?
Total Population of South Boardman is 613.
What is the Total Male Population of South Boardman?
Total Male Population of South Boardman is 327.
What is the Total Female Population of South Boardman?
Total Female Population of South Boardman is 286.
What is the Ratio of Males per 100 Females in South Boardman?
There are 114.34 Males per 100 Females in South Boardman.
What is the Ratio of Females per 100 Males in South Boardman?
There are 87.46 Females per 100 Males in South Boardman.
What is the Median Population Age in South Boardman?
Median Population Age in South Boardman is 37.4 Years.
What is the Average Family Size in South Boardman
Average Family Size in South Boardman is 3.1 People.
What is the Average Household Size in South Boardman
Average Household Size in South Boardman is 2.8 People.
How Large is the Labor Force in South Boardman?
There are 320 People in the Labor Forcein in South Boardman.
What is the Percentage of People in the Labor Force in South Boardman?
63.4% of People are in the Labor Force in South Boardman.
What is the Unemployment Rate in South Boardman?
Unemployment Rate in South Boardman is 2.5%.