Lakes of the North, MI Map & Demographics
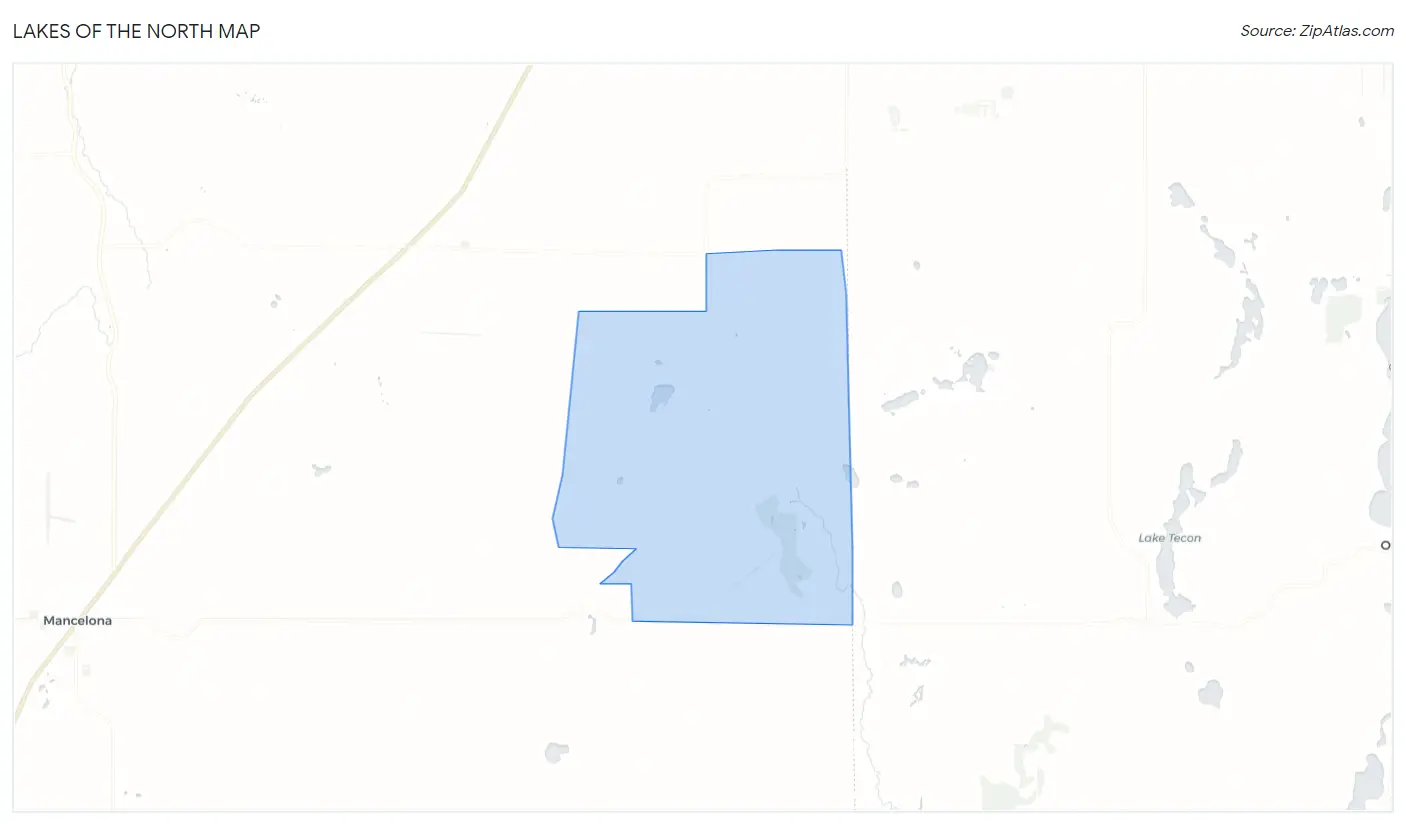
Lakes of the North Map
Lakes of the North Overview
$33,074
PER CAPITA INCOME
$63,438
AVG FAMILY INCOME
$62,179
AVG HOUSEHOLD INCOME
27.5%
WAGE / INCOME GAP [ % ]
72.5¢/ $1
WAGE / INCOME GAP [ $ ]
0.35
INEQUALITY / GINI INDEX
1,031
TOTAL POPULATION
529
MALE POPULATION
502
FEMALE POPULATION
105.38
MALES / 100 FEMALES
94.90
FEMALES / 100 MALES
55.0
MEDIAN AGE
2.2
AVG FAMILY SIZE
2.0
AVG HOUSEHOLD SIZE
423
LABOR FORCE [ PEOPLE ]
46.6%
PERCENT IN LABOR FORCE
4.0%
UNEMPLOYMENT RATE
Income in Lakes of the North
Income Overview in Lakes of the North
Per Capita Income in Lakes of the North is $33,074, while median incomes of families and households are $63,438 and $62,179 respectively.
| Characteristic | Number | Measure |
| Per Capita Income | 1,031 | $33,074 |
| Median Family Income | 398 | $63,438 |
| Mean Family Income | 398 | $73,492 |
| Median Household Income | 506 | $62,179 |
| Mean Household Income | 506 | $70,447 |
| Income Deficit | 398 | $0 |
| Wage / Income Gap (%) | 1,031 | 27.45% |
| Wage / Income Gap ($) | 1,031 | 72.55¢ per $1 |
| Gini / Inequality Index | 1,031 | 0.35 |
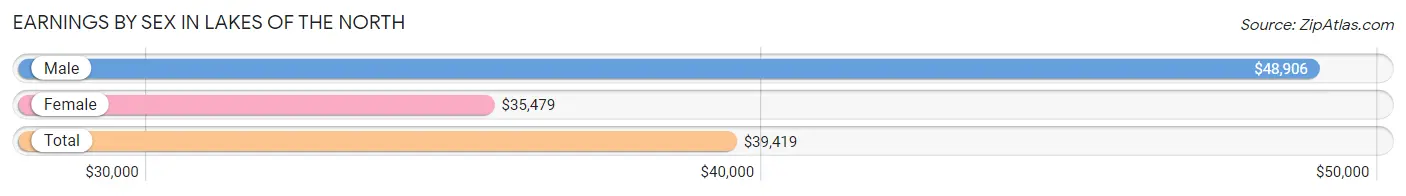
Earnings by Sex in Lakes of the North
Average Earnings in Lakes of the North are $39,419, $48,906 for men and $35,479 for women, a difference of 27.5%.
| Sex | Number | Average Earnings |
| Male | 248 (53.7%) | $48,906 |
| Female | 214 (46.3%) | $35,479 |
| Total | 462 (100.0%) | $39,419 |
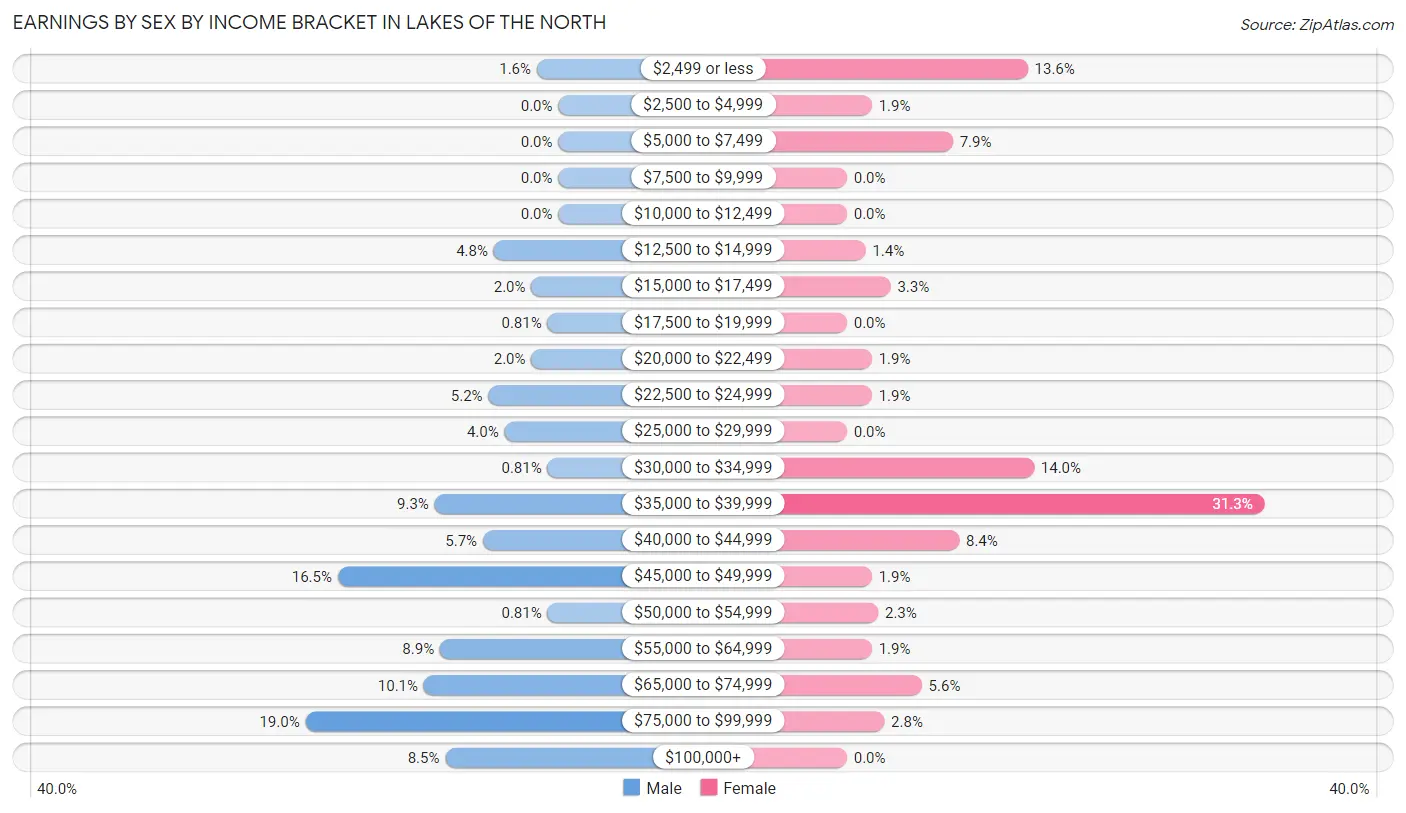
Earnings by Sex by Income Bracket in Lakes of the North
The most common earnings brackets in Lakes of the North are $75,000 to $99,999 for men (47 | 19.0%) and $35,000 to $39,999 for women (67 | 31.3%).
| Income | Male | Female |
| $2,499 or less | 4 (1.6%) | 29 (13.6%) |
| $2,500 to $4,999 | 0 (0.0%) | 4 (1.9%) |
| $5,000 to $7,499 | 0 (0.0%) | 17 (7.9%) |
| $7,500 to $9,999 | 0 (0.0%) | 0 (0.0%) |
| $10,000 to $12,499 | 0 (0.0%) | 0 (0.0%) |
| $12,500 to $14,999 | 12 (4.8%) | 3 (1.4%) |
| $15,000 to $17,499 | 5 (2.0%) | 7 (3.3%) |
| $17,500 to $19,999 | 2 (0.8%) | 0 (0.0%) |
| $20,000 to $22,499 | 5 (2.0%) | 4 (1.9%) |
| $22,500 to $24,999 | 13 (5.2%) | 4 (1.9%) |
| $25,000 to $29,999 | 10 (4.0%) | 0 (0.0%) |
| $30,000 to $34,999 | 2 (0.8%) | 30 (14.0%) |
| $35,000 to $39,999 | 23 (9.3%) | 67 (31.3%) |
| $40,000 to $44,999 | 14 (5.7%) | 18 (8.4%) |
| $45,000 to $49,999 | 41 (16.5%) | 4 (1.9%) |
| $50,000 to $54,999 | 2 (0.8%) | 5 (2.3%) |
| $55,000 to $64,999 | 22 (8.9%) | 4 (1.9%) |
| $65,000 to $74,999 | 25 (10.1%) | 12 (5.6%) |
| $75,000 to $99,999 | 47 (19.0%) | 6 (2.8%) |
| $100,000+ | 21 (8.5%) | 0 (0.0%) |
| Total | 248 (100.0%) | 214 (100.0%) |
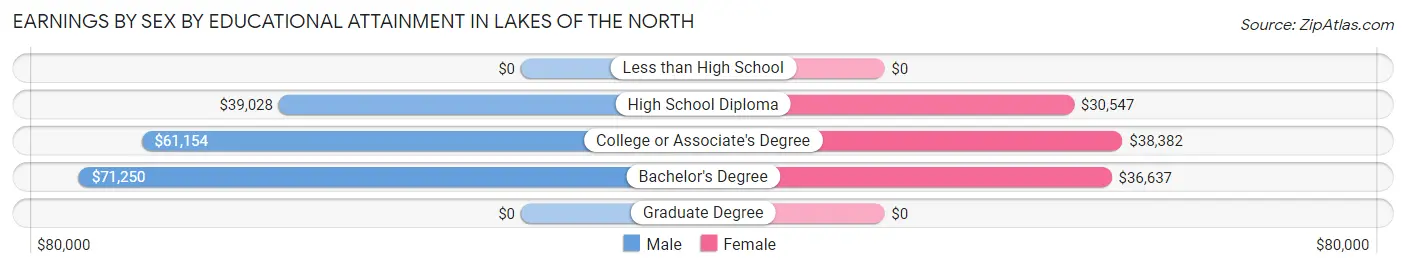
Earnings by Sex by Educational Attainment in Lakes of the North
Average earnings in Lakes of the North are $49,766 for men and $35,771 for women, a difference of 28.1%. Men with an educational attainment of bachelor's degree enjoy the highest average annual earnings of $71,250, while those with high school diploma education earn the least with $39,028. Women with an educational attainment of college or associate's degree earn the most with the average annual earnings of $38,382, while those with high school diploma education have the smallest earnings of $30,547.
| Educational Attainment | Male Income | Female Income |
| Less than High School | - | - |
| High School Diploma | $39,028 | $30,547 |
| College or Associate's Degree | $61,154 | $38,382 |
| Bachelor's Degree | $71,250 | $36,637 |
| Graduate Degree | - | - |
| Total | $49,766 | $35,771 |
Family Income in Lakes of the North
Family Income Brackets in Lakes of the North
According to the Lakes of the North family income data, there are 126 families falling into the $50,000 to $74,999 income range, which is the most common income bracket and makes up 31.7% of all families.
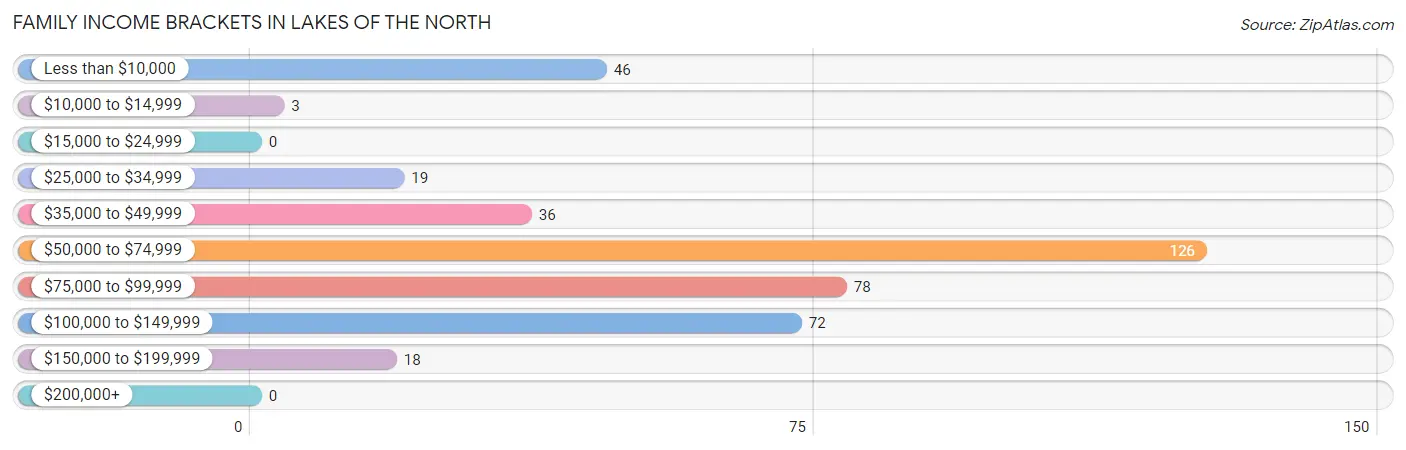
| Income Bracket | # Families | % Families |
| Less than $10,000 | 46 | 11.6% |
| $10,000 to $14,999 | 3 | 0.8% |
| $15,000 to $24,999 | 0 | 0.0% |
| $25,000 to $34,999 | 19 | 4.8% |
| $35,000 to $49,999 | 36 | 9.0% |
| $50,000 to $74,999 | 126 | 31.7% |
| $75,000 to $99,999 | 78 | 19.6% |
| $100,000 to $149,999 | 72 | 18.1% |
| $150,000 to $199,999 | 18 | 4.5% |
| $200,000+ | 0 | 0.0% |
Family Income by Famaliy Size in Lakes of the North
3-person families (52 | 13.1%) account for the highest median family income in Lakes of the North with $81,944 per family, while 2-person families (296 | 74.4%) have the highest median income of $31,140 per family member.
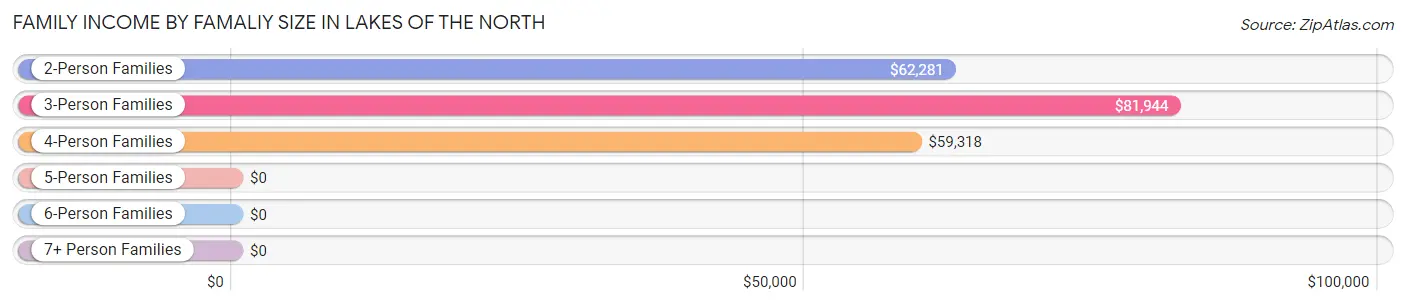
| Income Bracket | # Families | Median Income |
| 2-Person Families | 296 (74.4%) | $62,281 |
| 3-Person Families | 52 (13.1%) | $81,944 |
| 4-Person Families | 42 (10.5%) | $59,318 |
| 5-Person Families | 8 (2.0%) | $0 |
| 6-Person Families | 0 (0.0%) | $0 |
| 7+ Person Families | 0 (0.0%) | $0 |
| Total | 398 (100.0%) | $63,438 |
Family Income by Number of Earners in Lakes of the North
The median family income in Lakes of the North is $63,438, with families comprising 3+ earners (31) having the highest median family income of $130,221, while families with 1 earner (83) have the lowest median family income of $54,750, accounting for 7.8% and 20.8% of families, respectively.
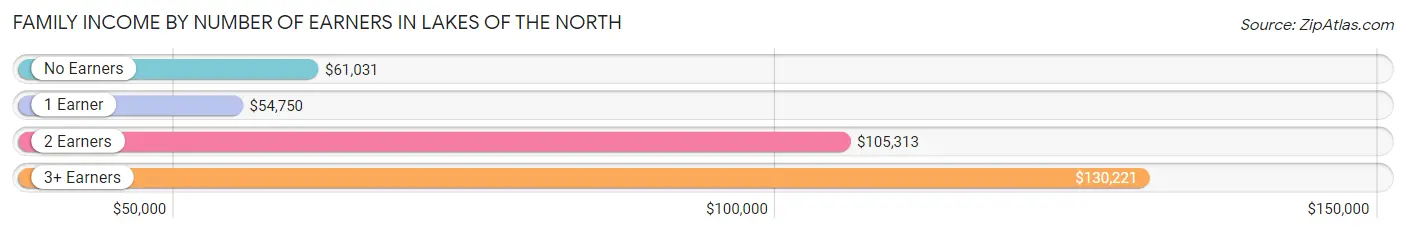
| Number of Earners | # Families | Median Income |
| No Earners | 179 (45.0%) | $61,031 |
| 1 Earner | 83 (20.8%) | $54,750 |
| 2 Earners | 105 (26.4%) | $105,313 |
| 3+ Earners | 31 (7.8%) | $130,221 |
| Total | 398 (100.0%) | $63,438 |
Household Income in Lakes of the North
Household Income Brackets in Lakes of the North
With 163 households falling in the category, the $50,000 to $74,999 income range is the most frequent in Lakes of the North, accounting for 32.2% of all households.
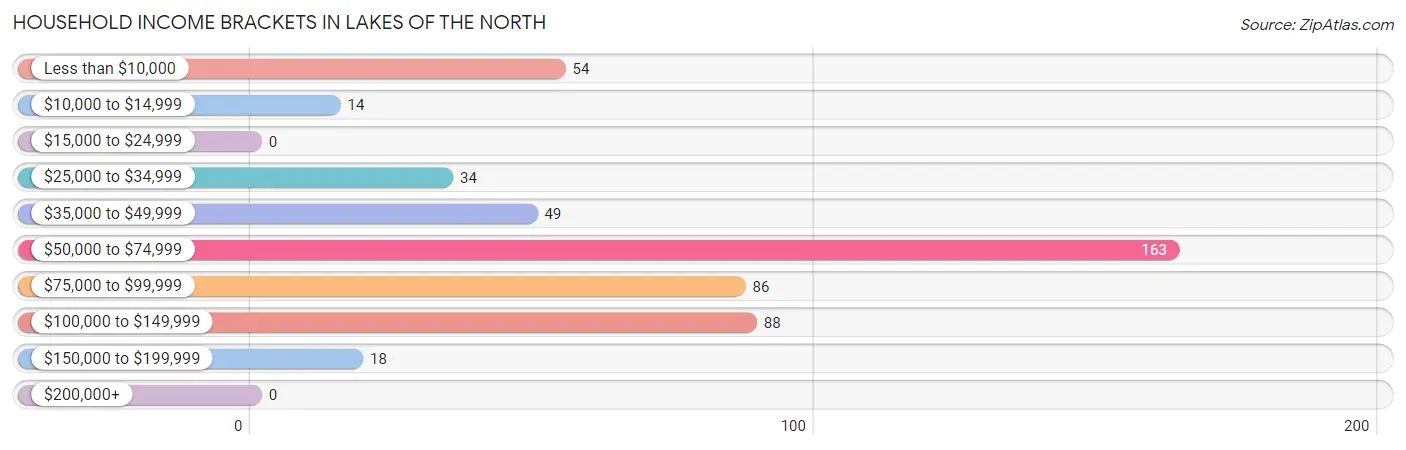
| Income Bracket | # Households | % Households |
| Less than $10,000 | 54 | 10.7% |
| $10,000 to $14,999 | 14 | 2.8% |
| $15,000 to $24,999 | 0 | 0.0% |
| $25,000 to $34,999 | 34 | 6.7% |
| $35,000 to $49,999 | 49 | 9.7% |
| $50,000 to $74,999 | 163 | 32.2% |
| $75,000 to $99,999 | 86 | 17.0% |
| $100,000 to $149,999 | 88 | 17.4% |
| $150,000 to $199,999 | 18 | 3.6% |
| $200,000+ | 0 | 0.0% |
Household Income by Householder Age in Lakes of the North
The median household income in Lakes of the North is $62,179, with the highest median household income of $63,409 found in the 65+ years age bracket for the primary householder. A total of 136 households (26.9%) fall into this category. Meanwhile, the 15 to 24 years age bracket for the primary householder has the lowest median household income of $0, with 9 households (1.8%) in this group.
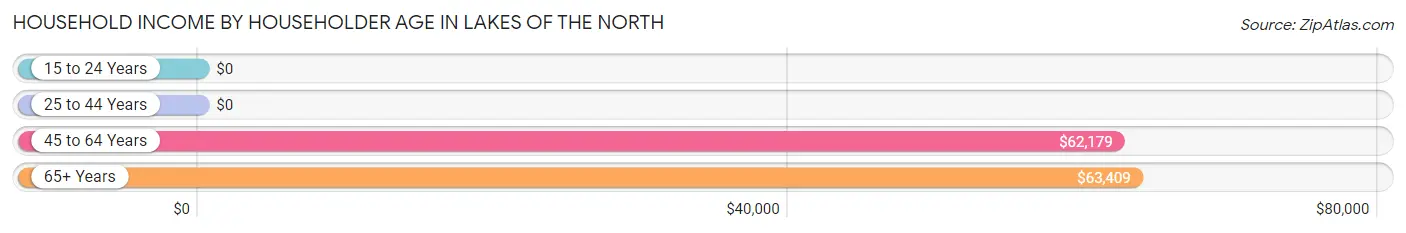
| Income Bracket | # Households | Median Income |
| 15 to 24 Years | 9 (1.8%) | $0 |
| 25 to 44 Years | 101 (20.0%) | $0 |
| 45 to 64 Years | 260 (51.4%) | $62,179 |
| 65+ Years | 136 (26.9%) | $63,409 |
| Total | 506 (100.0%) | $62,179 |
Poverty in Lakes of the North
Income Below Poverty by Sex and Age in Lakes of the North
With 3.9% poverty level for males and 17.9% for females among the residents of Lakes of the North, 18 to 24 year old males and under 5 year old females are the most vulnerable to poverty, with 4 males (36.4%) and 30 females (78.9%) in their respective age groups living below the poverty level.
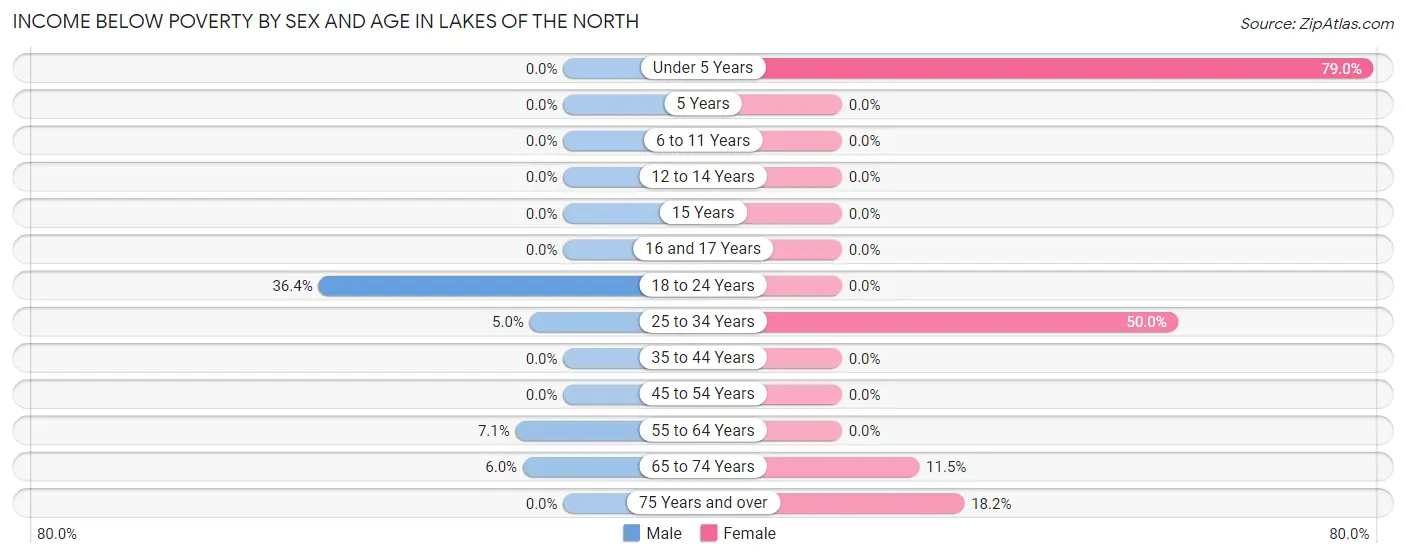
| Age Bracket | Male | Female |
| Under 5 Years | 0 (0.0%) | 30 (78.9%) |
| 5 Years | 0 (0.0%) | 0 (0.0%) |
| 6 to 11 Years | 0 (0.0%) | 0 (0.0%) |
| 12 to 14 Years | 0 (0.0%) | 0 (0.0%) |
| 15 Years | 0 (0.0%) | 0 (0.0%) |
| 16 and 17 Years | 0 (0.0%) | 0 (0.0%) |
| 18 to 24 Years | 4 (36.4%) | 0 (0.0%) |
| 25 to 34 Years | 2 (5.0%) | 46 (50.0%) |
| 35 to 44 Years | 0 (0.0%) | 0 (0.0%) |
| 45 to 54 Years | 0 (0.0%) | 0 (0.0%) |
| 55 to 64 Years | 11 (7.1%) | 0 (0.0%) |
| 65 to 74 Years | 3 (6.0%) | 10 (11.5%) |
| 75 Years and over | 0 (0.0%) | 4 (18.2%) |
| Total | 20 (3.9%) | 90 (17.9%) |
Income Above Poverty by Sex and Age in Lakes of the North
According to the poverty statistics in Lakes of the North, males aged under 5 years and females aged 6 to 11 years are the age groups that are most secure financially, with 100.0% of males and 100.0% of females in these age groups living above the poverty line.
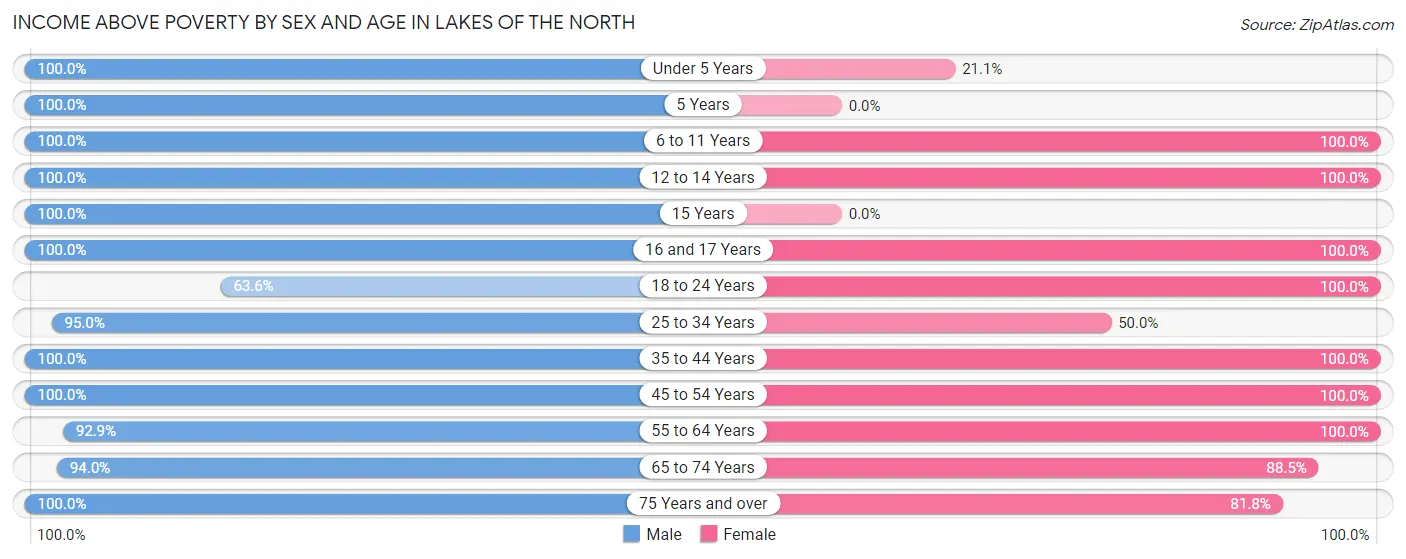
| Age Bracket | Male | Female |
| Under 5 Years | 2 (100.0%) | 8 (21.0%) |
| 5 Years | 4 (100.0%) | 0 (0.0%) |
| 6 to 11 Years | 17 (100.0%) | 10 (100.0%) |
| 12 to 14 Years | 16 (100.0%) | 3 (100.0%) |
| 15 Years | 17 (100.0%) | 0 (0.0%) |
| 16 and 17 Years | 5 (100.0%) | 3 (100.0%) |
| 18 to 24 Years | 7 (63.6%) | 13 (100.0%) |
| 25 to 34 Years | 38 (95.0%) | 46 (50.0%) |
| 35 to 44 Years | 28 (100.0%) | 22 (100.0%) |
| 45 to 54 Years | 92 (100.0%) | 85 (100.0%) |
| 55 to 64 Years | 144 (92.9%) | 127 (100.0%) |
| 65 to 74 Years | 47 (94.0%) | 77 (88.5%) |
| 75 Years and over | 75 (100.0%) | 18 (81.8%) |
| Total | 492 (96.1%) | 412 (82.1%) |
Income Below Poverty Among Married-Couple Families in Lakes of the North
The poverty statistics for married-couple families in Lakes of the North show that 0.9% or 3 of the total 336 families live below the poverty line. Families with no children have the highest poverty rate of 1.1%, comprising of 3 families. On the other hand, families with 1 or 2 children have the lowest poverty rate of 0.0%, which includes 0 families.
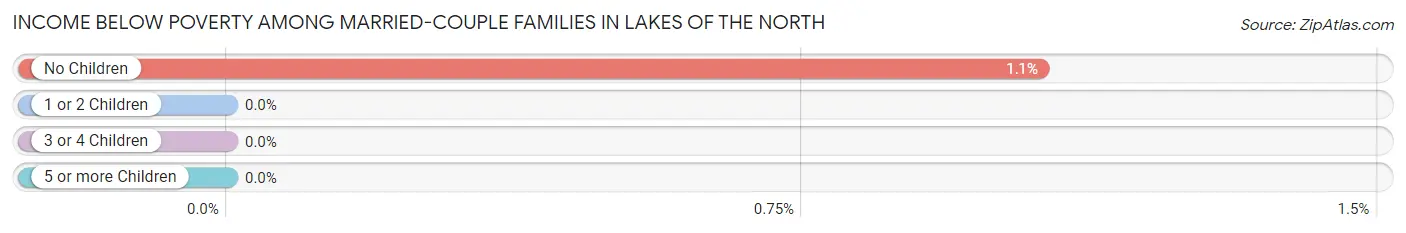
| Children | Above Poverty | Below Poverty |
| No Children | 280 (98.9%) | 3 (1.1%) |
| 1 or 2 Children | 53 (100.0%) | 0 (0.0%) |
| 3 or 4 Children | 0 (0.0%) | 0 (0.0%) |
| 5 or more Children | 0 (0.0%) | 0 (0.0%) |
| Total | 333 (99.1%) | 3 (0.9%) |
Income Below Poverty Among Single-Parent Households in Lakes of the North
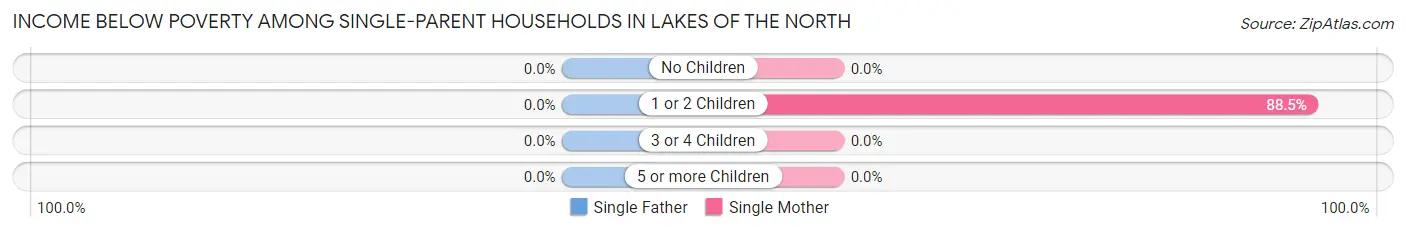
| Children | Single Father | Single Mother |
| No Children | 0 (0.0%) | 0 (0.0%) |
| 1 or 2 Children | 0 (0.0%) | 46 (88.5%) |
| 3 or 4 Children | 0 (0.0%) | 0 (0.0%) |
| 5 or more Children | 0 (0.0%) | 0 (0.0%) |
| Total | 0 (0.0%) | 46 (78.0%) |
Income Below Poverty Among Married-Couple vs Single-Parent Households in Lakes of the North
The poverty data for Lakes of the North shows that 3 of the married-couple family households (0.9%) and 46 of the single-parent households (74.2%) are living below the poverty level. Within the married-couple family households, those with no children have the highest poverty rate, with 3 households (1.1%) falling below the poverty line. Among the single-parent households, those with 1 or 2 children have the highest poverty rate, with 46 household (88.5%) living below poverty.
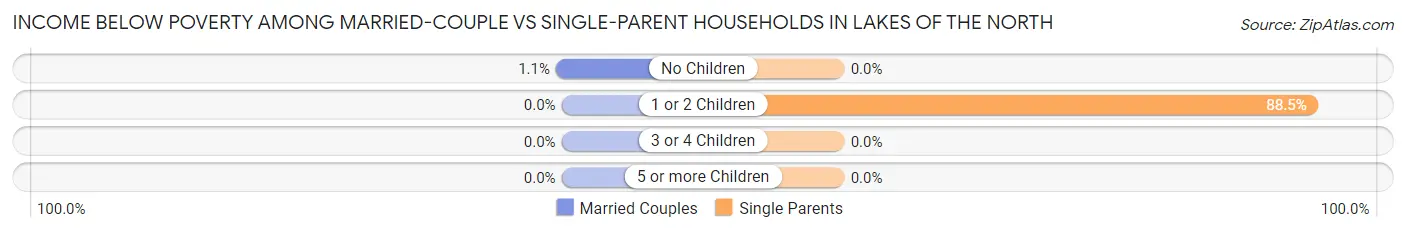
| Children | Married-Couple Families | Single-Parent Households |
| No Children | 3 (1.1%) | 0 (0.0%) |
| 1 or 2 Children | 0 (0.0%) | 46 (88.5%) |
| 3 or 4 Children | 0 (0.0%) | 0 (0.0%) |
| 5 or more Children | 0 (0.0%) | 0 (0.0%) |
| Total | 3 (0.9%) | 46 (74.2%) |
Race in Lakes of the North
The most populous races in Lakes of the North are White / Caucasian (989 | 95.9%), Two or more Races (22 | 2.1%), and Hispanic or Latino (13 | 1.3%).
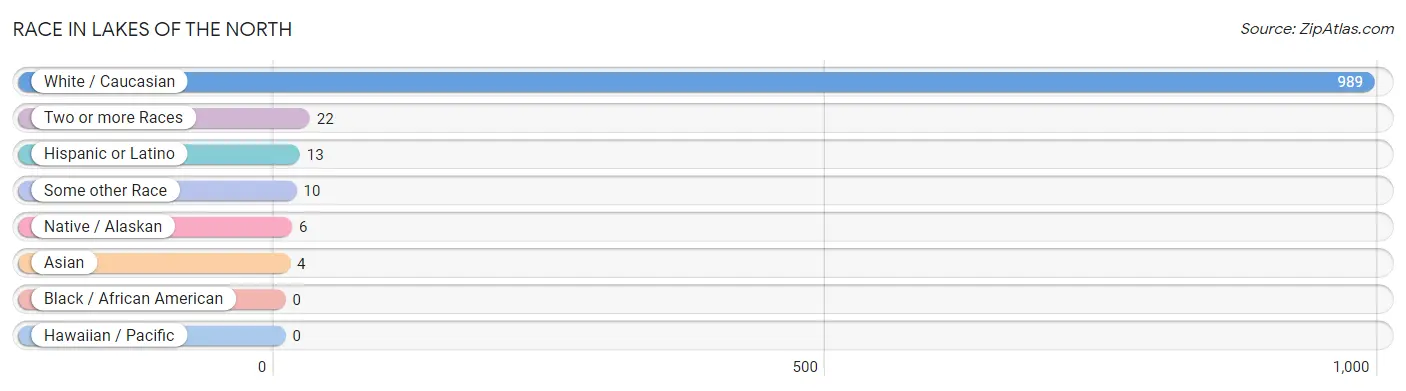
| Race | # Population | % Population |
| Asian | 4 | 0.4% |
| Black / African American | 0 | 0.0% |
| Hawaiian / Pacific | 0 | 0.0% |
| Hispanic or Latino | 13 | 1.3% |
| Native / Alaskan | 6 | 0.6% |
| White / Caucasian | 989 | 95.9% |
| Two or more Races | 22 | 2.1% |
| Some other Race | 10 | 1.0% |
| Total | 1,031 | 100.0% |
Ancestry in Lakes of the North
The most populous ancestries reported in Lakes of the North are English (287 | 27.8%), German (262 | 25.4%), Irish (143 | 13.9%), French (109 | 10.6%), and European (81 | 7.9%), together accounting for 85.6% of all Lakes of the North residents.
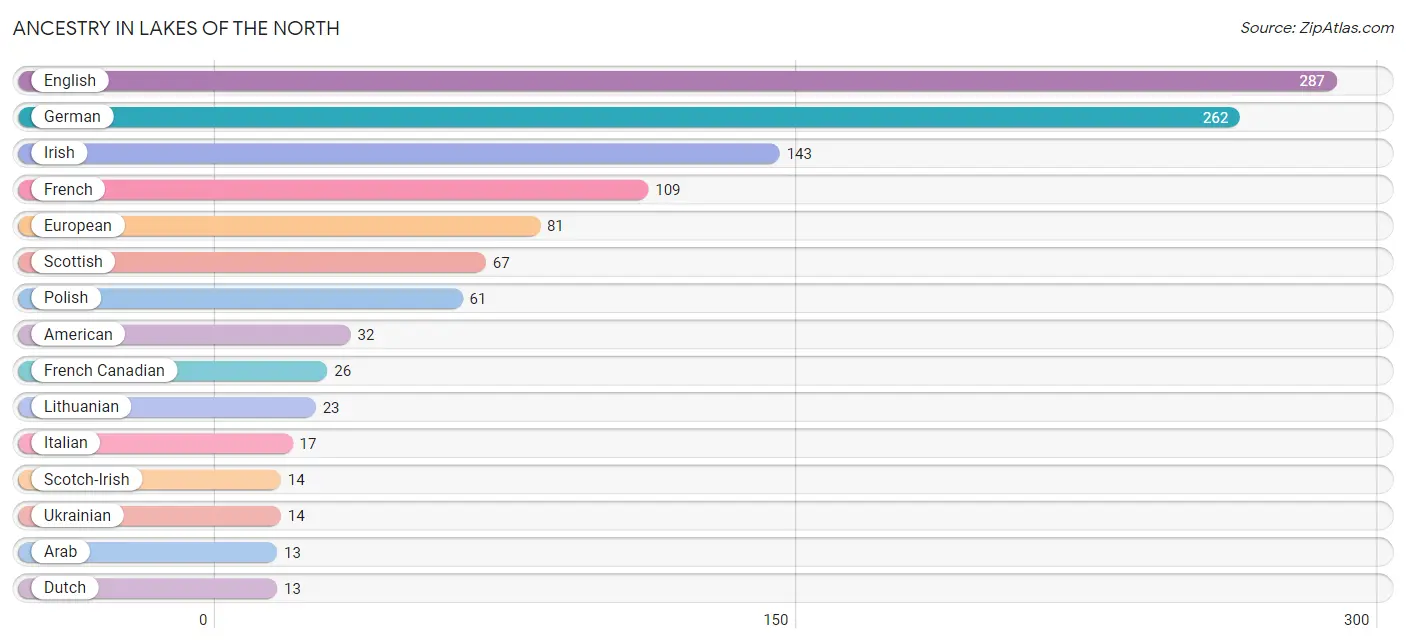
| Ancestry | # Population | % Population |
| American | 32 | 3.1% |
| Arab | 13 | 1.3% |
| Belgian | 3 | 0.3% |
| Chippewa | 6 | 0.6% |
| Czech | 2 | 0.2% |
| Dutch | 13 | 1.3% |
| Eastern European | 6 | 0.6% |
| English | 287 | 27.8% |
| European | 81 | 7.9% |
| Finnish | 9 | 0.9% |
| French | 109 | 10.6% |
| French American Indian | 6 | 0.6% |
| French Canadian | 26 | 2.5% |
| German | 262 | 25.4% |
| Irish | 143 | 13.9% |
| Italian | 17 | 1.7% |
| Korean | 4 | 0.4% |
| Lebanese | 13 | 1.3% |
| Lithuanian | 23 | 2.2% |
| Mexican | 13 | 1.3% |
| Native Hawaiian | 11 | 1.1% |
| Norwegian | 4 | 0.4% |
| Polish | 61 | 5.9% |
| Romanian | 3 | 0.3% |
| Scandinavian | 9 | 0.9% |
| Scotch-Irish | 14 | 1.4% |
| Scottish | 67 | 6.5% |
| Slovak | 10 | 1.0% |
| Swedish | 5 | 0.5% |
| Ukrainian | 14 | 1.4% |
| Welsh | 8 | 0.8% | View All 31 Rows |
Immigrants in Lakes of the North
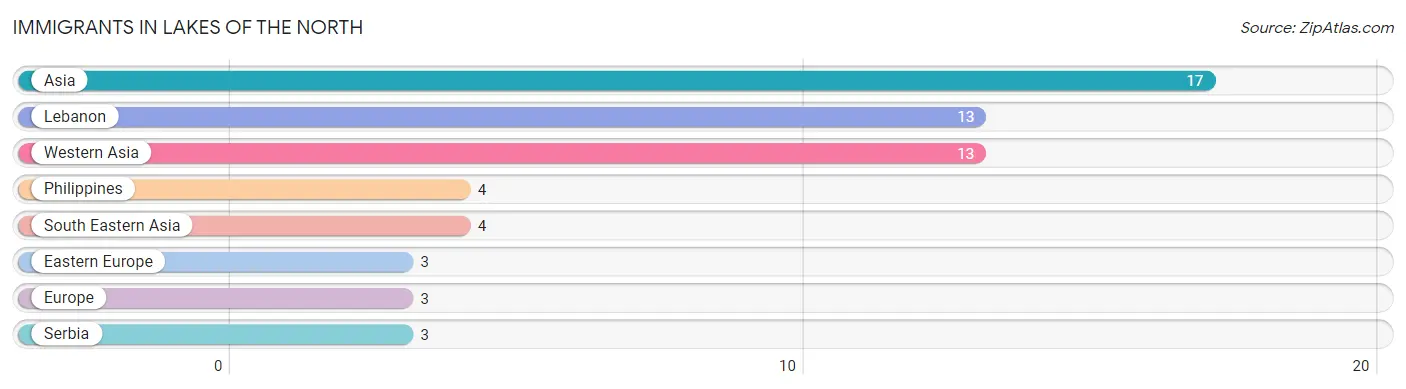
The most numerous immigrant groups reported in Lakes of the North came from Asia (17 | 1.7%), Lebanon (13 | 1.3%), Western Asia (13 | 1.3%), Philippines (4 | 0.4%), and South Eastern Asia (4 | 0.4%), together accounting for 5.0% of all Lakes of the North residents.
| Immigration Origin | # Population | % Population |
| Asia | 17 | 1.7% |
| Eastern Europe | 3 | 0.3% |
| Europe | 3 | 0.3% |
| Lebanon | 13 | 1.3% |
| Philippines | 4 | 0.4% |
| Serbia | 3 | 0.3% |
| South Eastern Asia | 4 | 0.4% |
| Western Asia | 13 | 1.3% | View All 8 Rows |
Sex and Age in Lakes of the North
Sex and Age in Lakes of the North
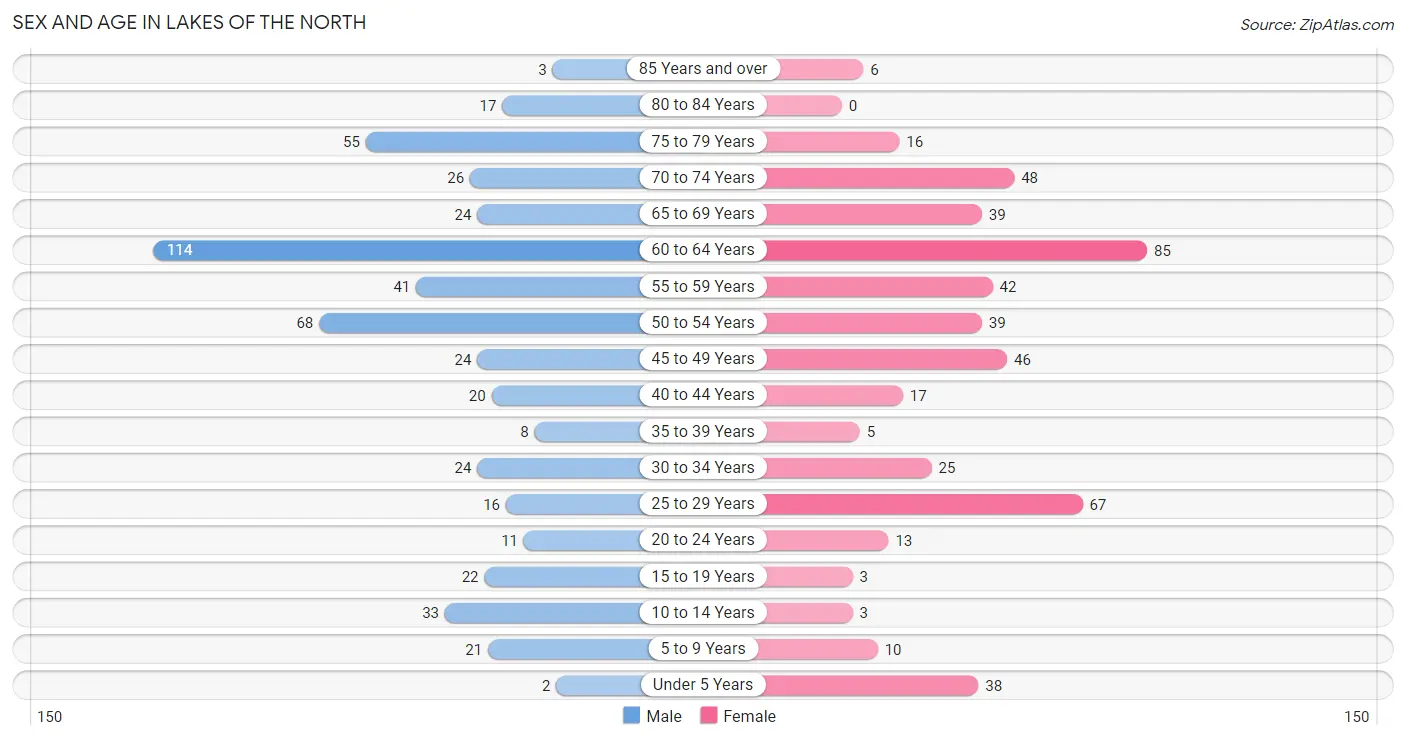
The most populous age groups in Lakes of the North are 60 to 64 Years (114 | 21.5%) for men and 60 to 64 Years (85 | 16.9%) for women.
| Age Bracket | Male | Female |
| Under 5 Years | 2 (0.4%) | 38 (7.6%) |
| 5 to 9 Years | 21 (4.0%) | 10 (2.0%) |
| 10 to 14 Years | 33 (6.2%) | 3 (0.6%) |
| 15 to 19 Years | 22 (4.2%) | 3 (0.6%) |
| 20 to 24 Years | 11 (2.1%) | 13 (2.6%) |
| 25 to 29 Years | 16 (3.0%) | 67 (13.4%) |
| 30 to 34 Years | 24 (4.5%) | 25 (5.0%) |
| 35 to 39 Years | 8 (1.5%) | 5 (1.0%) |
| 40 to 44 Years | 20 (3.8%) | 17 (3.4%) |
| 45 to 49 Years | 24 (4.5%) | 46 (9.2%) |
| 50 to 54 Years | 68 (12.9%) | 39 (7.8%) |
| 55 to 59 Years | 41 (7.7%) | 42 (8.4%) |
| 60 to 64 Years | 114 (21.5%) | 85 (16.9%) |
| 65 to 69 Years | 24 (4.5%) | 39 (7.8%) |
| 70 to 74 Years | 26 (4.9%) | 48 (9.6%) |
| 75 to 79 Years | 55 (10.4%) | 16 (3.2%) |
| 80 to 84 Years | 17 (3.2%) | 0 (0.0%) |
| 85 Years and over | 3 (0.6%) | 6 (1.2%) |
| Total | 529 (100.0%) | 502 (100.0%) |
Families and Households in Lakes of the North
Median Family Size in Lakes of the North
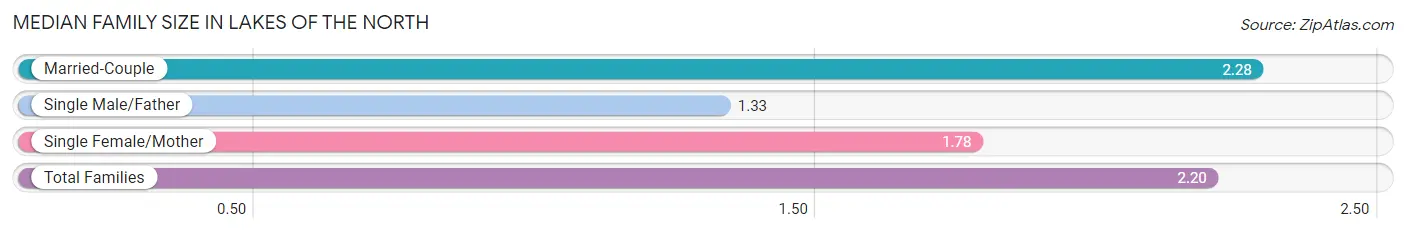
The median family size in Lakes of the North is 2.20 persons per family, with married-couple families (336 | 84.4%) accounting for the largest median family size of 2.28 persons per family. On the other hand, single male/father families (3 | 0.7%) represent the smallest median family size with 1.33 persons per family.
| Family Type | # Families | Family Size |
| Married-Couple | 336 (84.4%) | 2.28 |
| Single Male/Father | 3 (0.7%) | 1.33 |
| Single Female/Mother | 59 (14.8%) | 1.78 |
| Total Families | 398 (100.0%) | 2.20 |
Median Household Size in Lakes of the North
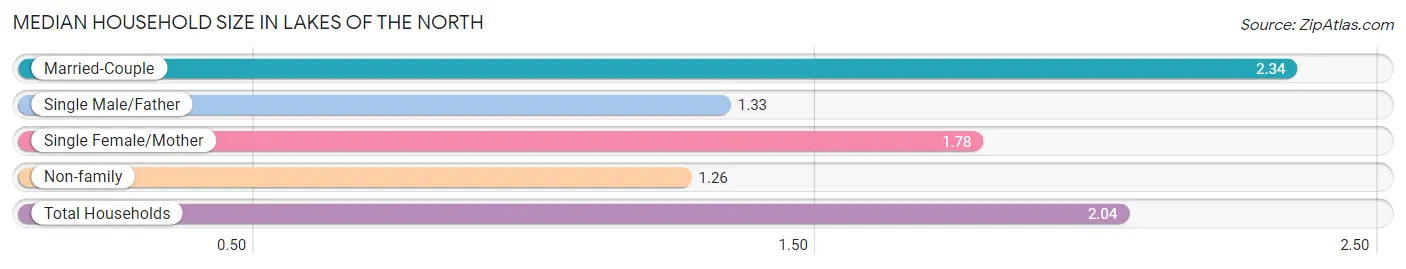
The median household size in Lakes of the North is 2.04 persons per household, with married-couple households (336 | 66.4%) accounting for the largest median household size of 2.34 persons per household. non-family households (108 | 21.3%) represent the smallest median household size with 1.26 persons per household.
| Household Type | # Households | Household Size |
| Married-Couple | 336 (66.4%) | 2.34 |
| Single Male/Father | 3 (0.6%) | 1.33 |
| Single Female/Mother | 59 (11.7%) | 1.78 |
| Non-family | 108 (21.3%) | 1.26 |
| Total Households | 506 (100.0%) | 2.04 |
Household Size by Marriage Status in Lakes of the North
Out of a total of 506 households in Lakes of the North, 398 (78.7%) are family households, while 108 (21.3%) are nonfamily households. The most numerous type of family households are 2-person households, comprising 296, and the most common type of nonfamily households are 1-person households, comprising 81.
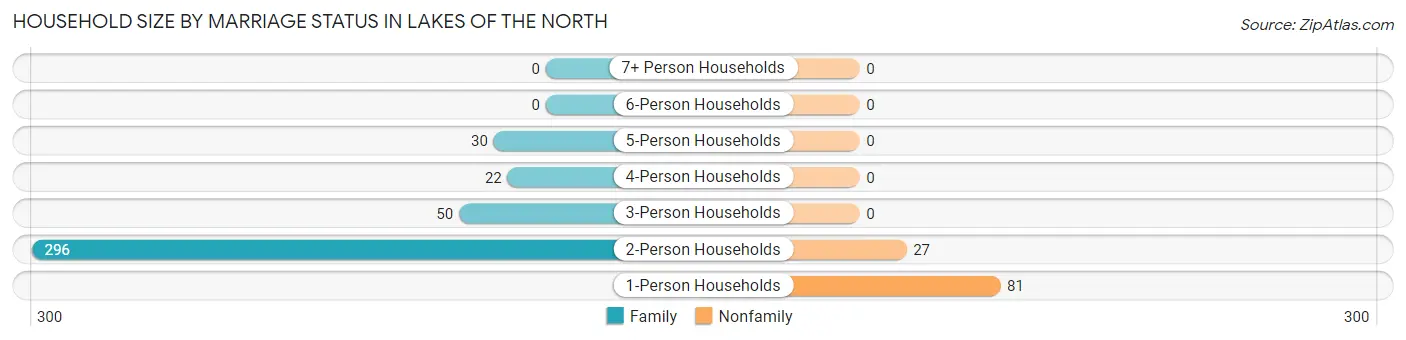
| Household Size | Family Households | Nonfamily Households |
| 1-Person Households | - | 81 (16.0%) |
| 2-Person Households | 296 (58.5%) | 27 (5.3%) |
| 3-Person Households | 50 (9.9%) | 0 (0.0%) |
| 4-Person Households | 22 (4.3%) | 0 (0.0%) |
| 5-Person Households | 30 (5.9%) | 0 (0.0%) |
| 6-Person Households | 0 (0.0%) | 0 (0.0%) |
| 7+ Person Households | 0 (0.0%) | 0 (0.0%) |
| Total | 398 (78.7%) | 108 (21.3%) |
Female Fertility in Lakes of the North
Fertility by Age in Lakes of the North
Average fertility rate in Lakes of the North is 23.0 births per 1,000 women. Women in the age bracket of 20 to 34 years have the highest fertility rate with 38.0 births per 1,000 women. Women in the age bracket of 20 to 34 years acount for 100.0% of all women with births.
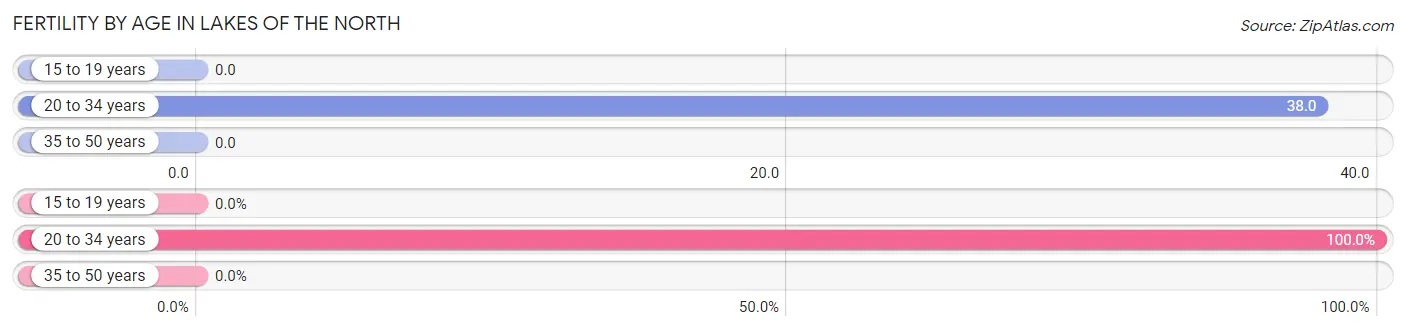
| Age Bracket | Women with Births | Births / 1,000 Women |
| 15 to 19 years | 0 (0.0%) | 0.0 |
| 20 to 34 years | 4 (100.0%) | 38.0 |
| 35 to 50 years | 0 (0.0%) | 0.0 |
| Total | 4 (100.0%) | 23.0 |
Fertility by Age by Marriage Status in Lakes of the North
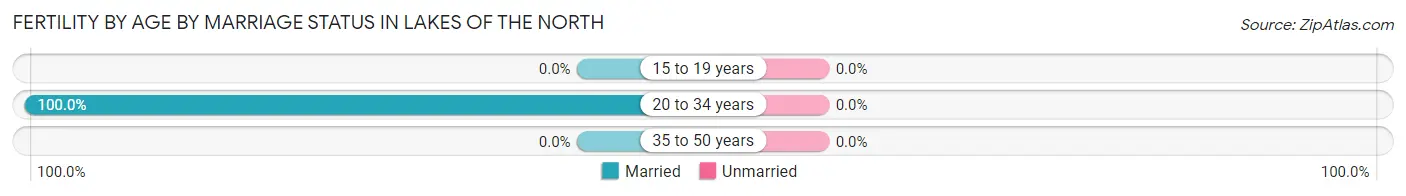
| Age Bracket | Married | Unmarried |
| 15 to 19 years | 0 (0.0%) | 0 (0.0%) |
| 20 to 34 years | 4 (100.0%) | 0 (0.0%) |
| 35 to 50 years | 0 (0.0%) | 0 (0.0%) |
| Total | 4 (100.0%) | 0 (0.0%) |
Fertility by Education in Lakes of the North
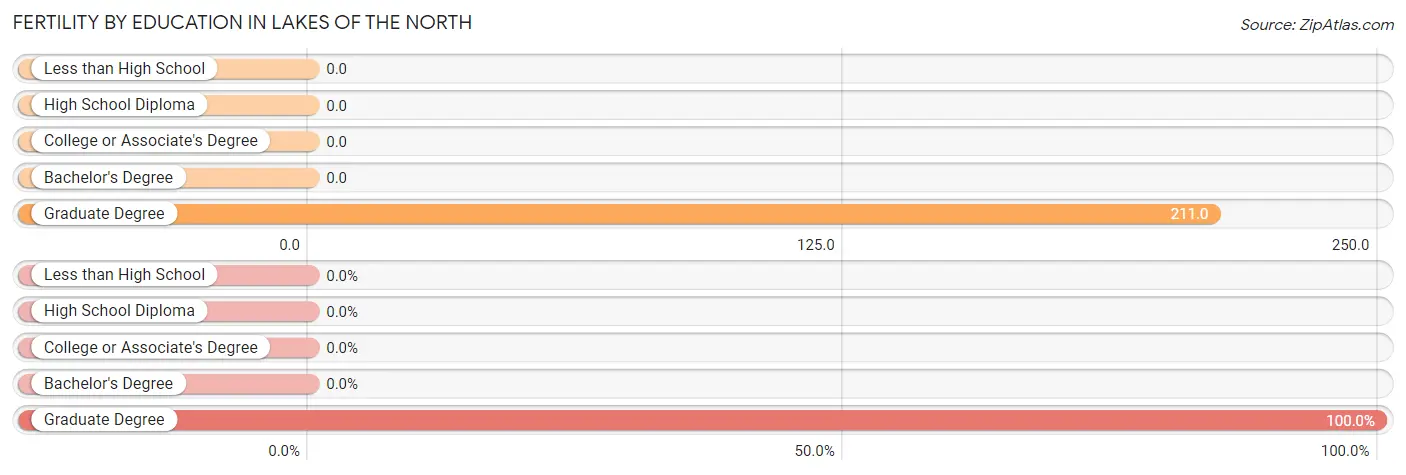
| Educational Attainment | Women with Births | Births / 1,000 Women |
| Less than High School | 0 (0.0%) | 0.0 |
| High School Diploma | 0 (0.0%) | 0.0 |
| College or Associate's Degree | 0 (0.0%) | 0.0 |
| Bachelor's Degree | 0 (0.0%) | 0.0 |
| Graduate Degree | 4 (100.0%) | 211.0 |
| Total | 4 (100.0%) | 23.0 |
Fertility by Education by Marriage Status in Lakes of the North
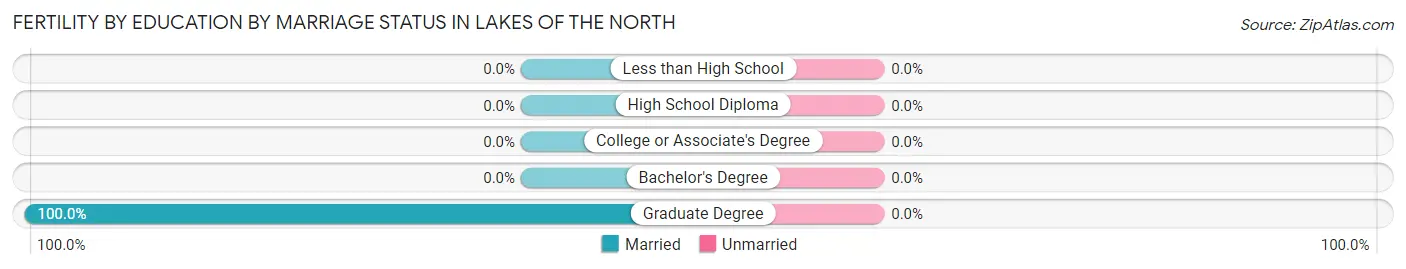
| Educational Attainment | Married | Unmarried |
| Less than High School | 0 (0.0%) | 0 (0.0%) |
| High School Diploma | 0 (0.0%) | 0 (0.0%) |
| College or Associate's Degree | 0 (0.0%) | 0 (0.0%) |
| Bachelor's Degree | 0 (0.0%) | 0 (0.0%) |
| Graduate Degree | 4 (100.0%) | 0 (0.0%) |
| Total | 4 (100.0%) | 0 (0.0%) |
Employment Characteristics in Lakes of the North
Employment by Class of Employer in Lakes of the North
Among the 398 employed individuals in Lakes of the North, private company employees (296 | 74.4%), state government employees (42 | 10.5%), and local government employees (27 | 6.8%) make up the most common classes of employment.
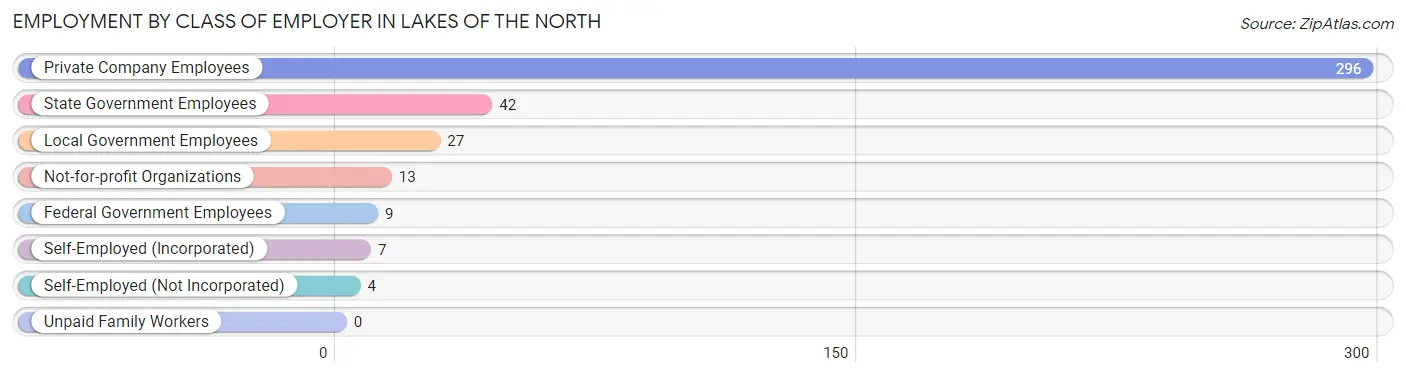
| Employer Class | # Employees | % Employees |
| Private Company Employees | 296 | 74.4% |
| Self-Employed (Incorporated) | 7 | 1.8% |
| Self-Employed (Not Incorporated) | 4 | 1.0% |
| Not-for-profit Organizations | 13 | 3.3% |
| Local Government Employees | 27 | 6.8% |
| State Government Employees | 42 | 10.5% |
| Federal Government Employees | 9 | 2.3% |
| Unpaid Family Workers | 0 | 0.0% |
| Total | 398 | 100.0% |
Employment Status by Age in Lakes of the North
According to the labor force statistics for Lakes of the North, out of the total population over 16 years of age (907), 46.6% or 423 individuals are in the labor force, with 4.0% or 17 of them unemployed. The age group with the highest labor force participation rate is 45 to 54 years, with 91.0% or 161 individuals in the labor force. Within the labor force, the 60 to 64 years age range has the highest percentage of unemployed individuals, with 41.9% or 13 of them being unemployed.
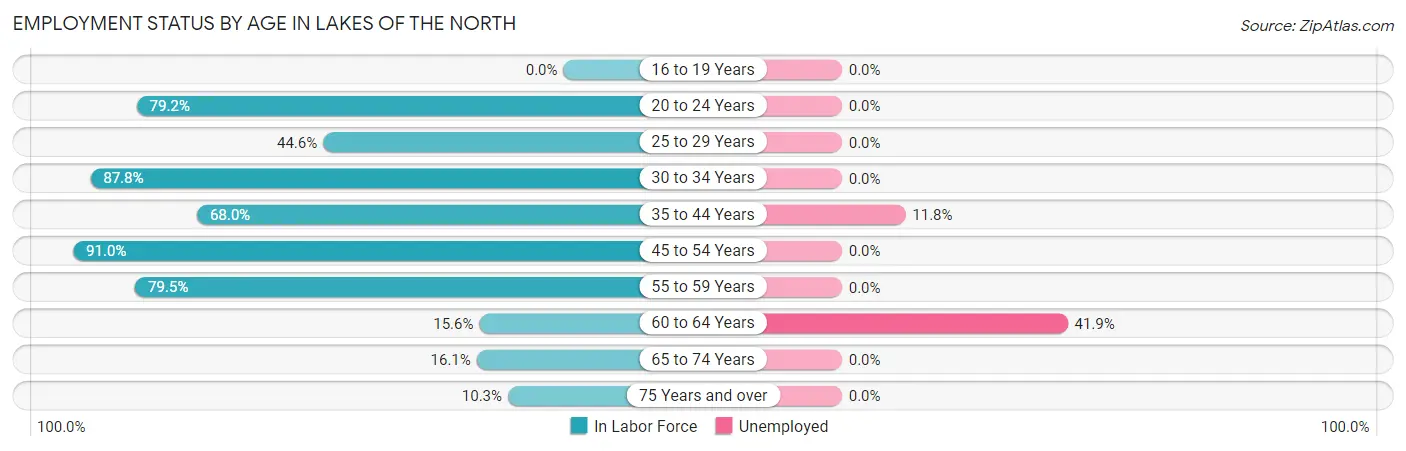
| Age Bracket | In Labor Force | Unemployed |
| 16 to 19 Years | 0 (0.0%) | 0 (0.0%) |
| 20 to 24 Years | 19 (79.2%) | 0 (0.0%) |
| 25 to 29 Years | 37 (44.6%) | 0 (0.0%) |
| 30 to 34 Years | 43 (87.8%) | 0 (0.0%) |
| 35 to 44 Years | 34 (68.0%) | 4 (11.8%) |
| 45 to 54 Years | 161 (91.0%) | 0 (0.0%) |
| 55 to 59 Years | 66 (79.5%) | 0 (0.0%) |
| 60 to 64 Years | 31 (15.6%) | 13 (41.9%) |
| 65 to 74 Years | 22 (16.1%) | 0 (0.0%) |
| 75 Years and over | 10 (10.3%) | 0 (0.0%) |
| Total | 423 (46.6%) | 17 (4.0%) |
Employment Status by Educational Attainment in Lakes of the North
According to labor force statistics for Lakes of the North, 58.0% of individuals (372) out of the total population between 25 and 64 years of age (641) are in the labor force, with 4.6% or 17 of them being unemployed. The group with the highest labor force participation rate are those with the educational attainment of bachelor's degree or higher, with 68.3% or 97 individuals in the labor force. Within the labor force, individuals with college / associate degree education have the highest percentage of unemployment, with 8.7% or 17 of them being unemployed.
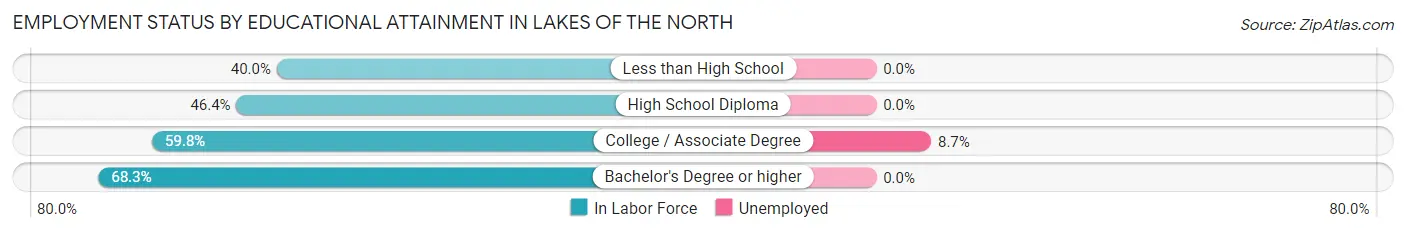
| Educational Attainment | In Labor Force | Unemployed |
| Less than High School | 2 (40.0%) | 0 (0.0%) |
| High School Diploma | 77 (46.4%) | 0 (0.0%) |
| College / Associate Degree | 196 (59.8%) | 29 (8.7%) |
| Bachelor's Degree or higher | 97 (68.3%) | 0 (0.0%) |
| Total | 372 (58.0%) | 29 (4.6%) |
Employment Occupations by Sex in Lakes of the North
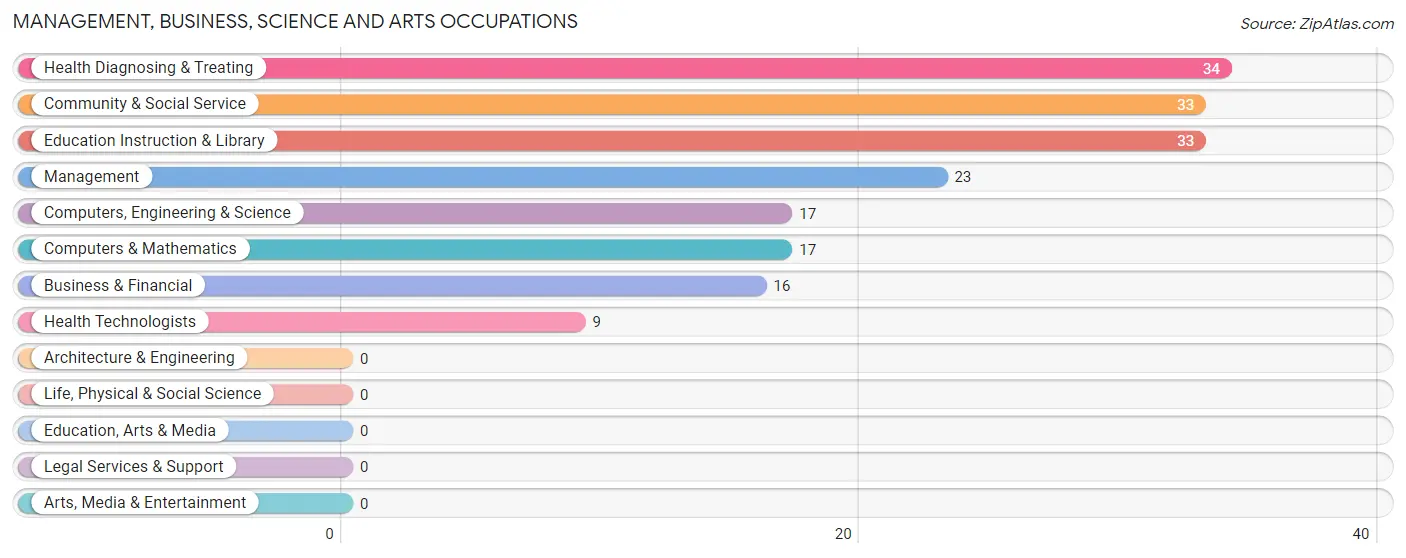
Management, Business, Science and Arts Occupations
The most common Management, Business, Science and Arts occupations in Lakes of the North are Health Diagnosing & Treating (34 | 8.4%), Community & Social Service (33 | 8.1%), Education Instruction & Library (33 | 8.1%), Management (23 | 5.7%), and Computers, Engineering & Science (17 | 4.2%).
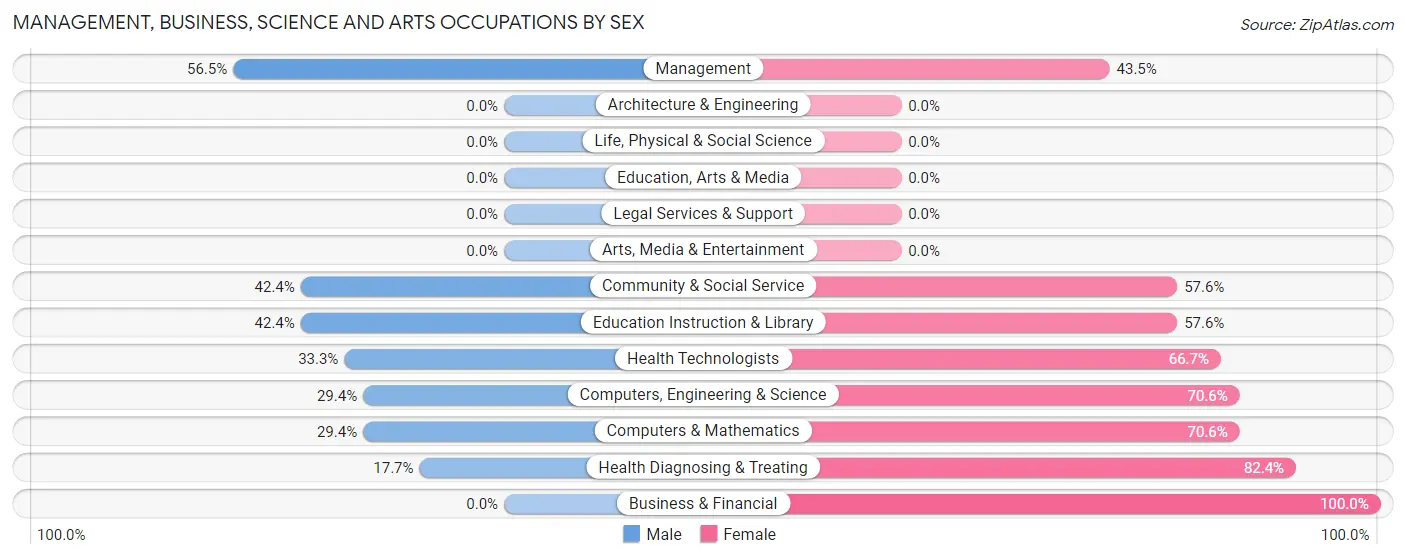
Management, Business, Science and Arts Occupations by Sex
Within the Management, Business, Science and Arts occupations in Lakes of the North, the most male-oriented occupations are Management (56.5%), Community & Social Service (42.4%), and Education Instruction & Library (42.4%), while the most female-oriented occupations are Business & Financial (100.0%), Health Diagnosing & Treating (82.4%), and Computers, Engineering & Science (70.6%).
| Occupation | Male | Female |
| Management | 13 (56.5%) | 10 (43.5%) |
| Business & Financial | 0 (0.0%) | 16 (100.0%) |
| Computers, Engineering & Science | 5 (29.4%) | 12 (70.6%) |
| Computers & Mathematics | 5 (29.4%) | 12 (70.6%) |
| Architecture & Engineering | 0 (0.0%) | 0 (0.0%) |
| Life, Physical & Social Science | 0 (0.0%) | 0 (0.0%) |
| Community & Social Service | 14 (42.4%) | 19 (57.6%) |
| Education, Arts & Media | 0 (0.0%) | 0 (0.0%) |
| Legal Services & Support | 0 (0.0%) | 0 (0.0%) |
| Education Instruction & Library | 14 (42.4%) | 19 (57.6%) |
| Arts, Media & Entertainment | 0 (0.0%) | 0 (0.0%) |
| Health Diagnosing & Treating | 6 (17.6%) | 28 (82.4%) |
| Health Technologists | 3 (33.3%) | 6 (66.7%) |
| Total (Category) | 38 (30.9%) | 85 (69.1%) |
| Total (Overall) | 214 (52.7%) | 192 (47.3%) |
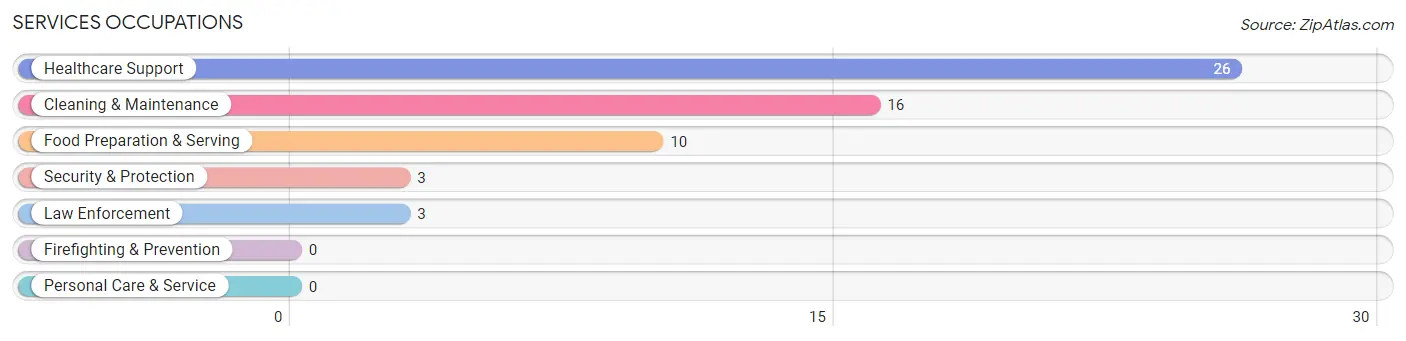
Services Occupations
The most common Services occupations in Lakes of the North are Healthcare Support (26 | 6.4%), Cleaning & Maintenance (16 | 3.9%), Food Preparation & Serving (10 | 2.5%), Security & Protection (3 | 0.7%), and Law Enforcement (3 | 0.7%).
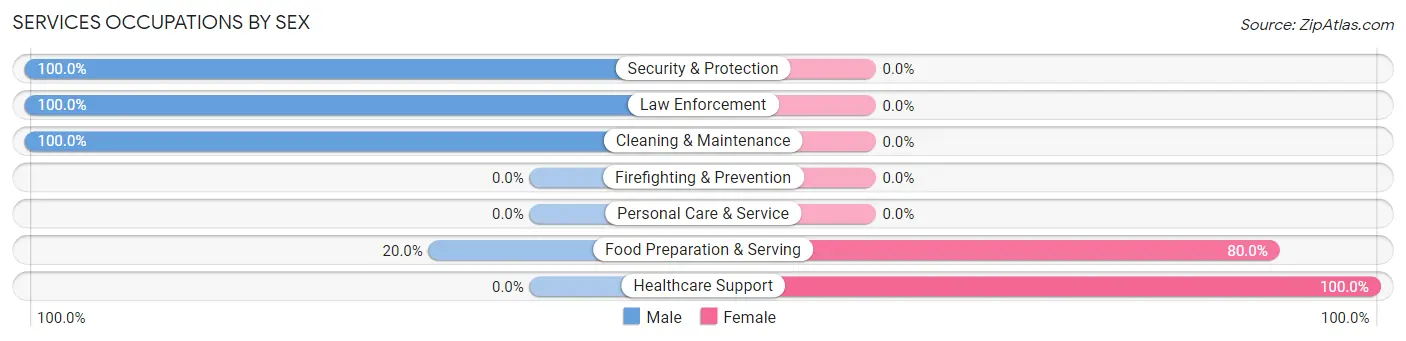
Services Occupations by Sex
Within the Services occupations in Lakes of the North, the most male-oriented occupations are Security & Protection (100.0%), Law Enforcement (100.0%), and Cleaning & Maintenance (100.0%), while the most female-oriented occupations are Healthcare Support (100.0%), and Food Preparation & Serving (80.0%).
| Occupation | Male | Female |
| Healthcare Support | 0 (0.0%) | 26 (100.0%) |
| Security & Protection | 3 (100.0%) | 0 (0.0%) |
| Firefighting & Prevention | 0 (0.0%) | 0 (0.0%) |
| Law Enforcement | 3 (100.0%) | 0 (0.0%) |
| Food Preparation & Serving | 2 (20.0%) | 8 (80.0%) |
| Cleaning & Maintenance | 16 (100.0%) | 0 (0.0%) |
| Personal Care & Service | 0 (0.0%) | 0 (0.0%) |
| Total (Category) | 21 (38.2%) | 34 (61.8%) |
| Total (Overall) | 214 (52.7%) | 192 (47.3%) |
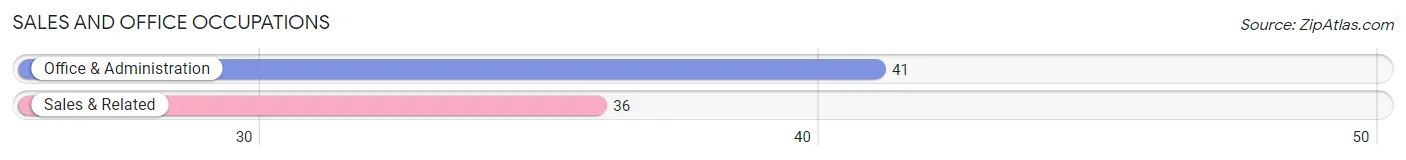
Sales and Office Occupations
The most common Sales and Office occupations in Lakes of the North are Office & Administration (41 | 10.1%), and Sales & Related (36 | 8.9%).
Sales and Office Occupations by Sex
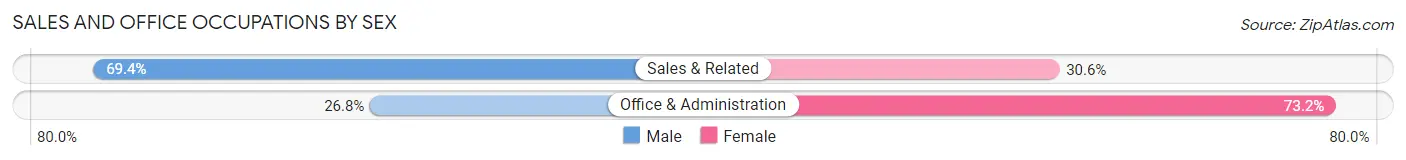
| Occupation | Male | Female |
| Sales & Related | 25 (69.4%) | 11 (30.6%) |
| Office & Administration | 11 (26.8%) | 30 (73.2%) |
| Total (Category) | 36 (46.8%) | 41 (53.2%) |
| Total (Overall) | 214 (52.7%) | 192 (47.3%) |
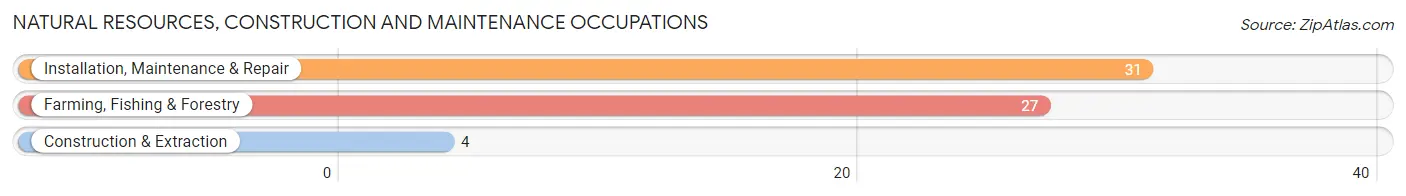
Natural Resources, Construction and Maintenance Occupations
The most common Natural Resources, Construction and Maintenance occupations in Lakes of the North are Installation, Maintenance & Repair (31 | 7.6%), Farming, Fishing & Forestry (27 | 6.7%), and Construction & Extraction (4 | 1.0%).
Natural Resources, Construction and Maintenance Occupations by Sex
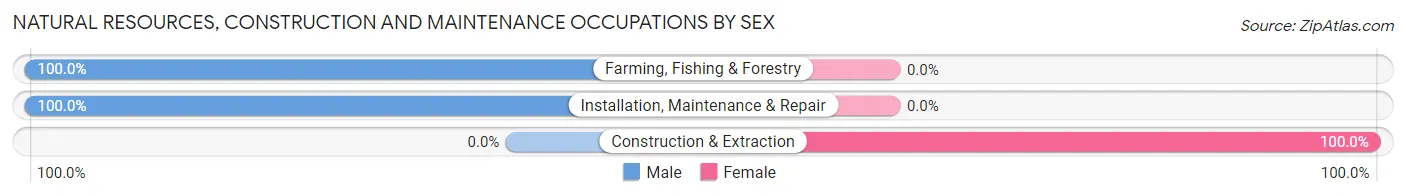
| Occupation | Male | Female |
| Farming, Fishing & Forestry | 27 (100.0%) | 0 (0.0%) |
| Construction & Extraction | 0 (0.0%) | 4 (100.0%) |
| Installation, Maintenance & Repair | 31 (100.0%) | 0 (0.0%) |
| Total (Category) | 58 (93.5%) | 4 (6.5%) |
| Total (Overall) | 214 (52.7%) | 192 (47.3%) |
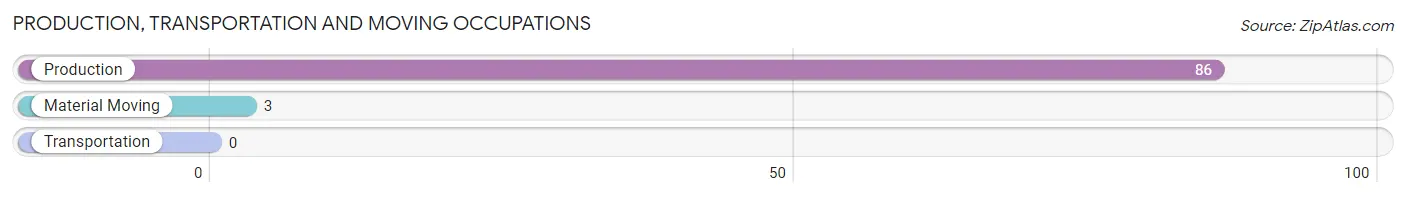
Production, Transportation and Moving Occupations
The most common Production, Transportation and Moving occupations in Lakes of the North are Production (86 | 21.2%), and Material Moving (3 | 0.7%).
Production, Transportation and Moving Occupations by Sex
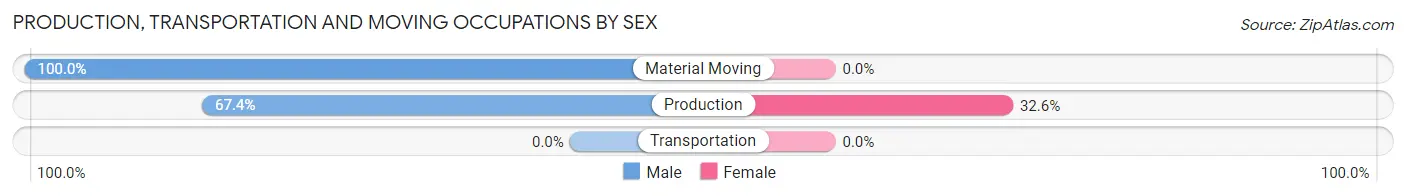
| Occupation | Male | Female |
| Production | 58 (67.4%) | 28 (32.6%) |
| Transportation | 0 (0.0%) | 0 (0.0%) |
| Material Moving | 3 (100.0%) | 0 (0.0%) |
| Total (Category) | 61 (68.5%) | 28 (31.5%) |
| Total (Overall) | 214 (52.7%) | 192 (47.3%) |
Employment Industries by Sex in Lakes of the North
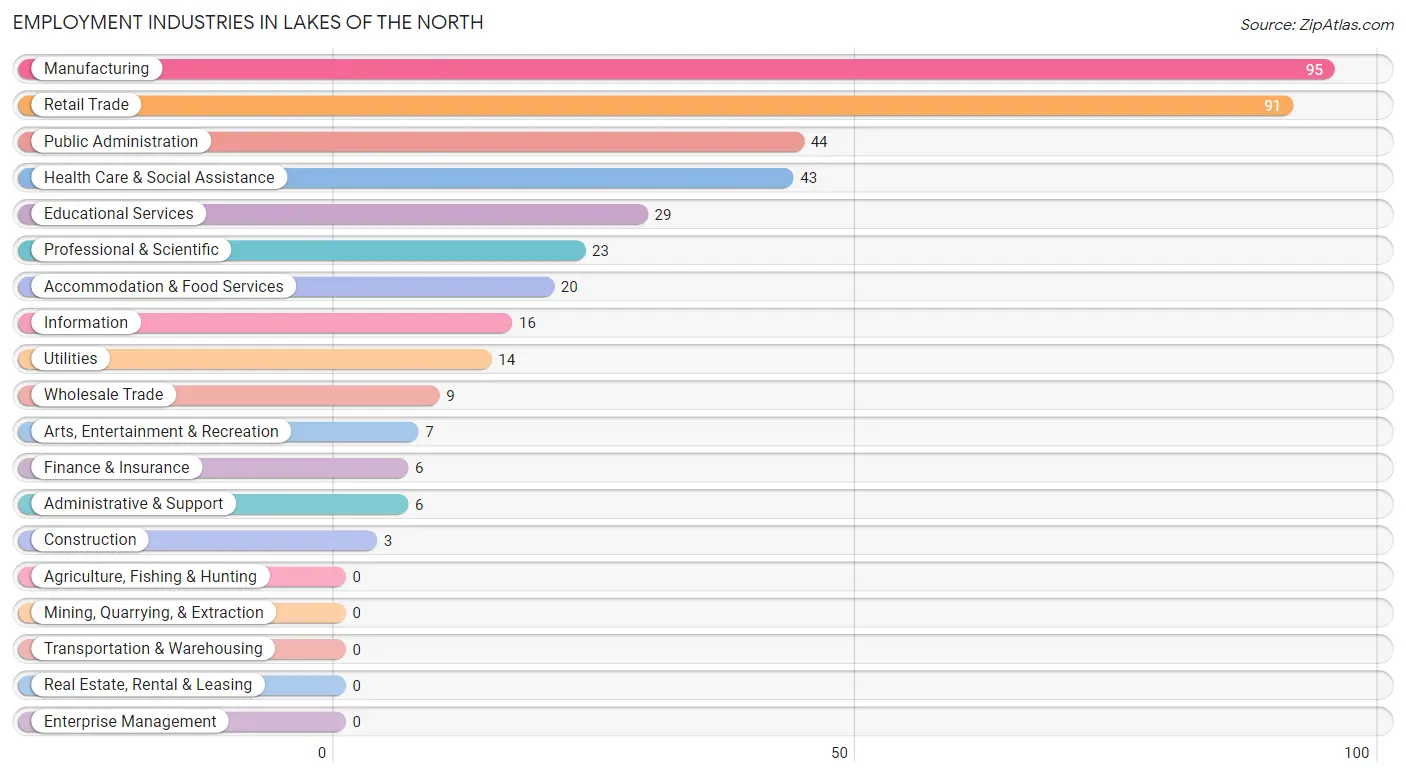
Employment Industries in Lakes of the North
The major employment industries in Lakes of the North include Manufacturing (95 | 23.4%), Retail Trade (91 | 22.4%), Public Administration (44 | 10.8%), Health Care & Social Assistance (43 | 10.6%), and Educational Services (29 | 7.1%).
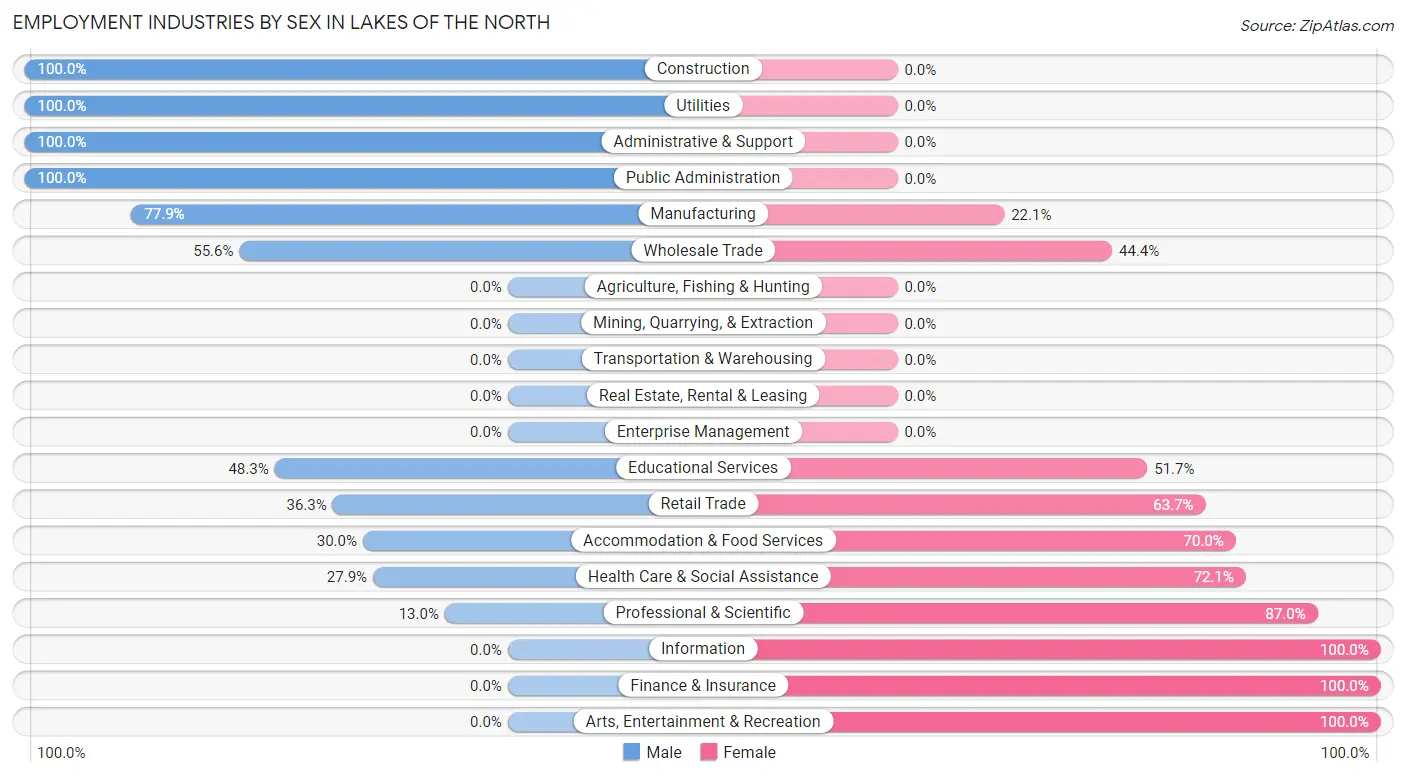
Employment Industries by Sex in Lakes of the North
The Lakes of the North industries that see more men than women are Construction (100.0%), Utilities (100.0%), and Administrative & Support (100.0%), whereas the industries that tend to have a higher number of women are Information (100.0%), Finance & Insurance (100.0%), and Arts, Entertainment & Recreation (100.0%).
| Industry | Male | Female |
| Agriculture, Fishing & Hunting | 0 (0.0%) | 0 (0.0%) |
| Mining, Quarrying, & Extraction | 0 (0.0%) | 0 (0.0%) |
| Construction | 3 (100.0%) | 0 (0.0%) |
| Manufacturing | 74 (77.9%) | 21 (22.1%) |
| Wholesale Trade | 5 (55.6%) | 4 (44.4%) |
| Retail Trade | 33 (36.3%) | 58 (63.7%) |
| Transportation & Warehousing | 0 (0.0%) | 0 (0.0%) |
| Utilities | 14 (100.0%) | 0 (0.0%) |
| Information | 0 (0.0%) | 16 (100.0%) |
| Finance & Insurance | 0 (0.0%) | 6 (100.0%) |
| Real Estate, Rental & Leasing | 0 (0.0%) | 0 (0.0%) |
| Professional & Scientific | 3 (13.0%) | 20 (87.0%) |
| Enterprise Management | 0 (0.0%) | 0 (0.0%) |
| Administrative & Support | 6 (100.0%) | 0 (0.0%) |
| Educational Services | 14 (48.3%) | 15 (51.7%) |
| Health Care & Social Assistance | 12 (27.9%) | 31 (72.1%) |
| Arts, Entertainment & Recreation | 0 (0.0%) | 7 (100.0%) |
| Accommodation & Food Services | 6 (30.0%) | 14 (70.0%) |
| Public Administration | 44 (100.0%) | 0 (0.0%) |
| Total | 214 (52.7%) | 192 (47.3%) |
Education in Lakes of the North
School Enrollment in Lakes of the North
The most common levels of schooling among the 105 students in Lakes of the North are middle school (36 | 34.3%), elementary school (27 | 25.7%), and high school (25 | 23.8%).
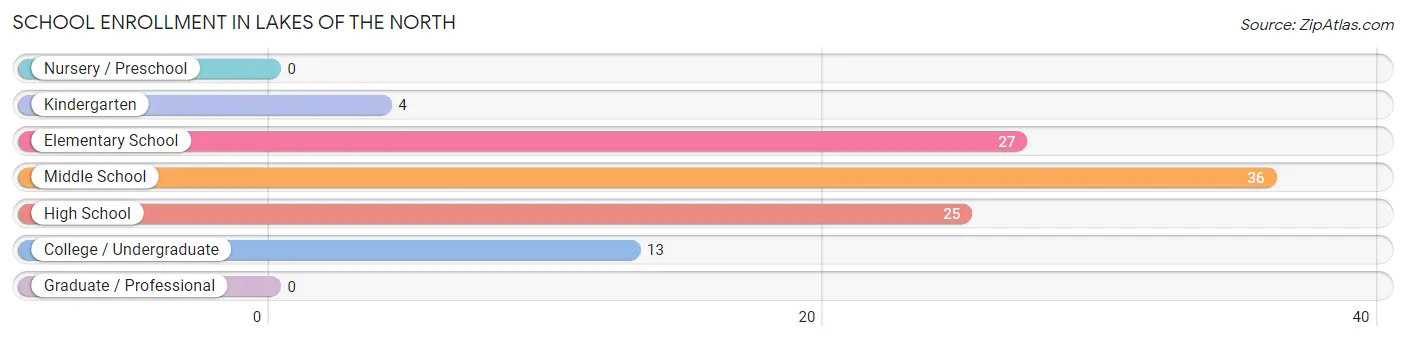
| School Level | # Students | % Students |
| Nursery / Preschool | 0 | 0.0% |
| Kindergarten | 4 | 3.8% |
| Elementary School | 27 | 25.7% |
| Middle School | 36 | 34.3% |
| High School | 25 | 23.8% |
| College / Undergraduate | 13 | 12.4% |
| Graduate / Professional | 0 | 0.0% |
| Total | 105 | 100.0% |
School Enrollment by Age by Funding Source in Lakes of the North
Out of a total of 105 students who are enrolled in schools in Lakes of the North, 33 (31.4%) attend a private institution, while the remaining 72 (68.6%) are enrolled in public schools. The age group of 15 to 17 year olds has the highest likelihood of being enrolled in private schools, with 17 (68.0% in the age bracket) enrolled. Conversely, the age group of 5 to 9 year old has the lowest likelihood of being enrolled in a private school, with 31 (100.0% in the age bracket) attending a public institution.
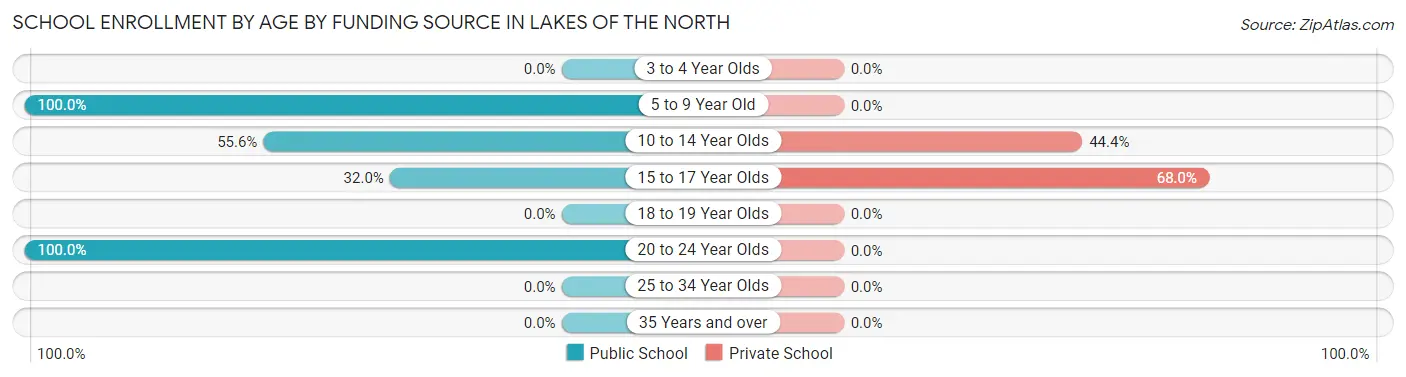
| Age Bracket | Public School | Private School |
| 3 to 4 Year Olds | 0 (0.0%) | 0 (0.0%) |
| 5 to 9 Year Old | 31 (100.0%) | 0 (0.0%) |
| 10 to 14 Year Olds | 20 (55.6%) | 16 (44.4%) |
| 15 to 17 Year Olds | 8 (32.0%) | 17 (68.0%) |
| 18 to 19 Year Olds | 0 (0.0%) | 0 (0.0%) |
| 20 to 24 Year Olds | 13 (100.0%) | 0 (0.0%) |
| 25 to 34 Year Olds | 0 (0.0%) | 0 (0.0%) |
| 35 Years and over | 0 (0.0%) | 0 (0.0%) |
| Total | 72 (68.6%) | 33 (31.4%) |
Educational Attainment by Field of Study in Lakes of the North
Education (65 | 24.8%), business (64 | 24.4%), arts & humanities (39 | 14.9%), science & technology (33 | 12.6%), and visual & performing arts (24 | 9.2%) are the most common fields of study among 262 individuals in Lakes of the North who have obtained a bachelor's degree or higher.
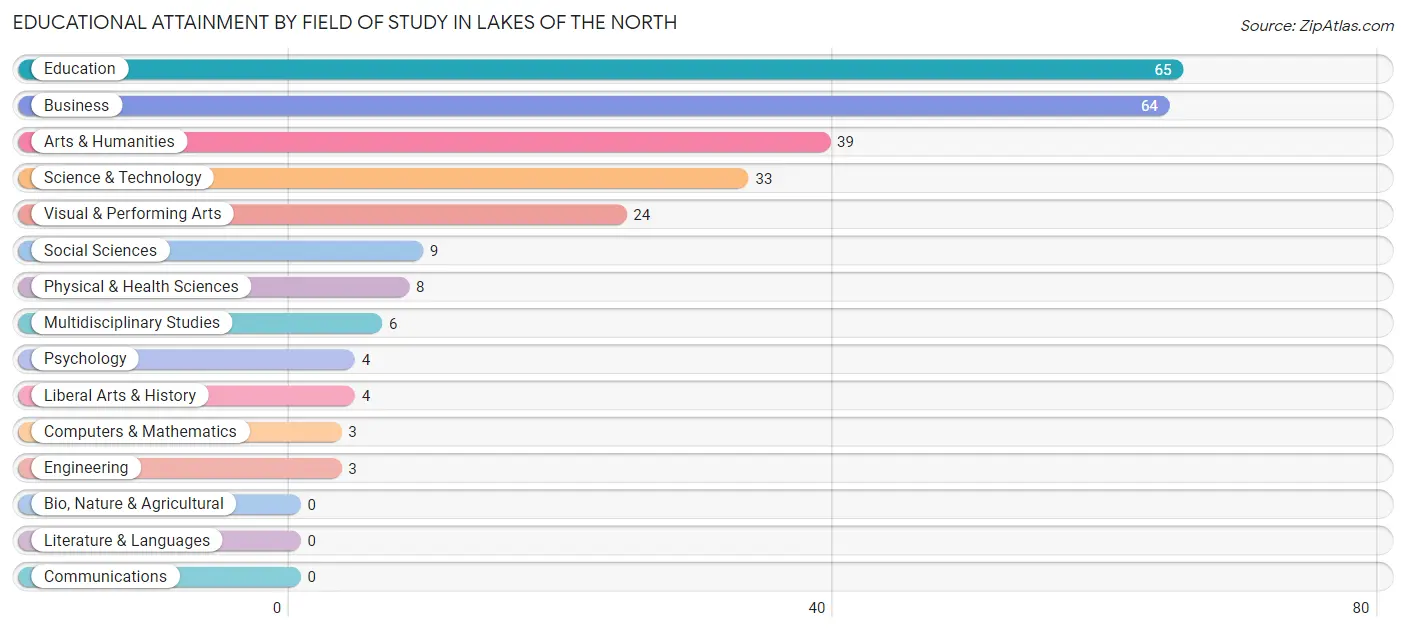
| Field of Study | # Graduates | % Graduates |
| Computers & Mathematics | 3 | 1.1% |
| Bio, Nature & Agricultural | 0 | 0.0% |
| Physical & Health Sciences | 8 | 3.0% |
| Psychology | 4 | 1.5% |
| Social Sciences | 9 | 3.4% |
| Engineering | 3 | 1.1% |
| Multidisciplinary Studies | 6 | 2.3% |
| Science & Technology | 33 | 12.6% |
| Business | 64 | 24.4% |
| Education | 65 | 24.8% |
| Literature & Languages | 0 | 0.0% |
| Liberal Arts & History | 4 | 1.5% |
| Visual & Performing Arts | 24 | 9.2% |
| Communications | 0 | 0.0% |
| Arts & Humanities | 39 | 14.9% |
| Total | 262 | 100.0% |
Transportation & Commute in Lakes of the North
Vehicle Availability by Sex in Lakes of the North
The most prevalent vehicle ownership categories in Lakes of the North are males with 2 vehicles (118, accounting for 55.1%) and females with 2 vehicles (111, making up 64.1%).
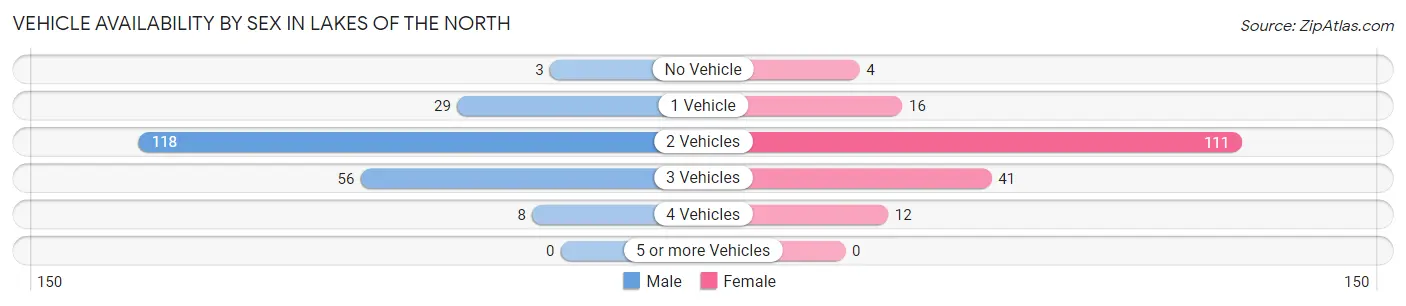
| Vehicles Available | Male | Female |
| No Vehicle | 3 (1.4%) | 4 (2.2%) |
| 1 Vehicle | 29 (13.6%) | 16 (8.7%) |
| 2 Vehicles | 118 (55.1%) | 111 (60.3%) |
| 3 Vehicles | 56 (26.2%) | 41 (22.3%) |
| 4 Vehicles | 8 (3.7%) | 12 (6.5%) |
| 5 or more Vehicles | 0 (0.0%) | 0 (0.0%) |
| Total | 214 (100.0%) | 184 (100.0%) |
Commute Time in Lakes of the North
The most frequently occuring commute durations in Lakes of the North are 25 to 29 minutes (96 commuters, 24.9%), 30 to 34 minutes (68 commuters, 17.6%), and 20 to 24 minutes (48 commuters, 12.4%).
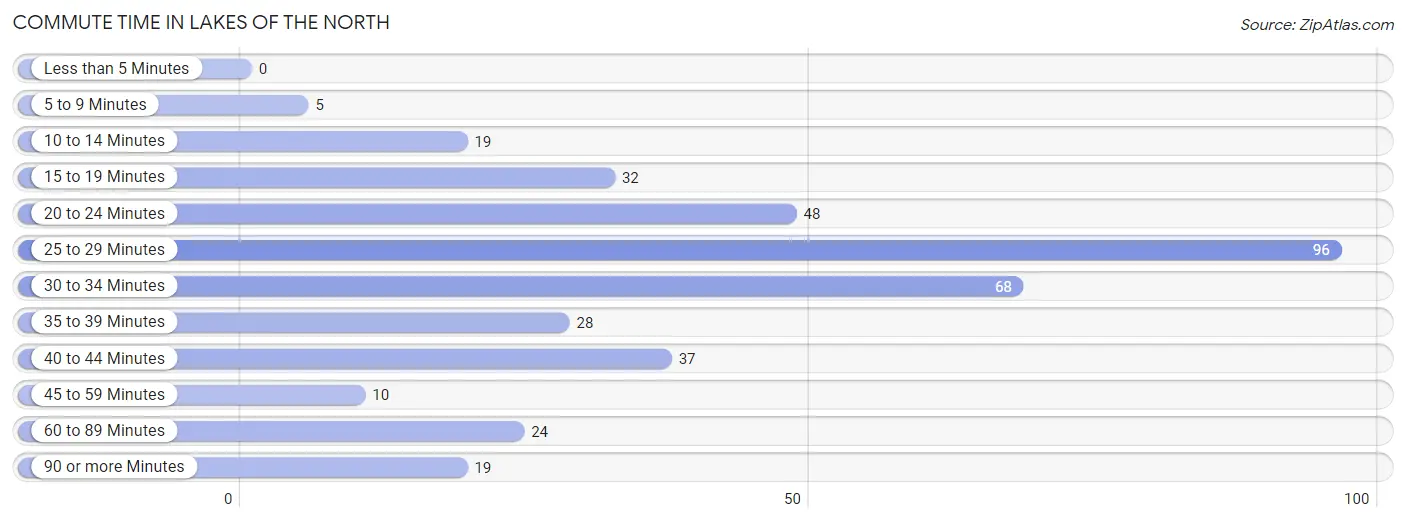
| Commute Time | # Commuters | % Commuters |
| Less than 5 Minutes | 0 | 0.0% |
| 5 to 9 Minutes | 5 | 1.3% |
| 10 to 14 Minutes | 19 | 4.9% |
| 15 to 19 Minutes | 32 | 8.3% |
| 20 to 24 Minutes | 48 | 12.4% |
| 25 to 29 Minutes | 96 | 24.9% |
| 30 to 34 Minutes | 68 | 17.6% |
| 35 to 39 Minutes | 28 | 7.2% |
| 40 to 44 Minutes | 37 | 9.6% |
| 45 to 59 Minutes | 10 | 2.6% |
| 60 to 89 Minutes | 24 | 6.2% |
| 90 or more Minutes | 19 | 4.9% |
Commute Time by Sex in Lakes of the North
The most common commute times in Lakes of the North are 30 to 34 minutes (43 commuters, 20.7%) for males and 25 to 29 minutes (96 commuters, 53.9%) for females.
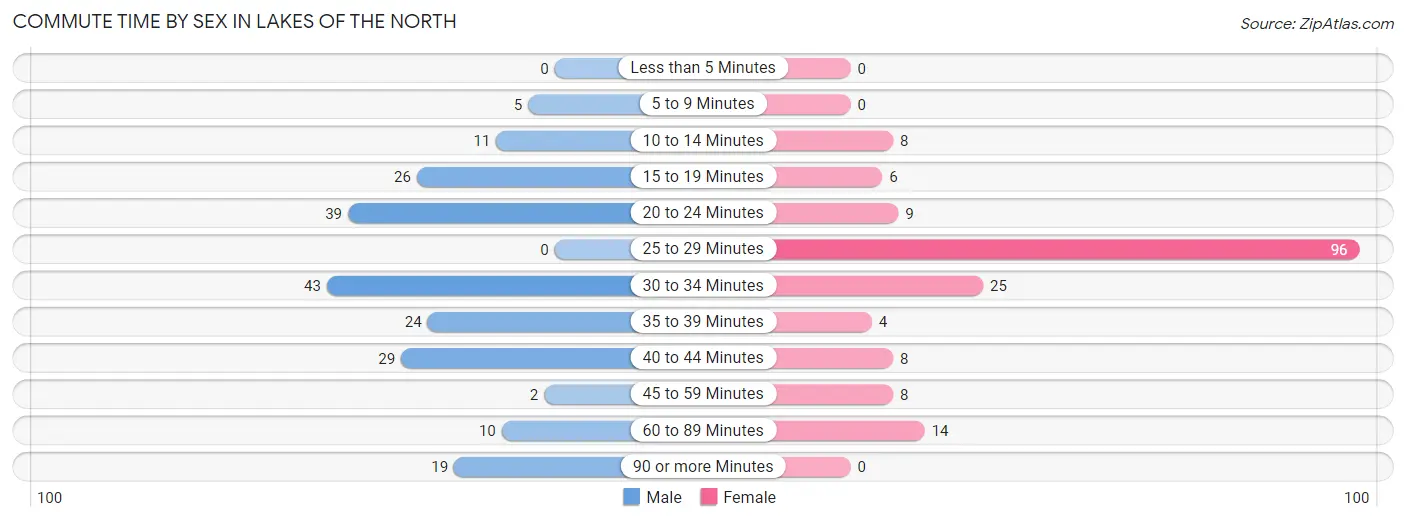
| Commute Time | Male | Female |
| Less than 5 Minutes | 0 (0.0%) | 0 (0.0%) |
| 5 to 9 Minutes | 5 (2.4%) | 0 (0.0%) |
| 10 to 14 Minutes | 11 (5.3%) | 8 (4.5%) |
| 15 to 19 Minutes | 26 (12.5%) | 6 (3.4%) |
| 20 to 24 Minutes | 39 (18.8%) | 9 (5.1%) |
| 25 to 29 Minutes | 0 (0.0%) | 96 (53.9%) |
| 30 to 34 Minutes | 43 (20.7%) | 25 (14.0%) |
| 35 to 39 Minutes | 24 (11.5%) | 4 (2.2%) |
| 40 to 44 Minutes | 29 (13.9%) | 8 (4.5%) |
| 45 to 59 Minutes | 2 (1.0%) | 8 (4.5%) |
| 60 to 89 Minutes | 10 (4.8%) | 14 (7.9%) |
| 90 or more Minutes | 19 (9.1%) | 0 (0.0%) |
Time of Departure to Work by Sex in Lakes of the North
The most frequent times of departure to work in Lakes of the North are 5:00 AM to 5:29 AM (44, 21.1%) for males and 12:00 PM to 3:59 PM (41, 23.0%) for females.
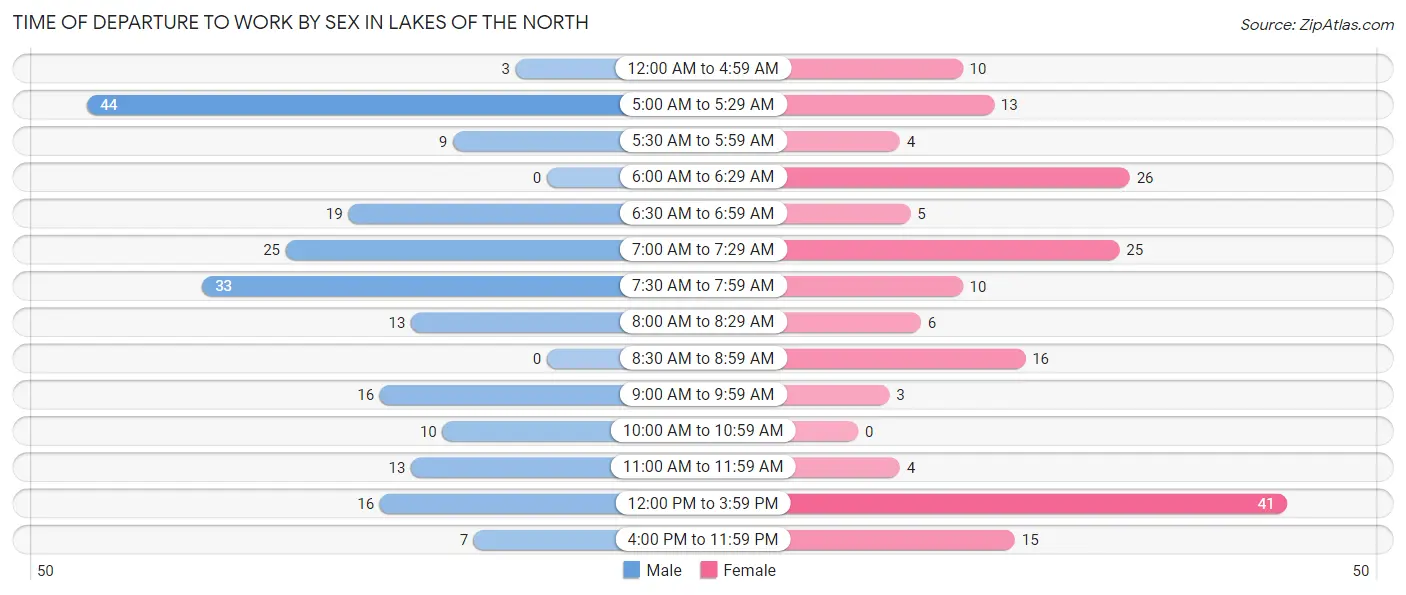
| Time of Departure | Male | Female |
| 12:00 AM to 4:59 AM | 3 (1.4%) | 10 (5.6%) |
| 5:00 AM to 5:29 AM | 44 (21.1%) | 13 (7.3%) |
| 5:30 AM to 5:59 AM | 9 (4.3%) | 4 (2.2%) |
| 6:00 AM to 6:29 AM | 0 (0.0%) | 26 (14.6%) |
| 6:30 AM to 6:59 AM | 19 (9.1%) | 5 (2.8%) |
| 7:00 AM to 7:29 AM | 25 (12.0%) | 25 (14.0%) |
| 7:30 AM to 7:59 AM | 33 (15.9%) | 10 (5.6%) |
| 8:00 AM to 8:29 AM | 13 (6.2%) | 6 (3.4%) |
| 8:30 AM to 8:59 AM | 0 (0.0%) | 16 (9.0%) |
| 9:00 AM to 9:59 AM | 16 (7.7%) | 3 (1.7%) |
| 10:00 AM to 10:59 AM | 10 (4.8%) | 0 (0.0%) |
| 11:00 AM to 11:59 AM | 13 (6.2%) | 4 (2.2%) |
| 12:00 PM to 3:59 PM | 16 (7.7%) | 41 (23.0%) |
| 4:00 PM to 11:59 PM | 7 (3.4%) | 15 (8.4%) |
| Total | 208 (100.0%) | 178 (100.0%) |
Housing Occupancy in Lakes of the North
Occupancy by Ownership in Lakes of the North
Of the total 506 dwellings in Lakes of the North, owner-occupied units account for 460 (90.9%), while renter-occupied units make up 46 (9.1%).
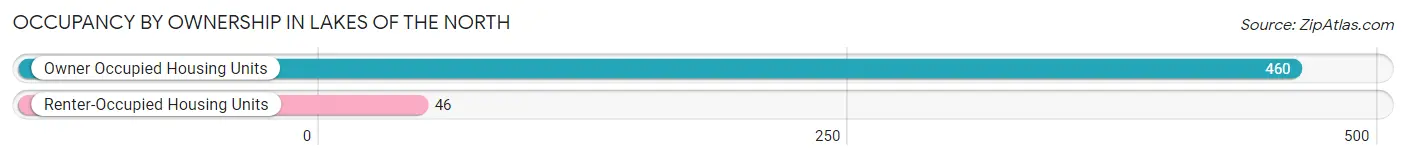
| Occupancy | # Housing Units | % Housing Units |
| Owner Occupied Housing Units | 460 | 90.9% |
| Renter-Occupied Housing Units | 46 | 9.1% |
| Total Occupied Housing Units | 506 | 100.0% |
Occupancy by Household Size in Lakes of the North
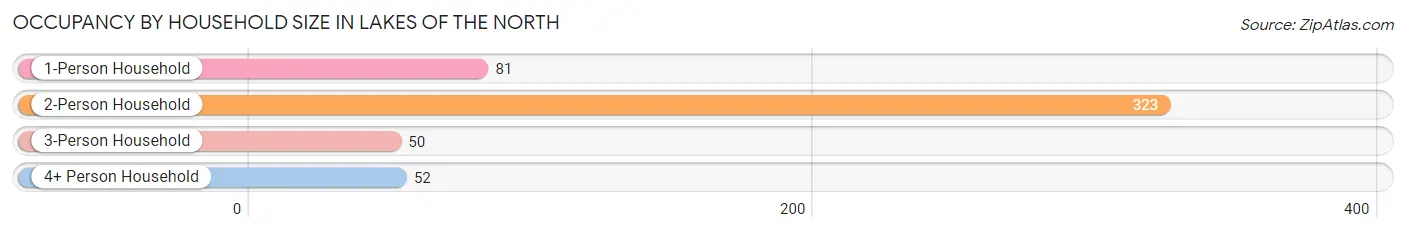
| Household Size | # Housing Units | % Housing Units |
| 1-Person Household | 81 | 16.0% |
| 2-Person Household | 323 | 63.8% |
| 3-Person Household | 50 | 9.9% |
| 4+ Person Household | 52 | 10.3% |
| Total Housing Units | 506 | 100.0% |
Occupancy by Ownership by Household Size in Lakes of the North
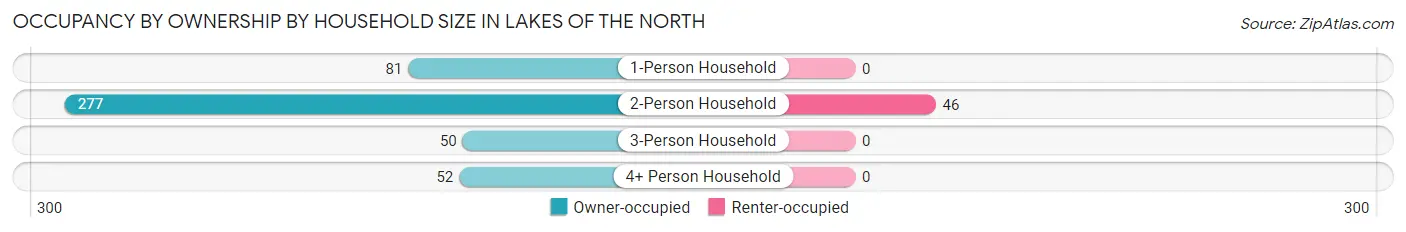
| Household Size | Owner-occupied | Renter-occupied |
| 1-Person Household | 81 (100.0%) | 0 (0.0%) |
| 2-Person Household | 277 (85.8%) | 46 (14.2%) |
| 3-Person Household | 50 (100.0%) | 0 (0.0%) |
| 4+ Person Household | 52 (100.0%) | 0 (0.0%) |
| Total Housing Units | 460 (90.9%) | 46 (9.1%) |
Occupancy by Educational Attainment in Lakes of the North
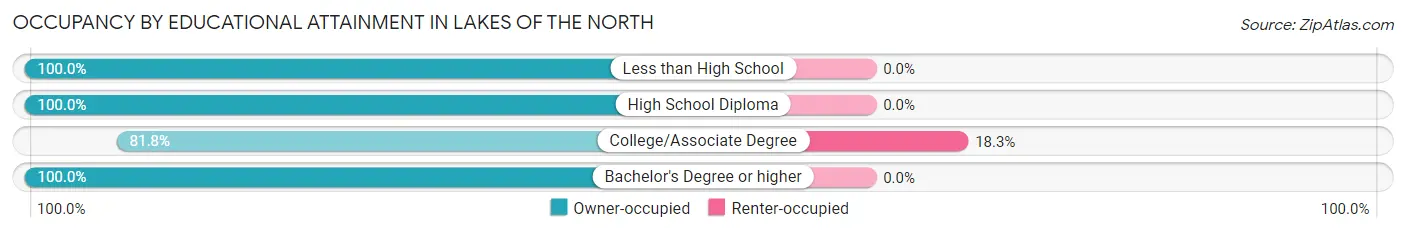
| Household Size | Owner-occupied | Renter-occupied |
| Less than High School | 5 (100.0%) | 0 (0.0%) |
| High School Diploma | 151 (100.0%) | 0 (0.0%) |
| College/Associate Degree | 206 (81.8%) | 46 (18.2%) |
| Bachelor's Degree or higher | 98 (100.0%) | 0 (0.0%) |
Occupancy by Age of Householder in Lakes of the North
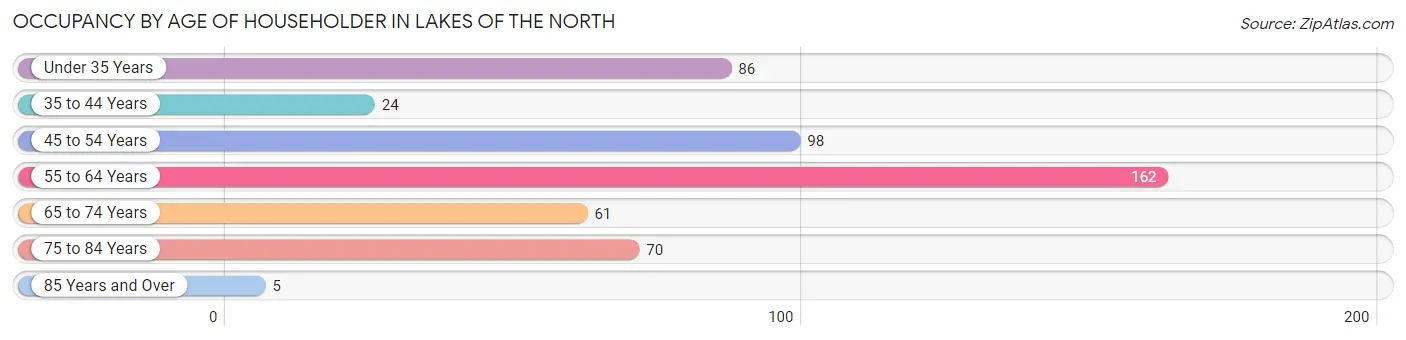
| Age Bracket | # Households | % Households |
| Under 35 Years | 86 | 17.0% |
| 35 to 44 Years | 24 | 4.7% |
| 45 to 54 Years | 98 | 19.4% |
| 55 to 64 Years | 162 | 32.0% |
| 65 to 74 Years | 61 | 12.1% |
| 75 to 84 Years | 70 | 13.8% |
| 85 Years and Over | 5 | 1.0% |
| Total | 506 | 100.0% |
Housing Finances in Lakes of the North
Median Income by Occupancy in Lakes of the North
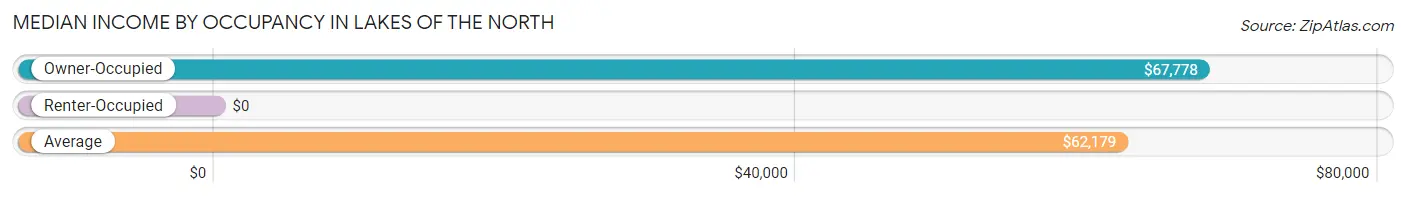
| Occupancy Type | # Households | Median Income |
| Owner-Occupied | 460 (90.9%) | $67,778 |
| Renter-Occupied | 46 (9.1%) | $0 |
| Average | 506 (100.0%) | $62,179 |
Occupancy by Householder Income Bracket in Lakes of the North
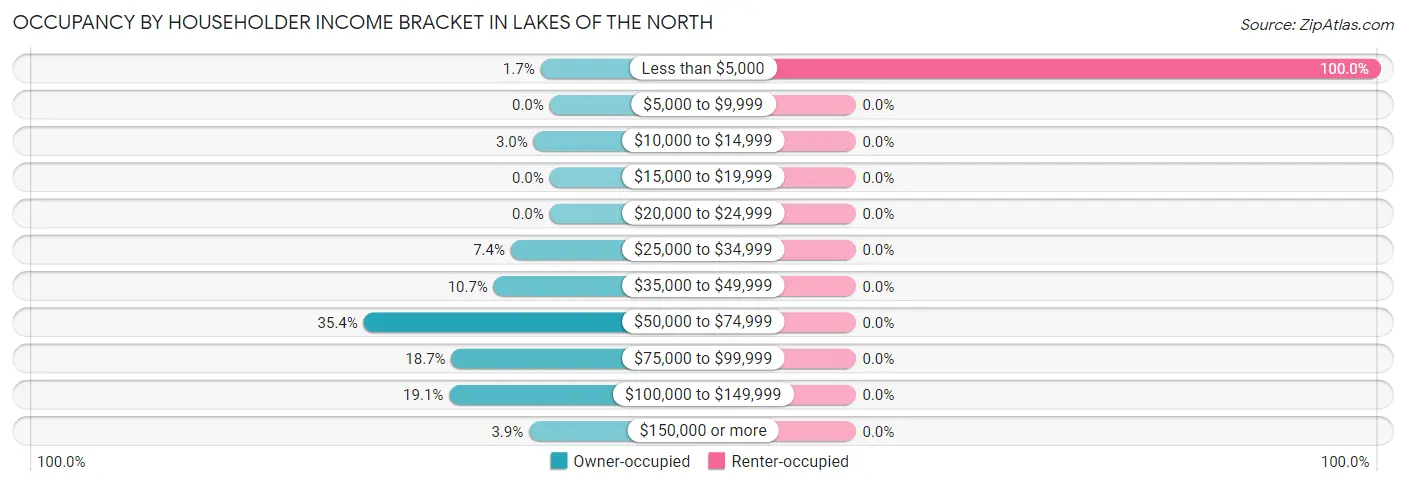
| Income Bracket | Owner-occupied | Renter-occupied |
| Less than $5,000 | 8 (1.7%) | 46 (100.0%) |
| $5,000 to $9,999 | 0 (0.0%) | 0 (0.0%) |
| $10,000 to $14,999 | 14 (3.0%) | 0 (0.0%) |
| $15,000 to $19,999 | 0 (0.0%) | 0 (0.0%) |
| $20,000 to $24,999 | 0 (0.0%) | 0 (0.0%) |
| $25,000 to $34,999 | 34 (7.4%) | 0 (0.0%) |
| $35,000 to $49,999 | 49 (10.6%) | 0 (0.0%) |
| $50,000 to $74,999 | 163 (35.4%) | 0 (0.0%) |
| $75,000 to $99,999 | 86 (18.7%) | 0 (0.0%) |
| $100,000 to $149,999 | 88 (19.1%) | 0 (0.0%) |
| $150,000 or more | 18 (3.9%) | 0 (0.0%) |
| Total | 460 (100.0%) | 46 (100.0%) |
Monthly Housing Cost Tiers in Lakes of the North
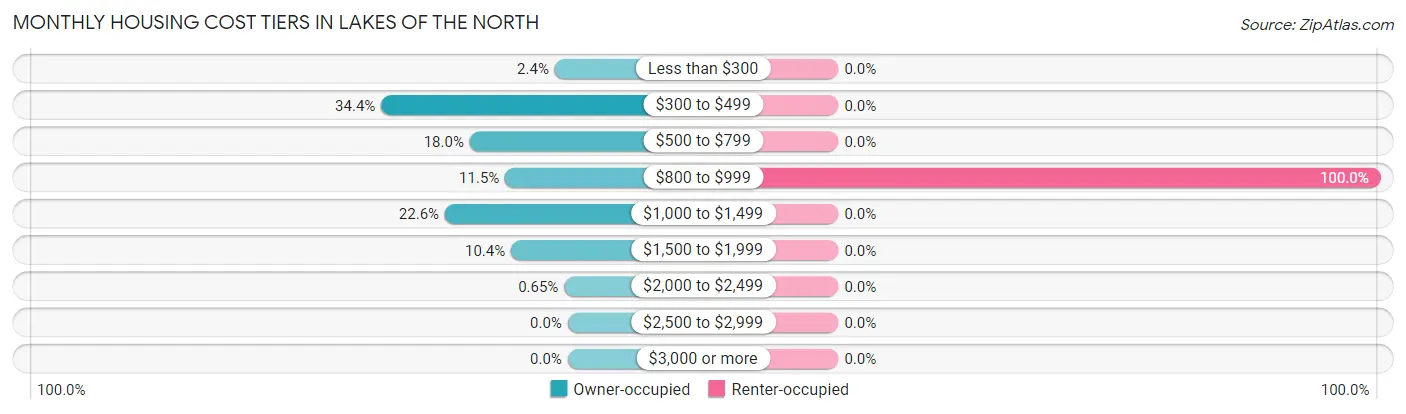
| Monthly Cost | Owner-occupied | Renter-occupied |
| Less than $300 | 11 (2.4%) | 0 (0.0%) |
| $300 to $499 | 158 (34.4%) | 0 (0.0%) |
| $500 to $799 | 83 (18.0%) | 0 (0.0%) |
| $800 to $999 | 53 (11.5%) | 46 (100.0%) |
| $1,000 to $1,499 | 104 (22.6%) | 0 (0.0%) |
| $1,500 to $1,999 | 48 (10.4%) | 0 (0.0%) |
| $2,000 to $2,499 | 3 (0.6%) | 0 (0.0%) |
| $2,500 to $2,999 | 0 (0.0%) | 0 (0.0%) |
| $3,000 or more | 0 (0.0%) | 0 (0.0%) |
| Total | 460 (100.0%) | 46 (100.0%) |
Physical Housing Characteristics in Lakes of the North
Housing Structures in Lakes of the North
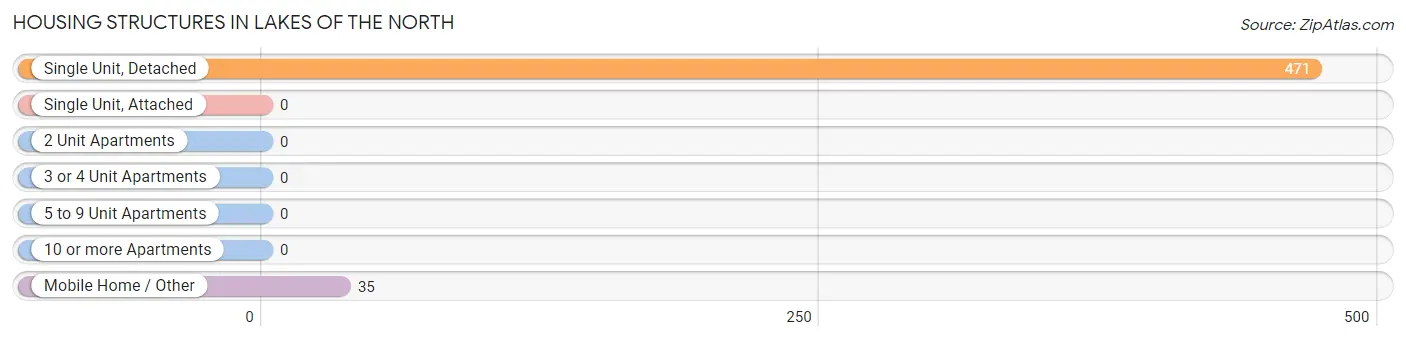
| Structure Type | # Housing Units | % Housing Units |
| Single Unit, Detached | 471 | 93.1% |
| Single Unit, Attached | 0 | 0.0% |
| 2 Unit Apartments | 0 | 0.0% |
| 3 or 4 Unit Apartments | 0 | 0.0% |
| 5 to 9 Unit Apartments | 0 | 0.0% |
| 10 or more Apartments | 0 | 0.0% |
| Mobile Home / Other | 35 | 6.9% |
| Total | 506 | 100.0% |
Housing Structures by Occupancy in Lakes of the North
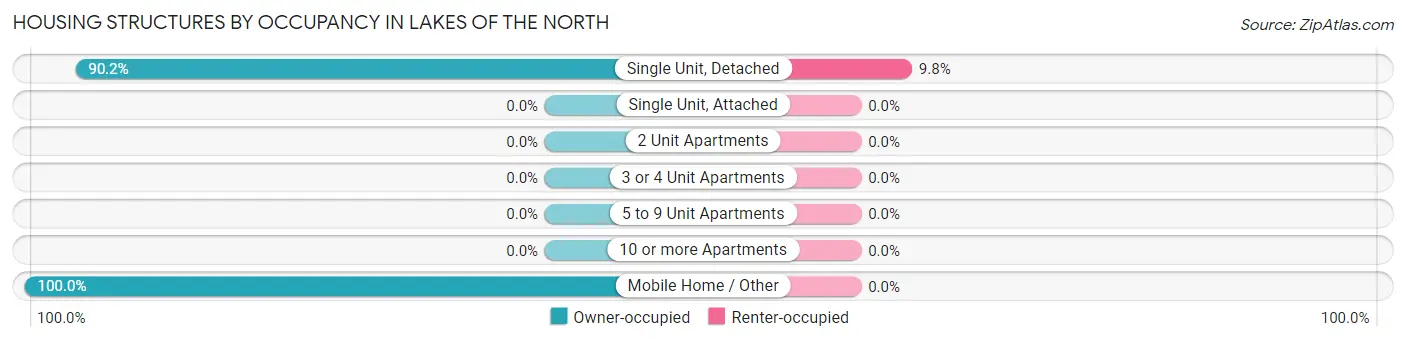
| Structure Type | Owner-occupied | Renter-occupied |
| Single Unit, Detached | 425 (90.2%) | 46 (9.8%) |
| Single Unit, Attached | 0 (0.0%) | 0 (0.0%) |
| 2 Unit Apartments | 0 (0.0%) | 0 (0.0%) |
| 3 or 4 Unit Apartments | 0 (0.0%) | 0 (0.0%) |
| 5 to 9 Unit Apartments | 0 (0.0%) | 0 (0.0%) |
| 10 or more Apartments | 0 (0.0%) | 0 (0.0%) |
| Mobile Home / Other | 35 (100.0%) | 0 (0.0%) |
| Total | 460 (90.9%) | 46 (9.1%) |
Housing Structures by Number of Rooms in Lakes of the North
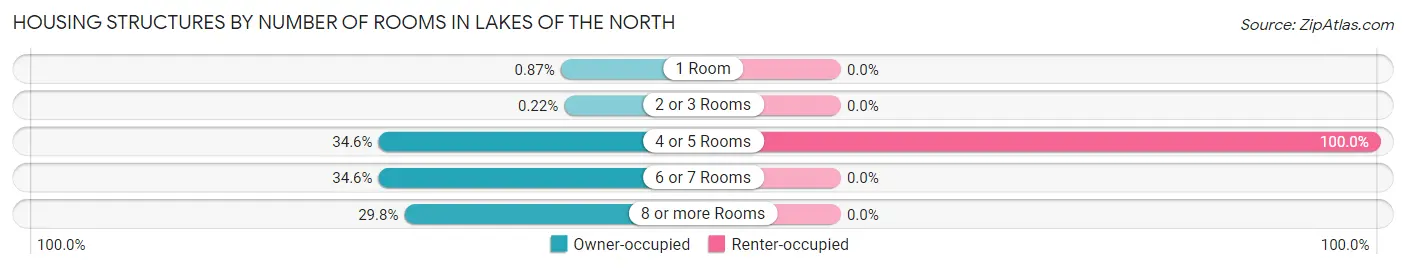
| Number of Rooms | Owner-occupied | Renter-occupied |
| 1 Room | 4 (0.9%) | 0 (0.0%) |
| 2 or 3 Rooms | 1 (0.2%) | 0 (0.0%) |
| 4 or 5 Rooms | 159 (34.6%) | 46 (100.0%) |
| 6 or 7 Rooms | 159 (34.6%) | 0 (0.0%) |
| 8 or more Rooms | 137 (29.8%) | 0 (0.0%) |
| Total | 460 (100.0%) | 46 (100.0%) |
Housing Structure by Heating Type in Lakes of the North
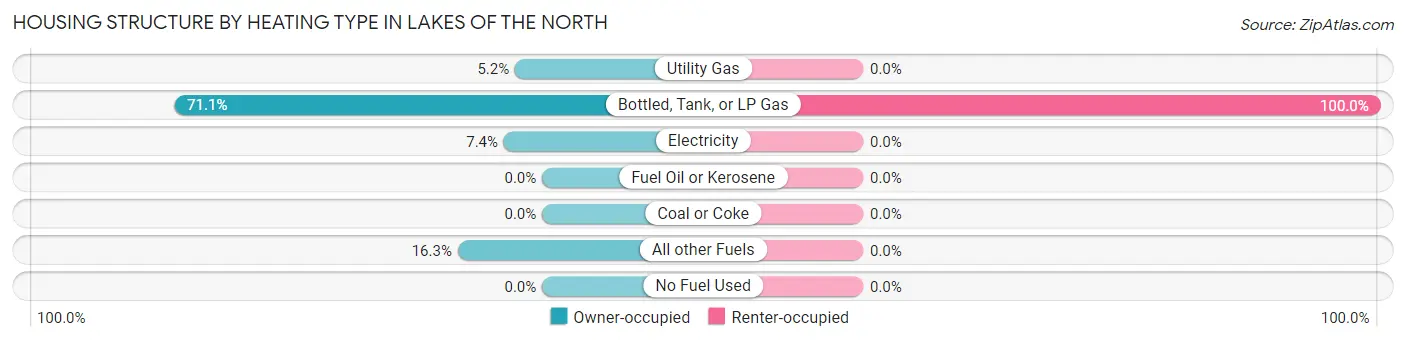
| Heating Type | Owner-occupied | Renter-occupied |
| Utility Gas | 24 (5.2%) | 0 (0.0%) |
| Bottled, Tank, or LP Gas | 327 (71.1%) | 46 (100.0%) |
| Electricity | 34 (7.4%) | 0 (0.0%) |
| Fuel Oil or Kerosene | 0 (0.0%) | 0 (0.0%) |
| Coal or Coke | 0 (0.0%) | 0 (0.0%) |
| All other Fuels | 75 (16.3%) | 0 (0.0%) |
| No Fuel Used | 0 (0.0%) | 0 (0.0%) |
| Total | 460 (100.0%) | 46 (100.0%) |
Household Vehicle Usage in Lakes of the North
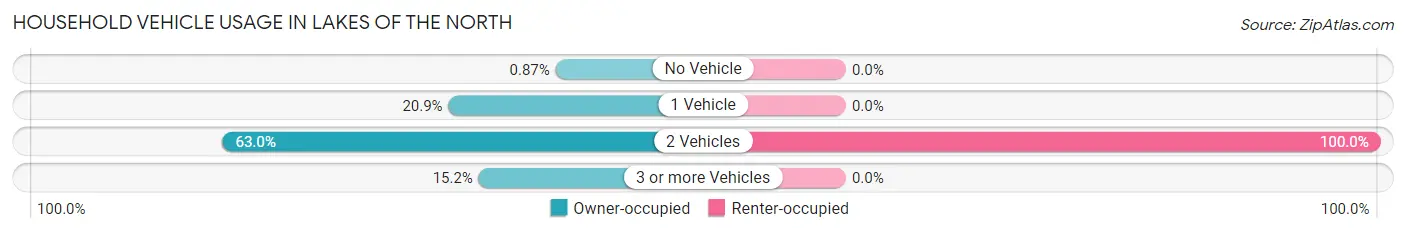
| Vehicles per Household | Owner-occupied | Renter-occupied |
| No Vehicle | 4 (0.9%) | 0 (0.0%) |
| 1 Vehicle | 96 (20.9%) | 0 (0.0%) |
| 2 Vehicles | 290 (63.0%) | 46 (100.0%) |
| 3 or more Vehicles | 70 (15.2%) | 0 (0.0%) |
| Total | 460 (100.0%) | 46 (100.0%) |
Real Estate & Mortgages in Lakes of the North
Real Estate and Mortgage Overview in Lakes of the North
| Characteristic | Without Mortgage | With Mortgage |
| Housing Units | 202 | 258 |
| Median Property Value | $142,800 | $187,000 |
| Median Household Income | $62,456 | $7 |
| Monthly Housing Costs | $385 | $0 |
| Real Estate Taxes | $1,333 | $16 |
Property Value by Mortgage Status in Lakes of the North
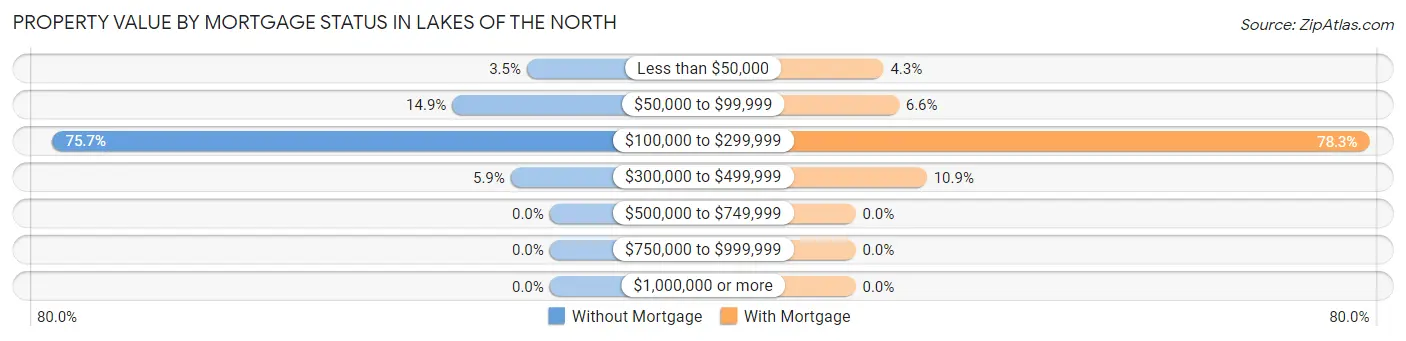
| Property Value | Without Mortgage | With Mortgage |
| Less than $50,000 | 7 (3.5%) | 11 (4.3%) |
| $50,000 to $99,999 | 30 (14.8%) | 17 (6.6%) |
| $100,000 to $299,999 | 153 (75.7%) | 202 (78.3%) |
| $300,000 to $499,999 | 12 (5.9%) | 28 (10.8%) |
| $500,000 to $749,999 | 0 (0.0%) | 0 (0.0%) |
| $750,000 to $999,999 | 0 (0.0%) | 0 (0.0%) |
| $1,000,000 or more | 0 (0.0%) | 0 (0.0%) |
| Total | 202 (100.0%) | 258 (100.0%) |
Household Income by Mortgage Status in Lakes of the North
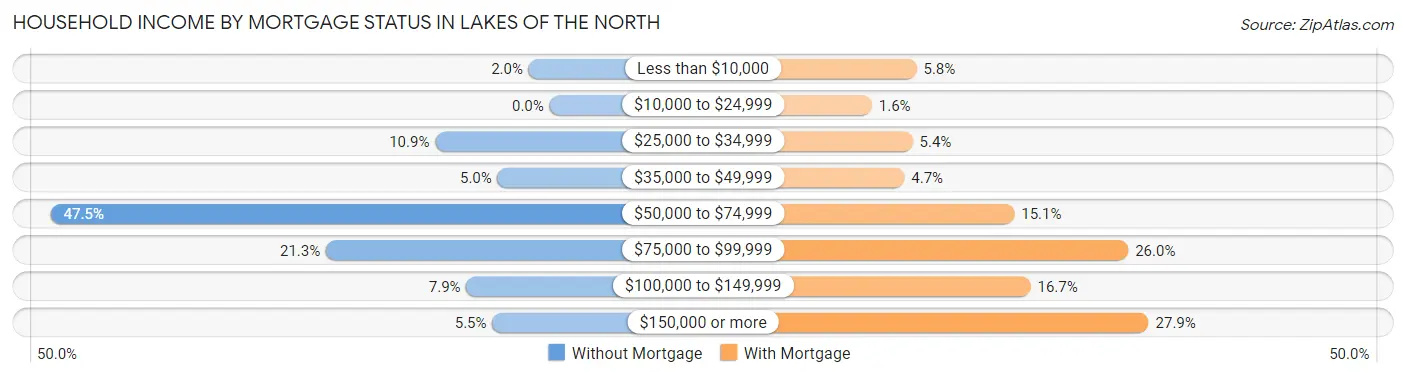
| Household Income | Without Mortgage | With Mortgage |
| Less than $10,000 | 4 (2.0%) | 15 (5.8%) |
| $10,000 to $24,999 | 0 (0.0%) | 4 (1.5%) |
| $25,000 to $34,999 | 22 (10.9%) | 14 (5.4%) |
| $35,000 to $49,999 | 10 (5.0%) | 12 (4.6%) |
| $50,000 to $74,999 | 96 (47.5%) | 39 (15.1%) |
| $75,000 to $99,999 | 43 (21.3%) | 67 (26.0%) |
| $100,000 to $149,999 | 16 (7.9%) | 43 (16.7%) |
| $150,000 or more | 11 (5.4%) | 72 (27.9%) |
| Total | 202 (100.0%) | 258 (100.0%) |
Property Value to Household Income Ratio in Lakes of the North
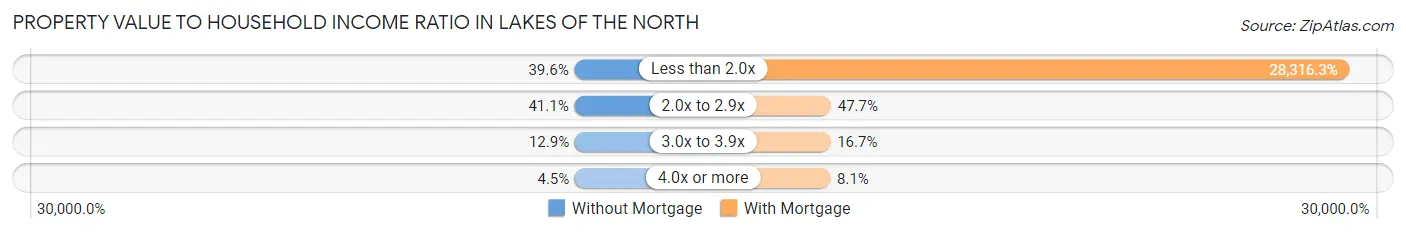
| Value-to-Income Ratio | Without Mortgage | With Mortgage |
| Less than 2.0x | 80 (39.6%) | 73,056 (28,316.3%) |
| 2.0x to 2.9x | 83 (41.1%) | 123 (47.7%) |
| 3.0x to 3.9x | 26 (12.9%) | 43 (16.7%) |
| 4.0x or more | 9 (4.5%) | 21 (8.1%) |
| Total | 202 (100.0%) | 258 (100.0%) |
Real Estate Taxes by Mortgage Status in Lakes of the North
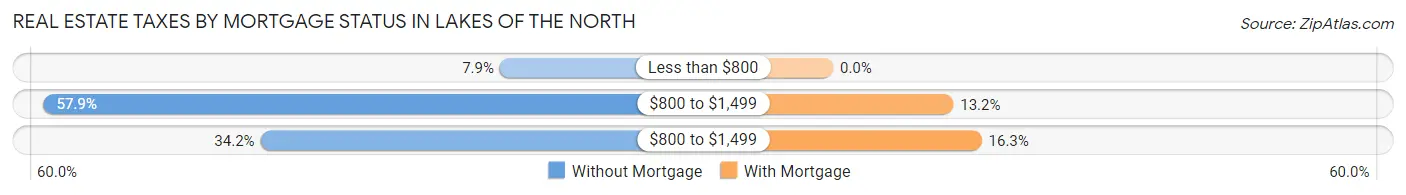
| Property Taxes | Without Mortgage | With Mortgage |
| Less than $800 | 16 (7.9%) | 0 (0.0%) |
| $800 to $1,499 | 117 (57.9%) | 34 (13.2%) |
| $800 to $1,499 | 69 (34.2%) | 42 (16.3%) |
| Total | 202 (100.0%) | 258 (100.0%) |
Health & Disability in Lakes of the North
Health Insurance Coverage by Age in Lakes of the North
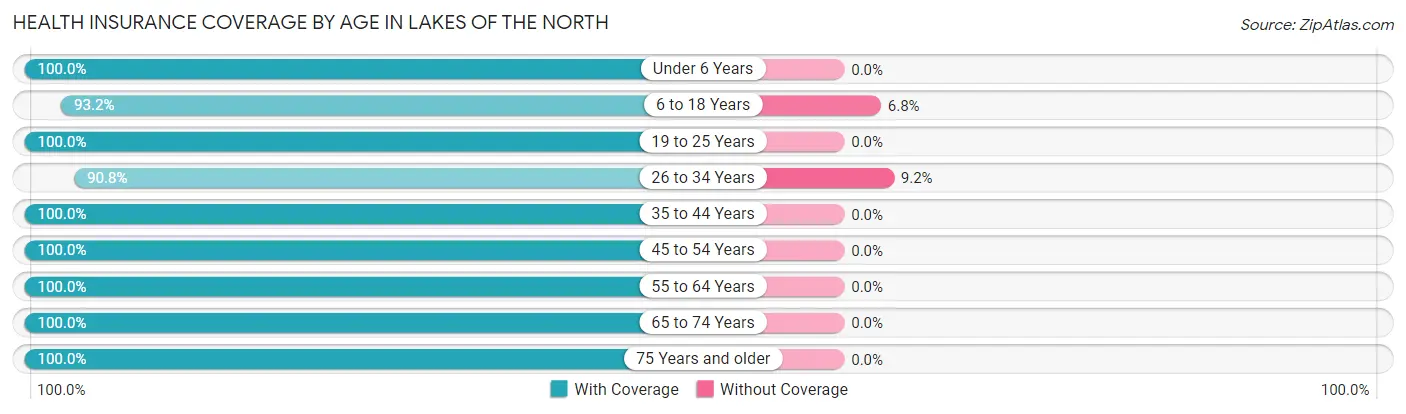
| Age Bracket | With Coverage | Without Coverage |
| Under 6 Years | 44 (100.0%) | 0 (0.0%) |
| 6 to 18 Years | 82 (93.2%) | 6 (6.8%) |
| 19 to 25 Years | 37 (100.0%) | 0 (0.0%) |
| 26 to 34 Years | 108 (90.8%) | 11 (9.2%) |
| 35 to 44 Years | 50 (100.0%) | 0 (0.0%) |
| 45 to 54 Years | 177 (100.0%) | 0 (0.0%) |
| 55 to 64 Years | 282 (100.0%) | 0 (0.0%) |
| 65 to 74 Years | 137 (100.0%) | 0 (0.0%) |
| 75 Years and older | 97 (100.0%) | 0 (0.0%) |
| Total | 1,014 (98.4%) | 17 (1.7%) |
Health Insurance Coverage by Citizenship Status in Lakes of the North
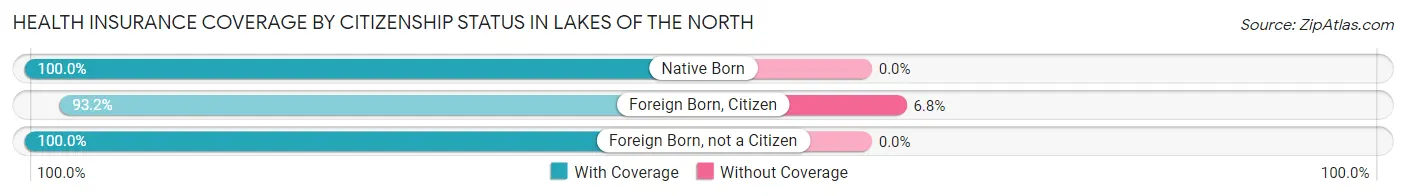
| Citizenship Status | With Coverage | Without Coverage |
| Native Born | 44 (100.0%) | 0 (0.0%) |
| Foreign Born, Citizen | 82 (93.2%) | 6 (6.8%) |
| Foreign Born, not a Citizen | 37 (100.0%) | 0 (0.0%) |
Health Insurance Coverage by Household Income in Lakes of the North
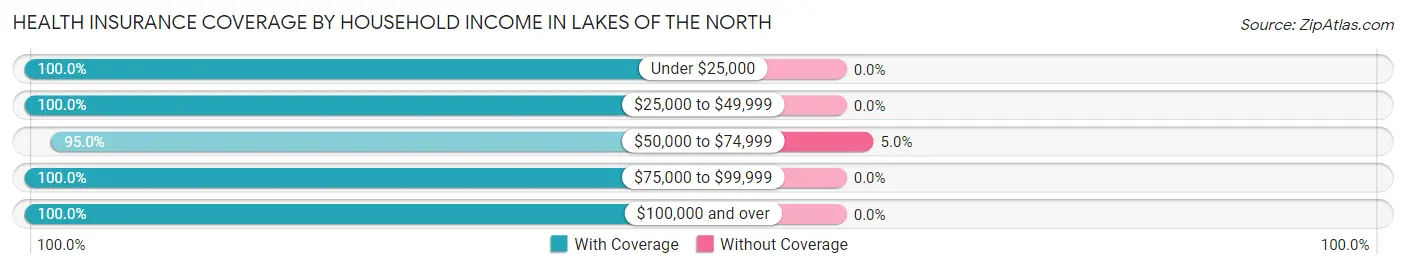
| Household Income | With Coverage | Without Coverage |
| Under $25,000 | 101 (100.0%) | 0 (0.0%) |
| $25,000 to $49,999 | 168 (100.0%) | 0 (0.0%) |
| $50,000 to $74,999 | 321 (95.0%) | 17 (5.0%) |
| $75,000 to $99,999 | 203 (100.0%) | 0 (0.0%) |
| $100,000 and over | 221 (100.0%) | 0 (0.0%) |
Public vs Private Health Insurance Coverage by Age in Lakes of the North
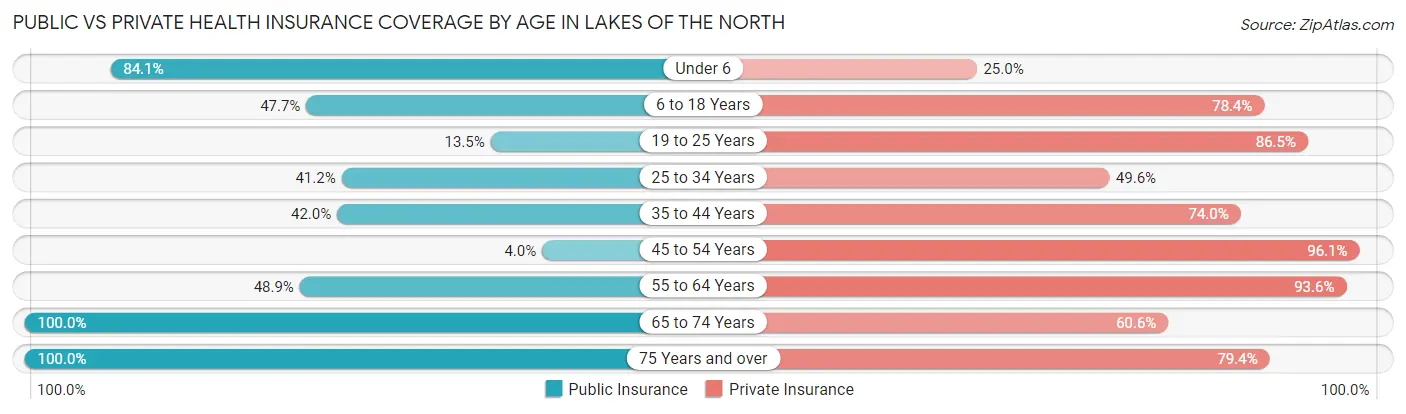
| Age Bracket | Public Insurance | Private Insurance |
| Under 6 | 37 (84.1%) | 11 (25.0%) |
| 6 to 18 Years | 42 (47.7%) | 69 (78.4%) |
| 19 to 25 Years | 5 (13.5%) | 32 (86.5%) |
| 25 to 34 Years | 49 (41.2%) | 59 (49.6%) |
| 35 to 44 Years | 21 (42.0%) | 37 (74.0%) |
| 45 to 54 Years | 7 (4.0%) | 170 (96.1%) |
| 55 to 64 Years | 138 (48.9%) | 264 (93.6%) |
| 65 to 74 Years | 137 (100.0%) | 83 (60.6%) |
| 75 Years and over | 97 (100.0%) | 77 (79.4%) |
| Total | 533 (51.7%) | 802 (77.8%) |
Disability Status by Sex by Age in Lakes of the North
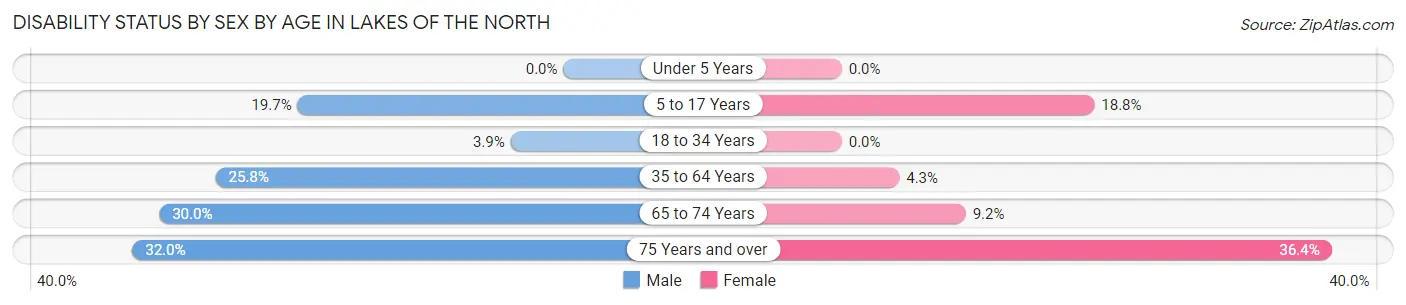
| Age Bracket | Male | Female |
| Under 5 Years | 0 (0.0%) | 0 (0.0%) |
| 5 to 17 Years | 15 (19.7%) | 3 (18.8%) |
| 18 to 34 Years | 2 (3.9%) | 0 (0.0%) |
| 35 to 64 Years | 71 (25.8%) | 10 (4.3%) |
| 65 to 74 Years | 15 (30.0%) | 8 (9.2%) |
| 75 Years and over | 24 (32.0%) | 8 (36.4%) |
Disability Class by Sex by Age in Lakes of the North
Disability Class: Hearing Difficulty
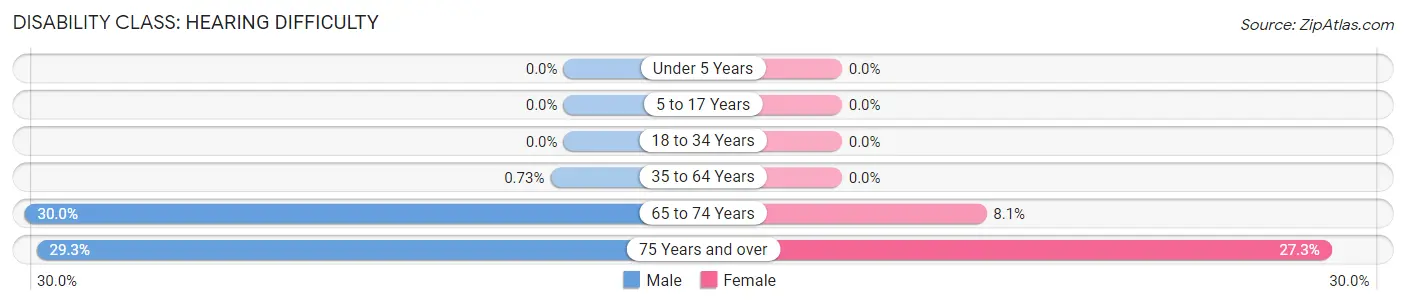
| Age Bracket | Male | Female |
| Under 5 Years | 0 (0.0%) | 0 (0.0%) |
| 5 to 17 Years | 0 (0.0%) | 0 (0.0%) |
| 18 to 34 Years | 0 (0.0%) | 0 (0.0%) |
| 35 to 64 Years | 2 (0.7%) | 0 (0.0%) |
| 65 to 74 Years | 15 (30.0%) | 7 (8.1%) |
| 75 Years and over | 22 (29.3%) | 6 (27.3%) |
Disability Class: Vision Difficulty
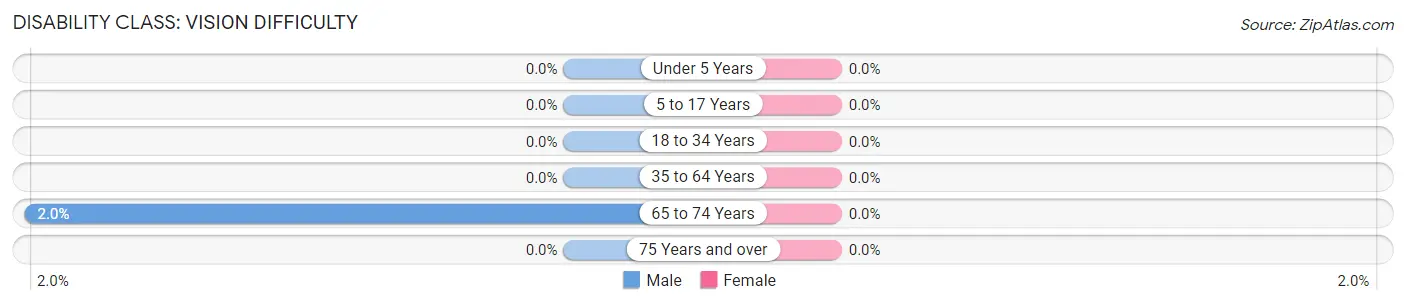
| Age Bracket | Male | Female |
| Under 5 Years | 0 (0.0%) | 0 (0.0%) |
| 5 to 17 Years | 0 (0.0%) | 0 (0.0%) |
| 18 to 34 Years | 0 (0.0%) | 0 (0.0%) |
| 35 to 64 Years | 0 (0.0%) | 0 (0.0%) |
| 65 to 74 Years | 1 (2.0%) | 0 (0.0%) |
| 75 Years and over | 0 (0.0%) | 0 (0.0%) |
Disability Class: Cognitive Difficulty
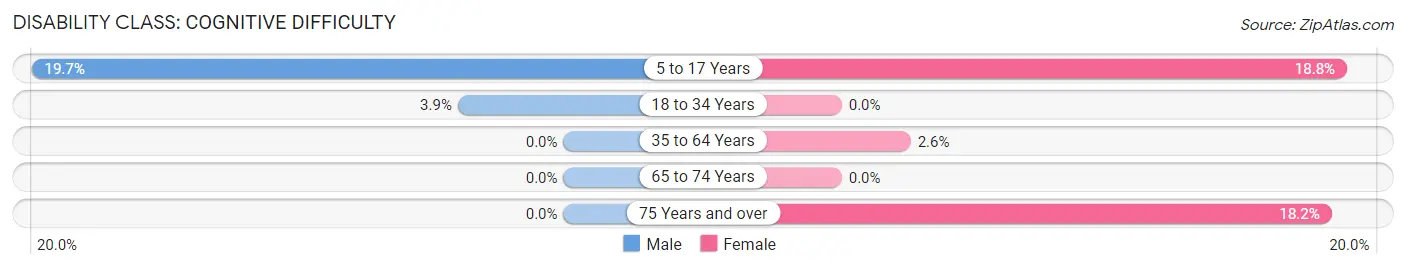
| Age Bracket | Male | Female |
| 5 to 17 Years | 15 (19.7%) | 3 (18.8%) |
| 18 to 34 Years | 2 (3.9%) | 0 (0.0%) |
| 35 to 64 Years | 0 (0.0%) | 6 (2.6%) |
| 65 to 74 Years | 0 (0.0%) | 0 (0.0%) |
| 75 Years and over | 0 (0.0%) | 4 (18.2%) |
Disability Class: Ambulatory Difficulty
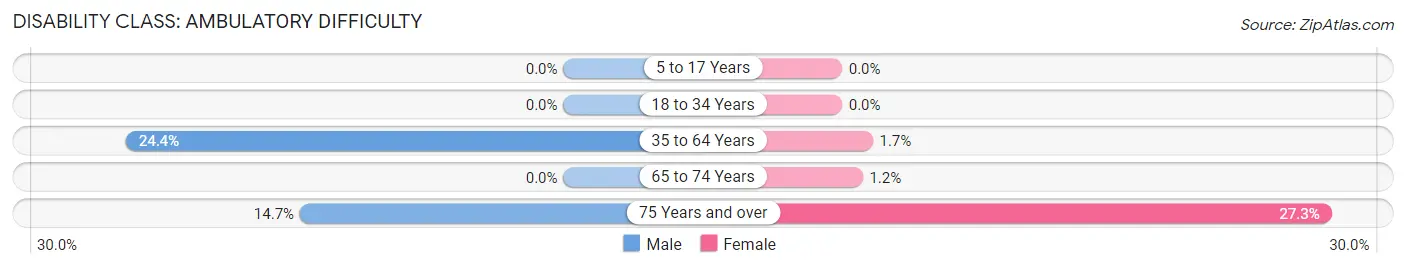
| Age Bracket | Male | Female |
| 5 to 17 Years | 0 (0.0%) | 0 (0.0%) |
| 18 to 34 Years | 0 (0.0%) | 0 (0.0%) |
| 35 to 64 Years | 67 (24.4%) | 4 (1.7%) |
| 65 to 74 Years | 0 (0.0%) | 1 (1.1%) |
| 75 Years and over | 11 (14.7%) | 6 (27.3%) |
Disability Class: Self-Care Difficulty
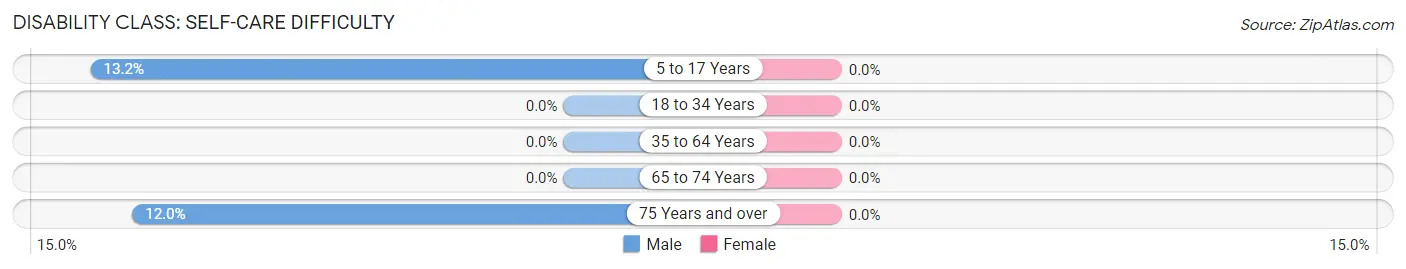
| Age Bracket | Male | Female |
| 5 to 17 Years | 10 (13.2%) | 0 (0.0%) |
| 18 to 34 Years | 0 (0.0%) | 0 (0.0%) |
| 35 to 64 Years | 0 (0.0%) | 0 (0.0%) |
| 65 to 74 Years | 0 (0.0%) | 0 (0.0%) |
| 75 Years and over | 9 (12.0%) | 0 (0.0%) |
Technology Access in Lakes of the North
Computing Device Access in Lakes of the North
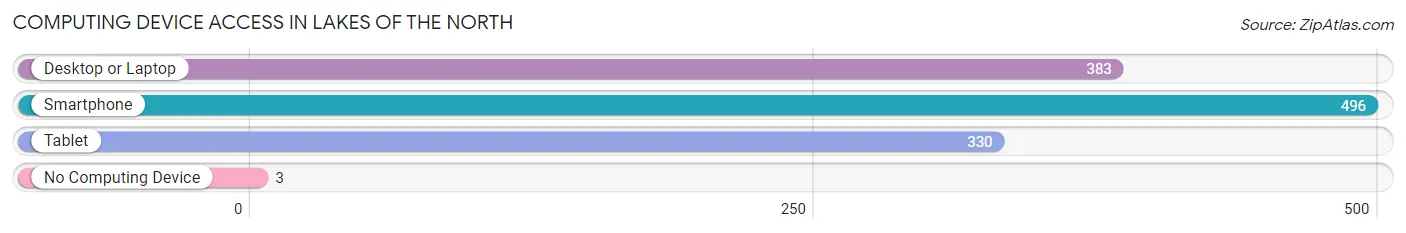
| Device Type | # Households | % Households |
| Desktop or Laptop | 383 | 75.7% |
| Smartphone | 496 | 98.0% |
| Tablet | 330 | 65.2% |
| No Computing Device | 3 | 0.6% |
| Total | 506 | 100.0% |
Internet Access in Lakes of the North
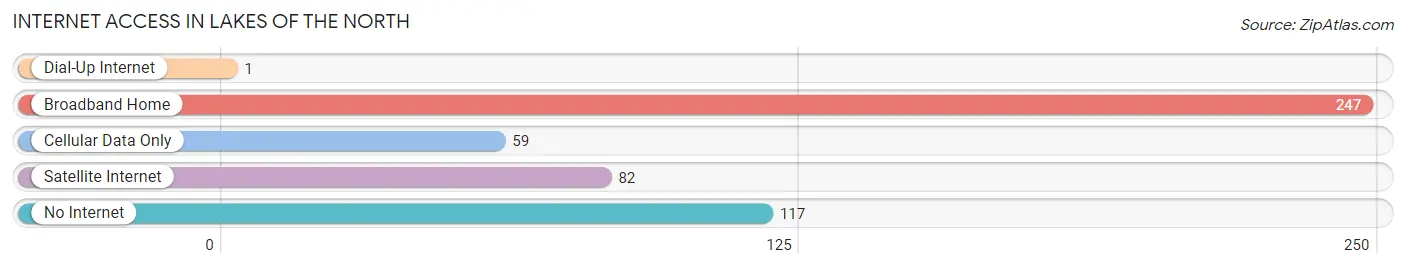
| Internet Type | # Households | % Households |
| Dial-Up Internet | 1 | 0.2% |
| Broadband Home | 247 | 48.8% |
| Cellular Data Only | 59 | 11.7% |
| Satellite Internet | 82 | 16.2% |
| No Internet | 117 | 23.1% |
| Total | 506 | 100.0% |
Lakes of the North Summary
Lakes of the North is a census-designated place (CDP) located in Antrim County, Michigan. It is situated in the northwest corner of the state, near the border with Wisconsin. The CDP is located within the larger township of Mancelona, and is home to a population of approximately 1,000 people.
Geography
Lakes of the North is located in the northwest corner of Michigan, near the border with Wisconsin. It is situated in Antrim County, within the larger township of Mancelona. The CDP is located in a rural area, surrounded by forests and lakes. The terrain is mostly flat, with some rolling hills. The area is known for its abundance of lakes, including Torch Lake, Lake Bellaire, and Clam Lake.
The climate in Lakes of the North is classified as humid continental, with warm summers and cold winters. The average annual temperature is around 45°F (7°C). The average annual precipitation is around 30 inches (76 cm).
History
The area now known as Lakes of the North was first settled in the late 19th century. The first settlers were mostly farmers and loggers, who were attracted to the area by its abundance of natural resources. The area was officially established as a CDP in 2000.
Economy
The economy of Lakes of the North is largely based on tourism and recreation. The area is known for its abundance of lakes, which attract visitors from all over the country. The area is also home to several resorts, campgrounds, and other recreational facilities.
In addition to tourism, the area is also home to several small businesses, including restaurants, retail stores, and service providers. The area is also home to several manufacturing companies, which produce a variety of products, including furniture, automotive parts, and electronics.
Demographics
As of the 2010 census, the population of Lakes of the North was 1,000. The racial makeup of the CDP was 97.2% White, 0.7% African American, 0.3% Native American, 0.2% Asian, 0.1% Pacific Islander, and 1.5% from other races. The median household income was $41,250, and the median family income was $50,000.
Conclusion
Lakes of the North is a census-designated place located in Antrim County, Michigan. It is situated in the northwest corner of the state, near the border with Wisconsin. The CDP is home to a population of approximately 1,000 people, and is known for its abundance of lakes and recreational opportunities. The economy of the area is largely based on tourism and recreation, as well as small businesses and manufacturing. The population of the CDP is predominantly White, with a median household income of $41,250.
Common Questions
What is Per Capita Income in Lakes of the North?
Per Capita income in Lakes of the North is $33,074.
What is the Median Family Income in Lakes of the North?
Median Family Income in Lakes of the North is $63,438.
What is the Median Household income in Lakes of the North?
Median Household Income in Lakes of the North is $62,179.
What is Income or Wage Gap in Lakes of the North?
Income or Wage Gap in Lakes of the North is 27.5%.
Women in Lakes of the North earn 72.5 cents for every dollar earned by a man.
What is Inequality or Gini Index in Lakes of the North?
Inequality or Gini Index in Lakes of the North is 0.35.
What is the Total Population of Lakes of the North?
Total Population of Lakes of the North is 1,031.
What is the Total Male Population of Lakes of the North?
Total Male Population of Lakes of the North is 529.
What is the Total Female Population of Lakes of the North?
Total Female Population of Lakes of the North is 502.
What is the Ratio of Males per 100 Females in Lakes of the North?
There are 105.38 Males per 100 Females in Lakes of the North.
What is the Ratio of Females per 100 Males in Lakes of the North?
There are 94.90 Females per 100 Males in Lakes of the North.
What is the Median Population Age in Lakes of the North?
Median Population Age in Lakes of the North is 55.0 Years.
What is the Average Family Size in Lakes of the North
Average Family Size in Lakes of the North is 2.2 People.
What is the Average Household Size in Lakes of the North
Average Household Size in Lakes of the North is 2.0 People.
How Large is the Labor Force in Lakes of the North?
There are 423 People in the Labor Forcein in Lakes of the North.
What is the Percentage of People in the Labor Force in Lakes of the North?
46.6% of People are in the Labor Force in Lakes of the North.
What is the Unemployment Rate in Lakes of the North?
Unemployment Rate in Lakes of the North is 4.0%.