Boyne Falls, MI Map & Demographics
Boyne Falls Map
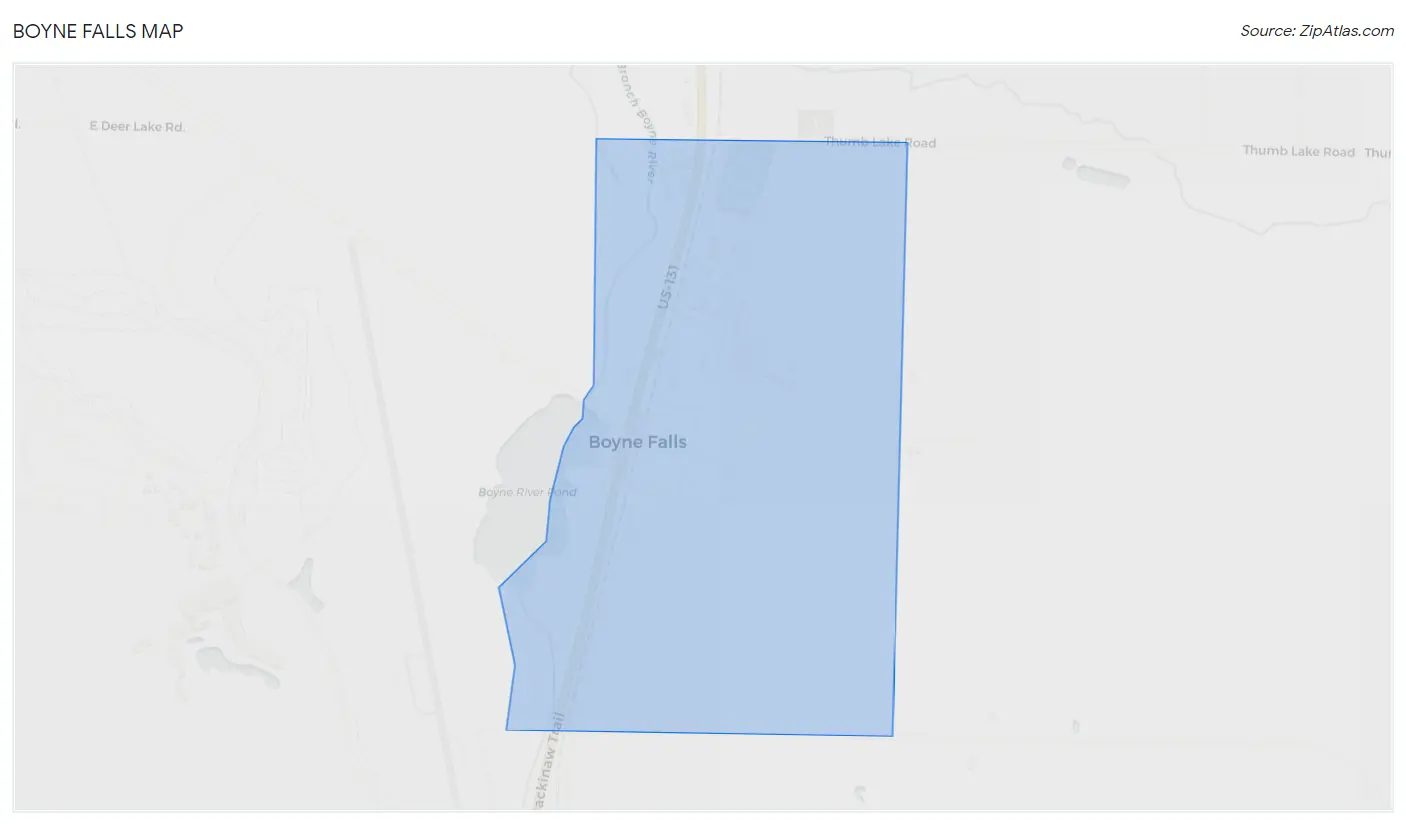
Boyne Falls Overview
$30,645
PER CAPITA INCOME
$45,625
AVG FAMILY INCOME
$50,625
AVG HOUSEHOLD INCOME
1.6%
WAGE / INCOME GAP [ % ]
98.4¢/ $1
WAGE / INCOME GAP [ $ ]
0.40
INEQUALITY / GINI INDEX
341
TOTAL POPULATION
167
MALE POPULATION
174
FEMALE POPULATION
95.98
MALES / 100 FEMALES
104.19
FEMALES / 100 MALES
46.4
MEDIAN AGE
2.6
AVG FAMILY SIZE
1.9
AVG HOUSEHOLD SIZE
159
LABOR FORCE [ PEOPLE ]
57.0%
PERCENT IN LABOR FORCE
3.8%
UNEMPLOYMENT RATE
Boyne Falls Zip Codes
Boyne Falls Area Codes
Income in Boyne Falls
Income Overview in Boyne Falls
Per Capita Income in Boyne Falls is $30,645, while median incomes of families and households are $45,625 and $50,625 respectively.
| Characteristic | Number | Measure |
| Per Capita Income | 341 | $30,645 |
| Median Family Income | 83 | $45,625 |
| Mean Family Income | 83 | $65,722 |
| Median Household Income | 176 | $50,625 |
| Mean Household Income | 176 | $66,368 |
| Income Deficit | 83 | $0 |
| Wage / Income Gap (%) | 341 | 1.60% |
| Wage / Income Gap ($) | 341 | 98.40¢ per $1 |
| Gini / Inequality Index | 341 | 0.40 |
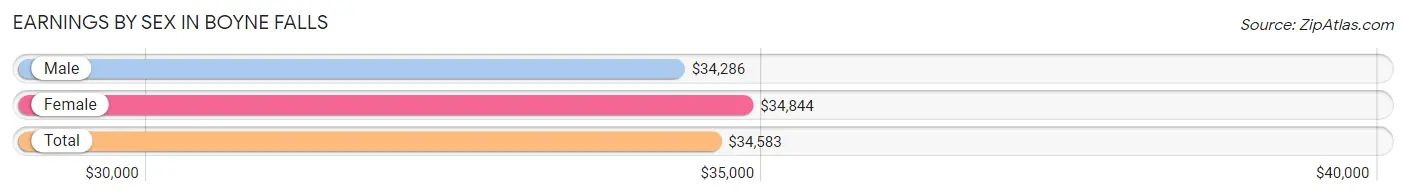
Earnings by Sex in Boyne Falls
Average Earnings in Boyne Falls are $34,583, $34,286 for men and $34,844 for women, a difference of 1.6%.
| Sex | Number | Average Earnings |
| Male | 82 (48.5%) | $34,286 |
| Female | 87 (51.5%) | $34,844 |
| Total | 169 (100.0%) | $34,583 |
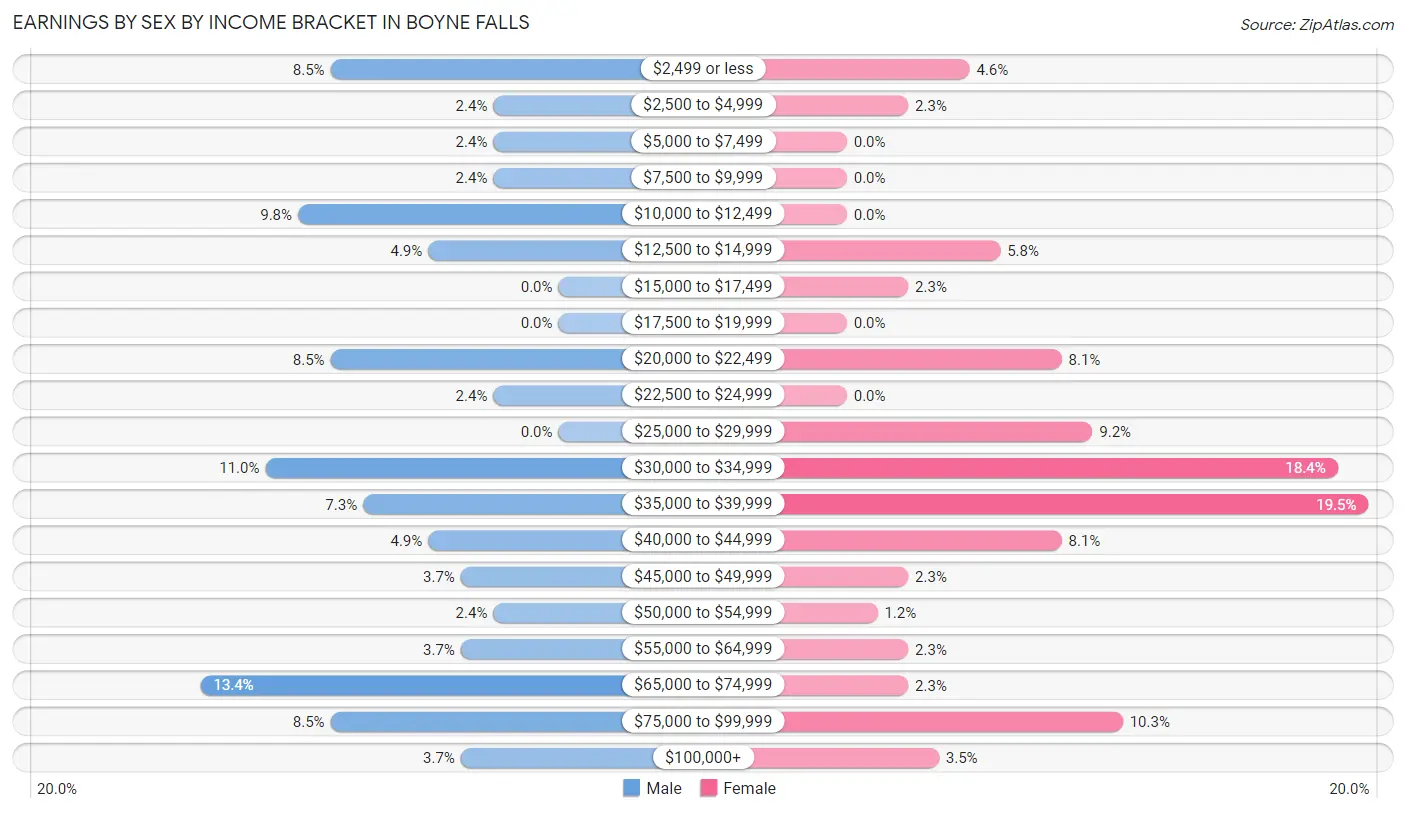
Earnings by Sex by Income Bracket in Boyne Falls
The most common earnings brackets in Boyne Falls are $65,000 to $74,999 for men (11 | 13.4%) and $35,000 to $39,999 for women (17 | 19.5%).
| Income | Male | Female |
| $2,499 or less | 7 (8.5%) | 4 (4.6%) |
| $2,500 to $4,999 | 2 (2.4%) | 2 (2.3%) |
| $5,000 to $7,499 | 2 (2.4%) | 0 (0.0%) |
| $7,500 to $9,999 | 2 (2.4%) | 0 (0.0%) |
| $10,000 to $12,499 | 8 (9.8%) | 0 (0.0%) |
| $12,500 to $14,999 | 4 (4.9%) | 5 (5.8%) |
| $15,000 to $17,499 | 0 (0.0%) | 2 (2.3%) |
| $17,500 to $19,999 | 0 (0.0%) | 0 (0.0%) |
| $20,000 to $22,499 | 7 (8.5%) | 7 (8.1%) |
| $22,500 to $24,999 | 2 (2.4%) | 0 (0.0%) |
| $25,000 to $29,999 | 0 (0.0%) | 8 (9.2%) |
| $30,000 to $34,999 | 9 (11.0%) | 16 (18.4%) |
| $35,000 to $39,999 | 6 (7.3%) | 17 (19.5%) |
| $40,000 to $44,999 | 4 (4.9%) | 7 (8.1%) |
| $45,000 to $49,999 | 3 (3.7%) | 2 (2.3%) |
| $50,000 to $54,999 | 2 (2.4%) | 1 (1.1%) |
| $55,000 to $64,999 | 3 (3.7%) | 2 (2.3%) |
| $65,000 to $74,999 | 11 (13.4%) | 2 (2.3%) |
| $75,000 to $99,999 | 7 (8.5%) | 9 (10.3%) |
| $100,000+ | 3 (3.7%) | 3 (3.5%) |
| Total | 82 (100.0%) | 87 (100.0%) |
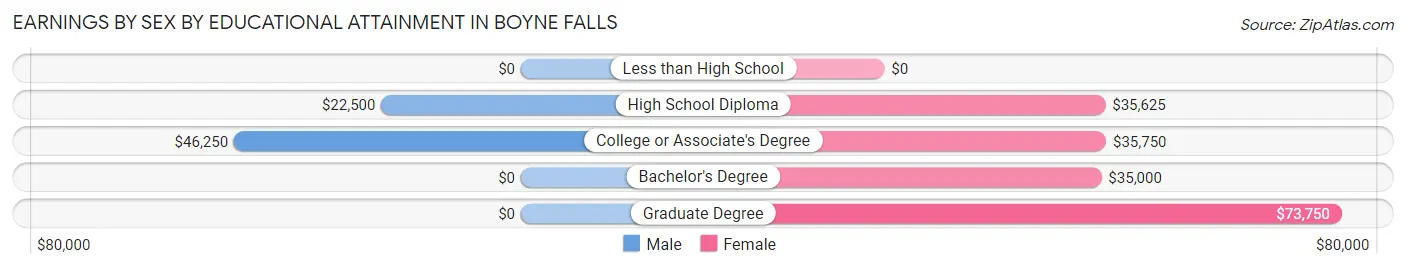
Earnings by Sex by Educational Attainment in Boyne Falls
Average earnings in Boyne Falls are $37,500 for men and $35,192 for women, a difference of 6.1%. Men with an educational attainment of college or associate's degree enjoy the highest average annual earnings of $46,250, while those with high school diploma education earn the least with $22,500. Women with an educational attainment of graduate degree earn the most with the average annual earnings of $73,750, while those with bachelor's degree education have the smallest earnings of $35,000.
| Educational Attainment | Male Income | Female Income |
| Less than High School | - | - |
| High School Diploma | $22,500 | $35,625 |
| College or Associate's Degree | $46,250 | $35,750 |
| Bachelor's Degree | - | - |
| Graduate Degree | - | - |
| Total | $37,500 | $35,192 |
Family Income in Boyne Falls
Family Income Brackets in Boyne Falls
According to the Boyne Falls family income data, there are 21 families falling into the $35,000 to $49,999 income range, which is the most common income bracket and makes up 25.3% of all families. Conversely, the $10,000 to $14,999 income bracket is the least frequent group with only 2 families (2.4%) belonging to this category.
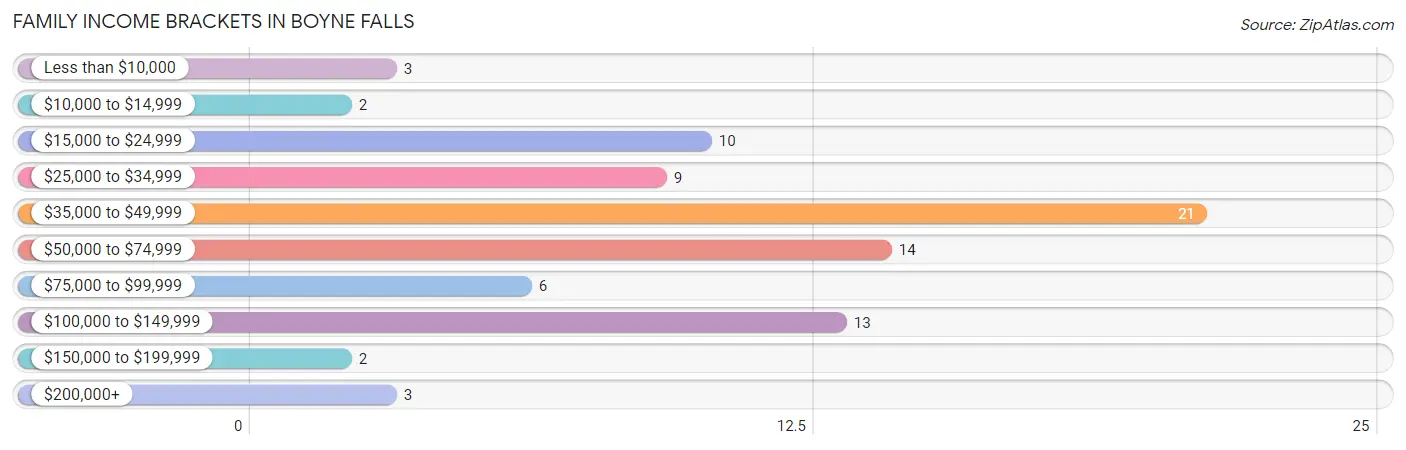
| Income Bracket | # Families | % Families |
| Less than $10,000 | 3 | 3.6% |
| $10,000 to $14,999 | 2 | 2.4% |
| $15,000 to $24,999 | 10 | 12.0% |
| $25,000 to $34,999 | 9 | 10.8% |
| $35,000 to $49,999 | 21 | 25.3% |
| $50,000 to $74,999 | 14 | 16.9% |
| $75,000 to $99,999 | 6 | 7.2% |
| $100,000 to $149,999 | 13 | 15.7% |
| $150,000 to $199,999 | 2 | 2.4% |
| $200,000+ | 3 | 3.6% |
Family Income by Famaliy Size in Boyne Falls
5-person families (7 | 8.4%) account for the highest median family income in Boyne Falls with $55,625 per family, while 2-person families (42 | 50.6%) have the highest median income of $20,625 per family member.
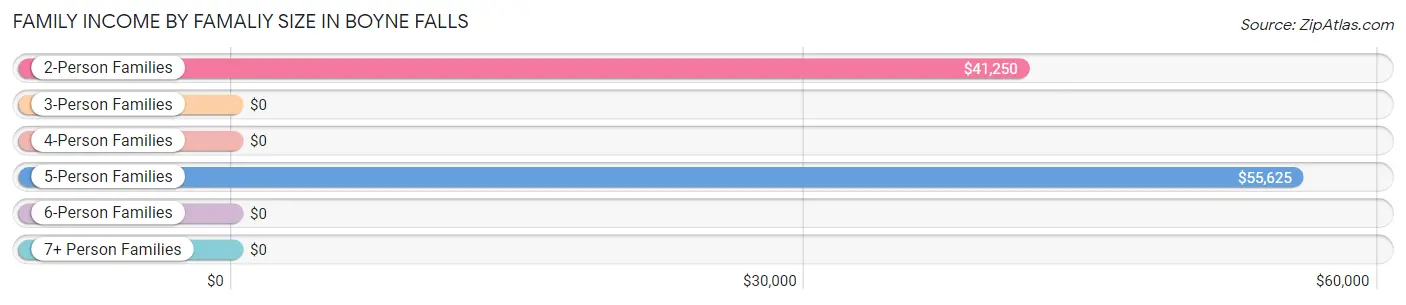
| Income Bracket | # Families | Median Income |
| 2-Person Families | 42 (50.6%) | $41,250 |
| 3-Person Families | 27 (32.5%) | $0 |
| 4-Person Families | 7 (8.4%) | $0 |
| 5-Person Families | 7 (8.4%) | $55,625 |
| 6-Person Families | 0 (0.0%) | $0 |
| 7+ Person Families | 0 (0.0%) | $0 |
| Total | 83 (100.0%) | $45,625 |
Family Income by Number of Earners in Boyne Falls
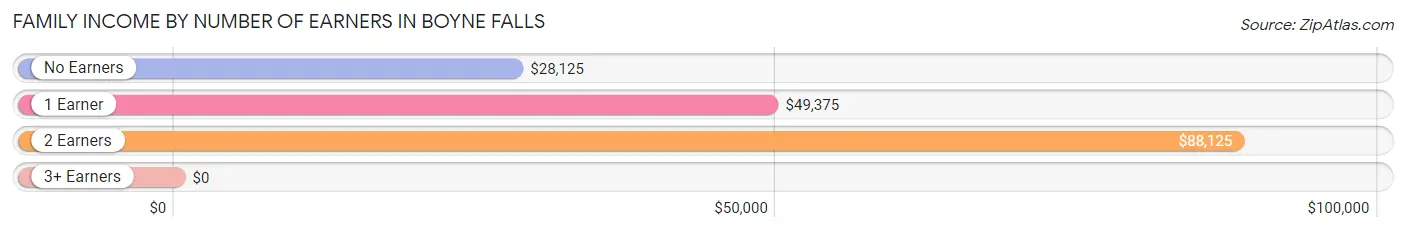
| Number of Earners | # Families | Median Income |
| No Earners | 19 (22.9%) | $28,125 |
| 1 Earner | 37 (44.6%) | $49,375 |
| 2 Earners | 25 (30.1%) | $88,125 |
| 3+ Earners | 2 (2.4%) | $0 |
| Total | 83 (100.0%) | $45,625 |
Household Income in Boyne Falls
Household Income Brackets in Boyne Falls
With 30 households falling in the category, the $50,000 to $74,999 income range is the most frequent in Boyne Falls, accounting for 17.1% of all households. In contrast, only 2 households (1.1%) fall into the $10,000 to $14,999 income bracket, making it the least populous group.
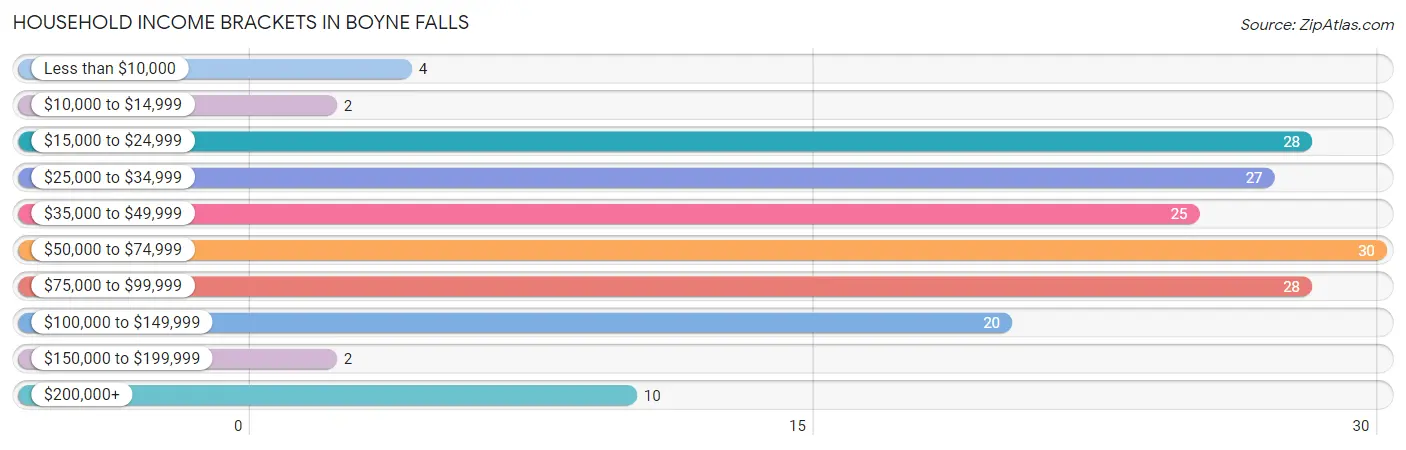
| Income Bracket | # Households | % Households |
| Less than $10,000 | 4 | 2.3% |
| $10,000 to $14,999 | 2 | 1.1% |
| $15,000 to $24,999 | 28 | 15.9% |
| $25,000 to $34,999 | 27 | 15.3% |
| $35,000 to $49,999 | 25 | 14.2% |
| $50,000 to $74,999 | 30 | 17.0% |
| $75,000 to $99,999 | 28 | 15.9% |
| $100,000 to $149,999 | 20 | 11.4% |
| $150,000 to $199,999 | 2 | 1.1% |
| $200,000+ | 10 | 5.7% |
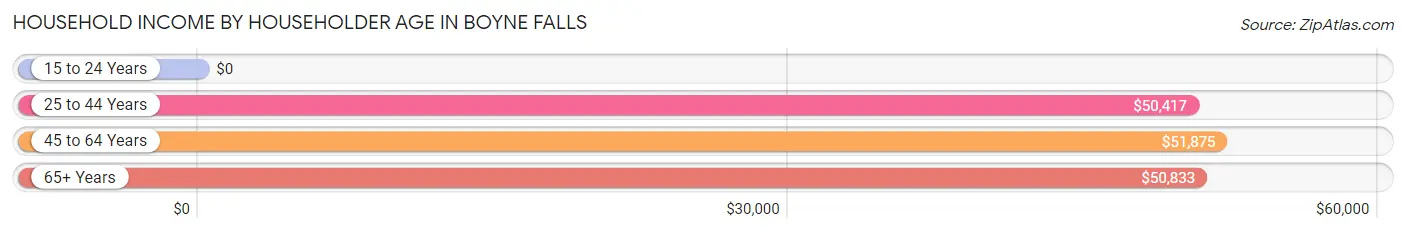
Household Income by Householder Age in Boyne Falls
The median household income in Boyne Falls is $50,625, with the highest median household income of $51,875 found in the 45 to 64 years age bracket for the primary householder. A total of 67 households (38.1%) fall into this category. Meanwhile, the 15 to 24 years age bracket for the primary householder has the lowest median household income of $0, with 2 households (1.1%) in this group.
| Income Bracket | # Households | Median Income |
| 15 to 24 Years | 2 (1.1%) | $0 |
| 25 to 44 Years | 45 (25.6%) | $50,417 |
| 45 to 64 Years | 67 (38.1%) | $51,875 |
| 65+ Years | 62 (35.2%) | $50,833 |
| Total | 176 (100.0%) | $50,625 |
Poverty in Boyne Falls
Income Below Poverty by Sex and Age in Boyne Falls
With 12.6% poverty level for males and 9.8% for females among the residents of Boyne Falls, under 5 year old males and 5 year old females are the most vulnerable to poverty, with 9 males (39.1%) and 2 females (66.7%) in their respective age groups living below the poverty level.
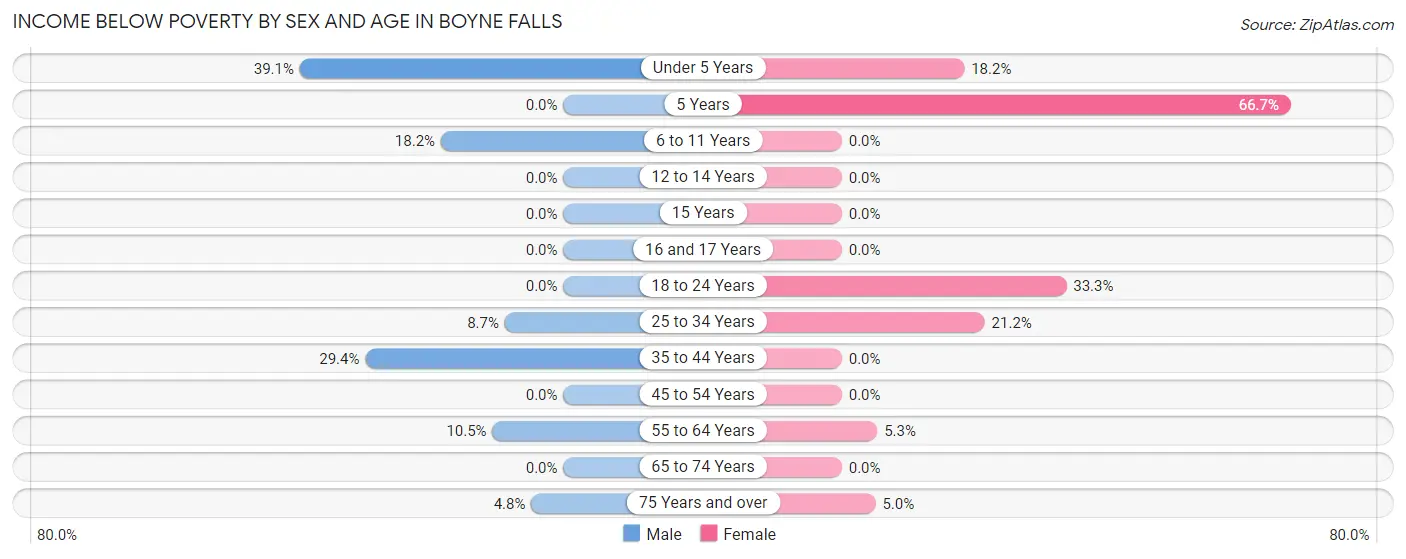
| Age Bracket | Male | Female |
| Under 5 Years | 9 (39.1%) | 2 (18.2%) |
| 5 Years | 0 (0.0%) | 2 (66.7%) |
| 6 to 11 Years | 2 (18.2%) | 0 (0.0%) |
| 12 to 14 Years | 0 (0.0%) | 0 (0.0%) |
| 15 Years | 0 (0.0%) | 0 (0.0%) |
| 16 and 17 Years | 0 (0.0%) | 0 (0.0%) |
| 18 to 24 Years | 0 (0.0%) | 3 (33.3%) |
| 25 to 34 Years | 2 (8.7%) | 7 (21.2%) |
| 35 to 44 Years | 5 (29.4%) | 0 (0.0%) |
| 45 to 54 Years | 0 (0.0%) | 0 (0.0%) |
| 55 to 64 Years | 2 (10.5%) | 2 (5.3%) |
| 65 to 74 Years | 0 (0.0%) | 0 (0.0%) |
| 75 Years and over | 1 (4.8%) | 1 (5.0%) |
| Total | 21 (12.6%) | 17 (9.8%) |
Income Above Poverty by Sex and Age in Boyne Falls
According to the poverty statistics in Boyne Falls, males aged 5 years and females aged 6 to 11 years are the age groups that are most secure financially, with 100.0% of males and 100.0% of females in these age groups living above the poverty line.
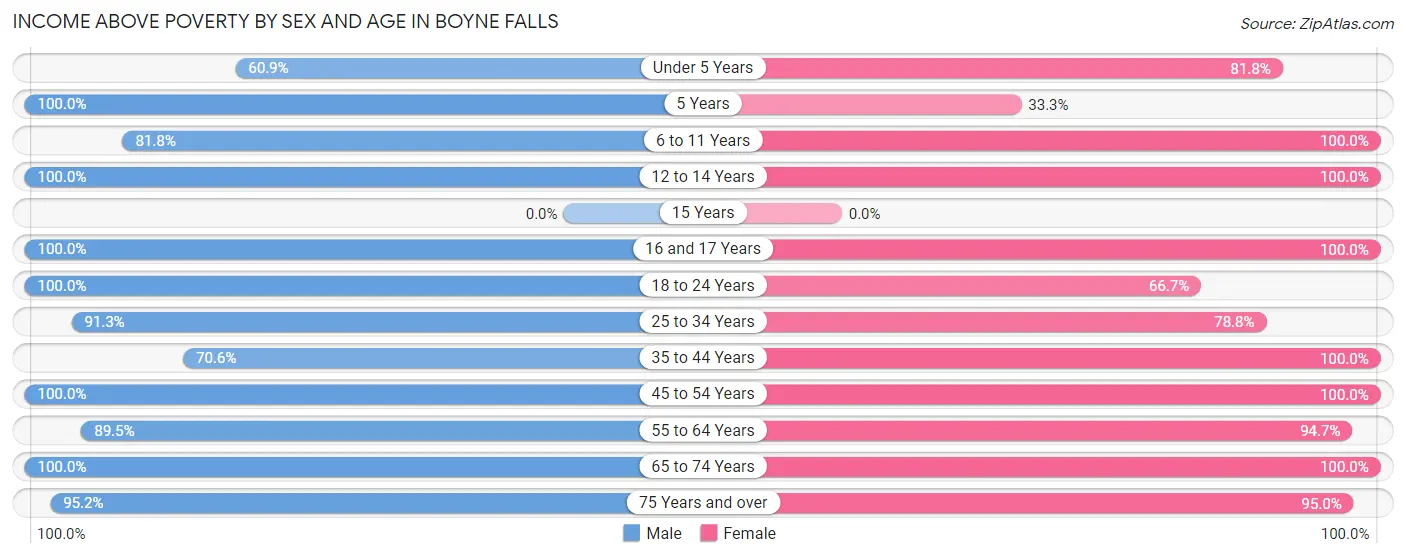
| Age Bracket | Male | Female |
| Under 5 Years | 14 (60.9%) | 9 (81.8%) |
| 5 Years | 1 (100.0%) | 1 (33.3%) |
| 6 to 11 Years | 9 (81.8%) | 4 (100.0%) |
| 12 to 14 Years | 2 (100.0%) | 7 (100.0%) |
| 15 Years | 0 (0.0%) | 0 (0.0%) |
| 16 and 17 Years | 2 (100.0%) | 2 (100.0%) |
| 18 to 24 Years | 7 (100.0%) | 6 (66.7%) |
| 25 to 34 Years | 21 (91.3%) | 26 (78.8%) |
| 35 to 44 Years | 12 (70.6%) | 11 (100.0%) |
| 45 to 54 Years | 16 (100.0%) | 21 (100.0%) |
| 55 to 64 Years | 17 (89.5%) | 36 (94.7%) |
| 65 to 74 Years | 25 (100.0%) | 15 (100.0%) |
| 75 Years and over | 20 (95.2%) | 19 (95.0%) |
| Total | 146 (87.4%) | 157 (90.2%) |
Income Below Poverty Among Married-Couple Families in Boyne Falls
The poverty statistics for married-couple families in Boyne Falls show that 5.7% or 3 of the total 53 families live below the poverty line. Families with 3 or 4 children have the highest poverty rate of 33.3%, comprising of 2 families. On the other hand, families with 1 or 2 children have the lowest poverty rate of 0.0%, which includes 0 families.
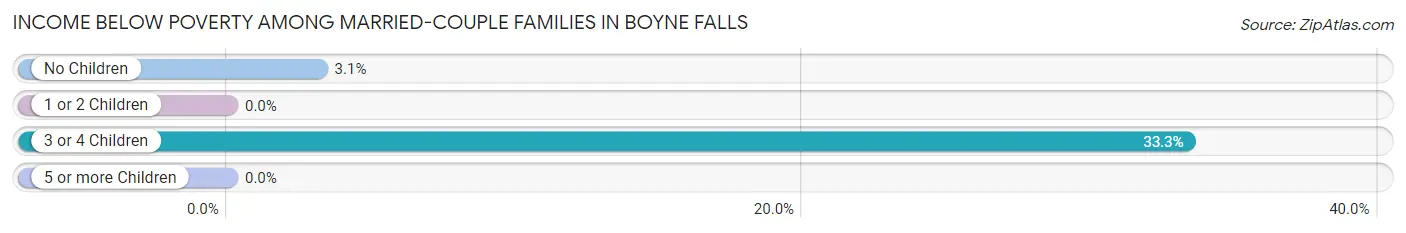
| Children | Above Poverty | Below Poverty |
| No Children | 31 (96.9%) | 1 (3.1%) |
| 1 or 2 Children | 15 (100.0%) | 0 (0.0%) |
| 3 or 4 Children | 4 (66.7%) | 2 (33.3%) |
| 5 or more Children | 0 (0.0%) | 0 (0.0%) |
| Total | 50 (94.3%) | 3 (5.7%) |
Income Below Poverty Among Single-Parent Households in Boyne Falls
According to the poverty data in Boyne Falls, 50.0% or 2 single-father households and 19.2% or 5 single-mother households are living below the poverty line. Among single-father households, those with 1 or 2 children have the highest poverty rate, with 2 households (50.0%) experiencing poverty. Likewise, among single-mother households, those with 1 or 2 children have the highest poverty rate, with 5 households (27.8%) falling below the poverty line.
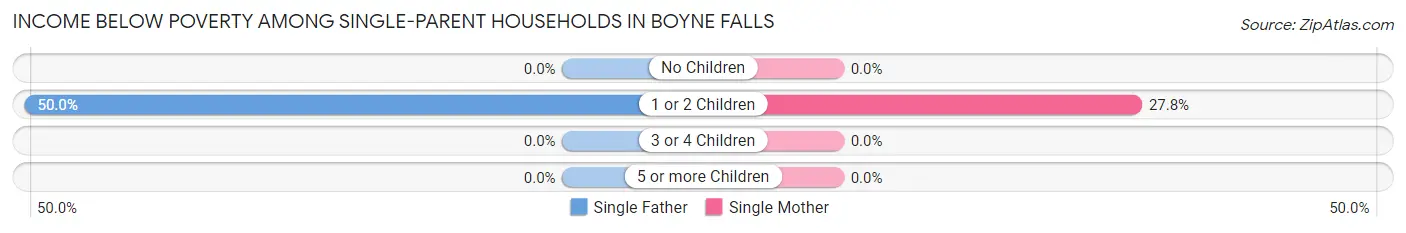
| Children | Single Father | Single Mother |
| No Children | 0 (0.0%) | 0 (0.0%) |
| 1 or 2 Children | 2 (50.0%) | 5 (27.8%) |
| 3 or 4 Children | 0 (0.0%) | 0 (0.0%) |
| 5 or more Children | 0 (0.0%) | 0 (0.0%) |
| Total | 2 (50.0%) | 5 (19.2%) |
Income Below Poverty Among Married-Couple vs Single-Parent Households in Boyne Falls
The poverty data for Boyne Falls shows that 3 of the married-couple family households (5.7%) and 7 of the single-parent households (23.3%) are living below the poverty level. Within the married-couple family households, those with 3 or 4 children have the highest poverty rate, with 2 households (33.3%) falling below the poverty line. Among the single-parent households, those with 1 or 2 children have the highest poverty rate, with 7 household (31.8%) living below poverty.
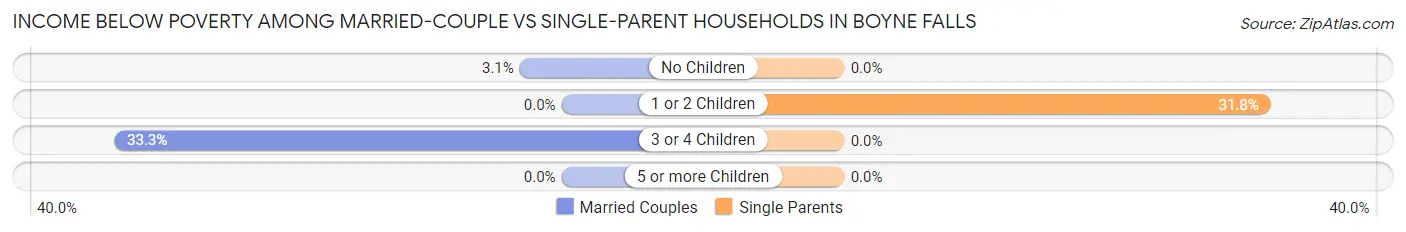
| Children | Married-Couple Families | Single-Parent Households |
| No Children | 1 (3.1%) | 0 (0.0%) |
| 1 or 2 Children | 0 (0.0%) | 7 (31.8%) |
| 3 or 4 Children | 2 (33.3%) | 0 (0.0%) |
| 5 or more Children | 0 (0.0%) | 0 (0.0%) |
| Total | 3 (5.7%) | 7 (23.3%) |
Race in Boyne Falls
The most populous races in Boyne Falls are White / Caucasian (299 | 87.7%), Two or more Races (29 | 8.5%), and Hispanic or Latino (8 | 2.4%).
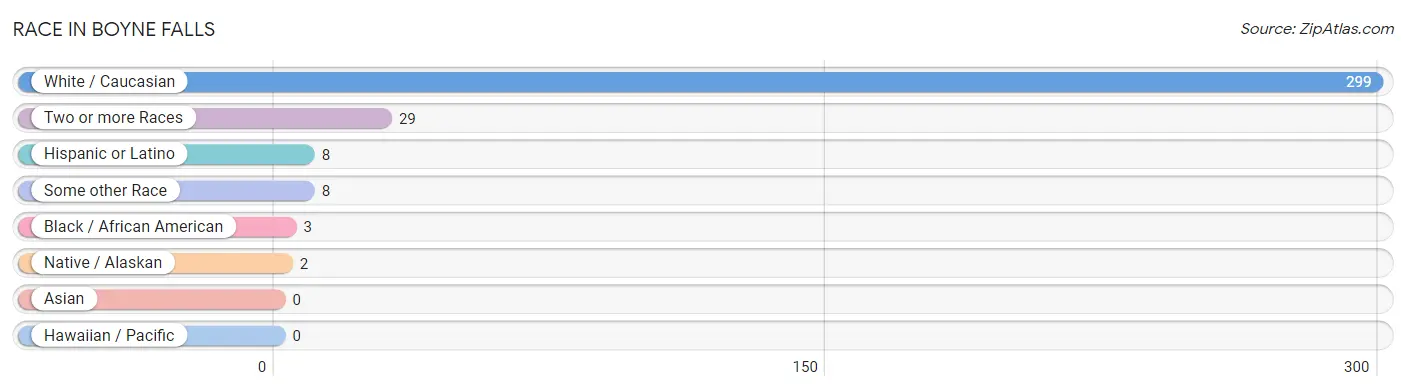
| Race | # Population | % Population |
| Asian | 0 | 0.0% |
| Black / African American | 3 | 0.9% |
| Hawaiian / Pacific | 0 | 0.0% |
| Hispanic or Latino | 8 | 2.4% |
| Native / Alaskan | 2 | 0.6% |
| White / Caucasian | 299 | 87.7% |
| Two or more Races | 29 | 8.5% |
| Some other Race | 8 | 2.4% |
| Total | 341 | 100.0% |
Ancestry in Boyne Falls
The most populous ancestries reported in Boyne Falls are German (81 | 23.7%), English (64 | 18.8%), Polish (51 | 15.0%), Irish (31 | 9.1%), and French (25 | 7.3%), together accounting for 73.9% of all Boyne Falls residents.
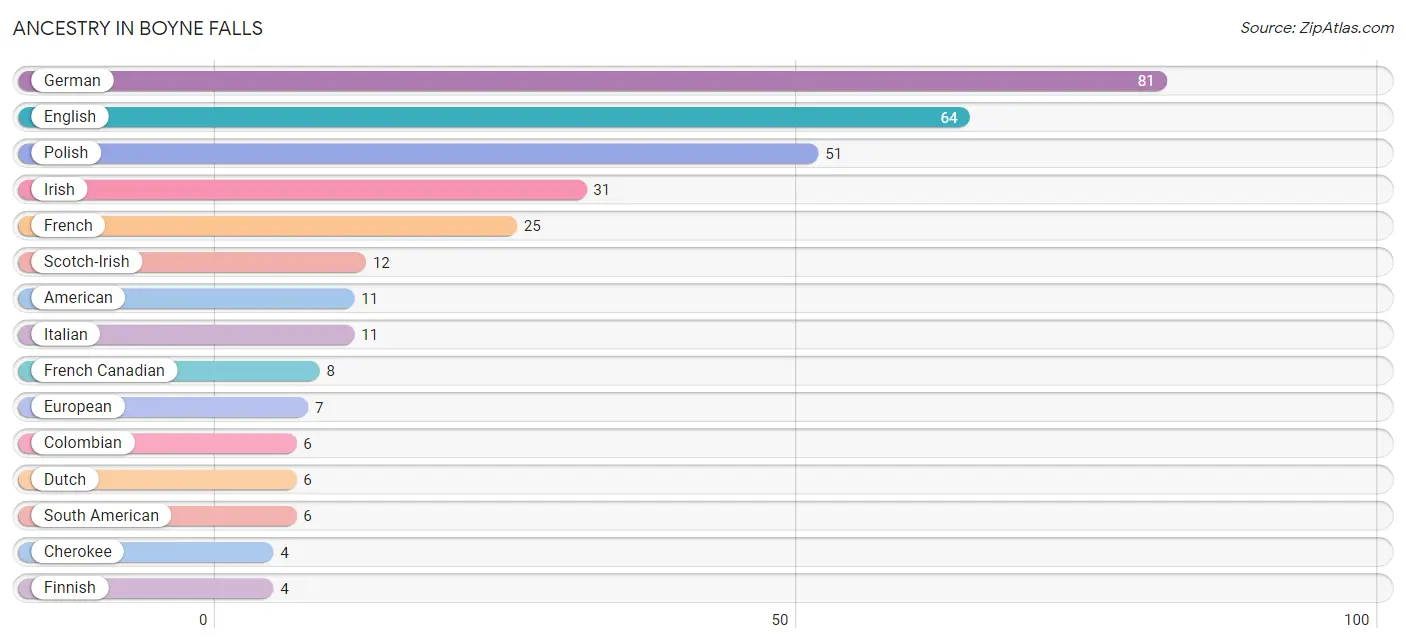
| Ancestry | # Population | % Population |
| American | 11 | 3.2% |
| Arab | 2 | 0.6% |
| Blackfeet | 3 | 0.9% |
| British | 1 | 0.3% |
| Burmese | 1 | 0.3% |
| Cherokee | 4 | 1.2% |
| Chippewa | 2 | 0.6% |
| Colombian | 6 | 1.8% |
| Dutch | 6 | 1.8% |
| English | 64 | 18.8% |
| European | 7 | 2.1% |
| Finnish | 4 | 1.2% |
| French | 25 | 7.3% |
| French American Indian | 3 | 0.9% |
| French Canadian | 8 | 2.4% |
| German | 81 | 23.7% |
| Greek | 2 | 0.6% |
| Hungarian | 1 | 0.3% |
| Irish | 31 | 9.1% |
| Italian | 11 | 3.2% |
| Maltese | 2 | 0.6% |
| Mexican | 2 | 0.6% |
| Northern European | 4 | 1.2% |
| Ottawa | 4 | 1.2% |
| Polish | 51 | 15.0% |
| Russian | 1 | 0.3% |
| Scandinavian | 1 | 0.3% |
| Scotch-Irish | 12 | 3.5% |
| Scottish | 4 | 1.2% |
| South American | 6 | 1.8% |
| Swiss | 2 | 0.6% | View All 31 Rows |
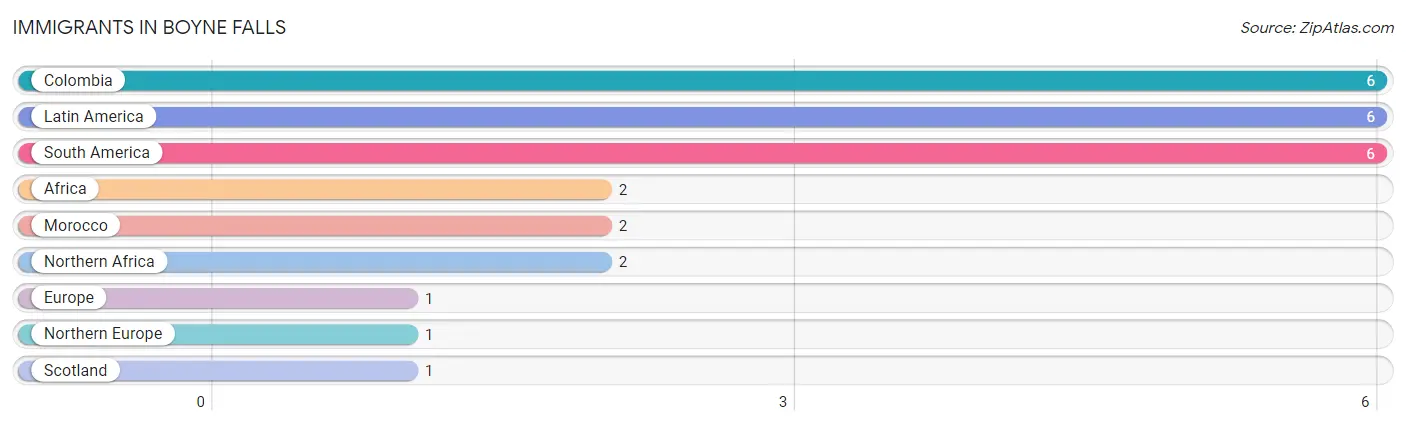
Immigrants in Boyne Falls
The most numerous immigrant groups reported in Boyne Falls came from Colombia (6 | 1.8%), Latin America (6 | 1.8%), South America (6 | 1.8%), Africa (2 | 0.6%), and Morocco (2 | 0.6%), together accounting for 6.5% of all Boyne Falls residents.
| Immigration Origin | # Population | % Population |
| Africa | 2 | 0.6% |
| Colombia | 6 | 1.8% |
| Europe | 1 | 0.3% |
| Latin America | 6 | 1.8% |
| Morocco | 2 | 0.6% |
| Northern Africa | 2 | 0.6% |
| Northern Europe | 1 | 0.3% |
| Scotland | 1 | 0.3% |
| South America | 6 | 1.8% | View All 9 Rows |
Sex and Age in Boyne Falls
Sex and Age in Boyne Falls
The most populous age groups in Boyne Falls are Under 5 Years (23 | 13.8%) for men and 55 to 59 Years (24 | 13.8%) for women.

| Age Bracket | Male | Female |
| Under 5 Years | 23 (13.8%) | 11 (6.3%) |
| 5 to 9 Years | 12 (7.2%) | 5 (2.9%) |
| 10 to 14 Years | 2 (1.2%) | 9 (5.2%) |
| 15 to 19 Years | 5 (3.0%) | 2 (1.1%) |
| 20 to 24 Years | 4 (2.4%) | 9 (5.2%) |
| 25 to 29 Years | 8 (4.8%) | 20 (11.5%) |
| 30 to 34 Years | 15 (9.0%) | 13 (7.5%) |
| 35 to 39 Years | 7 (4.2%) | 9 (5.2%) |
| 40 to 44 Years | 10 (6.0%) | 2 (1.1%) |
| 45 to 49 Years | 9 (5.4%) | 11 (6.3%) |
| 50 to 54 Years | 7 (4.2%) | 10 (5.8%) |
| 55 to 59 Years | 4 (2.4%) | 24 (13.8%) |
| 60 to 64 Years | 15 (9.0%) | 14 (8.1%) |
| 65 to 69 Years | 16 (9.6%) | 9 (5.2%) |
| 70 to 74 Years | 9 (5.4%) | 6 (3.5%) |
| 75 to 79 Years | 1 (0.6%) | 9 (5.2%) |
| 80 to 84 Years | 7 (4.2%) | 8 (4.6%) |
| 85 Years and over | 13 (7.8%) | 3 (1.7%) |
| Total | 167 (100.0%) | 174 (100.0%) |
Families and Households in Boyne Falls
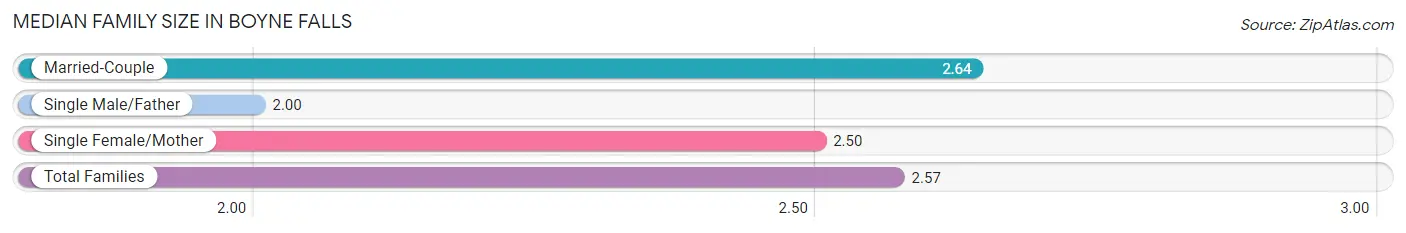
Median Family Size in Boyne Falls
The median family size in Boyne Falls is 2.57 persons per family, with married-couple families (53 | 63.9%) accounting for the largest median family size of 2.64 persons per family. On the other hand, single male/father families (4 | 4.8%) represent the smallest median family size with 2.00 persons per family.
| Family Type | # Families | Family Size |
| Married-Couple | 53 (63.9%) | 2.64 |
| Single Male/Father | 4 (4.8%) | 2.00 |
| Single Female/Mother | 26 (31.3%) | 2.50 |
| Total Families | 83 (100.0%) | 2.57 |
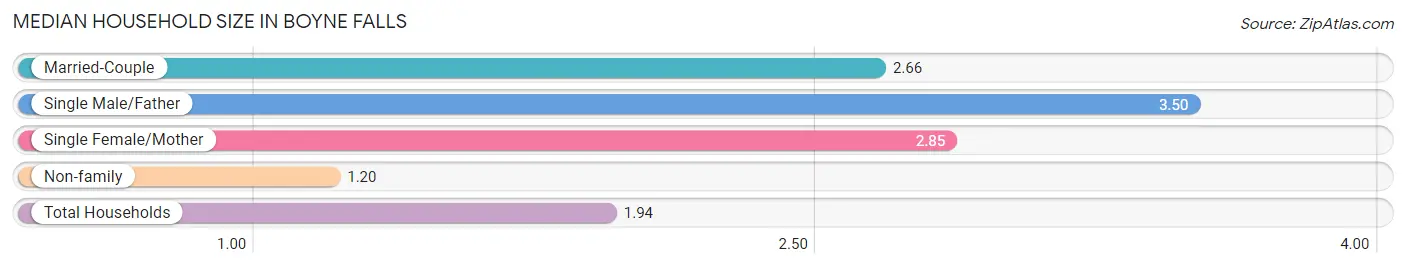
Median Household Size in Boyne Falls
The median household size in Boyne Falls is 1.94 persons per household, with single male/father households (4 | 2.3%) accounting for the largest median household size of 3.5 persons per household. non-family households (93 | 52.8%) represent the smallest median household size with 1.20 persons per household.
| Household Type | # Households | Household Size |
| Married-Couple | 53 (30.1%) | 2.66 |
| Single Male/Father | 4 (2.3%) | 3.50 |
| Single Female/Mother | 26 (14.8%) | 2.85 |
| Non-family | 93 (52.8%) | 1.20 |
| Total Households | 176 (100.0%) | 1.94 |
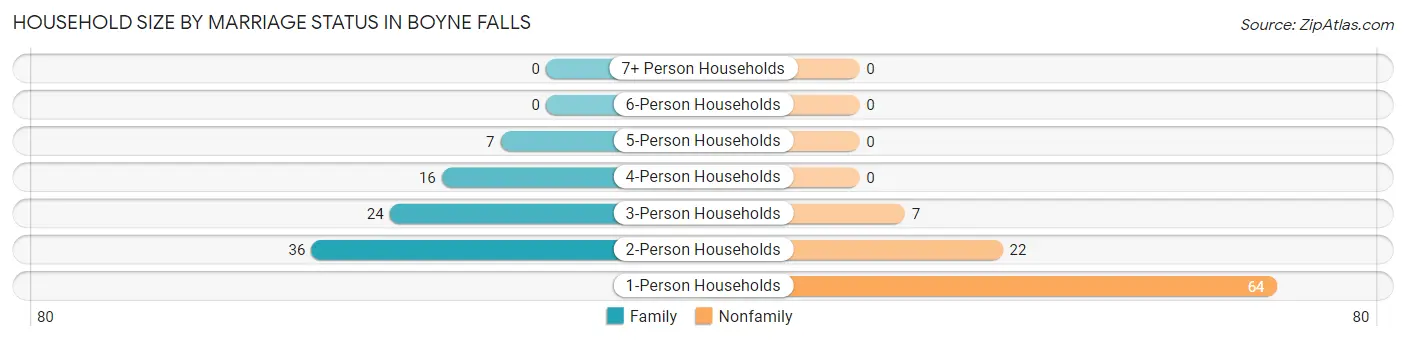
Household Size by Marriage Status in Boyne Falls
Out of a total of 176 households in Boyne Falls, 83 (47.2%) are family households, while 93 (52.8%) are nonfamily households. The most numerous type of family households are 2-person households, comprising 36, and the most common type of nonfamily households are 1-person households, comprising 64.
| Household Size | Family Households | Nonfamily Households |
| 1-Person Households | - | 64 (36.4%) |
| 2-Person Households | 36 (20.4%) | 22 (12.5%) |
| 3-Person Households | 24 (13.6%) | 7 (4.0%) |
| 4-Person Households | 16 (9.1%) | 0 (0.0%) |
| 5-Person Households | 7 (4.0%) | 0 (0.0%) |
| 6-Person Households | 0 (0.0%) | 0 (0.0%) |
| 7+ Person Households | 0 (0.0%) | 0 (0.0%) |
| Total | 83 (47.2%) | 93 (52.8%) |
Female Fertility in Boyne Falls
Fertility by Age in Boyne Falls
Average fertility rate in Boyne Falls is 88.0 births per 1,000 women. Women in the age bracket of 20 to 34 years have the highest fertility rate with 143.0 births per 1,000 women. Women in the age bracket of 20 to 34 years acount for 100.0% of all women with births.
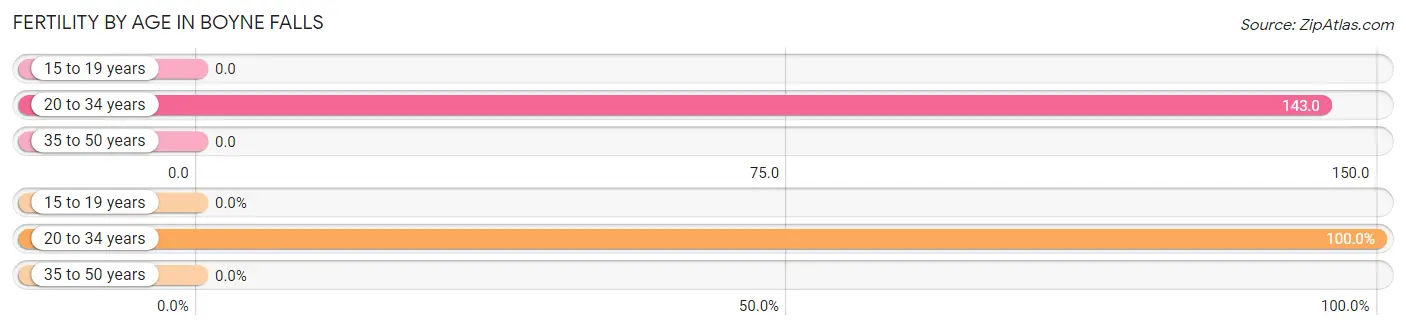
| Age Bracket | Women with Births | Births / 1,000 Women |
| 15 to 19 years | 0 (0.0%) | 0.0 |
| 20 to 34 years | 6 (100.0%) | 143.0 |
| 35 to 50 years | 0 (0.0%) | 0.0 |
| Total | 6 (100.0%) | 88.0 |
Fertility by Age by Marriage Status in Boyne Falls
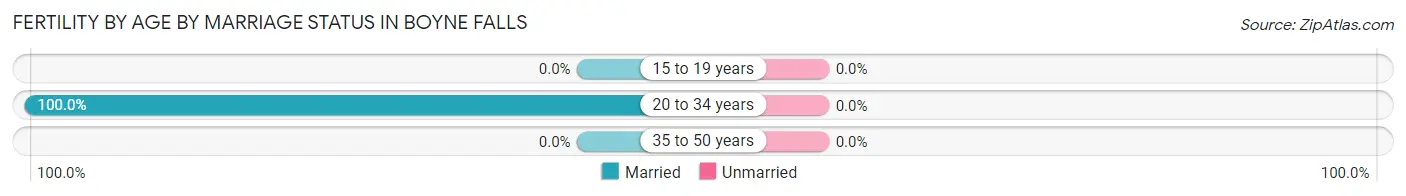
| Age Bracket | Married | Unmarried |
| 15 to 19 years | 0 (0.0%) | 0 (0.0%) |
| 20 to 34 years | 6 (100.0%) | 0 (0.0%) |
| 35 to 50 years | 0 (0.0%) | 0 (0.0%) |
| Total | 6 (100.0%) | 0 (0.0%) |
Fertility by Education in Boyne Falls
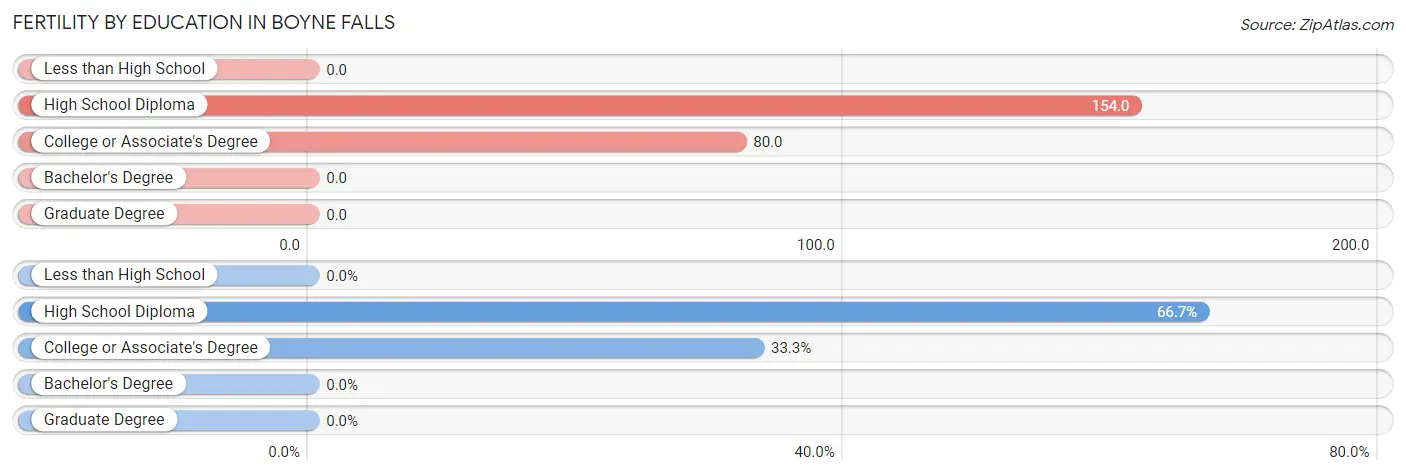
| Educational Attainment | Women with Births | Births / 1,000 Women |
| Less than High School | 0 (0.0%) | 0.0 |
| High School Diploma | 4 (66.7%) | 154.0 |
| College or Associate's Degree | 2 (33.3%) | 80.0 |
| Bachelor's Degree | 0 (0.0%) | 0.0 |
| Graduate Degree | 0 (0.0%) | 0.0 |
| Total | 6 (100.0%) | 88.0 |
Fertility by Education by Marriage Status in Boyne Falls
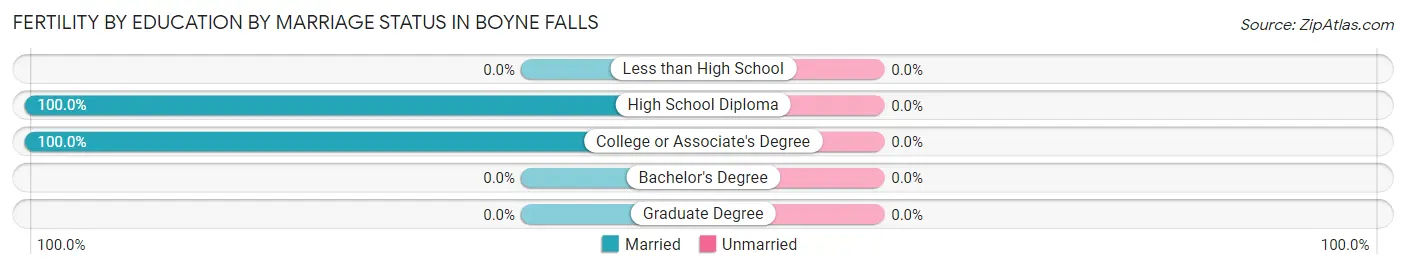
| Educational Attainment | Married | Unmarried |
| Less than High School | 0 (0.0%) | 0 (0.0%) |
| High School Diploma | 4 (100.0%) | 0 (0.0%) |
| College or Associate's Degree | 2 (100.0%) | 0 (0.0%) |
| Bachelor's Degree | 0 (0.0%) | 0 (0.0%) |
| Graduate Degree | 0 (0.0%) | 0 (0.0%) |
| Total | 6 (100.0%) | 0 (0.0%) |
Employment Characteristics in Boyne Falls
Employment by Class of Employer in Boyne Falls
Among the 145 employed individuals in Boyne Falls, private company employees (99 | 68.3%), self-employed (not incorporated) (19 | 13.1%), and not-for-profit organizations (10 | 6.9%) make up the most common classes of employment.
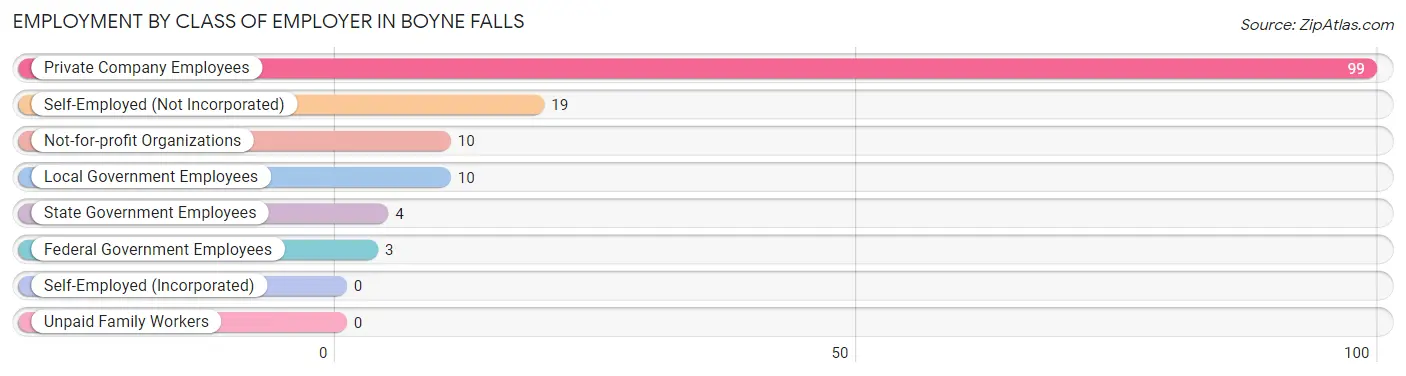
| Employer Class | # Employees | % Employees |
| Private Company Employees | 99 | 68.3% |
| Self-Employed (Incorporated) | 0 | 0.0% |
| Self-Employed (Not Incorporated) | 19 | 13.1% |
| Not-for-profit Organizations | 10 | 6.9% |
| Local Government Employees | 10 | 6.9% |
| State Government Employees | 4 | 2.8% |
| Federal Government Employees | 3 | 2.1% |
| Unpaid Family Workers | 0 | 0.0% |
| Total | 145 | 100.0% |
Employment Status by Age in Boyne Falls
According to the labor force statistics for Boyne Falls, out of the total population over 16 years of age (279), 57.0% or 159 individuals are in the labor force, with 3.8% or 6 of them unemployed. The age group with the highest labor force participation rate is 35 to 44 years, with 85.7% or 24 individuals in the labor force. Within the labor force, the 16 to 19 years age range has the highest percentage of unemployed individuals, with 50.0% or 2 of them being unemployed.
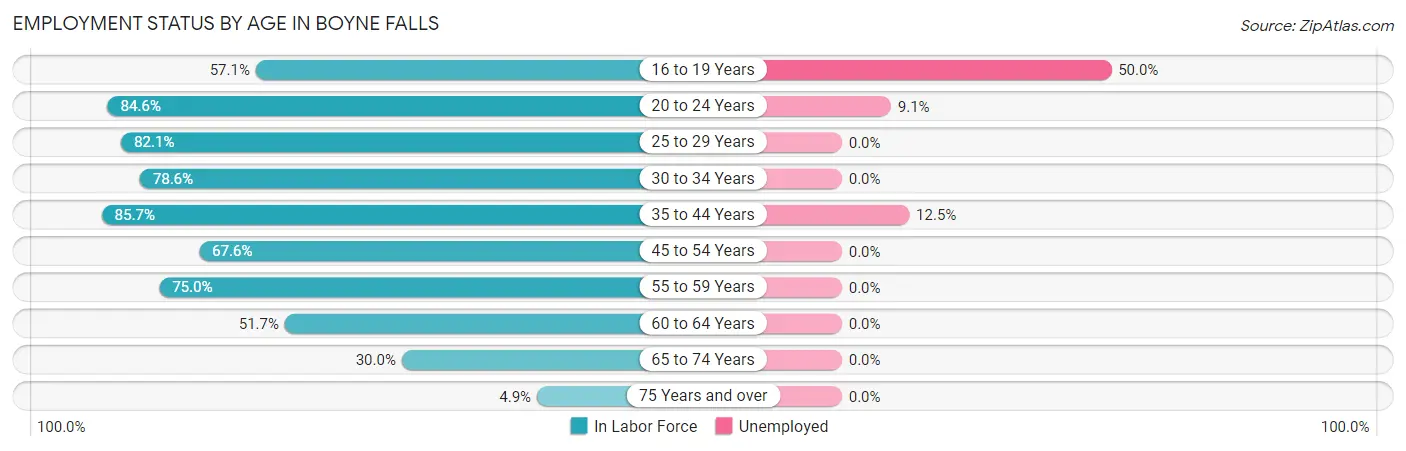
| Age Bracket | In Labor Force | Unemployed |
| 16 to 19 Years | 4 (57.1%) | 2 (50.0%) |
| 20 to 24 Years | 11 (84.6%) | 1 (9.1%) |
| 25 to 29 Years | 23 (82.1%) | 0 (0.0%) |
| 30 to 34 Years | 22 (78.6%) | 0 (0.0%) |
| 35 to 44 Years | 24 (85.7%) | 3 (12.5%) |
| 45 to 54 Years | 25 (67.6%) | 0 (0.0%) |
| 55 to 59 Years | 21 (75.0%) | 0 (0.0%) |
| 60 to 64 Years | 15 (51.7%) | 0 (0.0%) |
| 65 to 74 Years | 12 (30.0%) | 0 (0.0%) |
| 75 Years and over | 2 (4.9%) | 0 (0.0%) |
| Total | 159 (57.0%) | 6 (3.8%) |
Employment Status by Educational Attainment in Boyne Falls
According to labor force statistics for Boyne Falls, 73.0% of individuals (130) out of the total population between 25 and 64 years of age (178) are in the labor force, with 2.3% or 3 of them being unemployed. The group with the highest labor force participation rate are those with the educational attainment of high school diploma, with 80.0% or 60 individuals in the labor force. Within the labor force, individuals with high school diploma education have the highest percentage of unemployment, with 5.0% or 3 of them being unemployed.
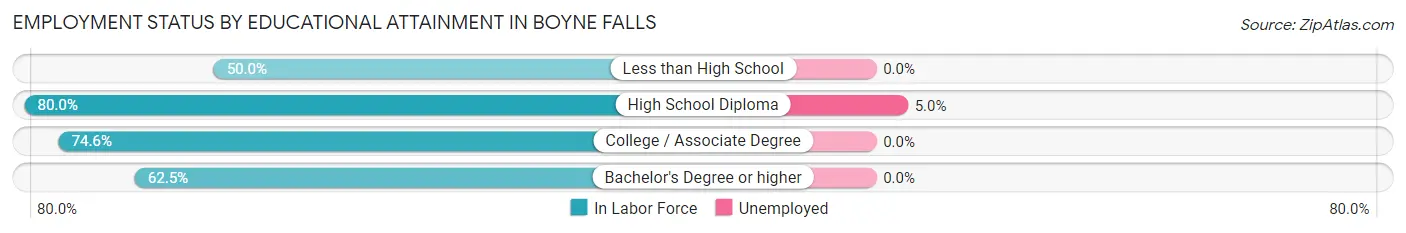
| Educational Attainment | In Labor Force | Unemployed |
| Less than High School | 8 (50.0%) | 0 (0.0%) |
| High School Diploma | 60 (80.0%) | 4 (5.0%) |
| College / Associate Degree | 47 (74.6%) | 0 (0.0%) |
| Bachelor's Degree or higher | 15 (62.5%) | 0 (0.0%) |
| Total | 130 (73.0%) | 4 (2.3%) |
Employment Occupations by Sex in Boyne Falls
Management, Business, Science and Arts Occupations
The most common Management, Business, Science and Arts occupations in Boyne Falls are Management (25 | 16.3%), Community & Social Service (14 | 9.1%), Health Diagnosing & Treating (13 | 8.5%), Education Instruction & Library (8 | 5.2%), and Computers, Engineering & Science (5 | 3.3%).
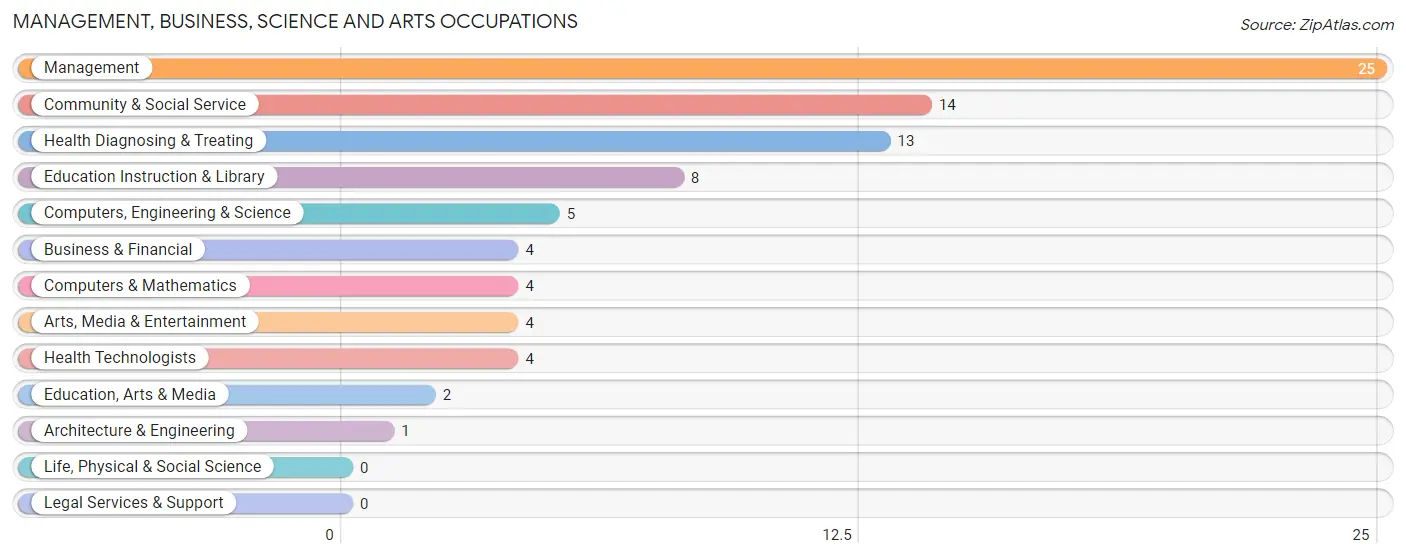
Management, Business, Science and Arts Occupations by Sex
Within the Management, Business, Science and Arts occupations in Boyne Falls, the most male-oriented occupations are Architecture & Engineering (100.0%), Arts, Media & Entertainment (75.0%), and Computers, Engineering & Science (60.0%), while the most female-oriented occupations are Education, Arts & Media (100.0%), Health Diagnosing & Treating (100.0%), and Health Technologists (100.0%).
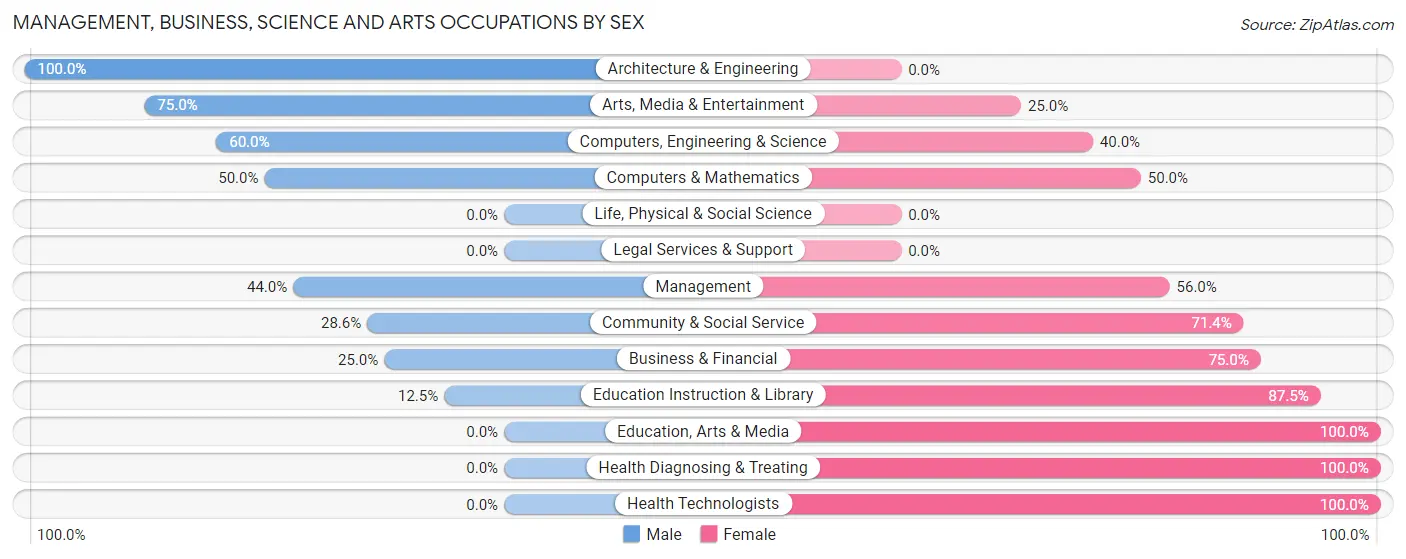
| Occupation | Male | Female |
| Management | 11 (44.0%) | 14 (56.0%) |
| Business & Financial | 1 (25.0%) | 3 (75.0%) |
| Computers, Engineering & Science | 3 (60.0%) | 2 (40.0%) |
| Computers & Mathematics | 2 (50.0%) | 2 (50.0%) |
| Architecture & Engineering | 1 (100.0%) | 0 (0.0%) |
| Life, Physical & Social Science | 0 (0.0%) | 0 (0.0%) |
| Community & Social Service | 4 (28.6%) | 10 (71.4%) |
| Education, Arts & Media | 0 (0.0%) | 2 (100.0%) |
| Legal Services & Support | 0 (0.0%) | 0 (0.0%) |
| Education Instruction & Library | 1 (12.5%) | 7 (87.5%) |
| Arts, Media & Entertainment | 3 (75.0%) | 1 (25.0%) |
| Health Diagnosing & Treating | 0 (0.0%) | 13 (100.0%) |
| Health Technologists | 0 (0.0%) | 4 (100.0%) |
| Total (Category) | 19 (31.1%) | 42 (68.9%) |
| Total (Overall) | 70 (45.8%) | 83 (54.2%) |
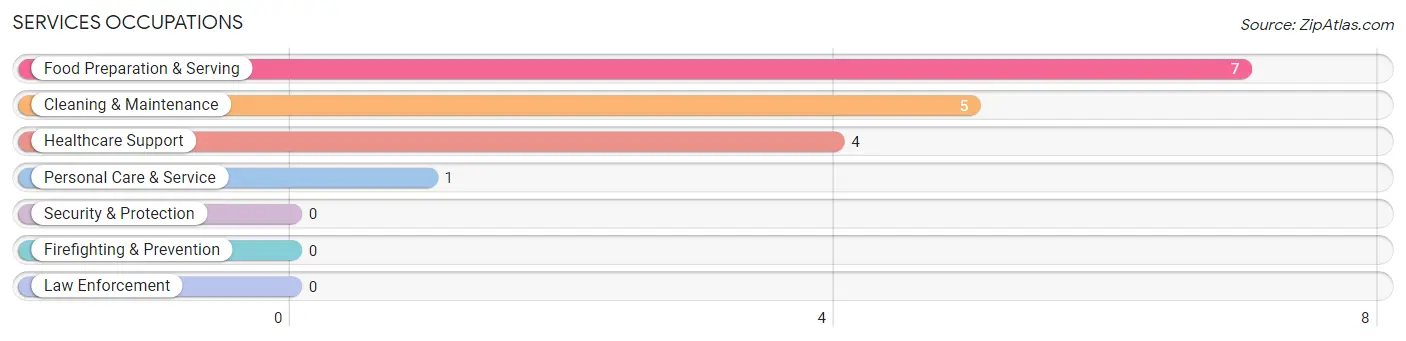
Services Occupations
The most common Services occupations in Boyne Falls are Food Preparation & Serving (7 | 4.6%), Cleaning & Maintenance (5 | 3.3%), Healthcare Support (4 | 2.6%), and Personal Care & Service (1 | 0.6%).
Services Occupations by Sex
Within the Services occupations in Boyne Falls, the most male-oriented occupations are Personal Care & Service (100.0%), Cleaning & Maintenance (60.0%), and Healthcare Support (25.0%), while the most female-oriented occupations are Food Preparation & Serving (85.7%), Healthcare Support (75.0%), and Cleaning & Maintenance (40.0%).
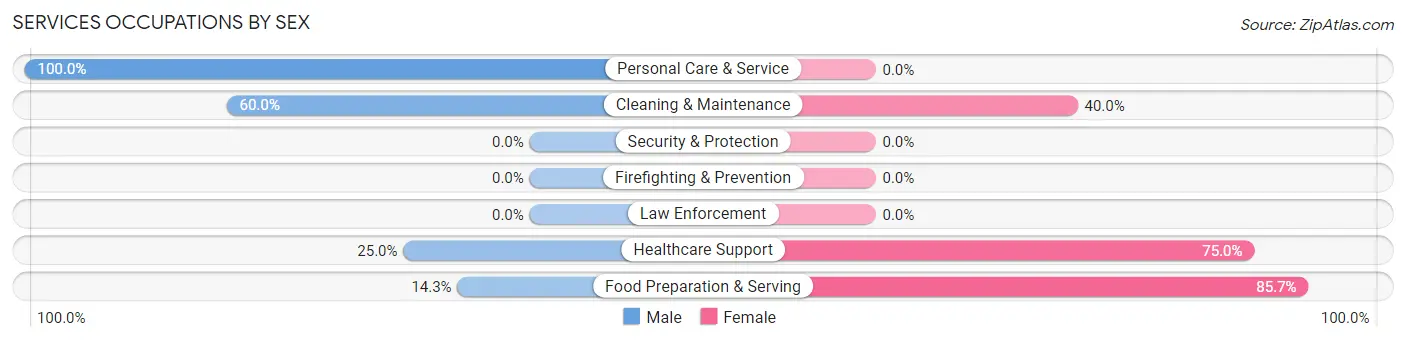
| Occupation | Male | Female |
| Healthcare Support | 1 (25.0%) | 3 (75.0%) |
| Security & Protection | 0 (0.0%) | 0 (0.0%) |
| Firefighting & Prevention | 0 (0.0%) | 0 (0.0%) |
| Law Enforcement | 0 (0.0%) | 0 (0.0%) |
| Food Preparation & Serving | 1 (14.3%) | 6 (85.7%) |
| Cleaning & Maintenance | 3 (60.0%) | 2 (40.0%) |
| Personal Care & Service | 1 (100.0%) | 0 (0.0%) |
| Total (Category) | 6 (35.3%) | 11 (64.7%) |
| Total (Overall) | 70 (45.8%) | 83 (54.2%) |
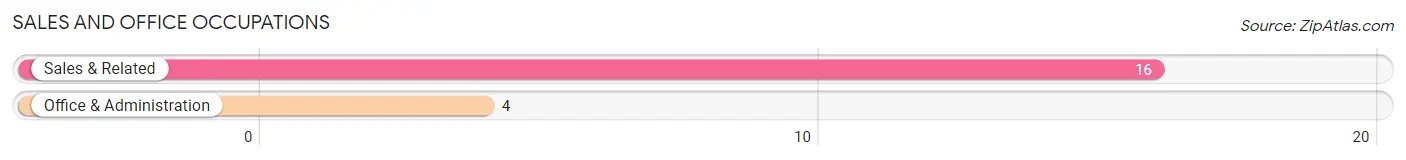
Sales and Office Occupations
The most common Sales and Office occupations in Boyne Falls are Sales & Related (16 | 10.5%), and Office & Administration (4 | 2.6%).
Sales and Office Occupations by Sex
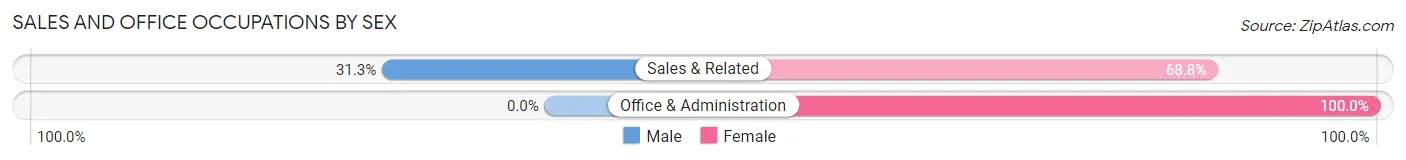
| Occupation | Male | Female |
| Sales & Related | 5 (31.2%) | 11 (68.8%) |
| Office & Administration | 0 (0.0%) | 4 (100.0%) |
| Total (Category) | 5 (25.0%) | 15 (75.0%) |
| Total (Overall) | 70 (45.8%) | 83 (54.2%) |
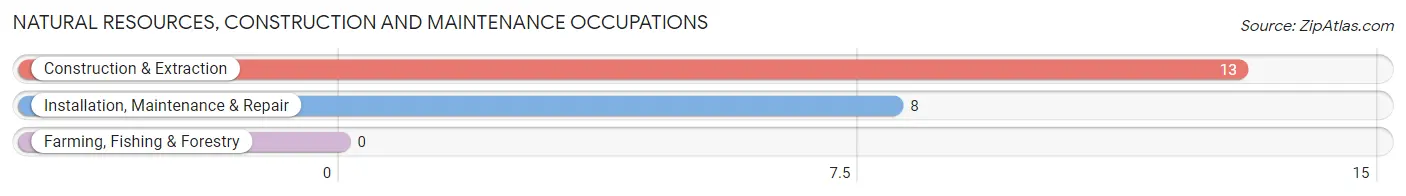
Natural Resources, Construction and Maintenance Occupations
The most common Natural Resources, Construction and Maintenance occupations in Boyne Falls are Construction & Extraction (13 | 8.5%), and Installation, Maintenance & Repair (8 | 5.2%).
Natural Resources, Construction and Maintenance Occupations by Sex
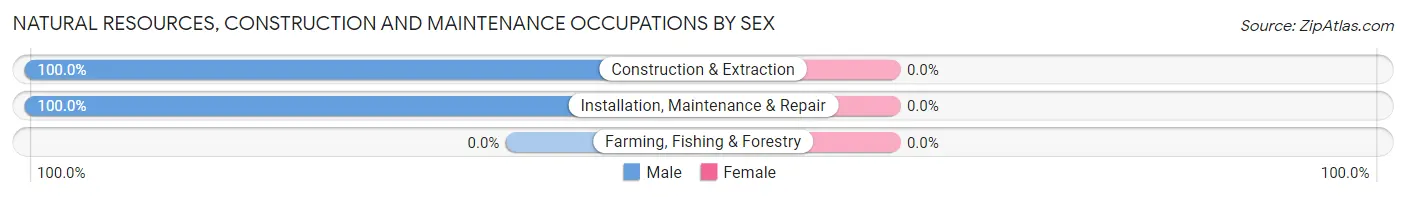
| Occupation | Male | Female |
| Farming, Fishing & Forestry | 0 (0.0%) | 0 (0.0%) |
| Construction & Extraction | 13 (100.0%) | 0 (0.0%) |
| Installation, Maintenance & Repair | 8 (100.0%) | 0 (0.0%) |
| Total (Category) | 21 (100.0%) | 0 (0.0%) |
| Total (Overall) | 70 (45.8%) | 83 (54.2%) |
Production, Transportation and Moving Occupations
The most common Production, Transportation and Moving occupations in Boyne Falls are Production (22 | 14.4%), Transportation (6 | 3.9%), and Material Moving (6 | 3.9%).
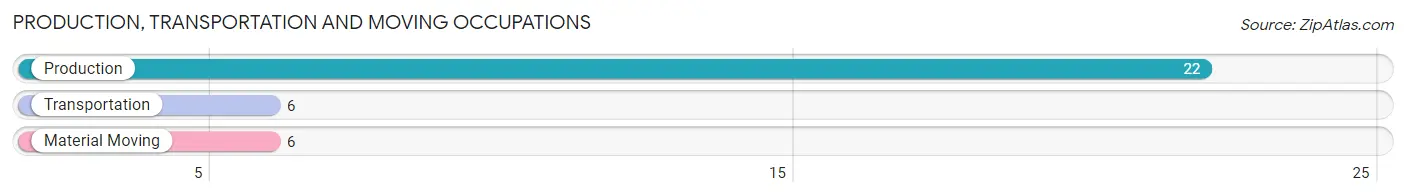
Production, Transportation and Moving Occupations by Sex
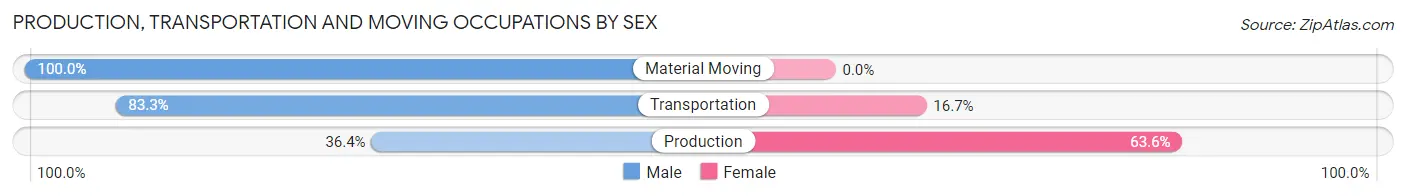
| Occupation | Male | Female |
| Production | 8 (36.4%) | 14 (63.6%) |
| Transportation | 5 (83.3%) | 1 (16.7%) |
| Material Moving | 6 (100.0%) | 0 (0.0%) |
| Total (Category) | 19 (55.9%) | 15 (44.1%) |
| Total (Overall) | 70 (45.8%) | 83 (54.2%) |
Employment Industries by Sex in Boyne Falls
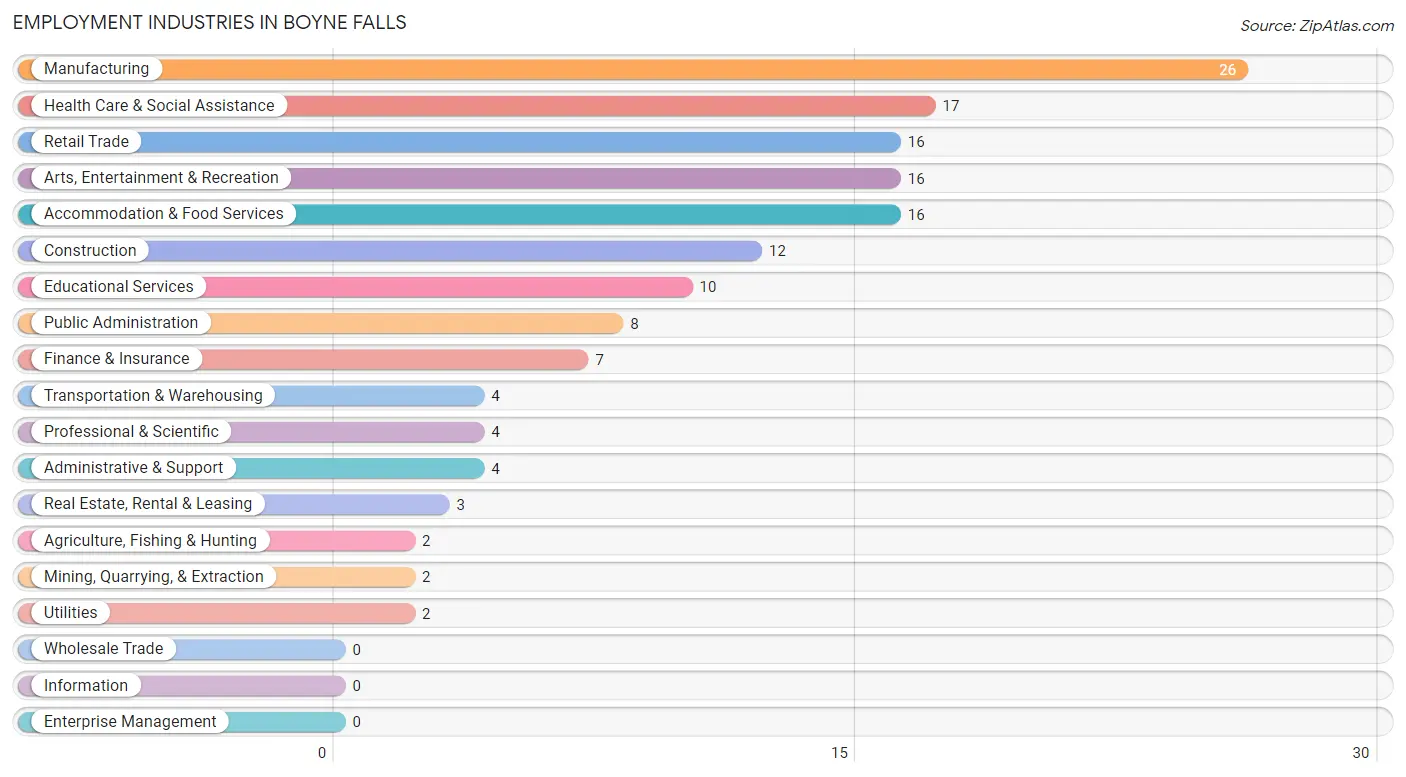
Employment Industries in Boyne Falls
The major employment industries in Boyne Falls include Manufacturing (26 | 17.0%), Health Care & Social Assistance (17 | 11.1%), Retail Trade (16 | 10.5%), Arts, Entertainment & Recreation (16 | 10.5%), and Accommodation & Food Services (16 | 10.5%).
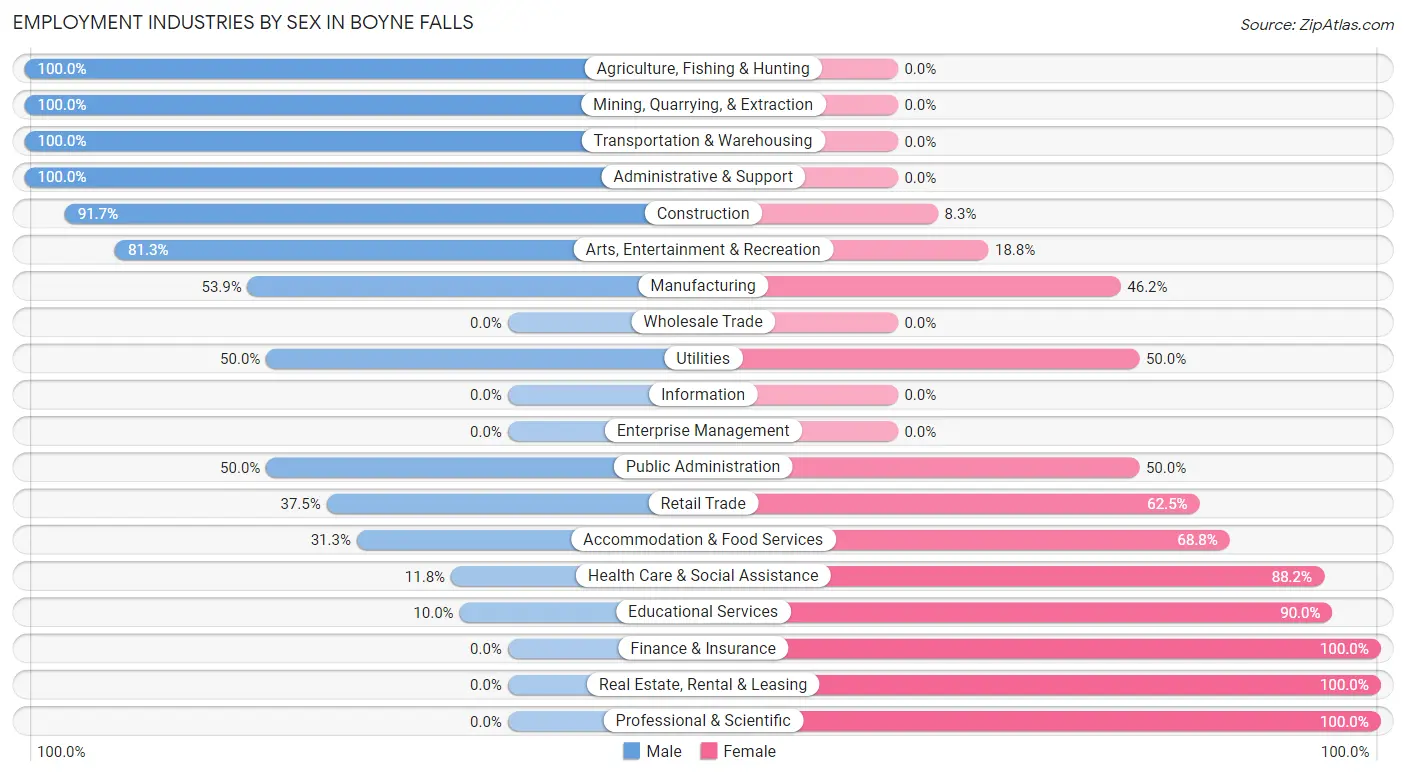
Employment Industries by Sex in Boyne Falls
The Boyne Falls industries that see more men than women are Agriculture, Fishing & Hunting (100.0%), Mining, Quarrying, & Extraction (100.0%), and Transportation & Warehousing (100.0%), whereas the industries that tend to have a higher number of women are Finance & Insurance (100.0%), Real Estate, Rental & Leasing (100.0%), and Professional & Scientific (100.0%).
| Industry | Male | Female |
| Agriculture, Fishing & Hunting | 2 (100.0%) | 0 (0.0%) |
| Mining, Quarrying, & Extraction | 2 (100.0%) | 0 (0.0%) |
| Construction | 11 (91.7%) | 1 (8.3%) |
| Manufacturing | 14 (53.8%) | 12 (46.2%) |
| Wholesale Trade | 0 (0.0%) | 0 (0.0%) |
| Retail Trade | 6 (37.5%) | 10 (62.5%) |
| Transportation & Warehousing | 4 (100.0%) | 0 (0.0%) |
| Utilities | 1 (50.0%) | 1 (50.0%) |
| Information | 0 (0.0%) | 0 (0.0%) |
| Finance & Insurance | 0 (0.0%) | 7 (100.0%) |
| Real Estate, Rental & Leasing | 0 (0.0%) | 3 (100.0%) |
| Professional & Scientific | 0 (0.0%) | 4 (100.0%) |
| Enterprise Management | 0 (0.0%) | 0 (0.0%) |
| Administrative & Support | 4 (100.0%) | 0 (0.0%) |
| Educational Services | 1 (10.0%) | 9 (90.0%) |
| Health Care & Social Assistance | 2 (11.8%) | 15 (88.2%) |
| Arts, Entertainment & Recreation | 13 (81.2%) | 3 (18.8%) |
| Accommodation & Food Services | 5 (31.2%) | 11 (68.8%) |
| Public Administration | 4 (50.0%) | 4 (50.0%) |
| Total | 70 (45.8%) | 83 (54.2%) |
Education in Boyne Falls
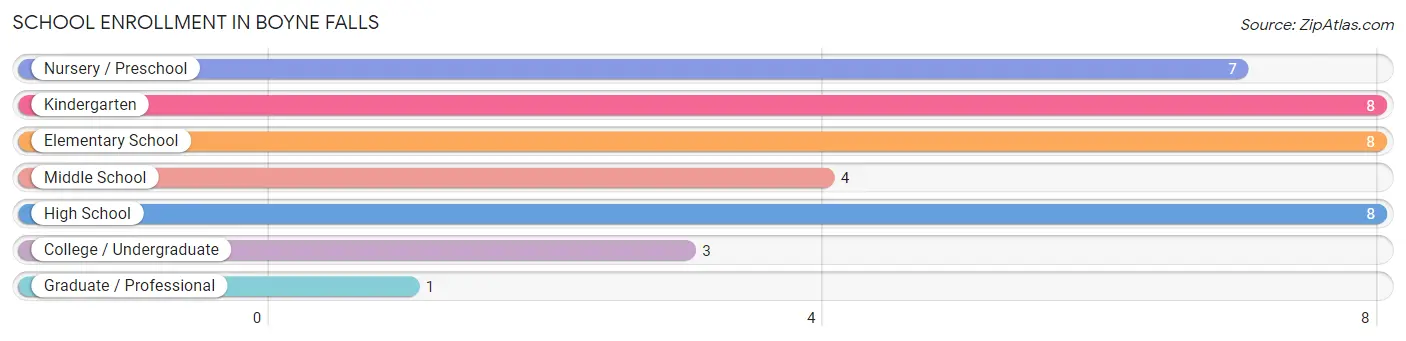
School Enrollment in Boyne Falls
The most common levels of schooling among the 39 students in Boyne Falls are kindergarten (8 | 20.5%), elementary school (8 | 20.5%), and high school (8 | 20.5%).
| School Level | # Students | % Students |
| Nursery / Preschool | 7 | 17.9% |
| Kindergarten | 8 | 20.5% |
| Elementary School | 8 | 20.5% |
| Middle School | 4 | 10.3% |
| High School | 8 | 20.5% |
| College / Undergraduate | 3 | 7.7% |
| Graduate / Professional | 1 | 2.6% |
| Total | 39 | 100.0% |
School Enrollment by Age by Funding Source in Boyne Falls
Out of a total of 39 students who are enrolled in schools in Boyne Falls, 5 (12.8%) attend a private institution, while the remaining 34 (87.2%) are enrolled in public schools. The age group of 5 to 9 year old has the highest likelihood of being enrolled in private schools, with 4 (23.5% in the age bracket) enrolled. Conversely, the age group of 10 to 14 year olds has the lowest likelihood of being enrolled in a private school, with 5 (100.0% in the age bracket) attending a public institution.
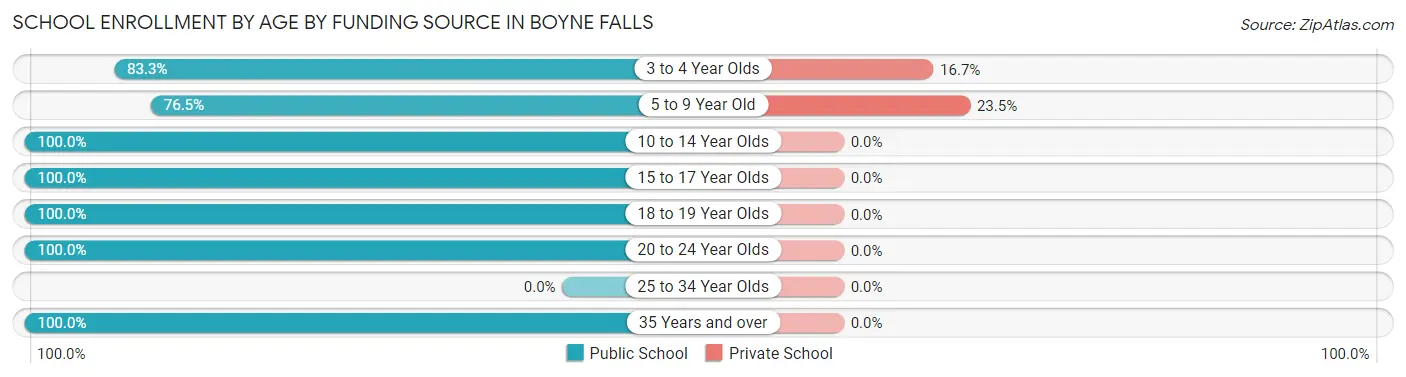
| Age Bracket | Public School | Private School |
| 3 to 4 Year Olds | 5 (83.3%) | 1 (16.7%) |
| 5 to 9 Year Old | 13 (76.5%) | 4 (23.5%) |
| 10 to 14 Year Olds | 5 (100.0%) | 0 (0.0%) |
| 15 to 17 Year Olds | 4 (100.0%) | 0 (0.0%) |
| 18 to 19 Year Olds | 1 (100.0%) | 0 (0.0%) |
| 20 to 24 Year Olds | 3 (100.0%) | 0 (0.0%) |
| 25 to 34 Year Olds | 0 (0.0%) | 0 (0.0%) |
| 35 Years and over | 3 (100.0%) | 0 (0.0%) |
| Total | 34 (87.2%) | 5 (12.8%) |
Educational Attainment by Field of Study in Boyne Falls
Education (9 | 22.0%), social sciences (7 | 17.1%), psychology (5 | 12.2%), science & technology (5 | 12.2%), and bio, nature & agricultural (4 | 9.8%) are the most common fields of study among 41 individuals in Boyne Falls who have obtained a bachelor's degree or higher.
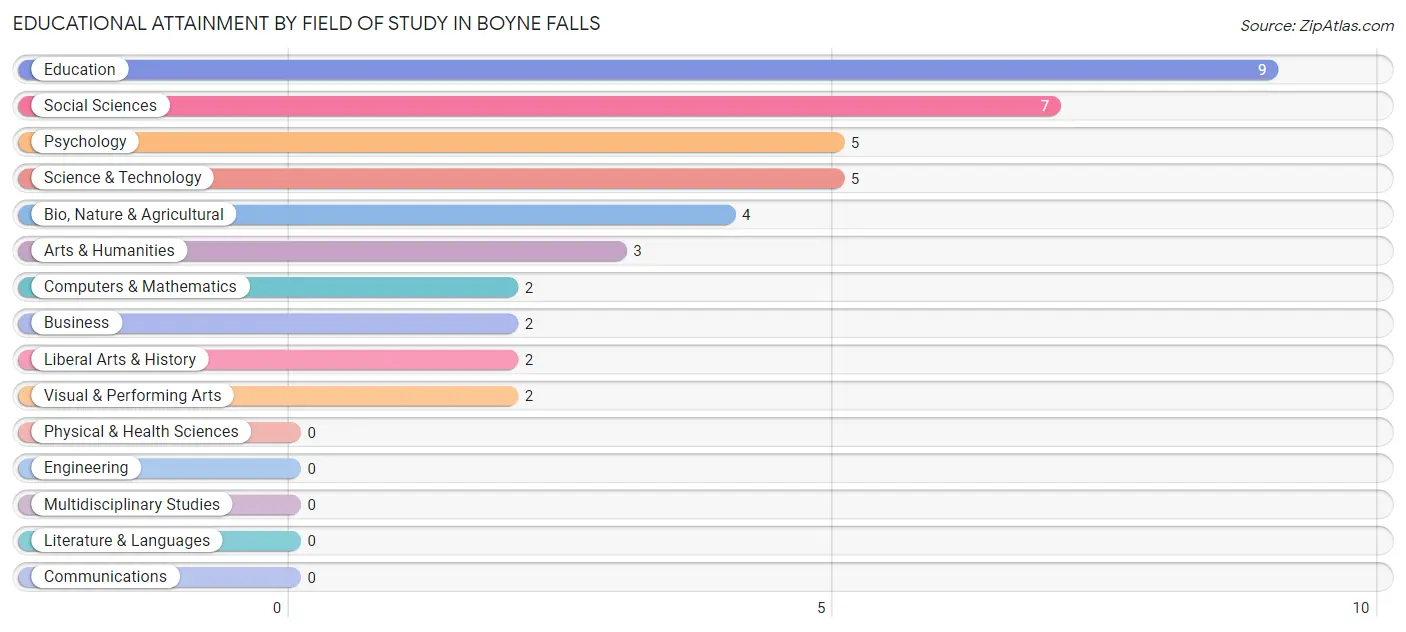
| Field of Study | # Graduates | % Graduates |
| Computers & Mathematics | 2 | 4.9% |
| Bio, Nature & Agricultural | 4 | 9.8% |
| Physical & Health Sciences | 0 | 0.0% |
| Psychology | 5 | 12.2% |
| Social Sciences | 7 | 17.1% |
| Engineering | 0 | 0.0% |
| Multidisciplinary Studies | 0 | 0.0% |
| Science & Technology | 5 | 12.2% |
| Business | 2 | 4.9% |
| Education | 9 | 22.0% |
| Literature & Languages | 0 | 0.0% |
| Liberal Arts & History | 2 | 4.9% |
| Visual & Performing Arts | 2 | 4.9% |
| Communications | 0 | 0.0% |
| Arts & Humanities | 3 | 7.3% |
| Total | 41 | 100.0% |
Transportation & Commute in Boyne Falls
Vehicle Availability by Sex in Boyne Falls
The most prevalent vehicle ownership categories in Boyne Falls are males with 2 vehicles (23, accounting for 33.3%) and females with 2 vehicles (28, making up 30.3%).
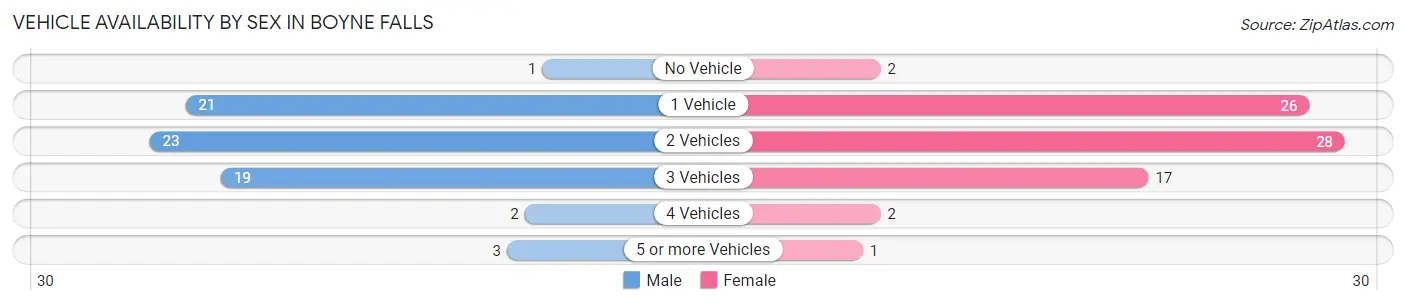
| Vehicles Available | Male | Female |
| No Vehicle | 1 (1.5%) | 2 (2.6%) |
| 1 Vehicle | 21 (30.4%) | 26 (34.2%) |
| 2 Vehicles | 23 (33.3%) | 28 (36.8%) |
| 3 Vehicles | 19 (27.5%) | 17 (22.4%) |
| 4 Vehicles | 2 (2.9%) | 2 (2.6%) |
| 5 or more Vehicles | 3 (4.3%) | 1 (1.3%) |
| Total | 69 (100.0%) | 76 (100.0%) |
Commute Time in Boyne Falls
The most frequently occuring commute durations in Boyne Falls are 5 to 9 minutes (37 commuters, 28.9%), 15 to 19 minutes (19 commuters, 14.8%), and 10 to 14 minutes (18 commuters, 14.1%).
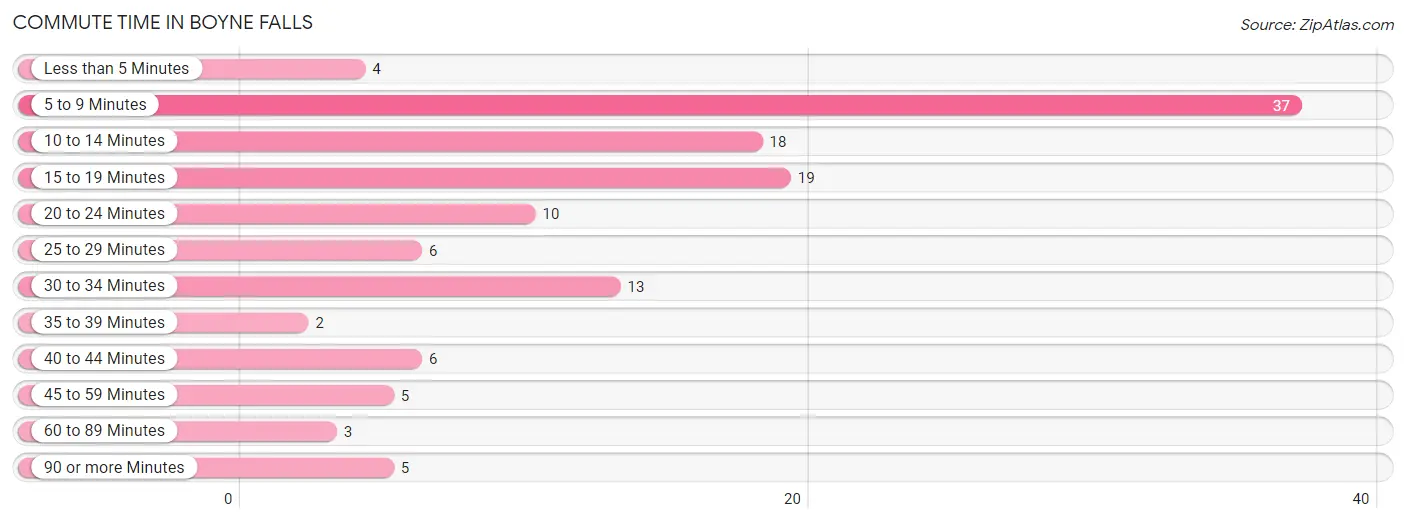
| Commute Time | # Commuters | % Commuters |
| Less than 5 Minutes | 4 | 3.1% |
| 5 to 9 Minutes | 37 | 28.9% |
| 10 to 14 Minutes | 18 | 14.1% |
| 15 to 19 Minutes | 19 | 14.8% |
| 20 to 24 Minutes | 10 | 7.8% |
| 25 to 29 Minutes | 6 | 4.7% |
| 30 to 34 Minutes | 13 | 10.2% |
| 35 to 39 Minutes | 2 | 1.6% |
| 40 to 44 Minutes | 6 | 4.7% |
| 45 to 59 Minutes | 5 | 3.9% |
| 60 to 89 Minutes | 3 | 2.3% |
| 90 or more Minutes | 5 | 3.9% |
Commute Time by Sex in Boyne Falls
The most common commute times in Boyne Falls are 5 to 9 minutes (17 commuters, 30.4%) for males and 5 to 9 minutes (20 commuters, 27.8%) for females.
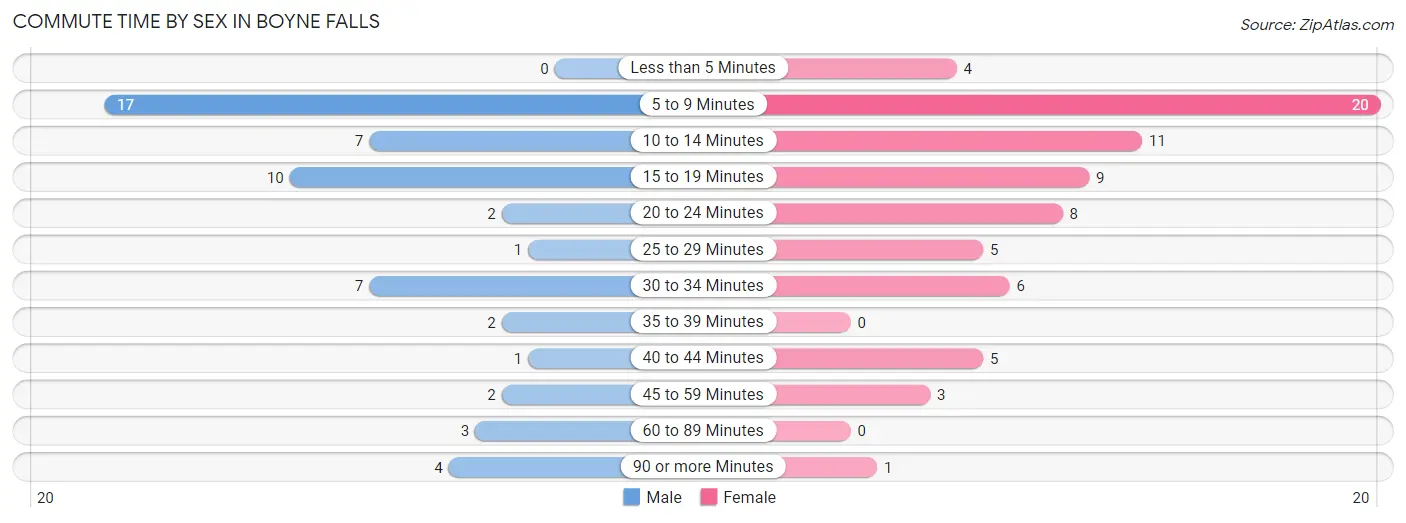
| Commute Time | Male | Female |
| Less than 5 Minutes | 0 (0.0%) | 4 (5.6%) |
| 5 to 9 Minutes | 17 (30.4%) | 20 (27.8%) |
| 10 to 14 Minutes | 7 (12.5%) | 11 (15.3%) |
| 15 to 19 Minutes | 10 (17.9%) | 9 (12.5%) |
| 20 to 24 Minutes | 2 (3.6%) | 8 (11.1%) |
| 25 to 29 Minutes | 1 (1.8%) | 5 (6.9%) |
| 30 to 34 Minutes | 7 (12.5%) | 6 (8.3%) |
| 35 to 39 Minutes | 2 (3.6%) | 0 (0.0%) |
| 40 to 44 Minutes | 1 (1.8%) | 5 (6.9%) |
| 45 to 59 Minutes | 2 (3.6%) | 3 (4.2%) |
| 60 to 89 Minutes | 3 (5.4%) | 0 (0.0%) |
| 90 or more Minutes | 4 (7.1%) | 1 (1.4%) |
Time of Departure to Work by Sex in Boyne Falls
The most frequent times of departure to work in Boyne Falls are 7:00 AM to 7:29 AM (18, 32.1%) for males and 6:30 AM to 6:59 AM (15, 20.8%) for females.
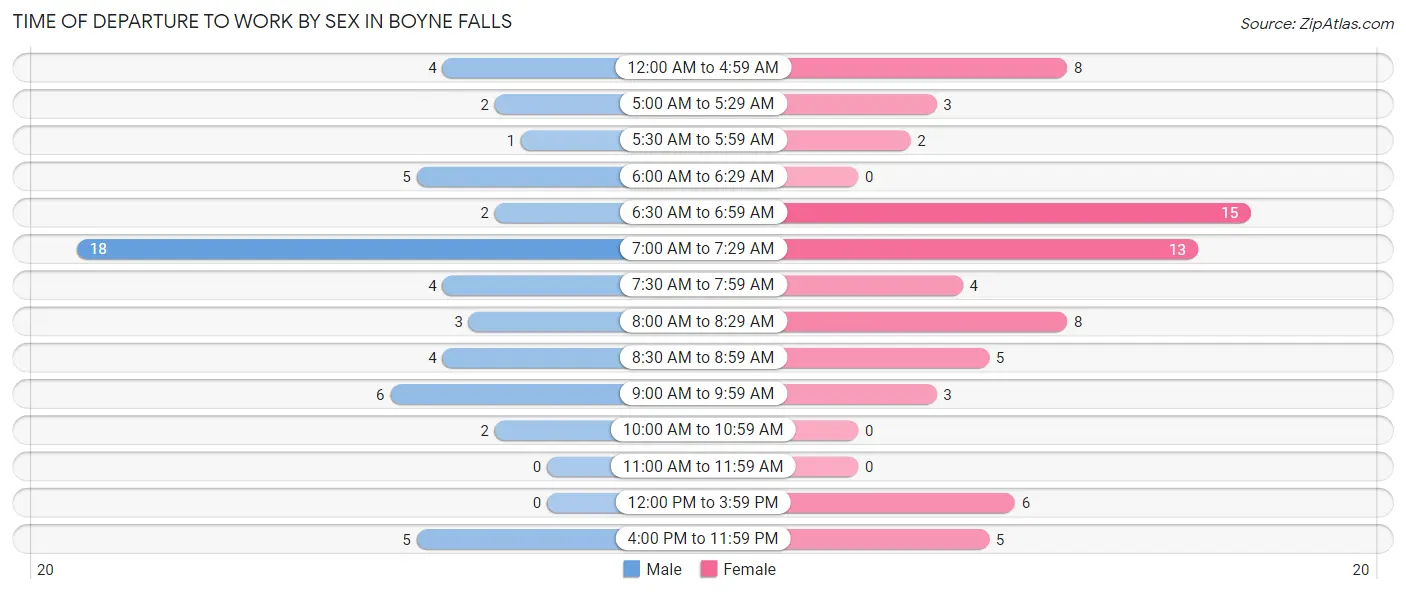
| Time of Departure | Male | Female |
| 12:00 AM to 4:59 AM | 4 (7.1%) | 8 (11.1%) |
| 5:00 AM to 5:29 AM | 2 (3.6%) | 3 (4.2%) |
| 5:30 AM to 5:59 AM | 1 (1.8%) | 2 (2.8%) |
| 6:00 AM to 6:29 AM | 5 (8.9%) | 0 (0.0%) |
| 6:30 AM to 6:59 AM | 2 (3.6%) | 15 (20.8%) |
| 7:00 AM to 7:29 AM | 18 (32.1%) | 13 (18.1%) |
| 7:30 AM to 7:59 AM | 4 (7.1%) | 4 (5.6%) |
| 8:00 AM to 8:29 AM | 3 (5.4%) | 8 (11.1%) |
| 8:30 AM to 8:59 AM | 4 (7.1%) | 5 (6.9%) |
| 9:00 AM to 9:59 AM | 6 (10.7%) | 3 (4.2%) |
| 10:00 AM to 10:59 AM | 2 (3.6%) | 0 (0.0%) |
| 11:00 AM to 11:59 AM | 0 (0.0%) | 0 (0.0%) |
| 12:00 PM to 3:59 PM | 0 (0.0%) | 6 (8.3%) |
| 4:00 PM to 11:59 PM | 5 (8.9%) | 5 (6.9%) |
| Total | 56 (100.0%) | 72 (100.0%) |
Housing Occupancy in Boyne Falls
Occupancy by Ownership in Boyne Falls
Of the total 176 dwellings in Boyne Falls, owner-occupied units account for 128 (72.7%), while renter-occupied units make up 48 (27.3%).
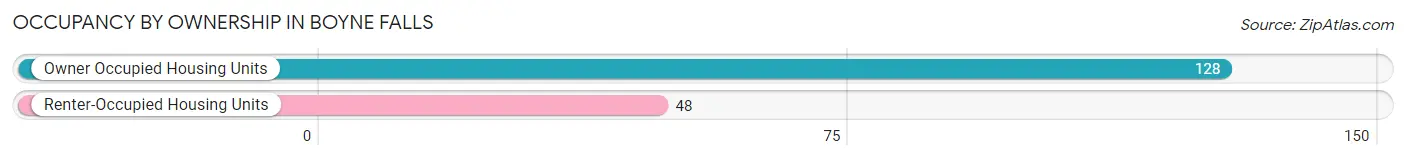
| Occupancy | # Housing Units | % Housing Units |
| Owner Occupied Housing Units | 128 | 72.7% |
| Renter-Occupied Housing Units | 48 | 27.3% |
| Total Occupied Housing Units | 176 | 100.0% |
Occupancy by Household Size in Boyne Falls
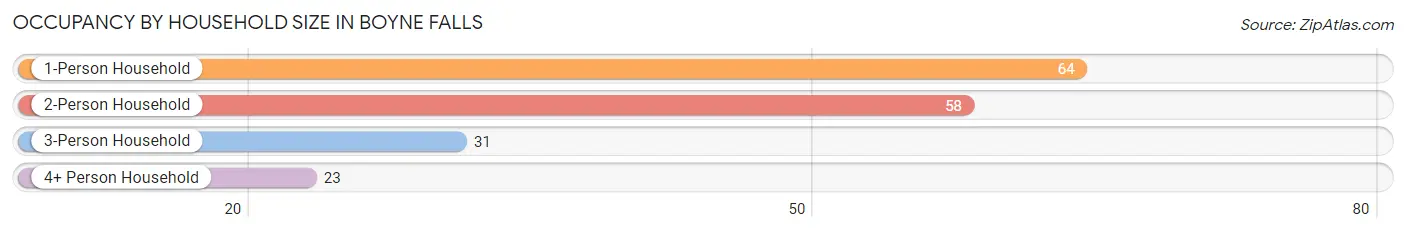
| Household Size | # Housing Units | % Housing Units |
| 1-Person Household | 64 | 36.4% |
| 2-Person Household | 58 | 33.0% |
| 3-Person Household | 31 | 17.6% |
| 4+ Person Household | 23 | 13.1% |
| Total Housing Units | 176 | 100.0% |
Occupancy by Ownership by Household Size in Boyne Falls
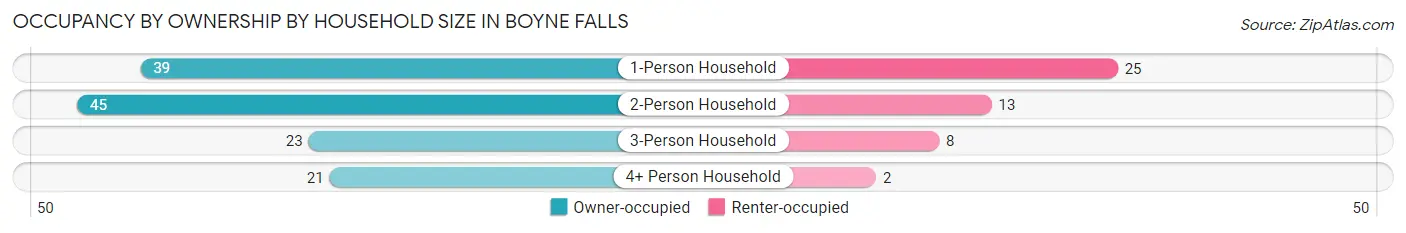
| Household Size | Owner-occupied | Renter-occupied |
| 1-Person Household | 39 (60.9%) | 25 (39.1%) |
| 2-Person Household | 45 (77.6%) | 13 (22.4%) |
| 3-Person Household | 23 (74.2%) | 8 (25.8%) |
| 4+ Person Household | 21 (91.3%) | 2 (8.7%) |
| Total Housing Units | 128 (72.7%) | 48 (27.3%) |
Occupancy by Educational Attainment in Boyne Falls
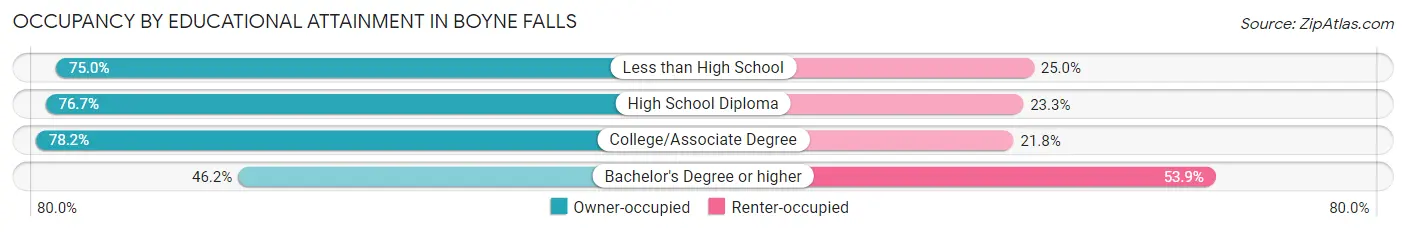
| Household Size | Owner-occupied | Renter-occupied |
| Less than High School | 9 (75.0%) | 3 (25.0%) |
| High School Diploma | 46 (76.7%) | 14 (23.3%) |
| College/Associate Degree | 61 (78.2%) | 17 (21.8%) |
| Bachelor's Degree or higher | 12 (46.2%) | 14 (53.8%) |
Occupancy by Age of Householder in Boyne Falls
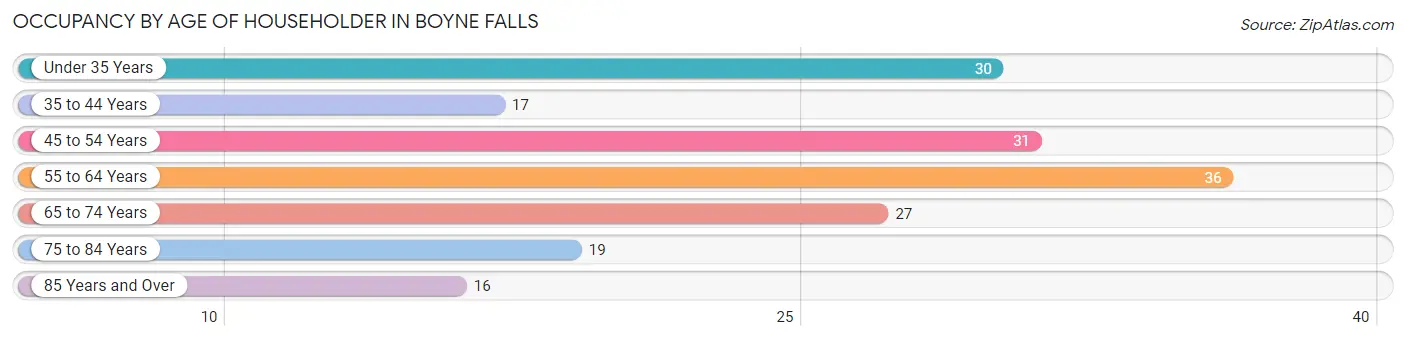
| Age Bracket | # Households | % Households |
| Under 35 Years | 30 | 17.1% |
| 35 to 44 Years | 17 | 9.7% |
| 45 to 54 Years | 31 | 17.6% |
| 55 to 64 Years | 36 | 20.4% |
| 65 to 74 Years | 27 | 15.3% |
| 75 to 84 Years | 19 | 10.8% |
| 85 Years and Over | 16 | 9.1% |
| Total | 176 | 100.0% |
Housing Finances in Boyne Falls
Median Income by Occupancy in Boyne Falls
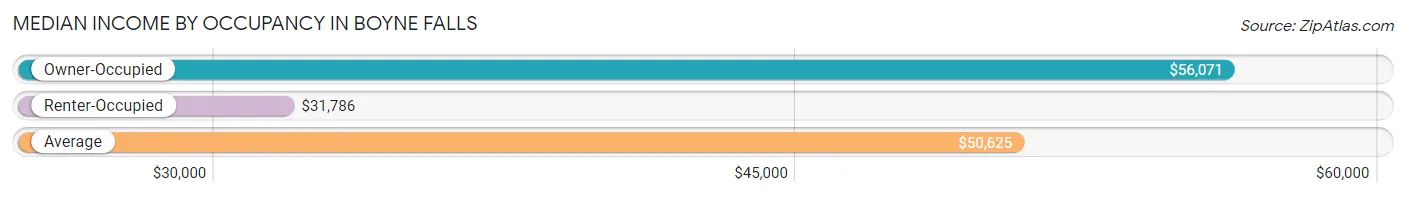
| Occupancy Type | # Households | Median Income |
| Owner-Occupied | 128 (72.7%) | $56,071 |
| Renter-Occupied | 48 (27.3%) | $31,786 |
| Average | 176 (100.0%) | $50,625 |
Occupancy by Householder Income Bracket in Boyne Falls
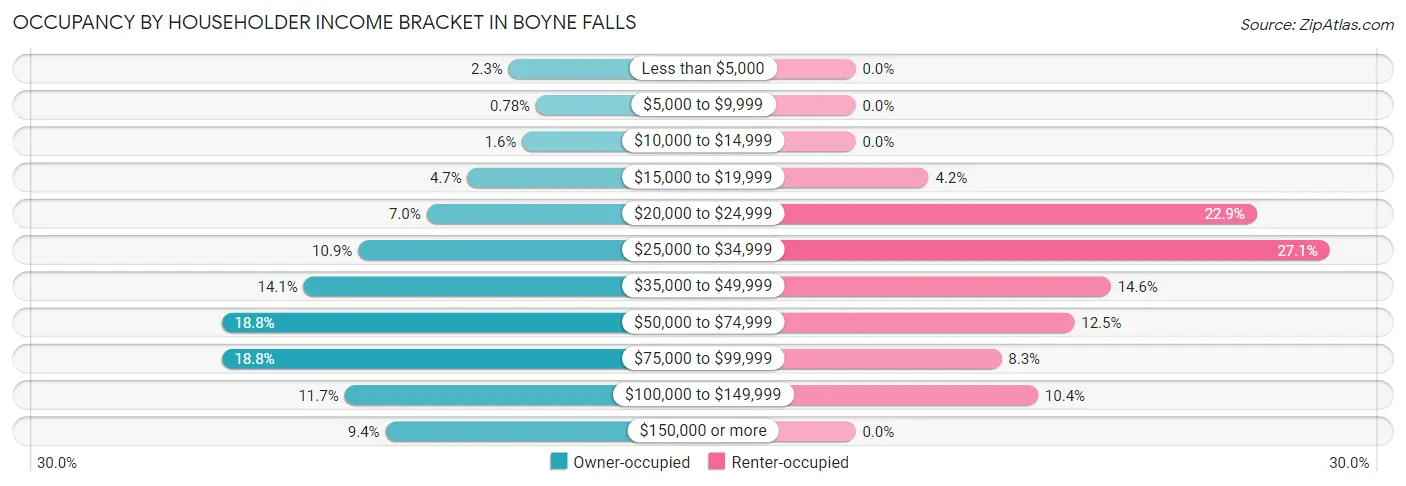
| Income Bracket | Owner-occupied | Renter-occupied |
| Less than $5,000 | 3 (2.3%) | 0 (0.0%) |
| $5,000 to $9,999 | 1 (0.8%) | 0 (0.0%) |
| $10,000 to $14,999 | 2 (1.6%) | 0 (0.0%) |
| $15,000 to $19,999 | 6 (4.7%) | 2 (4.2%) |
| $20,000 to $24,999 | 9 (7.0%) | 11 (22.9%) |
| $25,000 to $34,999 | 14 (10.9%) | 13 (27.1%) |
| $35,000 to $49,999 | 18 (14.1%) | 7 (14.6%) |
| $50,000 to $74,999 | 24 (18.8%) | 6 (12.5%) |
| $75,000 to $99,999 | 24 (18.8%) | 4 (8.3%) |
| $100,000 to $149,999 | 15 (11.7%) | 5 (10.4%) |
| $150,000 or more | 12 (9.4%) | 0 (0.0%) |
| Total | 128 (100.0%) | 48 (100.0%) |
Monthly Housing Cost Tiers in Boyne Falls
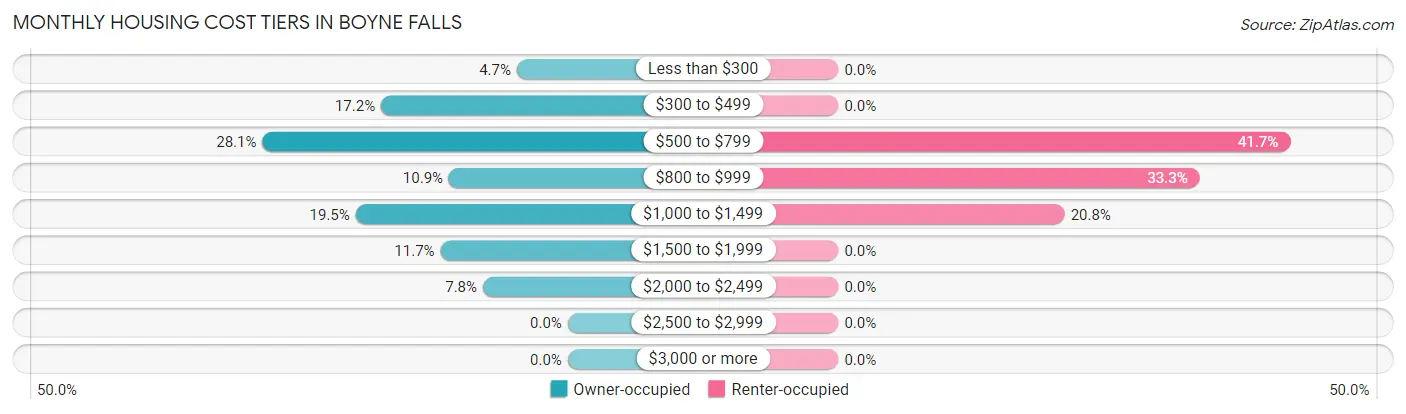
| Monthly Cost | Owner-occupied | Renter-occupied |
| Less than $300 | 6 (4.7%) | 0 (0.0%) |
| $300 to $499 | 22 (17.2%) | 0 (0.0%) |
| $500 to $799 | 36 (28.1%) | 20 (41.7%) |
| $800 to $999 | 14 (10.9%) | 16 (33.3%) |
| $1,000 to $1,499 | 25 (19.5%) | 10 (20.8%) |
| $1,500 to $1,999 | 15 (11.7%) | 0 (0.0%) |
| $2,000 to $2,499 | 10 (7.8%) | 0 (0.0%) |
| $2,500 to $2,999 | 0 (0.0%) | 0 (0.0%) |
| $3,000 or more | 0 (0.0%) | 0 (0.0%) |
| Total | 128 (100.0%) | 48 (100.0%) |
Physical Housing Characteristics in Boyne Falls
Housing Structures in Boyne Falls
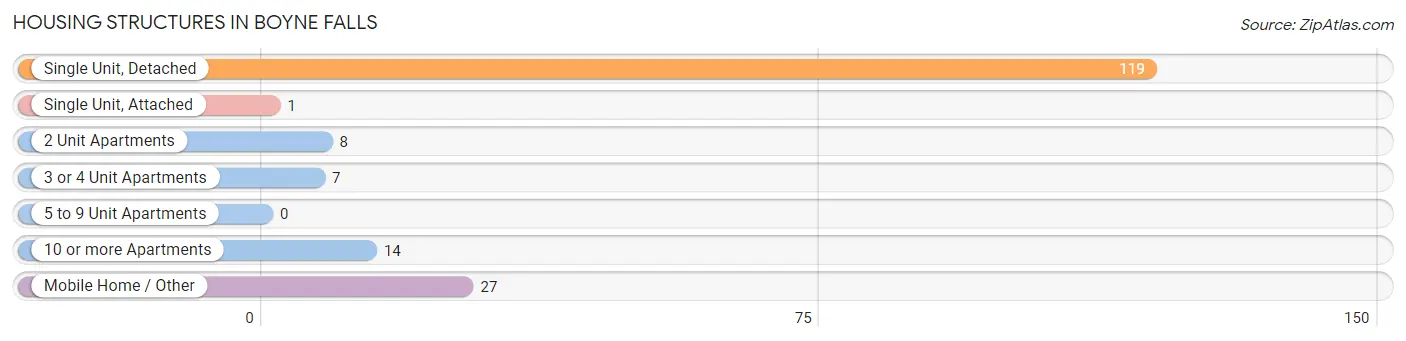
| Structure Type | # Housing Units | % Housing Units |
| Single Unit, Detached | 119 | 67.6% |
| Single Unit, Attached | 1 | 0.6% |
| 2 Unit Apartments | 8 | 4.5% |
| 3 or 4 Unit Apartments | 7 | 4.0% |
| 5 to 9 Unit Apartments | 0 | 0.0% |
| 10 or more Apartments | 14 | 8.0% |
| Mobile Home / Other | 27 | 15.3% |
| Total | 176 | 100.0% |
Housing Structures by Occupancy in Boyne Falls
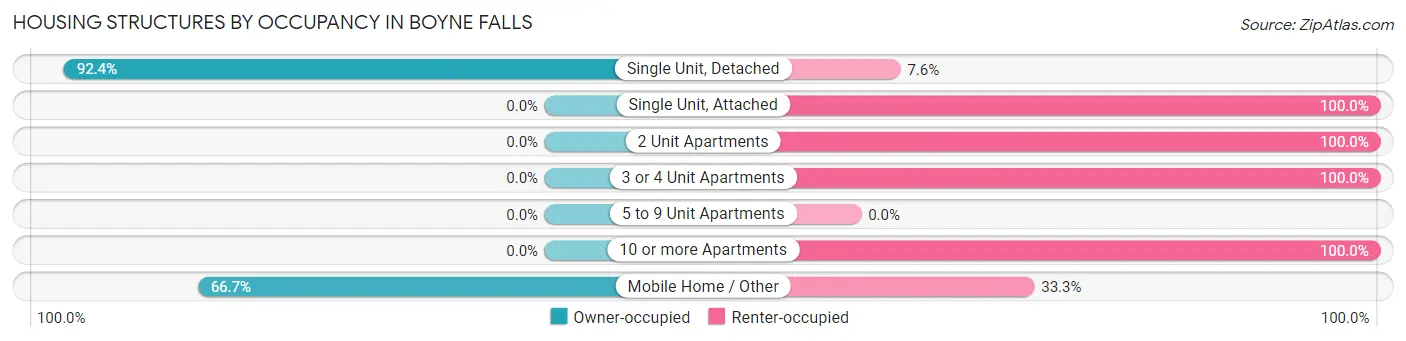
| Structure Type | Owner-occupied | Renter-occupied |
| Single Unit, Detached | 110 (92.4%) | 9 (7.6%) |
| Single Unit, Attached | 0 (0.0%) | 1 (100.0%) |
| 2 Unit Apartments | 0 (0.0%) | 8 (100.0%) |
| 3 or 4 Unit Apartments | 0 (0.0%) | 7 (100.0%) |
| 5 to 9 Unit Apartments | 0 (0.0%) | 0 (0.0%) |
| 10 or more Apartments | 0 (0.0%) | 14 (100.0%) |
| Mobile Home / Other | 18 (66.7%) | 9 (33.3%) |
| Total | 128 (72.7%) | 48 (27.3%) |
Housing Structures by Number of Rooms in Boyne Falls
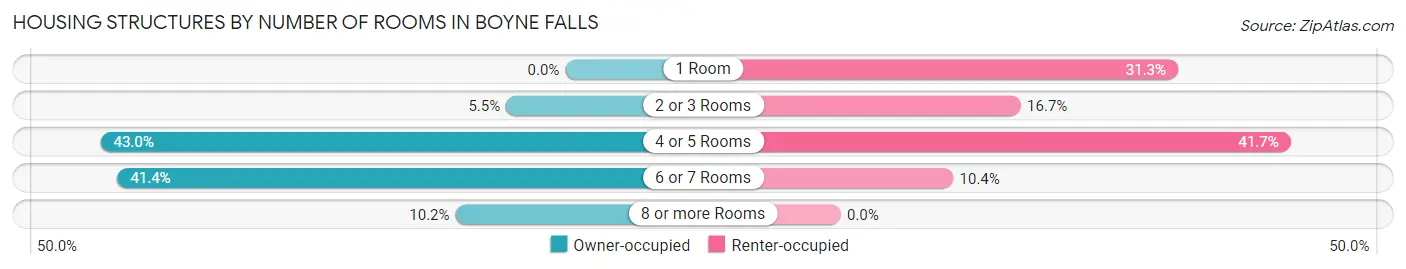
| Number of Rooms | Owner-occupied | Renter-occupied |
| 1 Room | 0 (0.0%) | 15 (31.2%) |
| 2 or 3 Rooms | 7 (5.5%) | 8 (16.7%) |
| 4 or 5 Rooms | 55 (43.0%) | 20 (41.7%) |
| 6 or 7 Rooms | 53 (41.4%) | 5 (10.4%) |
| 8 or more Rooms | 13 (10.2%) | 0 (0.0%) |
| Total | 128 (100.0%) | 48 (100.0%) |
Housing Structure by Heating Type in Boyne Falls
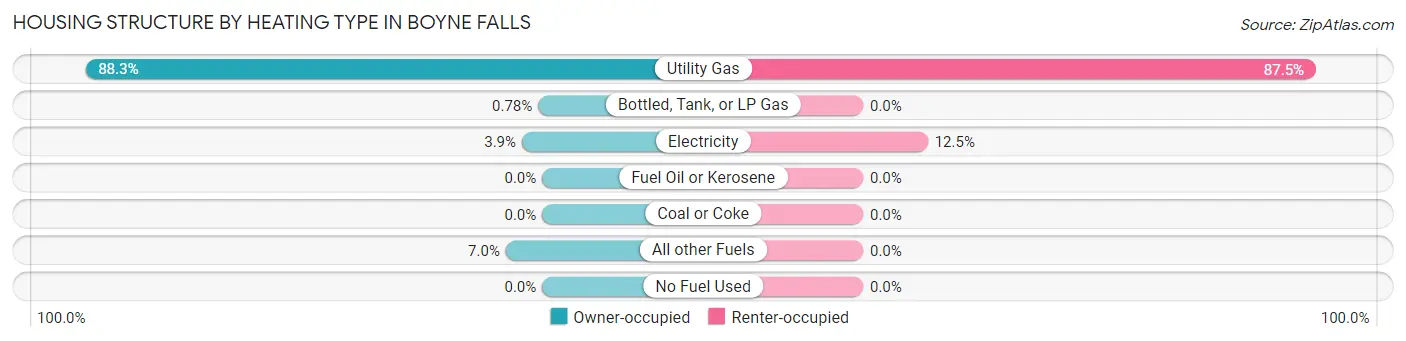
| Heating Type | Owner-occupied | Renter-occupied |
| Utility Gas | 113 (88.3%) | 42 (87.5%) |
| Bottled, Tank, or LP Gas | 1 (0.8%) | 0 (0.0%) |
| Electricity | 5 (3.9%) | 6 (12.5%) |
| Fuel Oil or Kerosene | 0 (0.0%) | 0 (0.0%) |
| Coal or Coke | 0 (0.0%) | 0 (0.0%) |
| All other Fuels | 9 (7.0%) | 0 (0.0%) |
| No Fuel Used | 0 (0.0%) | 0 (0.0%) |
| Total | 128 (100.0%) | 48 (100.0%) |
Household Vehicle Usage in Boyne Falls
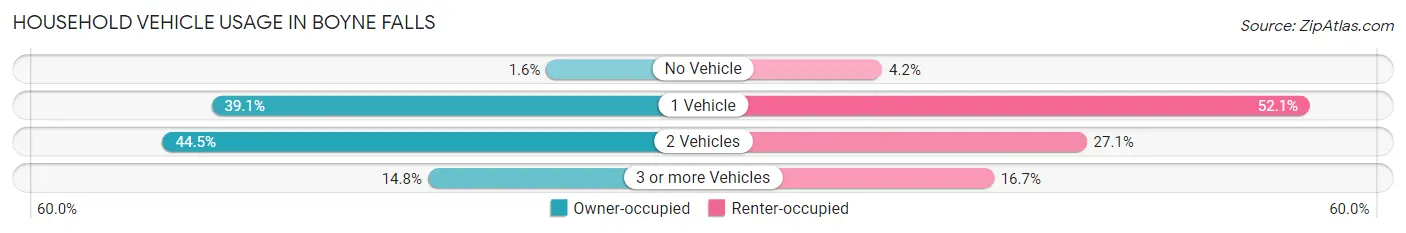
| Vehicles per Household | Owner-occupied | Renter-occupied |
| No Vehicle | 2 (1.6%) | 2 (4.2%) |
| 1 Vehicle | 50 (39.1%) | 25 (52.1%) |
| 2 Vehicles | 57 (44.5%) | 13 (27.1%) |
| 3 or more Vehicles | 19 (14.8%) | 8 (16.7%) |
| Total | 128 (100.0%) | 48 (100.0%) |
Real Estate & Mortgages in Boyne Falls
Real Estate and Mortgage Overview in Boyne Falls
| Characteristic | Without Mortgage | With Mortgage |
| Housing Units | 59 | 69 |
| Median Property Value | $109,400 | $172,300 |
| Median Household Income | $51,875 | $12 |
| Monthly Housing Costs | $530 | $0 |
| Real Estate Taxes | $2,313 | $7 |
Property Value by Mortgage Status in Boyne Falls
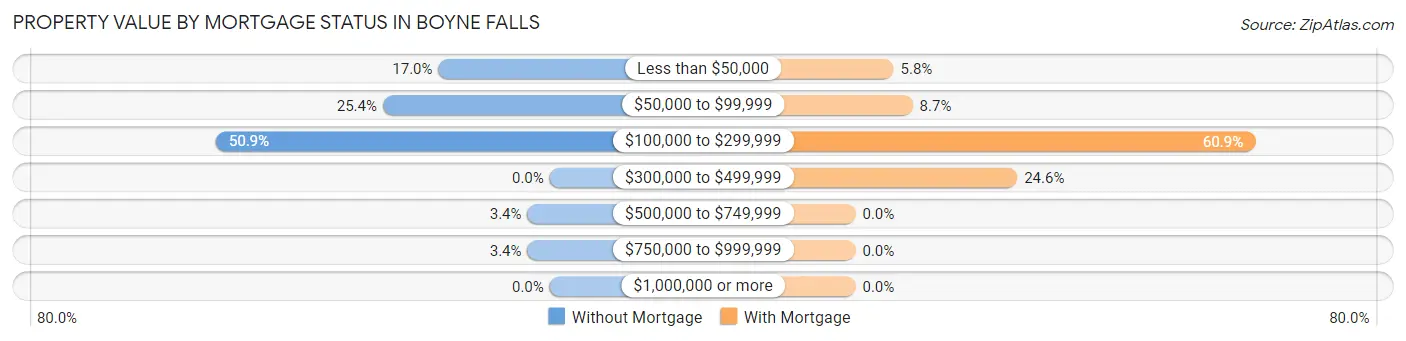
| Property Value | Without Mortgage | With Mortgage |
| Less than $50,000 | 10 (17.0%) | 4 (5.8%) |
| $50,000 to $99,999 | 15 (25.4%) | 6 (8.7%) |
| $100,000 to $299,999 | 30 (50.8%) | 42 (60.9%) |
| $300,000 to $499,999 | 0 (0.0%) | 17 (24.6%) |
| $500,000 to $749,999 | 2 (3.4%) | 0 (0.0%) |
| $750,000 to $999,999 | 2 (3.4%) | 0 (0.0%) |
| $1,000,000 or more | 0 (0.0%) | 0 (0.0%) |
| Total | 59 (100.0%) | 69 (100.0%) |
Household Income by Mortgage Status in Boyne Falls
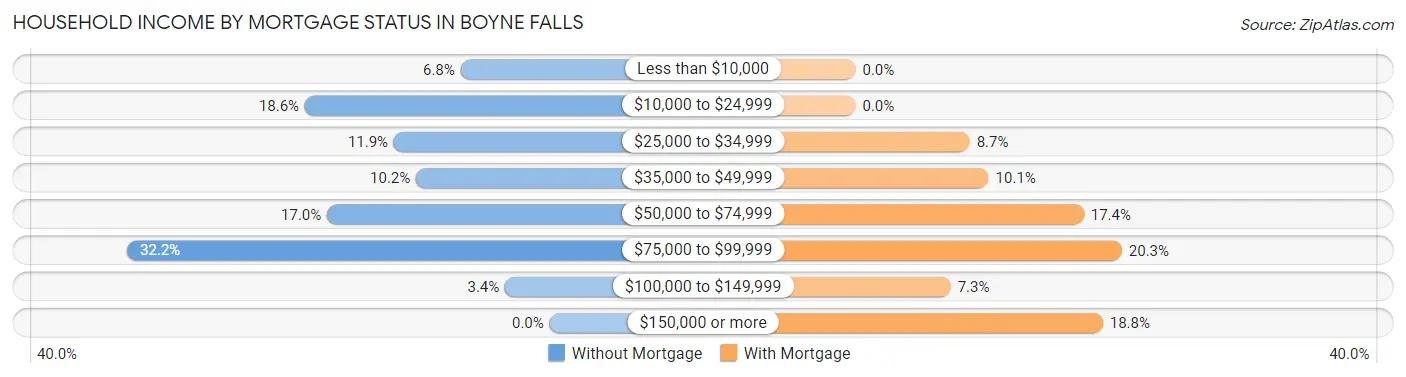
| Household Income | Without Mortgage | With Mortgage |
| Less than $10,000 | 4 (6.8%) | 0 (0.0%) |
| $10,000 to $24,999 | 11 (18.6%) | 0 (0.0%) |
| $25,000 to $34,999 | 7 (11.9%) | 6 (8.7%) |
| $35,000 to $49,999 | 6 (10.2%) | 7 (10.1%) |
| $50,000 to $74,999 | 10 (17.0%) | 12 (17.4%) |
| $75,000 to $99,999 | 19 (32.2%) | 14 (20.3%) |
| $100,000 to $149,999 | 2 (3.4%) | 5 (7.2%) |
| $150,000 or more | 0 (0.0%) | 13 (18.8%) |
| Total | 59 (100.0%) | 69 (100.0%) |
Property Value to Household Income Ratio in Boyne Falls
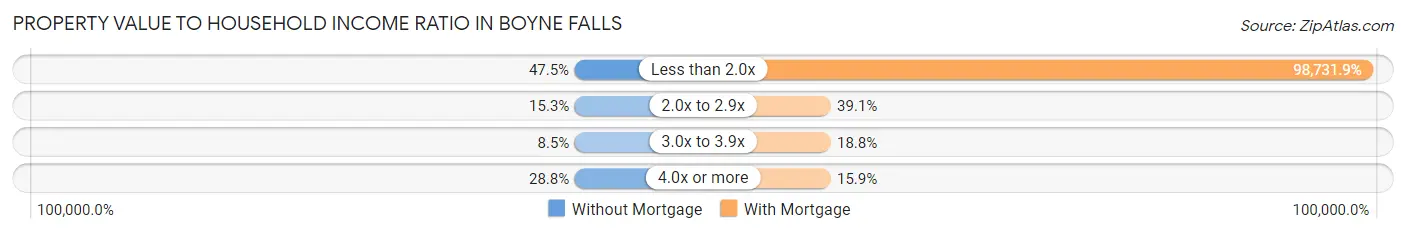
| Value-to-Income Ratio | Without Mortgage | With Mortgage |
| Less than 2.0x | 28 (47.5%) | 68,125 (98,731.9%) |
| 2.0x to 2.9x | 9 (15.2%) | 27 (39.1%) |
| 3.0x to 3.9x | 5 (8.5%) | 13 (18.8%) |
| 4.0x or more | 17 (28.8%) | 11 (15.9%) |
| Total | 59 (100.0%) | 69 (100.0%) |
Real Estate Taxes by Mortgage Status in Boyne Falls
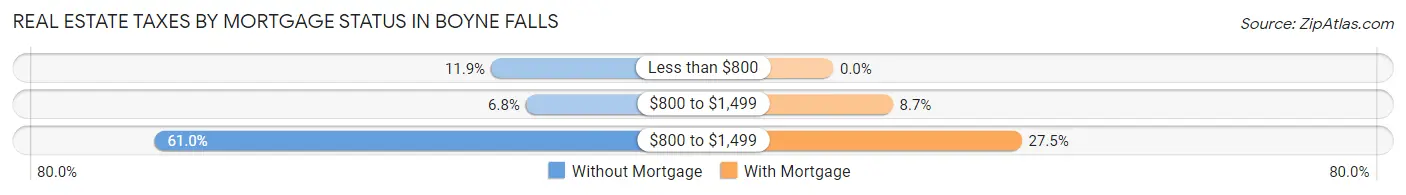
| Property Taxes | Without Mortgage | With Mortgage |
| Less than $800 | 7 (11.9%) | 0 (0.0%) |
| $800 to $1,499 | 4 (6.8%) | 6 (8.7%) |
| $800 to $1,499 | 36 (61.0%) | 19 (27.5%) |
| Total | 59 (100.0%) | 69 (100.0%) |
Health & Disability in Boyne Falls
Health Insurance Coverage by Age in Boyne Falls
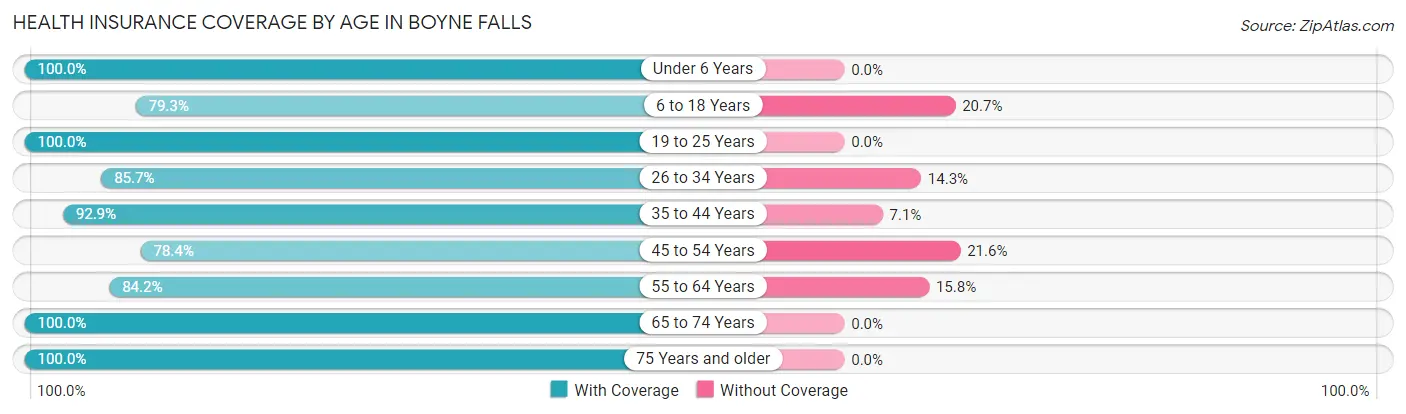
| Age Bracket | With Coverage | Without Coverage |
| Under 6 Years | 38 (100.0%) | 0 (0.0%) |
| 6 to 18 Years | 23 (79.3%) | 6 (20.7%) |
| 19 to 25 Years | 22 (100.0%) | 0 (0.0%) |
| 26 to 34 Years | 42 (85.7%) | 7 (14.3%) |
| 35 to 44 Years | 26 (92.9%) | 2 (7.1%) |
| 45 to 54 Years | 29 (78.4%) | 8 (21.6%) |
| 55 to 64 Years | 48 (84.2%) | 9 (15.8%) |
| 65 to 74 Years | 40 (100.0%) | 0 (0.0%) |
| 75 Years and older | 41 (100.0%) | 0 (0.0%) |
| Total | 309 (90.6%) | 32 (9.4%) |
Health Insurance Coverage by Citizenship Status in Boyne Falls
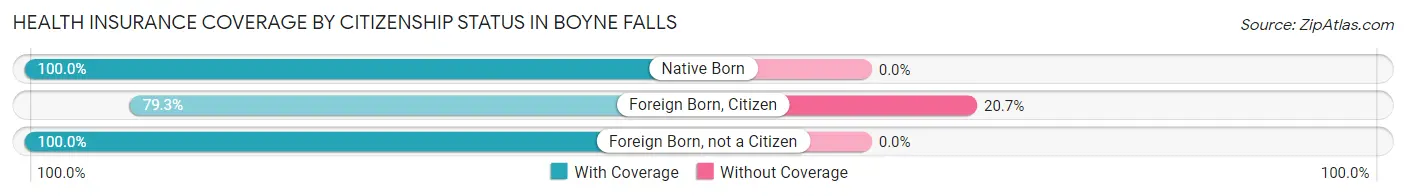
| Citizenship Status | With Coverage | Without Coverage |
| Native Born | 38 (100.0%) | 0 (0.0%) |
| Foreign Born, Citizen | 23 (79.3%) | 6 (20.7%) |
| Foreign Born, not a Citizen | 22 (100.0%) | 0 (0.0%) |
Health Insurance Coverage by Household Income in Boyne Falls
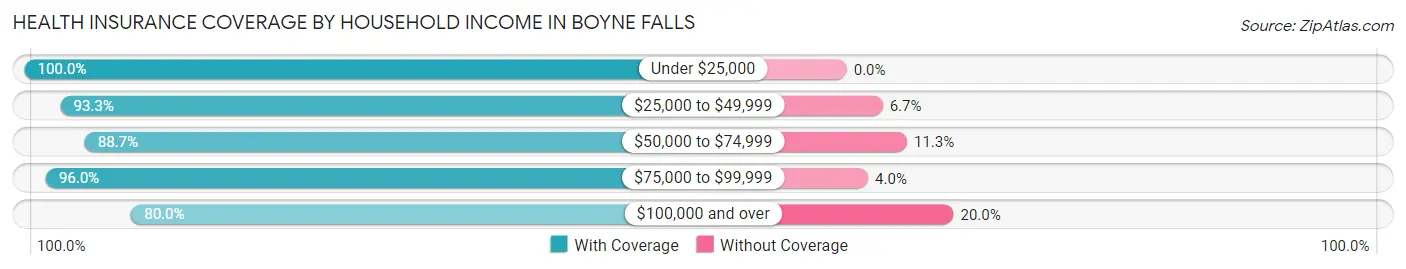
| Household Income | With Coverage | Without Coverage |
| Under $25,000 | 45 (100.0%) | 0 (0.0%) |
| $25,000 to $49,999 | 97 (93.3%) | 7 (6.7%) |
| $50,000 to $74,999 | 55 (88.7%) | 7 (11.3%) |
| $75,000 to $99,999 | 48 (96.0%) | 2 (4.0%) |
| $100,000 and over | 64 (80.0%) | 16 (20.0%) |
Public vs Private Health Insurance Coverage by Age in Boyne Falls
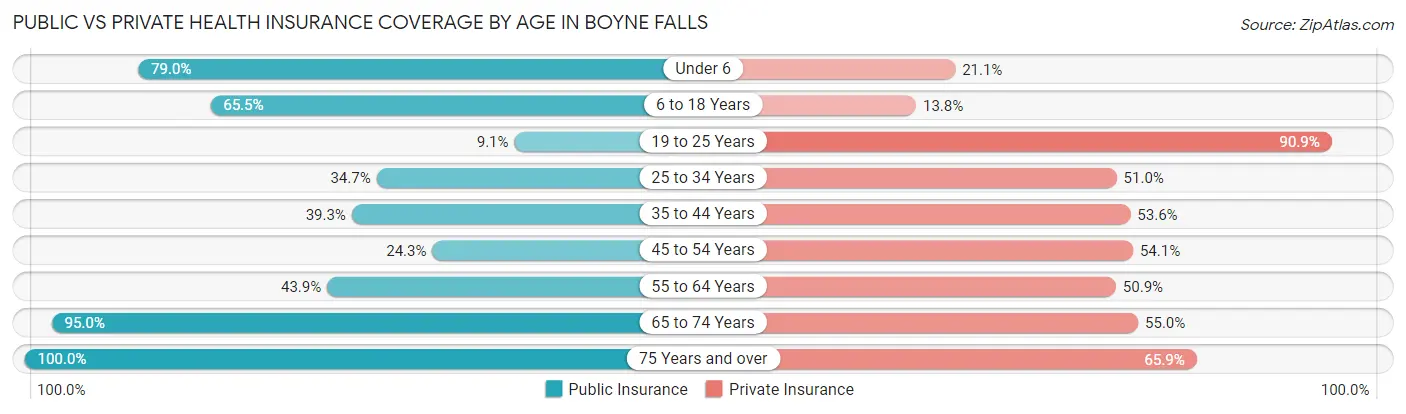
| Age Bracket | Public Insurance | Private Insurance |
| Under 6 | 30 (78.9%) | 8 (21.0%) |
| 6 to 18 Years | 19 (65.5%) | 4 (13.8%) |
| 19 to 25 Years | 2 (9.1%) | 20 (90.9%) |
| 25 to 34 Years | 17 (34.7%) | 25 (51.0%) |
| 35 to 44 Years | 11 (39.3%) | 15 (53.6%) |
| 45 to 54 Years | 9 (24.3%) | 20 (54.0%) |
| 55 to 64 Years | 25 (43.9%) | 29 (50.9%) |
| 65 to 74 Years | 38 (95.0%) | 22 (55.0%) |
| 75 Years and over | 41 (100.0%) | 27 (65.8%) |
| Total | 192 (56.3%) | 170 (49.8%) |
Disability Status by Sex by Age in Boyne Falls
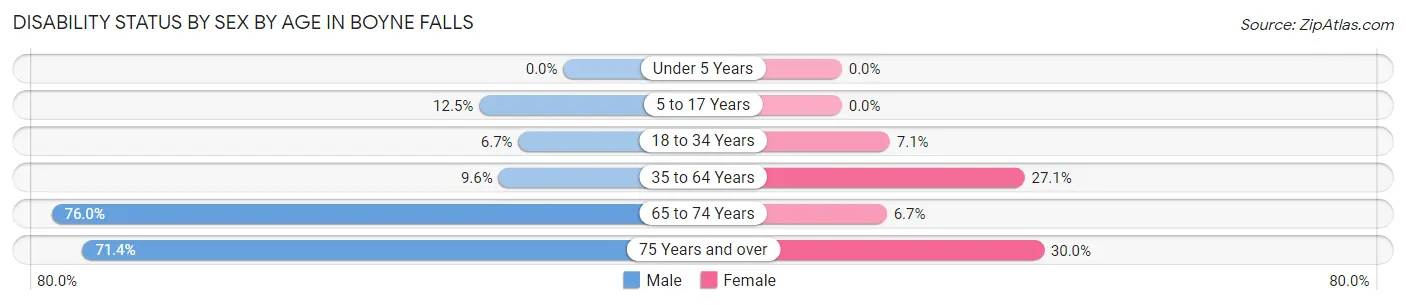
| Age Bracket | Male | Female |
| Under 5 Years | 0 (0.0%) | 0 (0.0%) |
| 5 to 17 Years | 2 (12.5%) | 0 (0.0%) |
| 18 to 34 Years | 2 (6.7%) | 3 (7.1%) |
| 35 to 64 Years | 5 (9.6%) | 19 (27.1%) |
| 65 to 74 Years | 19 (76.0%) | 1 (6.7%) |
| 75 Years and over | 15 (71.4%) | 6 (30.0%) |
Disability Class by Sex by Age in Boyne Falls
Disability Class: Hearing Difficulty
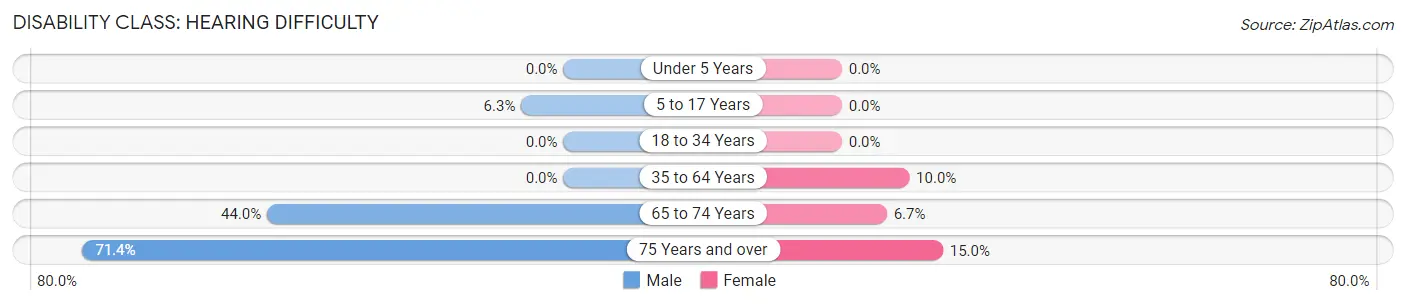
| Age Bracket | Male | Female |
| Under 5 Years | 0 (0.0%) | 0 (0.0%) |
| 5 to 17 Years | 1 (6.2%) | 0 (0.0%) |
| 18 to 34 Years | 0 (0.0%) | 0 (0.0%) |
| 35 to 64 Years | 0 (0.0%) | 7 (10.0%) |
| 65 to 74 Years | 11 (44.0%) | 1 (6.7%) |
| 75 Years and over | 15 (71.4%) | 3 (15.0%) |
Disability Class: Vision Difficulty
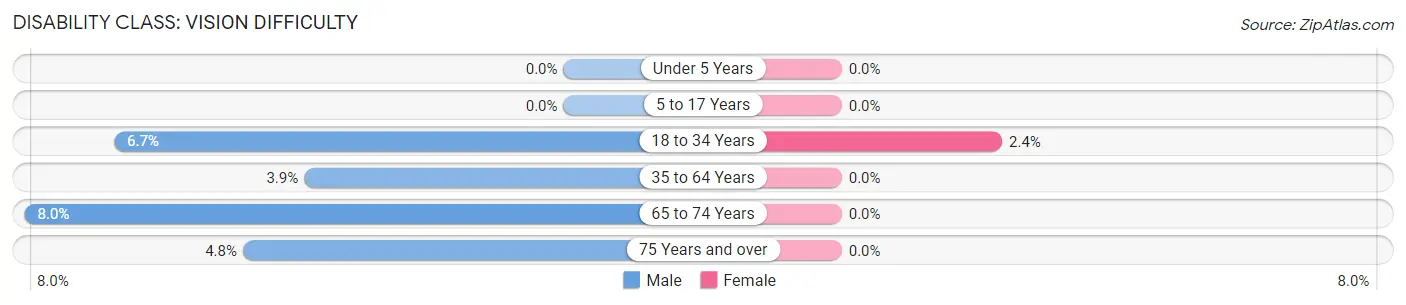
| Age Bracket | Male | Female |
| Under 5 Years | 0 (0.0%) | 0 (0.0%) |
| 5 to 17 Years | 0 (0.0%) | 0 (0.0%) |
| 18 to 34 Years | 2 (6.7%) | 1 (2.4%) |
| 35 to 64 Years | 2 (3.8%) | 0 (0.0%) |
| 65 to 74 Years | 2 (8.0%) | 0 (0.0%) |
| 75 Years and over | 1 (4.8%) | 0 (0.0%) |
Disability Class: Cognitive Difficulty
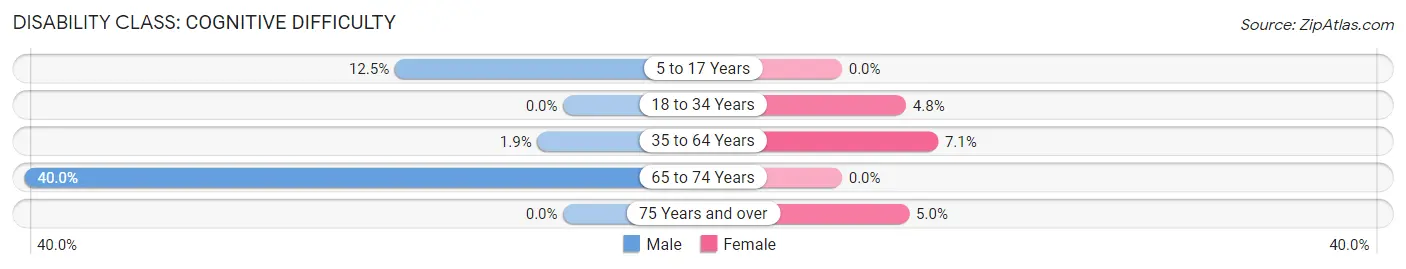
| Age Bracket | Male | Female |
| 5 to 17 Years | 2 (12.5%) | 0 (0.0%) |
| 18 to 34 Years | 0 (0.0%) | 2 (4.8%) |
| 35 to 64 Years | 1 (1.9%) | 5 (7.1%) |
| 65 to 74 Years | 10 (40.0%) | 0 (0.0%) |
| 75 Years and over | 0 (0.0%) | 1 (5.0%) |
Disability Class: Ambulatory Difficulty
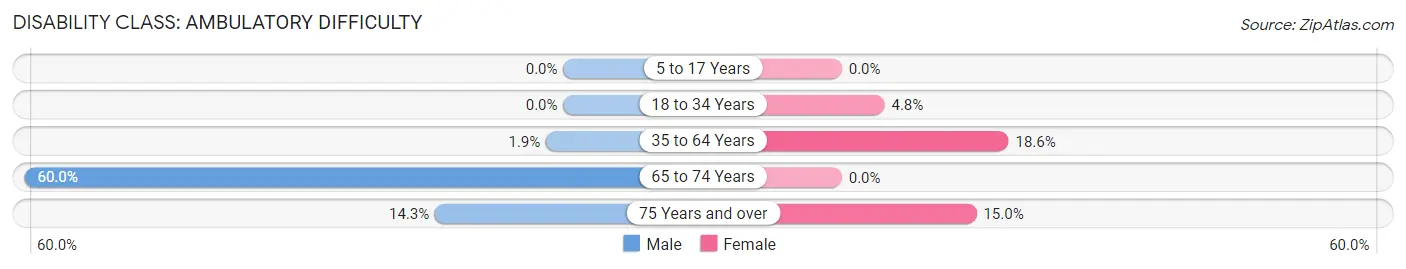
| Age Bracket | Male | Female |
| 5 to 17 Years | 0 (0.0%) | 0 (0.0%) |
| 18 to 34 Years | 0 (0.0%) | 2 (4.8%) |
| 35 to 64 Years | 1 (1.9%) | 13 (18.6%) |
| 65 to 74 Years | 15 (60.0%) | 0 (0.0%) |
| 75 Years and over | 3 (14.3%) | 3 (15.0%) |
Disability Class: Self-Care Difficulty
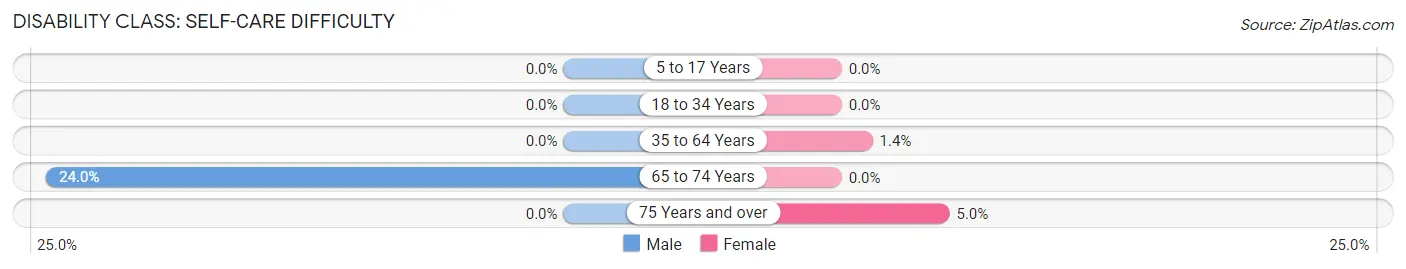
| Age Bracket | Male | Female |
| 5 to 17 Years | 0 (0.0%) | 0 (0.0%) |
| 18 to 34 Years | 0 (0.0%) | 0 (0.0%) |
| 35 to 64 Years | 0 (0.0%) | 1 (1.4%) |
| 65 to 74 Years | 6 (24.0%) | 0 (0.0%) |
| 75 Years and over | 0 (0.0%) | 1 (5.0%) |
Technology Access in Boyne Falls
Computing Device Access in Boyne Falls
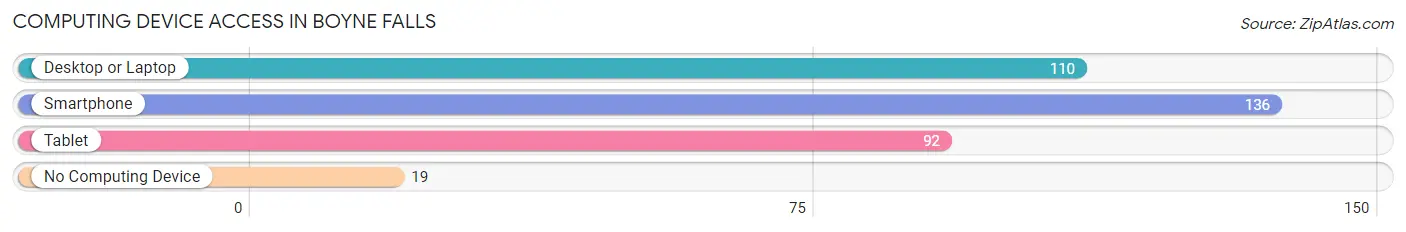
| Device Type | # Households | % Households |
| Desktop or Laptop | 110 | 62.5% |
| Smartphone | 136 | 77.3% |
| Tablet | 92 | 52.3% |
| No Computing Device | 19 | 10.8% |
| Total | 176 | 100.0% |
Internet Access in Boyne Falls
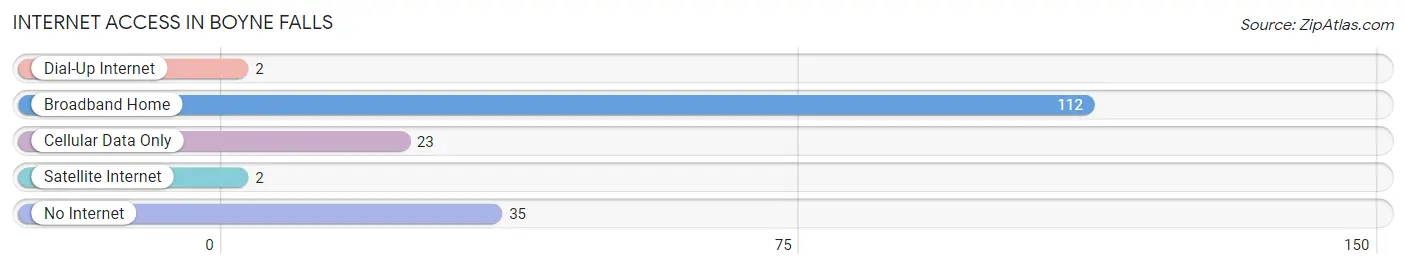
| Internet Type | # Households | % Households |
| Dial-Up Internet | 2 | 1.1% |
| Broadband Home | 112 | 63.6% |
| Cellular Data Only | 23 | 13.1% |
| Satellite Internet | 2 | 1.1% |
| No Internet | 35 | 19.9% |
| Total | 176 | 100.0% |
Boyne Falls Summary
Boyne Falls is a small unincorporated community located in Charlevoix County, Michigan. It is situated on the banks of the Boyne River, which flows through the area. The community is located approximately 10 miles east of Charlevoix and about 20 miles northwest of Petoskey. The population of Boyne Falls was estimated to be 545 in 2019.
History
Boyne Falls was first settled in 1871 by a group of lumberjacks from Canada. The lumberjacks were attracted to the area by the abundance of white pine trees in the area. The lumberjacks built a sawmill and a gristmill, which were the first businesses in the area. The lumberjacks also built a hotel and a general store.
The community was named after the Boyne River, which was named after the Battle of the Boyne, which took place in Ireland in 1690. The battle was between the forces of William of Orange and James II.
In 1876, the first post office was established in Boyne Falls. The community was incorporated as a village in 1891.
Geography
Boyne Falls is located in the northwest corner of Charlevoix County, Michigan. It is situated on the banks of the Boyne River, which flows through the area. The community is located approximately 10 miles east of Charlevoix and about 20 miles northwest of Petoskey.
The terrain of the area is mostly flat, with some rolling hills. The area is heavily forested, with a mix of hardwood and coniferous trees. The climate of the area is humid continental, with cold winters and warm summers.
Economy
The economy of Boyne Falls is largely based on tourism. The area is home to several resorts, including Boyne Mountain Resort and Boyne Highlands Resort. The resorts offer skiing, snowboarding, golf, and other recreational activities.
The area is also home to several small businesses, including restaurants, shops, and galleries. The community is also home to several manufacturing companies, including Boyne Machine Company and Boyne Plastics.
Demographics
As of 2019, the population of Boyne Falls was estimated to be 545. The racial makeup of the community was 97.3% White, 0.7% African American, 0.4% Native American, 0.2% Asian, and 1.4% from other races.
The median household income in Boyne Falls was $41,250 in 2019. The median home value was $127,400. The median age of the population was 44.7 years.
Conclusion
Boyne Falls is a small unincorporated community located in Charlevoix County, Michigan. It is situated on the banks of the Boyne River, which flows through the area. The community was first settled in 1871 by a group of lumberjacks from Canada. The economy of Boyne Falls is largely based on tourism, with several resorts and small businesses in the area. The population of Boyne Falls was estimated to be 545 in 2019. The median household income in Boyne Falls was $41,250 in 2019.
Common Questions
What is Per Capita Income in Boyne Falls?
Per Capita income in Boyne Falls is $30,645.
What is the Median Family Income in Boyne Falls?
Median Family Income in Boyne Falls is $45,625.
What is the Median Household income in Boyne Falls?
Median Household Income in Boyne Falls is $50,625.
What is Income or Wage Gap in Boyne Falls?
Income or Wage Gap in Boyne Falls is 1.6%.
Women in Boyne Falls earn 98.4 cents for every dollar earned by a man.
What is Inequality or Gini Index in Boyne Falls?
Inequality or Gini Index in Boyne Falls is 0.40.
What is the Total Population of Boyne Falls?
Total Population of Boyne Falls is 341.
What is the Total Male Population of Boyne Falls?
Total Male Population of Boyne Falls is 167.
What is the Total Female Population of Boyne Falls?
Total Female Population of Boyne Falls is 174.
What is the Ratio of Males per 100 Females in Boyne Falls?
There are 95.98 Males per 100 Females in Boyne Falls.
What is the Ratio of Females per 100 Males in Boyne Falls?
There are 104.19 Females per 100 Males in Boyne Falls.
What is the Median Population Age in Boyne Falls?
Median Population Age in Boyne Falls is 46.4 Years.
What is the Average Family Size in Boyne Falls
Average Family Size in Boyne Falls is 2.6 People.
What is the Average Household Size in Boyne Falls
Average Household Size in Boyne Falls is 1.9 People.
How Large is the Labor Force in Boyne Falls?
There are 159 People in the Labor Forcein in Boyne Falls.
What is the Percentage of People in the Labor Force in Boyne Falls?
57.0% of People are in the Labor Force in Boyne Falls.
What is the Unemployment Rate in Boyne Falls?
Unemployment Rate in Boyne Falls is 3.8%.