Riverview, MI Map & Demographics
Riverview Map
Riverview Overview
$37,331
PER CAPITA INCOME
$84,628
AVG FAMILY INCOME
$69,323
AVG HOUSEHOLD INCOME
30.2%
WAGE / INCOME GAP [ % ]
69.8¢/ $1
WAGE / INCOME GAP [ $ ]
0.42
INEQUALITY / GINI INDEX
12,390
TOTAL POPULATION
6,088
MALE POPULATION
6,302
FEMALE POPULATION
96.60
MALES / 100 FEMALES
103.52
FEMALES / 100 MALES
41.3
MEDIAN AGE
3.0
AVG FAMILY SIZE
2.3
AVG HOUSEHOLD SIZE
5,882
LABOR FORCE [ PEOPLE ]
58.4%
PERCENT IN LABOR FORCE
3.2%
UNEMPLOYMENT RATE
Riverview Zip Codes
Riverview Area Codes
Income in Riverview
Income Overview in Riverview
Per Capita Income in Riverview is $37,331, while median incomes of families and households are $84,628 and $69,323 respectively.
| Characteristic | Number | Measure |
| Per Capita Income | 12,390 | $37,331 |
| Median Family Income | 3,232 | $84,628 |
| Mean Family Income | 3,232 | $105,111 |
| Median Household Income | 5,162 | $69,323 |
| Mean Household Income | 5,162 | $84,933 |
| Income Deficit | 3,232 | $0 |
| Wage / Income Gap (%) | 12,390 | 30.25% |
| Wage / Income Gap ($) | 12,390 | 69.75¢ per $1 |
| Gini / Inequality Index | 12,390 | 0.42 |
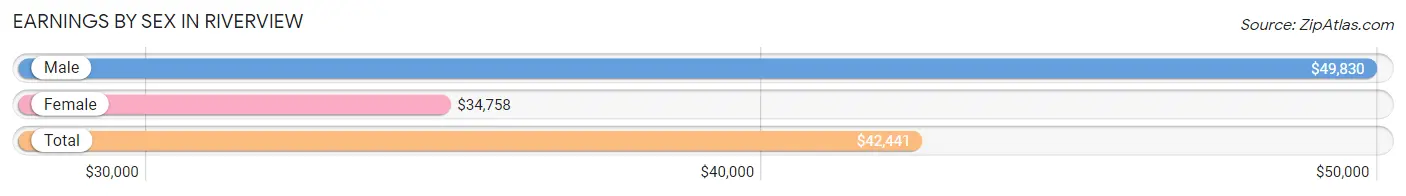
Earnings by Sex in Riverview
Average Earnings in Riverview are $42,441, $49,830 for men and $34,758 for women, a difference of 30.2%.
| Sex | Number | Average Earnings |
| Male | 3,449 (57.0%) | $49,830 |
| Female | 2,605 (43.0%) | $34,758 |
| Total | 6,054 (100.0%) | $42,441 |
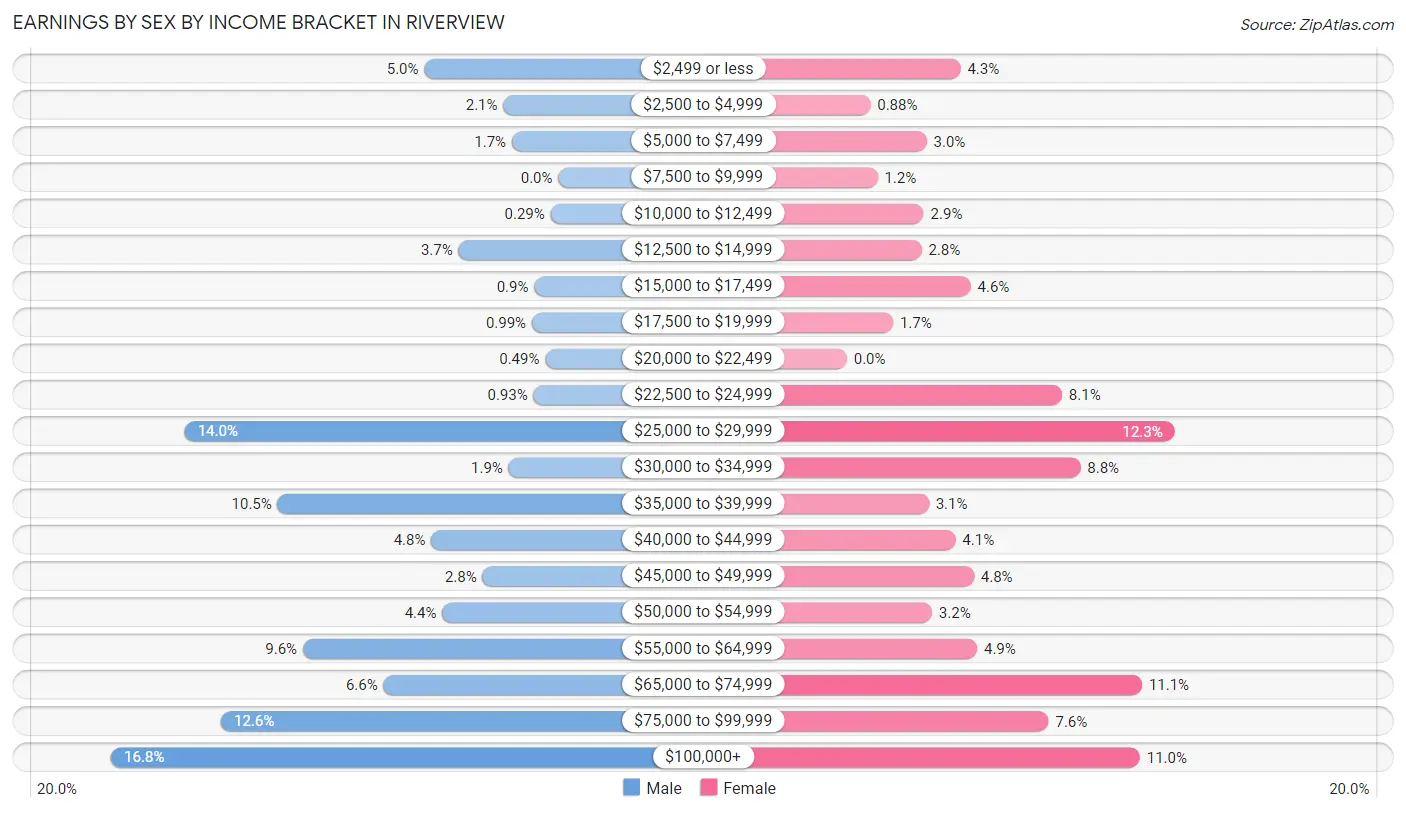
Earnings by Sex by Income Bracket in Riverview
The most common earnings brackets in Riverview are $100,000+ for men (578 | 16.8%) and $25,000 to $29,999 for women (320 | 12.3%).
| Income | Male | Female |
| $2,499 or less | 173 (5.0%) | 111 (4.3%) |
| $2,500 to $4,999 | 71 (2.1%) | 23 (0.9%) |
| $5,000 to $7,499 | 60 (1.7%) | 78 (3.0%) |
| $7,500 to $9,999 | 0 (0.0%) | 30 (1.1%) |
| $10,000 to $12,499 | 10 (0.3%) | 75 (2.9%) |
| $12,500 to $14,999 | 129 (3.7%) | 73 (2.8%) |
| $15,000 to $17,499 | 31 (0.9%) | 121 (4.6%) |
| $17,500 to $19,999 | 34 (1.0%) | 45 (1.7%) |
| $20,000 to $22,499 | 17 (0.5%) | 0 (0.0%) |
| $22,500 to $24,999 | 32 (0.9%) | 210 (8.1%) |
| $25,000 to $29,999 | 483 (14.0%) | 320 (12.3%) |
| $30,000 to $34,999 | 64 (1.9%) | 228 (8.7%) |
| $35,000 to $39,999 | 363 (10.5%) | 80 (3.1%) |
| $40,000 to $44,999 | 164 (4.8%) | 106 (4.1%) |
| $45,000 to $49,999 | 98 (2.8%) | 124 (4.8%) |
| $50,000 to $54,999 | 150 (4.3%) | 83 (3.2%) |
| $55,000 to $64,999 | 330 (9.6%) | 127 (4.9%) |
| $65,000 to $74,999 | 226 (6.6%) | 288 (11.1%) |
| $75,000 to $99,999 | 436 (12.6%) | 197 (7.6%) |
| $100,000+ | 578 (16.8%) | 286 (11.0%) |
| Total | 3,449 (100.0%) | 2,605 (100.0%) |
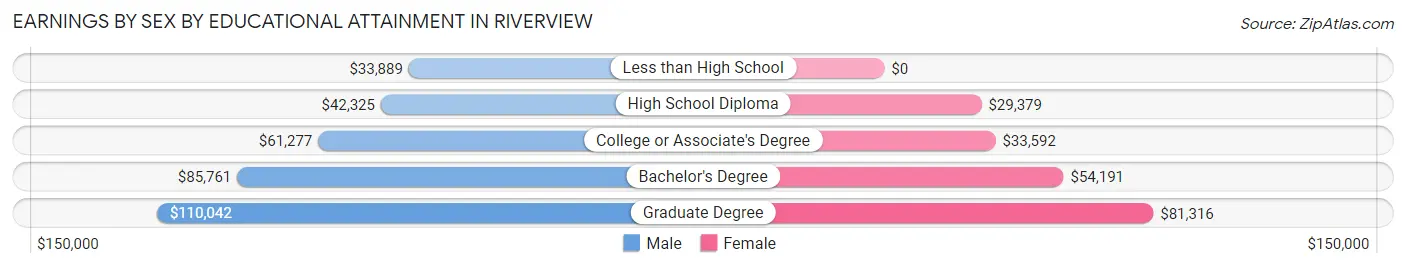
Earnings by Sex by Educational Attainment in Riverview
Average earnings in Riverview are $57,438 for men and $39,375 for women, a difference of 31.5%. Men with an educational attainment of graduate degree enjoy the highest average annual earnings of $110,042, while those with less than high school education earn the least with $33,889. Women with an educational attainment of graduate degree earn the most with the average annual earnings of $81,316, while those with high school diploma education have the smallest earnings of $29,379.
| Educational Attainment | Male Income | Female Income |
| Less than High School | $33,889 | $0 |
| High School Diploma | $42,325 | $29,379 |
| College or Associate's Degree | $61,277 | $33,592 |
| Bachelor's Degree | $85,761 | $54,191 |
| Graduate Degree | $110,042 | $81,316 |
| Total | $57,438 | $39,375 |
Family Income in Riverview
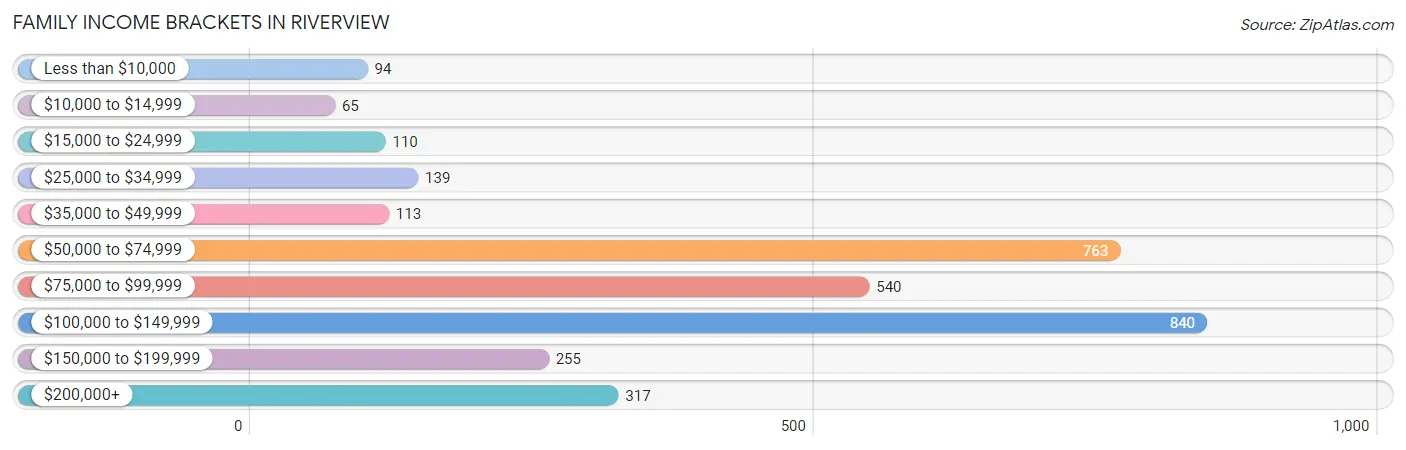
Family Income Brackets in Riverview
According to the Riverview family income data, there are 840 families falling into the $100,000 to $149,999 income range, which is the most common income bracket and makes up 26.0% of all families. Conversely, the $10,000 to $14,999 income bracket is the least frequent group with only 65 families (2.0%) belonging to this category.
| Income Bracket | # Families | % Families |
| Less than $10,000 | 94 | 2.9% |
| $10,000 to $14,999 | 65 | 2.0% |
| $15,000 to $24,999 | 110 | 3.4% |
| $25,000 to $34,999 | 139 | 4.3% |
| $35,000 to $49,999 | 113 | 3.5% |
| $50,000 to $74,999 | 763 | 23.6% |
| $75,000 to $99,999 | 540 | 16.7% |
| $100,000 to $149,999 | 840 | 26.0% |
| $150,000 to $199,999 | 255 | 7.9% |
| $200,000+ | 317 | 9.8% |
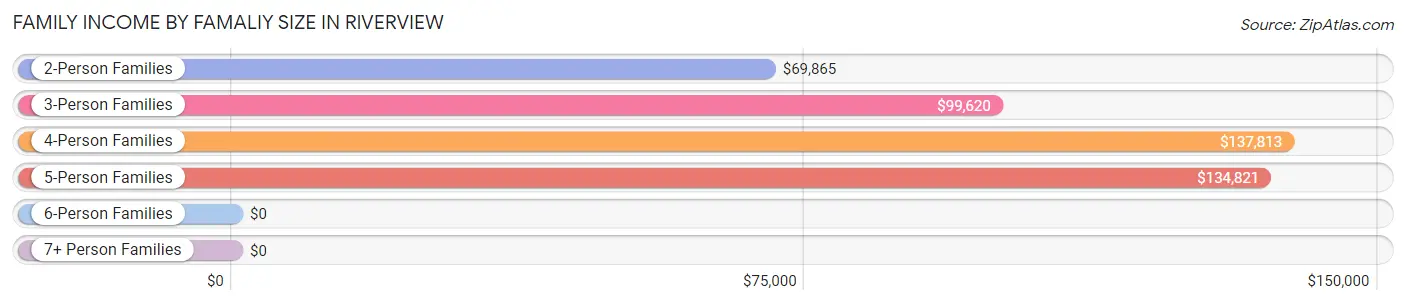
Family Income by Famaliy Size in Riverview
4-person families (489 | 15.1%) account for the highest median family income in Riverview with $137,813 per family, while 2-person families (1,844 | 57.1%) have the highest median income of $34,932 per family member.
| Income Bracket | # Families | Median Income |
| 2-Person Families | 1,844 (57.1%) | $69,865 |
| 3-Person Families | 588 (18.2%) | $99,620 |
| 4-Person Families | 489 (15.1%) | $137,813 |
| 5-Person Families | 231 (7.1%) | $134,821 |
| 6-Person Families | 49 (1.5%) | $0 |
| 7+ Person Families | 31 (1.0%) | $0 |
| Total | 3,232 (100.0%) | $84,628 |
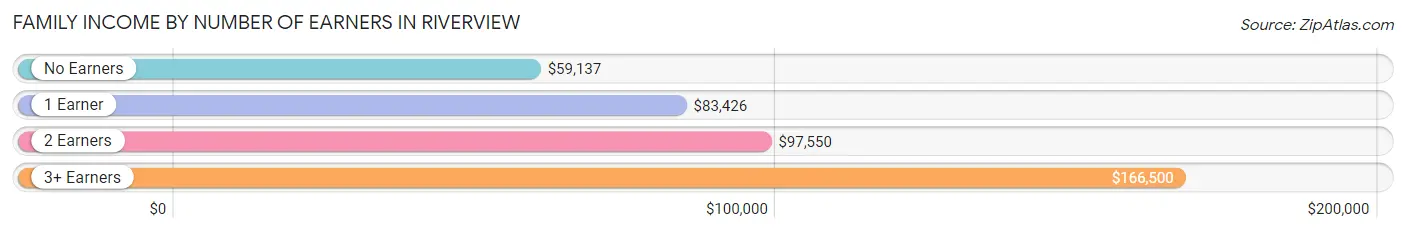
Family Income by Number of Earners in Riverview
The median family income in Riverview is $84,628, with families comprising 3+ earners (246) having the highest median family income of $166,500, while families with no earners (613) have the lowest median family income of $59,137, accounting for 7.6% and 19.0% of families, respectively.
| Number of Earners | # Families | Median Income |
| No Earners | 613 (19.0%) | $59,137 |
| 1 Earner | 922 (28.5%) | $83,426 |
| 2 Earners | 1,451 (44.9%) | $97,550 |
| 3+ Earners | 246 (7.6%) | $166,500 |
| Total | 3,232 (100.0%) | $84,628 |
Household Income in Riverview
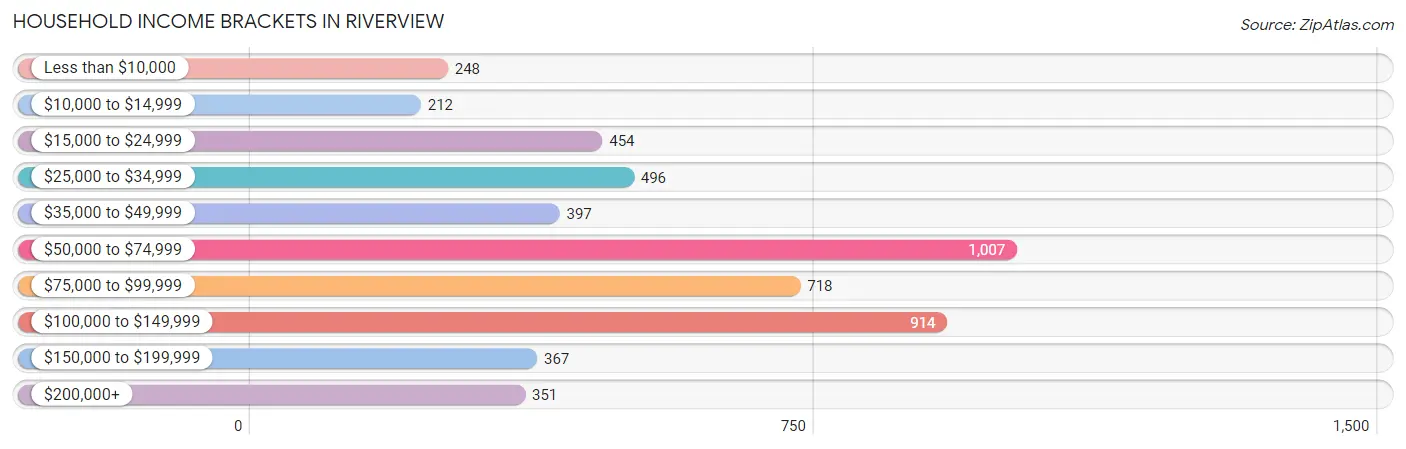
Household Income Brackets in Riverview
With 1,007 households falling in the category, the $50,000 to $74,999 income range is the most frequent in Riverview, accounting for 19.5% of all households. In contrast, only 212 households (4.1%) fall into the $10,000 to $14,999 income bracket, making it the least populous group.
| Income Bracket | # Households | % Households |
| Less than $10,000 | 248 | 4.8% |
| $10,000 to $14,999 | 212 | 4.1% |
| $15,000 to $24,999 | 454 | 8.8% |
| $25,000 to $34,999 | 496 | 9.6% |
| $35,000 to $49,999 | 397 | 7.7% |
| $50,000 to $74,999 | 1,007 | 19.5% |
| $75,000 to $99,999 | 718 | 13.9% |
| $100,000 to $149,999 | 914 | 17.7% |
| $150,000 to $199,999 | 367 | 7.1% |
| $200,000+ | 351 | 6.8% |
Household Income by Householder Age in Riverview
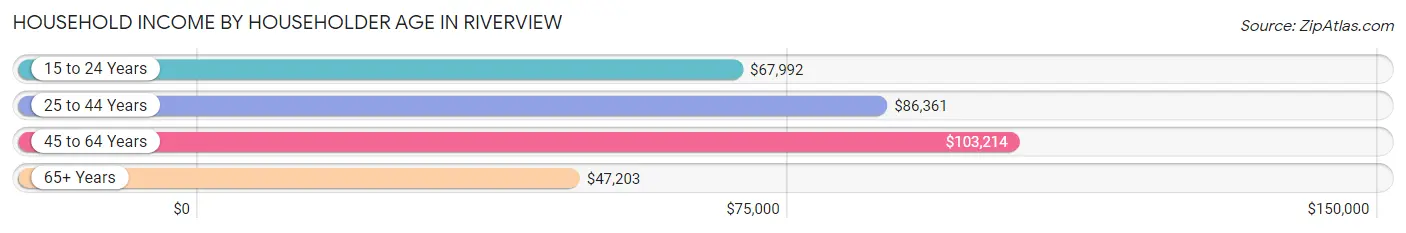
The median household income in Riverview is $69,323, with the highest median household income of $103,214 found in the 45 to 64 years age bracket for the primary householder. A total of 1,398 households (27.1%) fall into this category. Meanwhile, the 65+ years age bracket for the primary householder has the lowest median household income of $47,203, with 2,008 households (38.9%) in this group.
| Income Bracket | # Households | Median Income |
| 15 to 24 Years | 371 (7.2%) | $67,992 |
| 25 to 44 Years | 1,385 (26.8%) | $86,361 |
| 45 to 64 Years | 1,398 (27.1%) | $103,214 |
| 65+ Years | 2,008 (38.9%) | $47,203 |
| Total | 5,162 (100.0%) | $69,323 |
Poverty in Riverview
Income Below Poverty by Sex and Age in Riverview
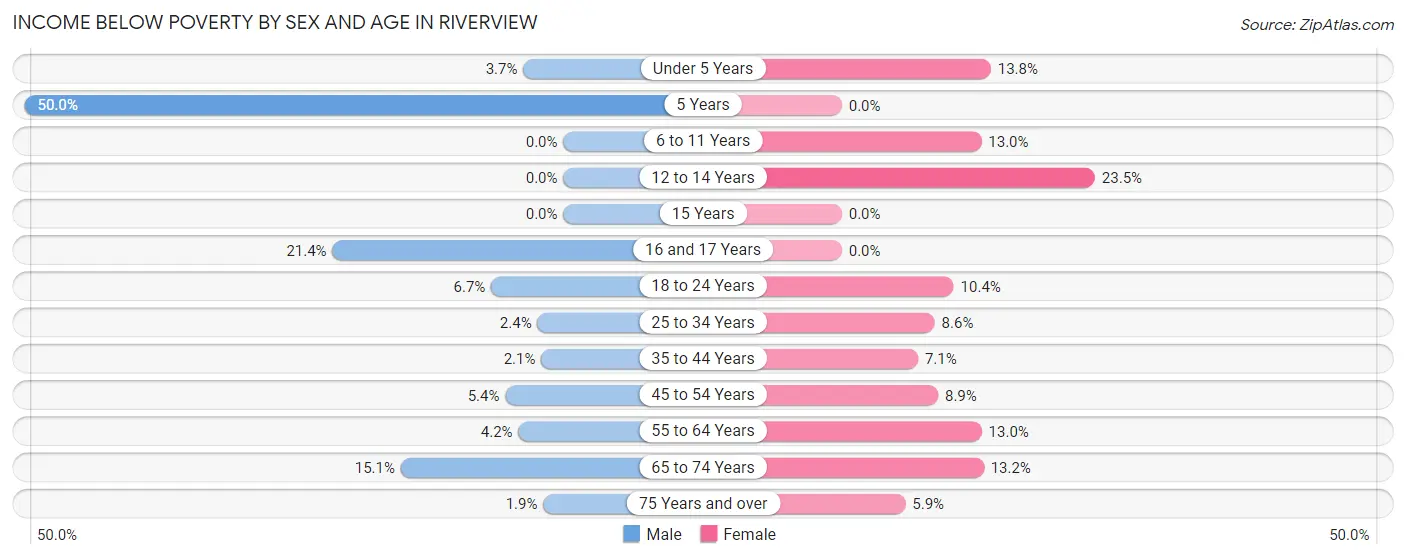
With 5.6% poverty level for males and 10.1% for females among the residents of Riverview, 5 year old males and 12 to 14 year old females are the most vulnerable to poverty, with 39 males (50.0%) and 70 females (23.5%) in their respective age groups living below the poverty level.
| Age Bracket | Male | Female |
| Under 5 Years | 20 (3.7%) | 26 (13.8%) |
| 5 Years | 39 (50.0%) | 0 (0.0%) |
| 6 to 11 Years | 0 (0.0%) | 57 (13.0%) |
| 12 to 14 Years | 0 (0.0%) | 70 (23.5%) |
| 15 Years | 0 (0.0%) | 0 (0.0%) |
| 16 and 17 Years | 24 (21.4%) | 0 (0.0%) |
| 18 to 24 Years | 47 (6.7%) | 30 (10.4%) |
| 25 to 34 Years | 22 (2.4%) | 69 (8.6%) |
| 35 to 44 Years | 14 (2.1%) | 51 (7.1%) |
| 45 to 54 Years | 37 (5.4%) | 45 (8.9%) |
| 55 to 64 Years | 23 (4.2%) | 74 (13.0%) |
| 65 to 74 Years | 97 (15.1%) | 132 (13.2%) |
| 75 Years and over | 8 (1.9%) | 49 (5.9%) |
| Total | 331 (5.6%) | 603 (10.1%) |
Income Above Poverty by Sex and Age in Riverview
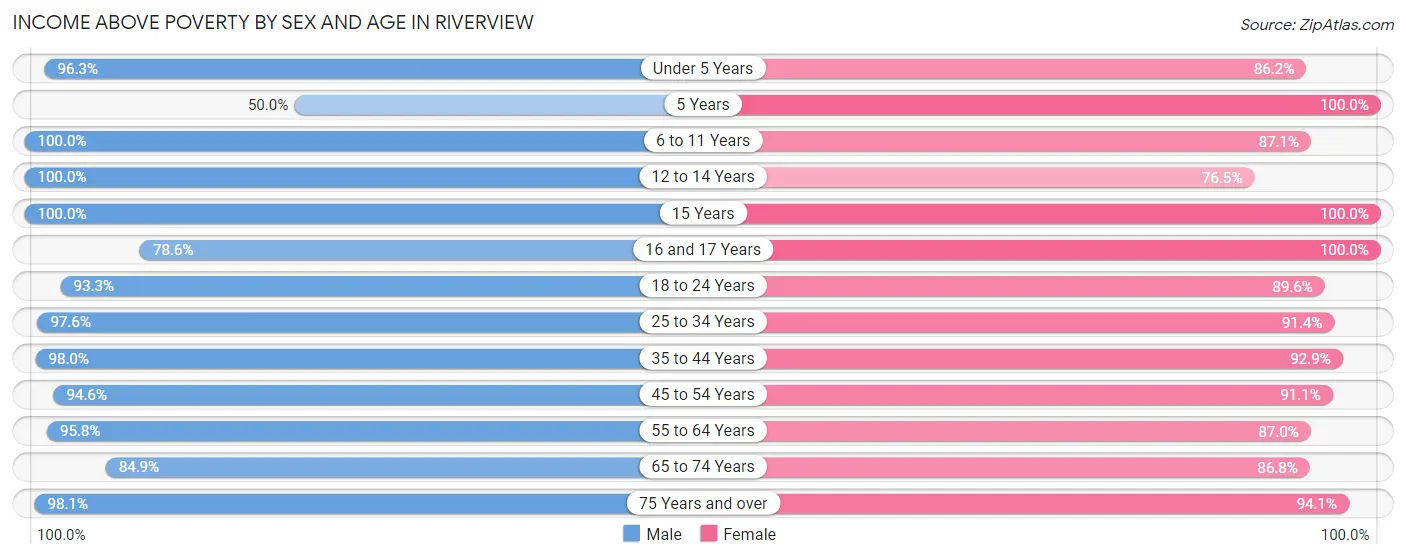
According to the poverty statistics in Riverview, males aged 6 to 11 years and females aged 5 years are the age groups that are most secure financially, with 100.0% of males and 100.0% of females in these age groups living above the poverty line.
| Age Bracket | Male | Female |
| Under 5 Years | 517 (96.3%) | 162 (86.2%) |
| 5 Years | 39 (50.0%) | 112 (100.0%) |
| 6 to 11 Years | 272 (100.0%) | 383 (87.1%) |
| 12 to 14 Years | 220 (100.0%) | 228 (76.5%) |
| 15 Years | 87 (100.0%) | 51 (100.0%) |
| 16 and 17 Years | 88 (78.6%) | 154 (100.0%) |
| 18 to 24 Years | 654 (93.3%) | 259 (89.6%) |
| 25 to 34 Years | 895 (97.6%) | 731 (91.4%) |
| 35 to 44 Years | 670 (98.0%) | 670 (92.9%) |
| 45 to 54 Years | 649 (94.6%) | 459 (91.1%) |
| 55 to 64 Years | 528 (95.8%) | 496 (87.0%) |
| 65 to 74 Years | 546 (84.9%) | 870 (86.8%) |
| 75 Years and over | 423 (98.1%) | 781 (94.1%) |
| Total | 5,588 (94.4%) | 5,356 (89.9%) |
Income Below Poverty Among Married-Couple Families in Riverview
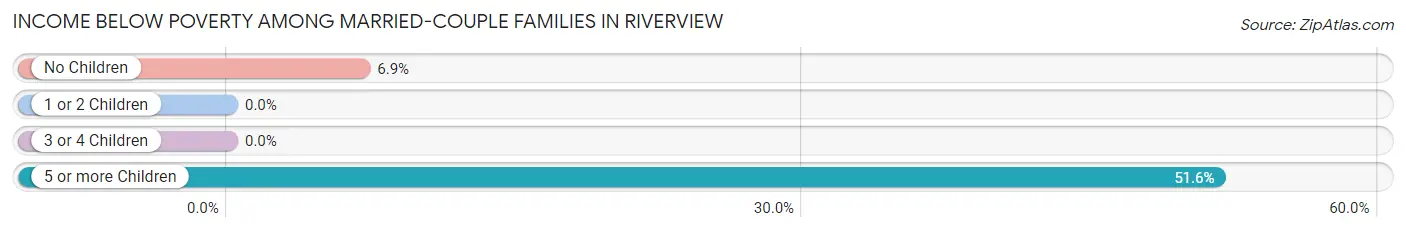
The poverty statistics for married-couple families in Riverview show that 4.7% or 97 of the total 2,083 families live below the poverty line. Families with 5 or more children have the highest poverty rate of 51.6%, comprising of 16 families. On the other hand, families with 1 or 2 children have the lowest poverty rate of 0.0%, which includes 0 families.
| Children | Above Poverty | Below Poverty |
| No Children | 1,092 (93.1%) | 81 (6.9%) |
| 1 or 2 Children | 665 (100.0%) | 0 (0.0%) |
| 3 or 4 Children | 214 (100.0%) | 0 (0.0%) |
| 5 or more Children | 15 (48.4%) | 16 (51.6%) |
| Total | 1,986 (95.3%) | 97 (4.7%) |
Income Below Poverty Among Single-Parent Households in Riverview
According to the poverty data in Riverview, 4.1% or 23 single-father households and 18.0% or 106 single-mother households are living below the poverty line. Among single-father households, those with 1 or 2 children have the highest poverty rate, with 23 households (23.5%) experiencing poverty. Likewise, among single-mother households, those with 3 or 4 children have the highest poverty rate, with 9 households (100.0%) falling below the poverty line.
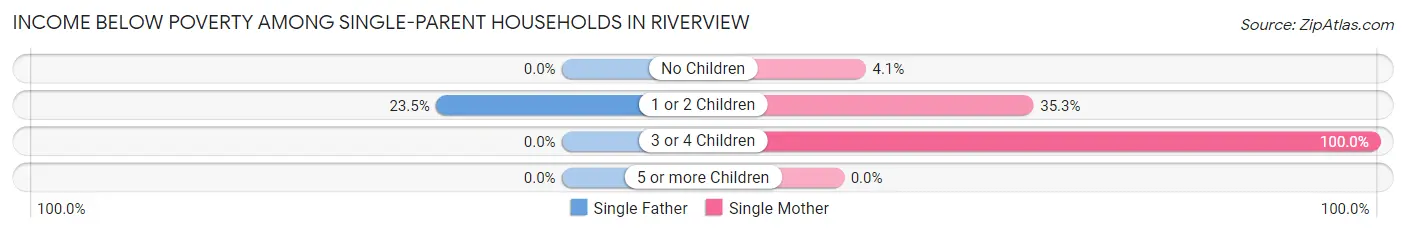
| Children | Single Father | Single Mother |
| No Children | 0 (0.0%) | 14 (4.1%) |
| 1 or 2 Children | 23 (23.5%) | 83 (35.3%) |
| 3 or 4 Children | 0 (0.0%) | 9 (100.0%) |
| 5 or more Children | 0 (0.0%) | 0 (0.0%) |
| Total | 23 (4.1%) | 106 (18.0%) |
Income Below Poverty Among Married-Couple vs Single-Parent Households in Riverview
The poverty data for Riverview shows that 97 of the married-couple family households (4.7%) and 129 of the single-parent households (11.2%) are living below the poverty level. Within the married-couple family households, those with 5 or more children have the highest poverty rate, with 16 households (51.6%) falling below the poverty line. Among the single-parent households, those with 1 or 2 children have the highest poverty rate, with 106 household (31.8%) living below poverty.
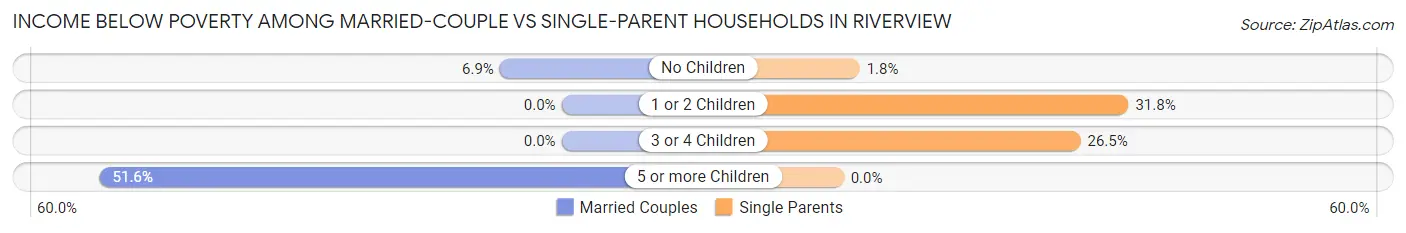
| Children | Married-Couple Families | Single-Parent Households |
| No Children | 81 (6.9%) | 14 (1.8%) |
| 1 or 2 Children | 0 (0.0%) | 106 (31.8%) |
| 3 or 4 Children | 0 (0.0%) | 9 (26.5%) |
| 5 or more Children | 16 (51.6%) | 0 (0.0%) |
| Total | 97 (4.7%) | 129 (11.2%) |
Race in Riverview
The most populous races in Riverview are White / Caucasian (10,304 | 83.2%), Black / African American (1,001 | 8.1%), and Hispanic or Latino (883 | 7.1%).
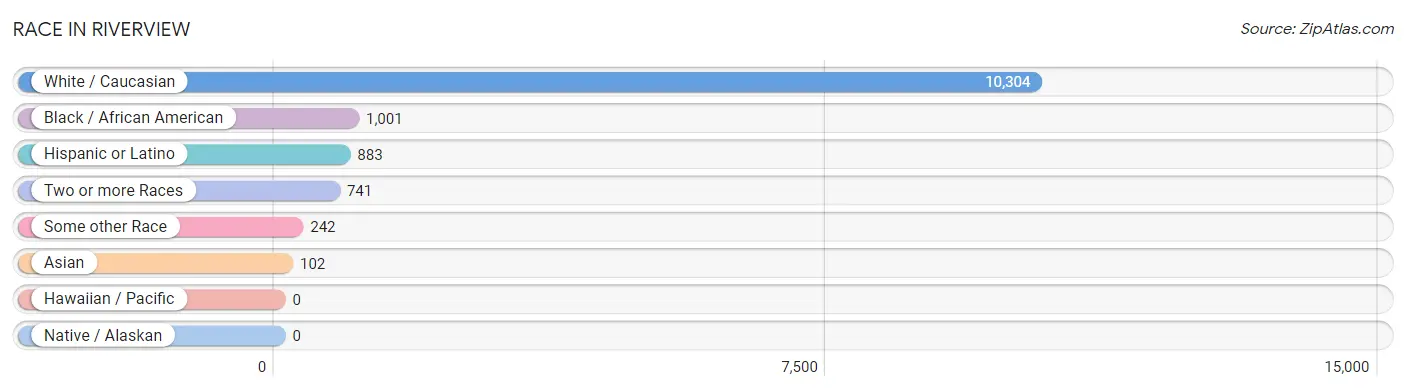
| Race | # Population | % Population |
| Asian | 102 | 0.8% |
| Black / African American | 1,001 | 8.1% |
| Hawaiian / Pacific | 0 | 0.0% |
| Hispanic or Latino | 883 | 7.1% |
| Native / Alaskan | 0 | 0.0% |
| White / Caucasian | 10,304 | 83.2% |
| Two or more Races | 741 | 6.0% |
| Some other Race | 242 | 1.9% |
| Total | 12,390 | 100.0% |
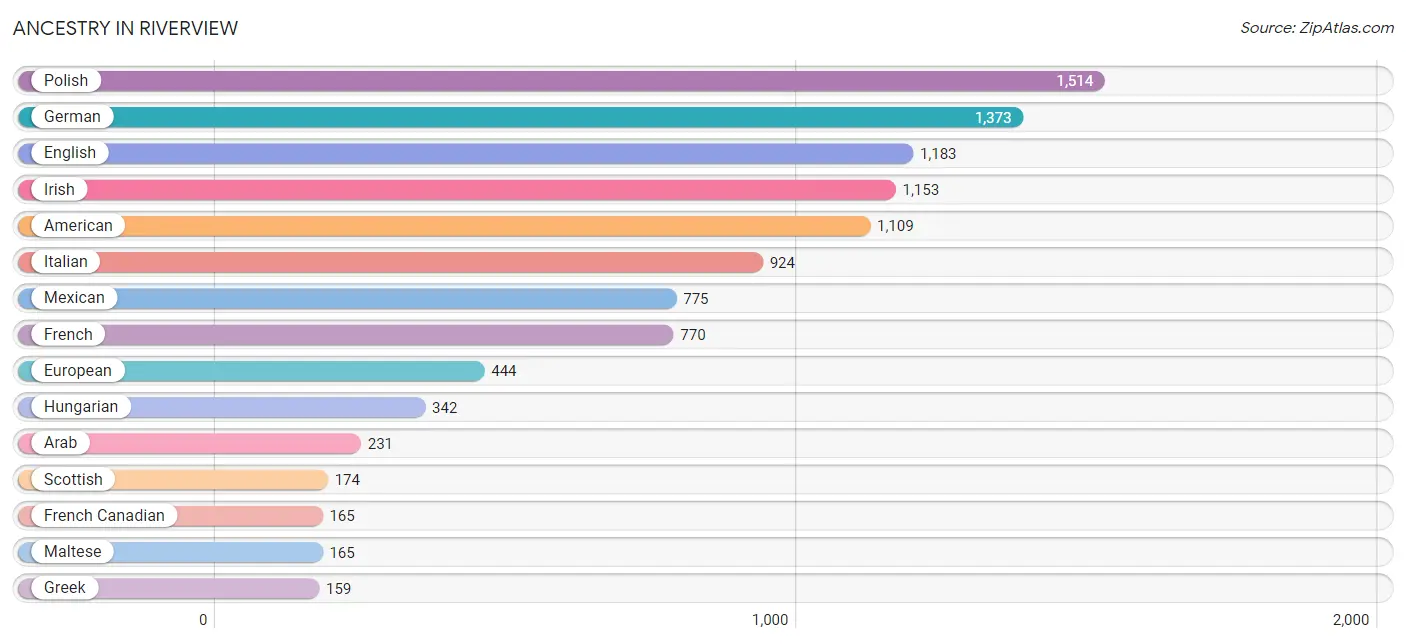
Ancestry in Riverview
The most populous ancestries reported in Riverview are Polish (1,514 | 12.2%), German (1,373 | 11.1%), English (1,183 | 9.6%), Irish (1,153 | 9.3%), and American (1,109 | 8.9%), together accounting for 51.1% of all Riverview residents.
| Ancestry | # Population | % Population |
| Albanian | 12 | 0.1% |
| American | 1,109 | 8.9% |
| Arab | 231 | 1.9% |
| Austrian | 34 | 0.3% |
| Belgian | 22 | 0.2% |
| Blackfeet | 81 | 0.6% |
| British | 8 | 0.1% |
| Canadian | 58 | 0.5% |
| Cherokee | 138 | 1.1% |
| Chippewa | 14 | 0.1% |
| Colombian | 17 | 0.1% |
| Croatian | 123 | 1.0% |
| Cuban | 9 | 0.1% |
| Czech | 64 | 0.5% |
| Dutch | 48 | 0.4% |
| Eastern European | 34 | 0.3% |
| English | 1,183 | 9.6% |
| European | 444 | 3.6% |
| Finnish | 25 | 0.2% |
| French | 770 | 6.2% |
| French American Indian | 1 | 0.0% |
| French Canadian | 165 | 1.3% |
| German | 1,373 | 11.1% |
| Greek | 159 | 1.3% |
| Hungarian | 342 | 2.8% |
| Indian (Asian) | 92 | 0.7% |
| Indonesian | 13 | 0.1% |
| Irish | 1,153 | 9.3% |
| Italian | 924 | 7.5% |
| Korean | 97 | 0.8% |
| Lebanese | 148 | 1.2% |
| Lithuanian | 59 | 0.5% |
| Maltese | 165 | 1.3% |
| Mexican | 775 | 6.3% |
| Norwegian | 39 | 0.3% |
| Polish | 1,514 | 12.2% |
| Potawatomi | 13 | 0.1% |
| Puerto Rican | 51 | 0.4% |
| Russian | 37 | 0.3% |
| Scandinavian | 22 | 0.2% |
| Scotch-Irish | 100 | 0.8% |
| Scottish | 174 | 1.4% |
| Serbian | 21 | 0.2% |
| Slovak | 77 | 0.6% |
| Slovene | 34 | 0.3% |
| Somali | 50 | 0.4% |
| South American | 33 | 0.3% |
| Spanish | 7 | 0.1% |
| Subsaharan African | 50 | 0.4% |
| Swedish | 89 | 0.7% |
| Thai | 18 | 0.2% |
| Ukrainian | 20 | 0.2% |
| Venezuelan | 16 | 0.1% |
| Welsh | 122 | 1.0% |
| Yugoslavian | 5 | 0.0% | View All 55 Rows |
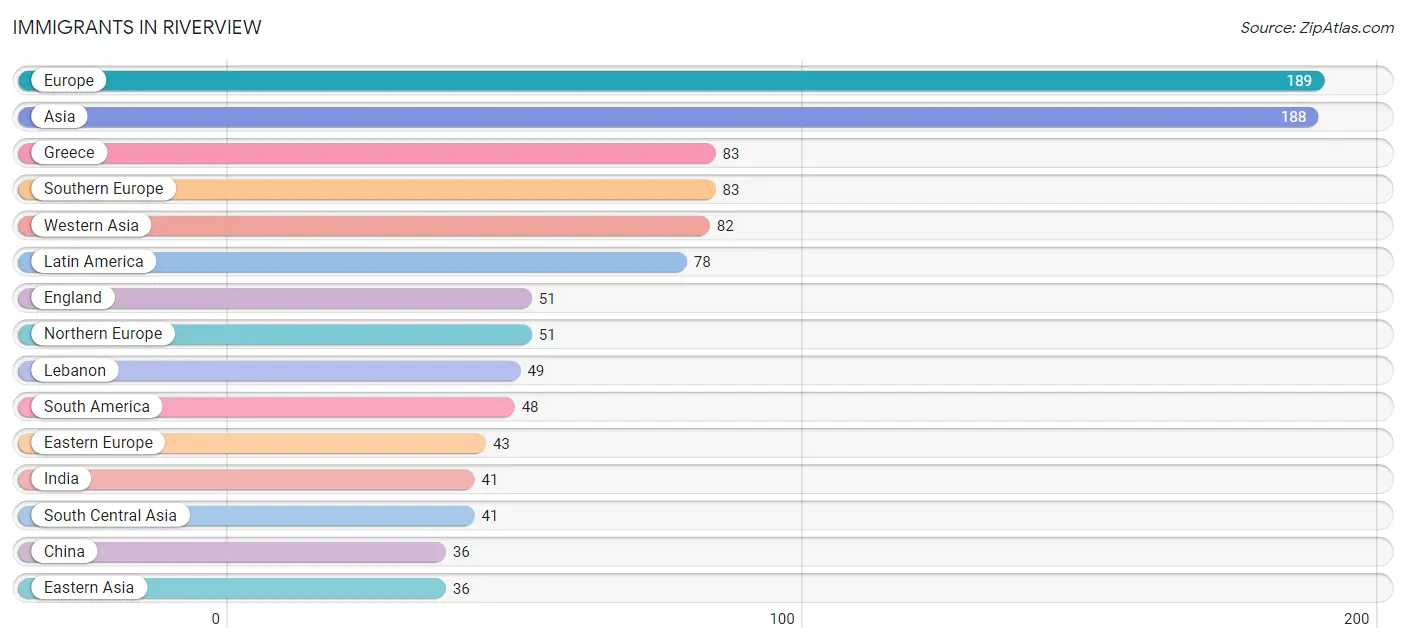
Immigrants in Riverview
The most numerous immigrant groups reported in Riverview came from Europe (189 | 1.5%), Asia (188 | 1.5%), Greece (83 | 0.7%), Southern Europe (83 | 0.7%), and Western Asia (82 | 0.7%), together accounting for 5.0% of all Riverview residents.
| Immigration Origin | # Population | % Population |
| Albania | 12 | 0.1% |
| Asia | 188 | 1.5% |
| Canada | 9 | 0.1% |
| Caribbean | 9 | 0.1% |
| Central America | 21 | 0.2% |
| Chile | 15 | 0.1% |
| China | 36 | 0.3% |
| Colombia | 17 | 0.1% |
| Cuba | 9 | 0.1% |
| Eastern Asia | 36 | 0.3% |
| Eastern Europe | 43 | 0.4% |
| England | 51 | 0.4% |
| Europe | 189 | 1.5% |
| Germany | 12 | 0.1% |
| Greece | 83 | 0.7% |
| India | 41 | 0.3% |
| Latin America | 78 | 0.6% |
| Lebanon | 49 | 0.4% |
| Mexico | 21 | 0.2% |
| Northern Europe | 51 | 0.4% |
| Philippines | 16 | 0.1% |
| Poland | 31 | 0.3% |
| South America | 48 | 0.4% |
| South Central Asia | 41 | 0.3% |
| South Eastern Asia | 29 | 0.2% |
| Southern Europe | 83 | 0.7% |
| Venezuela | 16 | 0.1% |
| Western Asia | 82 | 0.7% |
| Western Europe | 12 | 0.1% |
| Yemen | 33 | 0.3% | View All 30 Rows |
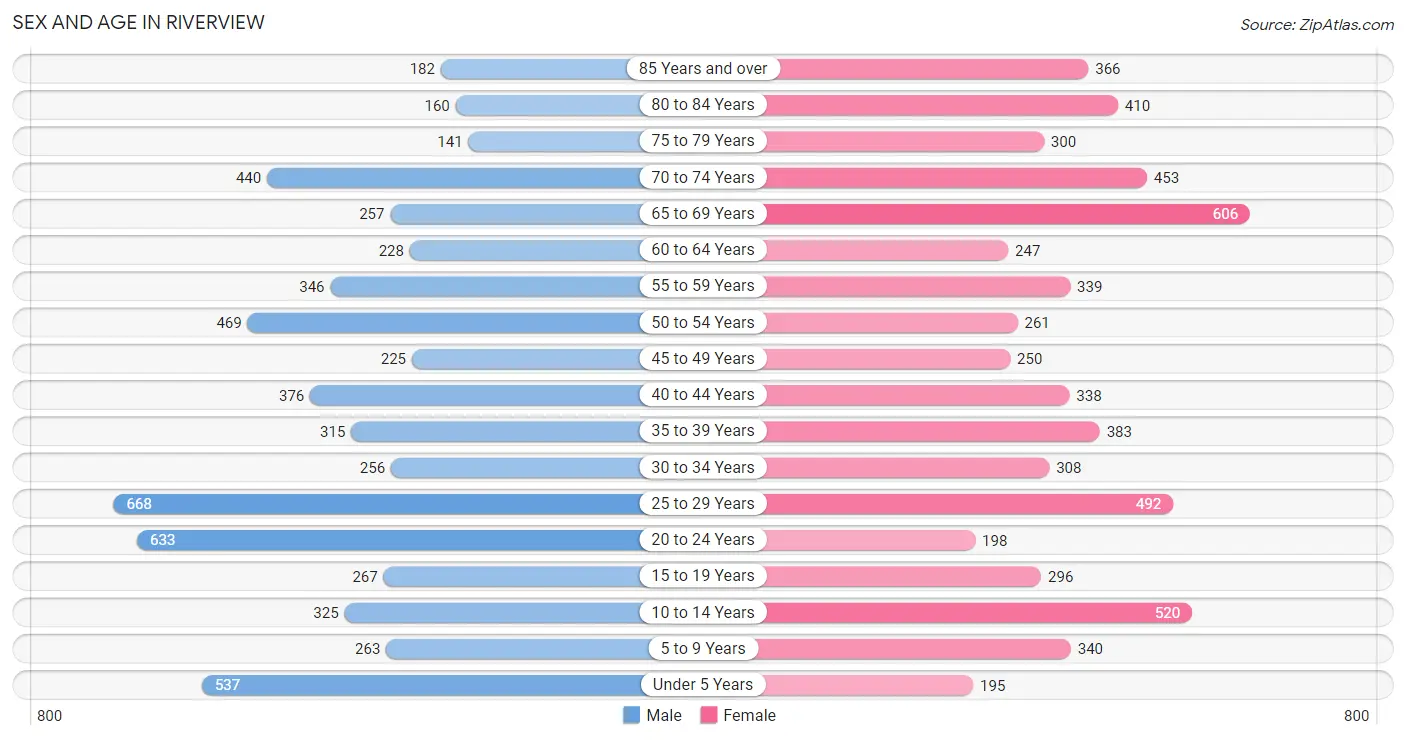
Sex and Age in Riverview
Sex and Age in Riverview
The most populous age groups in Riverview are 25 to 29 Years (668 | 11.0%) for men and 65 to 69 Years (606 | 9.6%) for women.
| Age Bracket | Male | Female |
| Under 5 Years | 537 (8.8%) | 195 (3.1%) |
| 5 to 9 Years | 263 (4.3%) | 340 (5.4%) |
| 10 to 14 Years | 325 (5.3%) | 520 (8.3%) |
| 15 to 19 Years | 267 (4.4%) | 296 (4.7%) |
| 20 to 24 Years | 633 (10.4%) | 198 (3.1%) |
| 25 to 29 Years | 668 (11.0%) | 492 (7.8%) |
| 30 to 34 Years | 256 (4.2%) | 308 (4.9%) |
| 35 to 39 Years | 315 (5.2%) | 383 (6.1%) |
| 40 to 44 Years | 376 (6.2%) | 338 (5.4%) |
| 45 to 49 Years | 225 (3.7%) | 250 (4.0%) |
| 50 to 54 Years | 469 (7.7%) | 261 (4.1%) |
| 55 to 59 Years | 346 (5.7%) | 339 (5.4%) |
| 60 to 64 Years | 228 (3.7%) | 247 (3.9%) |
| 65 to 69 Years | 257 (4.2%) | 606 (9.6%) |
| 70 to 74 Years | 440 (7.2%) | 453 (7.2%) |
| 75 to 79 Years | 141 (2.3%) | 300 (4.8%) |
| 80 to 84 Years | 160 (2.6%) | 410 (6.5%) |
| 85 Years and over | 182 (3.0%) | 366 (5.8%) |
| Total | 6,088 (100.0%) | 6,302 (100.0%) |
Families and Households in Riverview
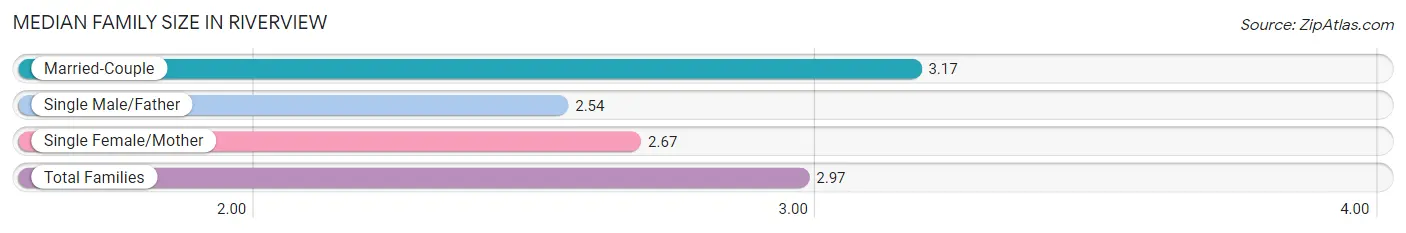
Median Family Size in Riverview
The median family size in Riverview is 2.97 persons per family, with married-couple families (2,083 | 64.4%) accounting for the largest median family size of 3.17 persons per family. On the other hand, single male/father families (561 | 17.4%) represent the smallest median family size with 2.54 persons per family.
| Family Type | # Families | Family Size |
| Married-Couple | 2,083 (64.4%) | 3.17 |
| Single Male/Father | 561 (17.4%) | 2.54 |
| Single Female/Mother | 588 (18.2%) | 2.67 |
| Total Families | 3,232 (100.0%) | 2.97 |
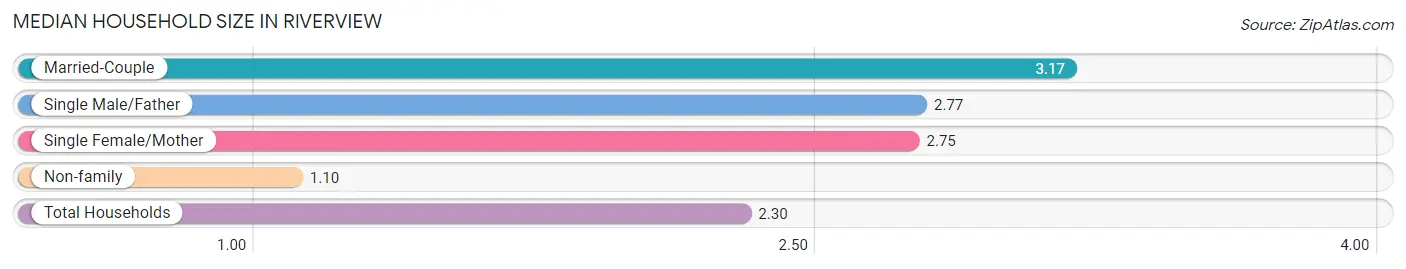
Median Household Size in Riverview
The median household size in Riverview is 2.30 persons per household, with married-couple households (2,083 | 40.4%) accounting for the largest median household size of 3.17 persons per household. non-family households (1,930 | 37.4%) represent the smallest median household size with 1.10 persons per household.
| Household Type | # Households | Household Size |
| Married-Couple | 2,083 (40.4%) | 3.17 |
| Single Male/Father | 561 (10.9%) | 2.77 |
| Single Female/Mother | 588 (11.4%) | 2.75 |
| Non-family | 1,930 (37.4%) | 1.10 |
| Total Households | 5,162 (100.0%) | 2.30 |
Household Size by Marriage Status in Riverview
Out of a total of 5,162 households in Riverview, 3,232 (62.6%) are family households, while 1,930 (37.4%) are nonfamily households. The most numerous type of family households are 2-person households, comprising 1,786, and the most common type of nonfamily households are 1-person households, comprising 1,764.
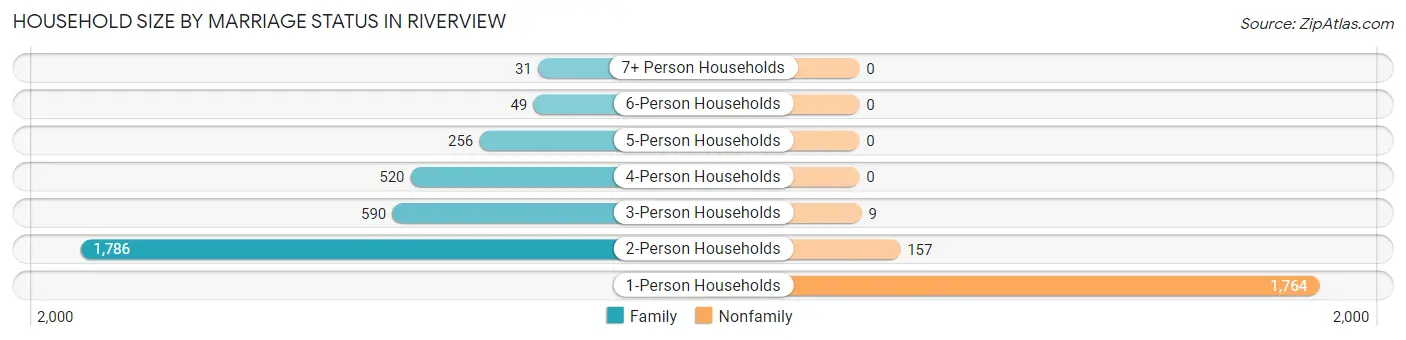
| Household Size | Family Households | Nonfamily Households |
| 1-Person Households | - | 1,764 (34.2%) |
| 2-Person Households | 1,786 (34.6%) | 157 (3.0%) |
| 3-Person Households | 590 (11.4%) | 9 (0.2%) |
| 4-Person Households | 520 (10.1%) | 0 (0.0%) |
| 5-Person Households | 256 (5.0%) | 0 (0.0%) |
| 6-Person Households | 49 (0.9%) | 0 (0.0%) |
| 7+ Person Households | 31 (0.6%) | 0 (0.0%) |
| Total | 3,232 (62.6%) | 1,930 (37.4%) |
Female Fertility in Riverview
Fertility by Age in Riverview
Average fertility rate in Riverview is 21.0 births per 1,000 women. Women in the age bracket of 35 to 50 years have the highest fertility rate with 40.0 births per 1,000 women. Women in the age bracket of 35 to 50 years acount for 81.6% of all women with births.
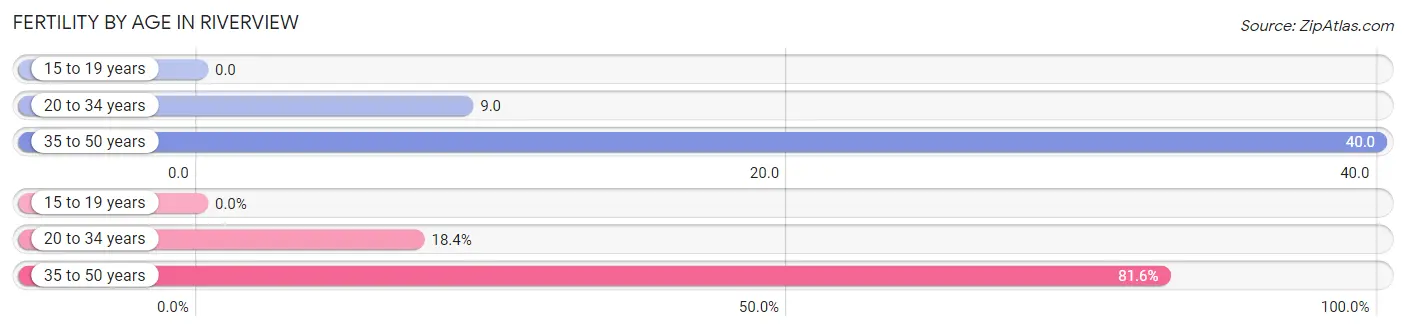
| Age Bracket | Women with Births | Births / 1,000 Women |
| 15 to 19 years | 0 (0.0%) | 0.0 |
| 20 to 34 years | 9 (18.4%) | 9.0 |
| 35 to 50 years | 40 (81.6%) | 40.0 |
| Total | 49 (100.0%) | 21.0 |
Fertility by Age by Marriage Status in Riverview
81.6% of women with births (49) in Riverview are married. The highest percentage of unmarried women with births falls into 20 to 34 years age bracket with 100.0% of them unmarried at the time of birth, while the lowest percentage of unmarried women with births belong to 35 to 50 years age bracket with 0.0% of them unmarried.
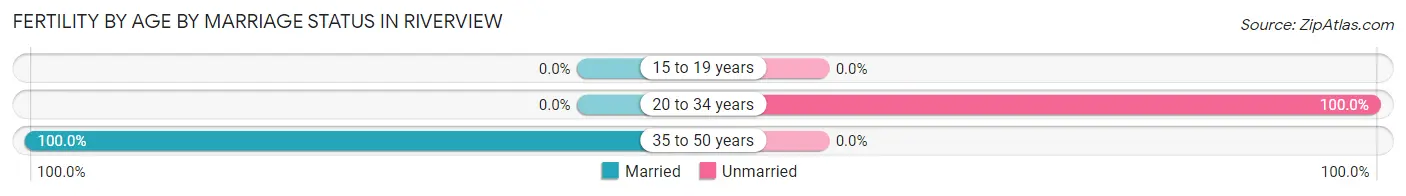
| Age Bracket | Married | Unmarried |
| 15 to 19 years | 0 (0.0%) | 0 (0.0%) |
| 20 to 34 years | 0 (0.0%) | 9 (100.0%) |
| 35 to 50 years | 40 (100.0%) | 0 (0.0%) |
| Total | 40 (81.6%) | 9 (18.4%) |
Fertility by Education in Riverview
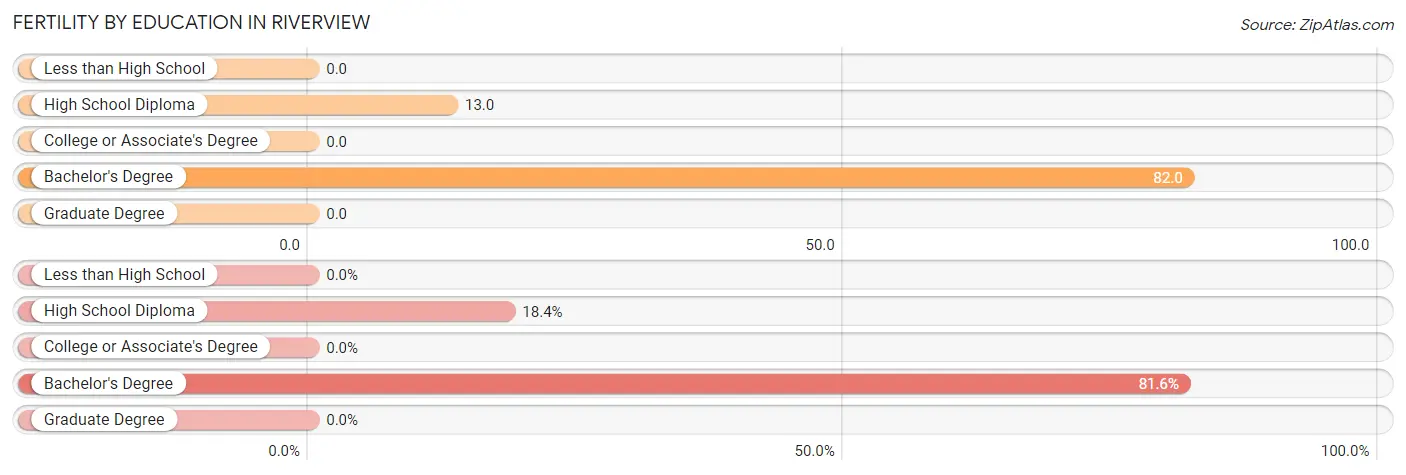
| Educational Attainment | Women with Births | Births / 1,000 Women |
| Less than High School | 0 (0.0%) | 0.0 |
| High School Diploma | 9 (18.4%) | 13.0 |
| College or Associate's Degree | 0 (0.0%) | 0.0 |
| Bachelor's Degree | 40 (81.6%) | 82.0 |
| Graduate Degree | 0 (0.0%) | 0.0 |
| Total | 49 (100.0%) | 21.0 |
Fertility by Education by Marriage Status in Riverview
18.4% of women with births in Riverview are unmarried. Women with the educational attainment of bachelor's degree are most likely to be married with 100.0% of them married at childbirth, while women with the educational attainment of high school diploma are least likely to be married with 100.0% of them unmarried at childbirth.
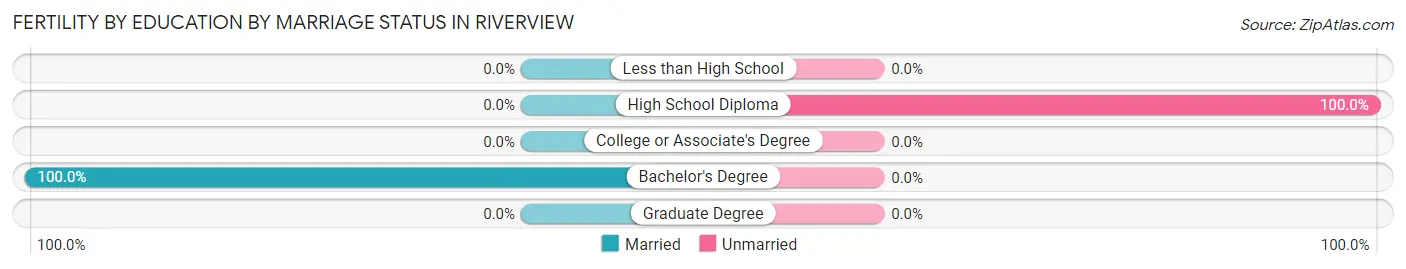
| Educational Attainment | Married | Unmarried |
| Less than High School | 0 (0.0%) | 0 (0.0%) |
| High School Diploma | 0 (0.0%) | 9 (100.0%) |
| College or Associate's Degree | 0 (0.0%) | 0 (0.0%) |
| Bachelor's Degree | 40 (100.0%) | 0 (0.0%) |
| Graduate Degree | 0 (0.0%) | 0 (0.0%) |
| Total | 40 (81.6%) | 9 (18.4%) |
Employment Characteristics in Riverview
Employment by Class of Employer in Riverview
Among the 5,581 employed individuals in Riverview, private company employees (4,777 | 85.6%), local government employees (314 | 5.6%), and not-for-profit organizations (146 | 2.6%) make up the most common classes of employment.
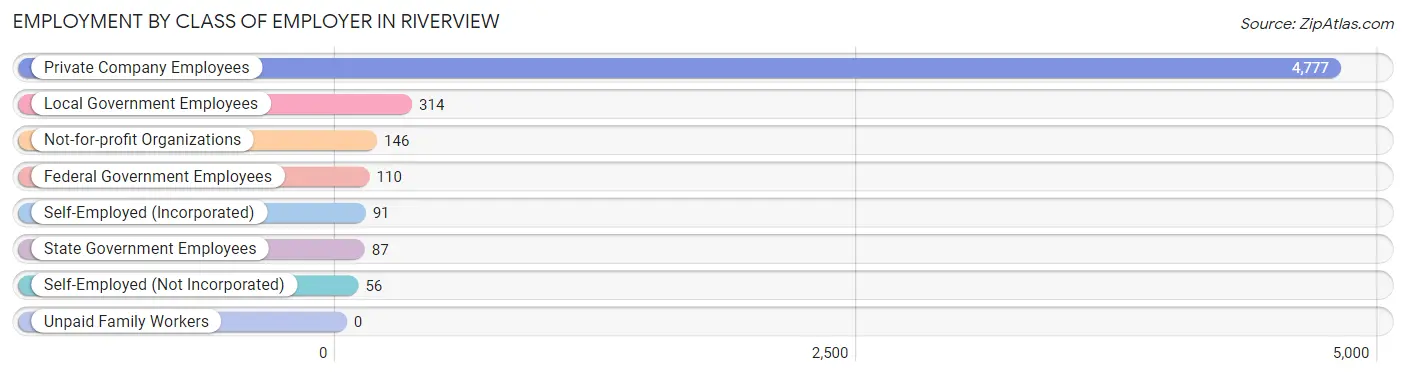
| Employer Class | # Employees | % Employees |
| Private Company Employees | 4,777 | 85.6% |
| Self-Employed (Incorporated) | 91 | 1.6% |
| Self-Employed (Not Incorporated) | 56 | 1.0% |
| Not-for-profit Organizations | 146 | 2.6% |
| Local Government Employees | 314 | 5.6% |
| State Government Employees | 87 | 1.6% |
| Federal Government Employees | 110 | 2.0% |
| Unpaid Family Workers | 0 | 0.0% |
| Total | 5,581 | 100.0% |
Employment Status by Age in Riverview
According to the labor force statistics for Riverview, out of the total population over 16 years of age (10,072), 58.4% or 5,882 individuals are in the labor force, with 3.2% or 188 of them unemployed. The age group with the highest labor force participation rate is 25 to 29 years, with 97.8% or 1,134 individuals in the labor force. Within the labor force, the 60 to 64 years age range has the highest percentage of unemployed individuals, with 9.7% or 25 of them being unemployed.
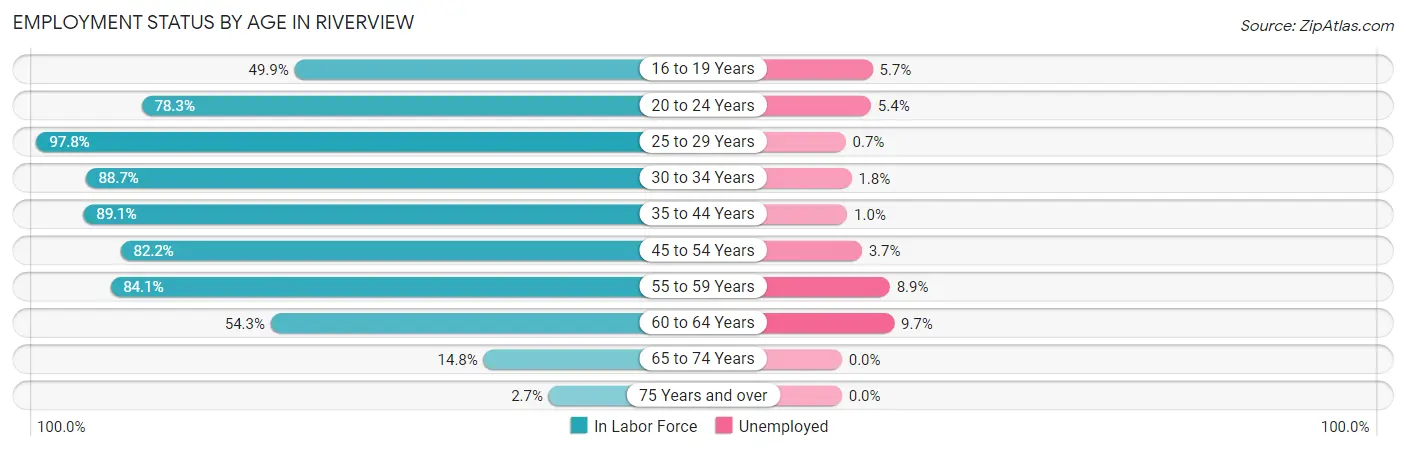
| Age Bracket | In Labor Force | Unemployed |
| 16 to 19 Years | 212 (49.9%) | 12 (5.7%) |
| 20 to 24 Years | 651 (78.3%) | 35 (5.4%) |
| 25 to 29 Years | 1,134 (97.8%) | 8 (0.7%) |
| 30 to 34 Years | 500 (88.7%) | 9 (1.8%) |
| 35 to 44 Years | 1,258 (89.1%) | 13 (1.0%) |
| 45 to 54 Years | 991 (82.2%) | 37 (3.7%) |
| 55 to 59 Years | 576 (84.1%) | 51 (8.9%) |
| 60 to 64 Years | 258 (54.3%) | 25 (9.7%) |
| 65 to 74 Years | 260 (14.8%) | 0 (0.0%) |
| 75 Years and over | 42 (2.7%) | 0 (0.0%) |
| Total | 5,882 (58.4%) | 188 (3.2%) |
Employment Status by Educational Attainment in Riverview
According to labor force statistics for Riverview, 85.7% of individuals (4,714) out of the total population between 25 and 64 years of age (5,501) are in the labor force, with 3.0% or 141 of them being unemployed. The group with the highest labor force participation rate are those with the educational attainment of bachelor's degree or higher, with 92.4% or 1,328 individuals in the labor force. Within the labor force, individuals with bachelor's degree or higher education have the highest percentage of unemployment, with 3.5% or 46 of them being unemployed.
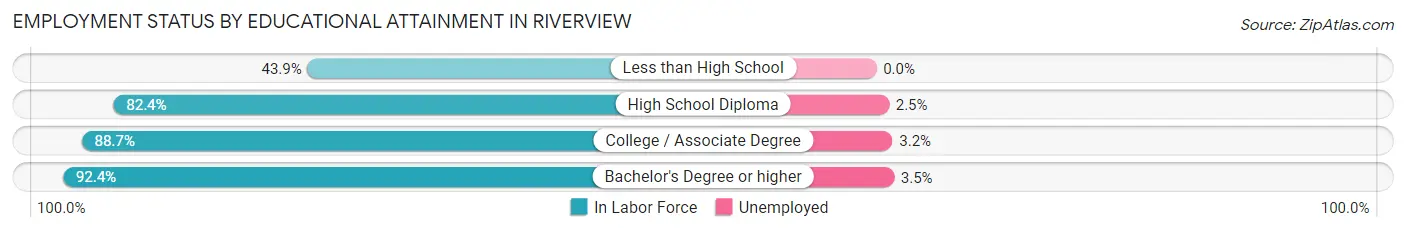
| Educational Attainment | In Labor Force | Unemployed |
| Less than High School | 101 (43.9%) | 0 (0.0%) |
| High School Diploma | 1,494 (82.4%) | 45 (2.5%) |
| College / Associate Degree | 1,793 (88.7%) | 65 (3.2%) |
| Bachelor's Degree or higher | 1,328 (92.4%) | 50 (3.5%) |
| Total | 4,714 (85.7%) | 165 (3.0%) |
Employment Occupations by Sex in Riverview
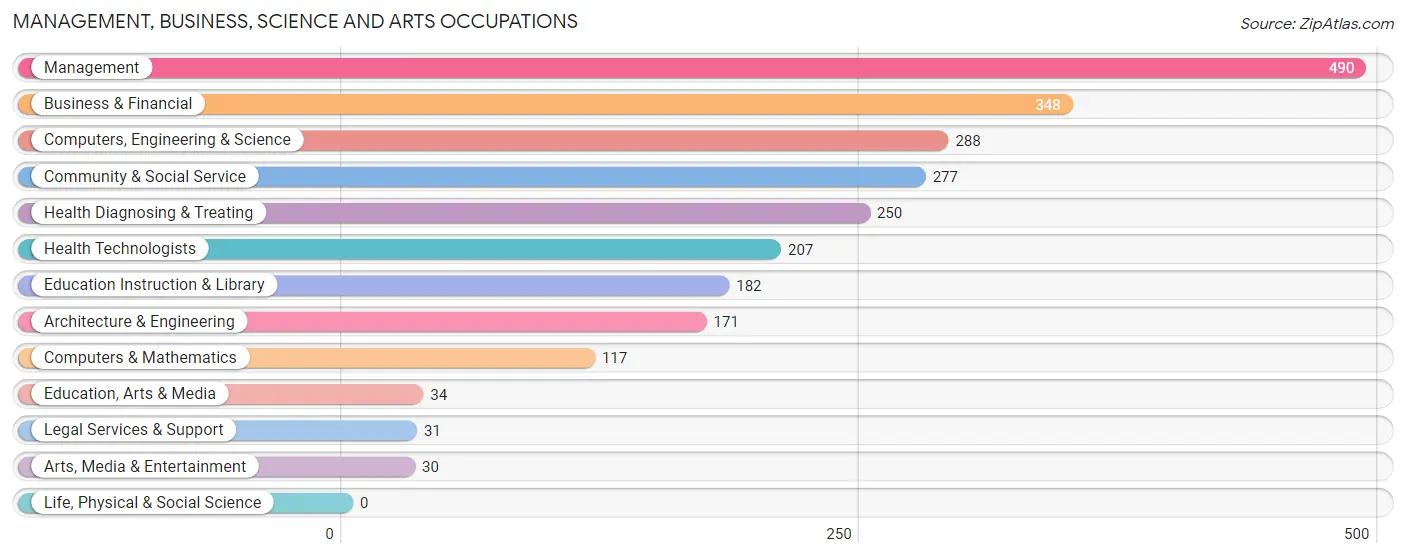
Management, Business, Science and Arts Occupations
The most common Management, Business, Science and Arts occupations in Riverview are Management (490 | 8.6%), Business & Financial (348 | 6.1%), Computers, Engineering & Science (288 | 5.1%), Community & Social Service (277 | 4.9%), and Health Diagnosing & Treating (250 | 4.4%).
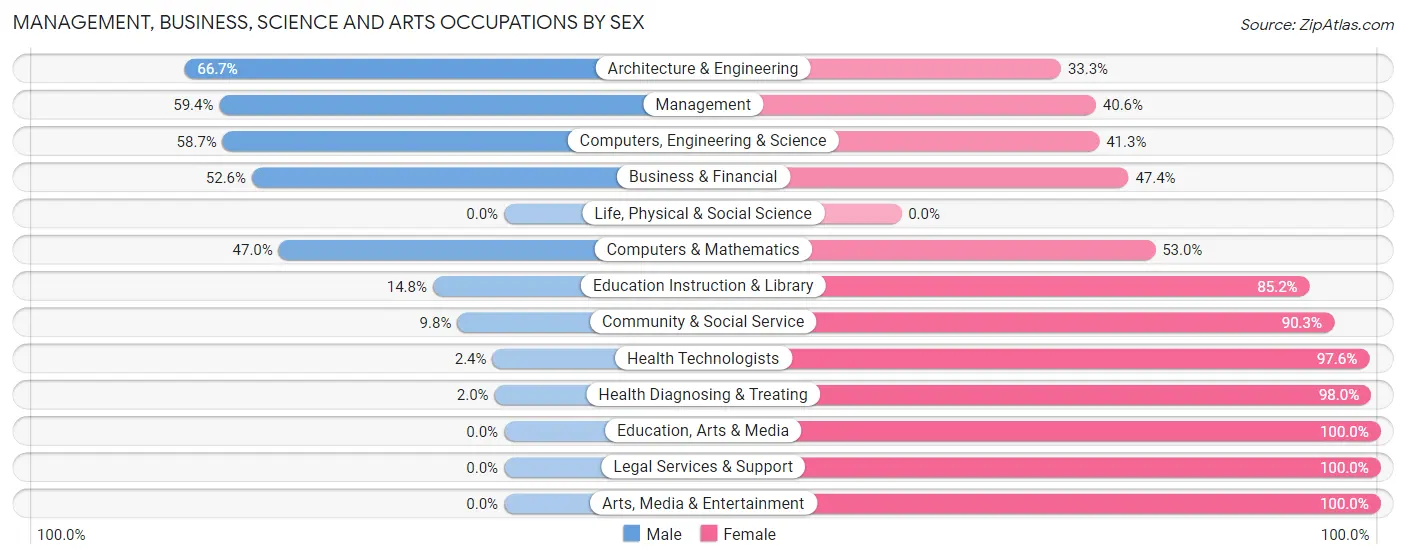
Management, Business, Science and Arts Occupations by Sex
Within the Management, Business, Science and Arts occupations in Riverview, the most male-oriented occupations are Architecture & Engineering (66.7%), Management (59.4%), and Computers, Engineering & Science (58.7%), while the most female-oriented occupations are Education, Arts & Media (100.0%), Legal Services & Support (100.0%), and Arts, Media & Entertainment (100.0%).
| Occupation | Male | Female |
| Management | 291 (59.4%) | 199 (40.6%) |
| Business & Financial | 183 (52.6%) | 165 (47.4%) |
| Computers, Engineering & Science | 169 (58.7%) | 119 (41.3%) |
| Computers & Mathematics | 55 (47.0%) | 62 (53.0%) |
| Architecture & Engineering | 114 (66.7%) | 57 (33.3%) |
| Life, Physical & Social Science | 0 (0.0%) | 0 (0.0%) |
| Community & Social Service | 27 (9.8%) | 250 (90.2%) |
| Education, Arts & Media | 0 (0.0%) | 34 (100.0%) |
| Legal Services & Support | 0 (0.0%) | 31 (100.0%) |
| Education Instruction & Library | 27 (14.8%) | 155 (85.2%) |
| Arts, Media & Entertainment | 0 (0.0%) | 30 (100.0%) |
| Health Diagnosing & Treating | 5 (2.0%) | 245 (98.0%) |
| Health Technologists | 5 (2.4%) | 202 (97.6%) |
| Total (Category) | 675 (40.8%) | 978 (59.2%) |
| Total (Overall) | 3,266 (57.4%) | 2,426 (42.6%) |
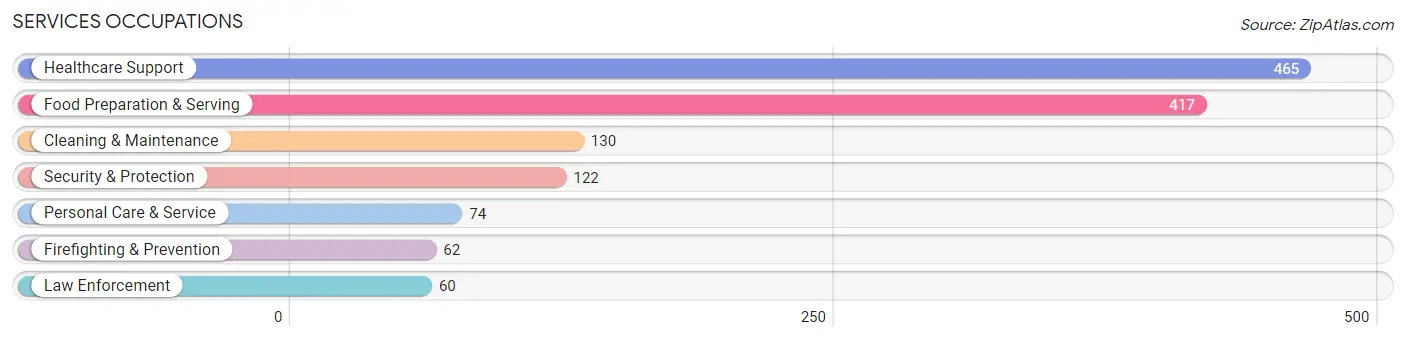
Services Occupations
The most common Services occupations in Riverview are Healthcare Support (465 | 8.2%), Food Preparation & Serving (417 | 7.3%), Cleaning & Maintenance (130 | 2.3%), Security & Protection (122 | 2.1%), and Personal Care & Service (74 | 1.3%).
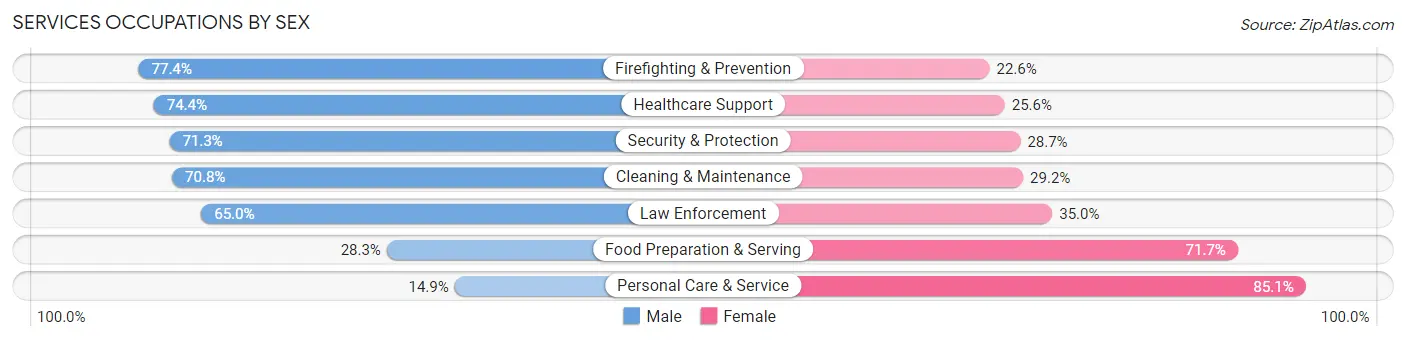
Services Occupations by Sex
Within the Services occupations in Riverview, the most male-oriented occupations are Firefighting & Prevention (77.4%), Healthcare Support (74.4%), and Security & Protection (71.3%), while the most female-oriented occupations are Personal Care & Service (85.1%), Food Preparation & Serving (71.7%), and Law Enforcement (35.0%).
| Occupation | Male | Female |
| Healthcare Support | 346 (74.4%) | 119 (25.6%) |
| Security & Protection | 87 (71.3%) | 35 (28.7%) |
| Firefighting & Prevention | 48 (77.4%) | 14 (22.6%) |
| Law Enforcement | 39 (65.0%) | 21 (35.0%) |
| Food Preparation & Serving | 118 (28.3%) | 299 (71.7%) |
| Cleaning & Maintenance | 92 (70.8%) | 38 (29.2%) |
| Personal Care & Service | 11 (14.9%) | 63 (85.1%) |
| Total (Category) | 654 (54.1%) | 554 (45.9%) |
| Total (Overall) | 3,266 (57.4%) | 2,426 (42.6%) |
Sales and Office Occupations
The most common Sales and Office occupations in Riverview are Office & Administration (758 | 13.3%), and Sales & Related (344 | 6.0%).
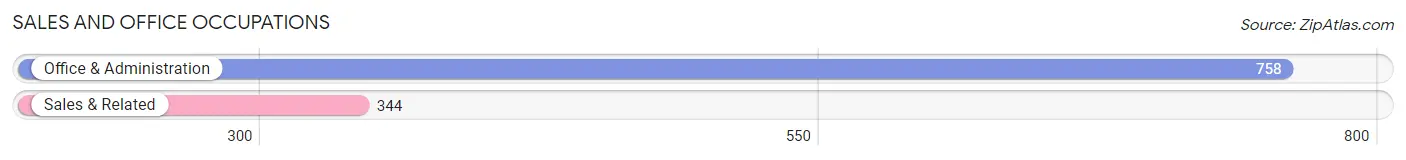
Sales and Office Occupations by Sex
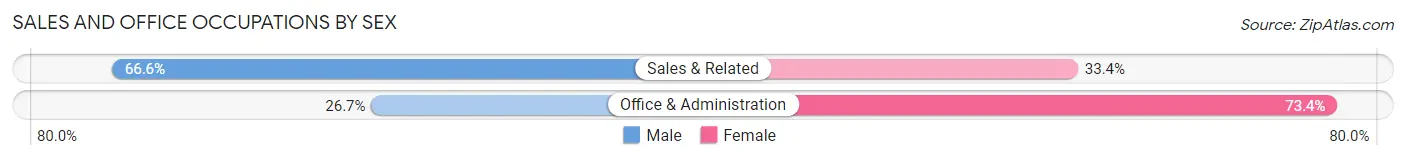
| Occupation | Male | Female |
| Sales & Related | 229 (66.6%) | 115 (33.4%) |
| Office & Administration | 202 (26.7%) | 556 (73.4%) |
| Total (Category) | 431 (39.1%) | 671 (60.9%) |
| Total (Overall) | 3,266 (57.4%) | 2,426 (42.6%) |
Natural Resources, Construction and Maintenance Occupations
The most common Natural Resources, Construction and Maintenance occupations in Riverview are Installation, Maintenance & Repair (322 | 5.7%), and Construction & Extraction (167 | 2.9%).

Natural Resources, Construction and Maintenance Occupations by Sex

| Occupation | Male | Female |
| Farming, Fishing & Forestry | 0 (0.0%) | 0 (0.0%) |
| Construction & Extraction | 167 (100.0%) | 0 (0.0%) |
| Installation, Maintenance & Repair | 322 (100.0%) | 0 (0.0%) |
| Total (Category) | 489 (100.0%) | 0 (0.0%) |
| Total (Overall) | 3,266 (57.4%) | 2,426 (42.6%) |
Production, Transportation and Moving Occupations
The most common Production, Transportation and Moving occupations in Riverview are Production (790 | 13.9%), Transportation (259 | 4.5%), and Material Moving (191 | 3.4%).
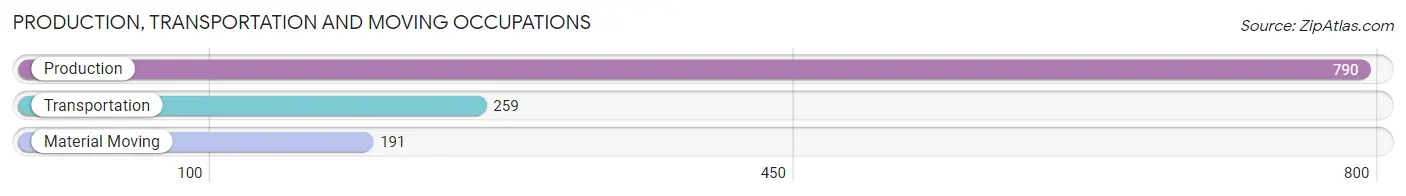
Production, Transportation and Moving Occupations by Sex
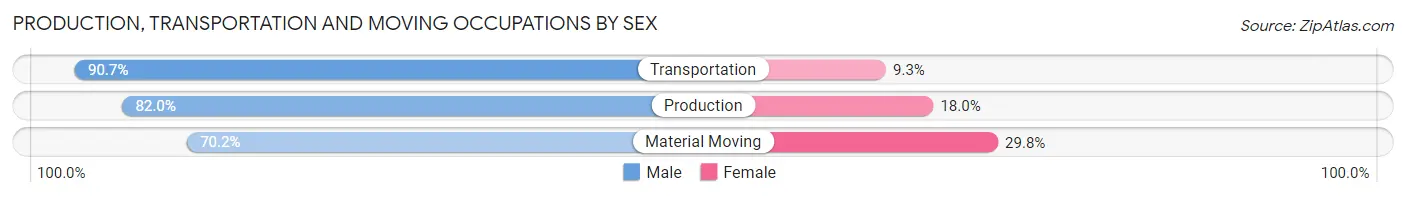
| Occupation | Male | Female |
| Production | 648 (82.0%) | 142 (18.0%) |
| Transportation | 235 (90.7%) | 24 (9.3%) |
| Material Moving | 134 (70.2%) | 57 (29.8%) |
| Total (Category) | 1,017 (82.0%) | 223 (18.0%) |
| Total (Overall) | 3,266 (57.4%) | 2,426 (42.6%) |
Employment Industries by Sex in Riverview
Employment Industries in Riverview
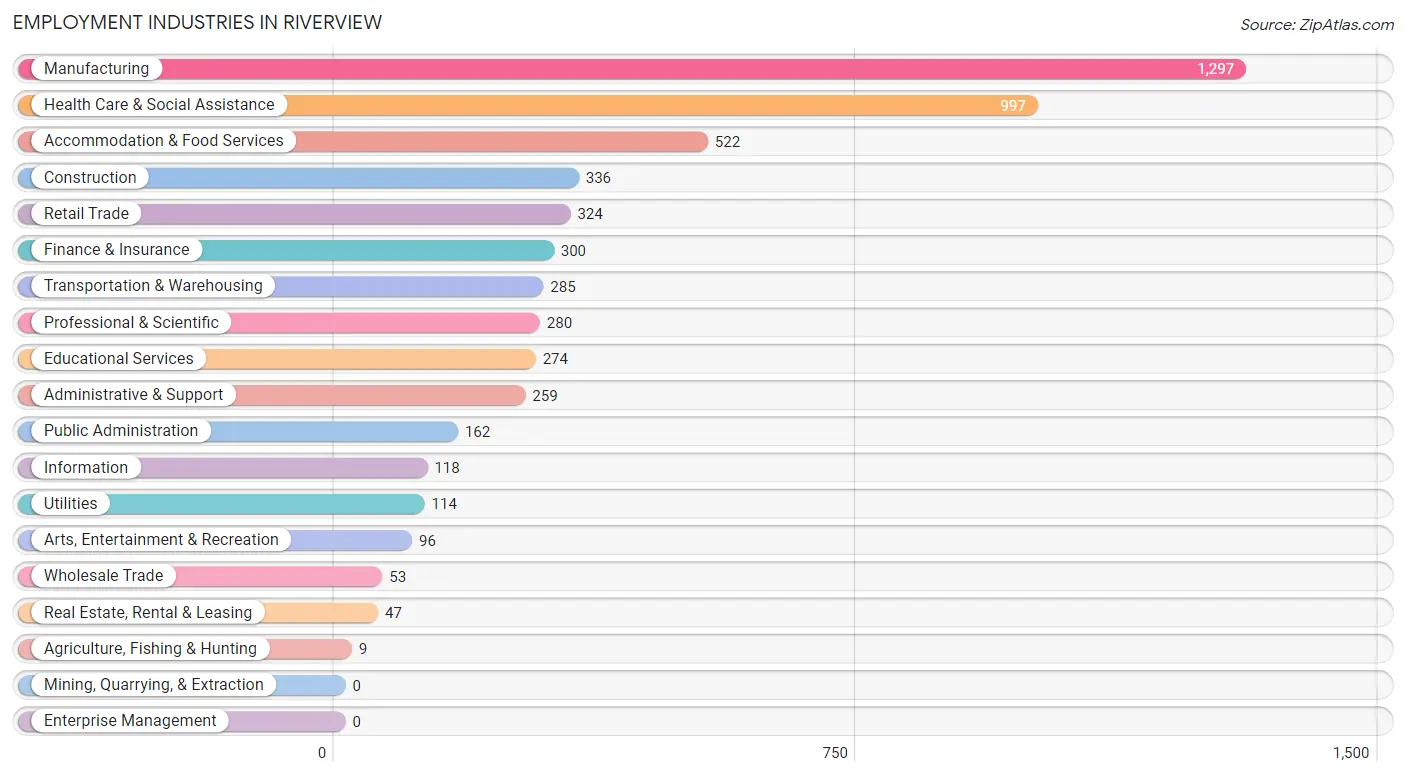
The major employment industries in Riverview include Manufacturing (1,297 | 22.8%), Health Care & Social Assistance (997 | 17.5%), Accommodation & Food Services (522 | 9.2%), Construction (336 | 5.9%), and Retail Trade (324 | 5.7%).
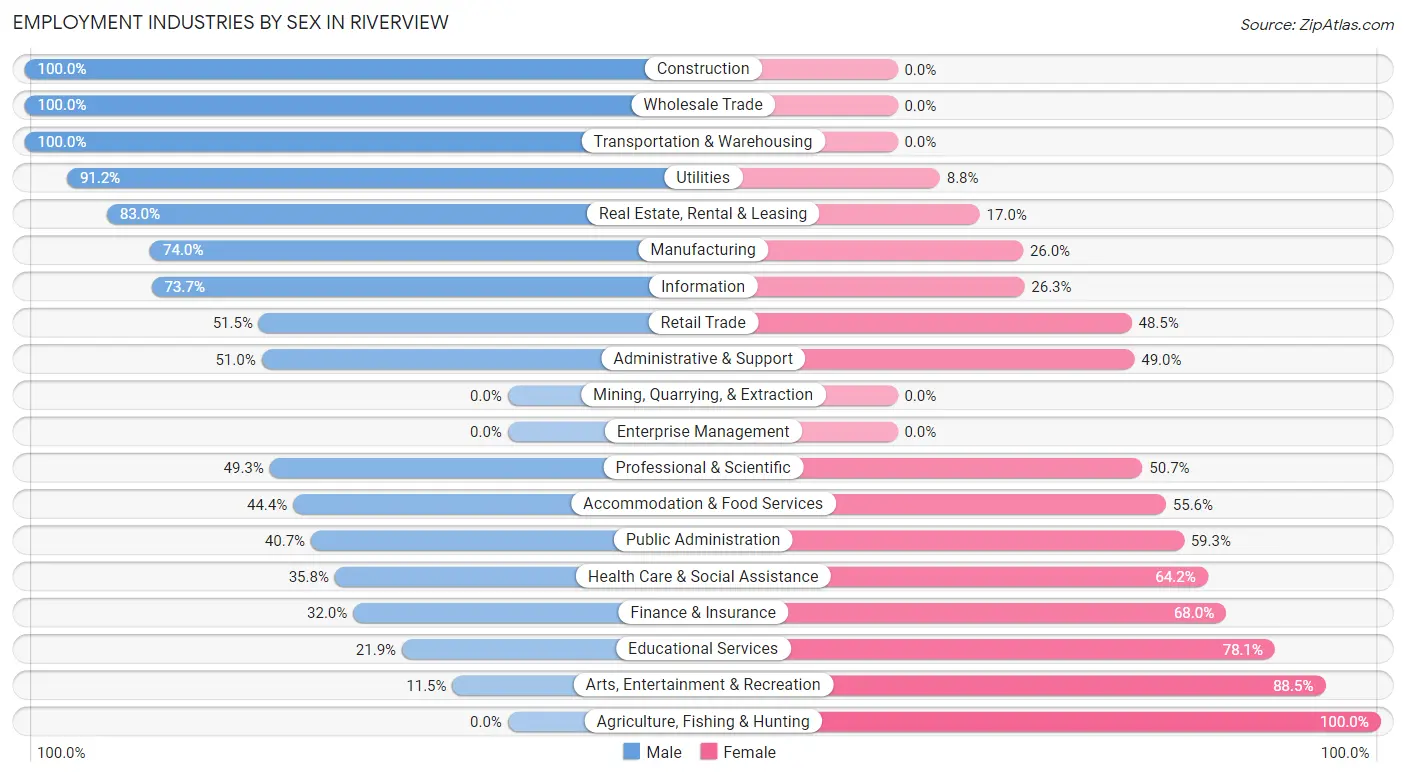
Employment Industries by Sex in Riverview
The Riverview industries that see more men than women are Construction (100.0%), Wholesale Trade (100.0%), and Transportation & Warehousing (100.0%), whereas the industries that tend to have a higher number of women are Agriculture, Fishing & Hunting (100.0%), Arts, Entertainment & Recreation (88.5%), and Educational Services (78.1%).
| Industry | Male | Female |
| Agriculture, Fishing & Hunting | 0 (0.0%) | 9 (100.0%) |
| Mining, Quarrying, & Extraction | 0 (0.0%) | 0 (0.0%) |
| Construction | 336 (100.0%) | 0 (0.0%) |
| Manufacturing | 960 (74.0%) | 337 (26.0%) |
| Wholesale Trade | 53 (100.0%) | 0 (0.0%) |
| Retail Trade | 167 (51.5%) | 157 (48.5%) |
| Transportation & Warehousing | 285 (100.0%) | 0 (0.0%) |
| Utilities | 104 (91.2%) | 10 (8.8%) |
| Information | 87 (73.7%) | 31 (26.3%) |
| Finance & Insurance | 96 (32.0%) | 204 (68.0%) |
| Real Estate, Rental & Leasing | 39 (83.0%) | 8 (17.0%) |
| Professional & Scientific | 138 (49.3%) | 142 (50.7%) |
| Enterprise Management | 0 (0.0%) | 0 (0.0%) |
| Administrative & Support | 132 (51.0%) | 127 (49.0%) |
| Educational Services | 60 (21.9%) | 214 (78.1%) |
| Health Care & Social Assistance | 357 (35.8%) | 640 (64.2%) |
| Arts, Entertainment & Recreation | 11 (11.5%) | 85 (88.5%) |
| Accommodation & Food Services | 232 (44.4%) | 290 (55.6%) |
| Public Administration | 66 (40.7%) | 96 (59.3%) |
| Total | 3,266 (57.4%) | 2,426 (42.6%) |
Education in Riverview
School Enrollment in Riverview
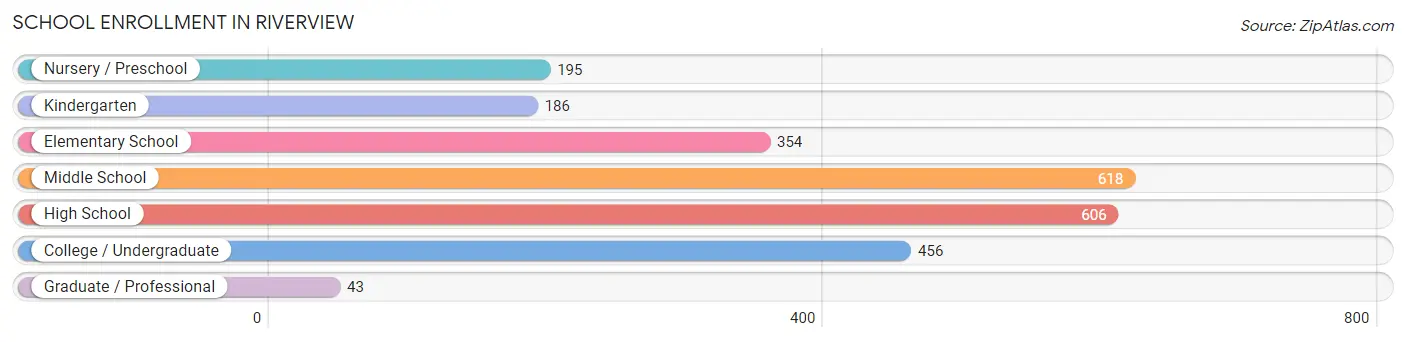
The most common levels of schooling among the 2,458 students in Riverview are middle school (618 | 25.1%), high school (606 | 24.6%), and college / undergraduate (456 | 18.5%).
| School Level | # Students | % Students |
| Nursery / Preschool | 195 | 7.9% |
| Kindergarten | 186 | 7.6% |
| Elementary School | 354 | 14.4% |
| Middle School | 618 | 25.1% |
| High School | 606 | 24.6% |
| College / Undergraduate | 456 | 18.5% |
| Graduate / Professional | 43 | 1.8% |
| Total | 2,458 | 100.0% |
School Enrollment by Age by Funding Source in Riverview
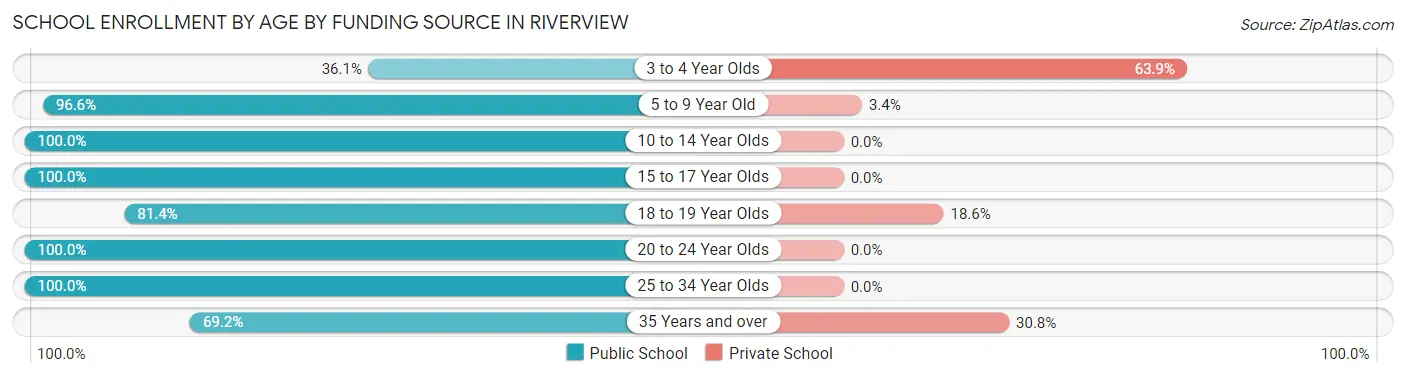
Out of a total of 2,458 students who are enrolled in schools in Riverview, 199 (8.1%) attend a private institution, while the remaining 2,259 (91.9%) are enrolled in public schools. The age group of 3 to 4 year olds has the highest likelihood of being enrolled in private schools, with 108 (63.9% in the age bracket) enrolled. Conversely, the age group of 10 to 14 year olds has the lowest likelihood of being enrolled in a private school, with 845 (100.0% in the age bracket) attending a public institution.
| Age Bracket | Public School | Private School |
| 3 to 4 Year Olds | 61 (36.1%) | 108 (63.9%) |
| 5 to 9 Year Old | 481 (96.6%) | 17 (3.4%) |
| 10 to 14 Year Olds | 845 (100.0%) | 0 (0.0%) |
| 15 to 17 Year Olds | 383 (100.0%) | 0 (0.0%) |
| 18 to 19 Year Olds | 70 (81.4%) | 16 (18.6%) |
| 20 to 24 Year Olds | 148 (100.0%) | 0 (0.0%) |
| 25 to 34 Year Olds | 144 (100.0%) | 0 (0.0%) |
| 35 Years and over | 128 (69.2%) | 57 (30.8%) |
| Total | 2,259 (91.9%) | 199 (8.1%) |
Educational Attainment by Field of Study in Riverview
Business (576 | 24.4%), education (392 | 16.6%), engineering (281 | 11.9%), science & technology (250 | 10.6%), and communications (183 | 7.7%) are the most common fields of study among 2,364 individuals in Riverview who have obtained a bachelor's degree or higher.
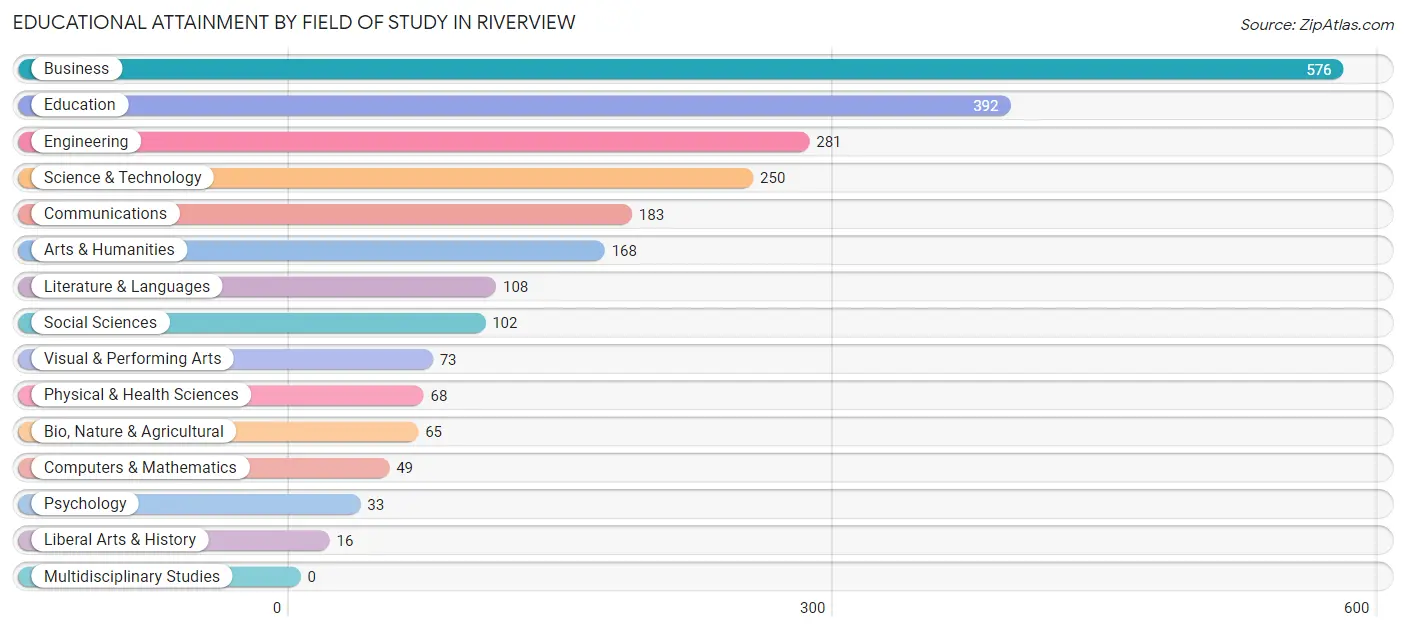
| Field of Study | # Graduates | % Graduates |
| Computers & Mathematics | 49 | 2.1% |
| Bio, Nature & Agricultural | 65 | 2.8% |
| Physical & Health Sciences | 68 | 2.9% |
| Psychology | 33 | 1.4% |
| Social Sciences | 102 | 4.3% |
| Engineering | 281 | 11.9% |
| Multidisciplinary Studies | 0 | 0.0% |
| Science & Technology | 250 | 10.6% |
| Business | 576 | 24.4% |
| Education | 392 | 16.6% |
| Literature & Languages | 108 | 4.6% |
| Liberal Arts & History | 16 | 0.7% |
| Visual & Performing Arts | 73 | 3.1% |
| Communications | 183 | 7.7% |
| Arts & Humanities | 168 | 7.1% |
| Total | 2,364 | 100.0% |
Transportation & Commute in Riverview
Vehicle Availability by Sex in Riverview
The most prevalent vehicle ownership categories in Riverview are males with 2 vehicles (1,985, accounting for 61.4%) and females with 2 vehicles (1,283, making up 84.6%).
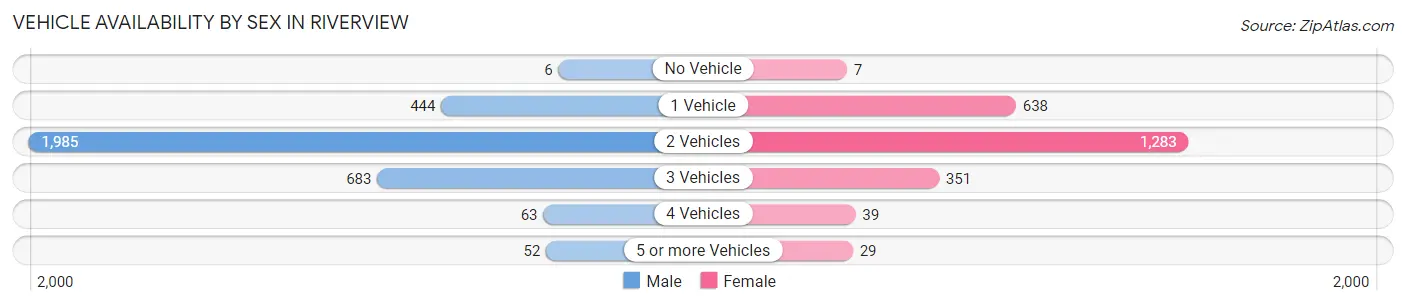
| Vehicles Available | Male | Female |
| No Vehicle | 6 (0.2%) | 7 (0.3%) |
| 1 Vehicle | 444 (13.7%) | 638 (27.2%) |
| 2 Vehicles | 1,985 (61.4%) | 1,283 (54.7%) |
| 3 Vehicles | 683 (21.1%) | 351 (15.0%) |
| 4 Vehicles | 63 (1.9%) | 39 (1.7%) |
| 5 or more Vehicles | 52 (1.6%) | 29 (1.2%) |
| Total | 3,233 (100.0%) | 2,347 (100.0%) |
Commute Time in Riverview
The most frequently occuring commute durations in Riverview are 5 to 9 minutes (853 commuters, 17.0%), 30 to 34 minutes (733 commuters, 14.6%), and 45 to 59 minutes (660 commuters, 13.1%).
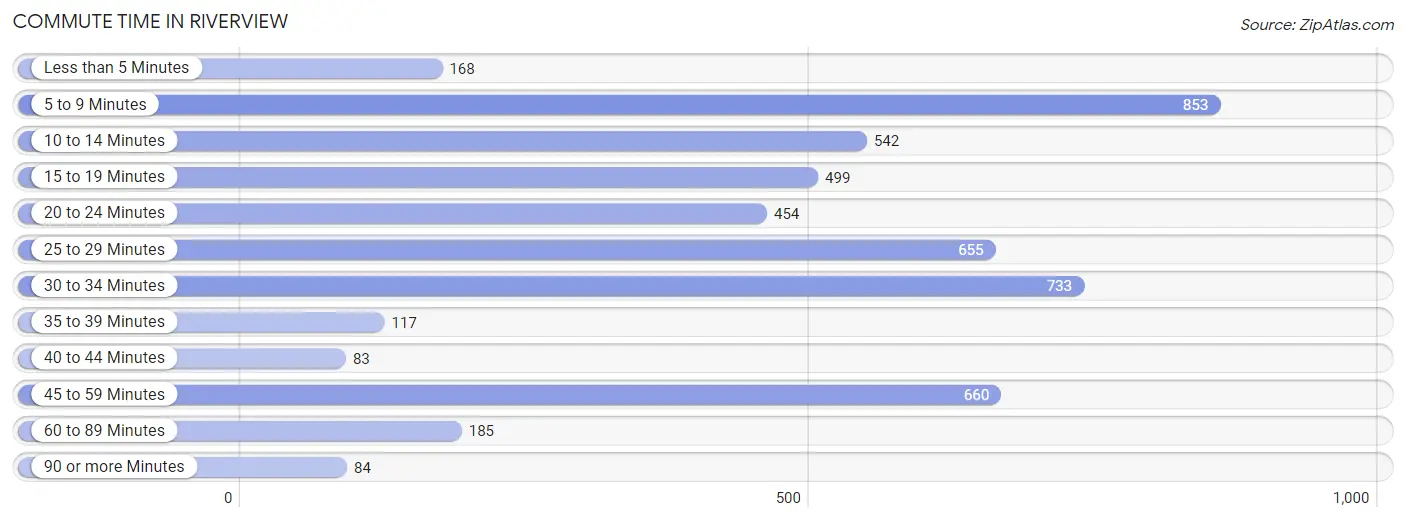
| Commute Time | # Commuters | % Commuters |
| Less than 5 Minutes | 168 | 3.3% |
| 5 to 9 Minutes | 853 | 17.0% |
| 10 to 14 Minutes | 542 | 10.8% |
| 15 to 19 Minutes | 499 | 9.9% |
| 20 to 24 Minutes | 454 | 9.0% |
| 25 to 29 Minutes | 655 | 13.0% |
| 30 to 34 Minutes | 733 | 14.6% |
| 35 to 39 Minutes | 117 | 2.3% |
| 40 to 44 Minutes | 83 | 1.7% |
| 45 to 59 Minutes | 660 | 13.1% |
| 60 to 89 Minutes | 185 | 3.7% |
| 90 or more Minutes | 84 | 1.7% |
Commute Time by Sex in Riverview
The most common commute times in Riverview are 30 to 34 minutes (517 commuters, 17.3%) for males and 5 to 9 minutes (342 commuters, 16.8%) for females.
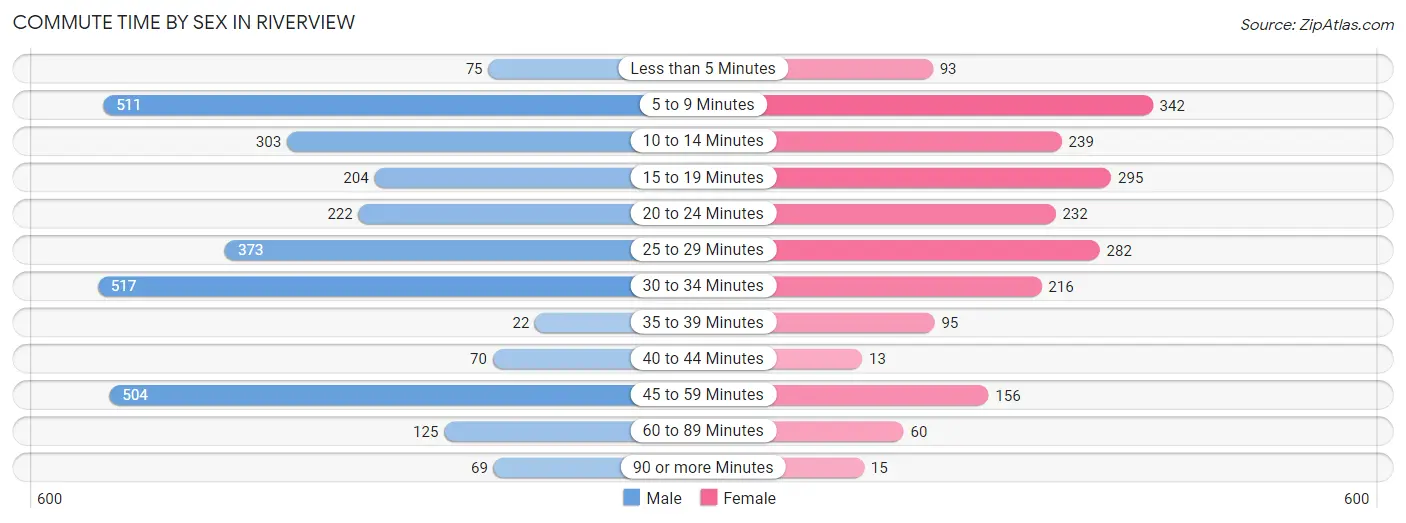
| Commute Time | Male | Female |
| Less than 5 Minutes | 75 (2.5%) | 93 (4.6%) |
| 5 to 9 Minutes | 511 (17.1%) | 342 (16.8%) |
| 10 to 14 Minutes | 303 (10.1%) | 239 (11.7%) |
| 15 to 19 Minutes | 204 (6.8%) | 295 (14.5%) |
| 20 to 24 Minutes | 222 (7.4%) | 232 (11.4%) |
| 25 to 29 Minutes | 373 (12.4%) | 282 (13.8%) |
| 30 to 34 Minutes | 517 (17.3%) | 216 (10.6%) |
| 35 to 39 Minutes | 22 (0.7%) | 95 (4.7%) |
| 40 to 44 Minutes | 70 (2.3%) | 13 (0.6%) |
| 45 to 59 Minutes | 504 (16.8%) | 156 (7.6%) |
| 60 to 89 Minutes | 125 (4.2%) | 60 (2.9%) |
| 90 or more Minutes | 69 (2.3%) | 15 (0.7%) |
Time of Departure to Work by Sex in Riverview
The most frequent times of departure to work in Riverview are 7:30 AM to 7:59 AM (498, 16.6%) for males and 7:00 AM to 7:29 AM (397, 19.5%) for females.
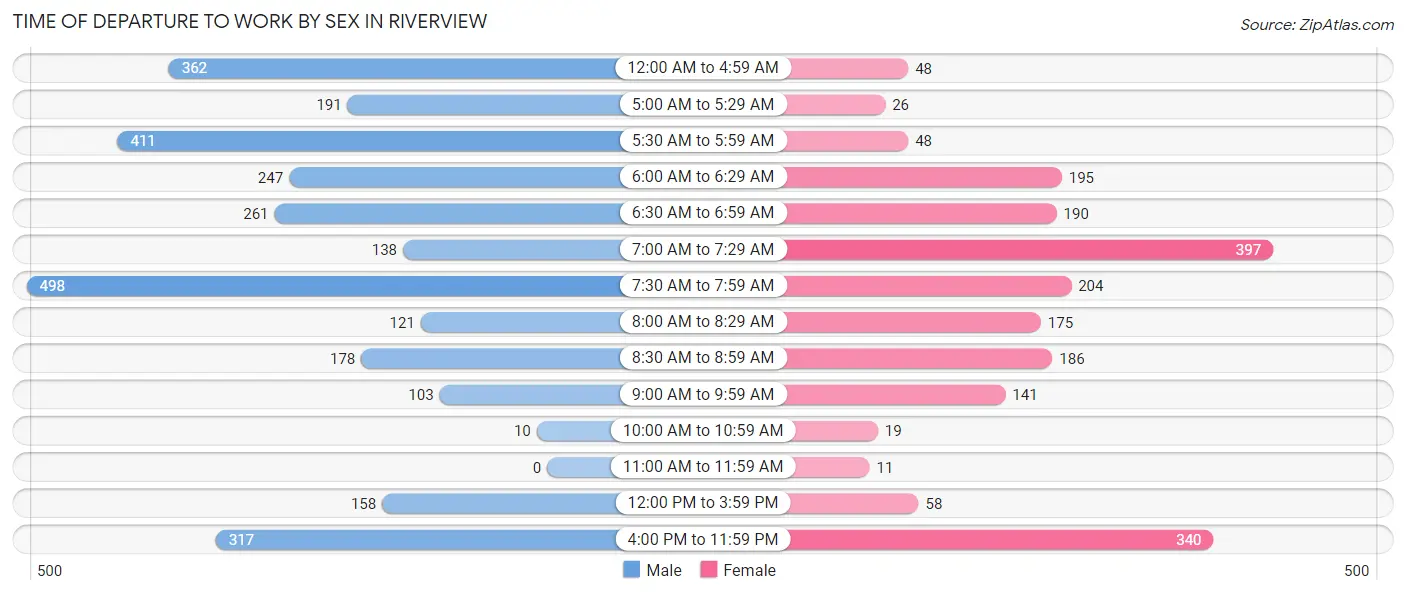
| Time of Departure | Male | Female |
| 12:00 AM to 4:59 AM | 362 (12.1%) | 48 (2.4%) |
| 5:00 AM to 5:29 AM | 191 (6.4%) | 26 (1.3%) |
| 5:30 AM to 5:59 AM | 411 (13.7%) | 48 (2.4%) |
| 6:00 AM to 6:29 AM | 247 (8.3%) | 195 (9.6%) |
| 6:30 AM to 6:59 AM | 261 (8.7%) | 190 (9.3%) |
| 7:00 AM to 7:29 AM | 138 (4.6%) | 397 (19.5%) |
| 7:30 AM to 7:59 AM | 498 (16.6%) | 204 (10.0%) |
| 8:00 AM to 8:29 AM | 121 (4.0%) | 175 (8.6%) |
| 8:30 AM to 8:59 AM | 178 (5.9%) | 186 (9.1%) |
| 9:00 AM to 9:59 AM | 103 (3.4%) | 141 (6.9%) |
| 10:00 AM to 10:59 AM | 10 (0.3%) | 19 (0.9%) |
| 11:00 AM to 11:59 AM | 0 (0.0%) | 11 (0.5%) |
| 12:00 PM to 3:59 PM | 158 (5.3%) | 58 (2.9%) |
| 4:00 PM to 11:59 PM | 317 (10.6%) | 340 (16.7%) |
| Total | 2,995 (100.0%) | 2,038 (100.0%) |
Housing Occupancy in Riverview
Occupancy by Ownership in Riverview
Of the total 5,162 dwellings in Riverview, owner-occupied units account for 3,186 (61.7%), while renter-occupied units make up 1,976 (38.3%).
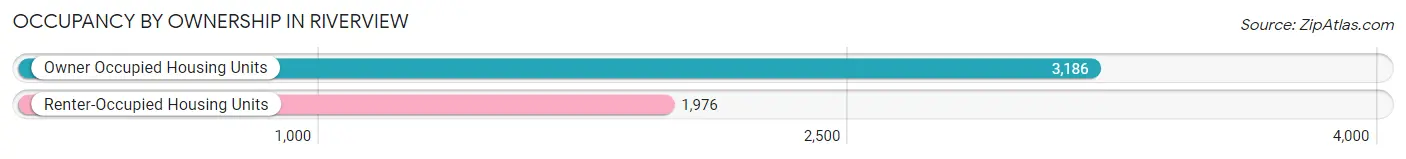
| Occupancy | # Housing Units | % Housing Units |
| Owner Occupied Housing Units | 3,186 | 61.7% |
| Renter-Occupied Housing Units | 1,976 | 38.3% |
| Total Occupied Housing Units | 5,162 | 100.0% |
Occupancy by Household Size in Riverview
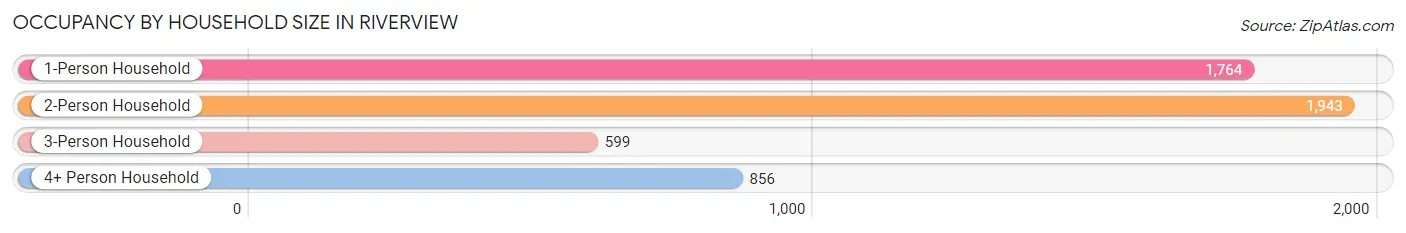
| Household Size | # Housing Units | % Housing Units |
| 1-Person Household | 1,764 | 34.2% |
| 2-Person Household | 1,943 | 37.6% |
| 3-Person Household | 599 | 11.6% |
| 4+ Person Household | 856 | 16.6% |
| Total Housing Units | 5,162 | 100.0% |
Occupancy by Ownership by Household Size in Riverview
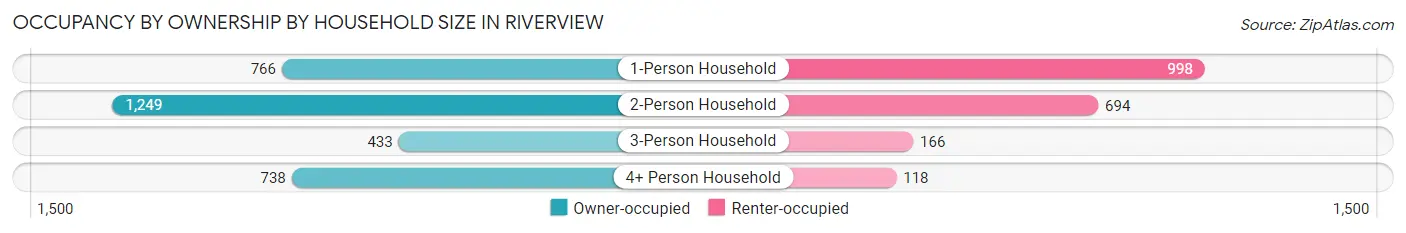
| Household Size | Owner-occupied | Renter-occupied |
| 1-Person Household | 766 (43.4%) | 998 (56.6%) |
| 2-Person Household | 1,249 (64.3%) | 694 (35.7%) |
| 3-Person Household | 433 (72.3%) | 166 (27.7%) |
| 4+ Person Household | 738 (86.2%) | 118 (13.8%) |
| Total Housing Units | 3,186 (61.7%) | 1,976 (38.3%) |
Occupancy by Educational Attainment in Riverview
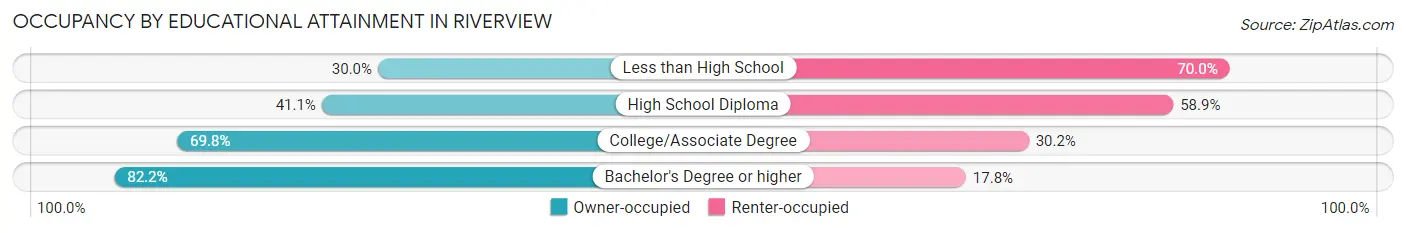
| Household Size | Owner-occupied | Renter-occupied |
| Less than High School | 83 (30.0%) | 194 (70.0%) |
| High School Diploma | 670 (41.1%) | 960 (58.9%) |
| College/Associate Degree | 1,361 (69.8%) | 590 (30.2%) |
| Bachelor's Degree or higher | 1,072 (82.2%) | 232 (17.8%) |
Occupancy by Age of Householder in Riverview
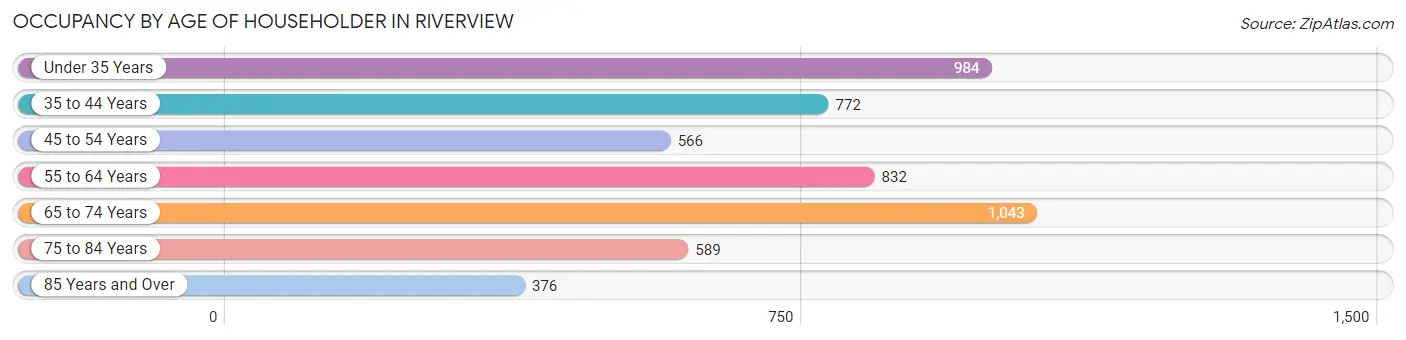
| Age Bracket | # Households | % Households |
| Under 35 Years | 984 | 19.1% |
| 35 to 44 Years | 772 | 15.0% |
| 45 to 54 Years | 566 | 11.0% |
| 55 to 64 Years | 832 | 16.1% |
| 65 to 74 Years | 1,043 | 20.2% |
| 75 to 84 Years | 589 | 11.4% |
| 85 Years and Over | 376 | 7.3% |
| Total | 5,162 | 100.0% |
Housing Finances in Riverview
Median Income by Occupancy in Riverview
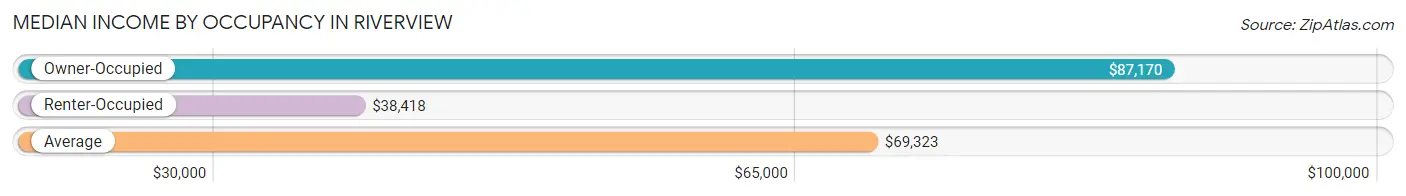
| Occupancy Type | # Households | Median Income |
| Owner-Occupied | 3,186 (61.7%) | $87,170 |
| Renter-Occupied | 1,976 (38.3%) | $38,418 |
| Average | 5,162 (100.0%) | $69,323 |
Occupancy by Householder Income Bracket in Riverview
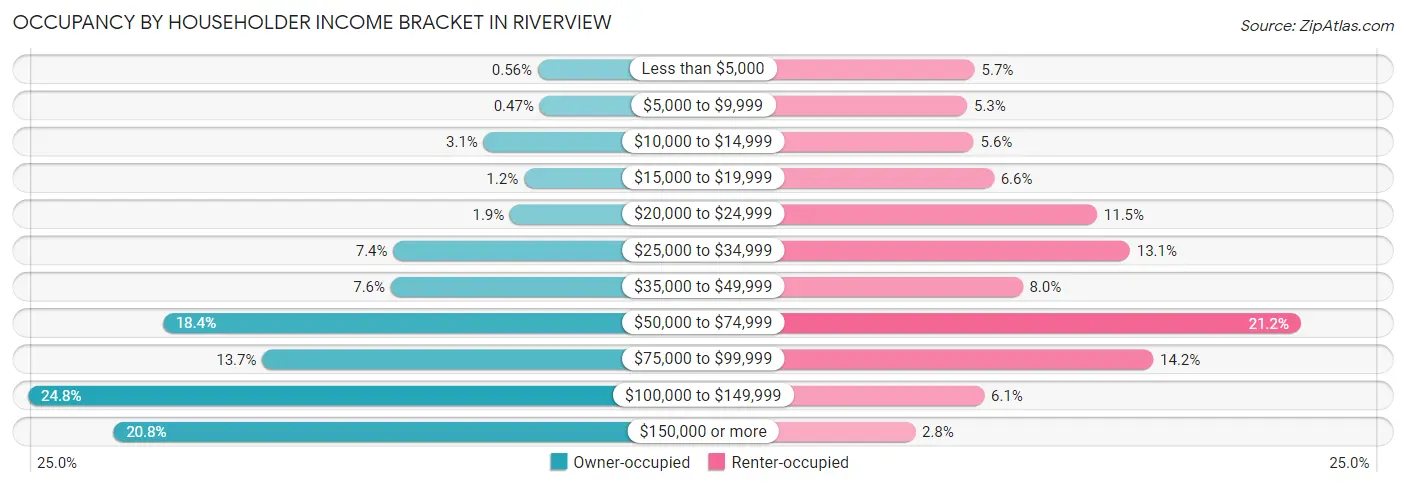
| Income Bracket | Owner-occupied | Renter-occupied |
| Less than $5,000 | 18 (0.6%) | 112 (5.7%) |
| $5,000 to $9,999 | 15 (0.5%) | 105 (5.3%) |
| $10,000 to $14,999 | 100 (3.1%) | 111 (5.6%) |
| $15,000 to $19,999 | 39 (1.2%) | 130 (6.6%) |
| $20,000 to $24,999 | 60 (1.9%) | 227 (11.5%) |
| $25,000 to $34,999 | 237 (7.4%) | 258 (13.1%) |
| $35,000 to $49,999 | 241 (7.6%) | 157 (8.0%) |
| $50,000 to $74,999 | 587 (18.4%) | 419 (21.2%) |
| $75,000 to $99,999 | 436 (13.7%) | 280 (14.2%) |
| $100,000 to $149,999 | 791 (24.8%) | 121 (6.1%) |
| $150,000 or more | 662 (20.8%) | 56 (2.8%) |
| Total | 3,186 (100.0%) | 1,976 (100.0%) |
Monthly Housing Cost Tiers in Riverview
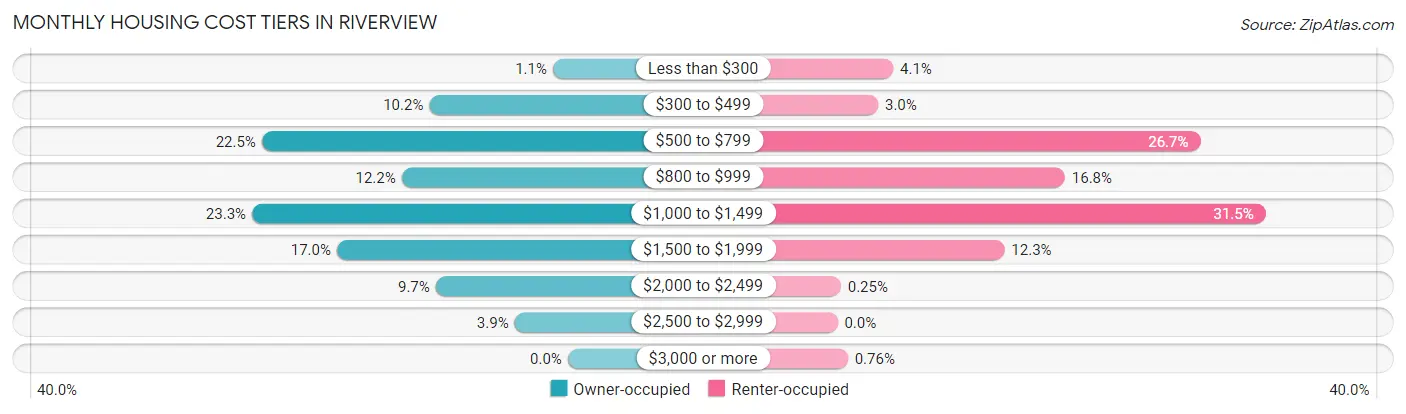
| Monthly Cost | Owner-occupied | Renter-occupied |
| Less than $300 | 35 (1.1%) | 81 (4.1%) |
| $300 to $499 | 325 (10.2%) | 59 (3.0%) |
| $500 to $799 | 718 (22.5%) | 528 (26.7%) |
| $800 to $999 | 390 (12.2%) | 331 (16.8%) |
| $1,000 to $1,499 | 741 (23.3%) | 623 (31.5%) |
| $1,500 to $1,999 | 542 (17.0%) | 243 (12.3%) |
| $2,000 to $2,499 | 310 (9.7%) | 5 (0.3%) |
| $2,500 to $2,999 | 125 (3.9%) | 0 (0.0%) |
| $3,000 or more | 0 (0.0%) | 15 (0.8%) |
| Total | 3,186 (100.0%) | 1,976 (100.0%) |
Physical Housing Characteristics in Riverview
Housing Structures in Riverview
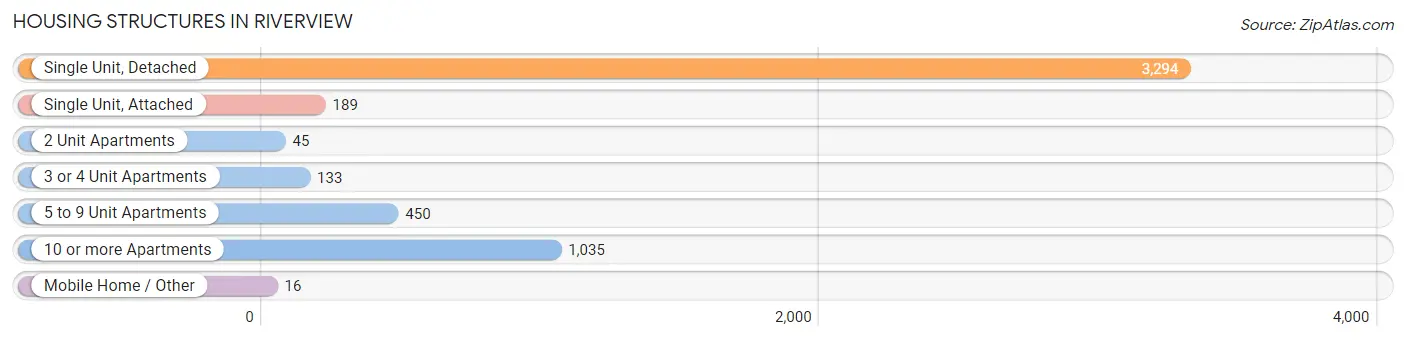
| Structure Type | # Housing Units | % Housing Units |
| Single Unit, Detached | 3,294 | 63.8% |
| Single Unit, Attached | 189 | 3.7% |
| 2 Unit Apartments | 45 | 0.9% |
| 3 or 4 Unit Apartments | 133 | 2.6% |
| 5 to 9 Unit Apartments | 450 | 8.7% |
| 10 or more Apartments | 1,035 | 20.1% |
| Mobile Home / Other | 16 | 0.3% |
| Total | 5,162 | 100.0% |
Housing Structures by Occupancy in Riverview
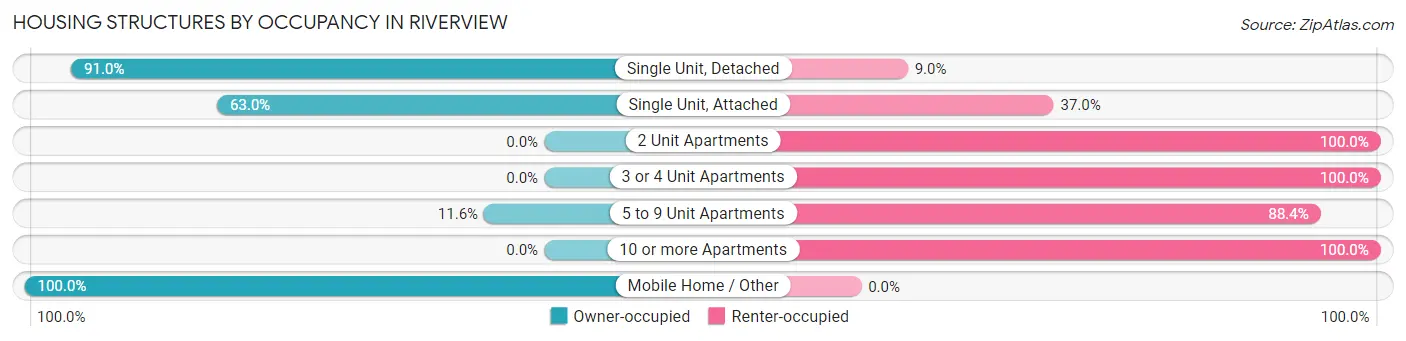
| Structure Type | Owner-occupied | Renter-occupied |
| Single Unit, Detached | 2,999 (91.0%) | 295 (9.0%) |
| Single Unit, Attached | 119 (63.0%) | 70 (37.0%) |
| 2 Unit Apartments | 0 (0.0%) | 45 (100.0%) |
| 3 or 4 Unit Apartments | 0 (0.0%) | 133 (100.0%) |
| 5 to 9 Unit Apartments | 52 (11.6%) | 398 (88.4%) |
| 10 or more Apartments | 0 (0.0%) | 1,035 (100.0%) |
| Mobile Home / Other | 16 (100.0%) | 0 (0.0%) |
| Total | 3,186 (61.7%) | 1,976 (38.3%) |
Housing Structures by Number of Rooms in Riverview
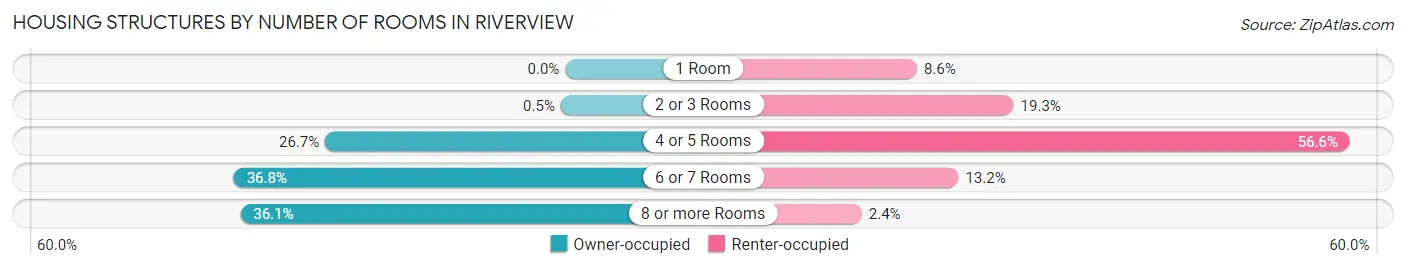
| Number of Rooms | Owner-occupied | Renter-occupied |
| 1 Room | 0 (0.0%) | 169 (8.6%) |
| 2 or 3 Rooms | 16 (0.5%) | 381 (19.3%) |
| 4 or 5 Rooms | 849 (26.7%) | 1,118 (56.6%) |
| 6 or 7 Rooms | 1,172 (36.8%) | 260 (13.2%) |
| 8 or more Rooms | 1,149 (36.1%) | 48 (2.4%) |
| Total | 3,186 (100.0%) | 1,976 (100.0%) |
Housing Structure by Heating Type in Riverview
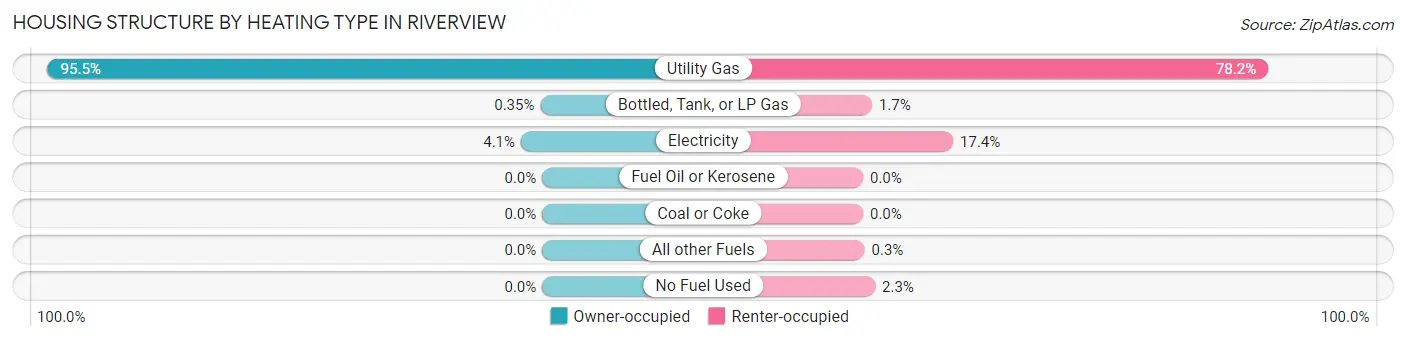
| Heating Type | Owner-occupied | Renter-occupied |
| Utility Gas | 3,044 (95.5%) | 1,546 (78.2%) |
| Bottled, Tank, or LP Gas | 11 (0.4%) | 34 (1.7%) |
| Electricity | 131 (4.1%) | 344 (17.4%) |
| Fuel Oil or Kerosene | 0 (0.0%) | 0 (0.0%) |
| Coal or Coke | 0 (0.0%) | 0 (0.0%) |
| All other Fuels | 0 (0.0%) | 6 (0.3%) |
| No Fuel Used | 0 (0.0%) | 46 (2.3%) |
| Total | 3,186 (100.0%) | 1,976 (100.0%) |
Household Vehicle Usage in Riverview
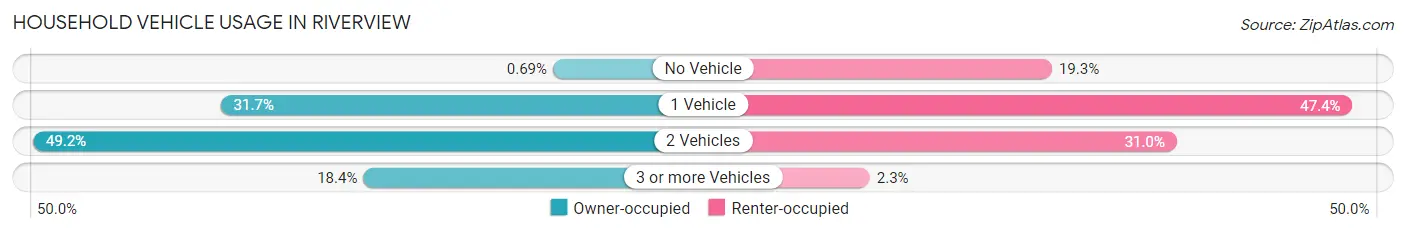
| Vehicles per Household | Owner-occupied | Renter-occupied |
| No Vehicle | 22 (0.7%) | 382 (19.3%) |
| 1 Vehicle | 1,010 (31.7%) | 936 (47.4%) |
| 2 Vehicles | 1,568 (49.2%) | 612 (31.0%) |
| 3 or more Vehicles | 586 (18.4%) | 46 (2.3%) |
| Total | 3,186 (100.0%) | 1,976 (100.0%) |
Real Estate & Mortgages in Riverview
Real Estate and Mortgage Overview in Riverview
| Characteristic | Without Mortgage | With Mortgage |
| Housing Units | 1,220 | 1,966 |
| Median Property Value | $194,900 | $185,500 |
| Median Household Income | $65,784 | $572 |
| Monthly Housing Costs | $670 | $0 |
| Real Estate Taxes | $3,689 | $55 |
Property Value by Mortgage Status in Riverview
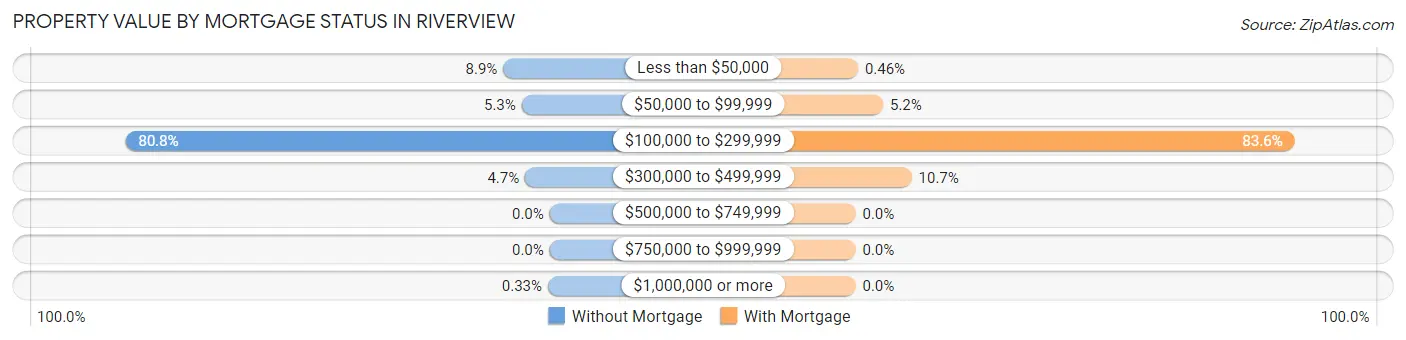
| Property Value | Without Mortgage | With Mortgage |
| Less than $50,000 | 108 (8.8%) | 9 (0.5%) |
| $50,000 to $99,999 | 65 (5.3%) | 103 (5.2%) |
| $100,000 to $299,999 | 986 (80.8%) | 1,644 (83.6%) |
| $300,000 to $499,999 | 57 (4.7%) | 210 (10.7%) |
| $500,000 to $749,999 | 0 (0.0%) | 0 (0.0%) |
| $750,000 to $999,999 | 0 (0.0%) | 0 (0.0%) |
| $1,000,000 or more | 4 (0.3%) | 0 (0.0%) |
| Total | 1,220 (100.0%) | 1,966 (100.0%) |
Household Income by Mortgage Status in Riverview
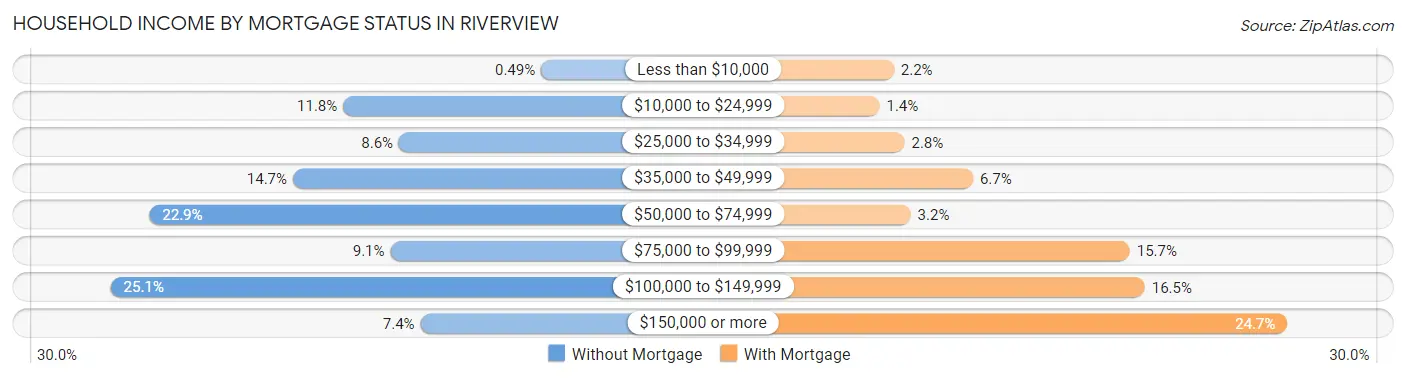
| Household Income | Without Mortgage | With Mortgage |
| Less than $10,000 | 6 (0.5%) | 43 (2.2%) |
| $10,000 to $24,999 | 144 (11.8%) | 27 (1.4%) |
| $25,000 to $34,999 | 105 (8.6%) | 55 (2.8%) |
| $35,000 to $49,999 | 179 (14.7%) | 132 (6.7%) |
| $50,000 to $74,999 | 279 (22.9%) | 62 (3.2%) |
| $75,000 to $99,999 | 111 (9.1%) | 308 (15.7%) |
| $100,000 to $149,999 | 306 (25.1%) | 325 (16.5%) |
| $150,000 or more | 90 (7.4%) | 485 (24.7%) |
| Total | 1,220 (100.0%) | 1,966 (100.0%) |
Property Value to Household Income Ratio in Riverview
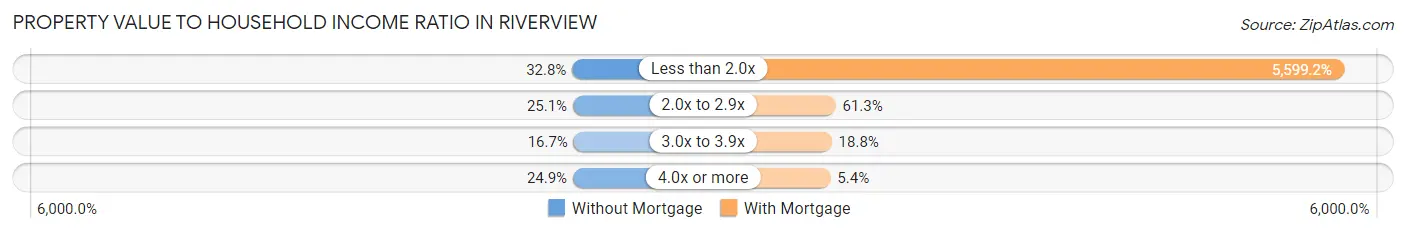
| Value-to-Income Ratio | Without Mortgage | With Mortgage |
| Less than 2.0x | 400 (32.8%) | 110,081 (5,599.2%) |
| 2.0x to 2.9x | 306 (25.1%) | 1,205 (61.3%) |
| 3.0x to 3.9x | 204 (16.7%) | 369 (18.8%) |
| 4.0x or more | 304 (24.9%) | 106 (5.4%) |
| Total | 1,220 (100.0%) | 1,966 (100.0%) |
Real Estate Taxes by Mortgage Status in Riverview

| Property Taxes | Without Mortgage | With Mortgage |
| Less than $800 | 16 (1.3%) | 0 (0.0%) |
| $800 to $1,499 | 20 (1.6%) | 11 (0.6%) |
| $800 to $1,499 | 1,058 (86.7%) | 106 (5.4%) |
| Total | 1,220 (100.0%) | 1,966 (100.0%) |
Health & Disability in Riverview
Health Insurance Coverage by Age in Riverview
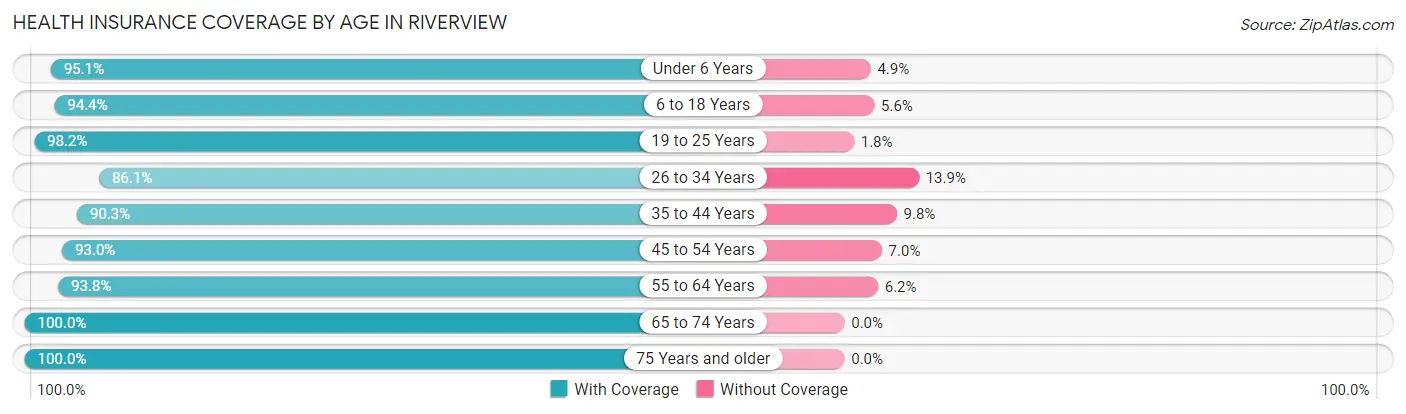
| Age Bracket | With Coverage | Without Coverage |
| Under 6 Years | 877 (95.1%) | 45 (4.9%) |
| 6 to 18 Years | 1,648 (94.4%) | 97 (5.6%) |
| 19 to 25 Years | 1,332 (98.2%) | 24 (1.8%) |
| 26 to 34 Years | 1,092 (86.1%) | 176 (13.9%) |
| 35 to 44 Years | 1,268 (90.2%) | 137 (9.8%) |
| 45 to 54 Years | 1,107 (93.0%) | 83 (7.0%) |
| 55 to 64 Years | 1,051 (93.8%) | 70 (6.2%) |
| 65 to 74 Years | 1,645 (100.0%) | 0 (0.0%) |
| 75 Years and older | 1,261 (100.0%) | 0 (0.0%) |
| Total | 11,281 (94.7%) | 632 (5.3%) |
Health Insurance Coverage by Citizenship Status in Riverview
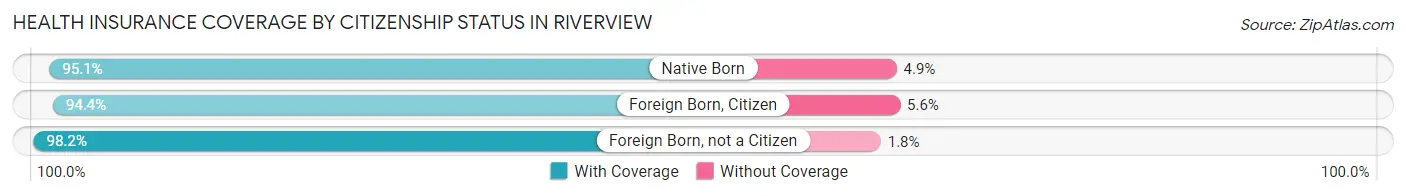
| Citizenship Status | With Coverage | Without Coverage |
| Native Born | 877 (95.1%) | 45 (4.9%) |
| Foreign Born, Citizen | 1,648 (94.4%) | 97 (5.6%) |
| Foreign Born, not a Citizen | 1,332 (98.2%) | 24 (1.8%) |
Health Insurance Coverage by Household Income in Riverview
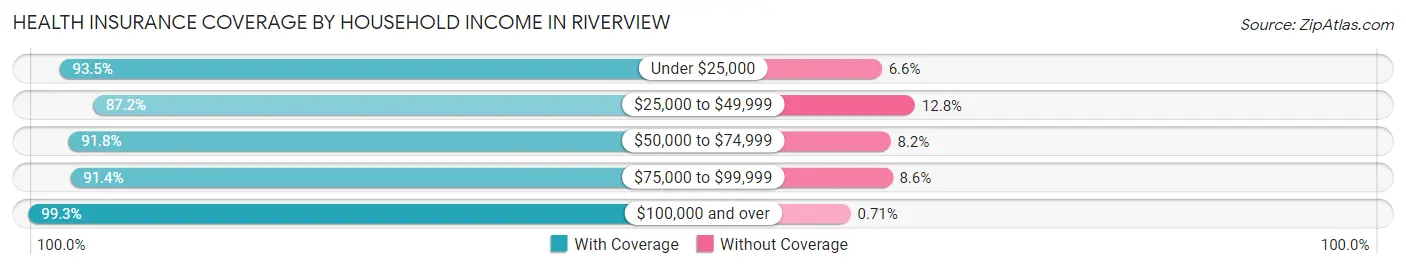
| Household Income | With Coverage | Without Coverage |
| Under $25,000 | 1,256 (93.4%) | 88 (6.6%) |
| $25,000 to $49,999 | 1,039 (87.2%) | 152 (12.8%) |
| $50,000 to $74,999 | 2,096 (91.8%) | 187 (8.2%) |
| $75,000 to $99,999 | 1,805 (91.4%) | 169 (8.6%) |
| $100,000 and over | 5,060 (99.3%) | 36 (0.7%) |
Public vs Private Health Insurance Coverage by Age in Riverview
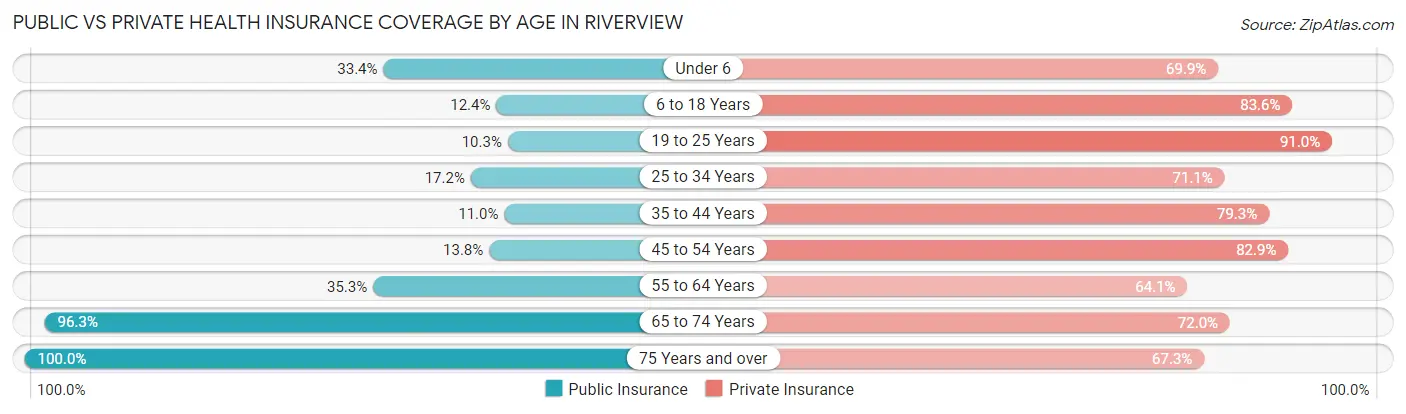
| Age Bracket | Public Insurance | Private Insurance |
| Under 6 | 308 (33.4%) | 644 (69.9%) |
| 6 to 18 Years | 217 (12.4%) | 1,459 (83.6%) |
| 19 to 25 Years | 140 (10.3%) | 1,234 (91.0%) |
| 25 to 34 Years | 218 (17.2%) | 901 (71.1%) |
| 35 to 44 Years | 154 (11.0%) | 1,114 (79.3%) |
| 45 to 54 Years | 164 (13.8%) | 986 (82.9%) |
| 55 to 64 Years | 396 (35.3%) | 719 (64.1%) |
| 65 to 74 Years | 1,584 (96.3%) | 1,185 (72.0%) |
| 75 Years and over | 1,261 (100.0%) | 848 (67.2%) |
| Total | 4,442 (37.3%) | 9,090 (76.3%) |
Disability Status by Sex by Age in Riverview
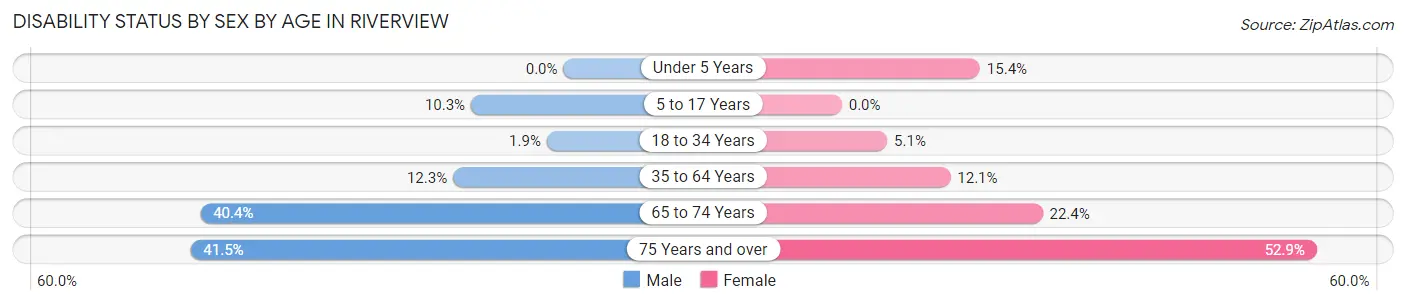
| Age Bracket | Male | Female |
| Under 5 Years | 0 (0.0%) | 30 (15.4%) |
| 5 to 17 Years | 81 (10.3%) | 0 (0.0%) |
| 18 to 34 Years | 30 (1.8%) | 55 (5.1%) |
| 35 to 64 Years | 236 (12.3%) | 217 (12.1%) |
| 65 to 74 Years | 260 (40.4%) | 224 (22.4%) |
| 75 Years and over | 179 (41.5%) | 439 (52.9%) |
Disability Class by Sex by Age in Riverview
Disability Class: Hearing Difficulty
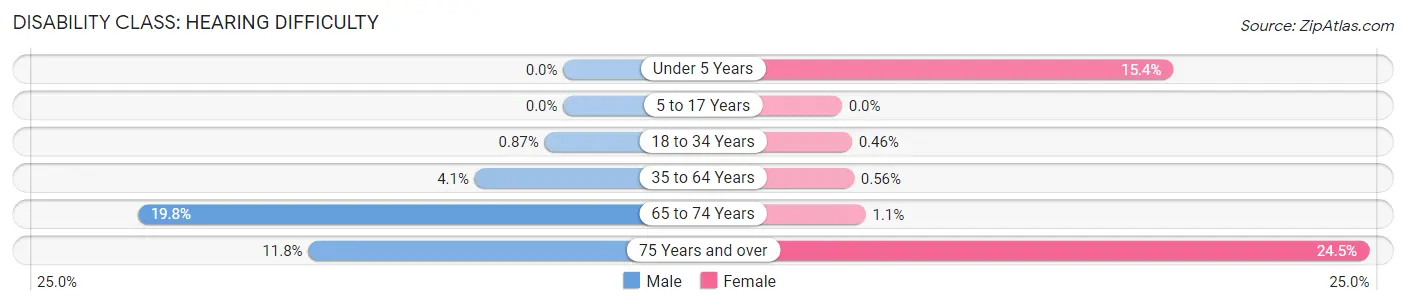
| Age Bracket | Male | Female |
| Under 5 Years | 0 (0.0%) | 30 (15.4%) |
| 5 to 17 Years | 0 (0.0%) | 0 (0.0%) |
| 18 to 34 Years | 14 (0.9%) | 5 (0.5%) |
| 35 to 64 Years | 79 (4.1%) | 10 (0.6%) |
| 65 to 74 Years | 127 (19.8%) | 11 (1.1%) |
| 75 Years and over | 51 (11.8%) | 203 (24.5%) |
Disability Class: Vision Difficulty
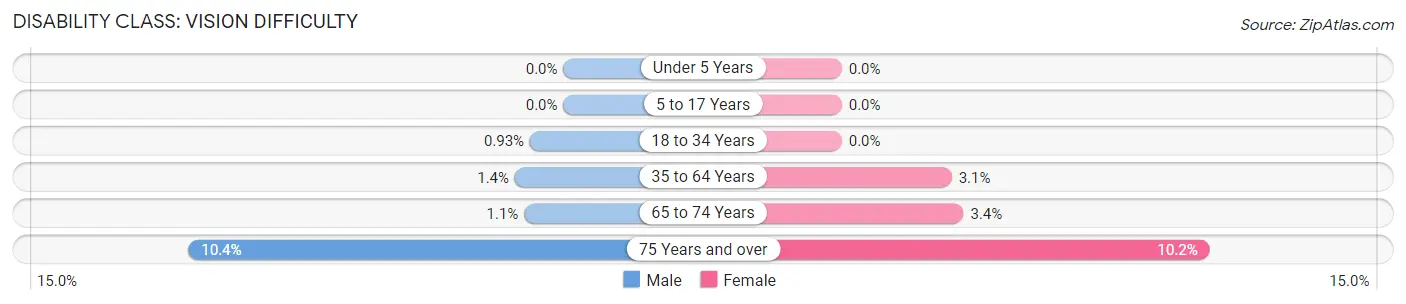
| Age Bracket | Male | Female |
| Under 5 Years | 0 (0.0%) | 0 (0.0%) |
| 5 to 17 Years | 0 (0.0%) | 0 (0.0%) |
| 18 to 34 Years | 15 (0.9%) | 0 (0.0%) |
| 35 to 64 Years | 26 (1.3%) | 55 (3.1%) |
| 65 to 74 Years | 7 (1.1%) | 34 (3.4%) |
| 75 Years and over | 45 (10.4%) | 85 (10.2%) |
Disability Class: Cognitive Difficulty
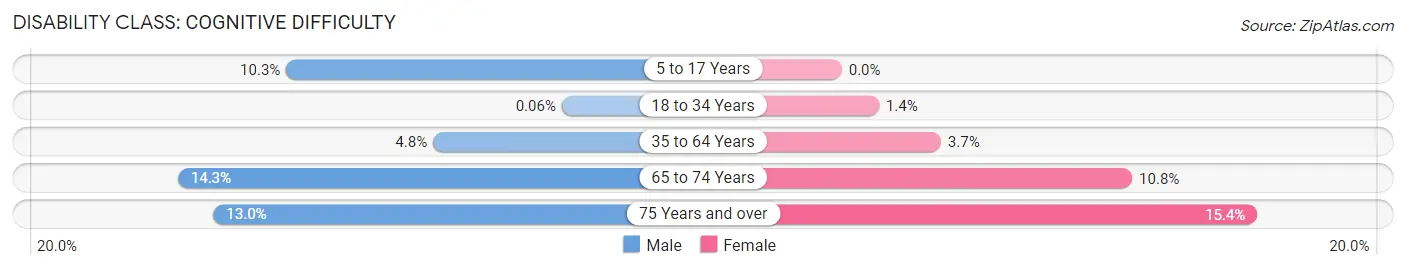
| Age Bracket | Male | Female |
| 5 to 17 Years | 81 (10.3%) | 0 (0.0%) |
| 18 to 34 Years | 1 (0.1%) | 15 (1.4%) |
| 35 to 64 Years | 93 (4.8%) | 66 (3.7%) |
| 65 to 74 Years | 92 (14.3%) | 108 (10.8%) |
| 75 Years and over | 56 (13.0%) | 128 (15.4%) |
Disability Class: Ambulatory Difficulty
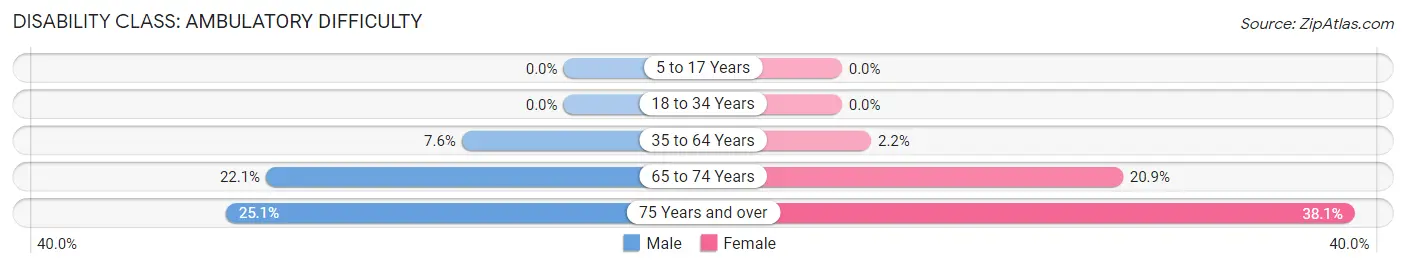
| Age Bracket | Male | Female |
| 5 to 17 Years | 0 (0.0%) | 0 (0.0%) |
| 18 to 34 Years | 0 (0.0%) | 0 (0.0%) |
| 35 to 64 Years | 145 (7.5%) | 39 (2.2%) |
| 65 to 74 Years | 142 (22.1%) | 209 (20.9%) |
| 75 Years and over | 108 (25.1%) | 316 (38.1%) |
Disability Class: Self-Care Difficulty
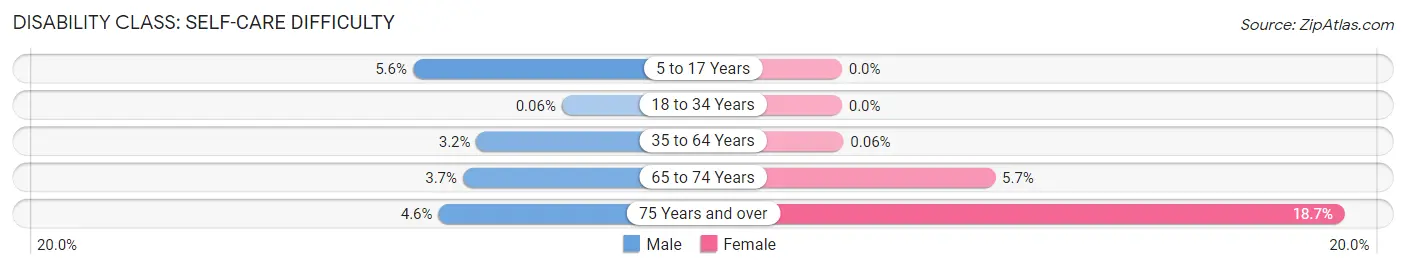
| Age Bracket | Male | Female |
| 5 to 17 Years | 44 (5.6%) | 0 (0.0%) |
| 18 to 34 Years | 1 (0.1%) | 0 (0.0%) |
| 35 to 64 Years | 62 (3.2%) | 1 (0.1%) |
| 65 to 74 Years | 24 (3.7%) | 57 (5.7%) |
| 75 Years and over | 20 (4.6%) | 155 (18.7%) |
Technology Access in Riverview
Computing Device Access in Riverview
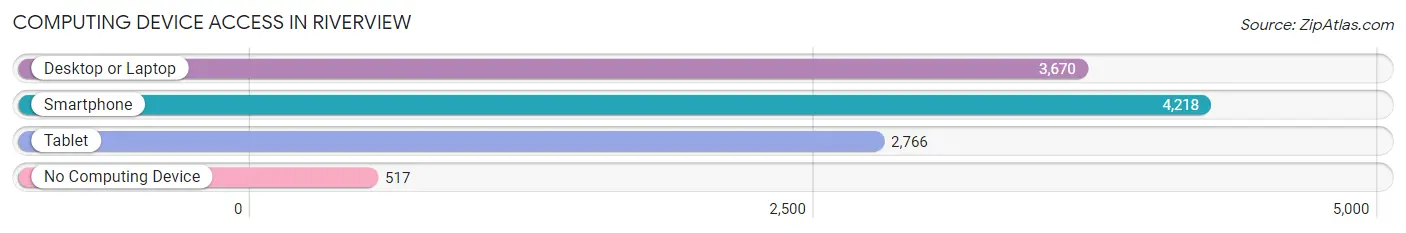
| Device Type | # Households | % Households |
| Desktop or Laptop | 3,670 | 71.1% |
| Smartphone | 4,218 | 81.7% |
| Tablet | 2,766 | 53.6% |
| No Computing Device | 517 | 10.0% |
| Total | 5,162 | 100.0% |
Internet Access in Riverview
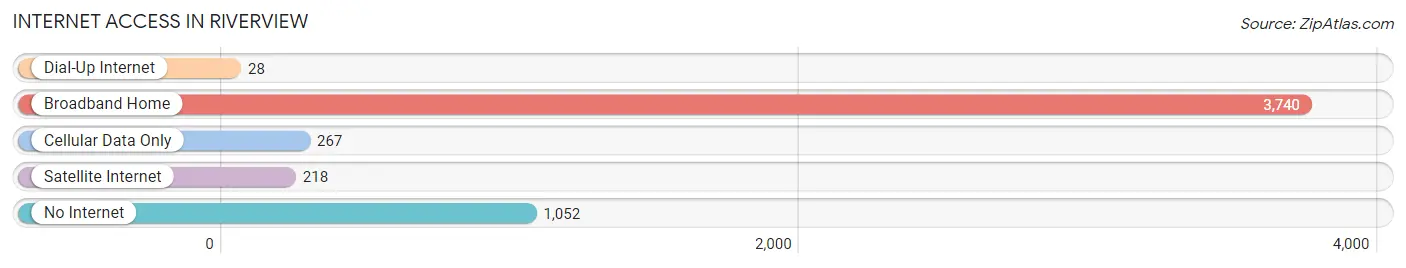
| Internet Type | # Households | % Households |
| Dial-Up Internet | 28 | 0.5% |
| Broadband Home | 3,740 | 72.5% |
| Cellular Data Only | 267 | 5.2% |
| Satellite Internet | 218 | 4.2% |
| No Internet | 1,052 | 20.4% |
| Total | 5,162 | 100.0% |
Riverview Summary
Riverview, Michigan is a small city located in Wayne County, Michigan. It is situated on the Detroit River, just south of the city of Detroit. The city has a population of about 12,000 people and is part of the Downriver area of Wayne County.
History
The area that is now Riverview was originally inhabited by the Potawatomi Native American tribe. The first European settlers arrived in the area in the early 1800s. The area was originally known as “Mud Creek” due to the muddy conditions of the river. In 1837, the area was renamed “Riverview” by the first postmaster, William H. Smith.
The city was officially incorporated in 1867. At the time, the city was primarily a farming community. In the late 1800s, the city began to grow as a result of the industrialization of the Detroit area. The city was home to several factories, including the Detroit Stove Works, which produced stoves and other kitchen appliances.
In the early 1900s, the city began to experience a population boom. This was due to the influx of immigrants from Europe, as well as the growth of the automotive industry in Detroit. The city continued to grow throughout the 20th century, and by the 2000s, it had become a bedroom community for Detroit.
Geography
Riverview is located in Wayne County, Michigan. It is situated on the Detroit River, just south of the city of Detroit. The city is bordered by the cities of Wyandotte, Southgate, and Trenton. The city covers an area of about 4.5 square miles.
The terrain of Riverview is mostly flat, with some rolling hills. The city is located in the Great Lakes region, and is part of the Detroit River watershed. The city is home to several parks, including the Riverview Park and the Riverview Nature Preserve.
Economy
The economy of Riverview is largely based on the automotive industry. The city is home to several automotive suppliers, including the Detroit Stove Works, which produces stoves and other kitchen appliances. The city is also home to several manufacturing companies, including the Riverview Manufacturing Company, which produces automotive parts.
The city is also home to several retail stores, including the Riverview Mall. The city is also home to several restaurants, bars, and other entertainment venues.
Demographics
As of the 2010 census, the population of Riverview was 11,811. The racial makeup of the city was 79.3% White, 14.2% African American, 0.4% Native American, 1.2% Asian, 0.1% Pacific Islander, and 4.8% from other races. Hispanic or Latino of any race were 5.2% of the population.
The median household income in Riverview was $45,845, and the median family income was $54,845. The per capita income in Riverview was $21,845. About 8.3% of the population was below the poverty line.
Riverview is a diverse city, with a variety of cultures and backgrounds represented. The city is home to several churches, including the Riverview United Methodist Church and the Riverview Baptist Church. The city is also home to several schools, including the Riverview High School and the Riverview Middle School.
Common Questions
What is Per Capita Income in Riverview?
Per Capita income in Riverview is $37,331.
What is the Median Family Income in Riverview?
Median Family Income in Riverview is $84,628.
What is the Median Household income in Riverview?
Median Household Income in Riverview is $69,323.
What is Income or Wage Gap in Riverview?
Income or Wage Gap in Riverview is 30.2%.
Women in Riverview earn 69.8 cents for every dollar earned by a man.
What is Inequality or Gini Index in Riverview?
Inequality or Gini Index in Riverview is 0.42.
What is the Total Population of Riverview?
Total Population of Riverview is 12,390.
What is the Total Male Population of Riverview?
Total Male Population of Riverview is 6,088.
What is the Total Female Population of Riverview?
Total Female Population of Riverview is 6,302.
What is the Ratio of Males per 100 Females in Riverview?
There are 96.60 Males per 100 Females in Riverview.
What is the Ratio of Females per 100 Males in Riverview?
There are 103.52 Females per 100 Males in Riverview.
What is the Median Population Age in Riverview?
Median Population Age in Riverview is 41.3 Years.
What is the Average Family Size in Riverview
Average Family Size in Riverview is 3.0 People.
What is the Average Household Size in Riverview
Average Household Size in Riverview is 2.3 People.
How Large is the Labor Force in Riverview?
There are 5,882 People in the Labor Forcein in Riverview.
What is the Percentage of People in the Labor Force in Riverview?
58.4% of People are in the Labor Force in Riverview.
What is the Unemployment Rate in Riverview?
Unemployment Rate in Riverview is 3.2%.