Lake Isabella, MI Map & Demographics
Lake Isabella Map
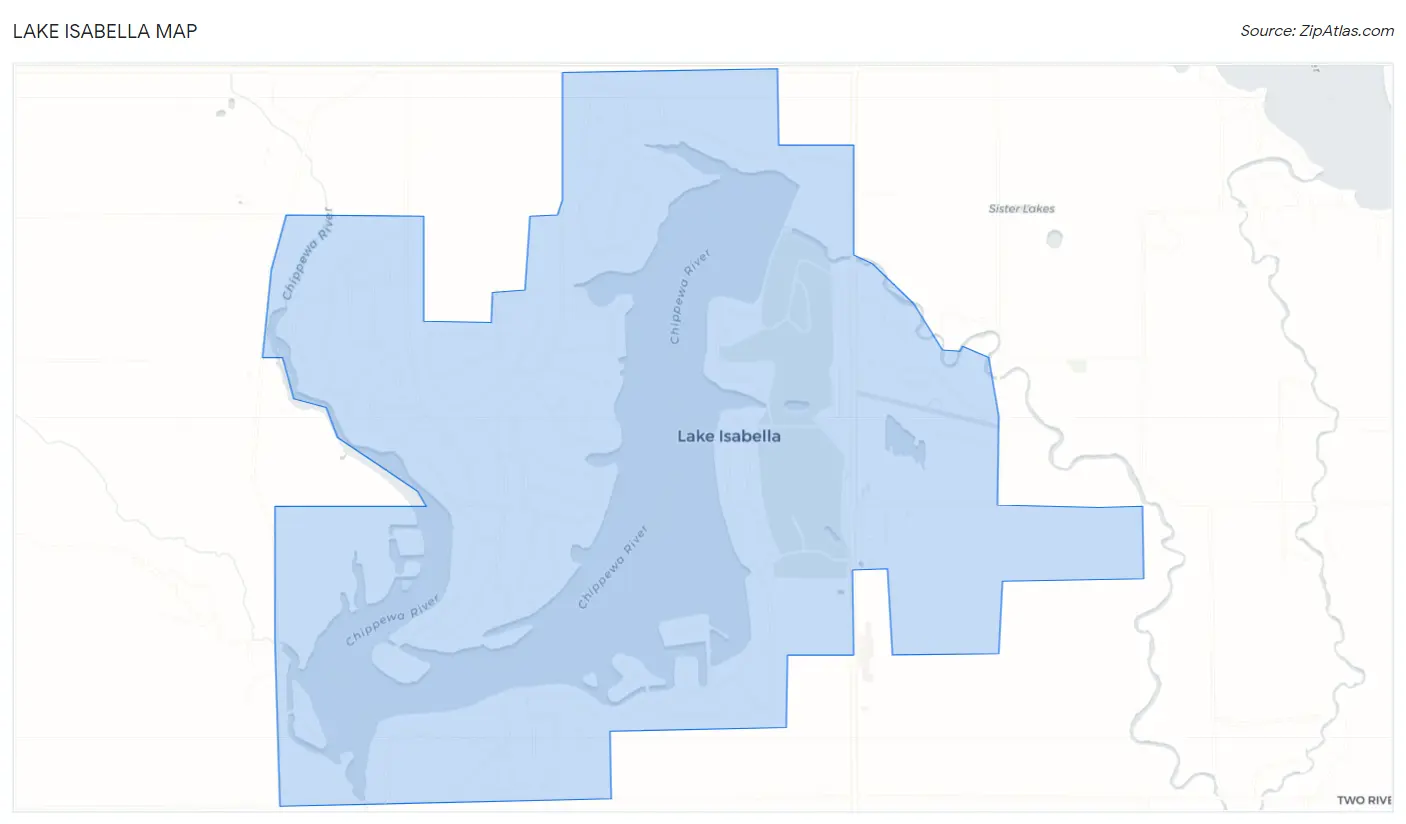
Lake Isabella Overview
$36,887
PER CAPITA INCOME
$81,429
AVG FAMILY INCOME
$69,468
AVG HOUSEHOLD INCOME
25.9%
WAGE / INCOME GAP [ % ]
74.1¢/ $1
WAGE / INCOME GAP [ $ ]
0.36
INEQUALITY / GINI INDEX
1,550
TOTAL POPULATION
771
MALE POPULATION
779
FEMALE POPULATION
98.97
MALES / 100 FEMALES
101.04
FEMALES / 100 MALES
53.5
MEDIAN AGE
2.7
AVG FAMILY SIZE
2.3
AVG HOUSEHOLD SIZE
637
LABOR FORCE [ PEOPLE ]
48.5%
PERCENT IN LABOR FORCE
2.4%
UNEMPLOYMENT RATE
Lake Isabella Area Codes
Income in Lake Isabella
Income Overview in Lake Isabella
Per Capita Income in Lake Isabella is $36,887, while median incomes of families and households are $81,429 and $69,468 respectively.
| Characteristic | Number | Measure |
| Per Capita Income | 1,550 | $36,887 |
| Median Family Income | 476 | $81,429 |
| Mean Family Income | 476 | $94,787 |
| Median Household Income | 666 | $69,468 |
| Mean Household Income | 666 | $84,289 |
| Income Deficit | 476 | $0 |
| Wage / Income Gap (%) | 1,550 | 25.92% |
| Wage / Income Gap ($) | 1,550 | 74.08¢ per $1 |
| Gini / Inequality Index | 1,550 | 0.36 |
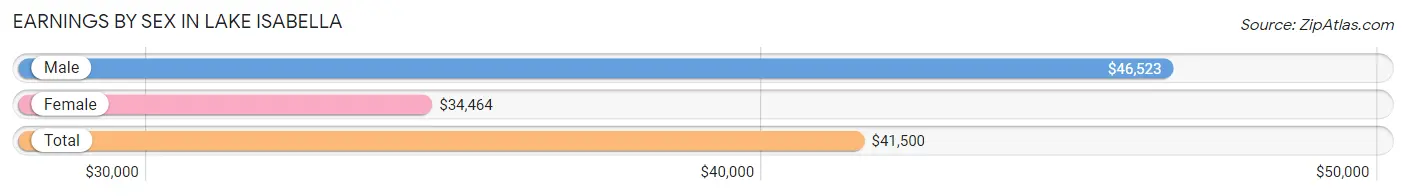
Earnings by Sex in Lake Isabella
Average Earnings in Lake Isabella are $41,500, $46,523 for men and $34,464 for women, a difference of 25.9%.
| Sex | Number | Average Earnings |
| Male | 375 (54.5%) | $46,523 |
| Female | 313 (45.5%) | $34,464 |
| Total | 688 (100.0%) | $41,500 |
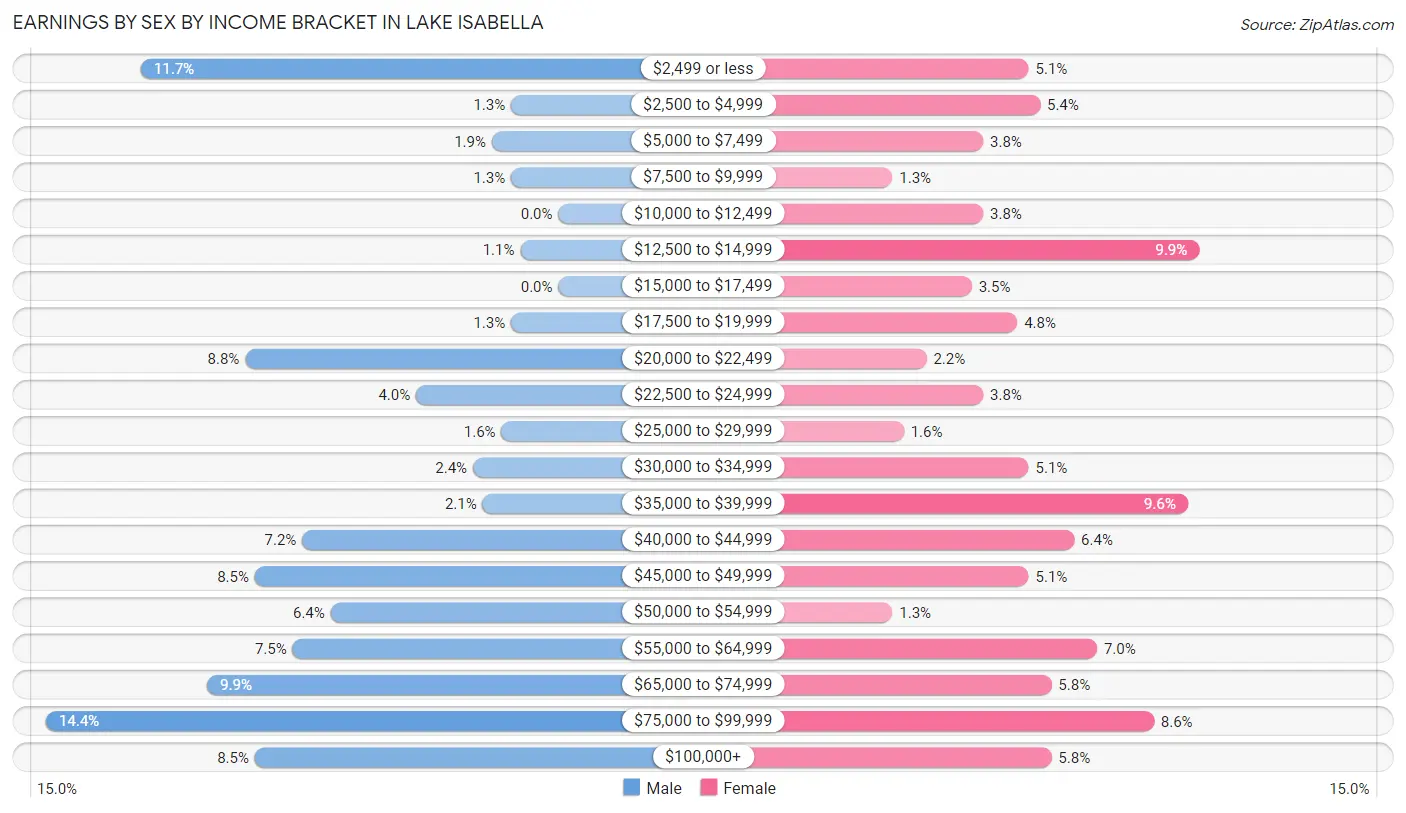
Earnings by Sex by Income Bracket in Lake Isabella
The most common earnings brackets in Lake Isabella are $75,000 to $99,999 for men (54 | 14.4%) and $12,500 to $14,999 for women (31 | 9.9%).
| Income | Male | Female |
| $2,499 or less | 44 (11.7%) | 16 (5.1%) |
| $2,500 to $4,999 | 5 (1.3%) | 17 (5.4%) |
| $5,000 to $7,499 | 7 (1.9%) | 12 (3.8%) |
| $7,500 to $9,999 | 5 (1.3%) | 4 (1.3%) |
| $10,000 to $12,499 | 0 (0.0%) | 12 (3.8%) |
| $12,500 to $14,999 | 4 (1.1%) | 31 (9.9%) |
| $15,000 to $17,499 | 0 (0.0%) | 11 (3.5%) |
| $17,500 to $19,999 | 5 (1.3%) | 15 (4.8%) |
| $20,000 to $22,499 | 33 (8.8%) | 7 (2.2%) |
| $22,500 to $24,999 | 15 (4.0%) | 12 (3.8%) |
| $25,000 to $29,999 | 6 (1.6%) | 5 (1.6%) |
| $30,000 to $34,999 | 9 (2.4%) | 16 (5.1%) |
| $35,000 to $39,999 | 8 (2.1%) | 30 (9.6%) |
| $40,000 to $44,999 | 27 (7.2%) | 20 (6.4%) |
| $45,000 to $49,999 | 32 (8.5%) | 16 (5.1%) |
| $50,000 to $54,999 | 24 (6.4%) | 4 (1.3%) |
| $55,000 to $64,999 | 28 (7.5%) | 22 (7.0%) |
| $65,000 to $74,999 | 37 (9.9%) | 18 (5.8%) |
| $75,000 to $99,999 | 54 (14.4%) | 27 (8.6%) |
| $100,000+ | 32 (8.5%) | 18 (5.8%) |
| Total | 375 (100.0%) | 313 (100.0%) |
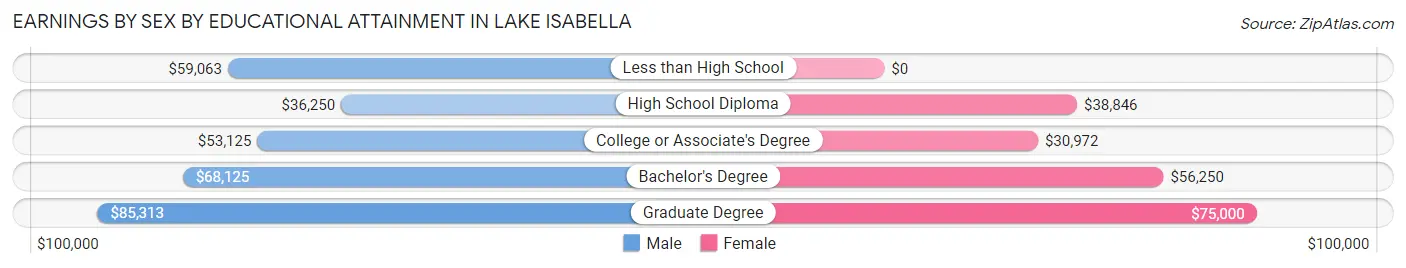
Earnings by Sex by Educational Attainment in Lake Isabella
Average earnings in Lake Isabella are $55,250 for men and $38,359 for women, a difference of 30.6%. Men with an educational attainment of graduate degree enjoy the highest average annual earnings of $85,313, while those with high school diploma education earn the least with $36,250. Women with an educational attainment of graduate degree earn the most with the average annual earnings of $75,000, while those with college or associate's degree education have the smallest earnings of $30,972.
| Educational Attainment | Male Income | Female Income |
| Less than High School | $59,063 | $0 |
| High School Diploma | $36,250 | $38,846 |
| College or Associate's Degree | $53,125 | $30,972 |
| Bachelor's Degree | $68,125 | $56,250 |
| Graduate Degree | $85,313 | $75,000 |
| Total | $55,250 | $38,359 |
Family Income in Lake Isabella
Family Income Brackets in Lake Isabella
According to the Lake Isabella family income data, there are 114 families falling into the $100,000 to $149,999 income range, which is the most common income bracket and makes up 23.9% of all families.
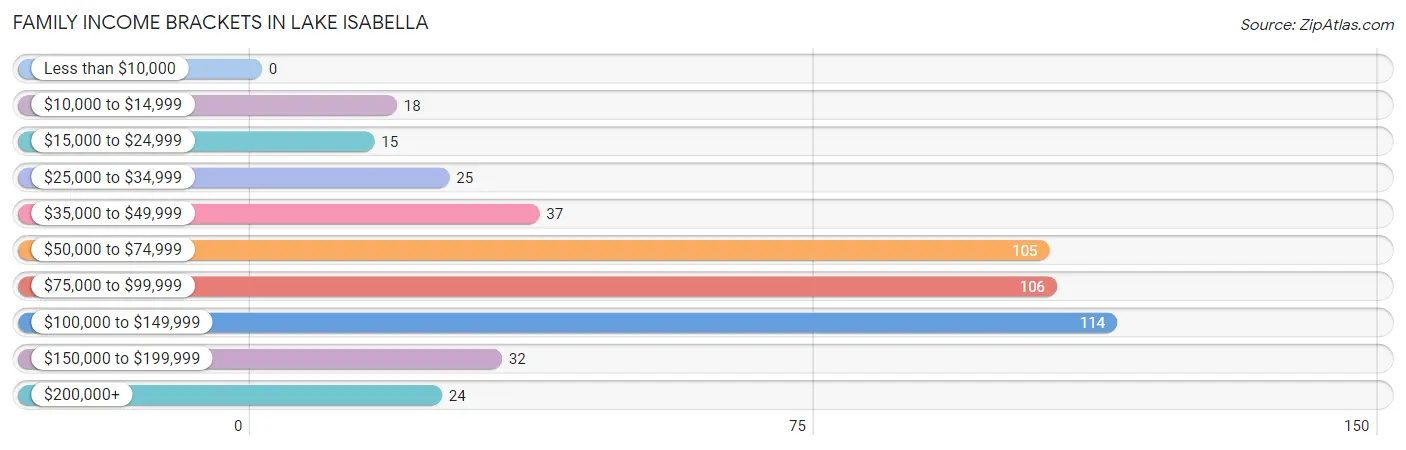
| Income Bracket | # Families | % Families |
| Less than $10,000 | 0 | 0.0% |
| $10,000 to $14,999 | 18 | 3.8% |
| $15,000 to $24,999 | 15 | 3.2% |
| $25,000 to $34,999 | 25 | 5.3% |
| $35,000 to $49,999 | 37 | 7.8% |
| $50,000 to $74,999 | 105 | 22.1% |
| $75,000 to $99,999 | 106 | 22.3% |
| $100,000 to $149,999 | 114 | 23.9% |
| $150,000 to $199,999 | 32 | 6.7% |
| $200,000+ | 24 | 5.0% |
Family Income by Famaliy Size in Lake Isabella
5-person families (26 | 5.5%) account for the highest median family income in Lake Isabella with $106,250 per family, while 2-person families (288 | 60.5%) have the highest median income of $38,906 per family member.
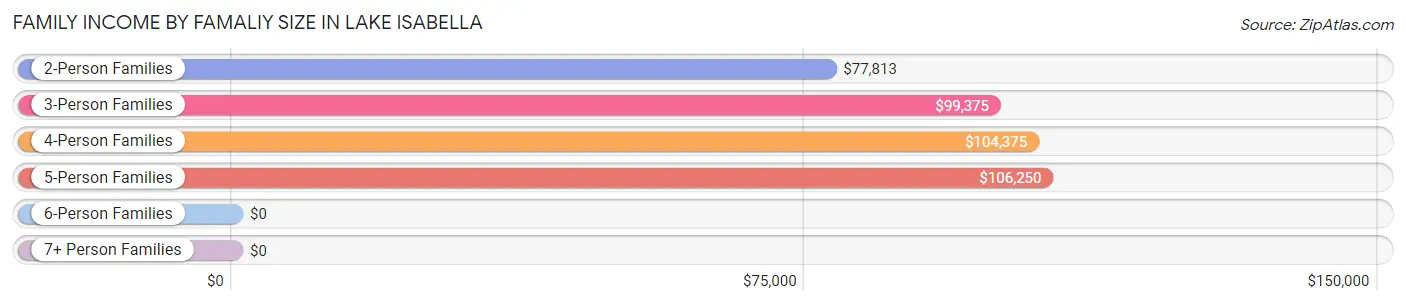
| Income Bracket | # Families | Median Income |
| 2-Person Families | 288 (60.5%) | $77,813 |
| 3-Person Families | 102 (21.4%) | $99,375 |
| 4-Person Families | 54 (11.3%) | $104,375 |
| 5-Person Families | 26 (5.5%) | $106,250 |
| 6-Person Families | 0 (0.0%) | $0 |
| 7+ Person Families | 6 (1.3%) | $0 |
| Total | 476 (100.0%) | $81,429 |
Family Income by Number of Earners in Lake Isabella
The median family income in Lake Isabella is $81,429, with families comprising 3+ earners (31) having the highest median family income of $140,972, while families with no earners (156) have the lowest median family income of $62,500, accounting for 6.5% and 32.8% of families, respectively.
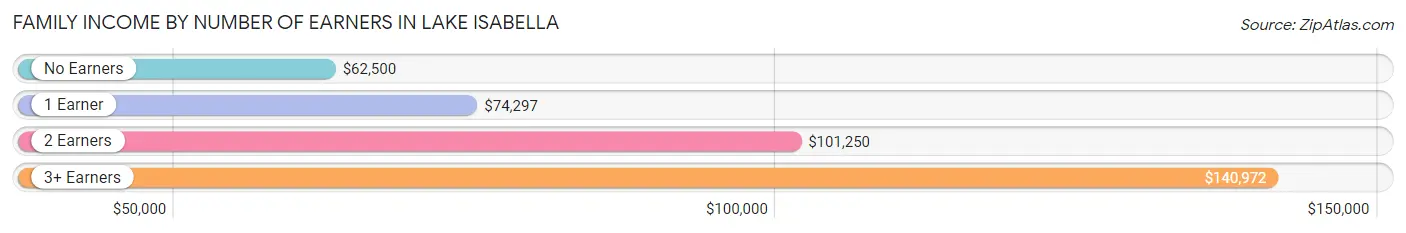
| Number of Earners | # Families | Median Income |
| No Earners | 156 (32.8%) | $62,500 |
| 1 Earner | 137 (28.8%) | $74,297 |
| 2 Earners | 152 (31.9%) | $101,250 |
| 3+ Earners | 31 (6.5%) | $140,972 |
| Total | 476 (100.0%) | $81,429 |
Household Income in Lake Isabella
Household Income Brackets in Lake Isabella
With 149 households falling in the category, the $50,000 to $74,999 income range is the most frequent in Lake Isabella, accounting for 22.4% of all households. In contrast, only 8 households (1.2%) fall into the $10,000 to $14,999 income bracket, making it the least populous group.
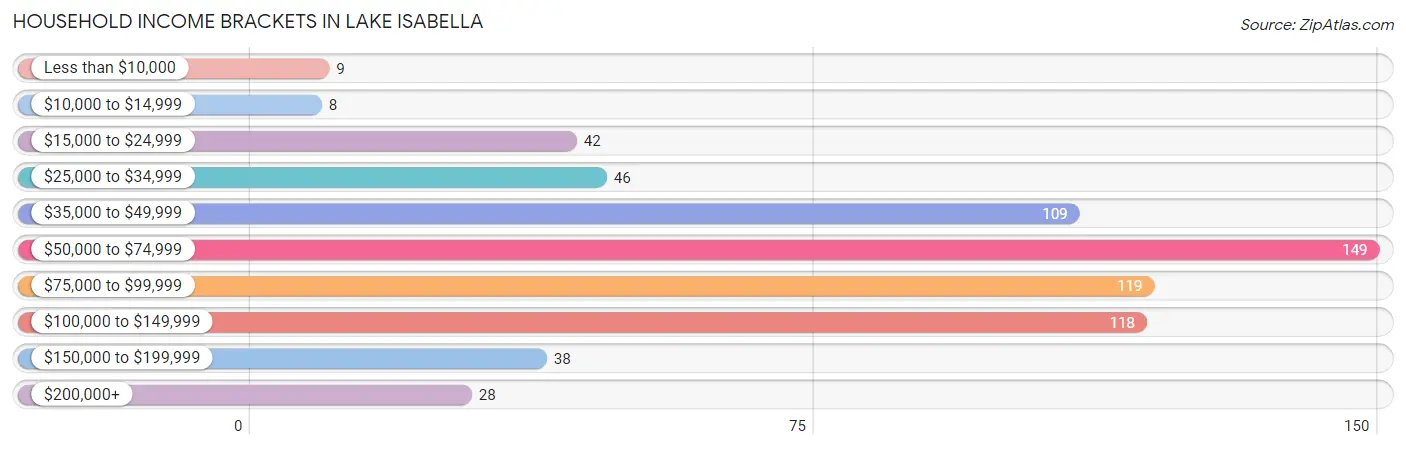
| Income Bracket | # Households | % Households |
| Less than $10,000 | 9 | 1.4% |
| $10,000 to $14,999 | 8 | 1.2% |
| $15,000 to $24,999 | 42 | 6.3% |
| $25,000 to $34,999 | 46 | 6.9% |
| $35,000 to $49,999 | 109 | 16.4% |
| $50,000 to $74,999 | 149 | 22.4% |
| $75,000 to $99,999 | 119 | 17.9% |
| $100,000 to $149,999 | 118 | 17.7% |
| $150,000 to $199,999 | 38 | 5.7% |
| $200,000+ | 28 | 4.2% |
Household Income by Householder Age in Lake Isabella
The median household income in Lake Isabella is $69,468, with the highest median household income of $95,313 found in the 25 to 44 years age bracket for the primary householder. A total of 141 households (21.2%) fall into this category. Meanwhile, the 65+ years age bracket for the primary householder has the lowest median household income of $66,328, with 279 households (41.9%) in this group.
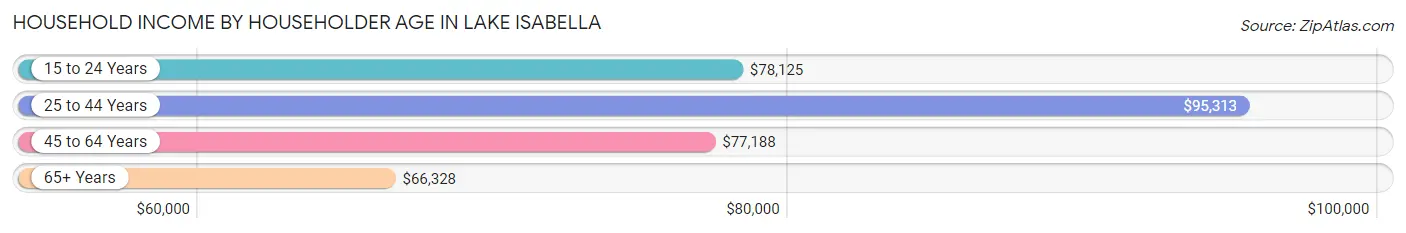
| Income Bracket | # Households | Median Income |
| 15 to 24 Years | 15 (2.2%) | $78,125 |
| 25 to 44 Years | 141 (21.2%) | $95,313 |
| 45 to 64 Years | 231 (34.7%) | $77,188 |
| 65+ Years | 279 (41.9%) | $66,328 |
| Total | 666 (100.0%) | $69,468 |
Poverty in Lake Isabella
Income Below Poverty by Sex and Age in Lake Isabella
With 6.5% poverty level for males and 9.1% for females among the residents of Lake Isabella, 55 to 64 year old males and 18 to 24 year old females are the most vulnerable to poverty, with 33 males (25.6%) and 22 females (56.4%) in their respective age groups living below the poverty level.
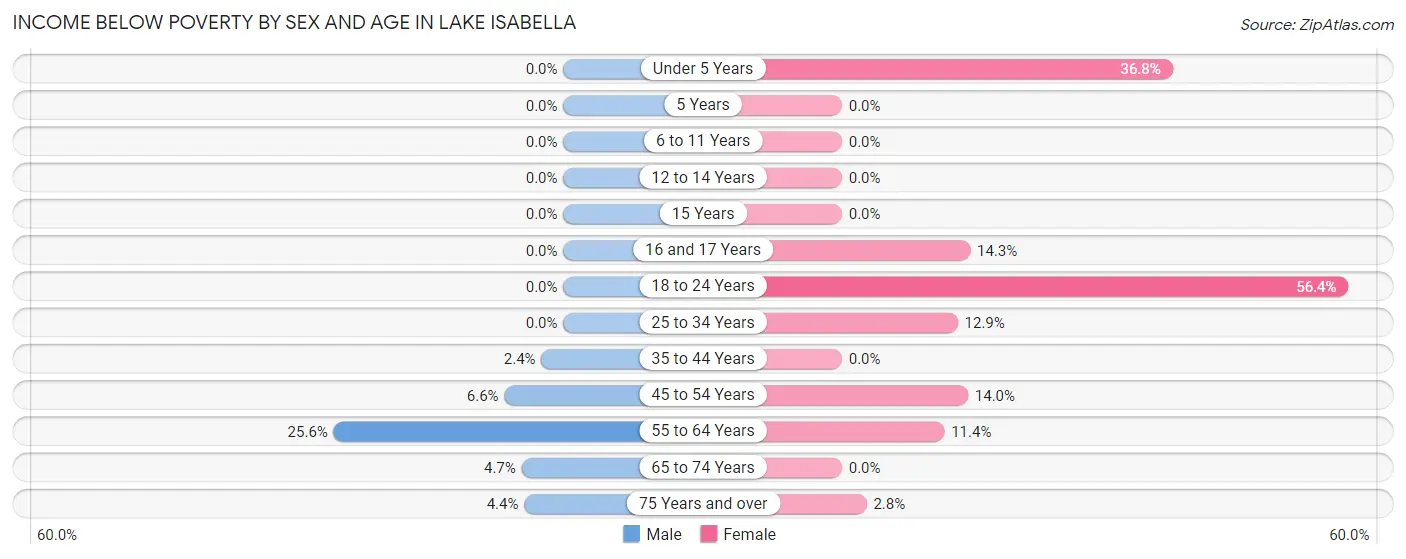
| Age Bracket | Male | Female |
| Under 5 Years | 0 (0.0%) | 14 (36.8%) |
| 5 Years | 0 (0.0%) | 0 (0.0%) |
| 6 to 11 Years | 0 (0.0%) | 0 (0.0%) |
| 12 to 14 Years | 0 (0.0%) | 0 (0.0%) |
| 15 Years | 0 (0.0%) | 0 (0.0%) |
| 16 and 17 Years | 0 (0.0%) | 3 (14.3%) |
| 18 to 24 Years | 0 (0.0%) | 22 (56.4%) |
| 25 to 34 Years | 0 (0.0%) | 4 (12.9%) |
| 35 to 44 Years | 2 (2.4%) | 0 (0.0%) |
| 45 to 54 Years | 4 (6.6%) | 8 (14.0%) |
| 55 to 64 Years | 33 (25.6%) | 17 (11.4%) |
| 65 to 74 Years | 8 (4.6%) | 0 (0.0%) |
| 75 Years and over | 3 (4.3%) | 3 (2.8%) |
| Total | 50 (6.5%) | 71 (9.1%) |
Income Above Poverty by Sex and Age in Lake Isabella
According to the poverty statistics in Lake Isabella, males aged under 5 years and females aged 5 years are the age groups that are most secure financially, with 100.0% of males and 100.0% of females in these age groups living above the poverty line.
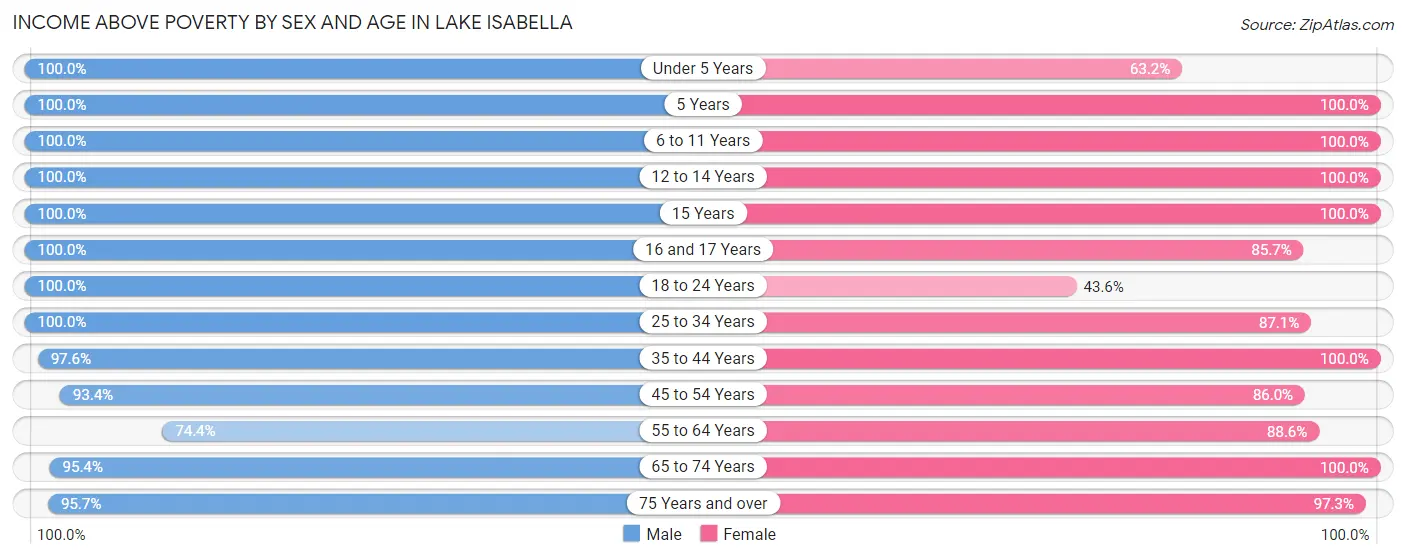
| Age Bracket | Male | Female |
| Under 5 Years | 21 (100.0%) | 24 (63.2%) |
| 5 Years | 4 (100.0%) | 8 (100.0%) |
| 6 to 11 Years | 38 (100.0%) | 53 (100.0%) |
| 12 to 14 Years | 23 (100.0%) | 35 (100.0%) |
| 15 Years | 6 (100.0%) | 7 (100.0%) |
| 16 and 17 Years | 17 (100.0%) | 18 (85.7%) |
| 18 to 24 Years | 71 (100.0%) | 17 (43.6%) |
| 25 to 34 Years | 78 (100.0%) | 27 (87.1%) |
| 35 to 44 Years | 80 (97.6%) | 106 (100.0%) |
| 45 to 54 Years | 57 (93.4%) | 49 (86.0%) |
| 55 to 64 Years | 96 (74.4%) | 132 (88.6%) |
| 65 to 74 Years | 164 (95.4%) | 123 (100.0%) |
| 75 Years and over | 66 (95.7%) | 106 (97.3%) |
| Total | 721 (93.5%) | 705 (90.8%) |
Income Below Poverty Among Married-Couple Families in Lake Isabella
The poverty statistics for married-couple families in Lake Isabella show that 3.7% or 15 of the total 405 families live below the poverty line. Families with no children have the highest poverty rate of 5.2%, comprising of 15 families. On the other hand, families with 1 or 2 children have the lowest poverty rate of 0.0%, which includes 0 families.
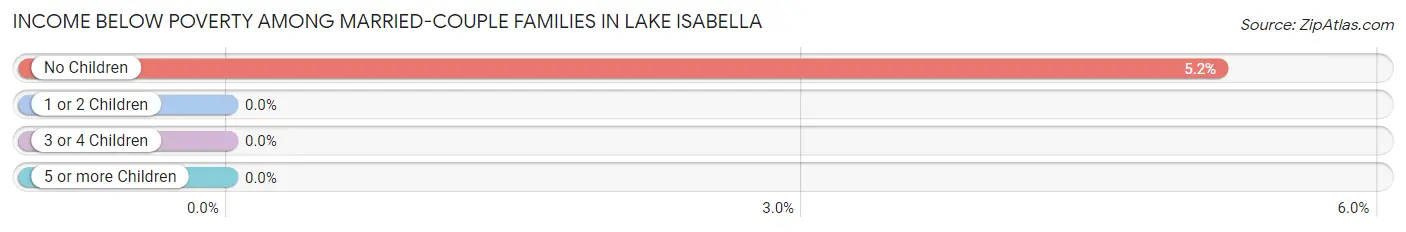
| Children | Above Poverty | Below Poverty |
| No Children | 275 (94.8%) | 15 (5.2%) |
| 1 or 2 Children | 83 (100.0%) | 0 (0.0%) |
| 3 or 4 Children | 28 (100.0%) | 0 (0.0%) |
| 5 or more Children | 4 (100.0%) | 0 (0.0%) |
| Total | 390 (96.3%) | 15 (3.7%) |
Income Below Poverty Among Single-Parent Households in Lake Isabella
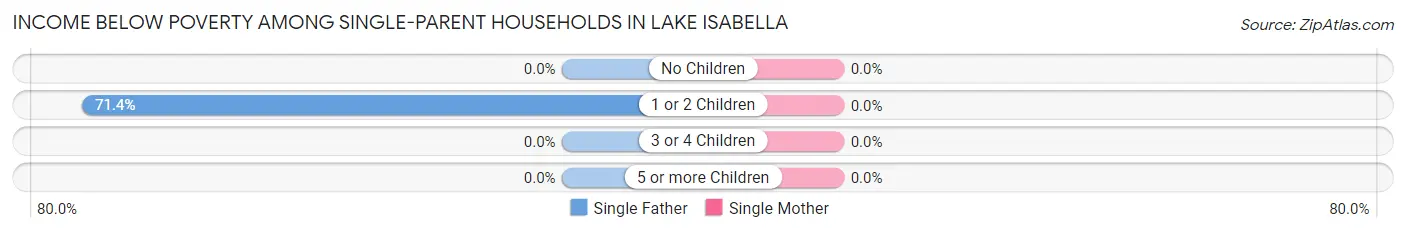
| Children | Single Father | Single Mother |
| No Children | 0 (0.0%) | 0 (0.0%) |
| 1 or 2 Children | 15 (71.4%) | 0 (0.0%) |
| 3 or 4 Children | 0 (0.0%) | 0 (0.0%) |
| 5 or more Children | 0 (0.0%) | 0 (0.0%) |
| Total | 15 (40.5%) | 0 (0.0%) |
Income Below Poverty Among Married-Couple vs Single-Parent Households in Lake Isabella
The poverty data for Lake Isabella shows that 15 of the married-couple family households (3.7%) and 15 of the single-parent households (21.1%) are living below the poverty level. Within the married-couple family households, those with no children have the highest poverty rate, with 15 households (5.2%) falling below the poverty line. Among the single-parent households, those with 1 or 2 children have the highest poverty rate, with 15 household (32.6%) living below poverty.
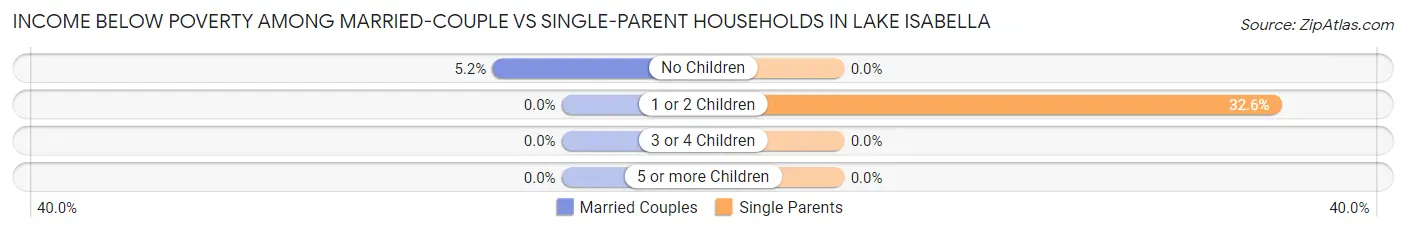
| Children | Married-Couple Families | Single-Parent Households |
| No Children | 15 (5.2%) | 0 (0.0%) |
| 1 or 2 Children | 0 (0.0%) | 15 (32.6%) |
| 3 or 4 Children | 0 (0.0%) | 0 (0.0%) |
| 5 or more Children | 0 (0.0%) | 0 (0.0%) |
| Total | 15 (3.7%) | 15 (21.1%) |
Race in Lake Isabella
The most populous races in Lake Isabella are White / Caucasian (1,502 | 96.9%), Two or more Races (38 | 2.5%), and Hispanic or Latino (34 | 2.2%).
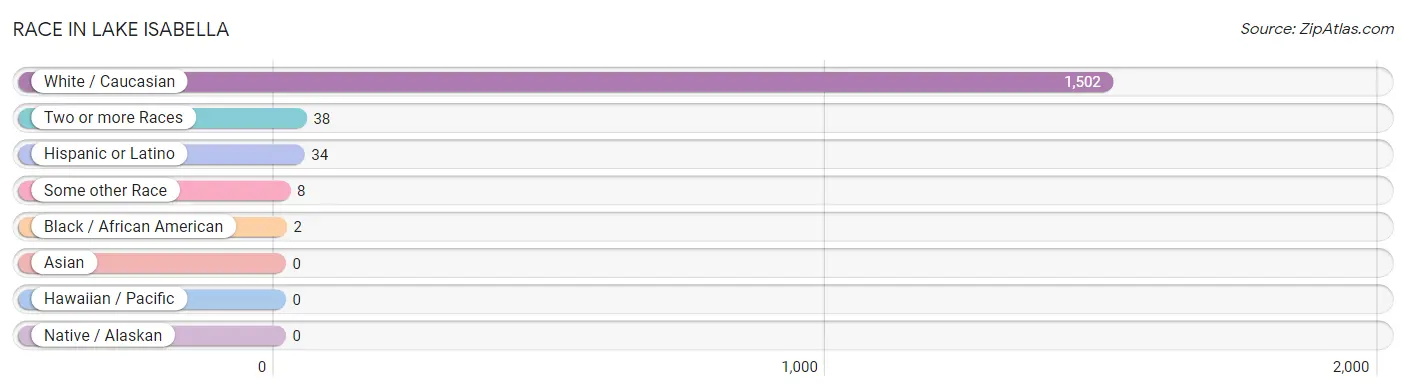
| Race | # Population | % Population |
| Asian | 0 | 0.0% |
| Black / African American | 2 | 0.1% |
| Hawaiian / Pacific | 0 | 0.0% |
| Hispanic or Latino | 34 | 2.2% |
| Native / Alaskan | 0 | 0.0% |
| White / Caucasian | 1,502 | 96.9% |
| Two or more Races | 38 | 2.5% |
| Some other Race | 8 | 0.5% |
| Total | 1,550 | 100.0% |
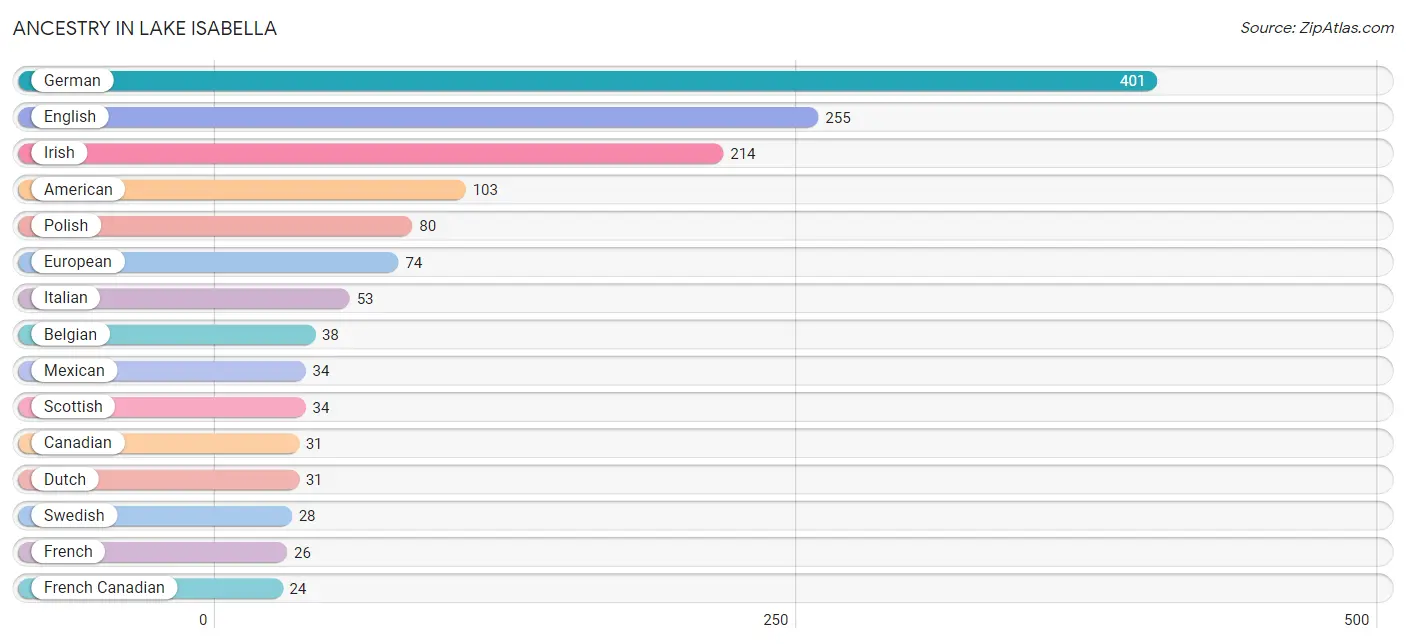
Ancestry in Lake Isabella
The most populous ancestries reported in Lake Isabella are German (401 | 25.9%), English (255 | 16.5%), Irish (214 | 13.8%), American (103 | 6.7%), and Polish (80 | 5.2%), together accounting for 67.9% of all Lake Isabella residents.
| Ancestry | # Population | % Population |
| Albanian | 4 | 0.3% |
| American | 103 | 6.7% |
| Austrian | 7 | 0.4% |
| Belgian | 38 | 2.5% |
| British | 12 | 0.8% |
| Canadian | 31 | 2.0% |
| Chippewa | 5 | 0.3% |
| Czechoslovakian | 3 | 0.2% |
| Danish | 4 | 0.3% |
| Dutch | 31 | 2.0% |
| English | 255 | 16.5% |
| European | 74 | 4.8% |
| Finnish | 15 | 1.0% |
| French | 26 | 1.7% |
| French Canadian | 24 | 1.5% |
| German | 401 | 25.9% |
| Hungarian | 9 | 0.6% |
| Iranian | 8 | 0.5% |
| Irish | 214 | 13.8% |
| Italian | 53 | 3.4% |
| Lithuanian | 2 | 0.1% |
| Luxembourger | 3 | 0.2% |
| Mexican | 34 | 2.2% |
| Norwegian | 8 | 0.5% |
| Polish | 80 | 5.2% |
| Russian | 6 | 0.4% |
| Scotch-Irish | 3 | 0.2% |
| Scottish | 34 | 2.2% |
| Slavic | 2 | 0.1% |
| Slovak | 3 | 0.2% |
| Sri Lankan | 6 | 0.4% |
| Swedish | 28 | 1.8% |
| Ukrainian | 1 | 0.1% |
| Welsh | 9 | 0.6% | View All 34 Rows |
Immigrants in Lake Isabella
The most numerous immigrant groups reported in Lake Isabella came from Europe (9 | 0.6%), Western Europe (9 | 0.6%), Netherlands (7 | 0.4%), Asia (3 | 0.2%), and Iran (3 | 0.2%), together accounting for 2.0% of all Lake Isabella residents.
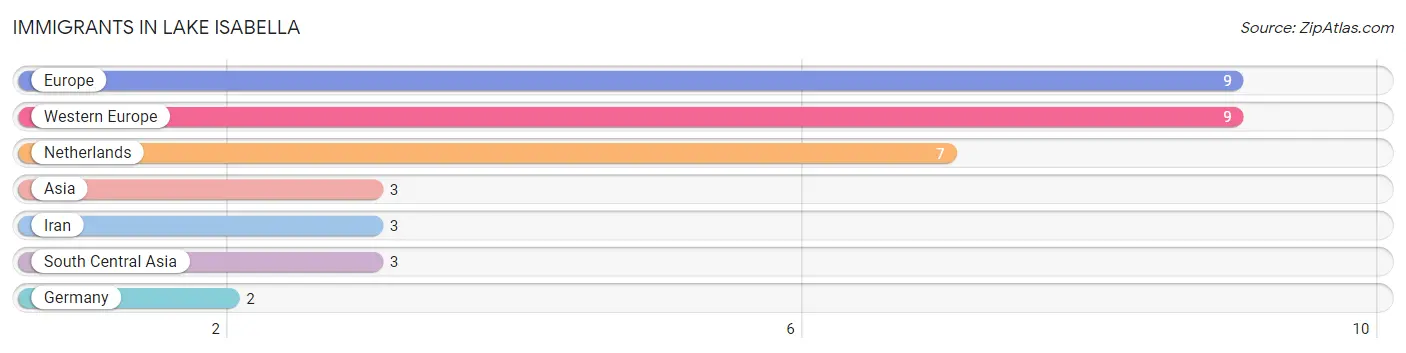
| Immigration Origin | # Population | % Population |
| Asia | 3 | 0.2% |
| Europe | 9 | 0.6% |
| Germany | 2 | 0.1% |
| Iran | 3 | 0.2% |
| Netherlands | 7 | 0.4% |
| South Central Asia | 3 | 0.2% |
| Western Europe | 9 | 0.6% | View All 7 Rows |
Sex and Age in Lake Isabella
Sex and Age in Lake Isabella
The most populous age groups in Lake Isabella are 70 to 74 Years (107 | 13.9%) for men and 60 to 64 Years (105 | 13.5%) for women.
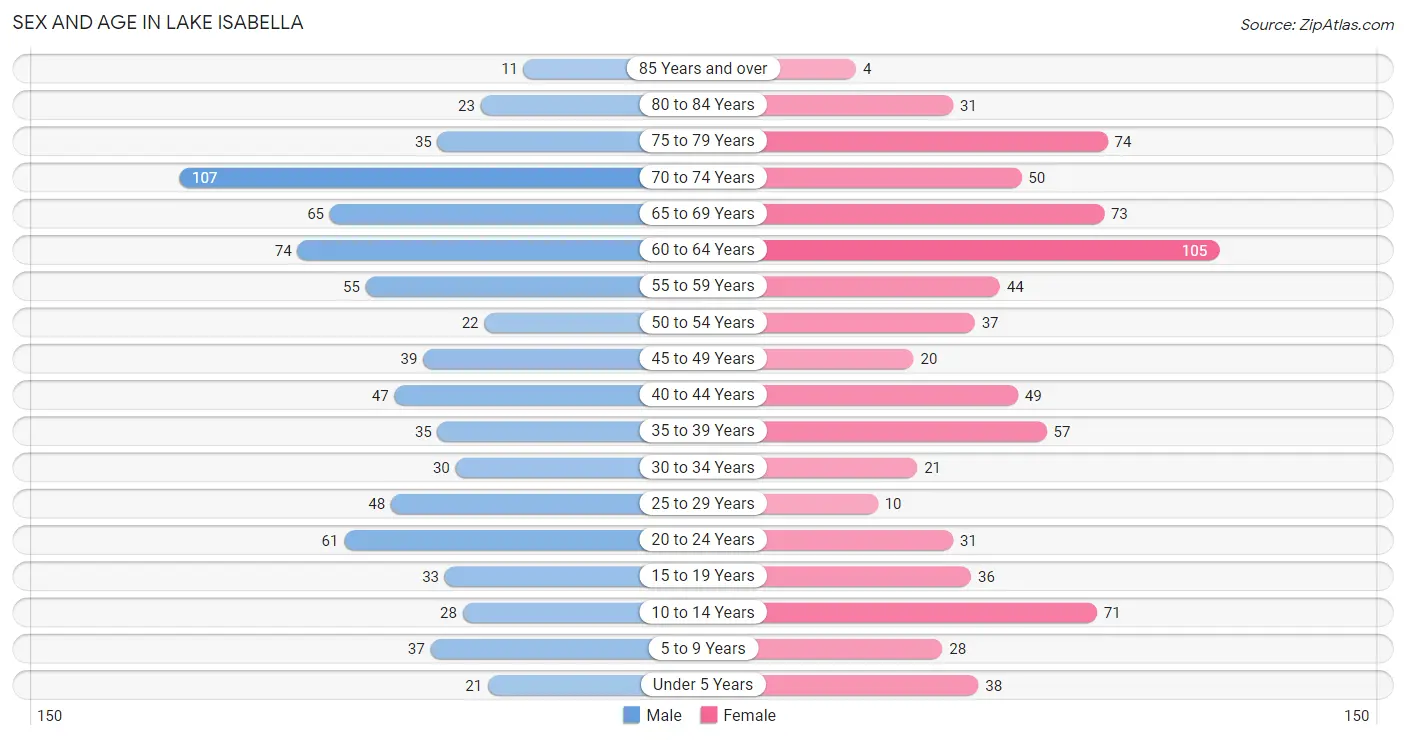
| Age Bracket | Male | Female |
| Under 5 Years | 21 (2.7%) | 38 (4.9%) |
| 5 to 9 Years | 37 (4.8%) | 28 (3.6%) |
| 10 to 14 Years | 28 (3.6%) | 71 (9.1%) |
| 15 to 19 Years | 33 (4.3%) | 36 (4.6%) |
| 20 to 24 Years | 61 (7.9%) | 31 (4.0%) |
| 25 to 29 Years | 48 (6.2%) | 10 (1.3%) |
| 30 to 34 Years | 30 (3.9%) | 21 (2.7%) |
| 35 to 39 Years | 35 (4.5%) | 57 (7.3%) |
| 40 to 44 Years | 47 (6.1%) | 49 (6.3%) |
| 45 to 49 Years | 39 (5.1%) | 20 (2.6%) |
| 50 to 54 Years | 22 (2.9%) | 37 (4.8%) |
| 55 to 59 Years | 55 (7.1%) | 44 (5.7%) |
| 60 to 64 Years | 74 (9.6%) | 105 (13.5%) |
| 65 to 69 Years | 65 (8.4%) | 73 (9.4%) |
| 70 to 74 Years | 107 (13.9%) | 50 (6.4%) |
| 75 to 79 Years | 35 (4.5%) | 74 (9.5%) |
| 80 to 84 Years | 23 (3.0%) | 31 (4.0%) |
| 85 Years and over | 11 (1.4%) | 4 (0.5%) |
| Total | 771 (100.0%) | 779 (100.0%) |
Families and Households in Lake Isabella
Median Family Size in Lake Isabella
The median family size in Lake Isabella is 2.66 persons per family, with single male/father families (37 | 7.8%) accounting for the largest median family size of 2.78 persons per family. On the other hand, single female/mother families (34 | 7.1%) represent the smallest median family size with 2.53 persons per family.
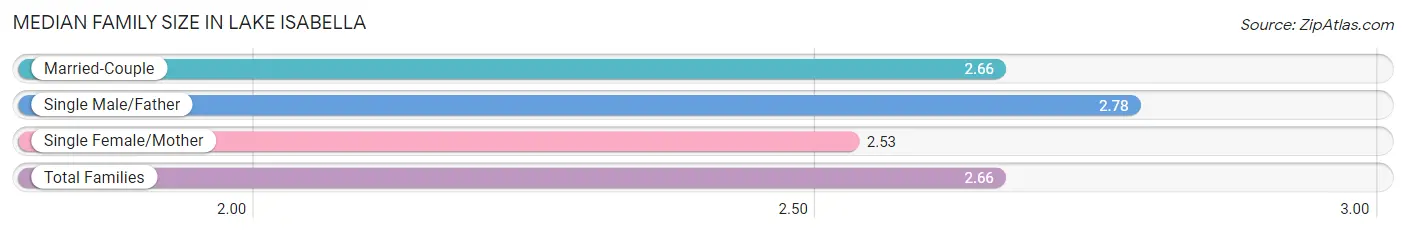
| Family Type | # Families | Family Size |
| Married-Couple | 405 (85.1%) | 2.66 |
| Single Male/Father | 37 (7.8%) | 2.78 |
| Single Female/Mother | 34 (7.1%) | 2.53 |
| Total Families | 476 (100.0%) | 2.66 |
Median Household Size in Lake Isabella
The median household size in Lake Isabella is 2.31 persons per household, with single male/father households (37 | 5.6%) accounting for the largest median household size of 3.57 persons per household. non-family households (190 | 28.5%) represent the smallest median household size with 1.29 persons per household.
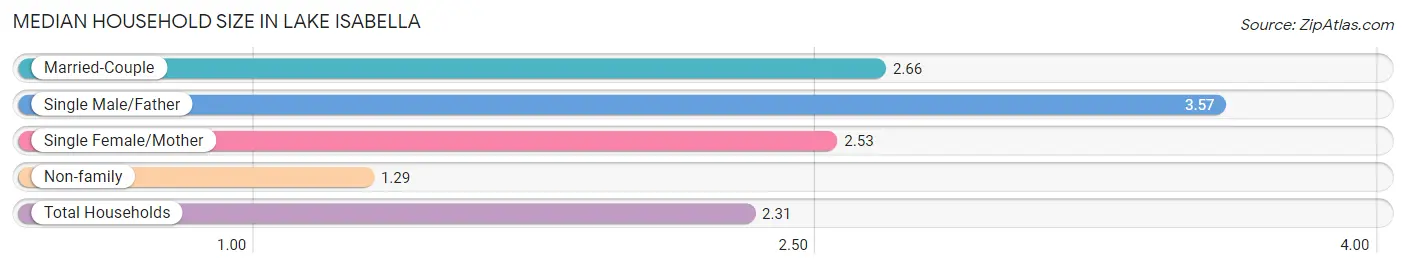
| Household Type | # Households | Household Size |
| Married-Couple | 405 (60.8%) | 2.66 |
| Single Male/Father | 37 (5.6%) | 3.57 |
| Single Female/Mother | 34 (5.1%) | 2.53 |
| Non-family | 190 (28.5%) | 1.29 |
| Total Households | 666 (100.0%) | 2.31 |
Household Size by Marriage Status in Lake Isabella
Out of a total of 666 households in Lake Isabella, 476 (71.5%) are family households, while 190 (28.5%) are nonfamily households. The most numerous type of family households are 2-person households, comprising 284, and the most common type of nonfamily households are 1-person households, comprising 139.
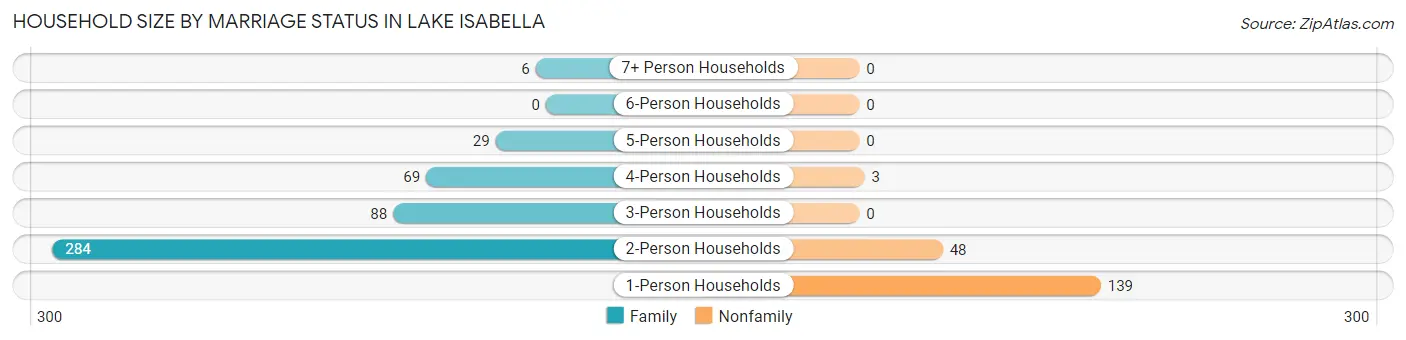
| Household Size | Family Households | Nonfamily Households |
| 1-Person Households | - | 139 (20.9%) |
| 2-Person Households | 284 (42.6%) | 48 (7.2%) |
| 3-Person Households | 88 (13.2%) | 0 (0.0%) |
| 4-Person Households | 69 (10.4%) | 3 (0.4%) |
| 5-Person Households | 29 (4.3%) | 0 (0.0%) |
| 6-Person Households | 0 (0.0%) | 0 (0.0%) |
| 7+ Person Households | 6 (0.9%) | 0 (0.0%) |
| Total | 476 (71.5%) | 190 (28.5%) |
Female Fertility in Lake Isabella
Fertility by Age in Lake Isabella
| Age Bracket | Women with Births | Births / 1,000 Women |
| 15 to 19 years | 0 (0.0%) | 0.0 |
| 20 to 34 years | 0 (0.0%) | 0.0 |
| 35 to 50 years | 0 (0.0%) | 0.0 |
| Total | 0 (0.0%) | 0.0 |
Fertility by Age by Marriage Status in Lake Isabella
| Age Bracket | Married | Unmarried |
| 15 to 19 years | 0 (0.0%) | 0 (0.0%) |
| 20 to 34 years | 0 (0.0%) | 0 (0.0%) |
| 35 to 50 years | 0 (0.0%) | 0 (0.0%) |
| Total | 0 (0.0%) | 0 (0.0%) |
Fertility by Education in Lake Isabella
| Educational Attainment | Women with Births | Births / 1,000 Women |
| Less than High School | 0 (0.0%) | 0.0 |
| High School Diploma | 0 (0.0%) | 0.0 |
| College or Associate's Degree | 0 (0.0%) | 0.0 |
| Bachelor's Degree | 0 (0.0%) | 0.0 |
| Graduate Degree | 0 (0.0%) | 0.0 |
| Total | 0 (0.0%) | 0.0 |
Fertility by Education by Marriage Status in Lake Isabella
| Educational Attainment | Married | Unmarried |
| Less than High School | 0 (0.0%) | 0 (0.0%) |
| High School Diploma | 0 (0.0%) | 0 (0.0%) |
| College or Associate's Degree | 0 (0.0%) | 0 (0.0%) |
| Bachelor's Degree | 0 (0.0%) | 0 (0.0%) |
| Graduate Degree | 0 (0.0%) | 0 (0.0%) |
| Total | 0 (0.0%) | 0 (0.0%) |
Employment Characteristics in Lake Isabella
Employment by Class of Employer in Lake Isabella
Among the 618 employed individuals in Lake Isabella, private company employees (408 | 66.0%), not-for-profit organizations (63 | 10.2%), and local government employees (42 | 6.8%) make up the most common classes of employment.
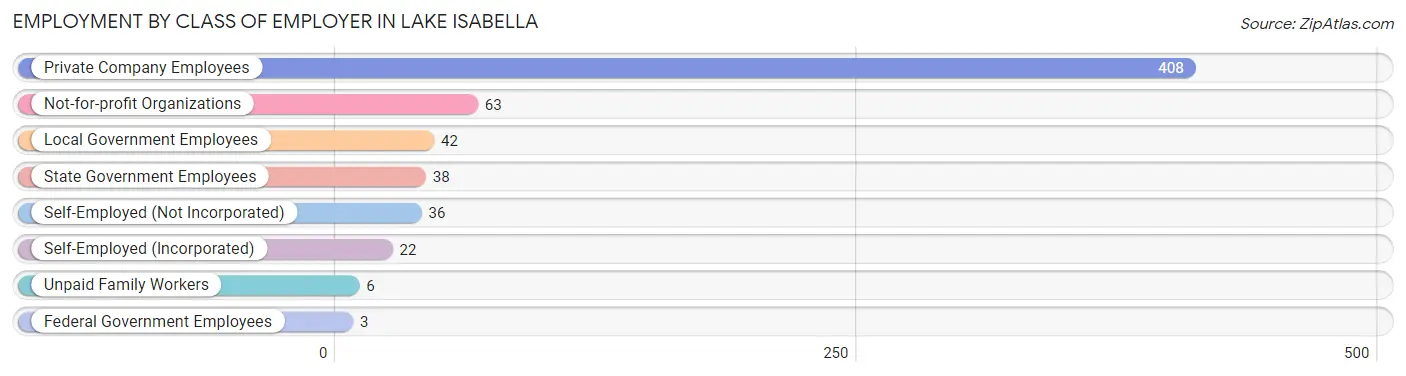
| Employer Class | # Employees | % Employees |
| Private Company Employees | 408 | 66.0% |
| Self-Employed (Incorporated) | 22 | 3.6% |
| Self-Employed (Not Incorporated) | 36 | 5.8% |
| Not-for-profit Organizations | 63 | 10.2% |
| Local Government Employees | 42 | 6.8% |
| State Government Employees | 38 | 6.1% |
| Federal Government Employees | 3 | 0.5% |
| Unpaid Family Workers | 6 | 1.0% |
| Total | 618 | 100.0% |
Employment Status by Age in Lake Isabella
According to the labor force statistics for Lake Isabella, out of the total population over 16 years of age (1,314), 48.5% or 637 individuals are in the labor force, with 2.4% or 15 of them unemployed. The age group with the highest labor force participation rate is 20 to 24 years, with 94.6% or 87 individuals in the labor force. Within the labor force, the 20 to 24 years age range has the highest percentage of unemployed individuals, with 6.9% or 6 of them being unemployed.
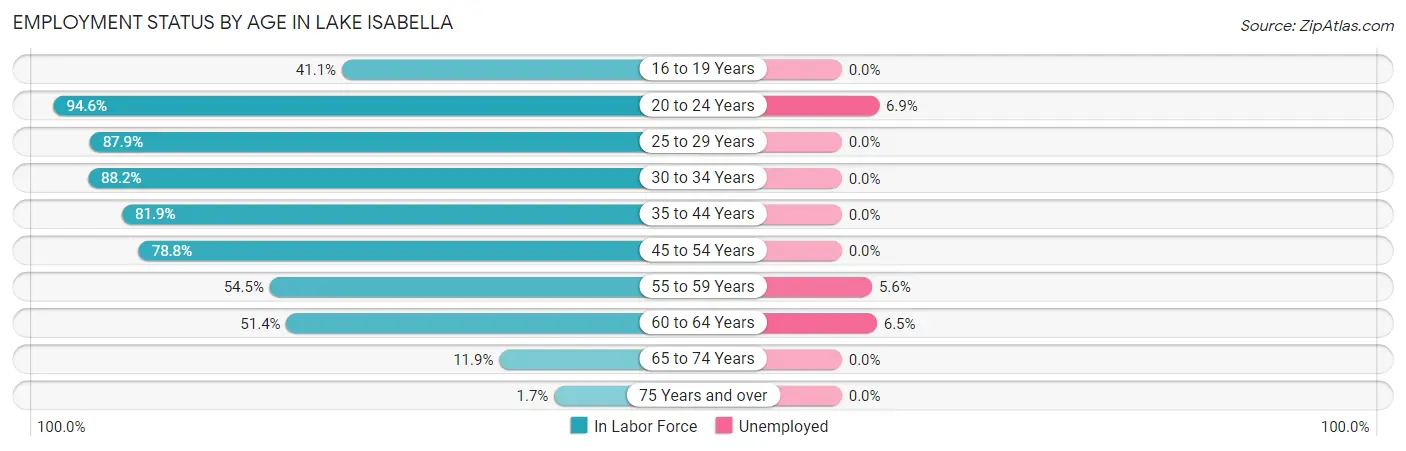
| Age Bracket | In Labor Force | Unemployed |
| 16 to 19 Years | 23 (41.1%) | 0 (0.0%) |
| 20 to 24 Years | 87 (94.6%) | 6 (6.9%) |
| 25 to 29 Years | 51 (87.9%) | 0 (0.0%) |
| 30 to 34 Years | 45 (88.2%) | 0 (0.0%) |
| 35 to 44 Years | 154 (81.9%) | 0 (0.0%) |
| 45 to 54 Years | 93 (78.8%) | 0 (0.0%) |
| 55 to 59 Years | 54 (54.5%) | 3 (5.6%) |
| 60 to 64 Years | 92 (51.4%) | 6 (6.5%) |
| 65 to 74 Years | 35 (11.9%) | 0 (0.0%) |
| 75 Years and over | 3 (1.7%) | 0 (0.0%) |
| Total | 637 (48.5%) | 15 (2.4%) |
Employment Status by Educational Attainment in Lake Isabella
According to labor force statistics for Lake Isabella, 70.6% of individuals (489) out of the total population between 25 and 64 years of age (693) are in the labor force, with 1.8% or 9 of them being unemployed. The group with the highest labor force participation rate are those with the educational attainment of bachelor's degree or higher, with 84.9% or 158 individuals in the labor force. Within the labor force, individuals with high school diploma education have the highest percentage of unemployment, with 3.0% or 4 of them being unemployed.
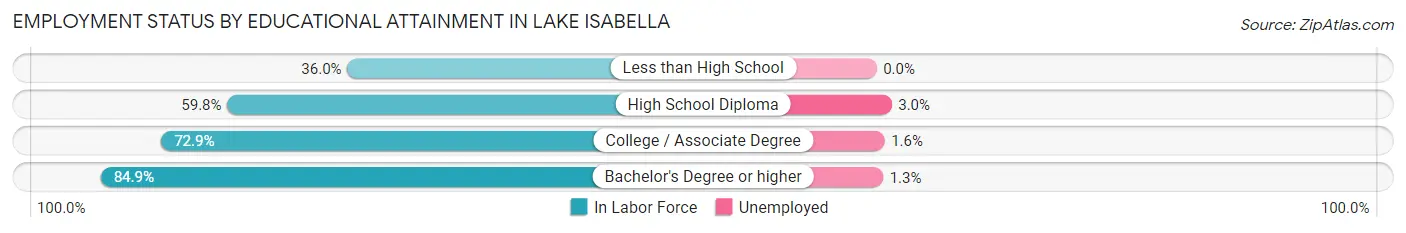
| Educational Attainment | In Labor Force | Unemployed |
| Less than High School | 9 (36.0%) | 0 (0.0%) |
| High School Diploma | 134 (59.8%) | 7 (3.0%) |
| College / Associate Degree | 188 (72.9%) | 4 (1.6%) |
| Bachelor's Degree or higher | 158 (84.9%) | 2 (1.3%) |
| Total | 489 (70.6%) | 12 (1.8%) |
Employment Occupations by Sex in Lake Isabella
Management, Business, Science and Arts Occupations
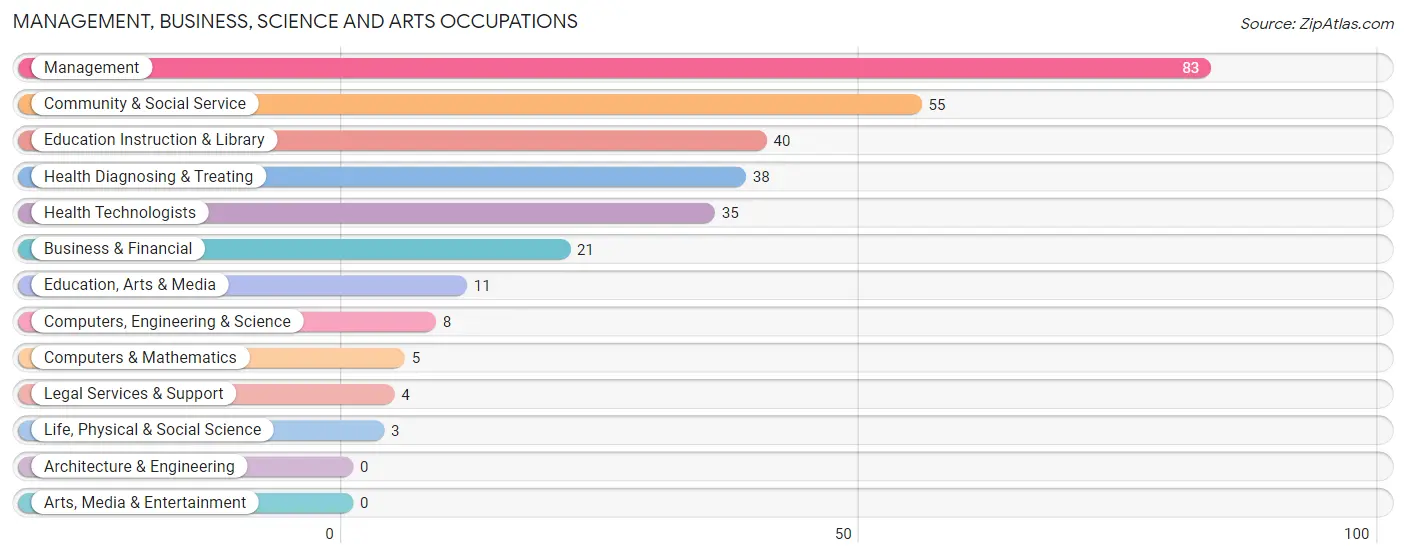
The most common Management, Business, Science and Arts occupations in Lake Isabella are Management (83 | 13.3%), Community & Social Service (55 | 8.8%), Education Instruction & Library (40 | 6.4%), Health Diagnosing & Treating (38 | 6.1%), and Health Technologists (35 | 5.6%).
Management, Business, Science and Arts Occupations by Sex
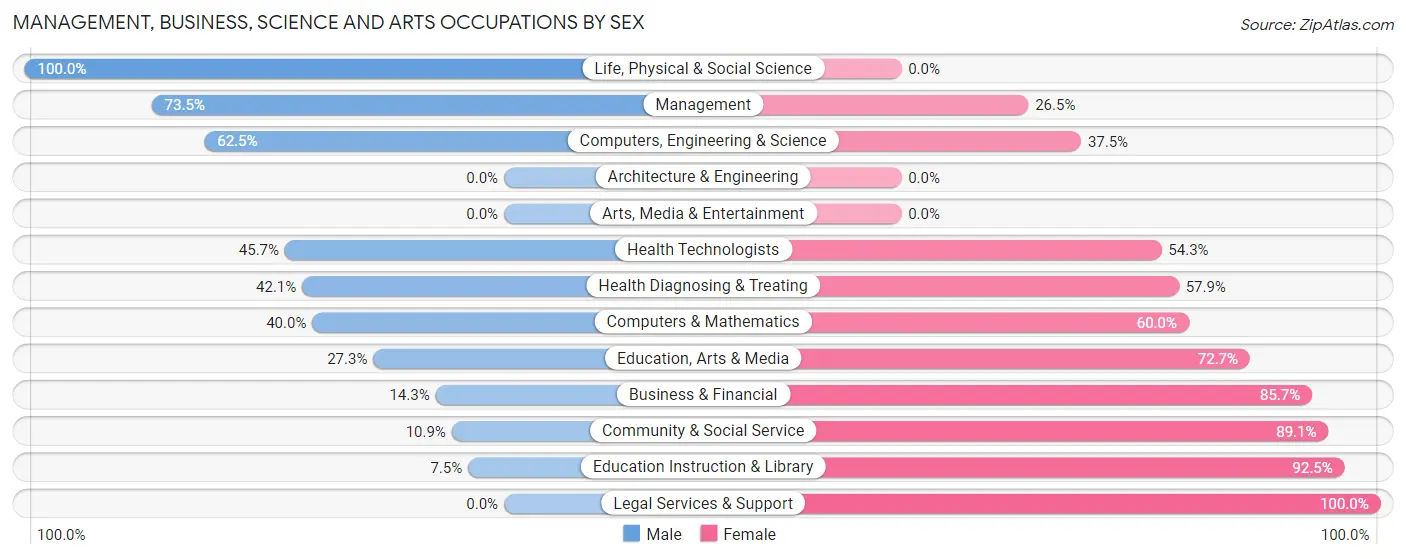
Within the Management, Business, Science and Arts occupations in Lake Isabella, the most male-oriented occupations are Life, Physical & Social Science (100.0%), Management (73.5%), and Computers, Engineering & Science (62.5%), while the most female-oriented occupations are Legal Services & Support (100.0%), Education Instruction & Library (92.5%), and Community & Social Service (89.1%).
| Occupation | Male | Female |
| Management | 61 (73.5%) | 22 (26.5%) |
| Business & Financial | 3 (14.3%) | 18 (85.7%) |
| Computers, Engineering & Science | 5 (62.5%) | 3 (37.5%) |
| Computers & Mathematics | 2 (40.0%) | 3 (60.0%) |
| Architecture & Engineering | 0 (0.0%) | 0 (0.0%) |
| Life, Physical & Social Science | 3 (100.0%) | 0 (0.0%) |
| Community & Social Service | 6 (10.9%) | 49 (89.1%) |
| Education, Arts & Media | 3 (27.3%) | 8 (72.7%) |
| Legal Services & Support | 0 (0.0%) | 4 (100.0%) |
| Education Instruction & Library | 3 (7.5%) | 37 (92.5%) |
| Arts, Media & Entertainment | 0 (0.0%) | 0 (0.0%) |
| Health Diagnosing & Treating | 16 (42.1%) | 22 (57.9%) |
| Health Technologists | 16 (45.7%) | 19 (54.3%) |
| Total (Category) | 91 (44.4%) | 114 (55.6%) |
| Total (Overall) | 340 (54.7%) | 282 (45.3%) |
Services Occupations
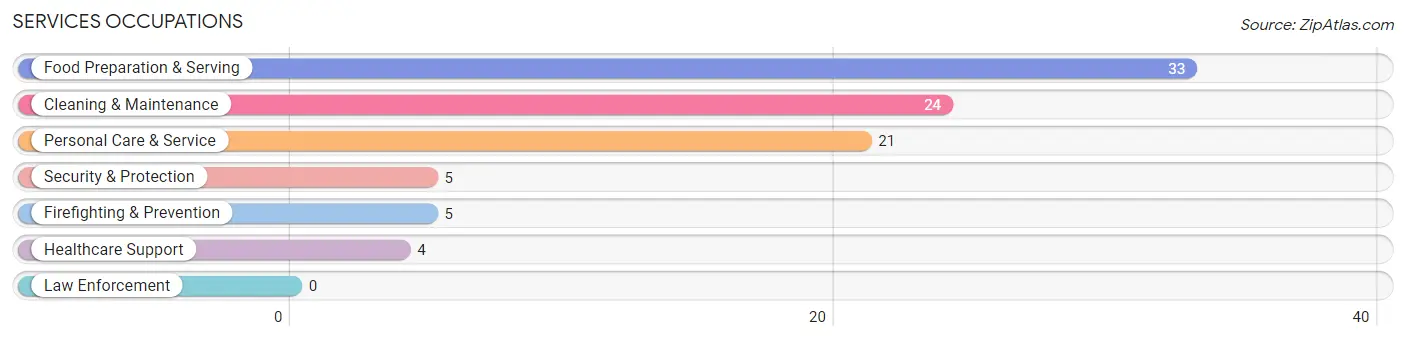
The most common Services occupations in Lake Isabella are Food Preparation & Serving (33 | 5.3%), Cleaning & Maintenance (24 | 3.9%), Personal Care & Service (21 | 3.4%), Security & Protection (5 | 0.8%), and Firefighting & Prevention (5 | 0.8%).
Services Occupations by Sex
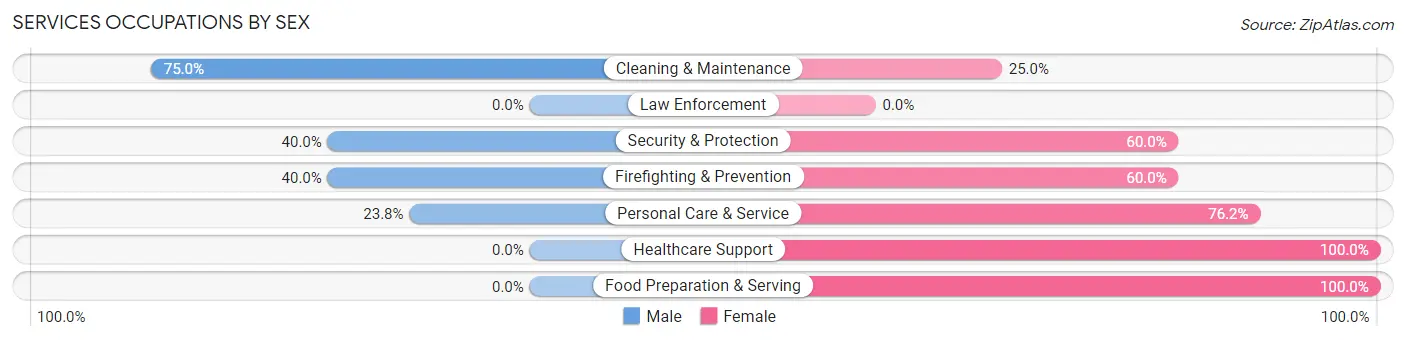
Within the Services occupations in Lake Isabella, the most male-oriented occupations are Cleaning & Maintenance (75.0%), Security & Protection (40.0%), and Firefighting & Prevention (40.0%), while the most female-oriented occupations are Healthcare Support (100.0%), Food Preparation & Serving (100.0%), and Personal Care & Service (76.2%).
| Occupation | Male | Female |
| Healthcare Support | 0 (0.0%) | 4 (100.0%) |
| Security & Protection | 2 (40.0%) | 3 (60.0%) |
| Firefighting & Prevention | 2 (40.0%) | 3 (60.0%) |
| Law Enforcement | 0 (0.0%) | 0 (0.0%) |
| Food Preparation & Serving | 0 (0.0%) | 33 (100.0%) |
| Cleaning & Maintenance | 18 (75.0%) | 6 (25.0%) |
| Personal Care & Service | 5 (23.8%) | 16 (76.2%) |
| Total (Category) | 25 (28.7%) | 62 (71.3%) |
| Total (Overall) | 340 (54.7%) | 282 (45.3%) |
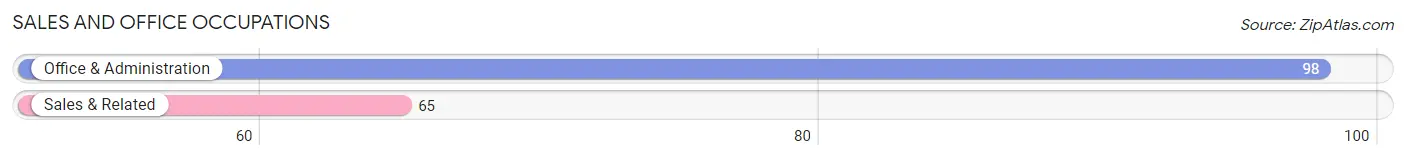
Sales and Office Occupations
The most common Sales and Office occupations in Lake Isabella are Office & Administration (98 | 15.8%), and Sales & Related (65 | 10.4%).
Sales and Office Occupations by Sex
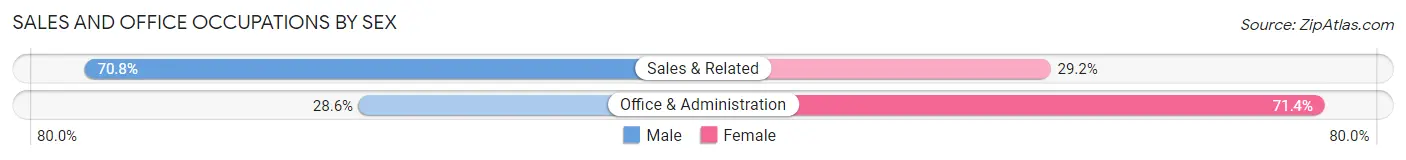
| Occupation | Male | Female |
| Sales & Related | 46 (70.8%) | 19 (29.2%) |
| Office & Administration | 28 (28.6%) | 70 (71.4%) |
| Total (Category) | 74 (45.4%) | 89 (54.6%) |
| Total (Overall) | 340 (54.7%) | 282 (45.3%) |
Natural Resources, Construction and Maintenance Occupations
The most common Natural Resources, Construction and Maintenance occupations in Lake Isabella are Construction & Extraction (27 | 4.3%), and Installation, Maintenance & Repair (9 | 1.5%).
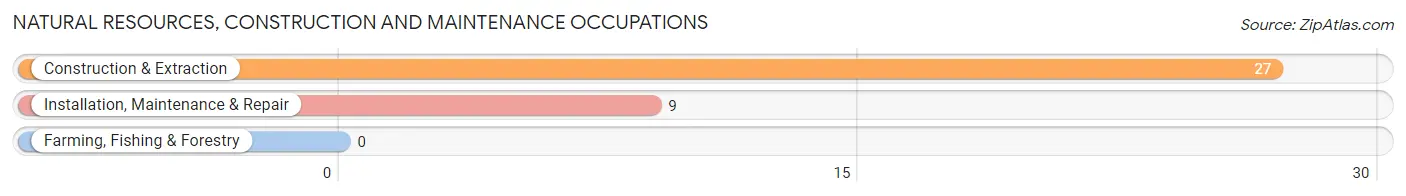
Natural Resources, Construction and Maintenance Occupations by Sex
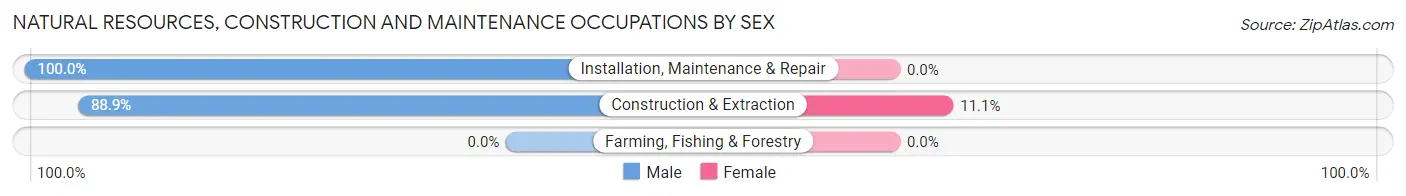
| Occupation | Male | Female |
| Farming, Fishing & Forestry | 0 (0.0%) | 0 (0.0%) |
| Construction & Extraction | 24 (88.9%) | 3 (11.1%) |
| Installation, Maintenance & Repair | 9 (100.0%) | 0 (0.0%) |
| Total (Category) | 33 (91.7%) | 3 (8.3%) |
| Total (Overall) | 340 (54.7%) | 282 (45.3%) |
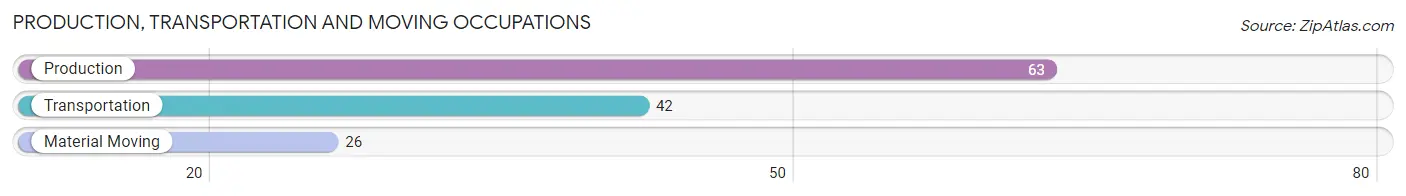
Production, Transportation and Moving Occupations
The most common Production, Transportation and Moving occupations in Lake Isabella are Production (63 | 10.1%), Transportation (42 | 6.8%), and Material Moving (26 | 4.2%).
Production, Transportation and Moving Occupations by Sex
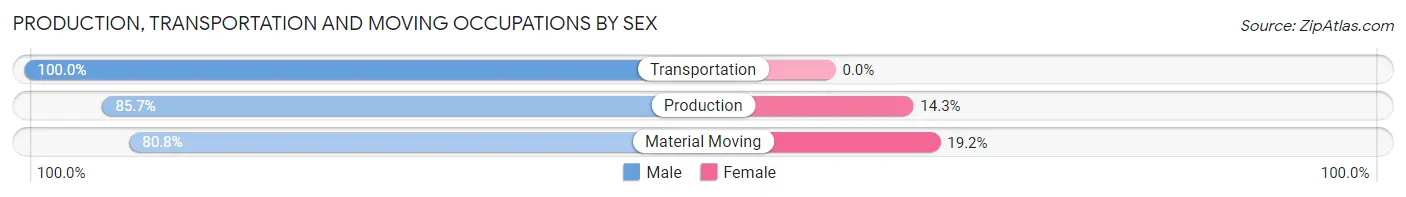
| Occupation | Male | Female |
| Production | 54 (85.7%) | 9 (14.3%) |
| Transportation | 42 (100.0%) | 0 (0.0%) |
| Material Moving | 21 (80.8%) | 5 (19.2%) |
| Total (Category) | 117 (89.3%) | 14 (10.7%) |
| Total (Overall) | 340 (54.7%) | 282 (45.3%) |
Employment Industries by Sex in Lake Isabella
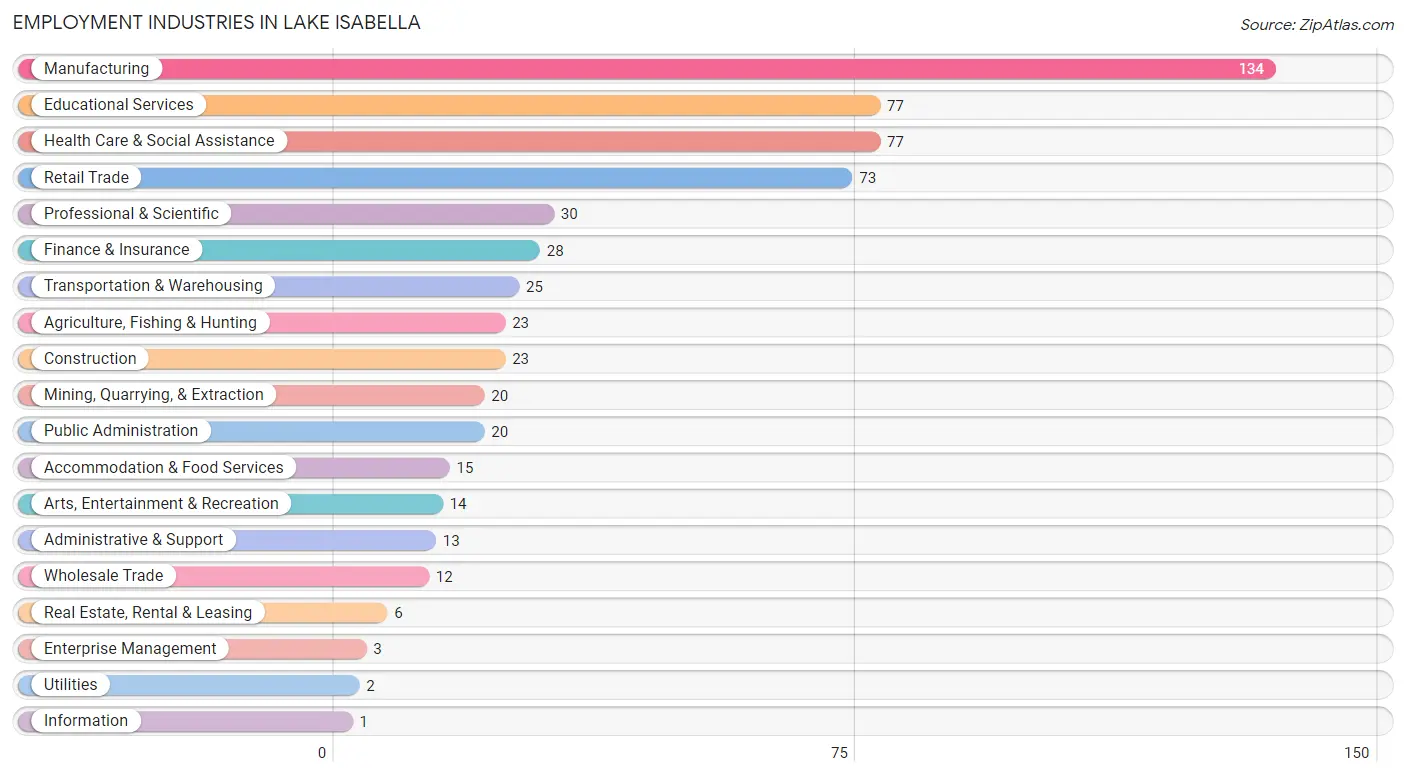
Employment Industries in Lake Isabella
The major employment industries in Lake Isabella include Manufacturing (134 | 21.5%), Educational Services (77 | 12.4%), Health Care & Social Assistance (77 | 12.4%), Retail Trade (73 | 11.7%), and Professional & Scientific (30 | 4.8%).
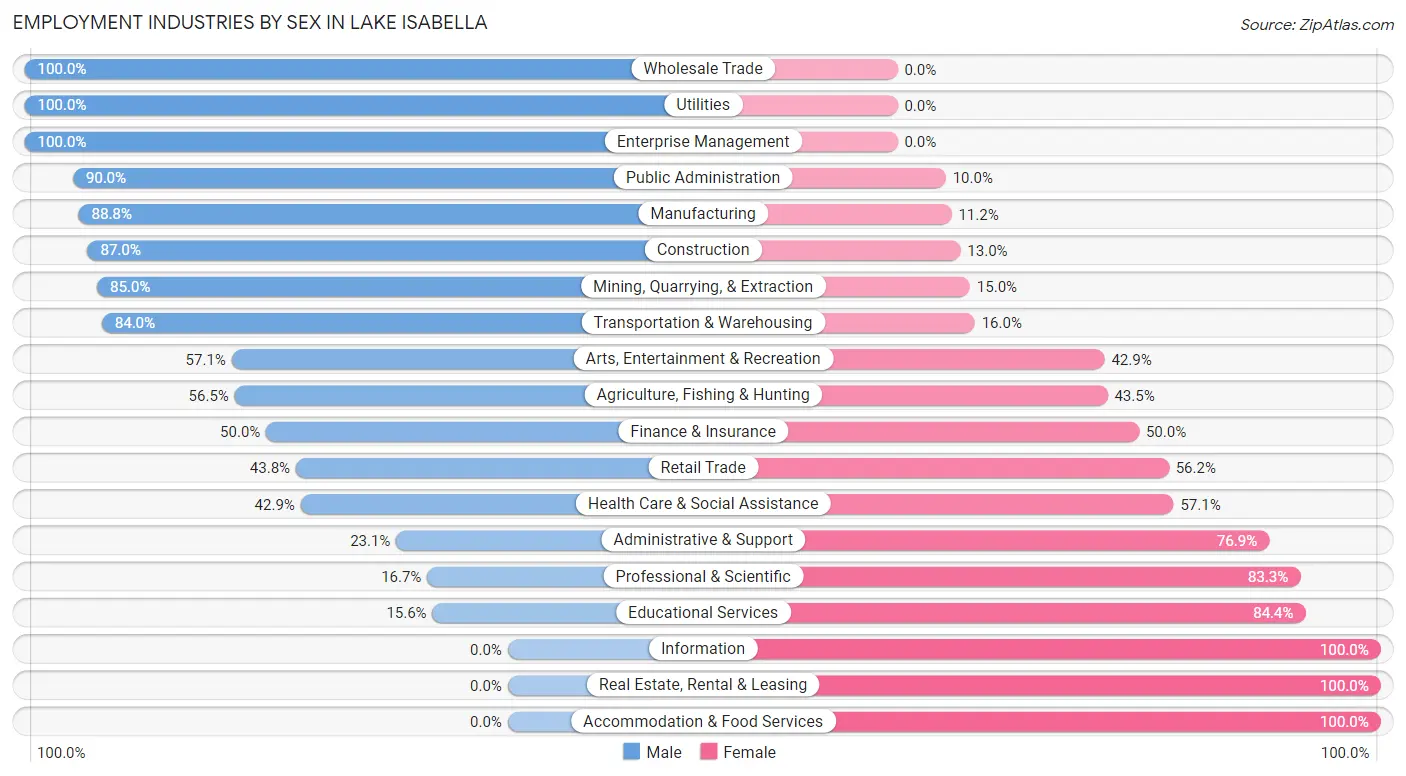
Employment Industries by Sex in Lake Isabella
The Lake Isabella industries that see more men than women are Wholesale Trade (100.0%), Utilities (100.0%), and Enterprise Management (100.0%), whereas the industries that tend to have a higher number of women are Information (100.0%), Real Estate, Rental & Leasing (100.0%), and Accommodation & Food Services (100.0%).
| Industry | Male | Female |
| Agriculture, Fishing & Hunting | 13 (56.5%) | 10 (43.5%) |
| Mining, Quarrying, & Extraction | 17 (85.0%) | 3 (15.0%) |
| Construction | 20 (87.0%) | 3 (13.0%) |
| Manufacturing | 119 (88.8%) | 15 (11.2%) |
| Wholesale Trade | 12 (100.0%) | 0 (0.0%) |
| Retail Trade | 32 (43.8%) | 41 (56.2%) |
| Transportation & Warehousing | 21 (84.0%) | 4 (16.0%) |
| Utilities | 2 (100.0%) | 0 (0.0%) |
| Information | 0 (0.0%) | 1 (100.0%) |
| Finance & Insurance | 14 (50.0%) | 14 (50.0%) |
| Real Estate, Rental & Leasing | 0 (0.0%) | 6 (100.0%) |
| Professional & Scientific | 5 (16.7%) | 25 (83.3%) |
| Enterprise Management | 3 (100.0%) | 0 (0.0%) |
| Administrative & Support | 3 (23.1%) | 10 (76.9%) |
| Educational Services | 12 (15.6%) | 65 (84.4%) |
| Health Care & Social Assistance | 33 (42.9%) | 44 (57.1%) |
| Arts, Entertainment & Recreation | 8 (57.1%) | 6 (42.9%) |
| Accommodation & Food Services | 0 (0.0%) | 15 (100.0%) |
| Public Administration | 18 (90.0%) | 2 (10.0%) |
| Total | 340 (54.7%) | 282 (45.3%) |
Education in Lake Isabella
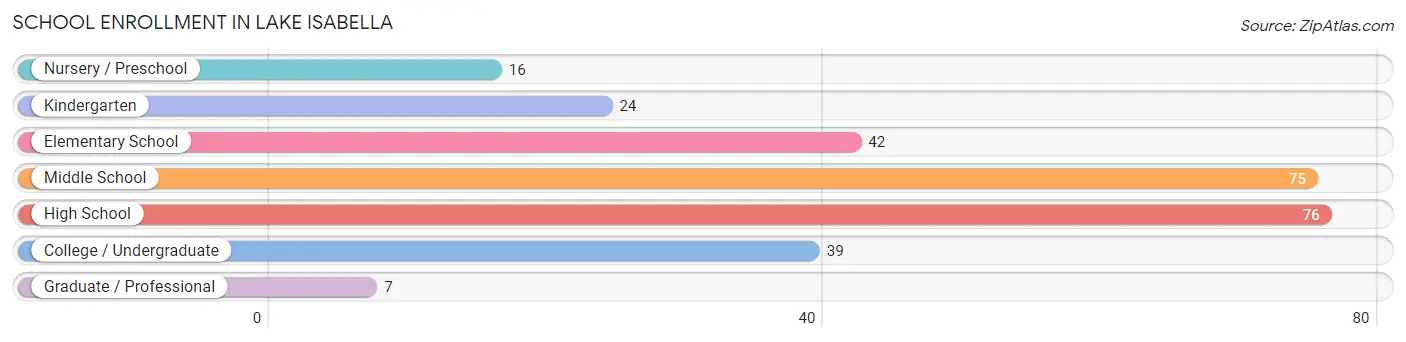
School Enrollment in Lake Isabella
The most common levels of schooling among the 279 students in Lake Isabella are high school (76 | 27.2%), middle school (75 | 26.9%), and elementary school (42 | 15.0%).
| School Level | # Students | % Students |
| Nursery / Preschool | 16 | 5.7% |
| Kindergarten | 24 | 8.6% |
| Elementary School | 42 | 15.0% |
| Middle School | 75 | 26.9% |
| High School | 76 | 27.2% |
| College / Undergraduate | 39 | 14.0% |
| Graduate / Professional | 7 | 2.5% |
| Total | 279 | 100.0% |
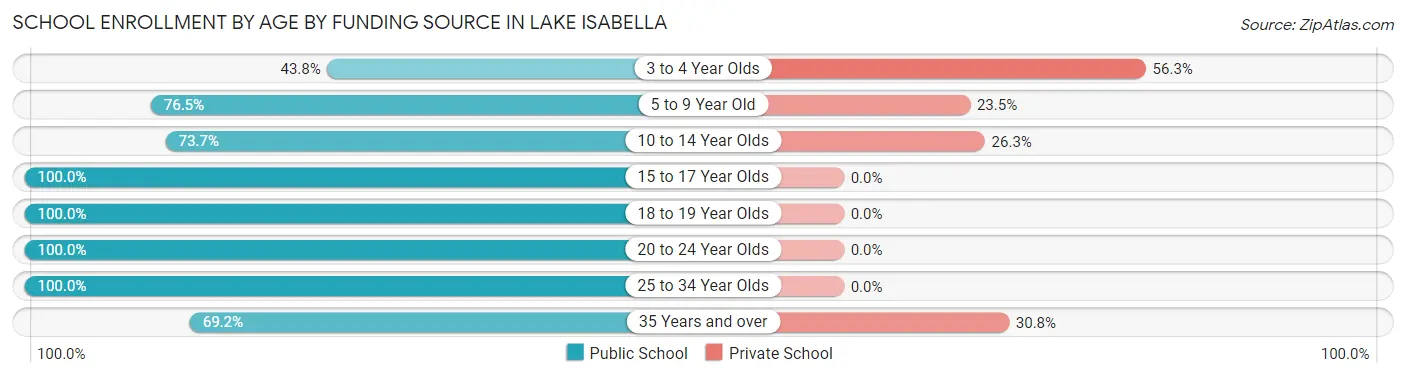
School Enrollment by Age by Funding Source in Lake Isabella
Out of a total of 279 students who are enrolled in schools in Lake Isabella, 51 (18.3%) attend a private institution, while the remaining 228 (81.7%) are enrolled in public schools. The age group of 3 to 4 year olds has the highest likelihood of being enrolled in private schools, with 9 (56.2% in the age bracket) enrolled. Conversely, the age group of 15 to 17 year olds has the lowest likelihood of being enrolled in a private school, with 51 (100.0% in the age bracket) attending a public institution.
| Age Bracket | Public School | Private School |
| 3 to 4 Year Olds | 7 (43.8%) | 9 (56.2%) |
| 5 to 9 Year Old | 39 (76.5%) | 12 (23.5%) |
| 10 to 14 Year Olds | 73 (73.7%) | 26 (26.3%) |
| 15 to 17 Year Olds | 51 (100.0%) | 0 (0.0%) |
| 18 to 19 Year Olds | 18 (100.0%) | 0 (0.0%) |
| 20 to 24 Year Olds | 23 (100.0%) | 0 (0.0%) |
| 25 to 34 Year Olds | 8 (100.0%) | 0 (0.0%) |
| 35 Years and over | 9 (69.2%) | 4 (30.8%) |
| Total | 228 (81.7%) | 51 (18.3%) |
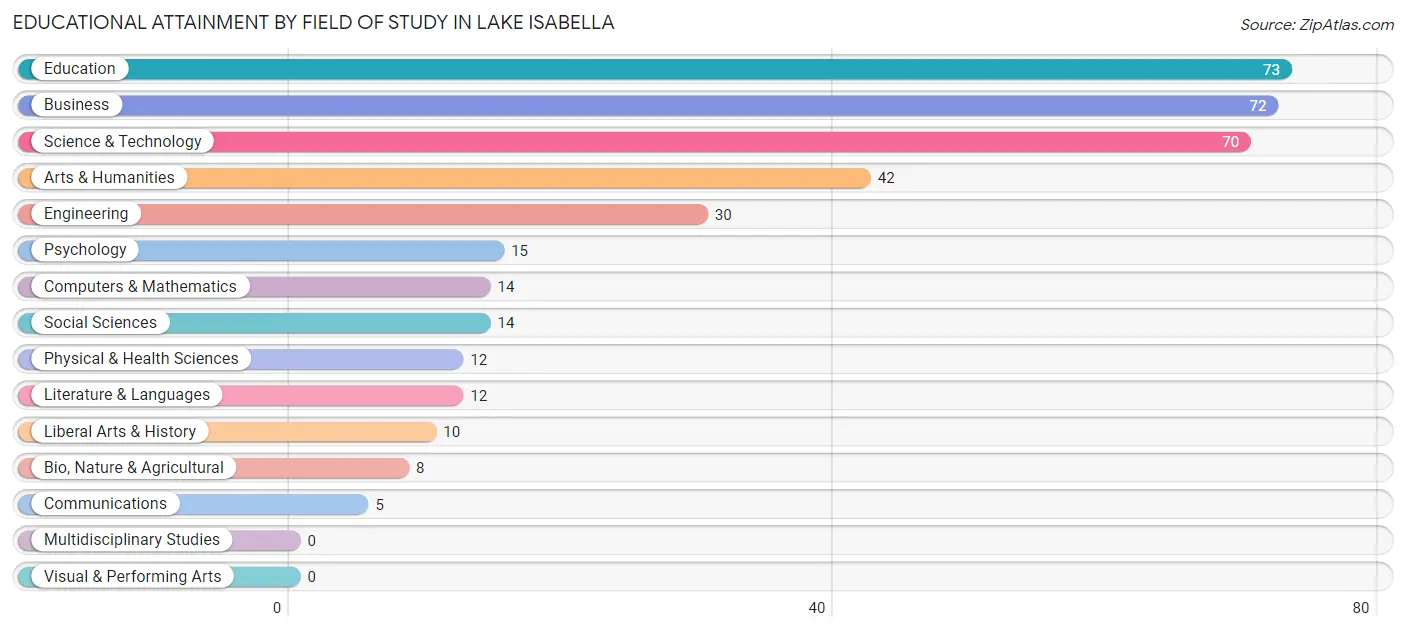
Educational Attainment by Field of Study in Lake Isabella
Education (73 | 19.4%), business (72 | 19.1%), science & technology (70 | 18.6%), arts & humanities (42 | 11.1%), and engineering (30 | 8.0%) are the most common fields of study among 377 individuals in Lake Isabella who have obtained a bachelor's degree or higher.
| Field of Study | # Graduates | % Graduates |
| Computers & Mathematics | 14 | 3.7% |
| Bio, Nature & Agricultural | 8 | 2.1% |
| Physical & Health Sciences | 12 | 3.2% |
| Psychology | 15 | 4.0% |
| Social Sciences | 14 | 3.7% |
| Engineering | 30 | 8.0% |
| Multidisciplinary Studies | 0 | 0.0% |
| Science & Technology | 70 | 18.6% |
| Business | 72 | 19.1% |
| Education | 73 | 19.4% |
| Literature & Languages | 12 | 3.2% |
| Liberal Arts & History | 10 | 2.6% |
| Visual & Performing Arts | 0 | 0.0% |
| Communications | 5 | 1.3% |
| Arts & Humanities | 42 | 11.1% |
| Total | 377 | 100.0% |
Transportation & Commute in Lake Isabella
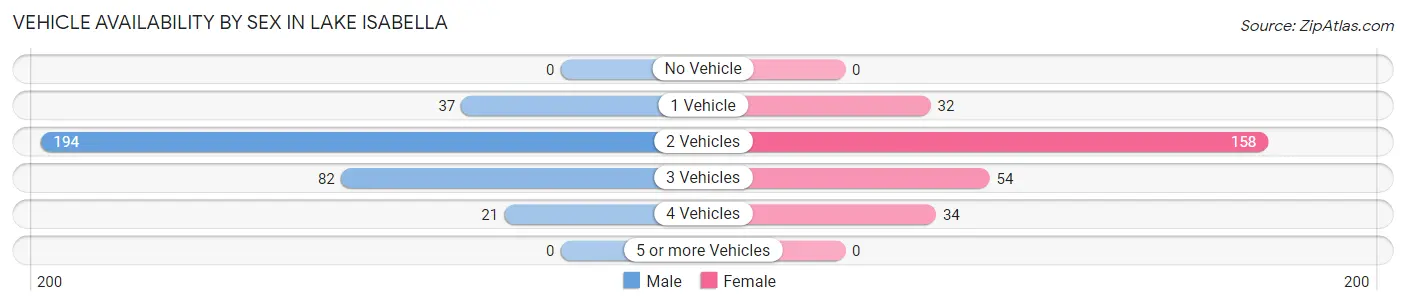
Vehicle Availability by Sex in Lake Isabella
The most prevalent vehicle ownership categories in Lake Isabella are males with 2 vehicles (194, accounting for 58.1%) and females with 2 vehicles (158, making up 69.8%).
| Vehicles Available | Male | Female |
| No Vehicle | 0 (0.0%) | 0 (0.0%) |
| 1 Vehicle | 37 (11.1%) | 32 (11.5%) |
| 2 Vehicles | 194 (58.1%) | 158 (56.8%) |
| 3 Vehicles | 82 (24.5%) | 54 (19.4%) |
| 4 Vehicles | 21 (6.3%) | 34 (12.2%) |
| 5 or more Vehicles | 0 (0.0%) | 0 (0.0%) |
| Total | 334 (100.0%) | 278 (100.0%) |
Commute Time in Lake Isabella
The most frequently occuring commute durations in Lake Isabella are 20 to 24 minutes (108 commuters, 18.1%), 30 to 34 minutes (107 commuters, 18.0%), and 10 to 14 minutes (85 commuters, 14.3%).
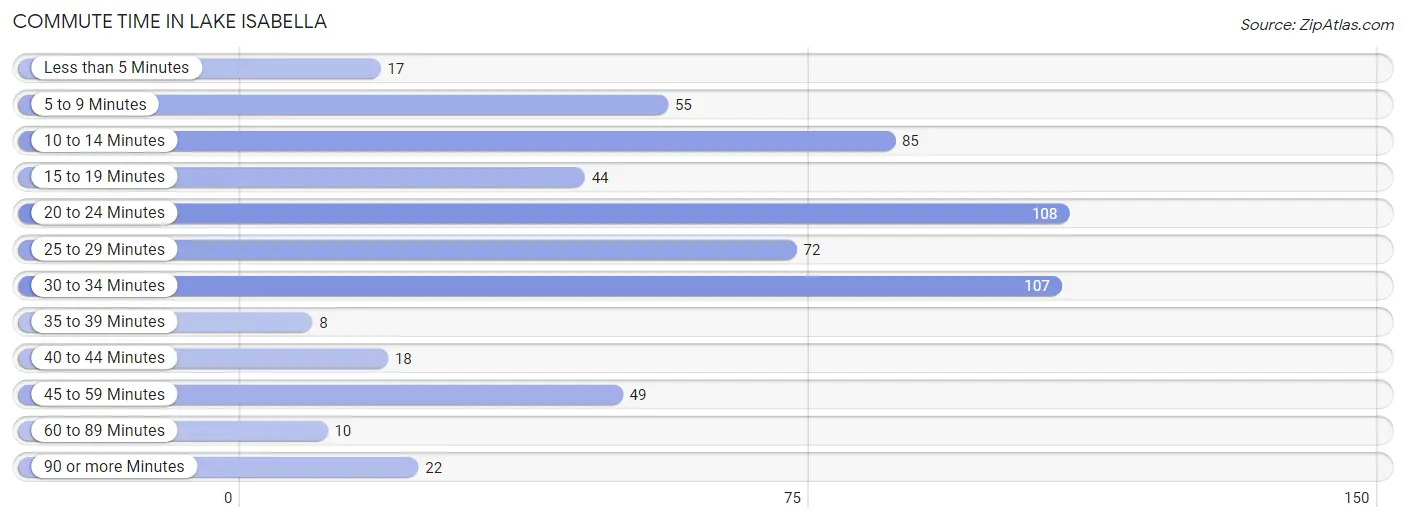
| Commute Time | # Commuters | % Commuters |
| Less than 5 Minutes | 17 | 2.9% |
| 5 to 9 Minutes | 55 | 9.2% |
| 10 to 14 Minutes | 85 | 14.3% |
| 15 to 19 Minutes | 44 | 7.4% |
| 20 to 24 Minutes | 108 | 18.1% |
| 25 to 29 Minutes | 72 | 12.1% |
| 30 to 34 Minutes | 107 | 18.0% |
| 35 to 39 Minutes | 8 | 1.3% |
| 40 to 44 Minutes | 18 | 3.0% |
| 45 to 59 Minutes | 49 | 8.2% |
| 60 to 89 Minutes | 10 | 1.7% |
| 90 or more Minutes | 22 | 3.7% |
Commute Time by Sex in Lake Isabella
The most common commute times in Lake Isabella are 30 to 34 minutes (78 commuters, 23.1%) for males and 20 to 24 minutes (63 commuters, 24.5%) for females.
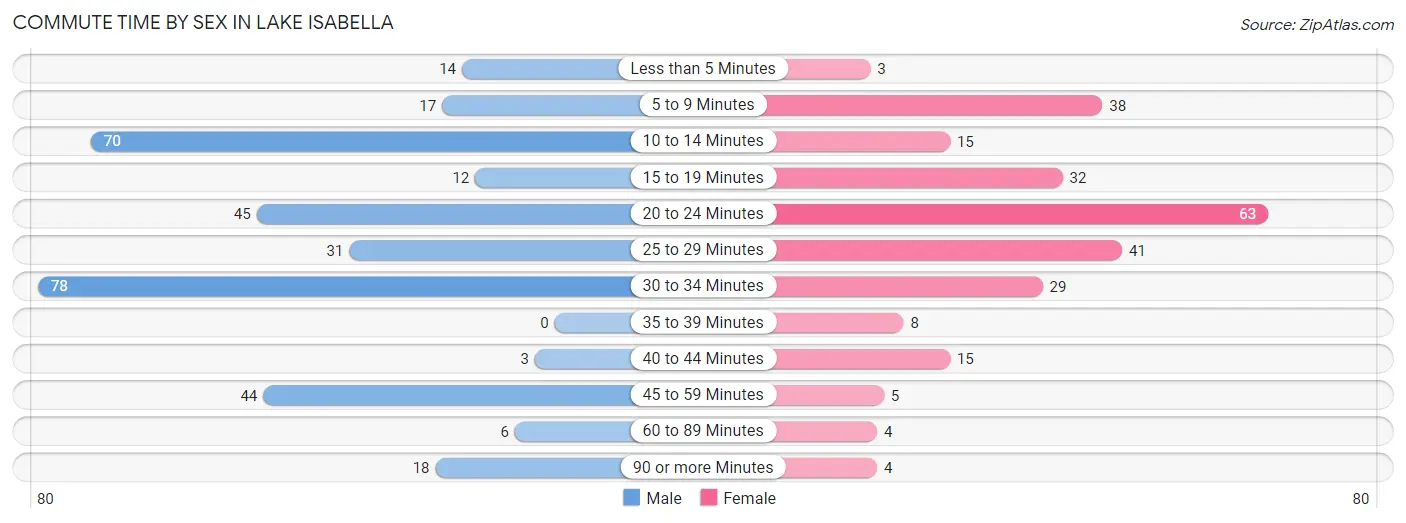
| Commute Time | Male | Female |
| Less than 5 Minutes | 14 (4.1%) | 3 (1.2%) |
| 5 to 9 Minutes | 17 (5.0%) | 38 (14.8%) |
| 10 to 14 Minutes | 70 (20.7%) | 15 (5.8%) |
| 15 to 19 Minutes | 12 (3.5%) | 32 (12.4%) |
| 20 to 24 Minutes | 45 (13.3%) | 63 (24.5%) |
| 25 to 29 Minutes | 31 (9.2%) | 41 (16.0%) |
| 30 to 34 Minutes | 78 (23.1%) | 29 (11.3%) |
| 35 to 39 Minutes | 0 (0.0%) | 8 (3.1%) |
| 40 to 44 Minutes | 3 (0.9%) | 15 (5.8%) |
| 45 to 59 Minutes | 44 (13.0%) | 5 (1.9%) |
| 60 to 89 Minutes | 6 (1.8%) | 4 (1.6%) |
| 90 or more Minutes | 18 (5.3%) | 4 (1.6%) |
Time of Departure to Work by Sex in Lake Isabella
The most frequent times of departure to work in Lake Isabella are 8:00 AM to 8:29 AM (64, 18.9%) for males and 7:00 AM to 7:29 AM (63, 24.5%) for females.
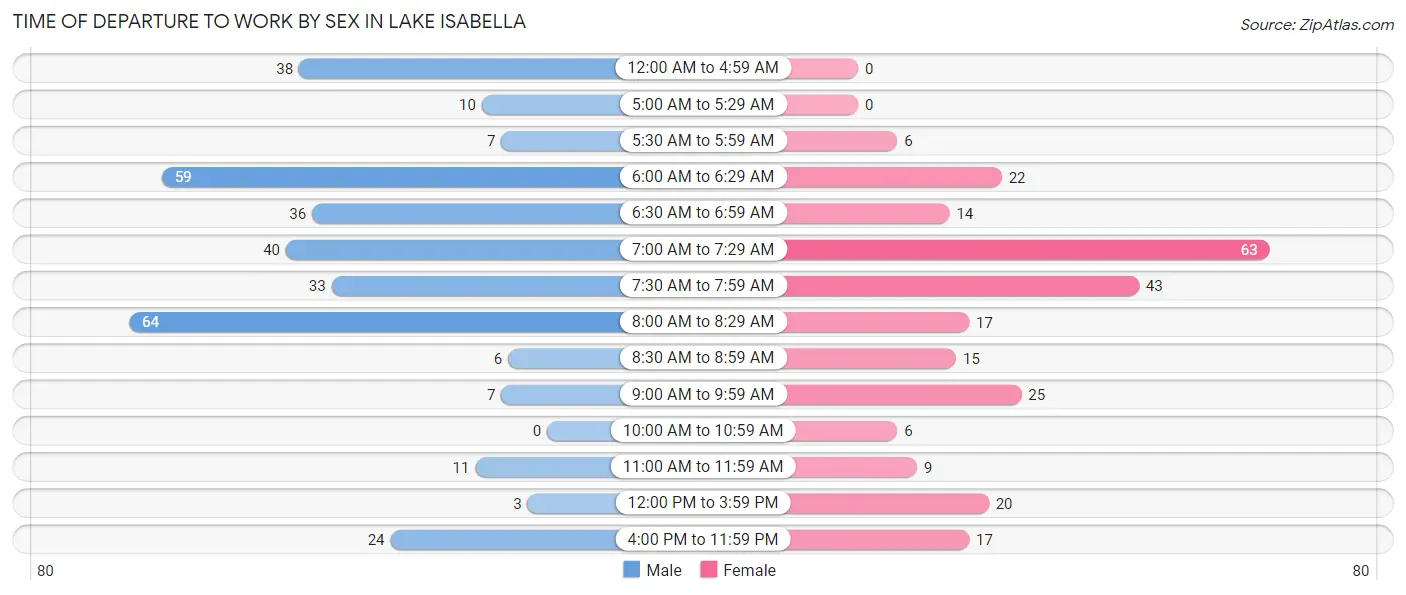
| Time of Departure | Male | Female |
| 12:00 AM to 4:59 AM | 38 (11.2%) | 0 (0.0%) |
| 5:00 AM to 5:29 AM | 10 (3.0%) | 0 (0.0%) |
| 5:30 AM to 5:59 AM | 7 (2.1%) | 6 (2.3%) |
| 6:00 AM to 6:29 AM | 59 (17.5%) | 22 (8.6%) |
| 6:30 AM to 6:59 AM | 36 (10.6%) | 14 (5.4%) |
| 7:00 AM to 7:29 AM | 40 (11.8%) | 63 (24.5%) |
| 7:30 AM to 7:59 AM | 33 (9.8%) | 43 (16.7%) |
| 8:00 AM to 8:29 AM | 64 (18.9%) | 17 (6.6%) |
| 8:30 AM to 8:59 AM | 6 (1.8%) | 15 (5.8%) |
| 9:00 AM to 9:59 AM | 7 (2.1%) | 25 (9.7%) |
| 10:00 AM to 10:59 AM | 0 (0.0%) | 6 (2.3%) |
| 11:00 AM to 11:59 AM | 11 (3.3%) | 9 (3.5%) |
| 12:00 PM to 3:59 PM | 3 (0.9%) | 20 (7.8%) |
| 4:00 PM to 11:59 PM | 24 (7.1%) | 17 (6.6%) |
| Total | 338 (100.0%) | 257 (100.0%) |
Housing Occupancy in Lake Isabella
Occupancy by Ownership in Lake Isabella
Of the total 666 dwellings in Lake Isabella, owner-occupied units account for 634 (95.2%), while renter-occupied units make up 32 (4.8%).
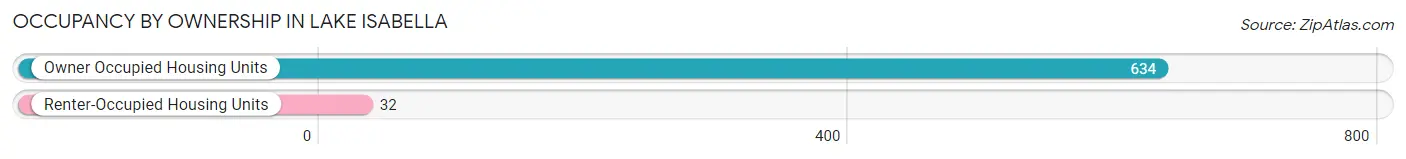
| Occupancy | # Housing Units | % Housing Units |
| Owner Occupied Housing Units | 634 | 95.2% |
| Renter-Occupied Housing Units | 32 | 4.8% |
| Total Occupied Housing Units | 666 | 100.0% |
Occupancy by Household Size in Lake Isabella
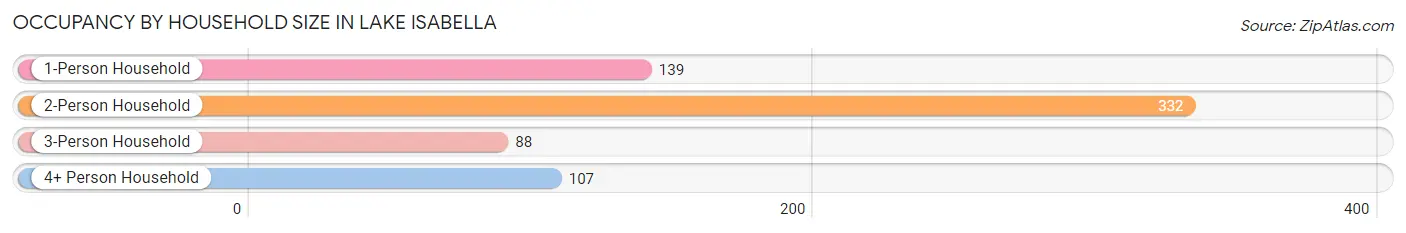
| Household Size | # Housing Units | % Housing Units |
| 1-Person Household | 139 | 20.9% |
| 2-Person Household | 332 | 49.8% |
| 3-Person Household | 88 | 13.2% |
| 4+ Person Household | 107 | 16.1% |
| Total Housing Units | 666 | 100.0% |
Occupancy by Ownership by Household Size in Lake Isabella
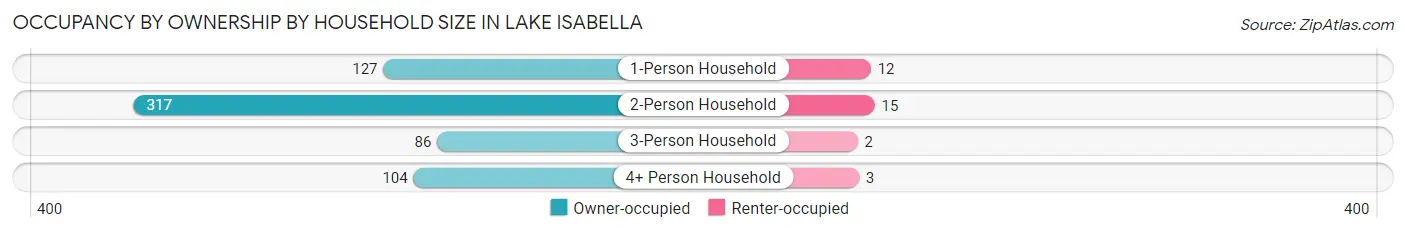
| Household Size | Owner-occupied | Renter-occupied |
| 1-Person Household | 127 (91.4%) | 12 (8.6%) |
| 2-Person Household | 317 (95.5%) | 15 (4.5%) |
| 3-Person Household | 86 (97.7%) | 2 (2.3%) |
| 4+ Person Household | 104 (97.2%) | 3 (2.8%) |
| Total Housing Units | 634 (95.2%) | 32 (4.8%) |
Occupancy by Educational Attainment in Lake Isabella
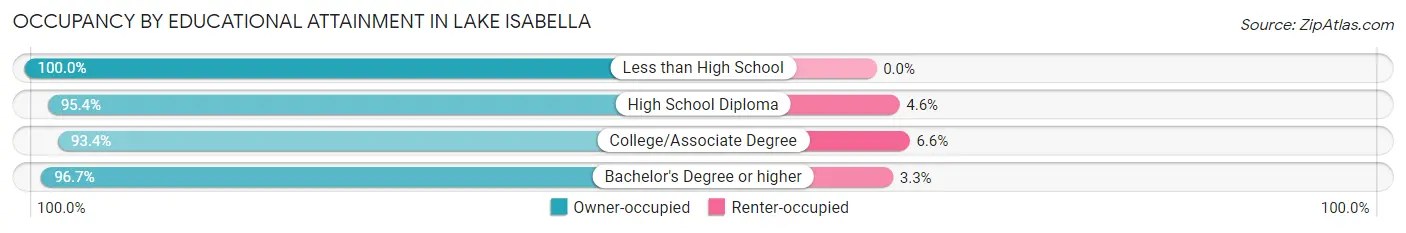
| Household Size | Owner-occupied | Renter-occupied |
| Less than High School | 9 (100.0%) | 0 (0.0%) |
| High School Diploma | 208 (95.4%) | 10 (4.6%) |
| College/Associate Degree | 212 (93.4%) | 15 (6.6%) |
| Bachelor's Degree or higher | 205 (96.7%) | 7 (3.3%) |
Occupancy by Age of Householder in Lake Isabella
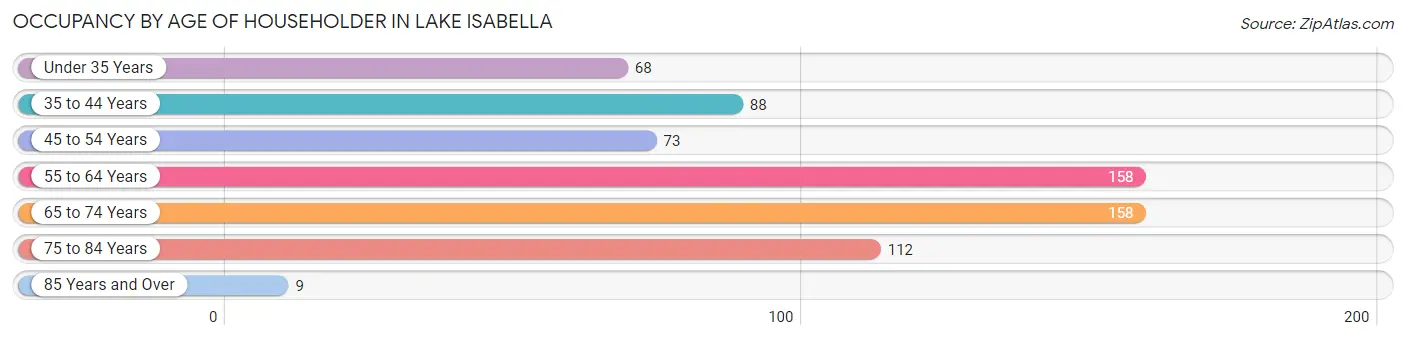
| Age Bracket | # Households | % Households |
| Under 35 Years | 68 | 10.2% |
| 35 to 44 Years | 88 | 13.2% |
| 45 to 54 Years | 73 | 11.0% |
| 55 to 64 Years | 158 | 23.7% |
| 65 to 74 Years | 158 | 23.7% |
| 75 to 84 Years | 112 | 16.8% |
| 85 Years and Over | 9 | 1.3% |
| Total | 666 | 100.0% |
Housing Finances in Lake Isabella
Median Income by Occupancy in Lake Isabella
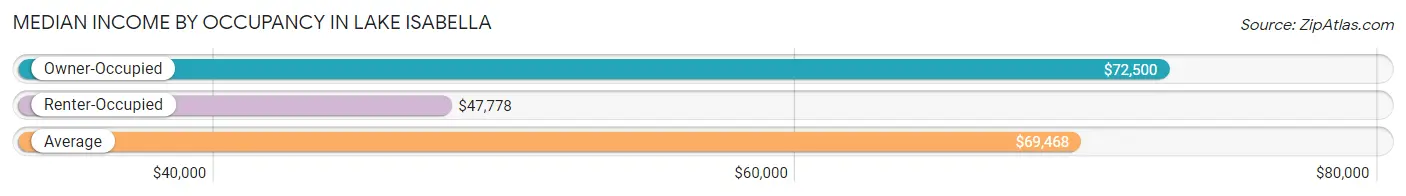
| Occupancy Type | # Households | Median Income |
| Owner-Occupied | 634 (95.2%) | $72,500 |
| Renter-Occupied | 32 (4.8%) | $47,778 |
| Average | 666 (100.0%) | $69,468 |
Occupancy by Householder Income Bracket in Lake Isabella
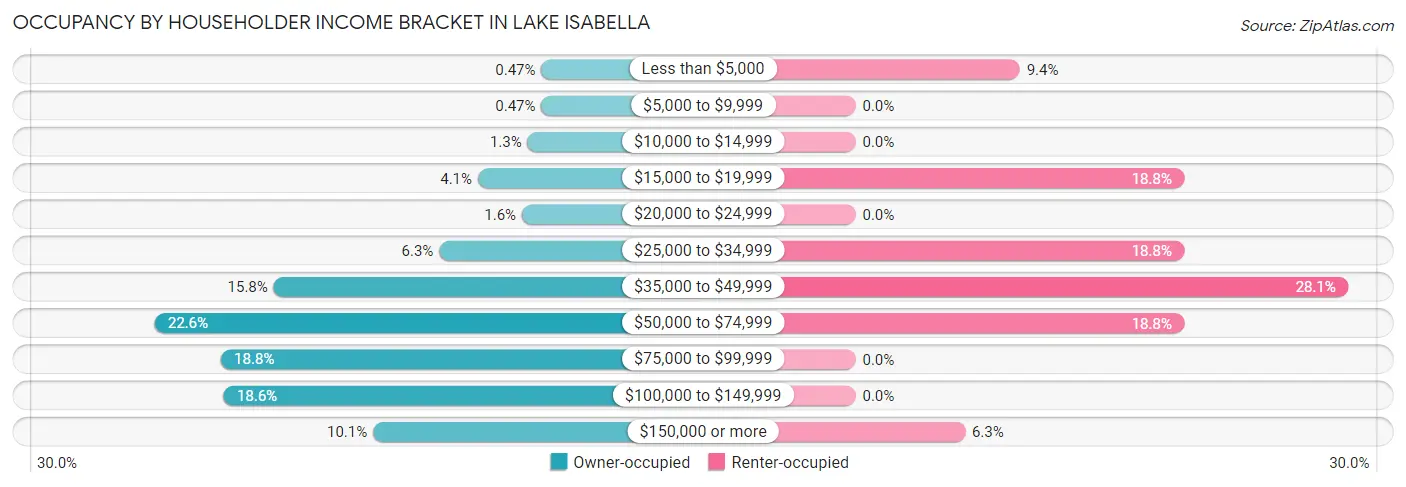
| Income Bracket | Owner-occupied | Renter-occupied |
| Less than $5,000 | 3 (0.5%) | 3 (9.4%) |
| $5,000 to $9,999 | 3 (0.5%) | 0 (0.0%) |
| $10,000 to $14,999 | 8 (1.3%) | 0 (0.0%) |
| $15,000 to $19,999 | 26 (4.1%) | 6 (18.8%) |
| $20,000 to $24,999 | 10 (1.6%) | 0 (0.0%) |
| $25,000 to $34,999 | 40 (6.3%) | 6 (18.8%) |
| $35,000 to $49,999 | 100 (15.8%) | 9 (28.1%) |
| $50,000 to $74,999 | 143 (22.6%) | 6 (18.8%) |
| $75,000 to $99,999 | 119 (18.8%) | 0 (0.0%) |
| $100,000 to $149,999 | 118 (18.6%) | 0 (0.0%) |
| $150,000 or more | 64 (10.1%) | 2 (6.2%) |
| Total | 634 (100.0%) | 32 (100.0%) |
Monthly Housing Cost Tiers in Lake Isabella
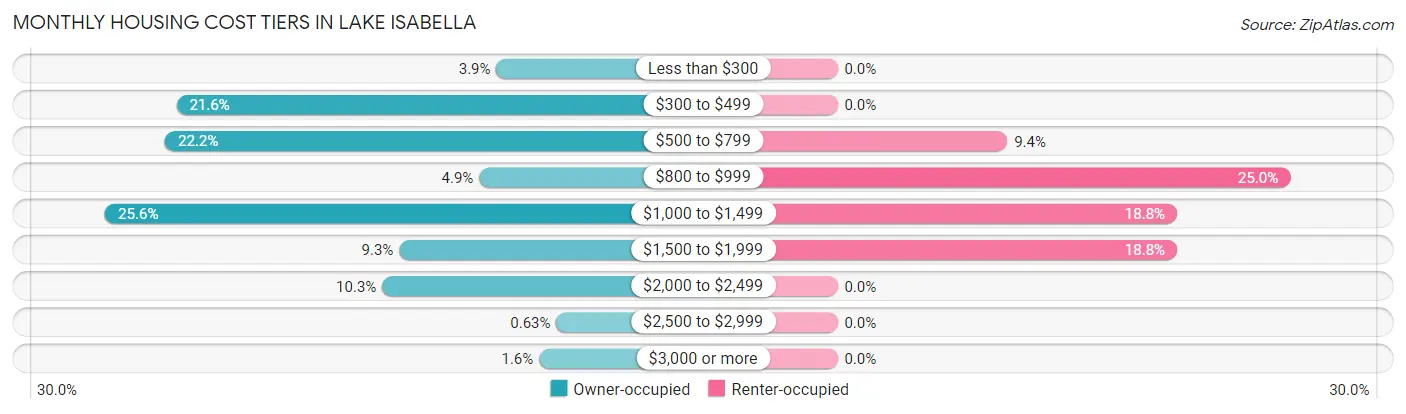
| Monthly Cost | Owner-occupied | Renter-occupied |
| Less than $300 | 25 (3.9%) | 0 (0.0%) |
| $300 to $499 | 137 (21.6%) | 0 (0.0%) |
| $500 to $799 | 141 (22.2%) | 3 (9.4%) |
| $800 to $999 | 31 (4.9%) | 8 (25.0%) |
| $1,000 to $1,499 | 162 (25.6%) | 6 (18.8%) |
| $1,500 to $1,999 | 59 (9.3%) | 6 (18.8%) |
| $2,000 to $2,499 | 65 (10.2%) | 0 (0.0%) |
| $2,500 to $2,999 | 4 (0.6%) | 0 (0.0%) |
| $3,000 or more | 10 (1.6%) | 0 (0.0%) |
| Total | 634 (100.0%) | 32 (100.0%) |
Physical Housing Characteristics in Lake Isabella
Housing Structures in Lake Isabella
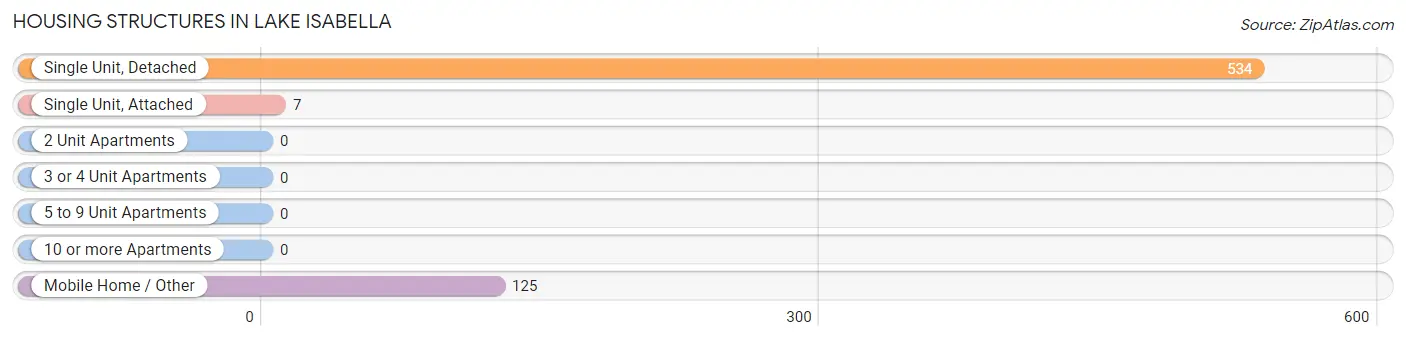
| Structure Type | # Housing Units | % Housing Units |
| Single Unit, Detached | 534 | 80.2% |
| Single Unit, Attached | 7 | 1.1% |
| 2 Unit Apartments | 0 | 0.0% |
| 3 or 4 Unit Apartments | 0 | 0.0% |
| 5 to 9 Unit Apartments | 0 | 0.0% |
| 10 or more Apartments | 0 | 0.0% |
| Mobile Home / Other | 125 | 18.8% |
| Total | 666 | 100.0% |
Housing Structures by Occupancy in Lake Isabella
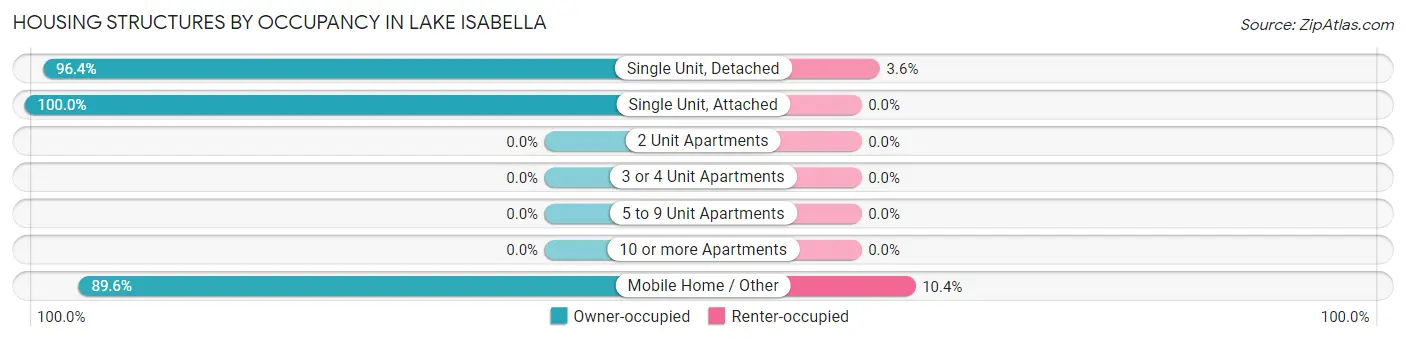
| Structure Type | Owner-occupied | Renter-occupied |
| Single Unit, Detached | 515 (96.4%) | 19 (3.6%) |
| Single Unit, Attached | 7 (100.0%) | 0 (0.0%) |
| 2 Unit Apartments | 0 (0.0%) | 0 (0.0%) |
| 3 or 4 Unit Apartments | 0 (0.0%) | 0 (0.0%) |
| 5 to 9 Unit Apartments | 0 (0.0%) | 0 (0.0%) |
| 10 or more Apartments | 0 (0.0%) | 0 (0.0%) |
| Mobile Home / Other | 112 (89.6%) | 13 (10.4%) |
| Total | 634 (95.2%) | 32 (4.8%) |
Housing Structures by Number of Rooms in Lake Isabella
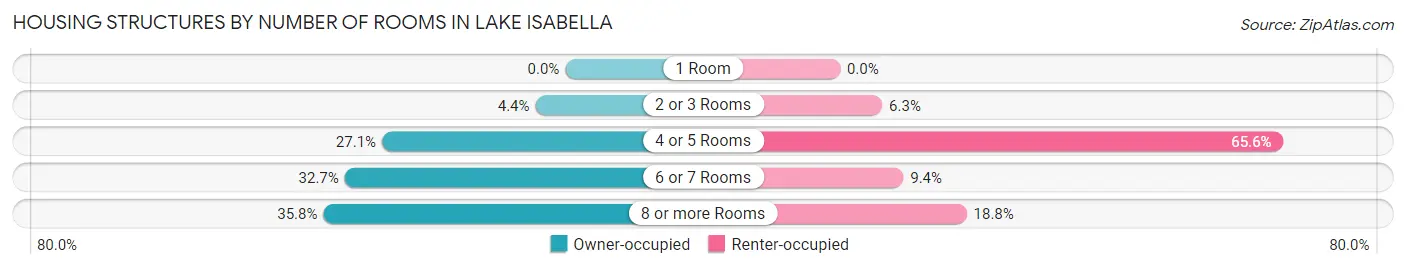
| Number of Rooms | Owner-occupied | Renter-occupied |
| 1 Room | 0 (0.0%) | 0 (0.0%) |
| 2 or 3 Rooms | 28 (4.4%) | 2 (6.2%) |
| 4 or 5 Rooms | 172 (27.1%) | 21 (65.6%) |
| 6 or 7 Rooms | 207 (32.7%) | 3 (9.4%) |
| 8 or more Rooms | 227 (35.8%) | 6 (18.8%) |
| Total | 634 (100.0%) | 32 (100.0%) |
Housing Structure by Heating Type in Lake Isabella
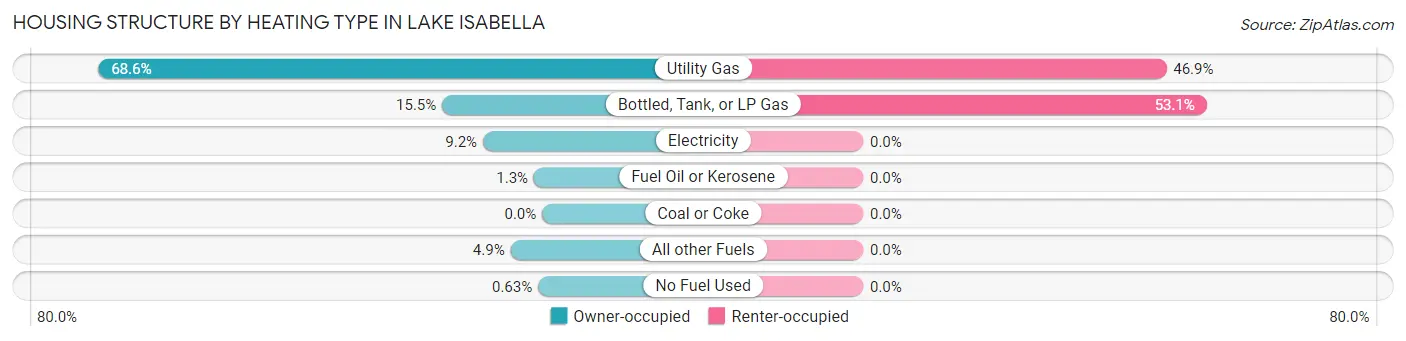
| Heating Type | Owner-occupied | Renter-occupied |
| Utility Gas | 435 (68.6%) | 15 (46.9%) |
| Bottled, Tank, or LP Gas | 98 (15.5%) | 17 (53.1%) |
| Electricity | 58 (9.1%) | 0 (0.0%) |
| Fuel Oil or Kerosene | 8 (1.3%) | 0 (0.0%) |
| Coal or Coke | 0 (0.0%) | 0 (0.0%) |
| All other Fuels | 31 (4.9%) | 0 (0.0%) |
| No Fuel Used | 4 (0.6%) | 0 (0.0%) |
| Total | 634 (100.0%) | 32 (100.0%) |
Household Vehicle Usage in Lake Isabella
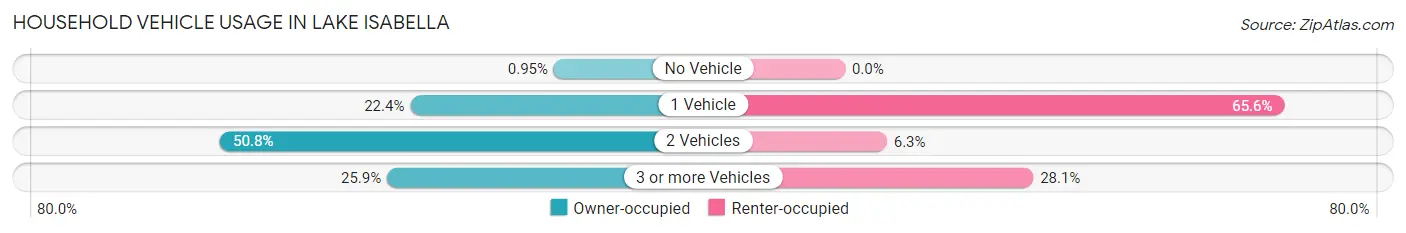
| Vehicles per Household | Owner-occupied | Renter-occupied |
| No Vehicle | 6 (0.9%) | 0 (0.0%) |
| 1 Vehicle | 142 (22.4%) | 21 (65.6%) |
| 2 Vehicles | 322 (50.8%) | 2 (6.2%) |
| 3 or more Vehicles | 164 (25.9%) | 9 (28.1%) |
| Total | 634 (100.0%) | 32 (100.0%) |
Real Estate & Mortgages in Lake Isabella
Real Estate and Mortgage Overview in Lake Isabella
| Characteristic | Without Mortgage | With Mortgage |
| Housing Units | 257 | 377 |
| Median Property Value | $172,900 | $177,000 |
| Median Household Income | $72,981 | $37 |
| Monthly Housing Costs | $454 | $7 |
| Real Estate Taxes | $2,127 | $4 |
Property Value by Mortgage Status in Lake Isabella
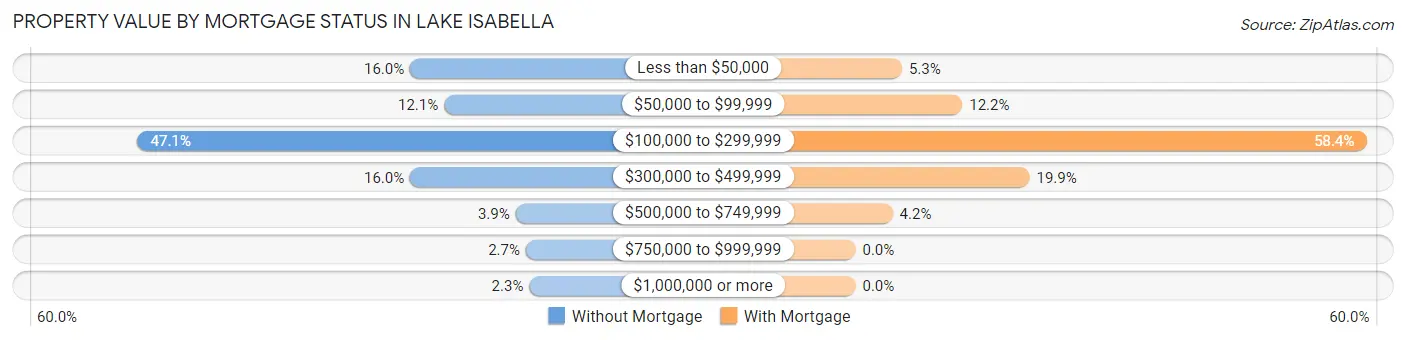
| Property Value | Without Mortgage | With Mortgage |
| Less than $50,000 | 41 (16.0%) | 20 (5.3%) |
| $50,000 to $99,999 | 31 (12.1%) | 46 (12.2%) |
| $100,000 to $299,999 | 121 (47.1%) | 220 (58.4%) |
| $300,000 to $499,999 | 41 (16.0%) | 75 (19.9%) |
| $500,000 to $749,999 | 10 (3.9%) | 16 (4.2%) |
| $750,000 to $999,999 | 7 (2.7%) | 0 (0.0%) |
| $1,000,000 or more | 6 (2.3%) | 0 (0.0%) |
| Total | 257 (100.0%) | 377 (100.0%) |
Household Income by Mortgage Status in Lake Isabella
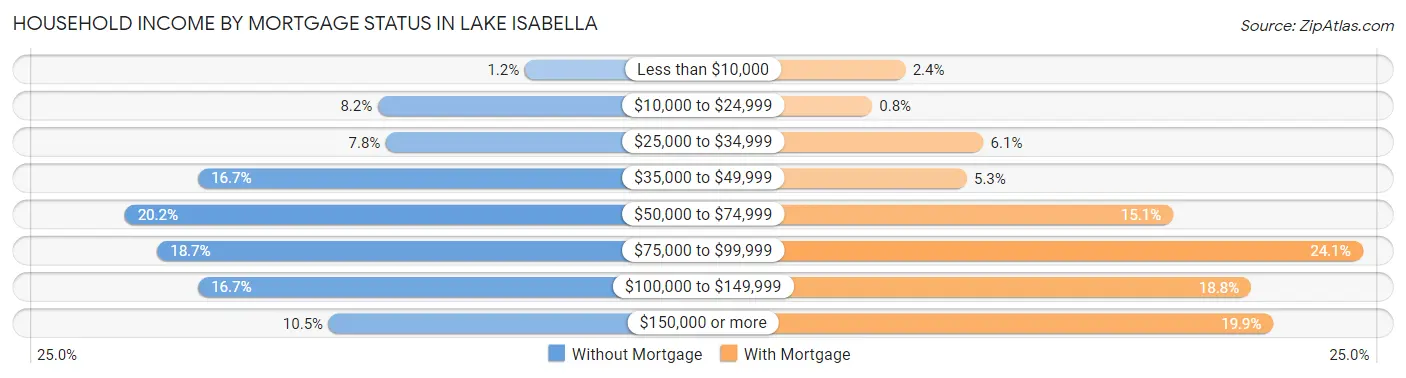
| Household Income | Without Mortgage | With Mortgage |
| Less than $10,000 | 3 (1.2%) | 9 (2.4%) |
| $10,000 to $24,999 | 21 (8.2%) | 3 (0.8%) |
| $25,000 to $34,999 | 20 (7.8%) | 23 (6.1%) |
| $35,000 to $49,999 | 43 (16.7%) | 20 (5.3%) |
| $50,000 to $74,999 | 52 (20.2%) | 57 (15.1%) |
| $75,000 to $99,999 | 48 (18.7%) | 91 (24.1%) |
| $100,000 to $149,999 | 43 (16.7%) | 71 (18.8%) |
| $150,000 or more | 27 (10.5%) | 75 (19.9%) |
| Total | 257 (100.0%) | 377 (100.0%) |
Property Value to Household Income Ratio in Lake Isabella
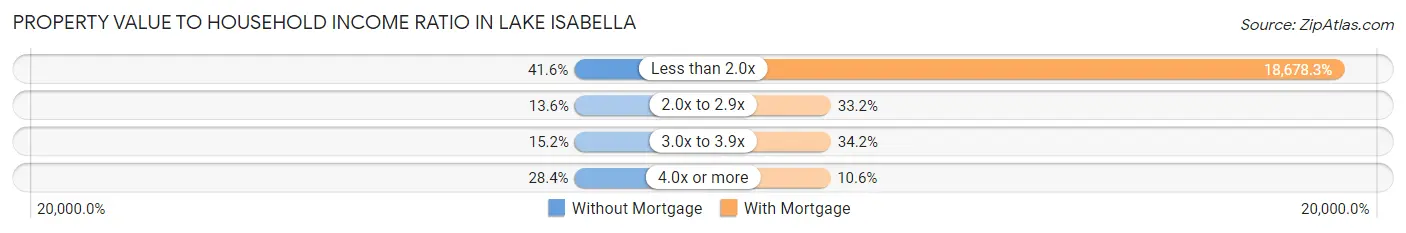
| Value-to-Income Ratio | Without Mortgage | With Mortgage |
| Less than 2.0x | 107 (41.6%) | 70,417 (18,678.2%) |
| 2.0x to 2.9x | 35 (13.6%) | 125 (33.2%) |
| 3.0x to 3.9x | 39 (15.2%) | 129 (34.2%) |
| 4.0x or more | 73 (28.4%) | 40 (10.6%) |
| Total | 257 (100.0%) | 377 (100.0%) |
Real Estate Taxes by Mortgage Status in Lake Isabella
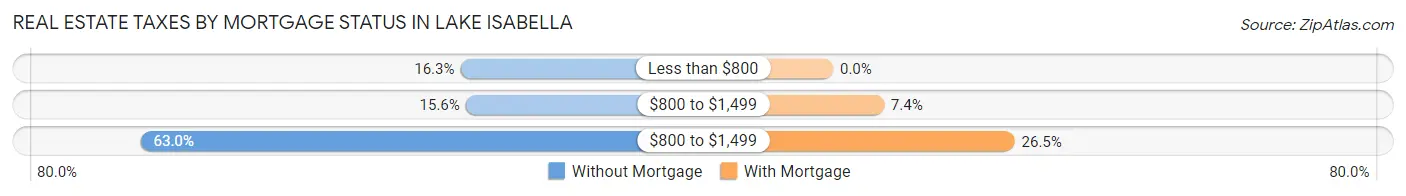
| Property Taxes | Without Mortgage | With Mortgage |
| Less than $800 | 42 (16.3%) | 0 (0.0%) |
| $800 to $1,499 | 40 (15.6%) | 28 (7.4%) |
| $800 to $1,499 | 162 (63.0%) | 100 (26.5%) |
| Total | 257 (100.0%) | 377 (100.0%) |
Health & Disability in Lake Isabella
Health Insurance Coverage by Age in Lake Isabella
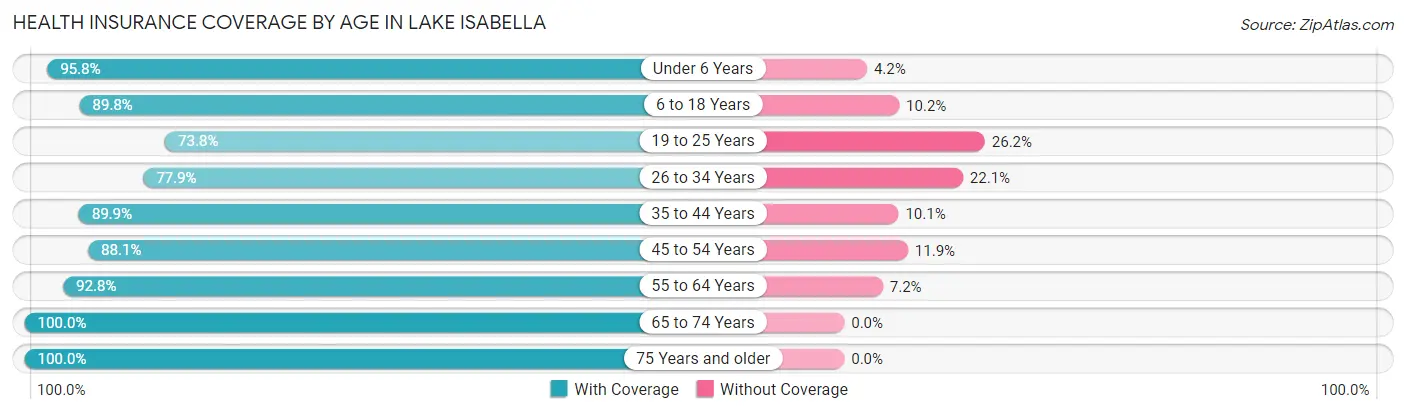
| Age Bracket | With Coverage | Without Coverage |
| Under 6 Years | 68 (95.8%) | 3 (4.2%) |
| 6 to 18 Years | 193 (89.8%) | 22 (10.2%) |
| 19 to 25 Years | 76 (73.8%) | 27 (26.2%) |
| 26 to 34 Years | 81 (77.9%) | 23 (22.1%) |
| 35 to 44 Years | 169 (89.9%) | 19 (10.1%) |
| 45 to 54 Years | 104 (88.1%) | 14 (11.9%) |
| 55 to 64 Years | 258 (92.8%) | 20 (7.2%) |
| 65 to 74 Years | 295 (100.0%) | 0 (0.0%) |
| 75 Years and older | 178 (100.0%) | 0 (0.0%) |
| Total | 1,422 (91.7%) | 128 (8.3%) |
Health Insurance Coverage by Citizenship Status in Lake Isabella
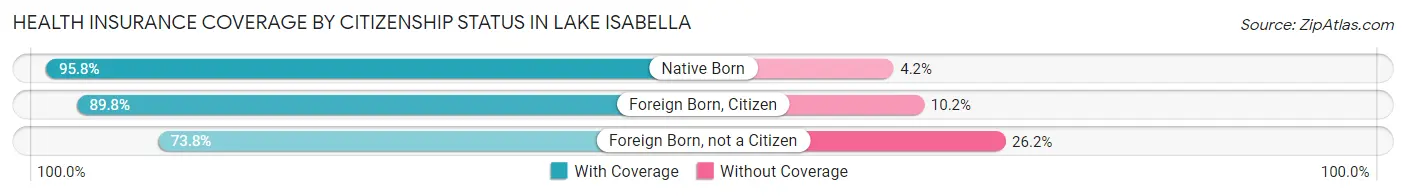
| Citizenship Status | With Coverage | Without Coverage |
| Native Born | 68 (95.8%) | 3 (4.2%) |
| Foreign Born, Citizen | 193 (89.8%) | 22 (10.2%) |
| Foreign Born, not a Citizen | 76 (73.8%) | 27 (26.2%) |
Health Insurance Coverage by Household Income in Lake Isabella
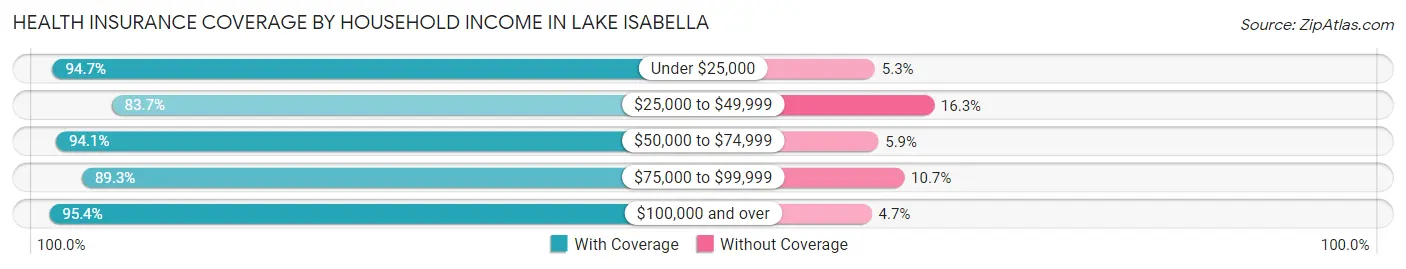
| Household Income | With Coverage | Without Coverage |
| Under $25,000 | 72 (94.7%) | 4 (5.3%) |
| $25,000 to $49,999 | 241 (83.7%) | 47 (16.3%) |
| $50,000 to $74,999 | 319 (94.1%) | 20 (5.9%) |
| $75,000 to $99,999 | 266 (89.3%) | 32 (10.7%) |
| $100,000 and over | 513 (95.4%) | 25 (4.6%) |
Public vs Private Health Insurance Coverage by Age in Lake Isabella
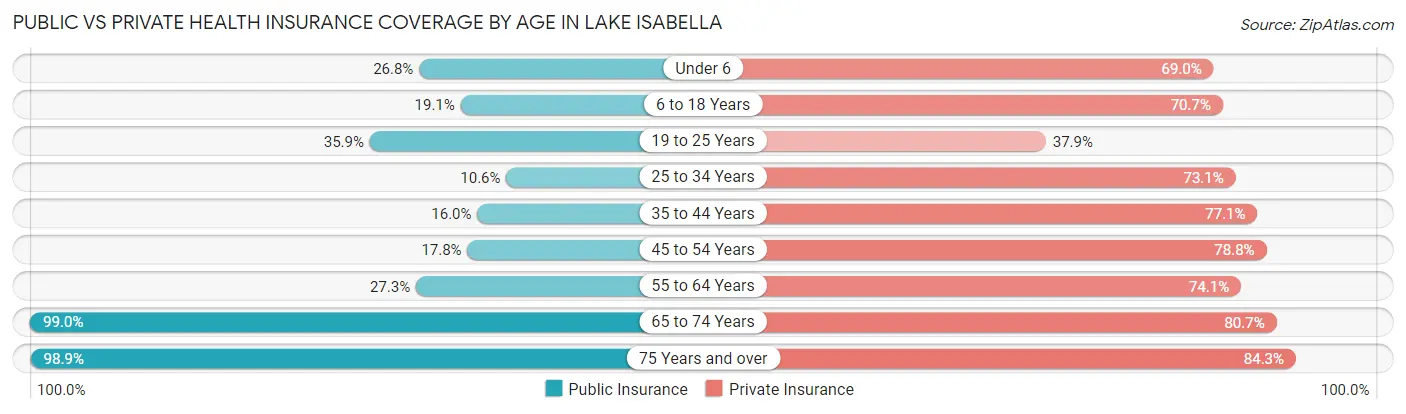
| Age Bracket | Public Insurance | Private Insurance |
| Under 6 | 19 (26.8%) | 49 (69.0%) |
| 6 to 18 Years | 41 (19.1%) | 152 (70.7%) |
| 19 to 25 Years | 37 (35.9%) | 39 (37.9%) |
| 25 to 34 Years | 11 (10.6%) | 76 (73.1%) |
| 35 to 44 Years | 30 (16.0%) | 145 (77.1%) |
| 45 to 54 Years | 21 (17.8%) | 93 (78.8%) |
| 55 to 64 Years | 76 (27.3%) | 206 (74.1%) |
| 65 to 74 Years | 292 (99.0%) | 238 (80.7%) |
| 75 Years and over | 176 (98.9%) | 150 (84.3%) |
| Total | 703 (45.4%) | 1,148 (74.1%) |
Disability Status by Sex by Age in Lake Isabella
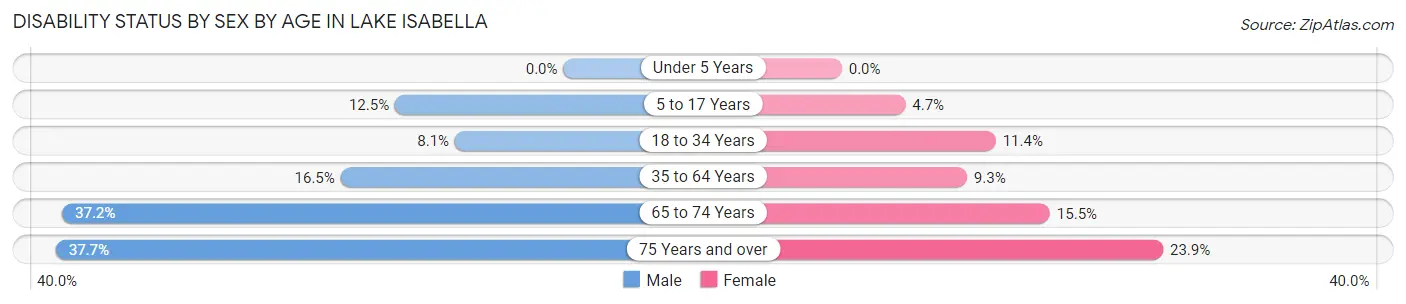
| Age Bracket | Male | Female |
| Under 5 Years | 0 (0.0%) | 0 (0.0%) |
| 5 to 17 Years | 11 (12.5%) | 6 (4.7%) |
| 18 to 34 Years | 12 (8.1%) | 8 (11.4%) |
| 35 to 64 Years | 45 (16.5%) | 29 (9.3%) |
| 65 to 74 Years | 64 (37.2%) | 19 (15.4%) |
| 75 Years and over | 26 (37.7%) | 26 (23.8%) |
Disability Class by Sex by Age in Lake Isabella
Disability Class: Hearing Difficulty
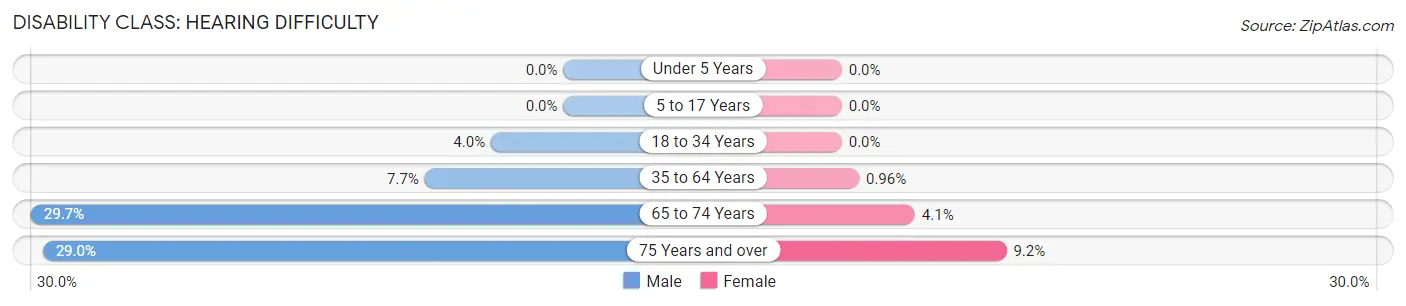
| Age Bracket | Male | Female |
| Under 5 Years | 0 (0.0%) | 0 (0.0%) |
| 5 to 17 Years | 0 (0.0%) | 0 (0.0%) |
| 18 to 34 Years | 6 (4.0%) | 0 (0.0%) |
| 35 to 64 Years | 21 (7.7%) | 3 (1.0%) |
| 65 to 74 Years | 51 (29.6%) | 5 (4.1%) |
| 75 Years and over | 20 (29.0%) | 10 (9.2%) |
Disability Class: Vision Difficulty
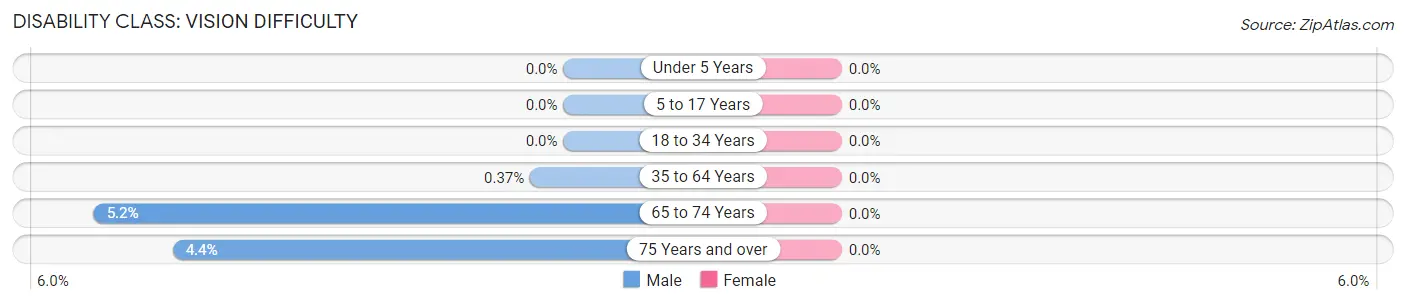
| Age Bracket | Male | Female |
| Under 5 Years | 0 (0.0%) | 0 (0.0%) |
| 5 to 17 Years | 0 (0.0%) | 0 (0.0%) |
| 18 to 34 Years | 0 (0.0%) | 0 (0.0%) |
| 35 to 64 Years | 1 (0.4%) | 0 (0.0%) |
| 65 to 74 Years | 9 (5.2%) | 0 (0.0%) |
| 75 Years and over | 3 (4.3%) | 0 (0.0%) |
Disability Class: Cognitive Difficulty

| Age Bracket | Male | Female |
| 5 to 17 Years | 11 (12.5%) | 6 (4.7%) |
| 18 to 34 Years | 6 (4.0%) | 8 (11.4%) |
| 35 to 64 Years | 31 (11.4%) | 16 (5.1%) |
| 65 to 74 Years | 26 (15.1%) | 2 (1.6%) |
| 75 Years and over | 3 (4.3%) | 0 (0.0%) |
Disability Class: Ambulatory Difficulty
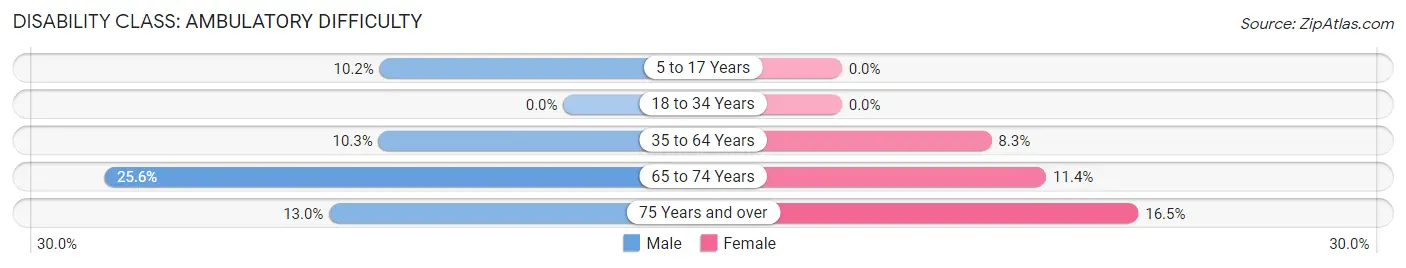
| Age Bracket | Male | Female |
| 5 to 17 Years | 9 (10.2%) | 0 (0.0%) |
| 18 to 34 Years | 0 (0.0%) | 0 (0.0%) |
| 35 to 64 Years | 28 (10.3%) | 26 (8.3%) |
| 65 to 74 Years | 44 (25.6%) | 14 (11.4%) |
| 75 Years and over | 9 (13.0%) | 18 (16.5%) |
Disability Class: Self-Care Difficulty
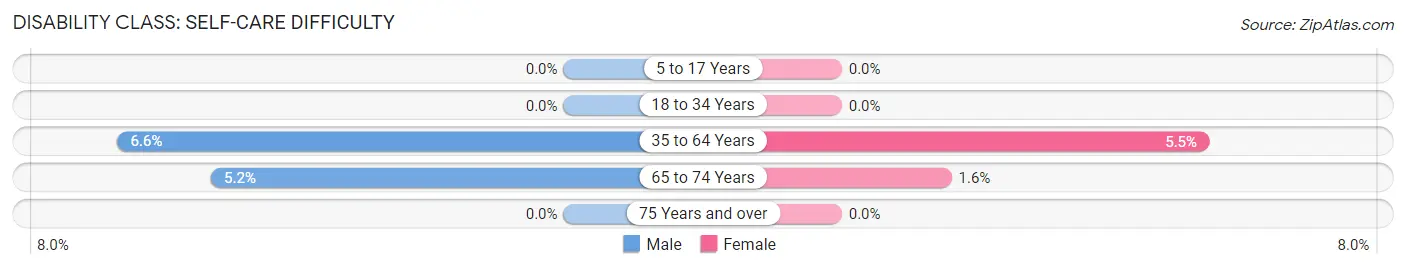
| Age Bracket | Male | Female |
| 5 to 17 Years | 0 (0.0%) | 0 (0.0%) |
| 18 to 34 Years | 0 (0.0%) | 0 (0.0%) |
| 35 to 64 Years | 18 (6.6%) | 17 (5.4%) |
| 65 to 74 Years | 9 (5.2%) | 2 (1.6%) |
| 75 Years and over | 0 (0.0%) | 0 (0.0%) |
Technology Access in Lake Isabella
Computing Device Access in Lake Isabella
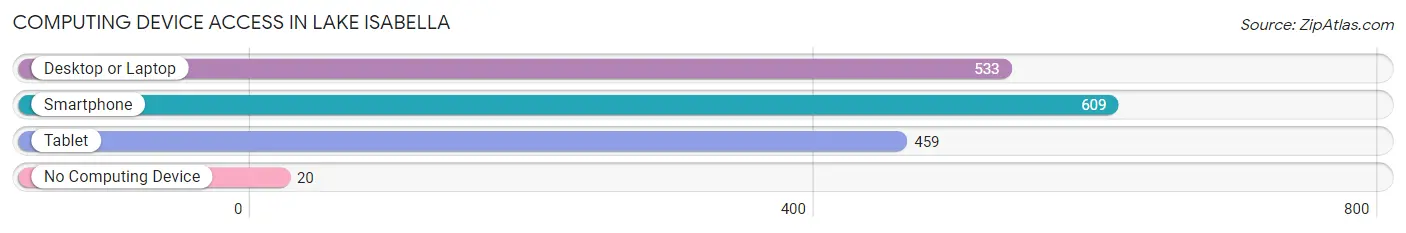
| Device Type | # Households | % Households |
| Desktop or Laptop | 533 | 80.0% |
| Smartphone | 609 | 91.4% |
| Tablet | 459 | 68.9% |
| No Computing Device | 20 | 3.0% |
| Total | 666 | 100.0% |
Internet Access in Lake Isabella
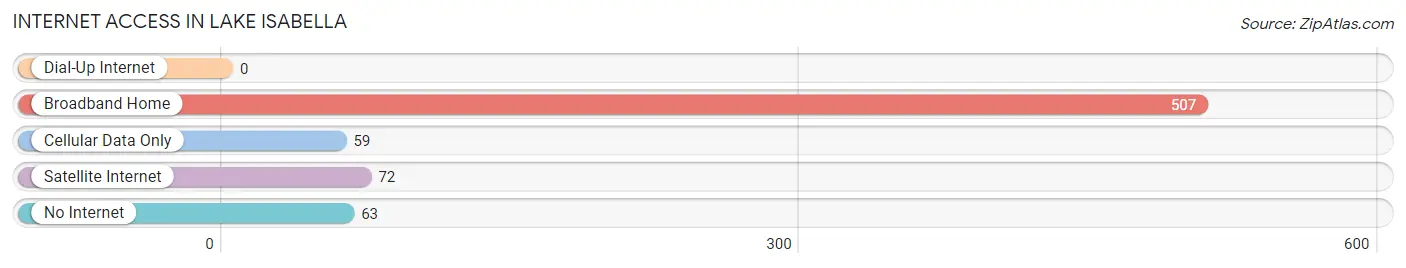
| Internet Type | # Households | % Households |
| Dial-Up Internet | 0 | 0.0% |
| Broadband Home | 507 | 76.1% |
| Cellular Data Only | 59 | 8.9% |
| Satellite Internet | 72 | 10.8% |
| No Internet | 63 | 9.5% |
| Total | 666 | 100.0% |
Lake Isabella Summary
Lake Isabella is a small unincorporated community located in Isabella County, Michigan. It is situated on the south shore of the lake of the same name, which is part of the Chippewa River watershed. The community is located approximately 10 miles east of Mount Pleasant and about 25 miles north of Midland.
History
The area around Lake Isabella was first settled in the late 1800s by lumberjacks and farmers. The lake was named after Isabella County, which was named after Queen Isabella of Spain. The first post office in the area was established in 1883.
In the early 1900s, the area around Lake Isabella became a popular tourist destination. The lake was stocked with fish, and the surrounding area was developed with resorts, cabins, and other recreational facilities. The lake was also used for boating, swimming, and fishing.
In the 1950s, the area around Lake Isabella began to experience a decline in tourism. The resorts and cabins were abandoned, and the lake became polluted due to runoff from nearby farms. In the 1970s, the lake was cleaned up and the area began to experience a resurgence in tourism.
Geography
Lake Isabella is located in Isabella County, Michigan. It is situated on the south shore of the lake of the same name, which is part of the Chippewa River watershed. The lake is approximately 2,000 acres in size and has a maximum depth of 40 feet. The lake is surrounded by rolling hills and is home to a variety of wildlife, including deer, turkey, and waterfowl.
The area around Lake Isabella is mostly rural, with small towns and villages scattered throughout the area. The nearest major city is Mount Pleasant, which is located approximately 10 miles to the west.
Economy
The economy of Lake Isabella is largely based on tourism. The lake is a popular destination for fishing, boating, and swimming. There are several resorts and cabins located around the lake, as well as a variety of restaurants and other businesses catering to tourists.
The area is also home to several small farms, which produce a variety of crops, including corn, soybeans, and wheat. There are also several small manufacturing businesses located in the area, which produce a variety of products, including furniture and automotive parts.
Demographics
As of the 2010 census, the population of Lake Isabella was 1,845. The racial makeup of the town was 97.3% White, 0.7% African American, 0.3% Native American, 0.2% Asian, and 1.5% from other races. The median household income was $37,917, and the median family income was $45,938.
The town is served by the Isabella County School District, which includes two elementary schools, one middle school, and one high school. The town is also home to a branch of the Isabella County Library.
Conclusion
Lake Isabella is a small unincorporated community located in Isabella County, Michigan. It is situated on the south shore of the lake of the same name, which is part of the Chippewa River watershed. The area was first settled in the late 1800s and has since become a popular tourist destination. The economy of the town is largely based on tourism, with several resorts and cabins located around the lake. As of the 2010 census, the population of Lake Isabella was 1,845. The town is served by the Isabella County School District and is home to a branch of the Isabella County Library.
Common Questions
What is Per Capita Income in Lake Isabella?
Per Capita income in Lake Isabella is $36,887.
What is the Median Family Income in Lake Isabella?
Median Family Income in Lake Isabella is $81,429.
What is the Median Household income in Lake Isabella?
Median Household Income in Lake Isabella is $69,468.
What is Income or Wage Gap in Lake Isabella?
Income or Wage Gap in Lake Isabella is 25.9%.
Women in Lake Isabella earn 74.1 cents for every dollar earned by a man.
What is Inequality or Gini Index in Lake Isabella?
Inequality or Gini Index in Lake Isabella is 0.36.
What is the Total Population of Lake Isabella?
Total Population of Lake Isabella is 1,550.
What is the Total Male Population of Lake Isabella?
Total Male Population of Lake Isabella is 771.
What is the Total Female Population of Lake Isabella?
Total Female Population of Lake Isabella is 779.
What is the Ratio of Males per 100 Females in Lake Isabella?
There are 98.97 Males per 100 Females in Lake Isabella.
What is the Ratio of Females per 100 Males in Lake Isabella?
There are 101.04 Females per 100 Males in Lake Isabella.
What is the Median Population Age in Lake Isabella?
Median Population Age in Lake Isabella is 53.5 Years.
What is the Average Family Size in Lake Isabella
Average Family Size in Lake Isabella is 2.7 People.
What is the Average Household Size in Lake Isabella
Average Household Size in Lake Isabella is 2.3 People.
How Large is the Labor Force in Lake Isabella?
There are 637 People in the Labor Forcein in Lake Isabella.
What is the Percentage of People in the Labor Force in Lake Isabella?
48.5% of People are in the Labor Force in Lake Isabella.
What is the Unemployment Rate in Lake Isabella?
Unemployment Rate in Lake Isabella is 2.4%.