Zip Codes with the Highest Percentage of Population Employed in Real Estate, Rental & Leasing in Glen Burnie, MD
RELATED REPORTS & OPTIONS
Real Estate, Rental & Leasing
Glen Burnie
Compare Zip Codes
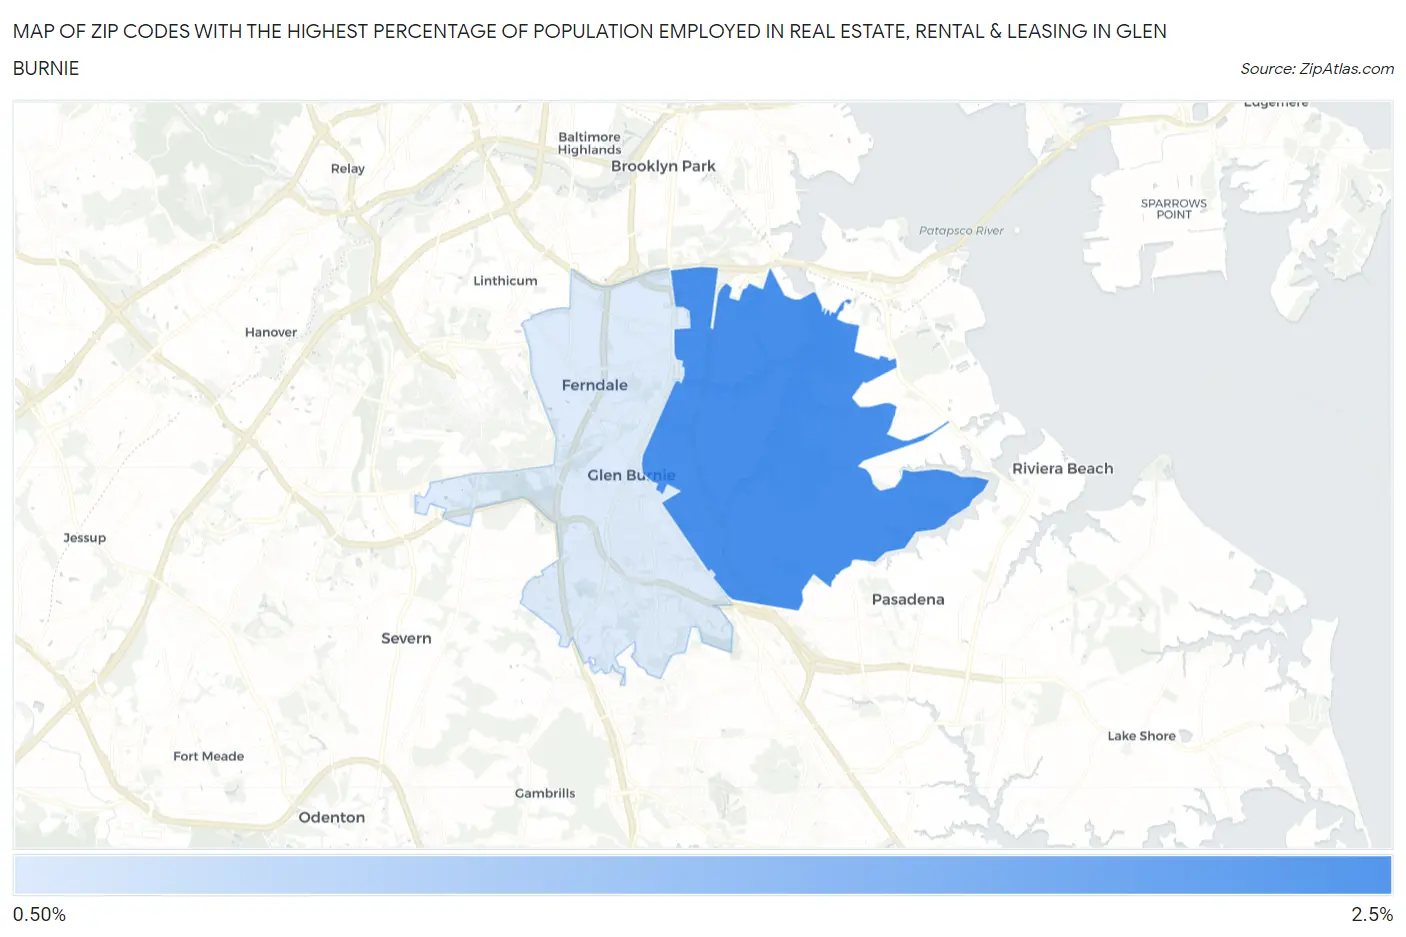
Map of Zip Codes with the Highest Percentage of Population Employed in Real Estate, Rental & Leasing in Glen Burnie
1.1%
2.5%
Zip Codes with the Highest Percentage of Population Employed in Real Estate, Rental & Leasing in Glen Burnie, MD
| Zip Code | % Employed | vs State | vs National | |
| 1. | 21060 | 2.5% | 2.1%(+0.366)#134 | 1.9%(+0.564)#5,648 |
| 2. | 21061 | 1.1% | 2.1%(-0.970)#283 | 1.9%(-0.772)#14,118 |
1
Common Questions
What are the Top Zip Codes with the Highest Percentage of Population Employed in Real Estate, Rental & Leasing in Glen Burnie, MD?
Top Zip Codes with the Highest Percentage of Population Employed in Real Estate, Rental & Leasing in Glen Burnie, MD are:
What zip code has the Highest Percentage of Population Employed in Real Estate, Rental & Leasing in Glen Burnie, MD?
21060 has the Highest Percentage of Population Employed in Real Estate, Rental & Leasing in Glen Burnie, MD with 2.5%.
What is the Percentage of Population Employed in Real Estate, Rental & Leasing in Glen Burnie, MD?
Percentage of Population Employed in Real Estate, Rental & Leasing in Glen Burnie is 1.7%.
What is the Percentage of Population Employed in Real Estate, Rental & Leasing in Maryland?
Percentage of Population Employed in Real Estate, Rental & Leasing in Maryland is 2.1%.
What is the Percentage of Population Employed in Real Estate, Rental & Leasing in the United States?
Percentage of Population Employed in Real Estate, Rental & Leasing in the United States is 1.9%.