Severna Park, MD Map & Demographics
Severna Park Map
Severna Park Overview
$71,112
PER CAPITA INCOME
$196,362
AVG FAMILY INCOME
$164,288
AVG HOUSEHOLD INCOME
40.5%
WAGE / INCOME GAP [ % ]
59.5¢/ $1
WAGE / INCOME GAP [ $ ]
0.42
INEQUALITY / GINI INDEX
40,452
TOTAL POPULATION
20,311
MALE POPULATION
20,141
FEMALE POPULATION
100.84
MALES / 100 FEMALES
99.16
FEMALES / 100 MALES
41.5
MEDIAN AGE
3.3
AVG FAMILY SIZE
2.9
AVG HOUSEHOLD SIZE
20,947
LABOR FORCE [ PEOPLE ]
67.6%
PERCENT IN LABOR FORCE
2.9%
UNEMPLOYMENT RATE
Severna Park Zip Codes
Income in Severna Park
Income Overview in Severna Park
Per Capita Income in Severna Park is $71,112, while median incomes of families and households are $196,362 and $164,288 respectively.
| Characteristic | Number | Measure |
| Per Capita Income | 40,452 | $71,112 |
| Median Family Income | 10,766 | $196,362 |
| Mean Family Income | 10,766 | $235,716 |
| Median Household Income | 13,792 | $164,288 |
| Mean Household Income | 13,792 | $207,294 |
| Income Deficit | 10,766 | $0 |
| Wage / Income Gap (%) | 40,452 | 40.49% |
| Wage / Income Gap ($) | 40,452 | 59.51¢ per $1 |
| Gini / Inequality Index | 40,452 | 0.42 |
Earnings by Sex in Severna Park
Average Earnings in Severna Park are $80,247, $100,086 for men and $59,566 for women, a difference of 40.5%.
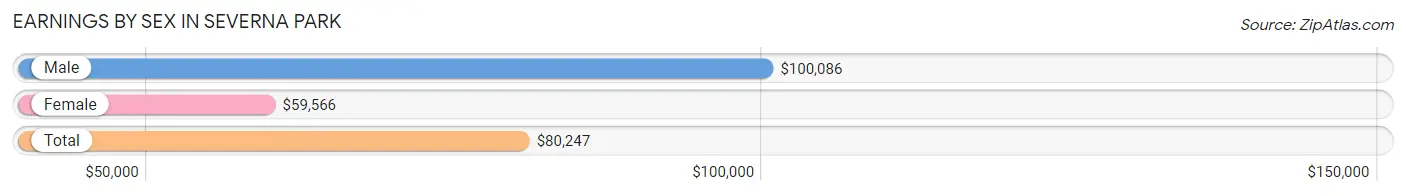
| Sex | Number | Average Earnings |
| Male | 12,091 (55.1%) | $100,086 |
| Female | 9,867 (44.9%) | $59,566 |
| Total | 21,958 (100.0%) | $80,247 |
Earnings by Sex by Income Bracket in Severna Park
The most common earnings brackets in Severna Park are $100,000+ for men (6,049 | 50.0%) and $100,000+ for women (2,815 | 28.5%).
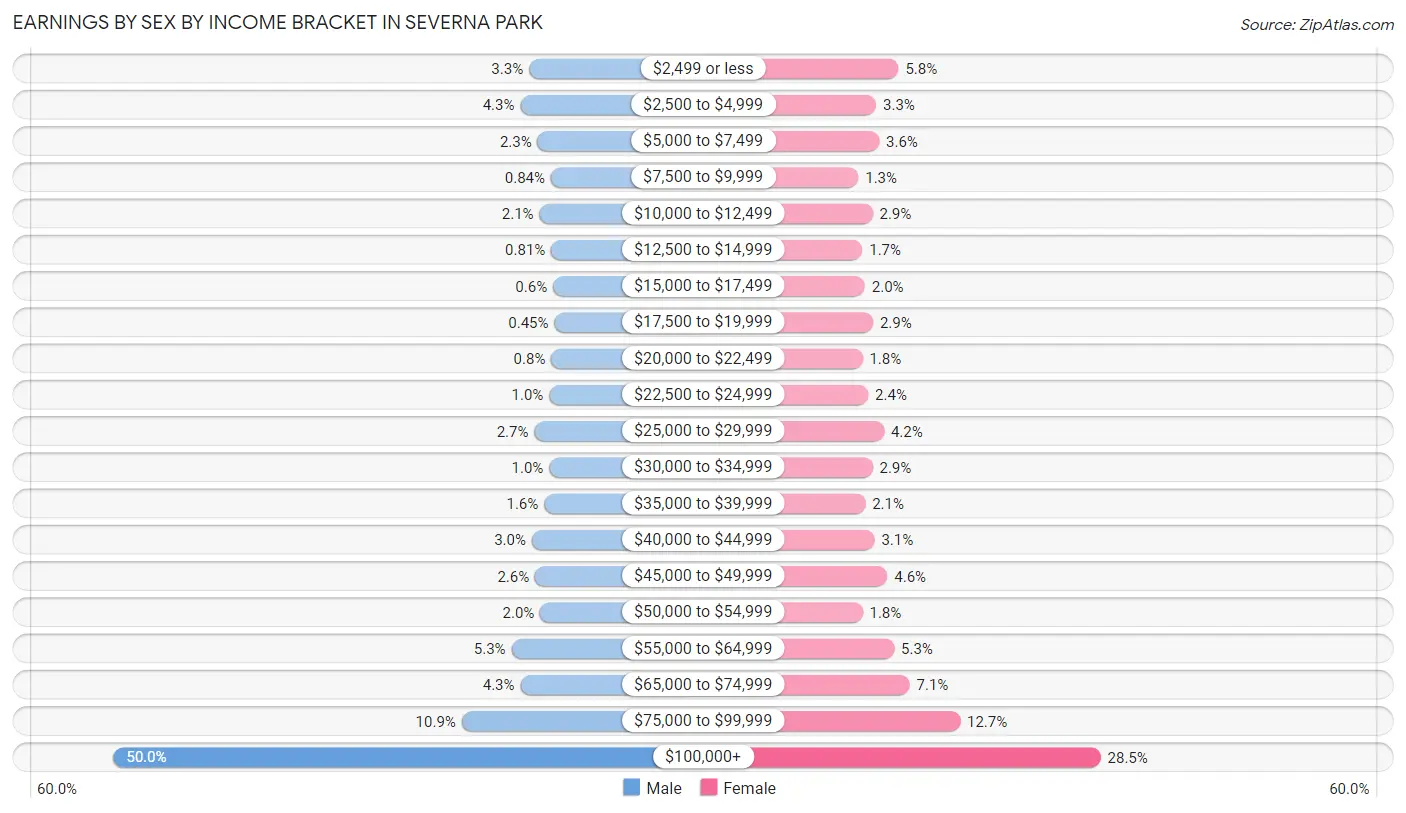
| Income | Male | Female |
| $2,499 or less | 399 (3.3%) | 573 (5.8%) |
| $2,500 to $4,999 | 517 (4.3%) | 325 (3.3%) |
| $5,000 to $7,499 | 283 (2.3%) | 358 (3.6%) |
| $7,500 to $9,999 | 102 (0.8%) | 127 (1.3%) |
| $10,000 to $12,499 | 257 (2.1%) | 285 (2.9%) |
| $12,500 to $14,999 | 98 (0.8%) | 172 (1.7%) |
| $15,000 to $17,499 | 73 (0.6%) | 200 (2.0%) |
| $17,500 to $19,999 | 55 (0.4%) | 290 (2.9%) |
| $20,000 to $22,499 | 97 (0.8%) | 174 (1.8%) |
| $22,500 to $24,999 | 125 (1.0%) | 237 (2.4%) |
| $25,000 to $29,999 | 327 (2.7%) | 412 (4.2%) |
| $30,000 to $34,999 | 124 (1.0%) | 285 (2.9%) |
| $35,000 to $39,999 | 194 (1.6%) | 204 (2.1%) |
| $40,000 to $44,999 | 360 (3.0%) | 307 (3.1%) |
| $45,000 to $49,999 | 317 (2.6%) | 450 (4.6%) |
| $50,000 to $54,999 | 247 (2.0%) | 175 (1.8%) |
| $55,000 to $64,999 | 637 (5.3%) | 525 (5.3%) |
| $65,000 to $74,999 | 516 (4.3%) | 697 (7.1%) |
| $75,000 to $99,999 | 1,314 (10.9%) | 1,256 (12.7%) |
| $100,000+ | 6,049 (50.0%) | 2,815 (28.5%) |
| Total | 12,091 (100.0%) | 9,867 (100.0%) |
Earnings by Sex by Educational Attainment in Severna Park
Average earnings in Severna Park are $113,577 for men and $73,218 for women, a difference of 35.5%. Men with an educational attainment of graduate degree enjoy the highest average annual earnings of $148,171, while those with less than high school education earn the least with $49,922. Women with an educational attainment of graduate degree earn the most with the average annual earnings of $96,667, while those with high school diploma education have the smallest earnings of $54,091.
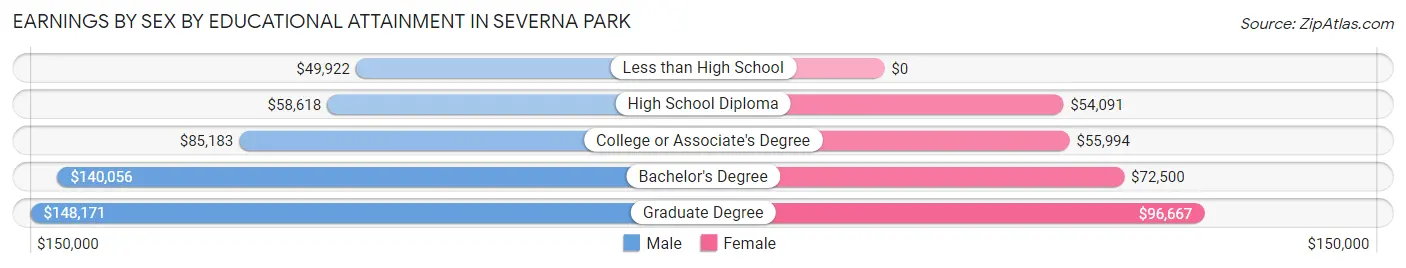
| Educational Attainment | Male Income | Female Income |
| Less than High School | $49,922 | $0 |
| High School Diploma | $58,618 | $54,091 |
| College or Associate's Degree | $85,183 | $55,994 |
| Bachelor's Degree | $140,056 | $72,500 |
| Graduate Degree | $148,171 | $96,667 |
| Total | $113,577 | $73,218 |
Family Income in Severna Park
Family Income Brackets in Severna Park
According to the Severna Park family income data, there are 5,211 families falling into the $200,000+ income range, which is the most common income bracket and makes up 48.4% of all families. Conversely, the less than $10,000 income bracket is the least frequent group with only 54 families (0.5%) belonging to this category.
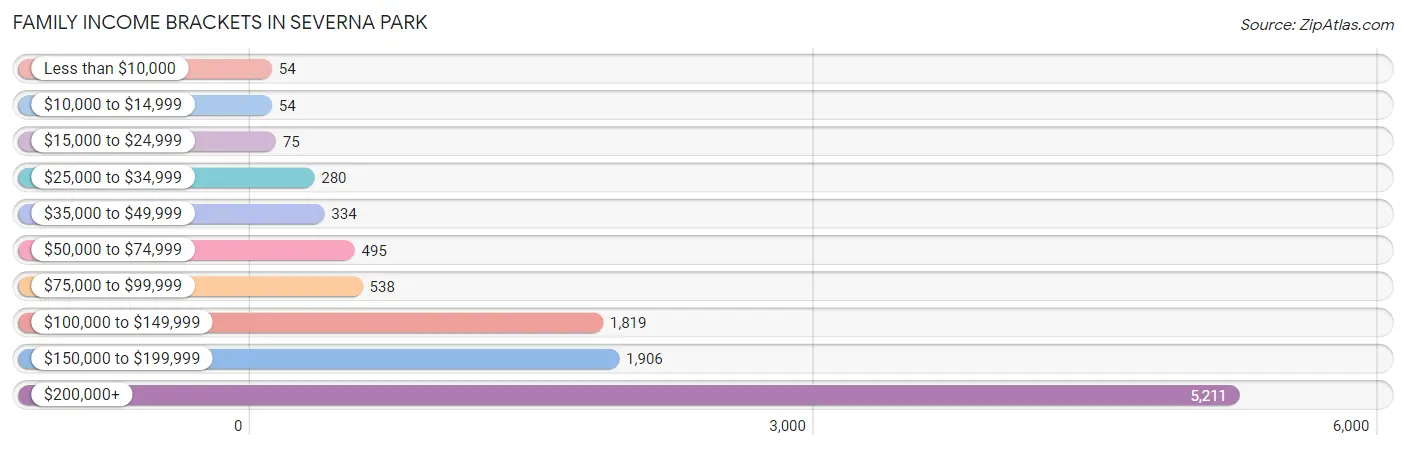
| Income Bracket | # Families | % Families |
| Less than $10,000 | 54 | 0.5% |
| $10,000 to $14,999 | 54 | 0.5% |
| $15,000 to $24,999 | 75 | 0.7% |
| $25,000 to $34,999 | 280 | 2.6% |
| $35,000 to $49,999 | 334 | 3.1% |
| $50,000 to $74,999 | 495 | 4.6% |
| $75,000 to $99,999 | 538 | 5.0% |
| $100,000 to $149,999 | 1,819 | 16.9% |
| $150,000 to $199,999 | 1,906 | 17.7% |
| $200,000+ | 5,211 | 48.4% |
Family Income by Famaliy Size in Severna Park
7+ person families (71 | 0.7%) account for the highest median family income in Severna Park with $250,001 per family, while 2-person families (3,664 | 34.0%) have the highest median income of $70,375 per family member.
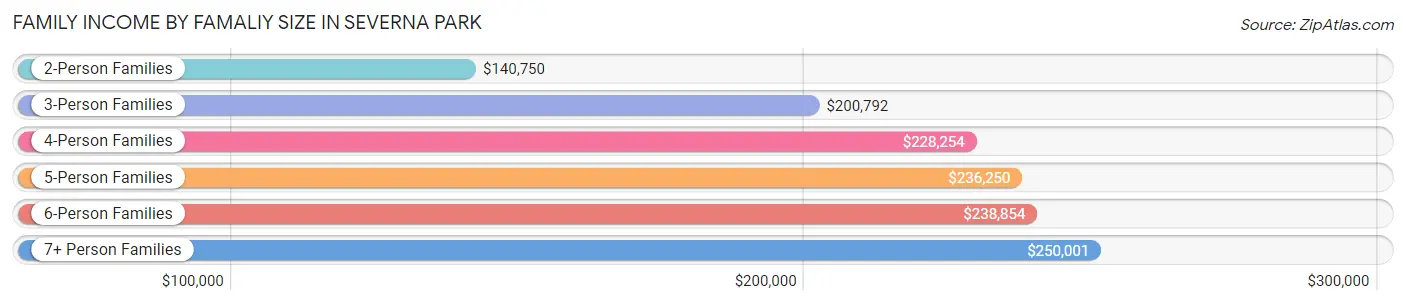
| Income Bracket | # Families | Median Income |
| 2-Person Families | 3,664 (34.0%) | $140,750 |
| 3-Person Families | 2,536 (23.6%) | $200,792 |
| 4-Person Families | 3,039 (28.2%) | $228,254 |
| 5-Person Families | 1,176 (10.9%) | $236,250 |
| 6-Person Families | 280 (2.6%) | $238,854 |
| 7+ Person Families | 71 (0.7%) | $250,001 |
| Total | 10,766 (100.0%) | $196,362 |
Family Income by Number of Earners in Severna Park
The median family income in Severna Park is $196,362, with families comprising 3+ earners (2,047) having the highest median family income of $242,972, while families with no earners (948) have the lowest median family income of $98,981, accounting for 19.0% and 8.8% of families, respectively.
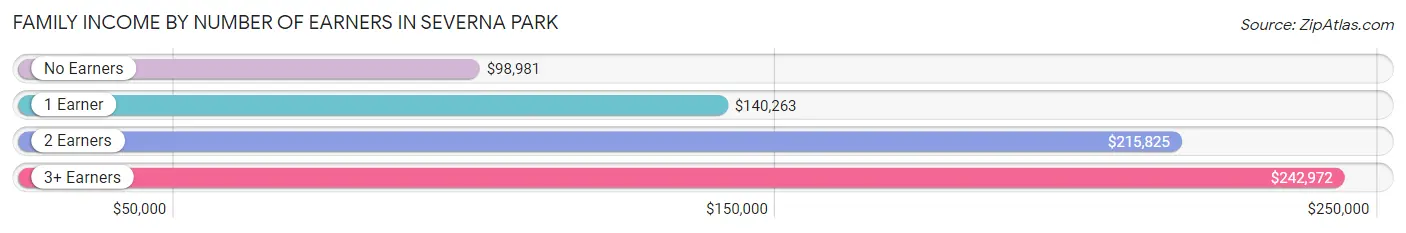
| Number of Earners | # Families | Median Income |
| No Earners | 948 (8.8%) | $98,981 |
| 1 Earner | 2,762 (25.7%) | $140,263 |
| 2 Earners | 5,009 (46.5%) | $215,825 |
| 3+ Earners | 2,047 (19.0%) | $242,972 |
| Total | 10,766 (100.0%) | $196,362 |
Household Income in Severna Park
Household Income Brackets in Severna Park
With 5,517 households falling in the category, the $200,000+ income range is the most frequent in Severna Park, accounting for 40.0% of all households. In contrast, only 97 households (0.7%) fall into the $10,000 to $14,999 income bracket, making it the least populous group.
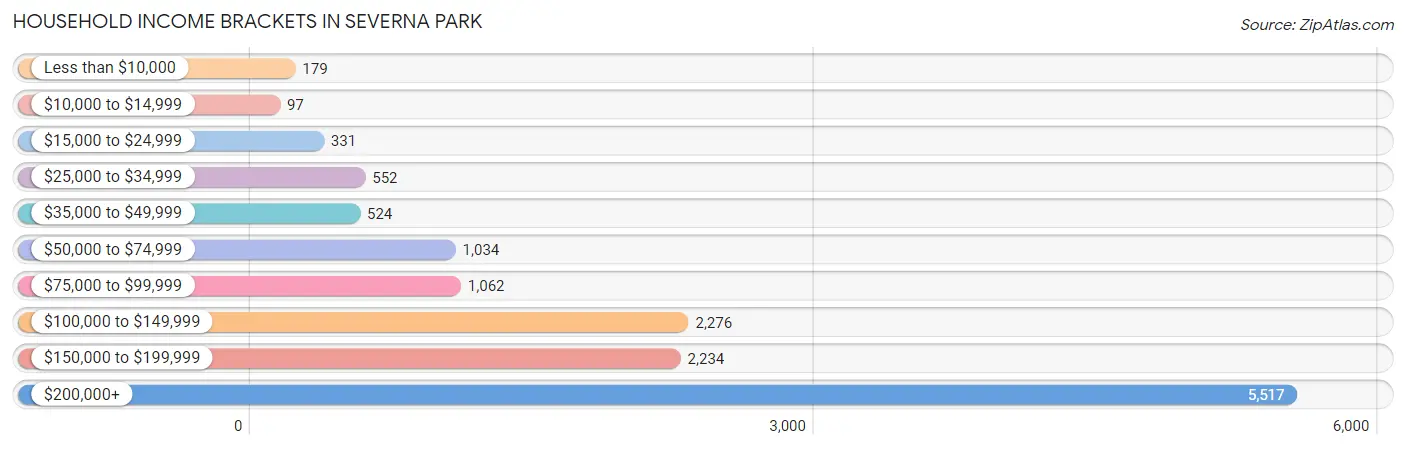
| Income Bracket | # Households | % Households |
| Less than $10,000 | 179 | 1.3% |
| $10,000 to $14,999 | 97 | 0.7% |
| $15,000 to $24,999 | 331 | 2.4% |
| $25,000 to $34,999 | 552 | 4.0% |
| $35,000 to $49,999 | 524 | 3.8% |
| $50,000 to $74,999 | 1,034 | 7.5% |
| $75,000 to $99,999 | 1,062 | 7.7% |
| $100,000 to $149,999 | 2,276 | 16.5% |
| $150,000 to $199,999 | 2,234 | 16.2% |
| $200,000+ | 5,517 | 40.0% |
Household Income by Householder Age in Severna Park
The median household income in Severna Park is $164,288, with the highest median household income of $215,092 found in the 45 to 64 years age bracket for the primary householder. A total of 5,755 households (41.7%) fall into this category. Meanwhile, the 15 to 24 years age bracket for the primary householder has the lowest median household income of $0, with 40 households (0.3%) in this group.
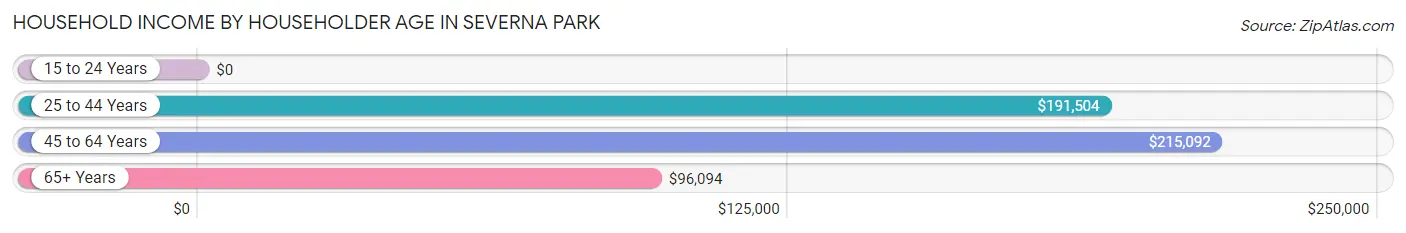
| Income Bracket | # Households | Median Income |
| 15 to 24 Years | 40 (0.3%) | $0 |
| 25 to 44 Years | 3,891 (28.2%) | $191,504 |
| 45 to 64 Years | 5,755 (41.7%) | $215,092 |
| 65+ Years | 4,106 (29.8%) | $96,094 |
| Total | 13,792 (100.0%) | $164,288 |
Poverty in Severna Park
Income Below Poverty by Sex and Age in Severna Park
With 2.2% poverty level for males and 3.6% for females among the residents of Severna Park, 45 to 54 year old males and 25 to 34 year old females are the most vulnerable to poverty, with 127 males (5.0%) and 191 females (12.0%) in their respective age groups living below the poverty level.
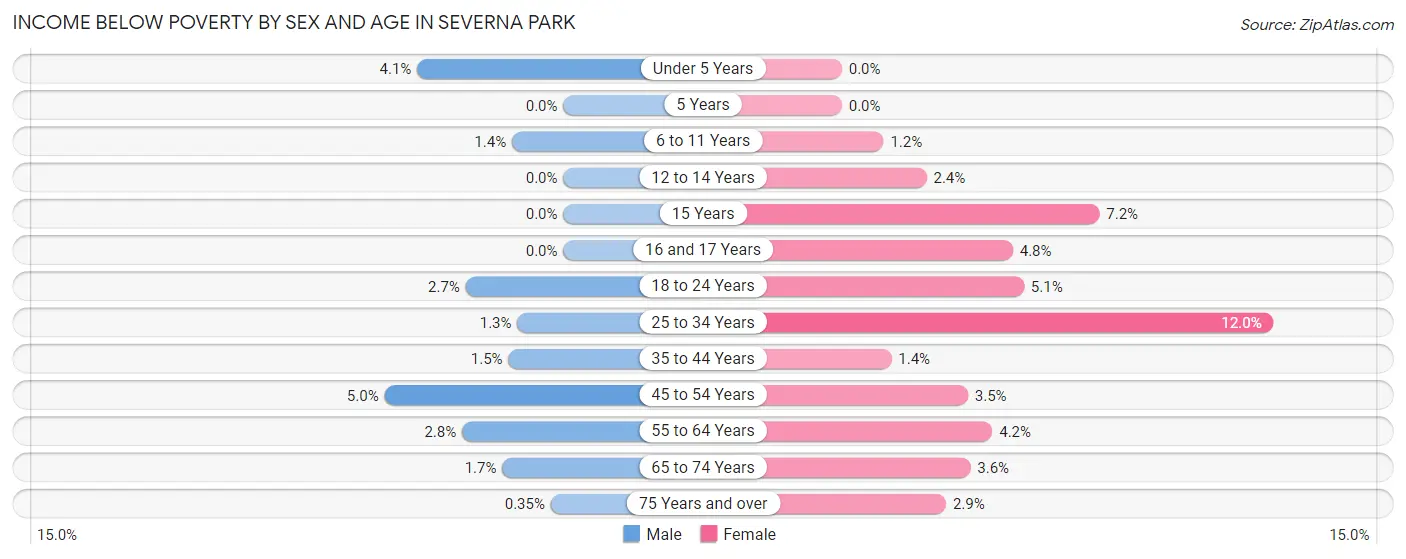
| Age Bracket | Male | Female |
| Under 5 Years | 62 (4.1%) | 0 (0.0%) |
| 5 Years | 0 (0.0%) | 0 (0.0%) |
| 6 to 11 Years | 25 (1.4%) | 23 (1.2%) |
| 12 to 14 Years | 0 (0.0%) | 19 (2.4%) |
| 15 Years | 0 (0.0%) | 16 (7.2%) |
| 16 and 17 Years | 0 (0.0%) | 32 (4.8%) |
| 18 to 24 Years | 38 (2.7%) | 61 (5.1%) |
| 25 to 34 Years | 23 (1.3%) | 191 (12.0%) |
| 35 to 44 Years | 45 (1.5%) | 35 (1.4%) |
| 45 to 54 Years | 127 (5.0%) | 98 (3.5%) |
| 55 to 64 Years | 91 (2.8%) | 128 (4.2%) |
| 65 to 74 Years | 28 (1.7%) | 71 (3.6%) |
| 75 Years and over | 4 (0.4%) | 48 (2.9%) |
| Total | 443 (2.2%) | 722 (3.6%) |
Income Above Poverty by Sex and Age in Severna Park
According to the poverty statistics in Severna Park, males aged 5 years and females aged under 5 years are the age groups that are most secure financially, with 100.0% of males and 100.0% of females in these age groups living above the poverty line.
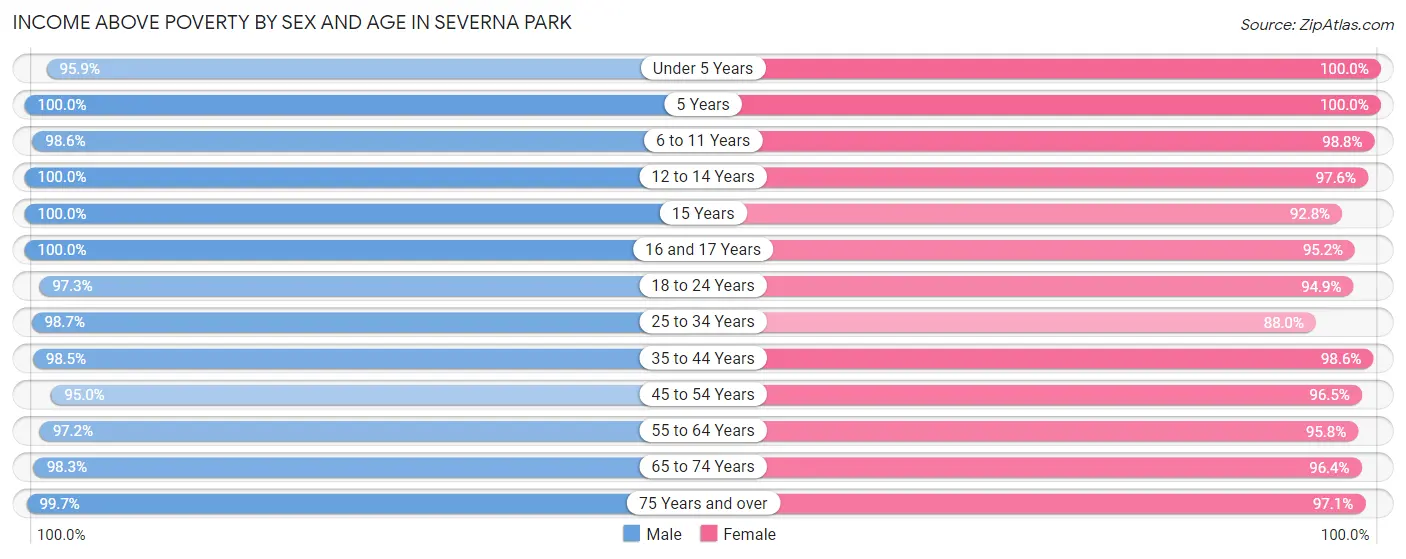
| Age Bracket | Male | Female |
| Under 5 Years | 1,460 (95.9%) | 1,250 (100.0%) |
| 5 Years | 150 (100.0%) | 198 (100.0%) |
| 6 to 11 Years | 1,718 (98.6%) | 1,968 (98.8%) |
| 12 to 14 Years | 1,134 (100.0%) | 786 (97.6%) |
| 15 Years | 395 (100.0%) | 207 (92.8%) |
| 16 and 17 Years | 606 (100.0%) | 640 (95.2%) |
| 18 to 24 Years | 1,359 (97.3%) | 1,143 (94.9%) |
| 25 to 34 Years | 1,774 (98.7%) | 1,398 (88.0%) |
| 35 to 44 Years | 2,898 (98.5%) | 2,493 (98.6%) |
| 45 to 54 Years | 2,425 (95.0%) | 2,691 (96.5%) |
| 55 to 64 Years | 3,132 (97.2%) | 2,930 (95.8%) |
| 65 to 74 Years | 1,616 (98.3%) | 1,915 (96.4%) |
| 75 Years and over | 1,144 (99.7%) | 1,609 (97.1%) |
| Total | 19,811 (97.8%) | 19,228 (96.4%) |
Income Below Poverty Among Married-Couple Families in Severna Park
The poverty statistics for married-couple families in Severna Park show that 1.0% or 98 of the total 9,473 families live below the poverty line. Families with 1 or 2 children have the highest poverty rate of 2.1%, comprising of 80 families. On the other hand, families with 3 or 4 children have the lowest poverty rate of 0.0%, which includes 0 families.
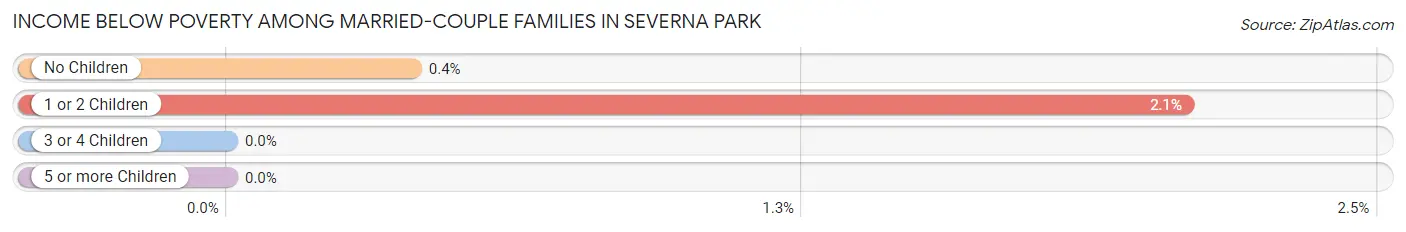
| Children | Above Poverty | Below Poverty |
| No Children | 4,493 (99.6%) | 18 (0.4%) |
| 1 or 2 Children | 3,772 (97.9%) | 80 (2.1%) |
| 3 or 4 Children | 1,059 (100.0%) | 0 (0.0%) |
| 5 or more Children | 51 (100.0%) | 0 (0.0%) |
| Total | 9,375 (99.0%) | 98 (1.0%) |
Income Below Poverty Among Single-Parent Households in Severna Park
According to the poverty data in Severna Park, 4.2% or 17 single-father households and 5.5% or 49 single-mother households are living below the poverty line. Among single-father households, those with 3 or 4 children have the highest poverty rate, with 17 households (100.0%) experiencing poverty. Likewise, among single-mother households, those with 1 or 2 children have the highest poverty rate, with 28 households (10.8%) falling below the poverty line.
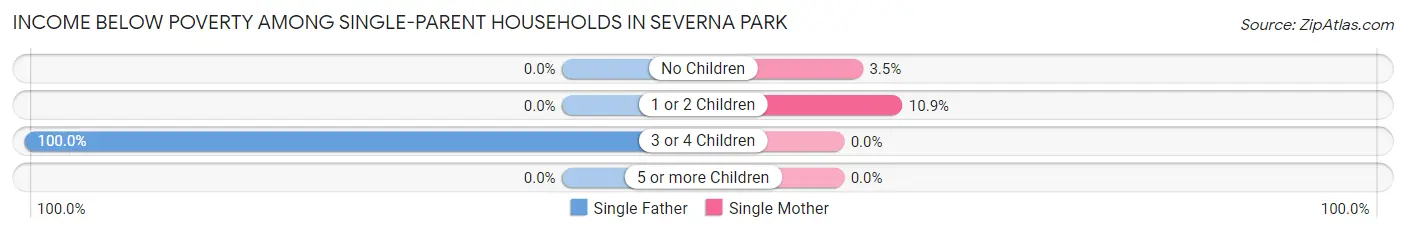
| Children | Single Father | Single Mother |
| No Children | 0 (0.0%) | 21 (3.5%) |
| 1 or 2 Children | 0 (0.0%) | 28 (10.8%) |
| 3 or 4 Children | 17 (100.0%) | 0 (0.0%) |
| 5 or more Children | 0 (0.0%) | 0 (0.0%) |
| Total | 17 (4.2%) | 49 (5.5%) |
Income Below Poverty Among Married-Couple vs Single-Parent Households in Severna Park
The poverty data for Severna Park shows that 98 of the married-couple family households (1.0%) and 66 of the single-parent households (5.1%) are living below the poverty level. Within the married-couple family households, those with 1 or 2 children have the highest poverty rate, with 80 households (2.1%) falling below the poverty line. Among the single-parent households, those with 3 or 4 children have the highest poverty rate, with 17 household (35.4%) living below poverty.
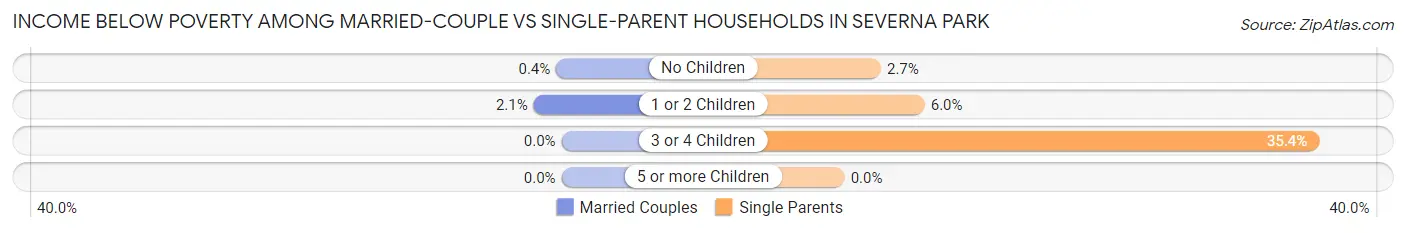
| Children | Married-Couple Families | Single-Parent Households |
| No Children | 18 (0.4%) | 21 (2.7%) |
| 1 or 2 Children | 80 (2.1%) | 28 (6.0%) |
| 3 or 4 Children | 0 (0.0%) | 17 (35.4%) |
| 5 or more Children | 0 (0.0%) | 0 (0.0%) |
| Total | 98 (1.0%) | 66 (5.1%) |
Race in Severna Park
The most populous races in Severna Park are White / Caucasian (35,415 | 87.5%), Two or more Races (2,143 | 5.3%), and Black / African American (1,340 | 3.3%).
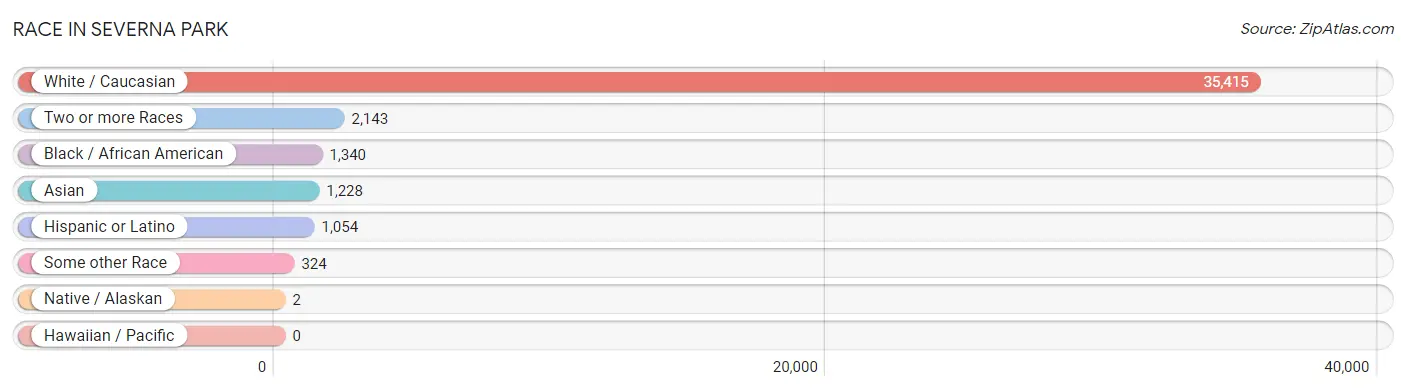
| Race | # Population | % Population |
| Asian | 1,228 | 3.0% |
| Black / African American | 1,340 | 3.3% |
| Hawaiian / Pacific | 0 | 0.0% |
| Hispanic or Latino | 1,054 | 2.6% |
| Native / Alaskan | 2 | 0.0% |
| White / Caucasian | 35,415 | 87.5% |
| Two or more Races | 2,143 | 5.3% |
| Some other Race | 324 | 0.8% |
| Total | 40,452 | 100.0% |
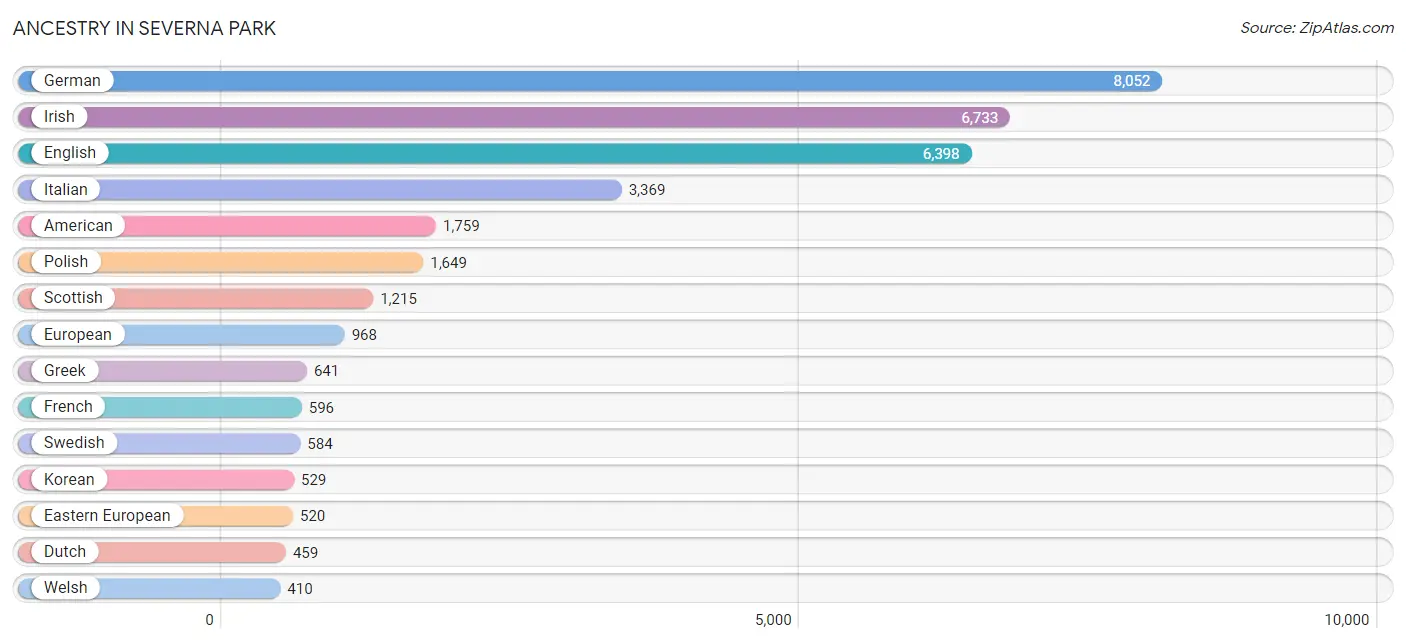
Ancestry in Severna Park
The most populous ancestries reported in Severna Park are German (8,052 | 19.9%), Irish (6,733 | 16.6%), English (6,398 | 15.8%), Italian (3,369 | 8.3%), and American (1,759 | 4.3%), together accounting for 65.1% of all Severna Park residents.
| Ancestry | # Population | % Population |
| African | 252 | 0.6% |
| American | 1,759 | 4.3% |
| Arab | 302 | 0.7% |
| Austrian | 90 | 0.2% |
| Belgian | 122 | 0.3% |
| Bhutanese | 207 | 0.5% |
| Brazilian | 27 | 0.1% |
| British | 389 | 1.0% |
| Burmese | 336 | 0.8% |
| Cajun | 98 | 0.2% |
| Canadian | 38 | 0.1% |
| Celtic | 28 | 0.1% |
| Central American | 92 | 0.2% |
| Central American Indian | 24 | 0.1% |
| Cherokee | 30 | 0.1% |
| Chickasaw | 2 | 0.0% |
| Choctaw | 5 | 0.0% |
| Colombian | 70 | 0.2% |
| Costa Rican | 31 | 0.1% |
| Croatian | 25 | 0.1% |
| Cuban | 157 | 0.4% |
| Czech | 124 | 0.3% |
| Czechoslovakian | 18 | 0.0% |
| Danish | 89 | 0.2% |
| Dominican | 4 | 0.0% |
| Dutch | 459 | 1.1% |
| Eastern European | 520 | 1.3% |
| Ecuadorian | 47 | 0.1% |
| Egyptian | 77 | 0.2% |
| English | 6,398 | 15.8% |
| Estonian | 32 | 0.1% |
| European | 968 | 2.4% |
| Finnish | 152 | 0.4% |
| French | 596 | 1.5% |
| French Canadian | 89 | 0.2% |
| German | 8,052 | 19.9% |
| Greek | 641 | 1.6% |
| Guatemalan | 15 | 0.0% |
| Haitian | 24 | 0.1% |
| Hungarian | 245 | 0.6% |
| Indian (Asian) | 368 | 0.9% |
| Iranian | 25 | 0.1% |
| Iraqi | 21 | 0.1% |
| Irish | 6,733 | 16.6% |
| Iroquois | 19 | 0.1% |
| Israeli | 15 | 0.0% |
| Italian | 3,369 | 8.3% |
| Jamaican | 97 | 0.2% |
| Japanese | 61 | 0.2% |
| Korean | 529 | 1.3% |
| Lebanese | 164 | 0.4% |
| Lithuanian | 392 | 1.0% |
| Mexican | 255 | 0.6% |
| Moroccan | 23 | 0.1% |
| Native Hawaiian | 36 | 0.1% |
| Navajo | 6 | 0.0% |
| Nicaraguan | 46 | 0.1% |
| Northern European | 142 | 0.4% |
| Norwegian | 353 | 0.9% |
| Pakistani | 73 | 0.2% |
| Palestinian | 18 | 0.0% |
| Pennsylvania German | 11 | 0.0% |
| Polish | 1,649 | 4.1% |
| Portuguese | 43 | 0.1% |
| Puerto Rican | 142 | 0.4% |
| Romanian | 43 | 0.1% |
| Russian | 279 | 0.7% |
| Scandinavian | 149 | 0.4% |
| Scotch-Irish | 299 | 0.7% |
| Scottish | 1,215 | 3.0% |
| Senegalese | 1 | 0.0% |
| Slovak | 224 | 0.5% |
| Slovene | 16 | 0.0% |
| South African | 73 | 0.2% |
| South American | 198 | 0.5% |
| Spaniard | 98 | 0.2% |
| Spanish | 53 | 0.1% |
| Sri Lankan | 138 | 0.3% |
| Subsaharan African | 326 | 0.8% |
| Swedish | 584 | 1.4% |
| Swiss | 128 | 0.3% |
| Thai | 261 | 0.6% |
| Trinidadian and Tobagonian | 10 | 0.0% |
| Turkish | 9 | 0.0% |
| Ukrainian | 143 | 0.4% |
| Venezuelan | 81 | 0.2% |
| Welsh | 410 | 1.0% |
| West Indian | 24 | 0.1% | View All 88 Rows |
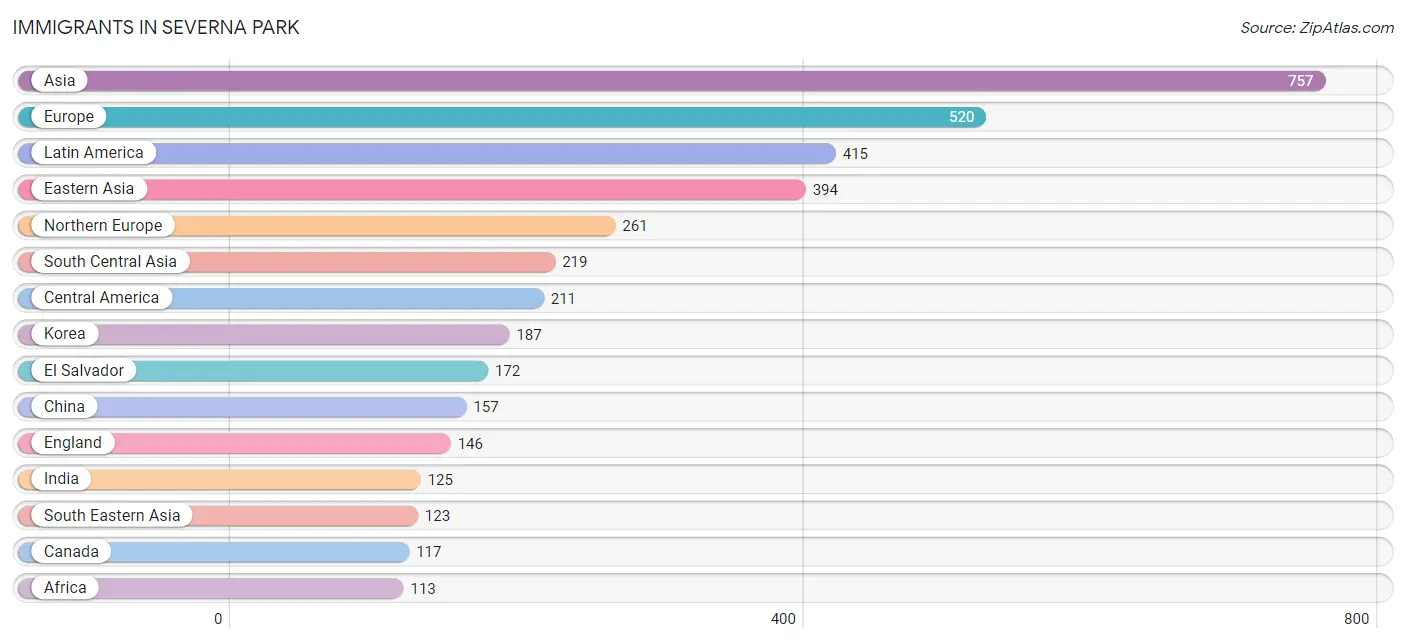
Immigrants in Severna Park
The most numerous immigrant groups reported in Severna Park came from Asia (757 | 1.9%), Europe (520 | 1.3%), Latin America (415 | 1.0%), Eastern Asia (394 | 1.0%), and Northern Europe (261 | 0.6%), together accounting for 5.8% of all Severna Park residents.
| Immigration Origin | # Population | % Population |
| Africa | 113 | 0.3% |
| Asia | 757 | 1.9% |
| Cambodia | 15 | 0.0% |
| Canada | 117 | 0.3% |
| Caribbean | 104 | 0.3% |
| Central America | 211 | 0.5% |
| China | 157 | 0.4% |
| Colombia | 49 | 0.1% |
| Cuba | 19 | 0.1% |
| Dominican Republic | 15 | 0.0% |
| Eastern Asia | 394 | 1.0% |
| Eastern Europe | 106 | 0.3% |
| Ecuador | 17 | 0.0% |
| Egypt | 78 | 0.2% |
| El Salvador | 172 | 0.4% |
| England | 146 | 0.4% |
| Europe | 520 | 1.3% |
| France | 19 | 0.1% |
| Germany | 62 | 0.2% |
| Greece | 16 | 0.0% |
| Guyana | 34 | 0.1% |
| Hong Kong | 7 | 0.0% |
| India | 125 | 0.3% |
| Indonesia | 9 | 0.0% |
| Ireland | 52 | 0.1% |
| Jamaica | 60 | 0.2% |
| Japan | 50 | 0.1% |
| Korea | 187 | 0.5% |
| Latin America | 415 | 1.0% |
| Morocco | 12 | 0.0% |
| Nepal | 83 | 0.2% |
| Netherlands | 13 | 0.0% |
| Nicaragua | 39 | 0.1% |
| Nigeria | 6 | 0.0% |
| Northern Africa | 90 | 0.2% |
| Northern Europe | 261 | 0.6% |
| Philippines | 51 | 0.1% |
| Poland | 21 | 0.1% |
| Romania | 24 | 0.1% |
| Russia | 40 | 0.1% |
| South Africa | 17 | 0.0% |
| South America | 100 | 0.3% |
| South Central Asia | 219 | 0.5% |
| South Eastern Asia | 123 | 0.3% |
| Southern Europe | 59 | 0.2% |
| Spain | 43 | 0.1% |
| Taiwan | 28 | 0.1% |
| Thailand | 13 | 0.0% |
| Trinidad and Tobago | 10 | 0.0% |
| Turkey | 9 | 0.0% |
| Ukraine | 11 | 0.0% |
| Uzbekistan | 11 | 0.0% |
| Vietnam | 35 | 0.1% |
| Western Africa | 6 | 0.0% |
| Western Asia | 21 | 0.1% |
| Western Europe | 94 | 0.2% | View All 56 Rows |
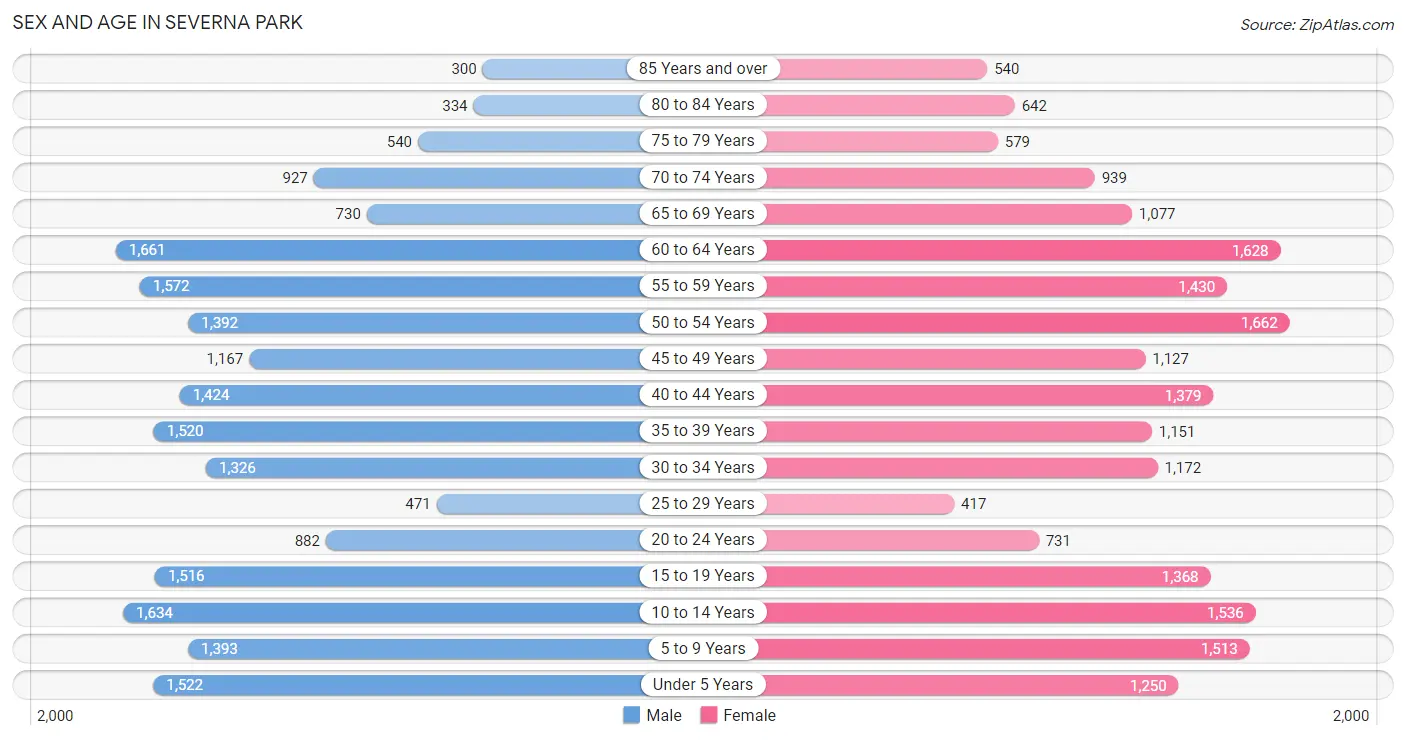
Sex and Age in Severna Park
Sex and Age in Severna Park
The most populous age groups in Severna Park are 60 to 64 Years (1,661 | 8.2%) for men and 50 to 54 Years (1,662 | 8.3%) for women.
| Age Bracket | Male | Female |
| Under 5 Years | 1,522 (7.5%) | 1,250 (6.2%) |
| 5 to 9 Years | 1,393 (6.9%) | 1,513 (7.5%) |
| 10 to 14 Years | 1,634 (8.0%) | 1,536 (7.6%) |
| 15 to 19 Years | 1,516 (7.5%) | 1,368 (6.8%) |
| 20 to 24 Years | 882 (4.3%) | 731 (3.6%) |
| 25 to 29 Years | 471 (2.3%) | 417 (2.1%) |
| 30 to 34 Years | 1,326 (6.5%) | 1,172 (5.8%) |
| 35 to 39 Years | 1,520 (7.5%) | 1,151 (5.7%) |
| 40 to 44 Years | 1,424 (7.0%) | 1,379 (6.9%) |
| 45 to 49 Years | 1,167 (5.8%) | 1,127 (5.6%) |
| 50 to 54 Years | 1,392 (6.9%) | 1,662 (8.3%) |
| 55 to 59 Years | 1,572 (7.7%) | 1,430 (7.1%) |
| 60 to 64 Years | 1,661 (8.2%) | 1,628 (8.1%) |
| 65 to 69 Years | 730 (3.6%) | 1,077 (5.3%) |
| 70 to 74 Years | 927 (4.6%) | 939 (4.7%) |
| 75 to 79 Years | 540 (2.7%) | 579 (2.9%) |
| 80 to 84 Years | 334 (1.6%) | 642 (3.2%) |
| 85 Years and over | 300 (1.5%) | 540 (2.7%) |
| Total | 20,311 (100.0%) | 20,141 (100.0%) |
Families and Households in Severna Park
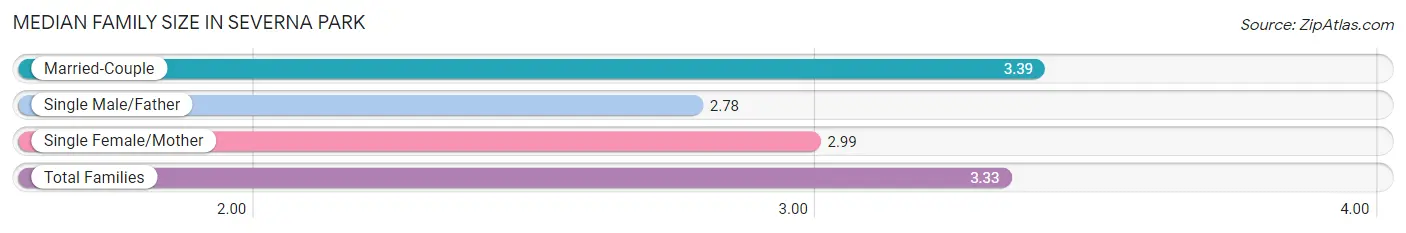
Median Family Size in Severna Park
The median family size in Severna Park is 3.33 persons per family, with married-couple families (9,473 | 88.0%) accounting for the largest median family size of 3.39 persons per family. On the other hand, single male/father families (404 | 3.7%) represent the smallest median family size with 2.78 persons per family.
| Family Type | # Families | Family Size |
| Married-Couple | 9,473 (88.0%) | 3.39 |
| Single Male/Father | 404 (3.7%) | 2.78 |
| Single Female/Mother | 889 (8.3%) | 2.99 |
| Total Families | 10,766 (100.0%) | 3.33 |
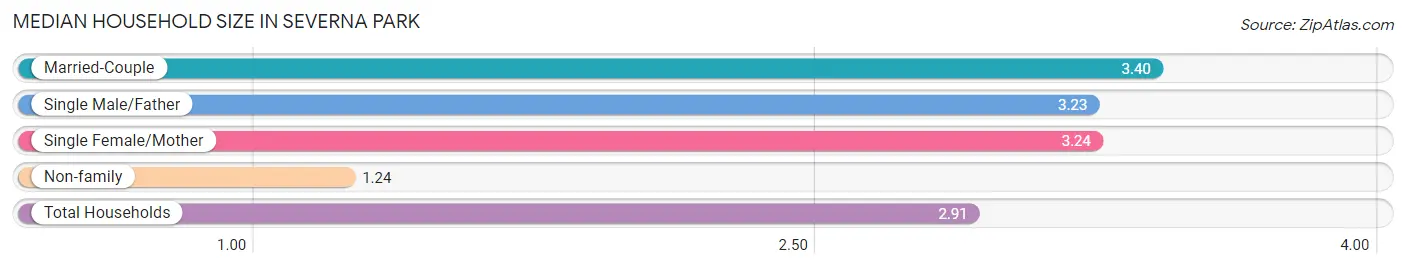
Median Household Size in Severna Park
The median household size in Severna Park is 2.91 persons per household, with married-couple households (9,473 | 68.7%) accounting for the largest median household size of 3.4 persons per household. non-family households (3,026 | 21.9%) represent the smallest median household size with 1.24 persons per household.
| Household Type | # Households | Household Size |
| Married-Couple | 9,473 (68.7%) | 3.40 |
| Single Male/Father | 404 (2.9%) | 3.23 |
| Single Female/Mother | 889 (6.5%) | 3.24 |
| Non-family | 3,026 (21.9%) | 1.24 |
| Total Households | 13,792 (100.0%) | 2.91 |
Household Size by Marriage Status in Severna Park
Out of a total of 13,792 households in Severna Park, 10,766 (78.1%) are family households, while 3,026 (21.9%) are nonfamily households. The most numerous type of family households are 2-person households, comprising 3,528, and the most common type of nonfamily households are 1-person households, comprising 2,414.
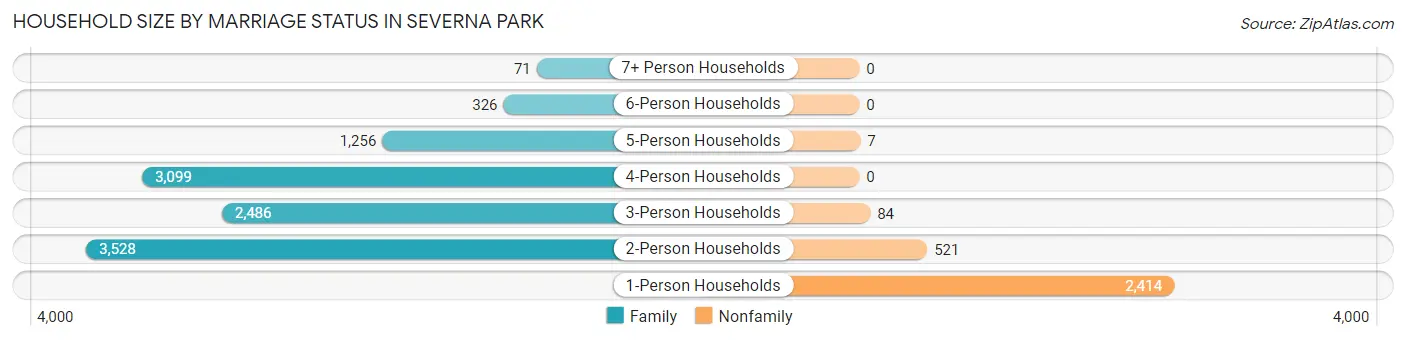
| Household Size | Family Households | Nonfamily Households |
| 1-Person Households | - | 2,414 (17.5%) |
| 2-Person Households | 3,528 (25.6%) | 521 (3.8%) |
| 3-Person Households | 2,486 (18.0%) | 84 (0.6%) |
| 4-Person Households | 3,099 (22.5%) | 0 (0.0%) |
| 5-Person Households | 1,256 (9.1%) | 7 (0.1%) |
| 6-Person Households | 326 (2.4%) | 0 (0.0%) |
| 7+ Person Households | 71 (0.5%) | 0 (0.0%) |
| Total | 10,766 (78.1%) | 3,026 (21.9%) |
Female Fertility in Severna Park
Fertility by Age in Severna Park
Average fertility rate in Severna Park is 45.0 births per 1,000 women. Women in the age bracket of 20 to 34 years have the highest fertility rate with 99.0 births per 1,000 women. Women in the age bracket of 20 to 34 years acount for 67.2% of all women with births.
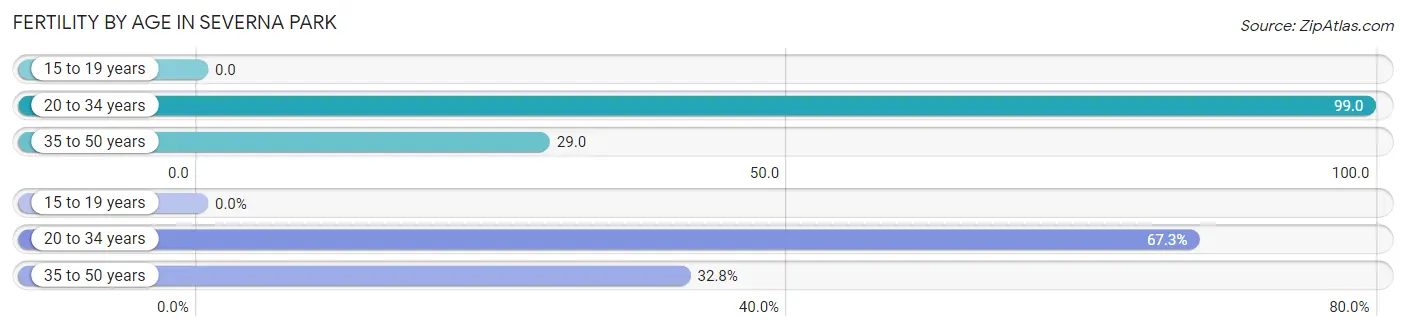
| Age Bracket | Women with Births | Births / 1,000 Women |
| 15 to 19 years | 0 (0.0%) | 0.0 |
| 20 to 34 years | 230 (67.2%) | 99.0 |
| 35 to 50 years | 112 (32.8%) | 29.0 |
| Total | 342 (100.0%) | 45.0 |
Fertility by Age by Marriage Status in Severna Park
96.5% of women with births (342) in Severna Park are married. The highest percentage of unmarried women with births falls into 20 to 34 years age bracket with 5.2% of them unmarried at the time of birth, while the lowest percentage of unmarried women with births belong to 35 to 50 years age bracket with 0.0% of them unmarried.
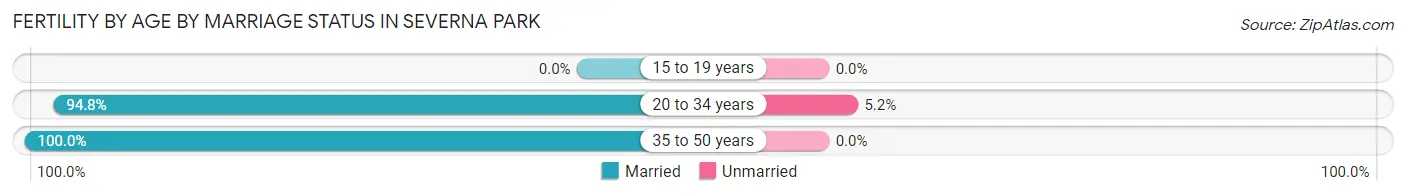
| Age Bracket | Married | Unmarried |
| 15 to 19 years | 0 (0.0%) | 0 (0.0%) |
| 20 to 34 years | 218 (94.8%) | 12 (5.2%) |
| 35 to 50 years | 112 (100.0%) | 0 (0.0%) |
| Total | 330 (96.5%) | 12 (3.5%) |
Fertility by Education in Severna Park
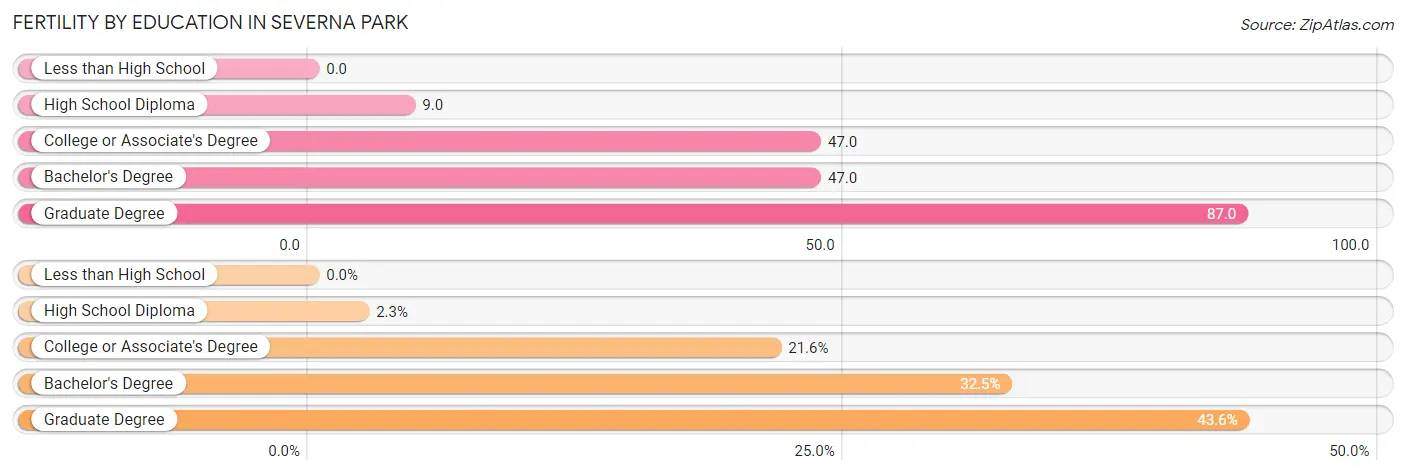
| Educational Attainment | Women with Births | Births / 1,000 Women |
| Less than High School | 0 (0.0%) | 0.0 |
| High School Diploma | 8 (2.3%) | 9.0 |
| College or Associate's Degree | 74 (21.6%) | 47.0 |
| Bachelor's Degree | 111 (32.5%) | 47.0 |
| Graduate Degree | 149 (43.6%) | 87.0 |
| Total | 342 (100.0%) | 45.0 |
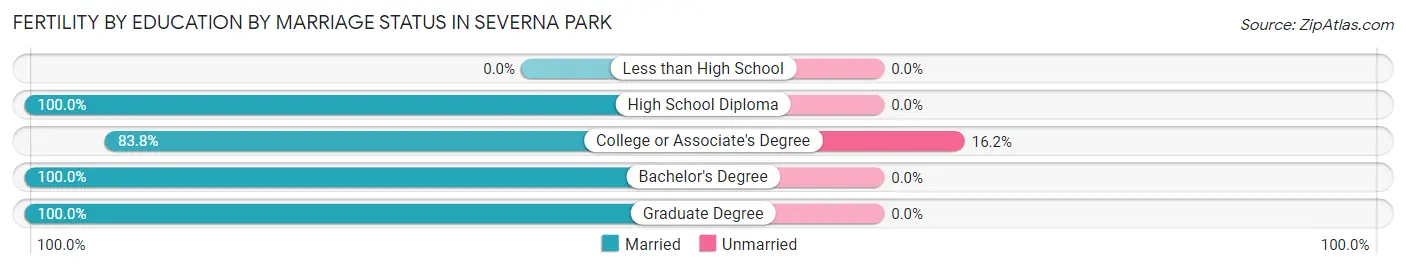
Fertility by Education by Marriage Status in Severna Park
3.5% of women with births in Severna Park are unmarried. Women with the educational attainment of high school diploma are most likely to be married with 100.0% of them married at childbirth, while women with the educational attainment of college or associate's degree are least likely to be married with 16.2% of them unmarried at childbirth.
| Educational Attainment | Married | Unmarried |
| Less than High School | 0 (0.0%) | 0 (0.0%) |
| High School Diploma | 8 (100.0%) | 0 (0.0%) |
| College or Associate's Degree | 62 (83.8%) | 12 (16.2%) |
| Bachelor's Degree | 111 (100.0%) | 0 (0.0%) |
| Graduate Degree | 149 (100.0%) | 0 (0.0%) |
| Total | 330 (96.5%) | 12 (3.5%) |
Employment Characteristics in Severna Park
Employment by Class of Employer in Severna Park
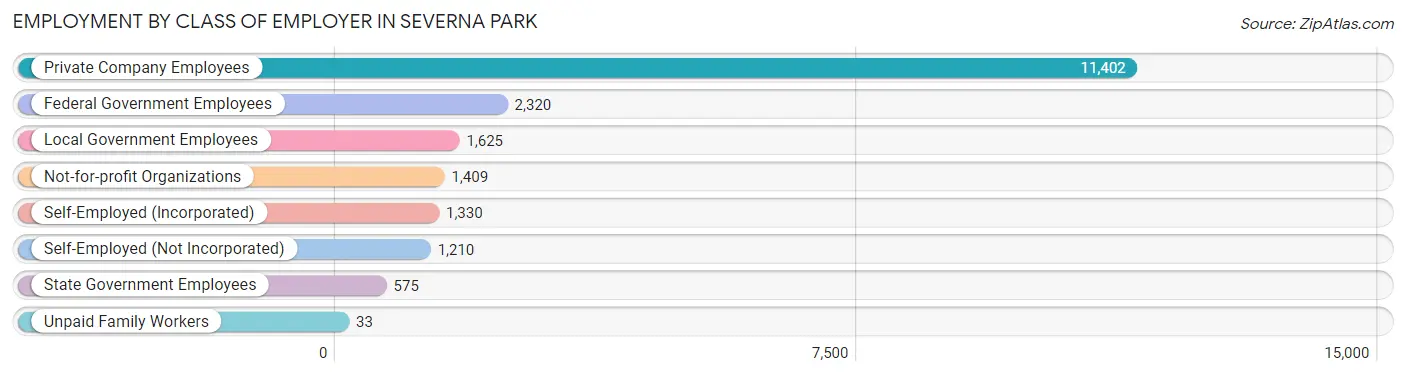
Among the 19,904 employed individuals in Severna Park, private company employees (11,402 | 57.3%), federal government employees (2,320 | 11.7%), and local government employees (1,625 | 8.2%) make up the most common classes of employment.
| Employer Class | # Employees | % Employees |
| Private Company Employees | 11,402 | 57.3% |
| Self-Employed (Incorporated) | 1,330 | 6.7% |
| Self-Employed (Not Incorporated) | 1,210 | 6.1% |
| Not-for-profit Organizations | 1,409 | 7.1% |
| Local Government Employees | 1,625 | 8.2% |
| State Government Employees | 575 | 2.9% |
| Federal Government Employees | 2,320 | 11.7% |
| Unpaid Family Workers | 33 | 0.2% |
| Total | 19,904 | 100.0% |
Employment Status by Age in Severna Park
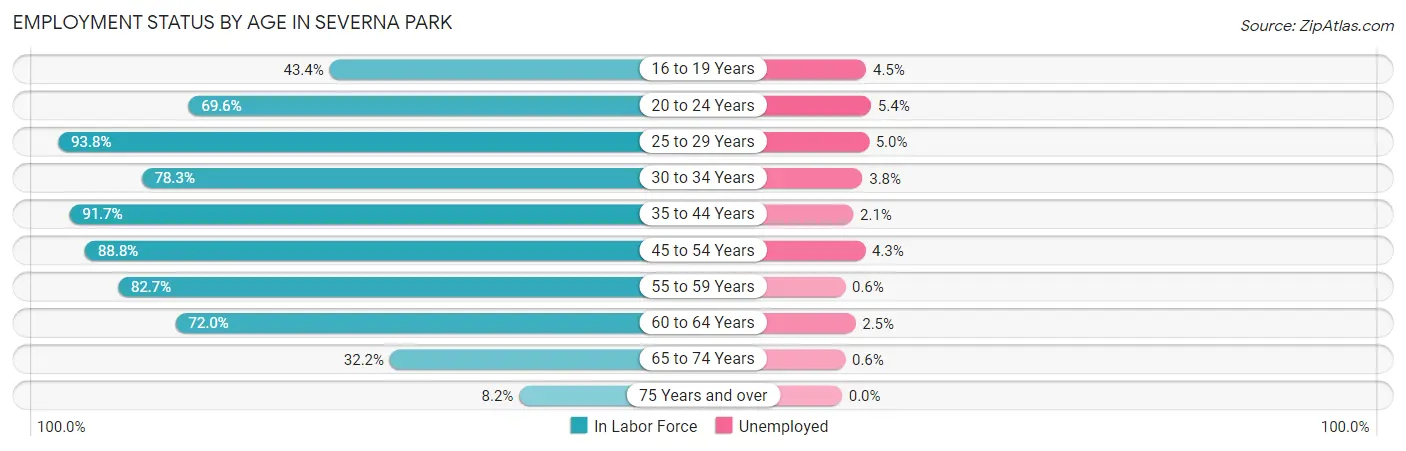
According to the labor force statistics for Severna Park, out of the total population over 16 years of age (30,986), 67.6% or 20,947 individuals are in the labor force, with 2.9% or 607 of them unemployed. The age group with the highest labor force participation rate is 25 to 29 years, with 93.8% or 833 individuals in the labor force. Within the labor force, the 20 to 24 years age range has the highest percentage of unemployed individuals, with 5.4% or 61 of them being unemployed.
| Age Bracket | In Labor Force | Unemployed |
| 16 to 19 Years | 983 (43.4%) | 44 (4.5%) |
| 20 to 24 Years | 1,123 (69.6%) | 61 (5.4%) |
| 25 to 29 Years | 833 (93.8%) | 42 (5.0%) |
| 30 to 34 Years | 1,956 (78.3%) | 74 (3.8%) |
| 35 to 44 Years | 5,020 (91.7%) | 105 (2.1%) |
| 45 to 54 Years | 4,749 (88.8%) | 204 (4.3%) |
| 55 to 59 Years | 2,483 (82.7%) | 15 (0.6%) |
| 60 to 64 Years | 2,368 (72.0%) | 59 (2.5%) |
| 65 to 74 Years | 1,183 (32.2%) | 7 (0.6%) |
| 75 Years and over | 241 (8.2%) | 0 (0.0%) |
| Total | 20,947 (67.6%) | 607 (2.9%) |
Employment Status by Educational Attainment in Severna Park
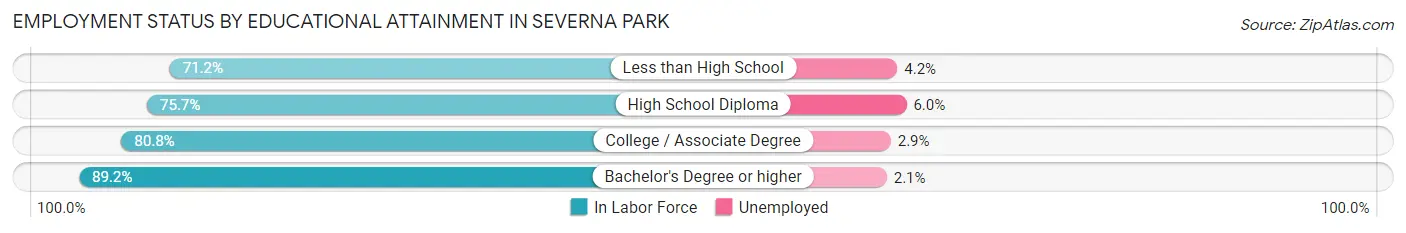
According to labor force statistics for Severna Park, 84.9% of individuals (17,404) out of the total population between 25 and 64 years of age (20,499) are in the labor force, with 2.9% or 505 of them being unemployed. The group with the highest labor force participation rate are those with the educational attainment of bachelor's degree or higher, with 89.2% or 11,188 individuals in the labor force. Within the labor force, individuals with high school diploma education have the highest percentage of unemployment, with 6.0% or 142 of them being unemployed.
| Educational Attainment | In Labor Force | Unemployed |
| Less than High School | 354 (71.2%) | 21 (4.2%) |
| High School Diploma | 2,367 (75.7%) | 188 (6.0%) |
| College / Associate Degree | 3,500 (80.8%) | 126 (2.9%) |
| Bachelor's Degree or higher | 11,188 (89.2%) | 263 (2.1%) |
| Total | 17,404 (84.9%) | 594 (2.9%) |
Employment Occupations by Sex in Severna Park
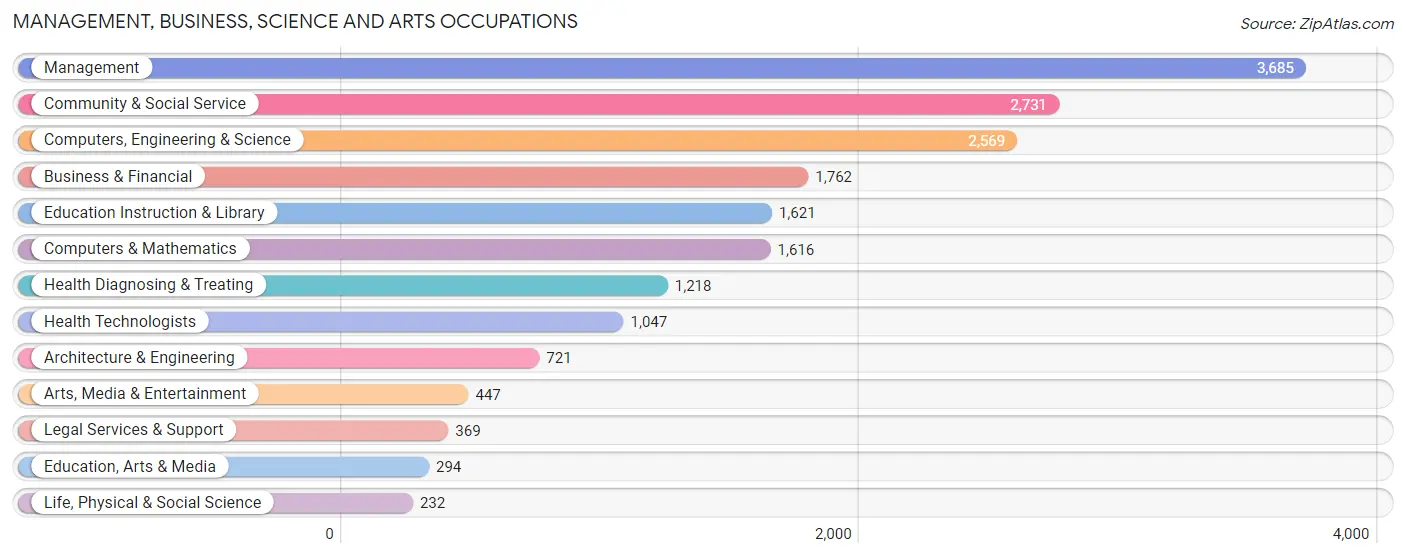
Management, Business, Science and Arts Occupations
The most common Management, Business, Science and Arts occupations in Severna Park are Management (3,685 | 18.5%), Community & Social Service (2,731 | 13.7%), Computers, Engineering & Science (2,569 | 12.9%), Business & Financial (1,762 | 8.8%), and Education Instruction & Library (1,621 | 8.1%).
Management, Business, Science and Arts Occupations by Sex
Within the Management, Business, Science and Arts occupations in Severna Park, the most male-oriented occupations are Architecture & Engineering (86.6%), Computers, Engineering & Science (73.6%), and Computers & Mathematics (70.5%), while the most female-oriented occupations are Health Technologists (81.3%), Health Diagnosing & Treating (77.4%), and Education Instruction & Library (68.5%).
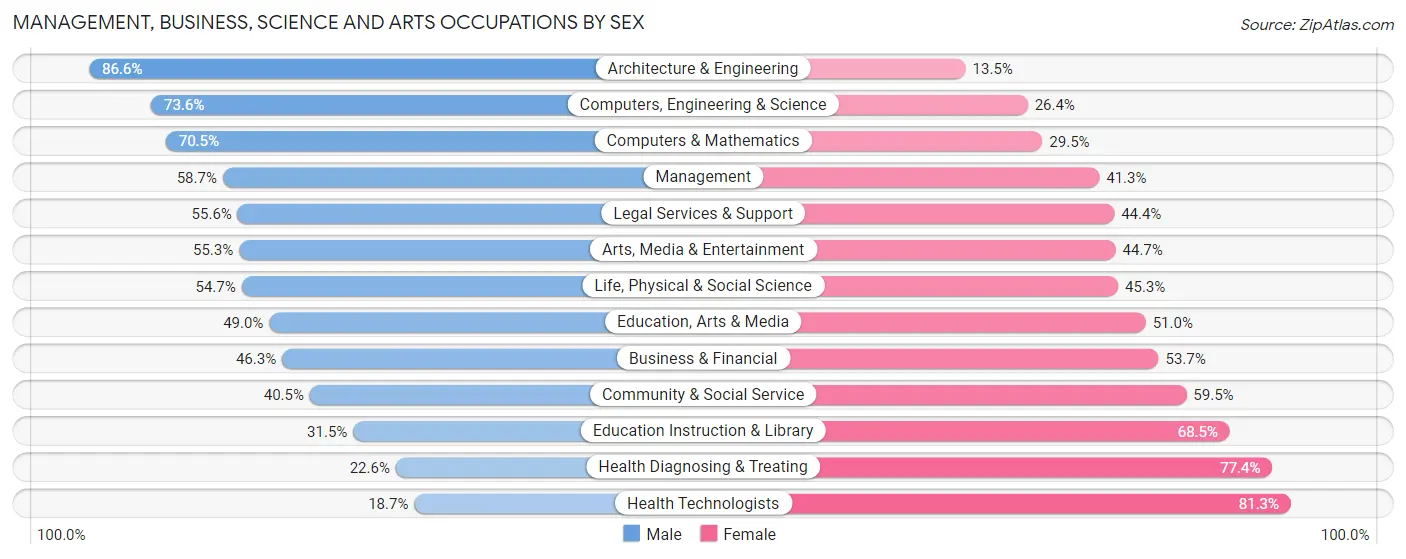
| Occupation | Male | Female |
| Management | 2,162 (58.7%) | 1,523 (41.3%) |
| Business & Financial | 816 (46.3%) | 946 (53.7%) |
| Computers, Engineering & Science | 1,891 (73.6%) | 678 (26.4%) |
| Computers & Mathematics | 1,140 (70.5%) | 476 (29.5%) |
| Architecture & Engineering | 624 (86.6%) | 97 (13.5%) |
| Life, Physical & Social Science | 127 (54.7%) | 105 (45.3%) |
| Community & Social Service | 1,106 (40.5%) | 1,625 (59.5%) |
| Education, Arts & Media | 144 (49.0%) | 150 (51.0%) |
| Legal Services & Support | 205 (55.6%) | 164 (44.4%) |
| Education Instruction & Library | 510 (31.5%) | 1,111 (68.5%) |
| Arts, Media & Entertainment | 247 (55.3%) | 200 (44.7%) |
| Health Diagnosing & Treating | 275 (22.6%) | 943 (77.4%) |
| Health Technologists | 196 (18.7%) | 851 (81.3%) |
| Total (Category) | 6,250 (52.2%) | 5,715 (47.8%) |
| Total (Overall) | 10,949 (54.8%) | 9,014 (45.2%) |
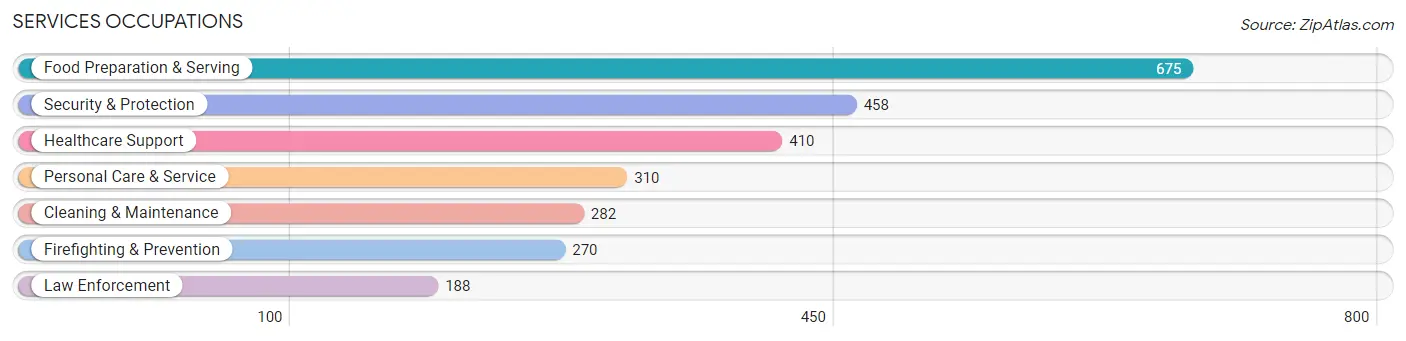
Services Occupations
The most common Services occupations in Severna Park are Food Preparation & Serving (675 | 3.4%), Security & Protection (458 | 2.3%), Healthcare Support (410 | 2.1%), Personal Care & Service (310 | 1.5%), and Cleaning & Maintenance (282 | 1.4%).
Services Occupations by Sex
Within the Services occupations in Severna Park, the most male-oriented occupations are Law Enforcement (82.5%), Security & Protection (81.4%), and Firefighting & Prevention (80.7%), while the most female-oriented occupations are Personal Care & Service (81.0%), Healthcare Support (73.4%), and Food Preparation & Serving (61.5%).
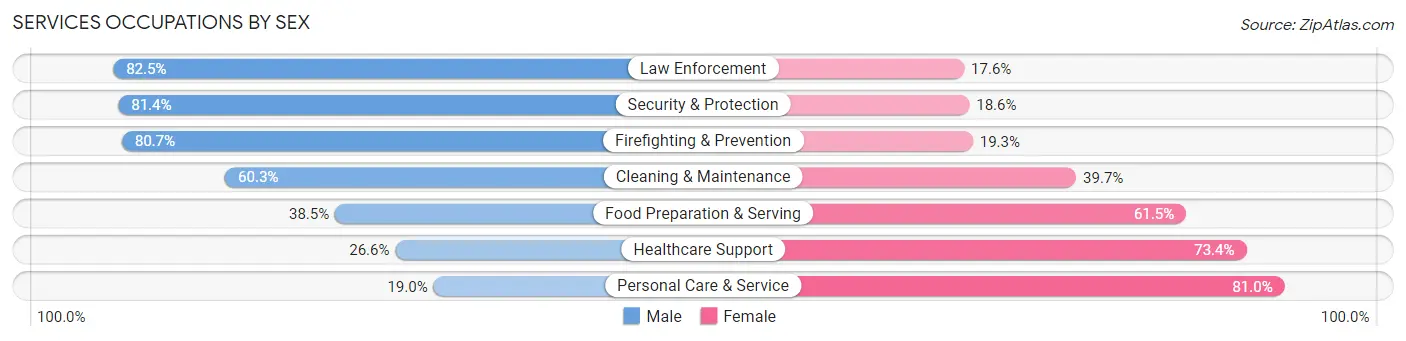
| Occupation | Male | Female |
| Healthcare Support | 109 (26.6%) | 301 (73.4%) |
| Security & Protection | 373 (81.4%) | 85 (18.6%) |
| Firefighting & Prevention | 218 (80.7%) | 52 (19.3%) |
| Law Enforcement | 155 (82.5%) | 33 (17.5%) |
| Food Preparation & Serving | 260 (38.5%) | 415 (61.5%) |
| Cleaning & Maintenance | 170 (60.3%) | 112 (39.7%) |
| Personal Care & Service | 59 (19.0%) | 251 (81.0%) |
| Total (Category) | 971 (45.5%) | 1,164 (54.5%) |
| Total (Overall) | 10,949 (54.8%) | 9,014 (45.2%) |
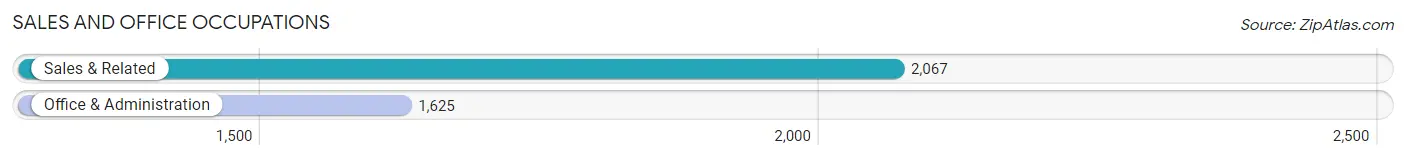
Sales and Office Occupations
The most common Sales and Office occupations in Severna Park are Sales & Related (2,067 | 10.3%), and Office & Administration (1,625 | 8.1%).
Sales and Office Occupations by Sex
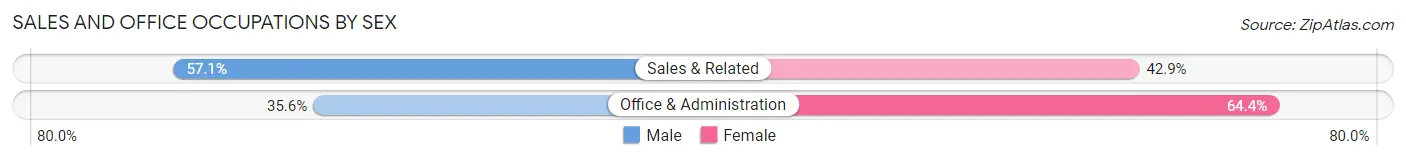
| Occupation | Male | Female |
| Sales & Related | 1,180 (57.1%) | 887 (42.9%) |
| Office & Administration | 579 (35.6%) | 1,046 (64.4%) |
| Total (Category) | 1,759 (47.6%) | 1,933 (52.4%) |
| Total (Overall) | 10,949 (54.8%) | 9,014 (45.2%) |
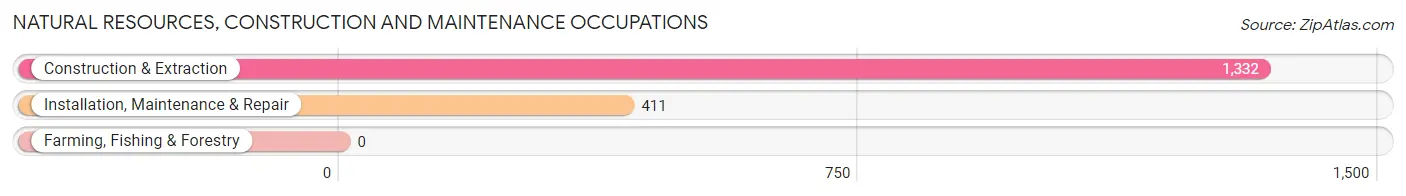
Natural Resources, Construction and Maintenance Occupations
The most common Natural Resources, Construction and Maintenance occupations in Severna Park are Construction & Extraction (1,332 | 6.7%), and Installation, Maintenance & Repair (411 | 2.1%).
Natural Resources, Construction and Maintenance Occupations by Sex
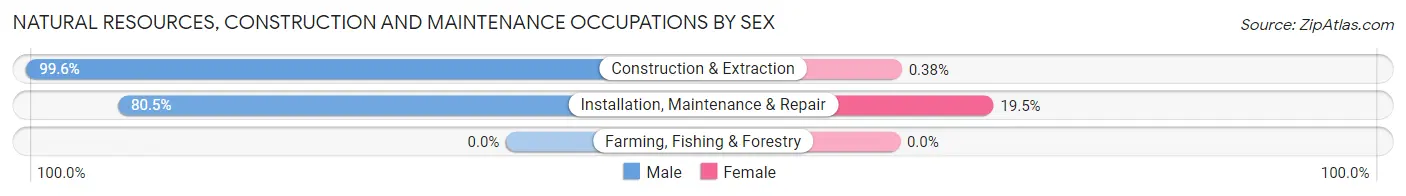
| Occupation | Male | Female |
| Farming, Fishing & Forestry | 0 (0.0%) | 0 (0.0%) |
| Construction & Extraction | 1,327 (99.6%) | 5 (0.4%) |
| Installation, Maintenance & Repair | 331 (80.5%) | 80 (19.5%) |
| Total (Category) | 1,658 (95.1%) | 85 (4.9%) |
| Total (Overall) | 10,949 (54.8%) | 9,014 (45.2%) |
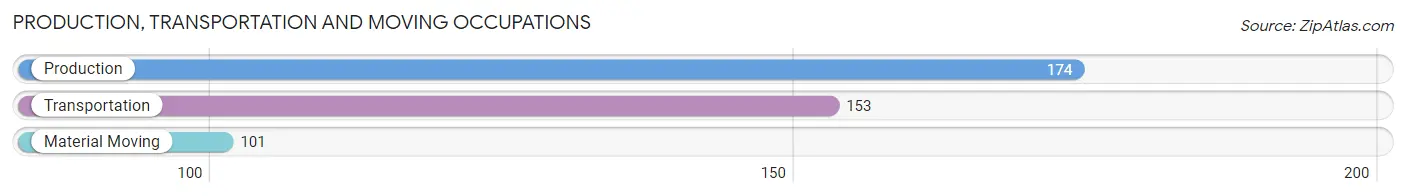
Production, Transportation and Moving Occupations
The most common Production, Transportation and Moving occupations in Severna Park are Production (174 | 0.9%), Transportation (153 | 0.8%), and Material Moving (101 | 0.5%).
Production, Transportation and Moving Occupations by Sex
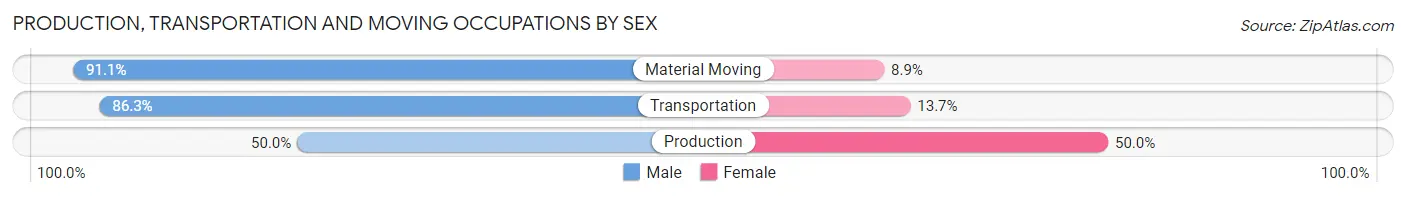
| Occupation | Male | Female |
| Production | 87 (50.0%) | 87 (50.0%) |
| Transportation | 132 (86.3%) | 21 (13.7%) |
| Material Moving | 92 (91.1%) | 9 (8.9%) |
| Total (Category) | 311 (72.7%) | 117 (27.3%) |
| Total (Overall) | 10,949 (54.8%) | 9,014 (45.2%) |
Employment Industries by Sex in Severna Park
Employment Industries in Severna Park
The major employment industries in Severna Park include Professional & Scientific (3,132 | 15.7%), Educational Services (2,588 | 13.0%), Construction (2,116 | 10.6%), Public Administration (2,053 | 10.3%), and Health Care & Social Assistance (1,904 | 9.5%).
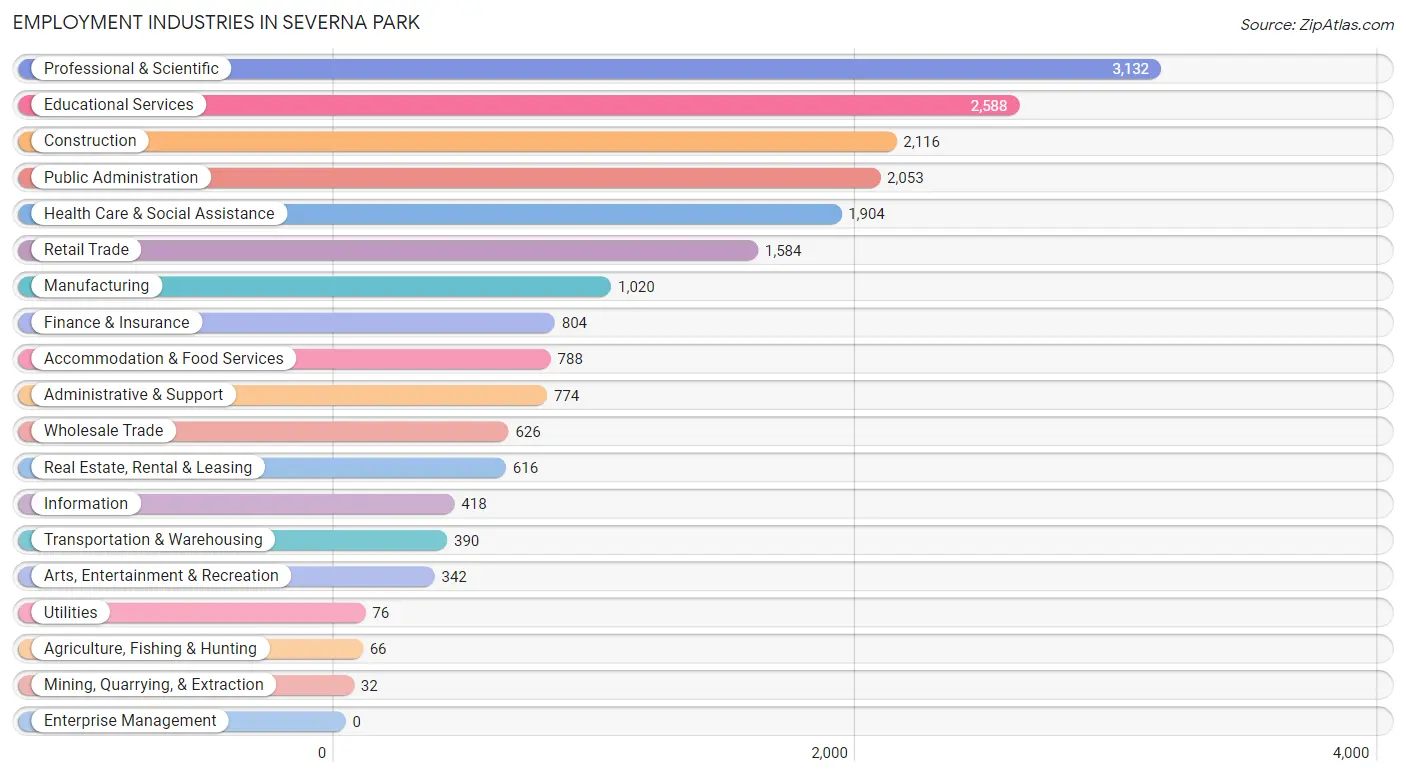
Employment Industries by Sex in Severna Park
The Severna Park industries that see more men than women are Information (88.0%), Construction (87.3%), and Utilities (85.5%), whereas the industries that tend to have a higher number of women are Health Care & Social Assistance (78.1%), Agriculture, Fishing & Hunting (74.2%), and Educational Services (70.5%).
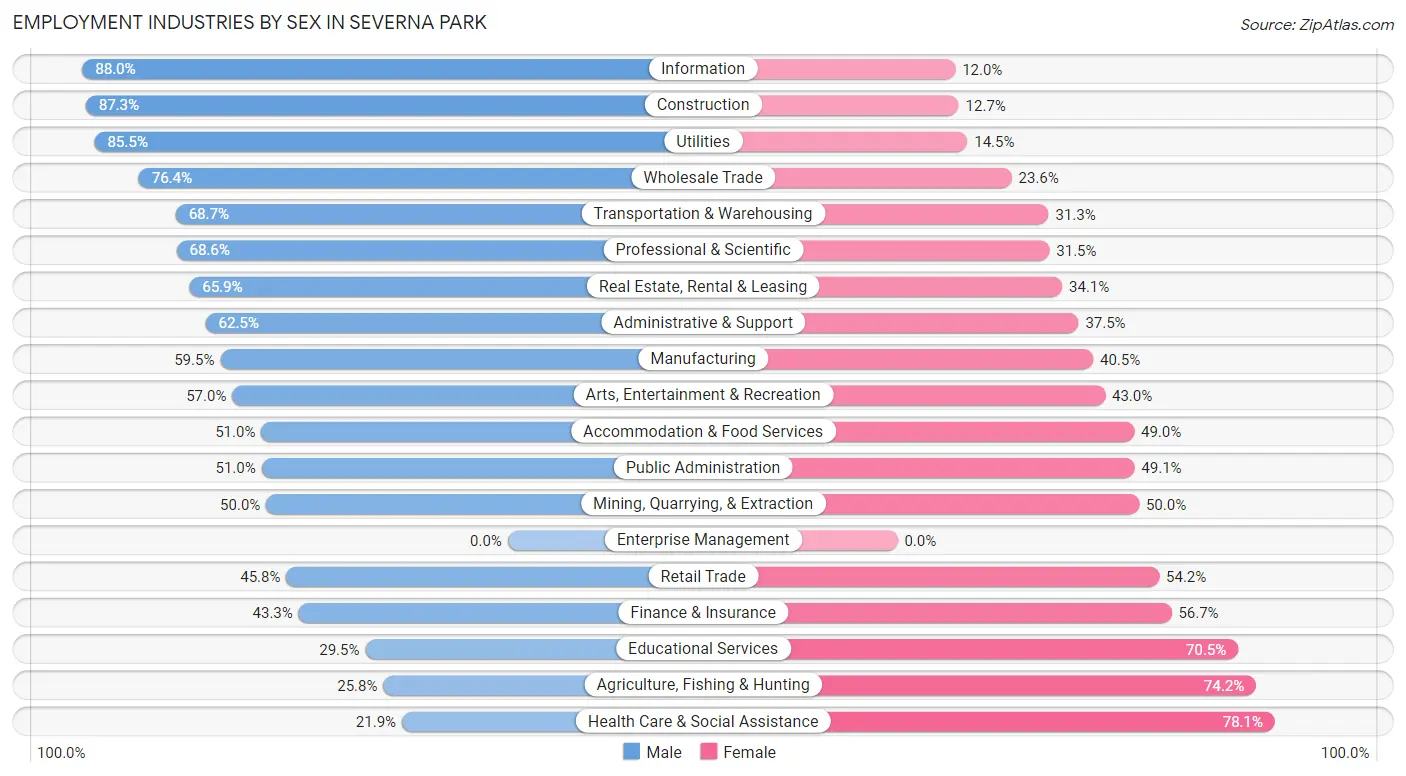
| Industry | Male | Female |
| Agriculture, Fishing & Hunting | 17 (25.8%) | 49 (74.2%) |
| Mining, Quarrying, & Extraction | 16 (50.0%) | 16 (50.0%) |
| Construction | 1,848 (87.3%) | 268 (12.7%) |
| Manufacturing | 607 (59.5%) | 413 (40.5%) |
| Wholesale Trade | 478 (76.4%) | 148 (23.6%) |
| Retail Trade | 726 (45.8%) | 858 (54.2%) |
| Transportation & Warehousing | 268 (68.7%) | 122 (31.3%) |
| Utilities | 65 (85.5%) | 11 (14.5%) |
| Information | 368 (88.0%) | 50 (12.0%) |
| Finance & Insurance | 348 (43.3%) | 456 (56.7%) |
| Real Estate, Rental & Leasing | 406 (65.9%) | 210 (34.1%) |
| Professional & Scientific | 2,147 (68.5%) | 985 (31.5%) |
| Enterprise Management | 0 (0.0%) | 0 (0.0%) |
| Administrative & Support | 484 (62.5%) | 290 (37.5%) |
| Educational Services | 763 (29.5%) | 1,825 (70.5%) |
| Health Care & Social Assistance | 417 (21.9%) | 1,487 (78.1%) |
| Arts, Entertainment & Recreation | 195 (57.0%) | 147 (43.0%) |
| Accommodation & Food Services | 402 (51.0%) | 386 (49.0%) |
| Public Administration | 1,046 (50.9%) | 1,007 (49.0%) |
| Total | 10,949 (54.8%) | 9,014 (45.2%) |
Education in Severna Park
School Enrollment in Severna Park
The most common levels of schooling among the 10,679 students in Severna Park are middle school (2,722 | 25.5%), high school (2,539 | 23.8%), and elementary school (2,364 | 22.1%).
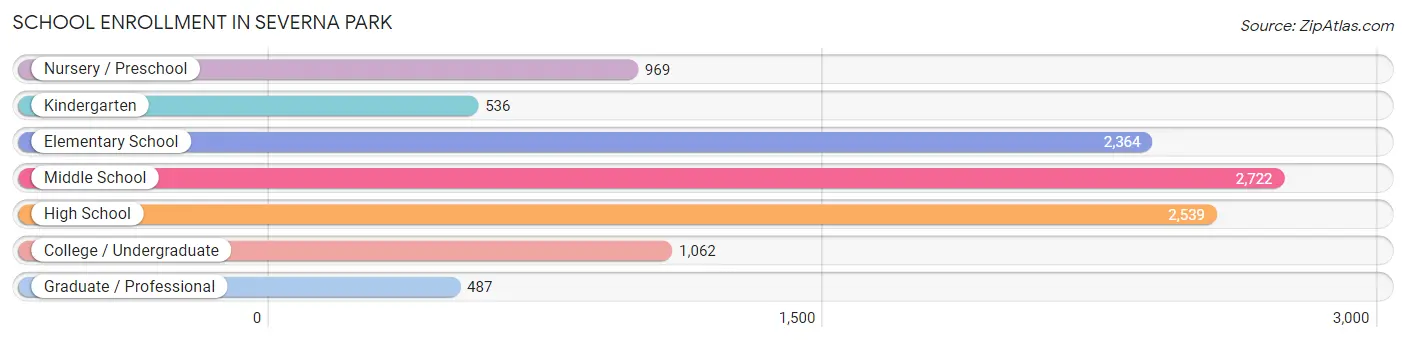
| School Level | # Students | % Students |
| Nursery / Preschool | 969 | 9.1% |
| Kindergarten | 536 | 5.0% |
| Elementary School | 2,364 | 22.1% |
| Middle School | 2,722 | 25.5% |
| High School | 2,539 | 23.8% |
| College / Undergraduate | 1,062 | 9.9% |
| Graduate / Professional | 487 | 4.6% |
| Total | 10,679 | 100.0% |
School Enrollment by Age by Funding Source in Severna Park
Out of a total of 10,679 students who are enrolled in schools in Severna Park, 3,097 (29.0%) attend a private institution, while the remaining 7,582 (71.0%) are enrolled in public schools. The age group of 3 to 4 year olds has the highest likelihood of being enrolled in private schools, with 543 (71.7% in the age bracket) enrolled. Conversely, the age group of 10 to 14 year olds has the lowest likelihood of being enrolled in a private school, with 2,553 (81.3% in the age bracket) attending a public institution.
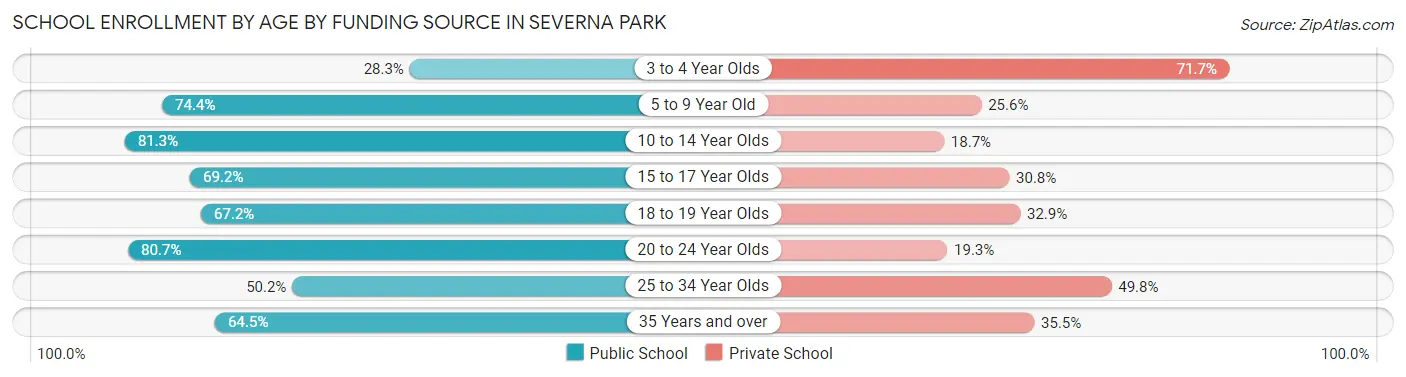
| Age Bracket | Public School | Private School |
| 3 to 4 Year Olds | 214 (28.3%) | 543 (71.7%) |
| 5 to 9 Year Old | 2,122 (74.4%) | 731 (25.6%) |
| 10 to 14 Year Olds | 2,553 (81.3%) | 586 (18.7%) |
| 15 to 17 Year Olds | 1,295 (69.2%) | 577 (30.8%) |
| 18 to 19 Year Olds | 558 (67.1%) | 273 (32.9%) |
| 20 to 24 Year Olds | 465 (80.7%) | 111 (19.3%) |
| 25 to 34 Year Olds | 154 (50.2%) | 153 (49.8%) |
| 35 Years and over | 222 (64.5%) | 122 (35.5%) |
| Total | 7,582 (71.0%) | 3,097 (29.0%) |
Educational Attainment by Field of Study in Severna Park
Business (3,145 | 18.6%), engineering (1,882 | 11.1%), social sciences (1,841 | 10.9%), education (1,585 | 9.4%), and bio, nature & agricultural (1,143 | 6.8%) are the most common fields of study among 16,913 individuals in Severna Park who have obtained a bachelor's degree or higher.
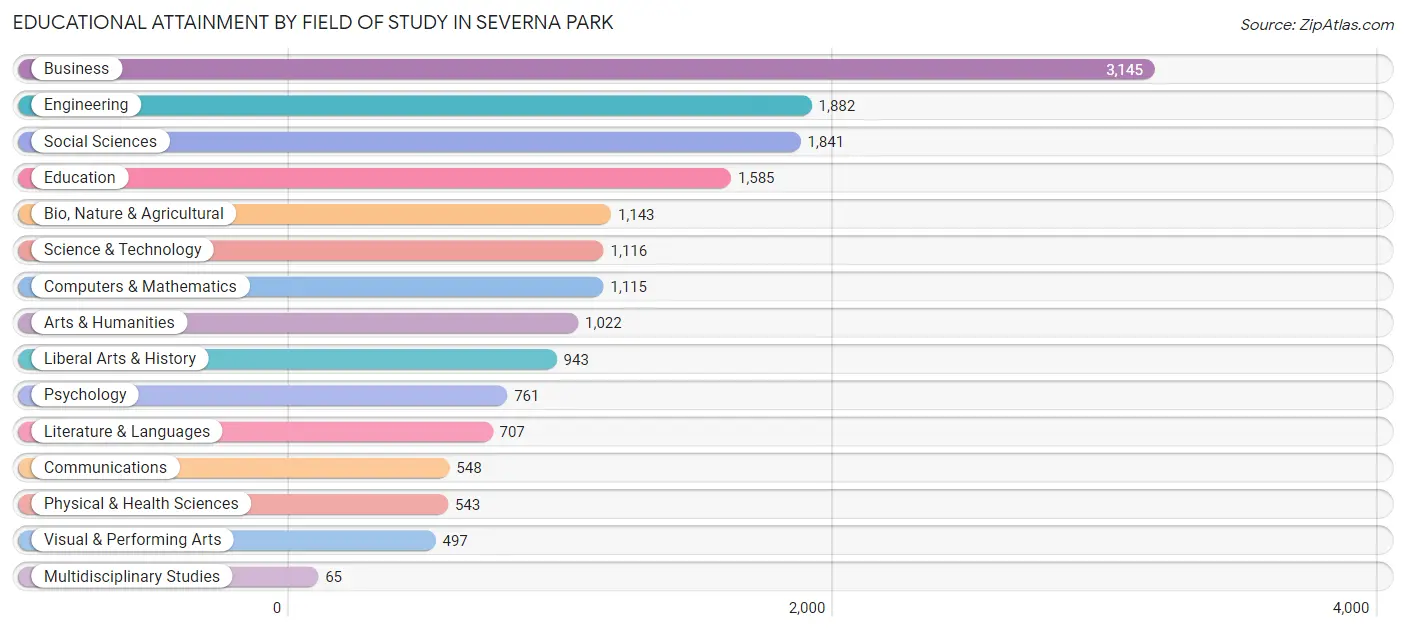
| Field of Study | # Graduates | % Graduates |
| Computers & Mathematics | 1,115 | 6.6% |
| Bio, Nature & Agricultural | 1,143 | 6.8% |
| Physical & Health Sciences | 543 | 3.2% |
| Psychology | 761 | 4.5% |
| Social Sciences | 1,841 | 10.9% |
| Engineering | 1,882 | 11.1% |
| Multidisciplinary Studies | 65 | 0.4% |
| Science & Technology | 1,116 | 6.6% |
| Business | 3,145 | 18.6% |
| Education | 1,585 | 9.4% |
| Literature & Languages | 707 | 4.2% |
| Liberal Arts & History | 943 | 5.6% |
| Visual & Performing Arts | 497 | 2.9% |
| Communications | 548 | 3.2% |
| Arts & Humanities | 1,022 | 6.0% |
| Total | 16,913 | 100.0% |
Transportation & Commute in Severna Park
Vehicle Availability by Sex in Severna Park
The most prevalent vehicle ownership categories in Severna Park are males with 2 vehicles (5,274, accounting for 48.0%) and females with 2 vehicles (3,938, making up 59.2%).
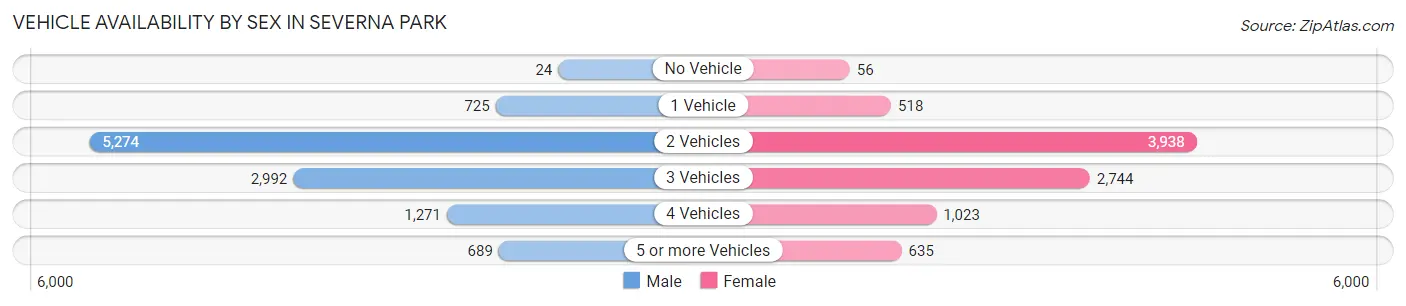
| Vehicles Available | Male | Female |
| No Vehicle | 24 (0.2%) | 56 (0.6%) |
| 1 Vehicle | 725 (6.6%) | 518 (5.8%) |
| 2 Vehicles | 5,274 (48.0%) | 3,938 (44.2%) |
| 3 Vehicles | 2,992 (27.3%) | 2,744 (30.8%) |
| 4 Vehicles | 1,271 (11.6%) | 1,023 (11.5%) |
| 5 or more Vehicles | 689 (6.3%) | 635 (7.1%) |
| Total | 10,975 (100.0%) | 8,914 (100.0%) |
Commute Time in Severna Park
The most frequently occuring commute durations in Severna Park are 30 to 34 minutes (2,429 commuters, 15.1%), 20 to 24 minutes (2,406 commuters, 15.0%), and 15 to 19 minutes (1,727 commuters, 10.8%).
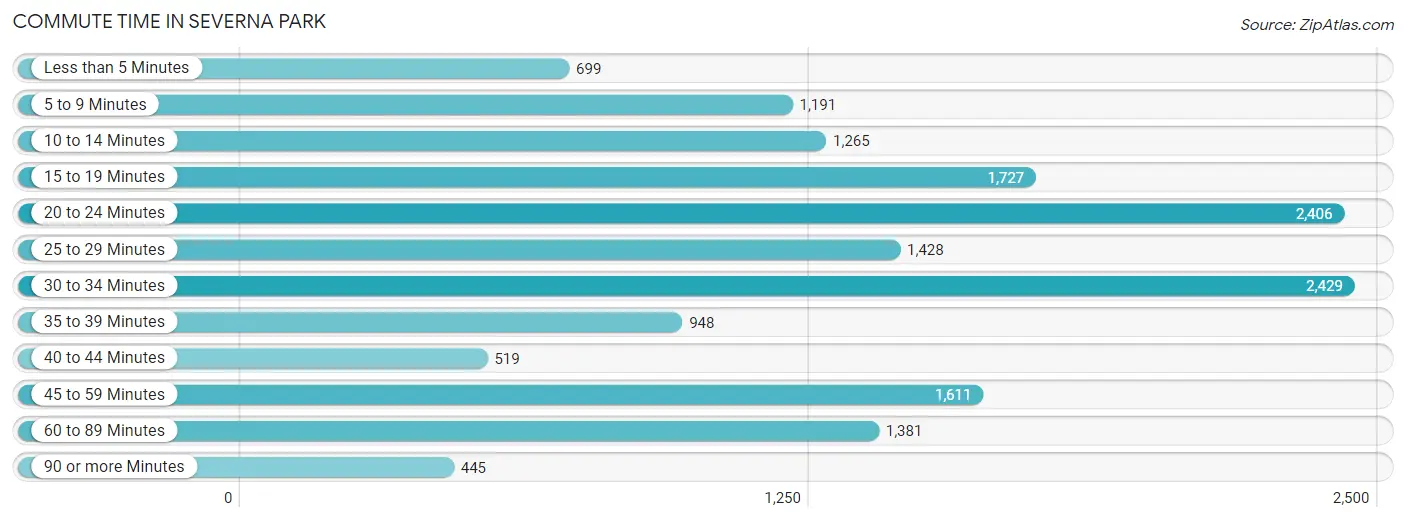
| Commute Time | # Commuters | % Commuters |
| Less than 5 Minutes | 699 | 4.4% |
| 5 to 9 Minutes | 1,191 | 7.4% |
| 10 to 14 Minutes | 1,265 | 7.9% |
| 15 to 19 Minutes | 1,727 | 10.8% |
| 20 to 24 Minutes | 2,406 | 15.0% |
| 25 to 29 Minutes | 1,428 | 8.9% |
| 30 to 34 Minutes | 2,429 | 15.1% |
| 35 to 39 Minutes | 948 | 5.9% |
| 40 to 44 Minutes | 519 | 3.2% |
| 45 to 59 Minutes | 1,611 | 10.0% |
| 60 to 89 Minutes | 1,381 | 8.6% |
| 90 or more Minutes | 445 | 2.8% |
Commute Time by Sex in Severna Park
The most common commute times in Severna Park are 20 to 24 minutes (1,469 commuters, 16.3%) for males and 15 to 19 minutes (993 commuters, 14.2%) for females.
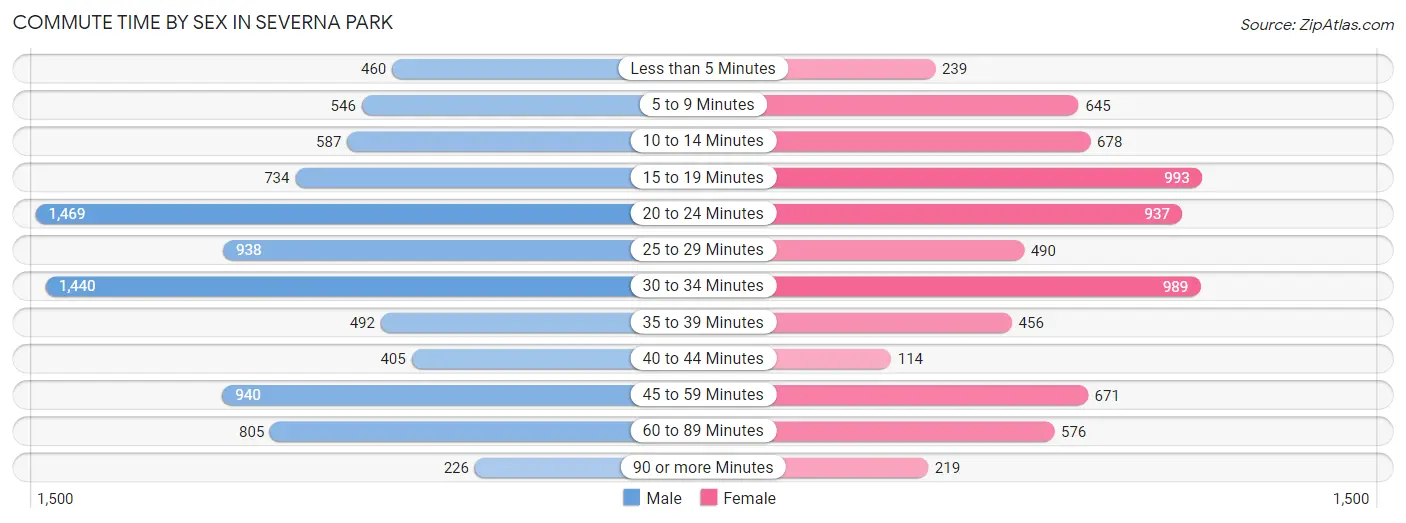
| Commute Time | Male | Female |
| Less than 5 Minutes | 460 (5.1%) | 239 (3.4%) |
| 5 to 9 Minutes | 546 (6.0%) | 645 (9.2%) |
| 10 to 14 Minutes | 587 (6.5%) | 678 (9.7%) |
| 15 to 19 Minutes | 734 (8.1%) | 993 (14.2%) |
| 20 to 24 Minutes | 1,469 (16.3%) | 937 (13.4%) |
| 25 to 29 Minutes | 938 (10.4%) | 490 (7.0%) |
| 30 to 34 Minutes | 1,440 (15.9%) | 989 (14.1%) |
| 35 to 39 Minutes | 492 (5.4%) | 456 (6.5%) |
| 40 to 44 Minutes | 405 (4.5%) | 114 (1.6%) |
| 45 to 59 Minutes | 940 (10.4%) | 671 (9.6%) |
| 60 to 89 Minutes | 805 (8.9%) | 576 (8.2%) |
| 90 or more Minutes | 226 (2.5%) | 219 (3.1%) |
Time of Departure to Work by Sex in Severna Park
The most frequent times of departure to work in Severna Park are 8:00 AM to 8:29 AM (1,601, 17.7%) for males and 7:00 AM to 7:29 AM (1,112, 15.9%) for females.
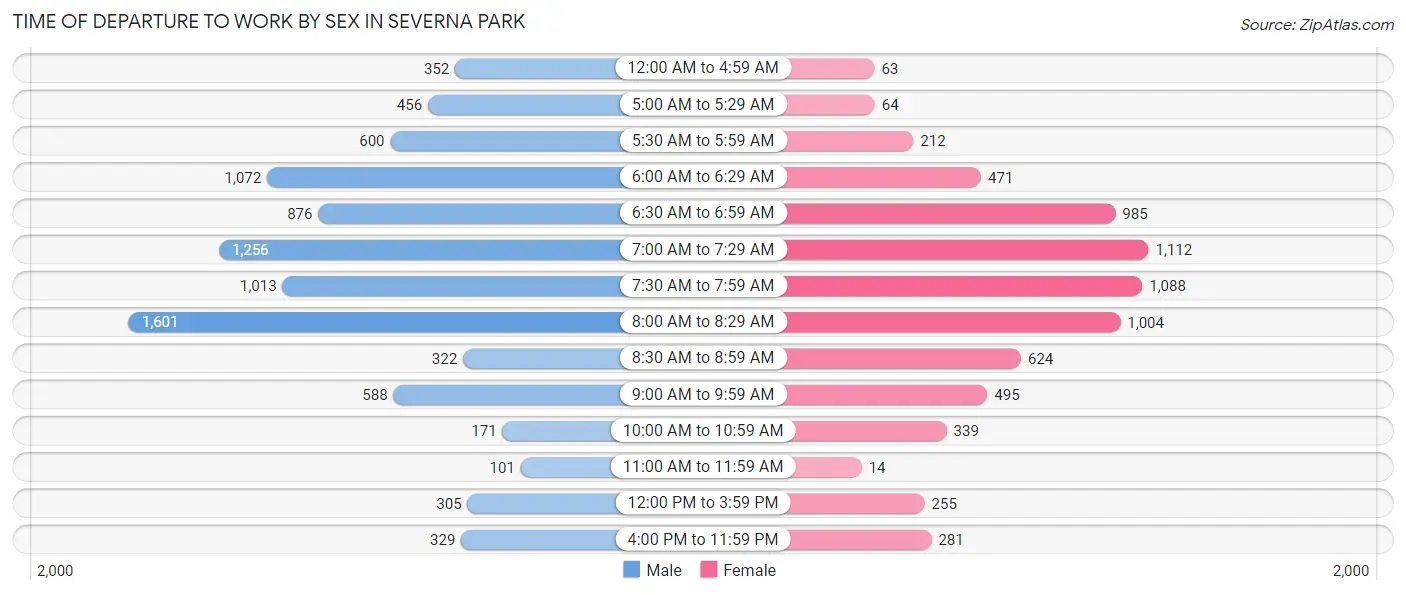
| Time of Departure | Male | Female |
| 12:00 AM to 4:59 AM | 352 (3.9%) | 63 (0.9%) |
| 5:00 AM to 5:29 AM | 456 (5.0%) | 64 (0.9%) |
| 5:30 AM to 5:59 AM | 600 (6.6%) | 212 (3.0%) |
| 6:00 AM to 6:29 AM | 1,072 (11.9%) | 471 (6.7%) |
| 6:30 AM to 6:59 AM | 876 (9.7%) | 985 (14.1%) |
| 7:00 AM to 7:29 AM | 1,256 (13.9%) | 1,112 (15.9%) |
| 7:30 AM to 7:59 AM | 1,013 (11.2%) | 1,088 (15.5%) |
| 8:00 AM to 8:29 AM | 1,601 (17.7%) | 1,004 (14.3%) |
| 8:30 AM to 8:59 AM | 322 (3.6%) | 624 (8.9%) |
| 9:00 AM to 9:59 AM | 588 (6.5%) | 495 (7.1%) |
| 10:00 AM to 10:59 AM | 171 (1.9%) | 339 (4.8%) |
| 11:00 AM to 11:59 AM | 101 (1.1%) | 14 (0.2%) |
| 12:00 PM to 3:59 PM | 305 (3.4%) | 255 (3.6%) |
| 4:00 PM to 11:59 PM | 329 (3.6%) | 281 (4.0%) |
| Total | 9,042 (100.0%) | 7,007 (100.0%) |
Housing Occupancy in Severna Park
Occupancy by Ownership in Severna Park
Of the total 13,792 dwellings in Severna Park, owner-occupied units account for 12,545 (91.0%), while renter-occupied units make up 1,247 (9.0%).
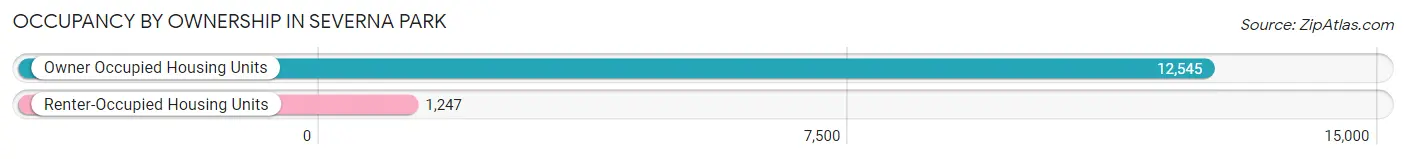
| Occupancy | # Housing Units | % Housing Units |
| Owner Occupied Housing Units | 12,545 | 91.0% |
| Renter-Occupied Housing Units | 1,247 | 9.0% |
| Total Occupied Housing Units | 13,792 | 100.0% |
Occupancy by Household Size in Severna Park
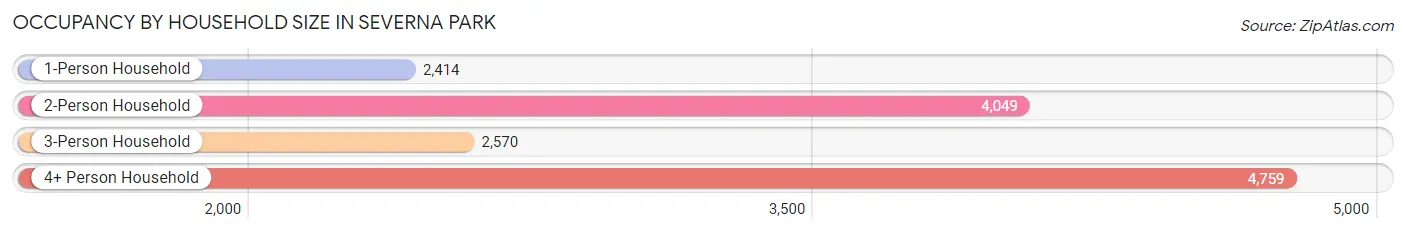
| Household Size | # Housing Units | % Housing Units |
| 1-Person Household | 2,414 | 17.5% |
| 2-Person Household | 4,049 | 29.4% |
| 3-Person Household | 2,570 | 18.6% |
| 4+ Person Household | 4,759 | 34.5% |
| Total Housing Units | 13,792 | 100.0% |
Occupancy by Ownership by Household Size in Severna Park
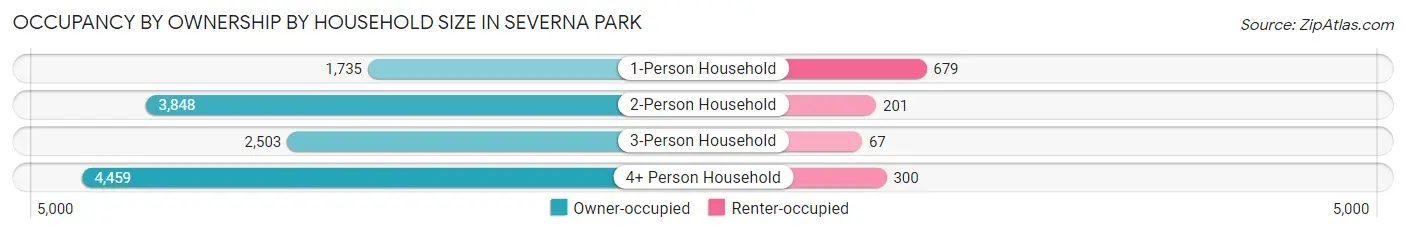
| Household Size | Owner-occupied | Renter-occupied |
| 1-Person Household | 1,735 (71.9%) | 679 (28.1%) |
| 2-Person Household | 3,848 (95.0%) | 201 (5.0%) |
| 3-Person Household | 2,503 (97.4%) | 67 (2.6%) |
| 4+ Person Household | 4,459 (93.7%) | 300 (6.3%) |
| Total Housing Units | 12,545 (91.0%) | 1,247 (9.0%) |
Occupancy by Educational Attainment in Severna Park
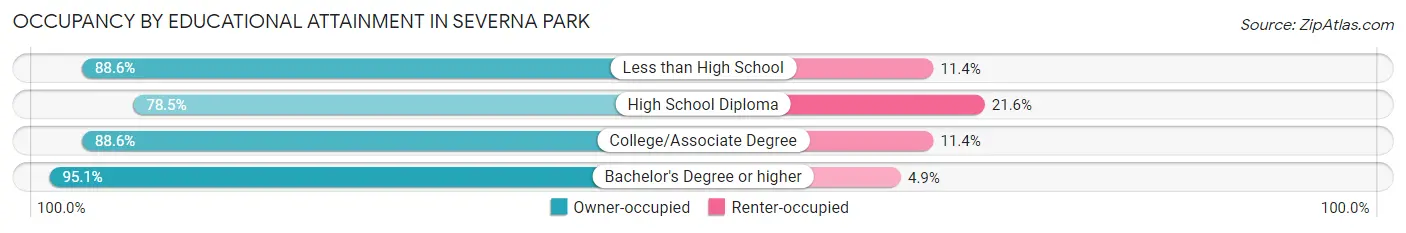
| Household Size | Owner-occupied | Renter-occupied |
| Less than High School | 382 (88.6%) | 49 (11.4%) |
| High School Diploma | 1,700 (78.4%) | 467 (21.5%) |
| College/Associate Degree | 2,464 (88.6%) | 316 (11.4%) |
| Bachelor's Degree or higher | 7,999 (95.1%) | 415 (4.9%) |
Occupancy by Age of Householder in Severna Park
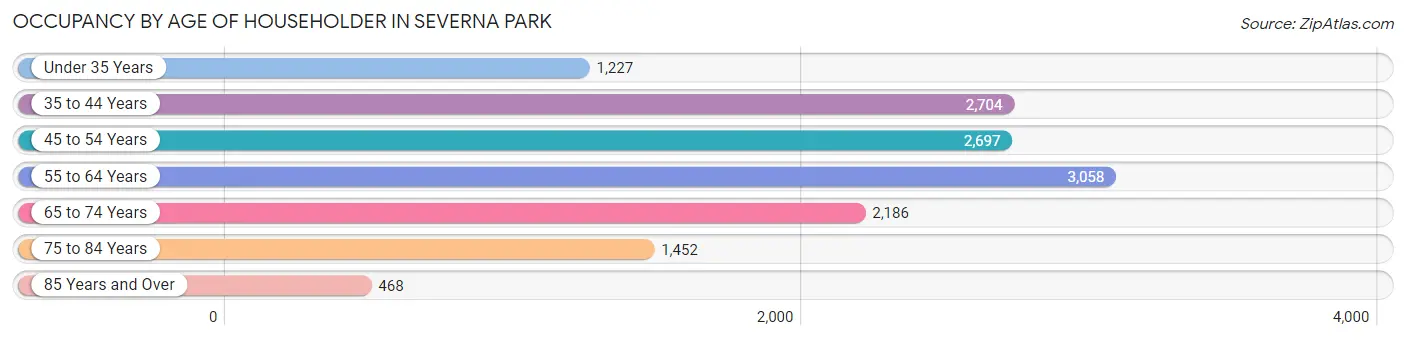
| Age Bracket | # Households | % Households |
| Under 35 Years | 1,227 | 8.9% |
| 35 to 44 Years | 2,704 | 19.6% |
| 45 to 54 Years | 2,697 | 19.6% |
| 55 to 64 Years | 3,058 | 22.2% |
| 65 to 74 Years | 2,186 | 15.9% |
| 75 to 84 Years | 1,452 | 10.5% |
| 85 Years and Over | 468 | 3.4% |
| Total | 13,792 | 100.0% |
Housing Finances in Severna Park
Median Income by Occupancy in Severna Park
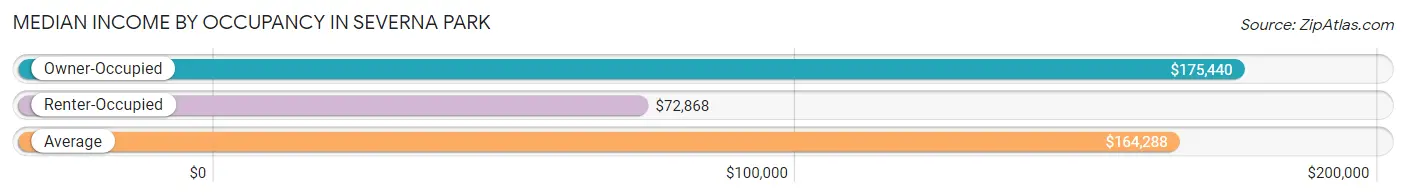
| Occupancy Type | # Households | Median Income |
| Owner-Occupied | 12,545 (91.0%) | $175,440 |
| Renter-Occupied | 1,247 (9.0%) | $72,868 |
| Average | 13,792 (100.0%) | $164,288 |
Occupancy by Householder Income Bracket in Severna Park
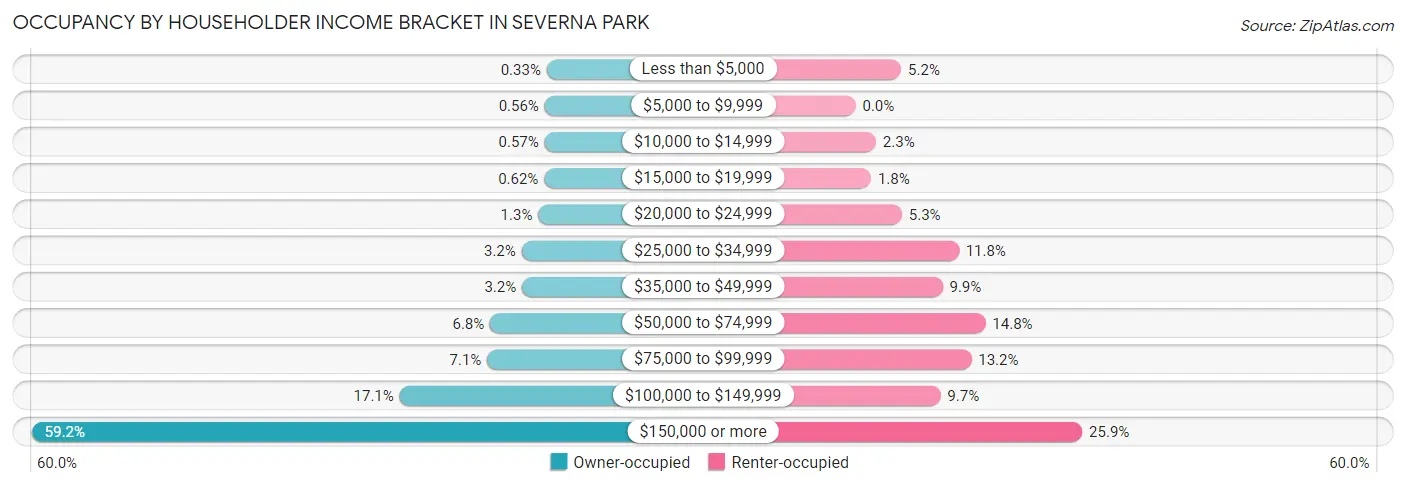
| Income Bracket | Owner-occupied | Renter-occupied |
| Less than $5,000 | 41 (0.3%) | 65 (5.2%) |
| $5,000 to $9,999 | 70 (0.6%) | 0 (0.0%) |
| $10,000 to $14,999 | 72 (0.6%) | 29 (2.3%) |
| $15,000 to $19,999 | 78 (0.6%) | 22 (1.8%) |
| $20,000 to $24,999 | 163 (1.3%) | 66 (5.3%) |
| $25,000 to $34,999 | 402 (3.2%) | 147 (11.8%) |
| $35,000 to $49,999 | 395 (3.2%) | 124 (9.9%) |
| $50,000 to $74,999 | 853 (6.8%) | 185 (14.8%) |
| $75,000 to $99,999 | 895 (7.1%) | 165 (13.2%) |
| $100,000 to $149,999 | 2,150 (17.1%) | 121 (9.7%) |
| $150,000 or more | 7,426 (59.2%) | 323 (25.9%) |
| Total | 12,545 (100.0%) | 1,247 (100.0%) |
Monthly Housing Cost Tiers in Severna Park
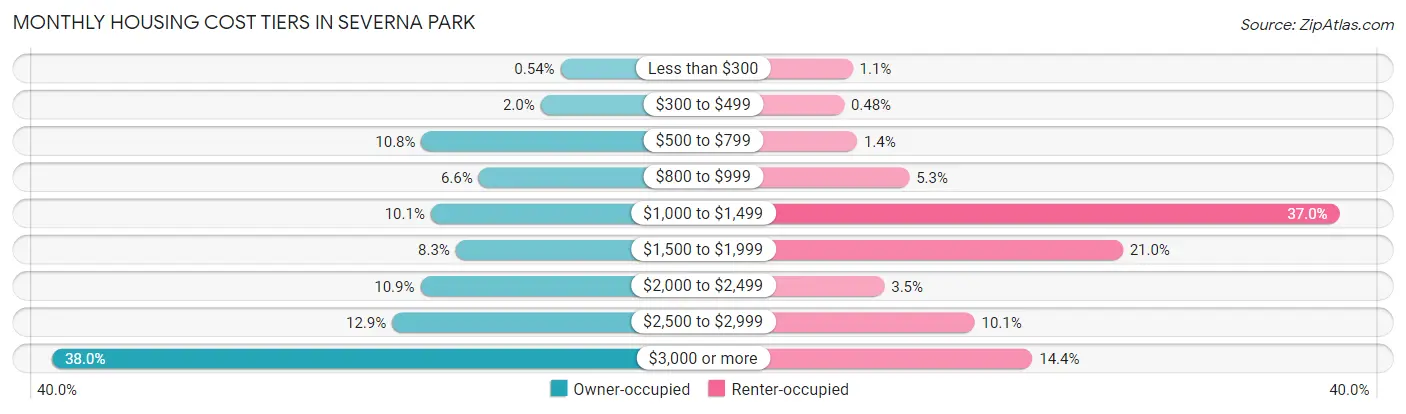
| Monthly Cost | Owner-occupied | Renter-occupied |
| Less than $300 | 68 (0.5%) | 14 (1.1%) |
| $300 to $499 | 251 (2.0%) | 6 (0.5%) |
| $500 to $799 | 1,352 (10.8%) | 18 (1.4%) |
| $800 to $999 | 824 (6.6%) | 66 (5.3%) |
| $1,000 to $1,499 | 1,266 (10.1%) | 461 (37.0%) |
| $1,500 to $1,999 | 1,035 (8.3%) | 262 (21.0%) |
| $2,000 to $2,499 | 1,362 (10.9%) | 43 (3.5%) |
| $2,500 to $2,999 | 1,623 (12.9%) | 126 (10.1%) |
| $3,000 or more | 4,764 (38.0%) | 179 (14.3%) |
| Total | 12,545 (100.0%) | 1,247 (100.0%) |
Physical Housing Characteristics in Severna Park
Housing Structures in Severna Park
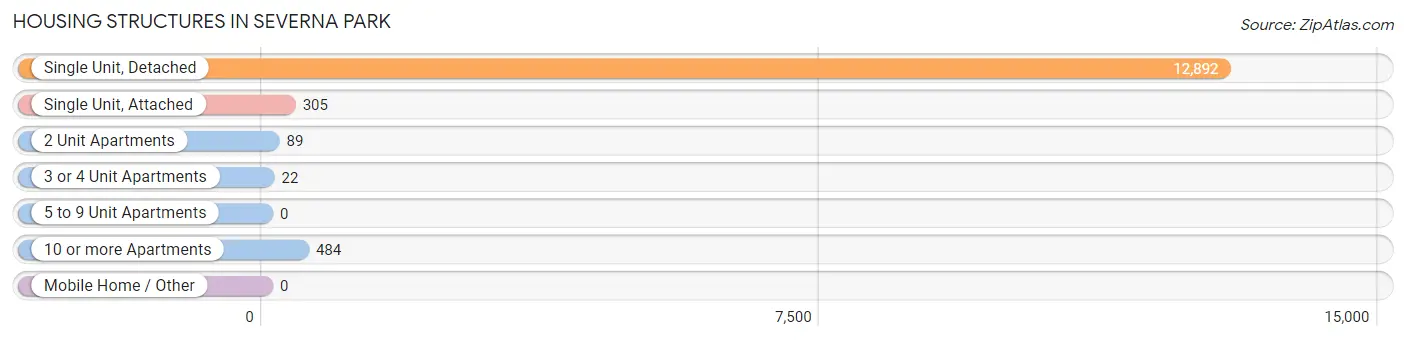
| Structure Type | # Housing Units | % Housing Units |
| Single Unit, Detached | 12,892 | 93.5% |
| Single Unit, Attached | 305 | 2.2% |
| 2 Unit Apartments | 89 | 0.6% |
| 3 or 4 Unit Apartments | 22 | 0.2% |
| 5 to 9 Unit Apartments | 0 | 0.0% |
| 10 or more Apartments | 484 | 3.5% |
| Mobile Home / Other | 0 | 0.0% |
| Total | 13,792 | 100.0% |
Housing Structures by Occupancy in Severna Park
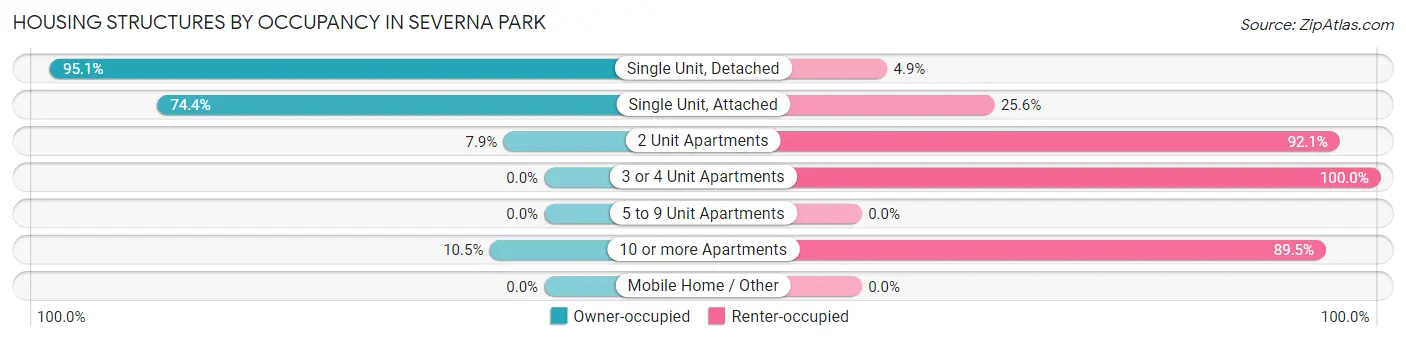
| Structure Type | Owner-occupied | Renter-occupied |
| Single Unit, Detached | 12,260 (95.1%) | 632 (4.9%) |
| Single Unit, Attached | 227 (74.4%) | 78 (25.6%) |
| 2 Unit Apartments | 7 (7.9%) | 82 (92.1%) |
| 3 or 4 Unit Apartments | 0 (0.0%) | 22 (100.0%) |
| 5 to 9 Unit Apartments | 0 (0.0%) | 0 (0.0%) |
| 10 or more Apartments | 51 (10.5%) | 433 (89.5%) |
| Mobile Home / Other | 0 (0.0%) | 0 (0.0%) |
| Total | 12,545 (91.0%) | 1,247 (9.0%) |
Housing Structures by Number of Rooms in Severna Park
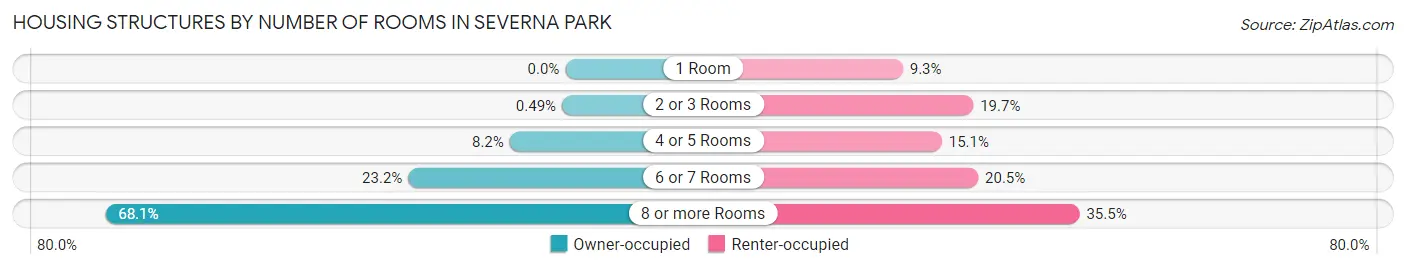
| Number of Rooms | Owner-occupied | Renter-occupied |
| 1 Room | 0 (0.0%) | 116 (9.3%) |
| 2 or 3 Rooms | 61 (0.5%) | 246 (19.7%) |
| 4 or 5 Rooms | 1,032 (8.2%) | 188 (15.1%) |
| 6 or 7 Rooms | 2,915 (23.2%) | 255 (20.4%) |
| 8 or more Rooms | 8,537 (68.0%) | 442 (35.4%) |
| Total | 12,545 (100.0%) | 1,247 (100.0%) |
Housing Structure by Heating Type in Severna Park
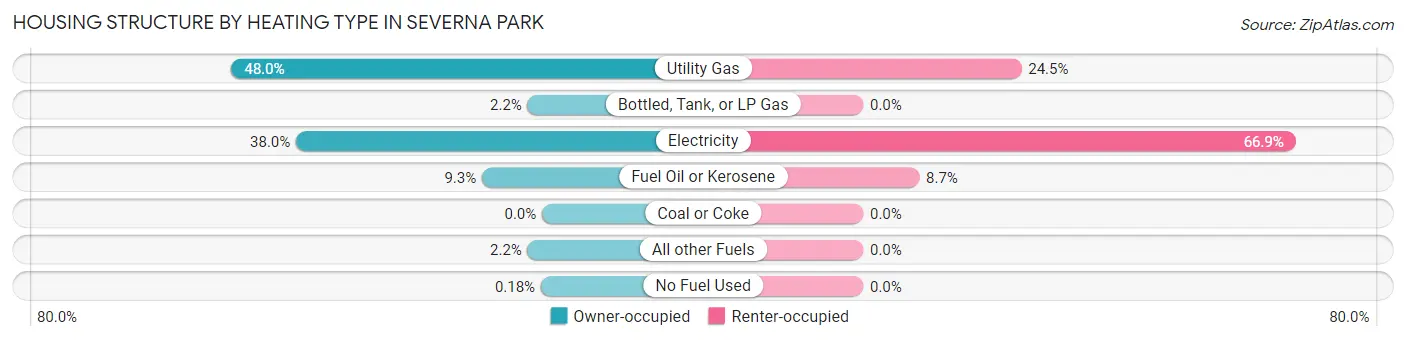
| Heating Type | Owner-occupied | Renter-occupied |
| Utility Gas | 6,026 (48.0%) | 305 (24.5%) |
| Bottled, Tank, or LP Gas | 280 (2.2%) | 0 (0.0%) |
| Electricity | 4,771 (38.0%) | 834 (66.9%) |
| Fuel Oil or Kerosene | 1,165 (9.3%) | 108 (8.7%) |
| Coal or Coke | 0 (0.0%) | 0 (0.0%) |
| All other Fuels | 280 (2.2%) | 0 (0.0%) |
| No Fuel Used | 23 (0.2%) | 0 (0.0%) |
| Total | 12,545 (100.0%) | 1,247 (100.0%) |
Household Vehicle Usage in Severna Park
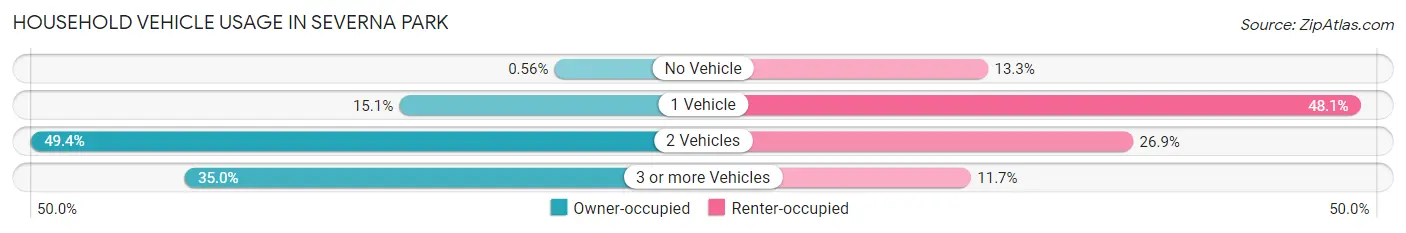
| Vehicles per Household | Owner-occupied | Renter-occupied |
| No Vehicle | 70 (0.6%) | 166 (13.3%) |
| 1 Vehicle | 1,888 (15.0%) | 600 (48.1%) |
| 2 Vehicles | 6,195 (49.4%) | 335 (26.9%) |
| 3 or more Vehicles | 4,392 (35.0%) | 146 (11.7%) |
| Total | 12,545 (100.0%) | 1,247 (100.0%) |
Real Estate & Mortgages in Severna Park
Real Estate and Mortgage Overview in Severna Park
| Characteristic | Without Mortgage | With Mortgage |
| Housing Units | 3,152 | 9,393 |
| Median Property Value | $598,300 | $617,300 |
| Median Household Income | $116,100 | $6,186 |
| Monthly Housing Costs | $806 | $4,738 |
| Real Estate Taxes | $4,365 | $104 |
Property Value by Mortgage Status in Severna Park
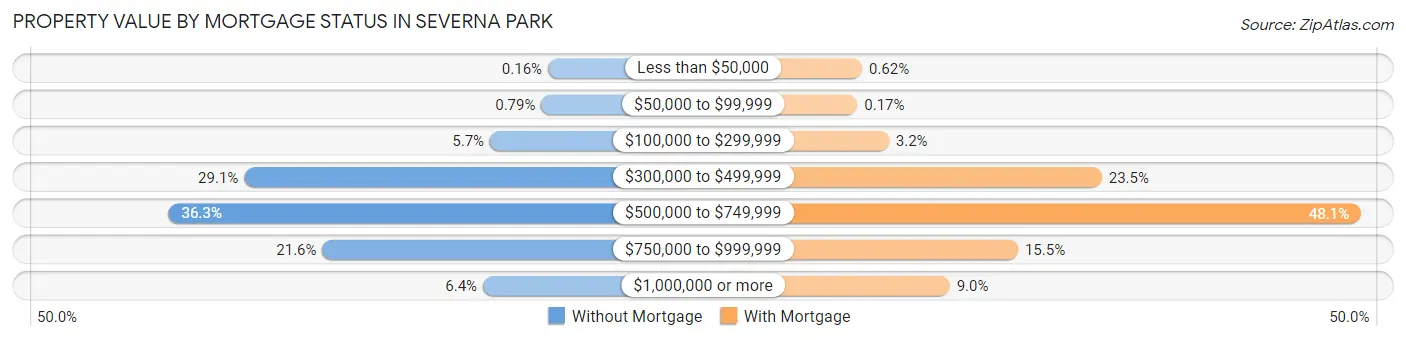
| Property Value | Without Mortgage | With Mortgage |
| Less than $50,000 | 5 (0.2%) | 58 (0.6%) |
| $50,000 to $99,999 | 25 (0.8%) | 16 (0.2%) |
| $100,000 to $299,999 | 179 (5.7%) | 298 (3.2%) |
| $300,000 to $499,999 | 917 (29.1%) | 2,203 (23.4%) |
| $500,000 to $749,999 | 1,144 (36.3%) | 4,522 (48.1%) |
| $750,000 to $999,999 | 682 (21.6%) | 1,453 (15.5%) |
| $1,000,000 or more | 200 (6.4%) | 843 (9.0%) |
| Total | 3,152 (100.0%) | 9,393 (100.0%) |
Household Income by Mortgage Status in Severna Park
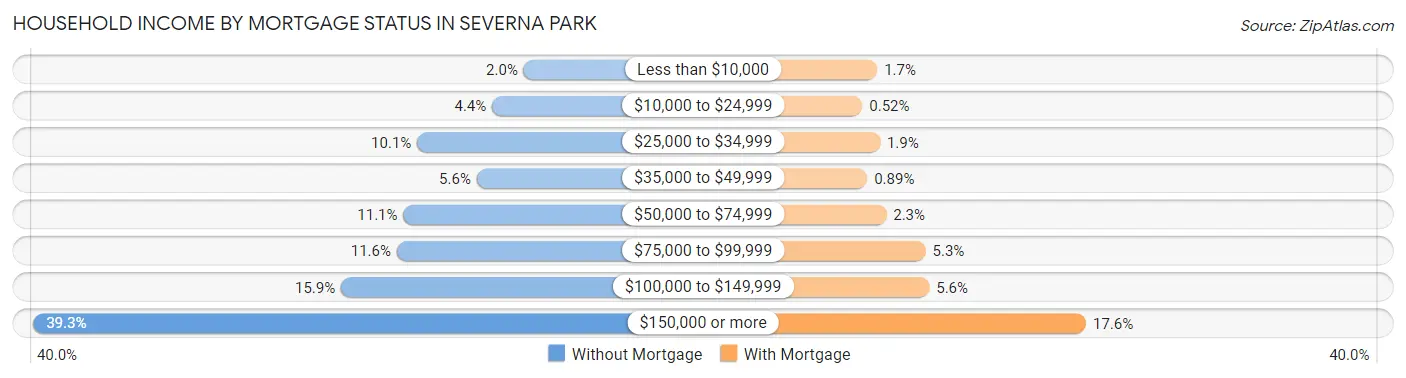
| Household Income | Without Mortgage | With Mortgage |
| Less than $10,000 | 62 (2.0%) | 155 (1.7%) |
| $10,000 to $24,999 | 138 (4.4%) | 49 (0.5%) |
| $25,000 to $34,999 | 318 (10.1%) | 175 (1.9%) |
| $35,000 to $49,999 | 175 (5.6%) | 84 (0.9%) |
| $50,000 to $74,999 | 351 (11.1%) | 220 (2.3%) |
| $75,000 to $99,999 | 367 (11.6%) | 502 (5.3%) |
| $100,000 to $149,999 | 501 (15.9%) | 528 (5.6%) |
| $150,000 or more | 1,240 (39.3%) | 1,649 (17.6%) |
| Total | 3,152 (100.0%) | 9,393 (100.0%) |
Property Value to Household Income Ratio in Severna Park
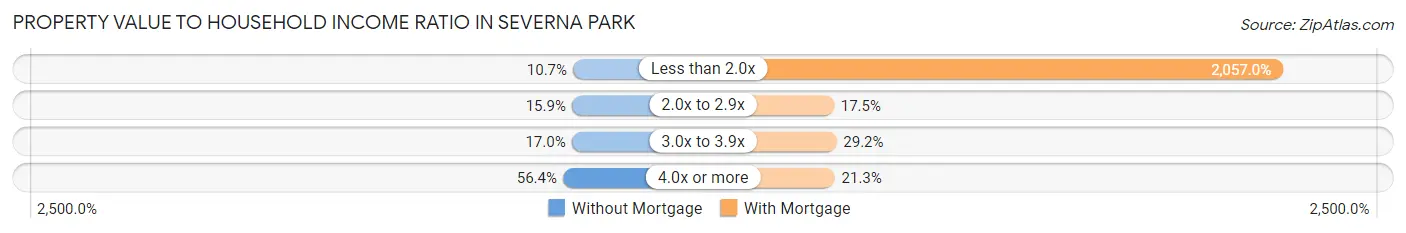
| Value-to-Income Ratio | Without Mortgage | With Mortgage |
| Less than 2.0x | 338 (10.7%) | 193,212 (2,057.0%) |
| 2.0x to 2.9x | 502 (15.9%) | 1,643 (17.5%) |
| 3.0x to 3.9x | 536 (17.0%) | 2,746 (29.2%) |
| 4.0x or more | 1,776 (56.4%) | 1,996 (21.2%) |
| Total | 3,152 (100.0%) | 9,393 (100.0%) |
Real Estate Taxes by Mortgage Status in Severna Park
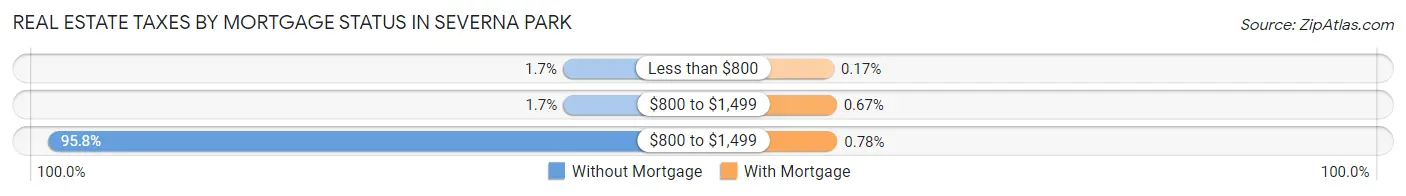
| Property Taxes | Without Mortgage | With Mortgage |
| Less than $800 | 54 (1.7%) | 16 (0.2%) |
| $800 to $1,499 | 52 (1.7%) | 63 (0.7%) |
| $800 to $1,499 | 3,018 (95.8%) | 73 (0.8%) |
| Total | 3,152 (100.0%) | 9,393 (100.0%) |
Health & Disability in Severna Park
Health Insurance Coverage by Age in Severna Park
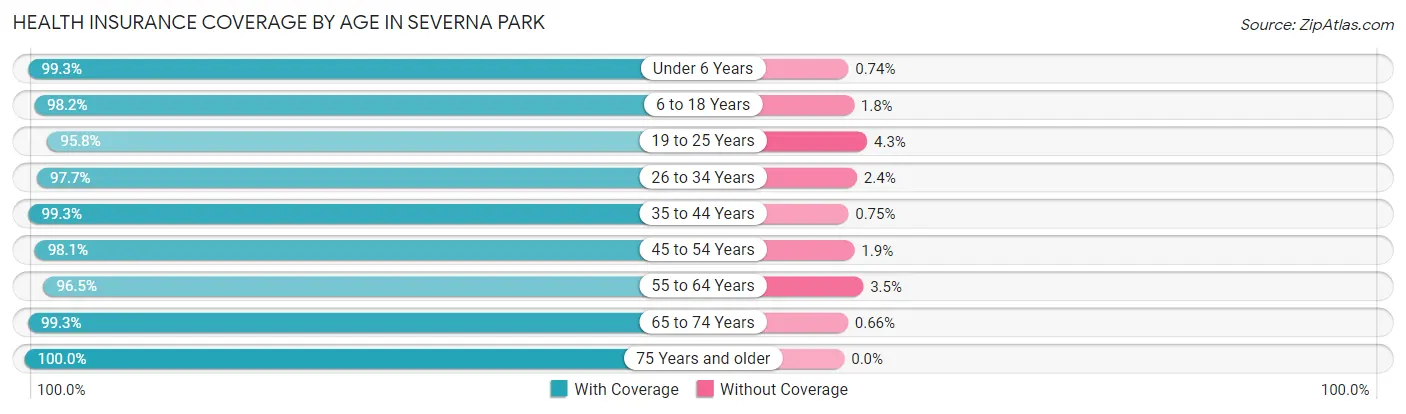
| Age Bracket | With Coverage | Without Coverage |
| Under 6 Years | 3,097 (99.3%) | 23 (0.7%) |
| 6 to 18 Years | 8,044 (98.2%) | 146 (1.8%) |
| 19 to 25 Years | 2,120 (95.8%) | 94 (4.3%) |
| 26 to 34 Years | 3,072 (97.7%) | 74 (2.4%) |
| 35 to 44 Years | 5,169 (99.3%) | 39 (0.7%) |
| 45 to 54 Years | 5,191 (98.1%) | 100 (1.9%) |
| 55 to 64 Years | 6,059 (96.5%) | 222 (3.5%) |
| 65 to 74 Years | 3,606 (99.3%) | 24 (0.7%) |
| 75 Years and older | 2,805 (100.0%) | 0 (0.0%) |
| Total | 39,163 (98.2%) | 722 (1.8%) |
Health Insurance Coverage by Citizenship Status in Severna Park
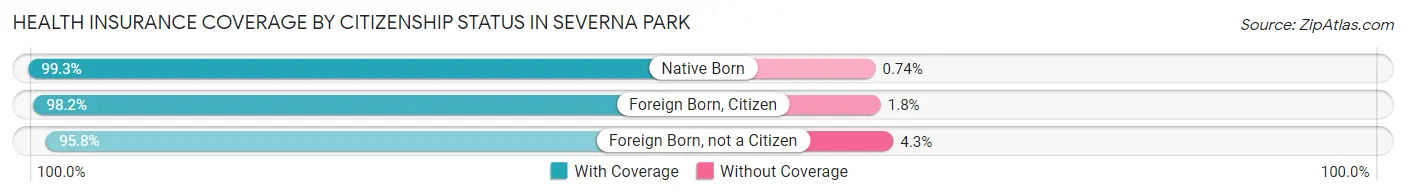
| Citizenship Status | With Coverage | Without Coverage |
| Native Born | 3,097 (99.3%) | 23 (0.7%) |
| Foreign Born, Citizen | 8,044 (98.2%) | 146 (1.8%) |
| Foreign Born, not a Citizen | 2,120 (95.8%) | 94 (4.3%) |
Health Insurance Coverage by Household Income in Severna Park
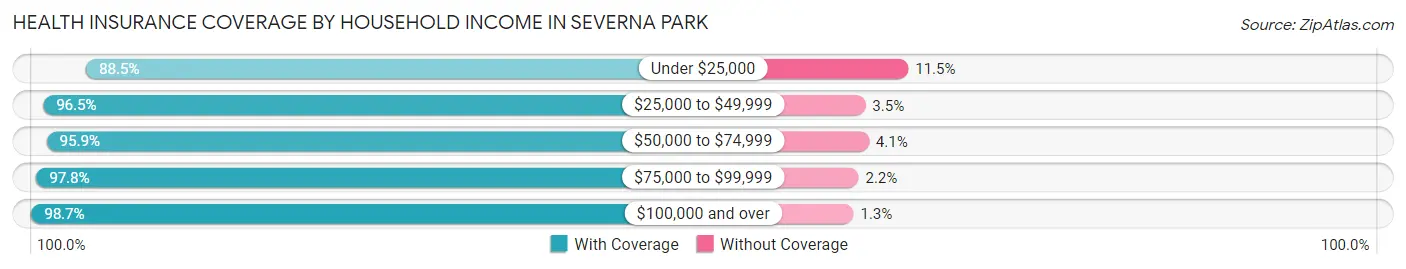
| Household Income | With Coverage | Without Coverage |
| Under $25,000 | 844 (88.5%) | 110 (11.5%) |
| $25,000 to $49,999 | 2,020 (96.5%) | 73 (3.5%) |
| $50,000 to $74,999 | 1,807 (95.9%) | 78 (4.1%) |
| $75,000 to $99,999 | 2,045 (97.8%) | 46 (2.2%) |
| $100,000 and over | 32,362 (98.7%) | 413 (1.3%) |
Public vs Private Health Insurance Coverage by Age in Severna Park
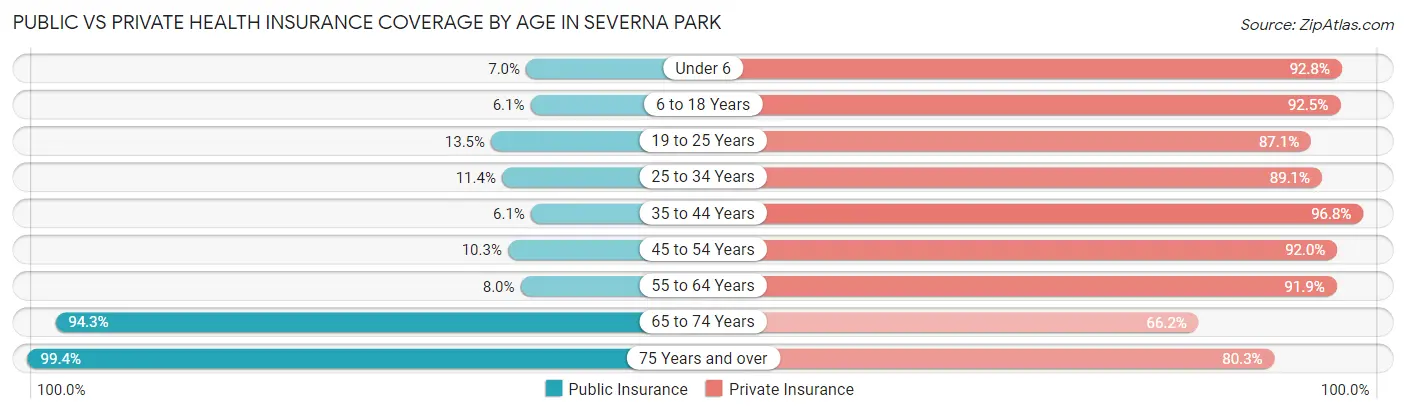
| Age Bracket | Public Insurance | Private Insurance |
| Under 6 | 217 (7.0%) | 2,895 (92.8%) |
| 6 to 18 Years | 503 (6.1%) | 7,573 (92.5%) |
| 19 to 25 Years | 298 (13.5%) | 1,928 (87.1%) |
| 25 to 34 Years | 360 (11.4%) | 2,803 (89.1%) |
| 35 to 44 Years | 316 (6.1%) | 5,040 (96.8%) |
| 45 to 54 Years | 546 (10.3%) | 4,865 (91.9%) |
| 55 to 64 Years | 501 (8.0%) | 5,769 (91.8%) |
| 65 to 74 Years | 3,423 (94.3%) | 2,404 (66.2%) |
| 75 Years and over | 2,789 (99.4%) | 2,252 (80.3%) |
| Total | 8,953 (22.5%) | 35,529 (89.1%) |
Disability Status by Sex by Age in Severna Park
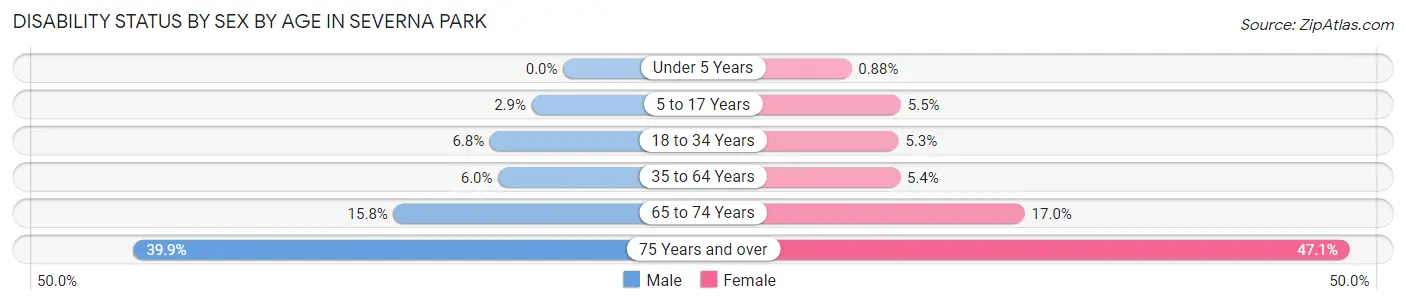
| Age Bracket | Male | Female |
| Under 5 Years | 0 (0.0%) | 11 (0.9%) |
| 5 to 17 Years | 118 (2.9%) | 216 (5.5%) |
| 18 to 34 Years | 213 (6.8%) | 147 (5.3%) |
| 35 to 64 Years | 510 (6.0%) | 449 (5.4%) |
| 65 to 74 Years | 259 (15.8%) | 337 (17.0%) |
| 75 Years and over | 458 (39.9%) | 781 (47.1%) |
Disability Class by Sex by Age in Severna Park
Disability Class: Hearing Difficulty
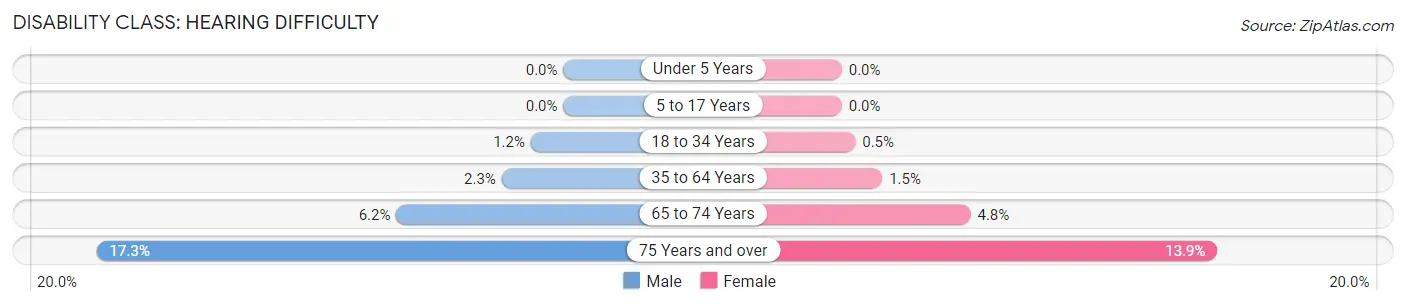
| Age Bracket | Male | Female |
| Under 5 Years | 0 (0.0%) | 0 (0.0%) |
| 5 to 17 Years | 0 (0.0%) | 0 (0.0%) |
| 18 to 34 Years | 38 (1.2%) | 14 (0.5%) |
| 35 to 64 Years | 194 (2.3%) | 125 (1.5%) |
| 65 to 74 Years | 102 (6.2%) | 95 (4.8%) |
| 75 Years and over | 199 (17.3%) | 231 (13.9%) |
Disability Class: Vision Difficulty
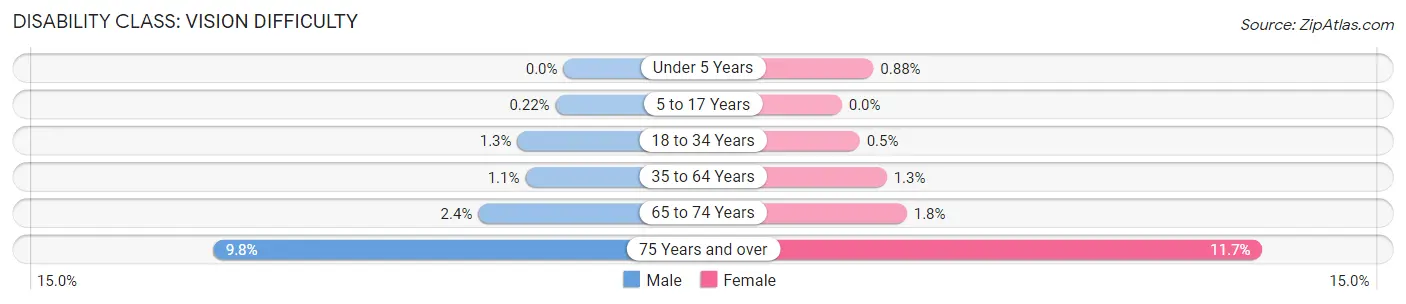
| Age Bracket | Male | Female |
| Under 5 Years | 0 (0.0%) | 11 (0.9%) |
| 5 to 17 Years | 9 (0.2%) | 0 (0.0%) |
| 18 to 34 Years | 40 (1.3%) | 14 (0.5%) |
| 35 to 64 Years | 90 (1.1%) | 104 (1.3%) |
| 65 to 74 Years | 39 (2.4%) | 36 (1.8%) |
| 75 Years and over | 112 (9.8%) | 194 (11.7%) |
Disability Class: Cognitive Difficulty
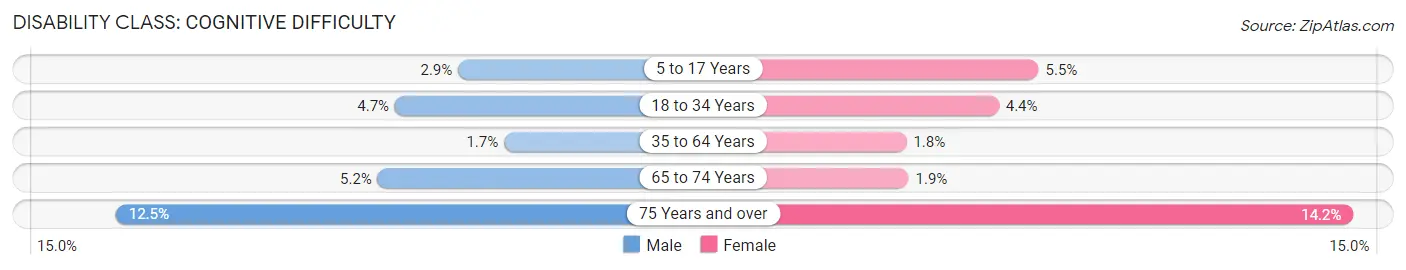
| Age Bracket | Male | Female |
| 5 to 17 Years | 118 (2.9%) | 216 (5.5%) |
| 18 to 34 Years | 147 (4.7%) | 122 (4.4%) |
| 35 to 64 Years | 140 (1.7%) | 150 (1.8%) |
| 65 to 74 Years | 85 (5.2%) | 37 (1.9%) |
| 75 Years and over | 143 (12.5%) | 236 (14.2%) |
Disability Class: Ambulatory Difficulty
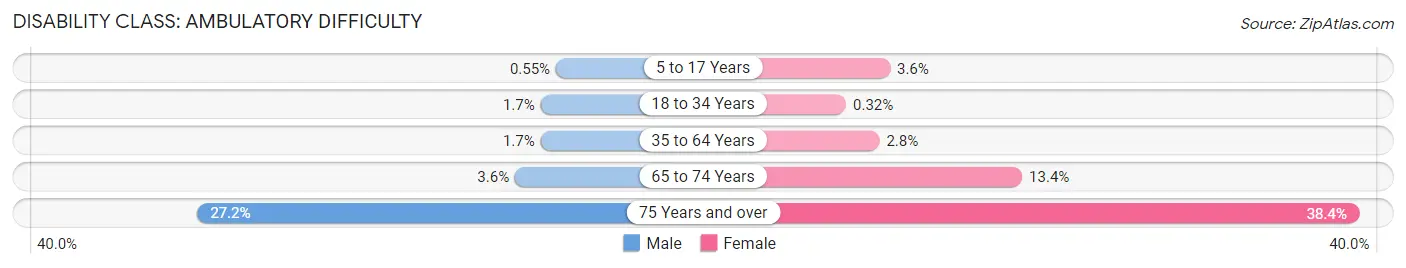
| Age Bracket | Male | Female |
| 5 to 17 Years | 22 (0.5%) | 141 (3.6%) |
| 18 to 34 Years | 53 (1.7%) | 9 (0.3%) |
| 35 to 64 Years | 143 (1.7%) | 233 (2.8%) |
| 65 to 74 Years | 59 (3.6%) | 266 (13.4%) |
| 75 Years and over | 312 (27.2%) | 636 (38.4%) |
Disability Class: Self-Care Difficulty
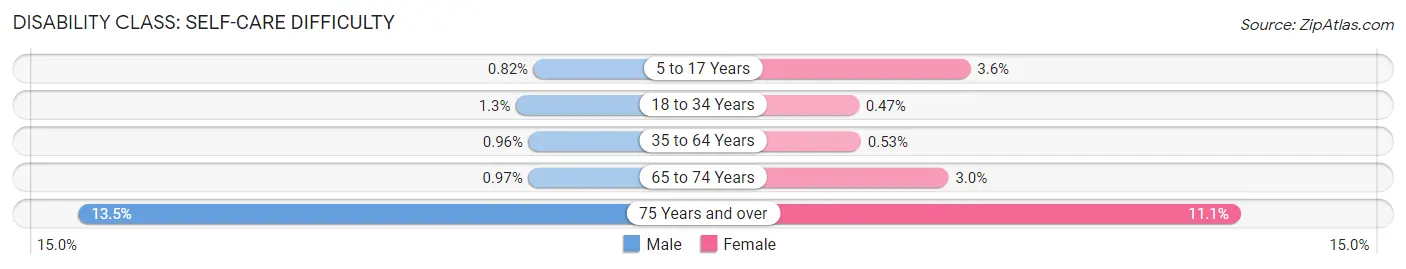
| Age Bracket | Male | Female |
| 5 to 17 Years | 33 (0.8%) | 141 (3.6%) |
| 18 to 34 Years | 41 (1.3%) | 13 (0.5%) |
| 35 to 64 Years | 81 (1.0%) | 44 (0.5%) |
| 65 to 74 Years | 16 (1.0%) | 59 (3.0%) |
| 75 Years and over | 155 (13.5%) | 184 (11.1%) |
Technology Access in Severna Park
Computing Device Access in Severna Park
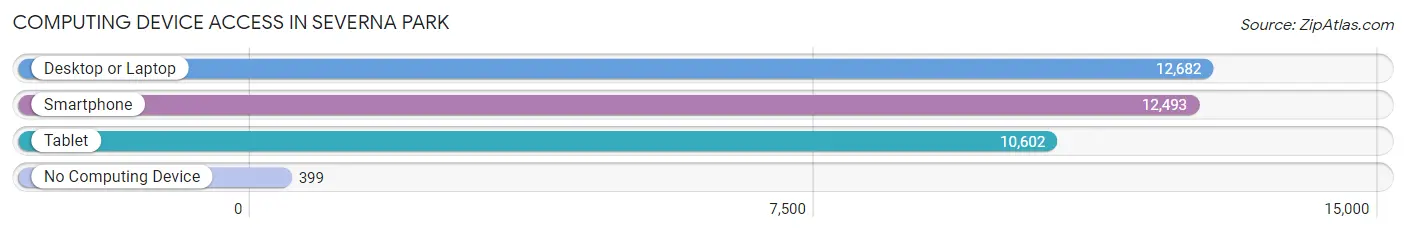
| Device Type | # Households | % Households |
| Desktop or Laptop | 12,682 | 91.9% |
| Smartphone | 12,493 | 90.6% |
| Tablet | 10,602 | 76.9% |
| No Computing Device | 399 | 2.9% |
| Total | 13,792 | 100.0% |
Internet Access in Severna Park
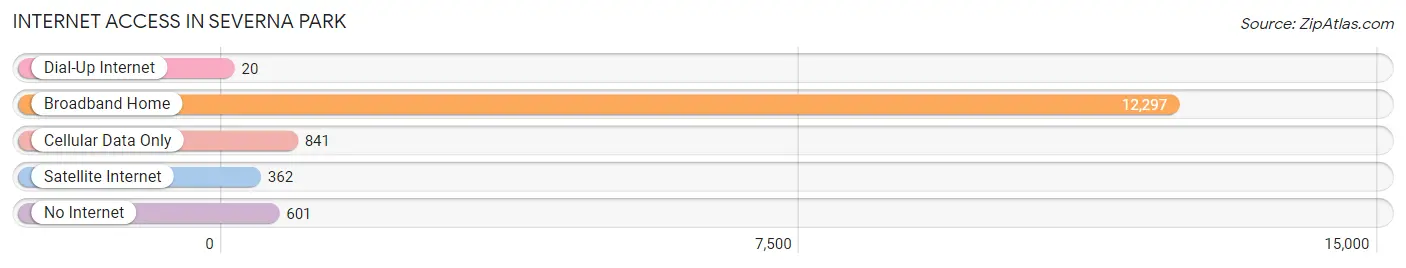
| Internet Type | # Households | % Households |
| Dial-Up Internet | 20 | 0.2% |
| Broadband Home | 12,297 | 89.2% |
| Cellular Data Only | 841 | 6.1% |
| Satellite Internet | 362 | 2.6% |
| No Internet | 601 | 4.4% |
| Total | 13,792 | 100.0% |
Severna Park Summary
Severna Park is a census-designated place (CDP) located in Anne Arundel County, Maryland, United States. It is a suburb of Baltimore and Washington, D.C. and is located approximately 8 miles (13 km) north of Annapolis. As of the 2010 census, the population of Severna Park was 37,634.
History
The area now known as Severna Park was originally inhabited by the Piscataway Indians. The first European settlers arrived in the area in the late 1600s. The area was originally known as “Bacon Ridge”, named after the Bacon family who owned much of the land in the area. In the late 1800s, the area was renamed “Severna Park” after the Severn River, which runs through the area.
In the early 1900s, the area began to develop as a residential community. The first homes were built in the area in the 1920s. The area continued to grow throughout the 20th century, and by the 2000s, Severna Park had become a popular suburb of Baltimore and Washington, D.C.
Geography
Severna Park is located at 39°5′17″N 76°33′17″W (39.0879, -76.5548). It is situated on the western shore of the Chesapeake Bay, approximately 8 miles (13 km) north of Annapolis. The area is bordered by Pasadena to the north, Arnold to the east, and Glen Burnie to the south.
The area is mostly flat, with an elevation of approximately 20 feet (6 m). The climate is humid subtropical, with hot, humid summers and mild winters.
Economy
Severna Park is a primarily residential community, with a few small businesses located in the area. The largest employers in the area are Anne Arundel County Public Schools, Anne Arundel Medical Center, and the U.S. Naval Academy.
Demographics
As of the 2010 census, there were 37,634 people, 14,945 households, and 10,845 families residing in Severna Park. The population density was 2,845.3 people per square mile (1,098.7/km2). The racial makeup of the CDP was 90.2% White, 4.2% African American, 0.3% Native American, 2.7% Asian, 0.1% Pacific Islander, 0.9% from other races, and 1.6% from two or more races. Hispanic or Latino of any race were 3.2% of the population.
The median income for a household in the CDP was $95,844, and the median income for a family was $106,917. Males had a median income of $71,945 versus $50,817 for females. The per capita income for the CDP was $41,945. About 2.2% of families and 3.2% of the population were below the poverty line, including 3.7% of those under age 18 and 3.2% of those age 65 or over.
Common Questions
What is Per Capita Income in Severna Park?
Per Capita income in Severna Park is $71,112.
What is the Median Family Income in Severna Park?
Median Family Income in Severna Park is $196,362.
What is the Median Household income in Severna Park?
Median Household Income in Severna Park is $164,288.
What is Income or Wage Gap in Severna Park?
Income or Wage Gap in Severna Park is 40.5%.
Women in Severna Park earn 59.5 cents for every dollar earned by a man.
What is Inequality or Gini Index in Severna Park?
Inequality or Gini Index in Severna Park is 0.42.
What is the Total Population of Severna Park?
Total Population of Severna Park is 40,452.
What is the Total Male Population of Severna Park?
Total Male Population of Severna Park is 20,311.
What is the Total Female Population of Severna Park?
Total Female Population of Severna Park is 20,141.
What is the Ratio of Males per 100 Females in Severna Park?
There are 100.84 Males per 100 Females in Severna Park.
What is the Ratio of Females per 100 Males in Severna Park?
There are 99.16 Females per 100 Males in Severna Park.
What is the Median Population Age in Severna Park?
Median Population Age in Severna Park is 41.5 Years.
What is the Average Family Size in Severna Park
Average Family Size in Severna Park is 3.3 People.
What is the Average Household Size in Severna Park
Average Household Size in Severna Park is 2.9 People.
How Large is the Labor Force in Severna Park?
There are 20,947 People in the Labor Forcein in Severna Park.
What is the Percentage of People in the Labor Force in Severna Park?
67.6% of People are in the Labor Force in Severna Park.
What is the Unemployment Rate in Severna Park?
Unemployment Rate in Severna Park is 2.9%.