Myersville, MD Map & Demographics
Myersville Map
Myersville Overview
$45,183
PER CAPITA INCOME
$145,500
AVG FAMILY INCOME
$140,048
AVG HOUSEHOLD INCOME
52.6%
WAGE / INCOME GAP [ % ]
47.4¢/ $1
WAGE / INCOME GAP [ $ ]
0.30
INEQUALITY / GINI INDEX
2,493
TOTAL POPULATION
1,081
MALE POPULATION
1,412
FEMALE POPULATION
76.56
MALES / 100 FEMALES
130.62
FEMALES / 100 MALES
33.3
MEDIAN AGE
4.0
AVG FAMILY SIZE
3.7
AVG HOUSEHOLD SIZE
1,162
LABOR FORCE [ PEOPLE ]
71.8%
PERCENT IN LABOR FORCE
Myersville Zip Codes
Income in Myersville
Income Overview in Myersville
Per Capita Income in Myersville is $45,183, while median incomes of families and households are $145,500 and $140,048 respectively.
| Characteristic | Number | Measure |
| Per Capita Income | 2,493 | $45,183 |
| Median Family Income | 584 | $145,500 |
| Mean Family Income | 584 | $169,966 |
| Median Household Income | 679 | $140,048 |
| Mean Household Income | 679 | $161,369 |
| Income Deficit | 584 | $0 |
| Wage / Income Gap (%) | 2,493 | 52.62% |
| Wage / Income Gap ($) | 2,493 | 47.38¢ per $1 |
| Gini / Inequality Index | 2,493 | 0.30 |
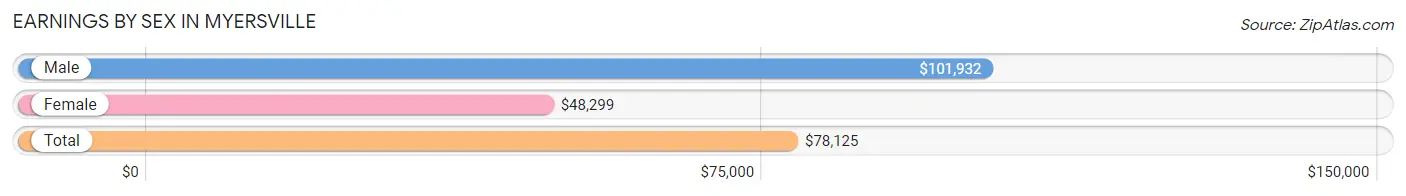
Earnings by Sex in Myersville
Average Earnings in Myersville are $78,125, $101,932 for men and $48,299 for women, a difference of 52.6%.
| Sex | Number | Average Earnings |
| Male | 700 (56.0%) | $101,932 |
| Female | 549 (44.0%) | $48,299 |
| Total | 1,249 (100.0%) | $78,125 |
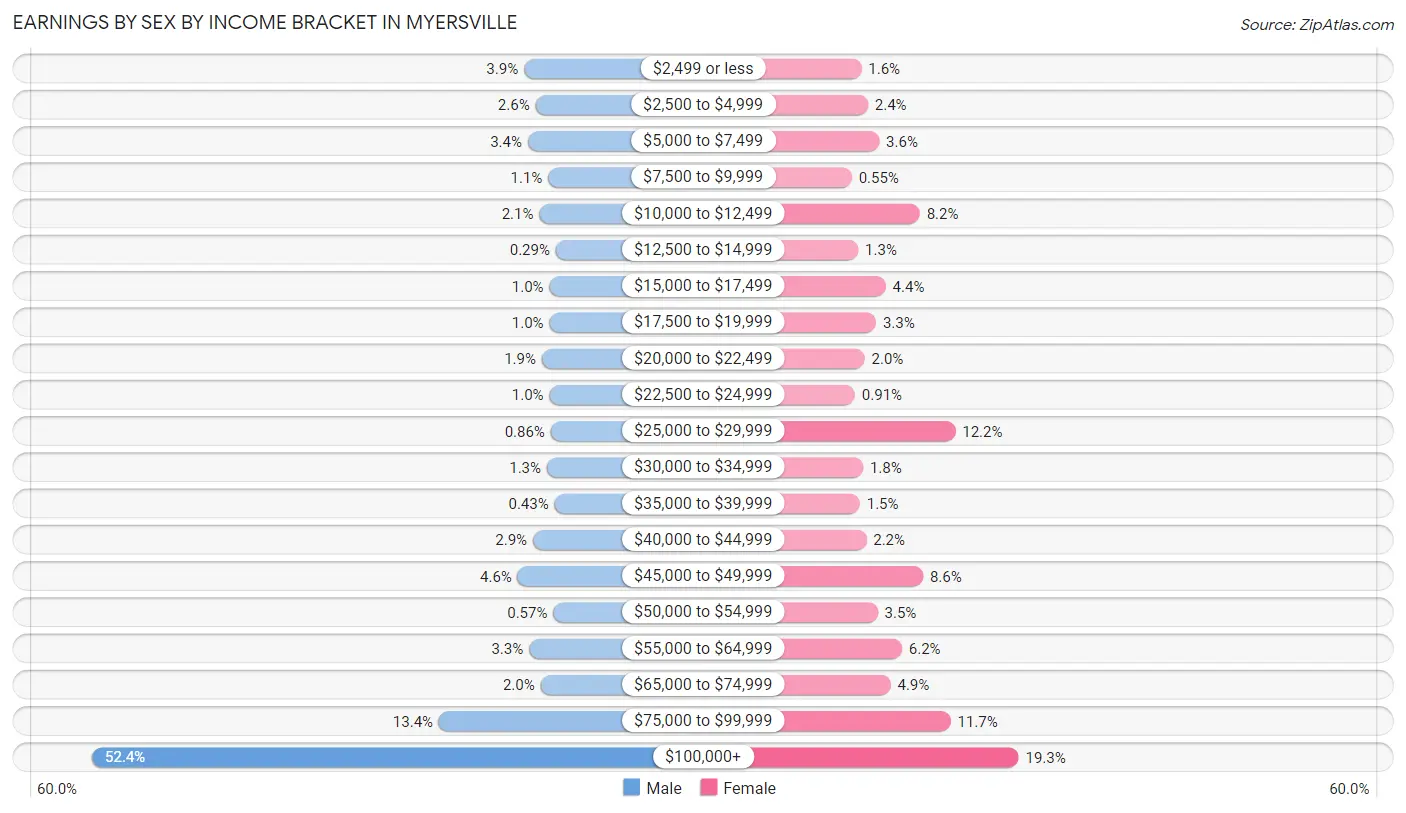
Earnings by Sex by Income Bracket in Myersville
The most common earnings brackets in Myersville are $100,000+ for men (367 | 52.4%) and $100,000+ for women (106 | 19.3%).
| Income | Male | Female |
| $2,499 or less | 27 (3.9%) | 9 (1.6%) |
| $2,500 to $4,999 | 18 (2.6%) | 13 (2.4%) |
| $5,000 to $7,499 | 24 (3.4%) | 20 (3.6%) |
| $7,500 to $9,999 | 8 (1.1%) | 3 (0.5%) |
| $10,000 to $12,499 | 15 (2.1%) | 45 (8.2%) |
| $12,500 to $14,999 | 2 (0.3%) | 7 (1.3%) |
| $15,000 to $17,499 | 7 (1.0%) | 24 (4.4%) |
| $17,500 to $19,999 | 7 (1.0%) | 18 (3.3%) |
| $20,000 to $22,499 | 13 (1.9%) | 11 (2.0%) |
| $22,500 to $24,999 | 7 (1.0%) | 5 (0.9%) |
| $25,000 to $29,999 | 6 (0.9%) | 67 (12.2%) |
| $30,000 to $34,999 | 9 (1.3%) | 10 (1.8%) |
| $35,000 to $39,999 | 3 (0.4%) | 8 (1.5%) |
| $40,000 to $44,999 | 20 (2.9%) | 12 (2.2%) |
| $45,000 to $49,999 | 32 (4.6%) | 47 (8.6%) |
| $50,000 to $54,999 | 4 (0.6%) | 19 (3.5%) |
| $55,000 to $64,999 | 23 (3.3%) | 34 (6.2%) |
| $65,000 to $74,999 | 14 (2.0%) | 27 (4.9%) |
| $75,000 to $99,999 | 94 (13.4%) | 64 (11.7%) |
| $100,000+ | 367 (52.4%) | 106 (19.3%) |
| Total | 700 (100.0%) | 549 (100.0%) |
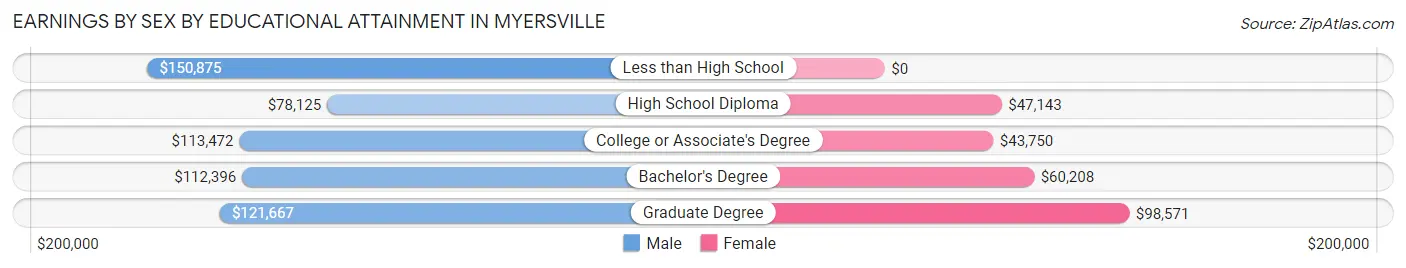
Earnings by Sex by Educational Attainment in Myersville
Average earnings in Myersville are $113,693 for men and $51,875 for women, a difference of 54.4%. Men with an educational attainment of less than high school enjoy the highest average annual earnings of $150,875, while those with high school diploma education earn the least with $78,125. Women with an educational attainment of graduate degree earn the most with the average annual earnings of $98,571, while those with college or associate's degree education have the smallest earnings of $43,750.
| Educational Attainment | Male Income | Female Income |
| Less than High School | $150,875 | $0 |
| High School Diploma | $78,125 | $47,143 |
| College or Associate's Degree | $113,472 | $43,750 |
| Bachelor's Degree | $112,396 | $60,208 |
| Graduate Degree | $121,667 | $98,571 |
| Total | $113,693 | $51,875 |
Family Income in Myersville
Family Income Brackets in Myersville
According to the Myersville family income data, there are 234 families falling into the $100,000 to $149,999 income range, which is the most common income bracket and makes up 40.1% of all families.
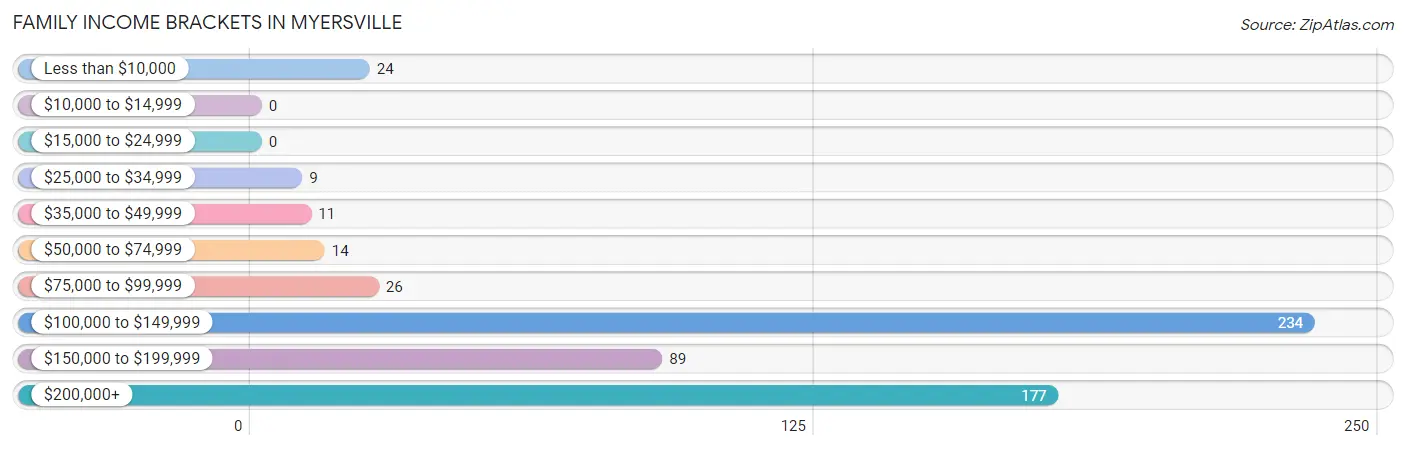
| Income Bracket | # Families | % Families |
| Less than $10,000 | 24 | 4.1% |
| $10,000 to $14,999 | 0 | 0.0% |
| $15,000 to $24,999 | 0 | 0.0% |
| $25,000 to $34,999 | 9 | 1.5% |
| $35,000 to $49,999 | 11 | 1.9% |
| $50,000 to $74,999 | 14 | 2.4% |
| $75,000 to $99,999 | 26 | 4.5% |
| $100,000 to $149,999 | 234 | 40.1% |
| $150,000 to $199,999 | 89 | 15.2% |
| $200,000+ | 177 | 30.3% |
Family Income by Famaliy Size in Myersville
4-person families (161 | 27.6%) account for the highest median family income in Myersville with $165,250 per family, while 2-person families (166 | 28.4%) have the highest median income of $60,062 per family member.
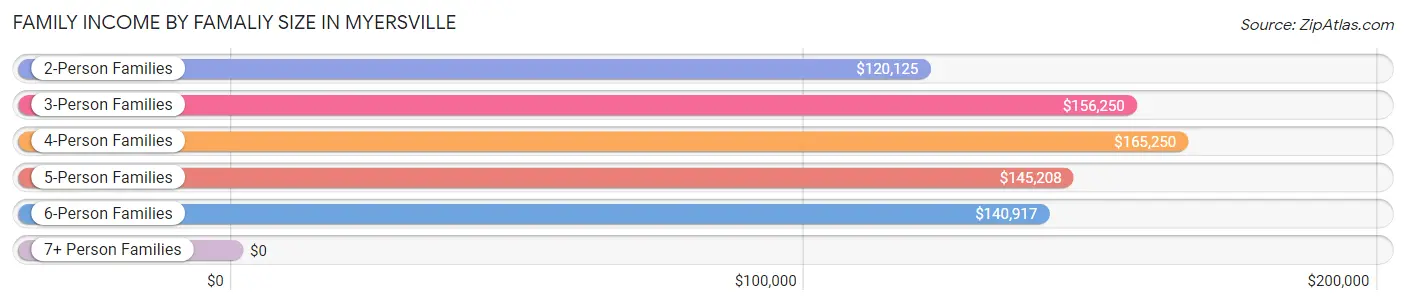
| Income Bracket | # Families | Median Income |
| 2-Person Families | 166 (28.4%) | $120,125 |
| 3-Person Families | 94 (16.1%) | $156,250 |
| 4-Person Families | 161 (27.6%) | $165,250 |
| 5-Person Families | 51 (8.7%) | $145,208 |
| 6-Person Families | 101 (17.3%) | $140,917 |
| 7+ Person Families | 11 (1.9%) | $0 |
| Total | 584 (100.0%) | $145,500 |
Family Income by Number of Earners in Myersville
The median family income in Myersville is $145,500, with families comprising 3+ earners (90) having the highest median family income of $198,333, while families with no earners (26) have the lowest median family income of $2,499, accounting for 15.4% and 4.4% of families, respectively.
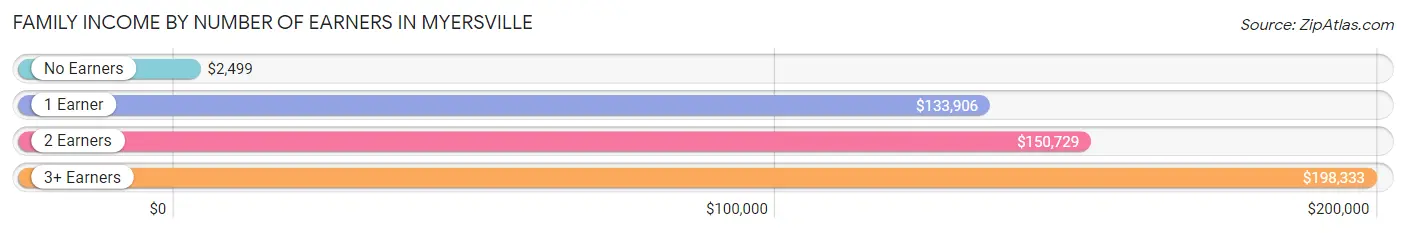
| Number of Earners | # Families | Median Income |
| No Earners | 26 (4.4%) | $2,499 |
| 1 Earner | 135 (23.1%) | $133,906 |
| 2 Earners | 333 (57.0%) | $150,729 |
| 3+ Earners | 90 (15.4%) | $198,333 |
| Total | 584 (100.0%) | $145,500 |
Household Income in Myersville
Household Income Brackets in Myersville
With 275 households falling in the category, the $100,000 to $149,999 income range is the most frequent in Myersville, accounting for 40.5% of all households. In contrast, only 3 households (0.4%) fall into the $15,000 to $24,999 income bracket, making it the least populous group.
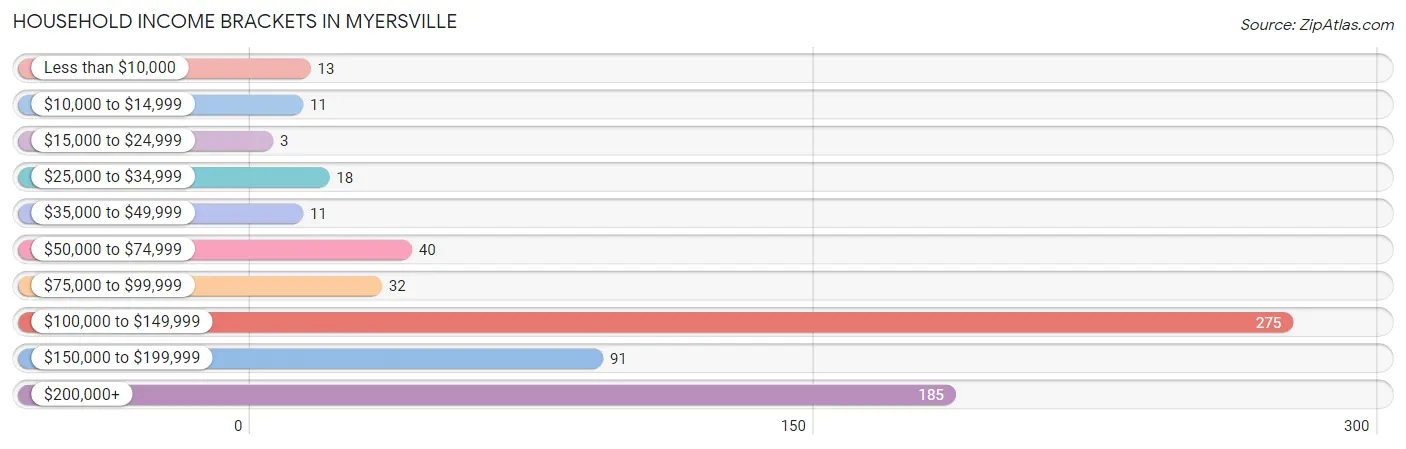
| Income Bracket | # Households | % Households |
| Less than $10,000 | 13 | 1.9% |
| $10,000 to $14,999 | 11 | 1.6% |
| $15,000 to $24,999 | 3 | 0.4% |
| $25,000 to $34,999 | 18 | 2.7% |
| $35,000 to $49,999 | 11 | 1.6% |
| $50,000 to $74,999 | 40 | 5.9% |
| $75,000 to $99,999 | 32 | 4.7% |
| $100,000 to $149,999 | 275 | 40.5% |
| $150,000 to $199,999 | 91 | 13.4% |
| $200,000+ | 185 | 27.2% |
Household Income by Householder Age in Myersville
The median household income in Myersville is $140,048, with the highest median household income of $159,583 found in the 45 to 64 years age bracket for the primary householder. A total of 285 households (42.0%) fall into this category. Meanwhile, the 15 to 24 years age bracket for the primary householder has the lowest median household income of $0, with 4 households (0.6%) in this group.
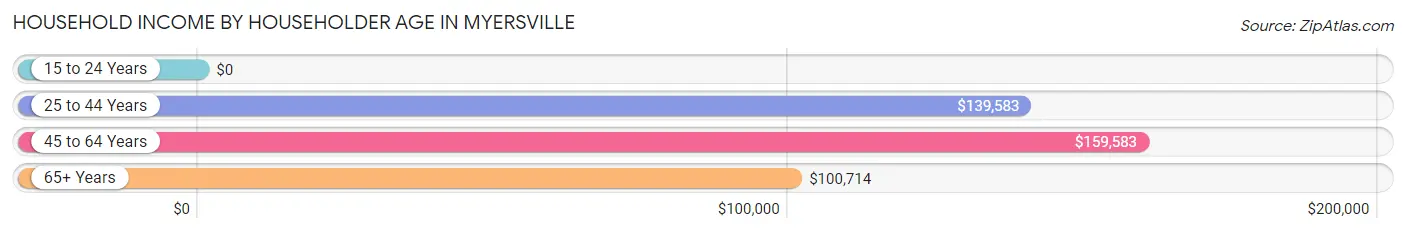
| Income Bracket | # Households | Median Income |
| 15 to 24 Years | 4 (0.6%) | $0 |
| 25 to 44 Years | 302 (44.5%) | $139,583 |
| 45 to 64 Years | 285 (42.0%) | $159,583 |
| 65+ Years | 88 (13.0%) | $100,714 |
| Total | 679 (100.0%) | $140,048 |
Poverty in Myersville
Income Below Poverty by Sex and Age in Myersville
With 3.4% poverty level for males and 2.1% for females among the residents of Myersville, under 5 year old males and 35 to 44 year old females are the most vulnerable to poverty, with 10 males (19.6%) and 27 females (10.3%) in their respective age groups living below the poverty level.
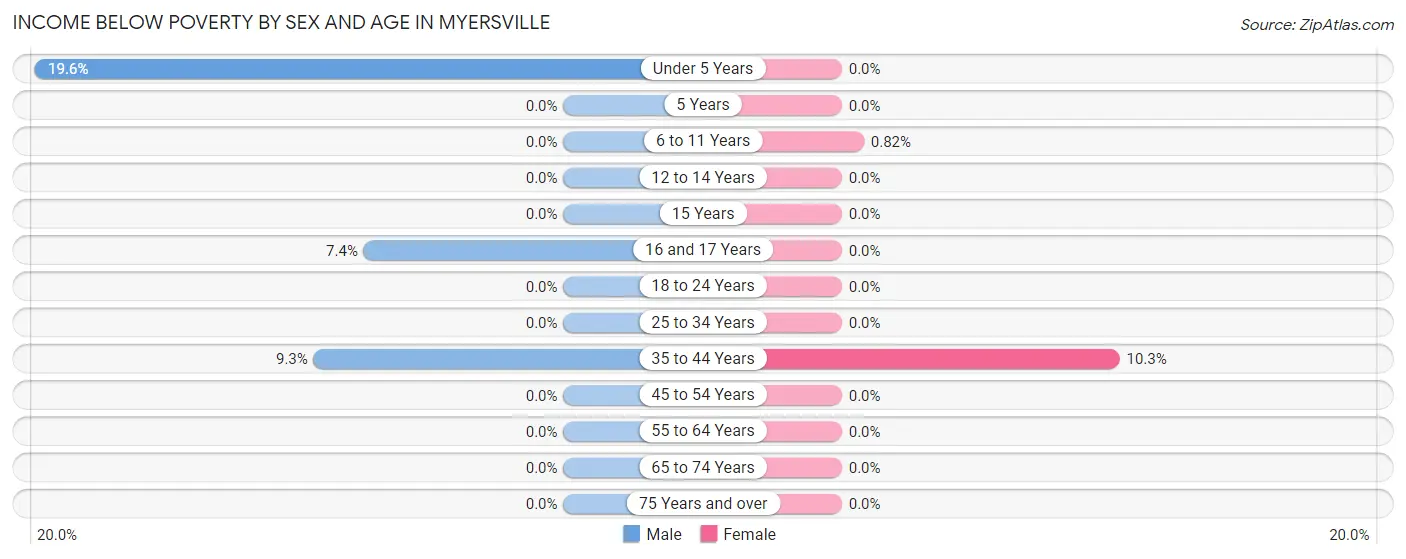
| Age Bracket | Male | Female |
| Under 5 Years | 10 (19.6%) | 0 (0.0%) |
| 5 Years | 0 (0.0%) | 0 (0.0%) |
| 6 to 11 Years | 0 (0.0%) | 3 (0.8%) |
| 12 to 14 Years | 0 (0.0%) | 0 (0.0%) |
| 15 Years | 0 (0.0%) | 0 (0.0%) |
| 16 and 17 Years | 4 (7.4%) | 0 (0.0%) |
| 18 to 24 Years | 0 (0.0%) | 0 (0.0%) |
| 25 to 34 Years | 0 (0.0%) | 0 (0.0%) |
| 35 to 44 Years | 23 (9.3%) | 27 (10.3%) |
| 45 to 54 Years | 0 (0.0%) | 0 (0.0%) |
| 55 to 64 Years | 0 (0.0%) | 0 (0.0%) |
| 65 to 74 Years | 0 (0.0%) | 0 (0.0%) |
| 75 Years and over | 0 (0.0%) | 0 (0.0%) |
| Total | 37 (3.4%) | 30 (2.1%) |
Income Above Poverty by Sex and Age in Myersville
According to the poverty statistics in Myersville, males aged 5 years and females aged under 5 years are the age groups that are most secure financially, with 100.0% of males and 100.0% of females in these age groups living above the poverty line.
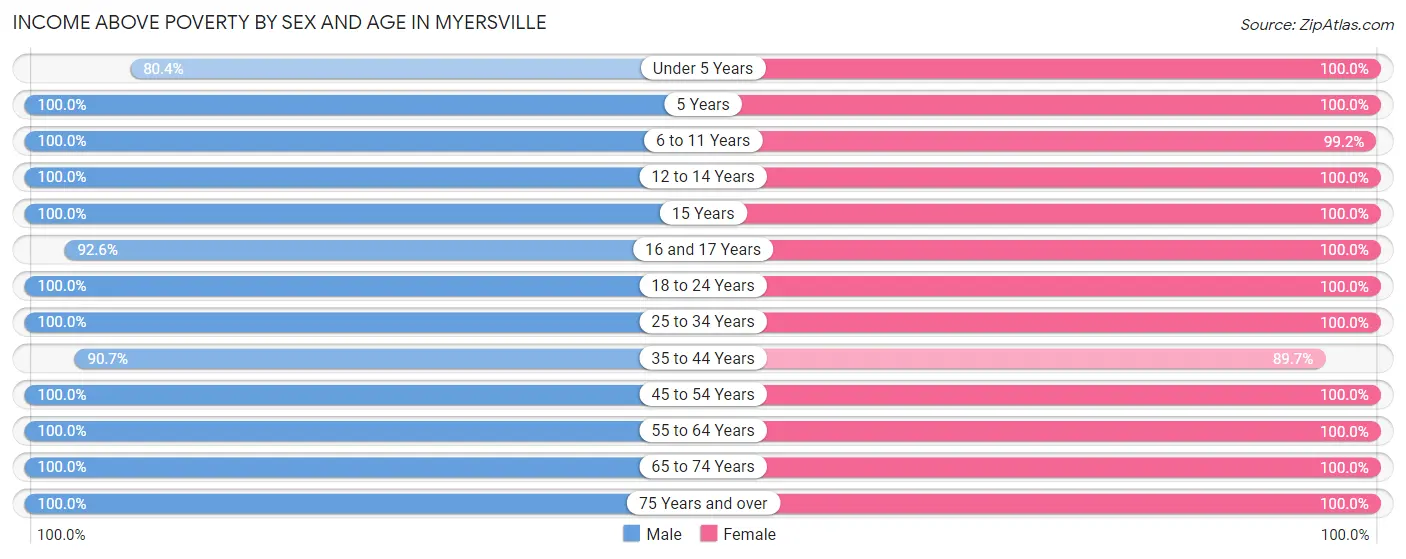
| Age Bracket | Male | Female |
| Under 5 Years | 41 (80.4%) | 88 (100.0%) |
| 5 Years | 14 (100.0%) | 24 (100.0%) |
| 6 to 11 Years | 63 (100.0%) | 361 (99.2%) |
| 12 to 14 Years | 138 (100.0%) | 104 (100.0%) |
| 15 Years | 5 (100.0%) | 9 (100.0%) |
| 16 and 17 Years | 50 (92.6%) | 16 (100.0%) |
| 18 to 24 Years | 84 (100.0%) | 103 (100.0%) |
| 25 to 34 Years | 76 (100.0%) | 75 (100.0%) |
| 35 to 44 Years | 225 (90.7%) | 235 (89.7%) |
| 45 to 54 Years | 140 (100.0%) | 142 (100.0%) |
| 55 to 64 Years | 140 (100.0%) | 122 (100.0%) |
| 65 to 74 Years | 33 (100.0%) | 45 (100.0%) |
| 75 Years and over | 32 (100.0%) | 46 (100.0%) |
| Total | 1,041 (96.6%) | 1,370 (97.9%) |
Income Below Poverty Among Married-Couple Families in Myersville
The poverty statistics for married-couple families in Myersville show that 1.9% or 10 of the total 536 families live below the poverty line. Families with no children have the highest poverty rate of 4.5%, comprising of 10 families. On the other hand, families with 1 or 2 children have the lowest poverty rate of 0.0%, which includes 0 families.
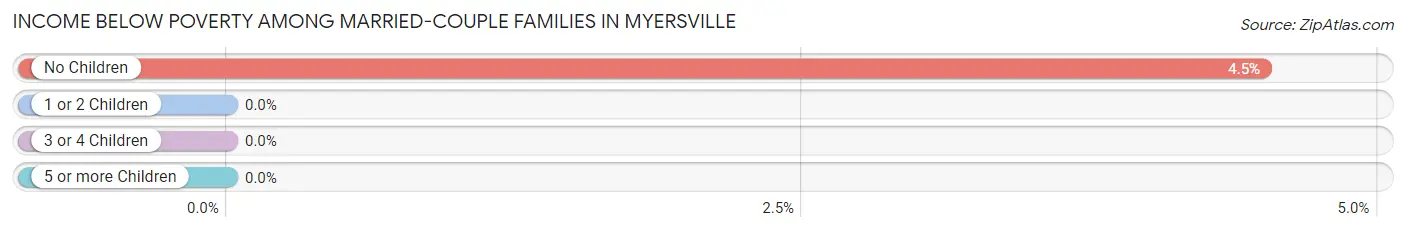
| Children | Above Poverty | Below Poverty |
| No Children | 212 (95.5%) | 10 (4.5%) |
| 1 or 2 Children | 188 (100.0%) | 0 (0.0%) |
| 3 or 4 Children | 121 (100.0%) | 0 (0.0%) |
| 5 or more Children | 5 (100.0%) | 0 (0.0%) |
| Total | 526 (98.1%) | 10 (1.9%) |
Income Below Poverty Among Single-Parent Households in Myersville
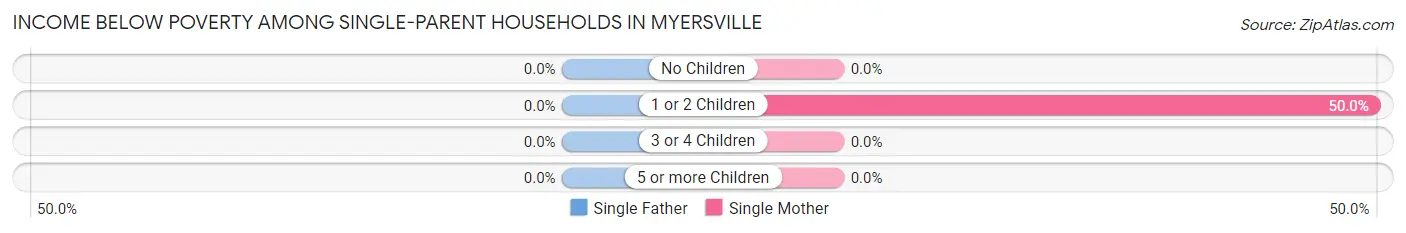
| Children | Single Father | Single Mother |
| No Children | 0 (0.0%) | 0 (0.0%) |
| 1 or 2 Children | 0 (0.0%) | 14 (50.0%) |
| 3 or 4 Children | 0 (0.0%) | 0 (0.0%) |
| 5 or more Children | 0 (0.0%) | 0 (0.0%) |
| Total | 0 (0.0%) | 14 (34.2%) |
Income Below Poverty Among Married-Couple vs Single-Parent Households in Myersville
The poverty data for Myersville shows that 10 of the married-couple family households (1.9%) and 14 of the single-parent households (29.2%) are living below the poverty level. Within the married-couple family households, those with no children have the highest poverty rate, with 10 households (4.5%) falling below the poverty line. Among the single-parent households, those with 1 or 2 children have the highest poverty rate, with 14 household (42.4%) living below poverty.
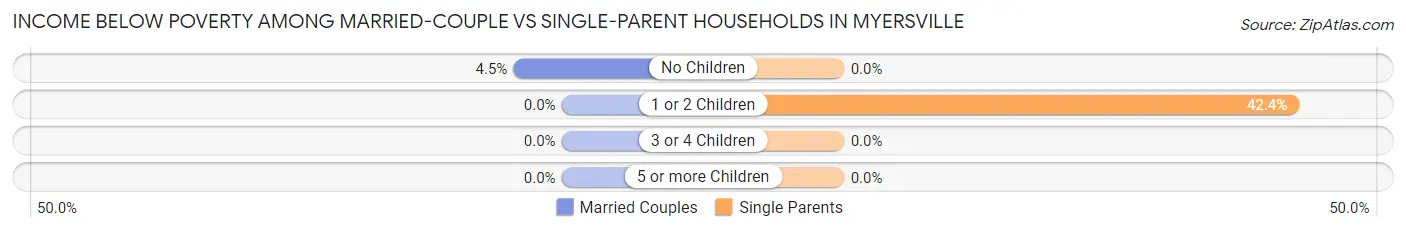
| Children | Married-Couple Families | Single-Parent Households |
| No Children | 10 (4.5%) | 0 (0.0%) |
| 1 or 2 Children | 0 (0.0%) | 14 (42.4%) |
| 3 or 4 Children | 0 (0.0%) | 0 (0.0%) |
| 5 or more Children | 0 (0.0%) | 0 (0.0%) |
| Total | 10 (1.9%) | 14 (29.2%) |
Race in Myersville
The most populous races in Myersville are White / Caucasian (2,127 | 85.3%), Two or more Races (217 | 8.7%), and Hispanic or Latino (190 | 7.6%).
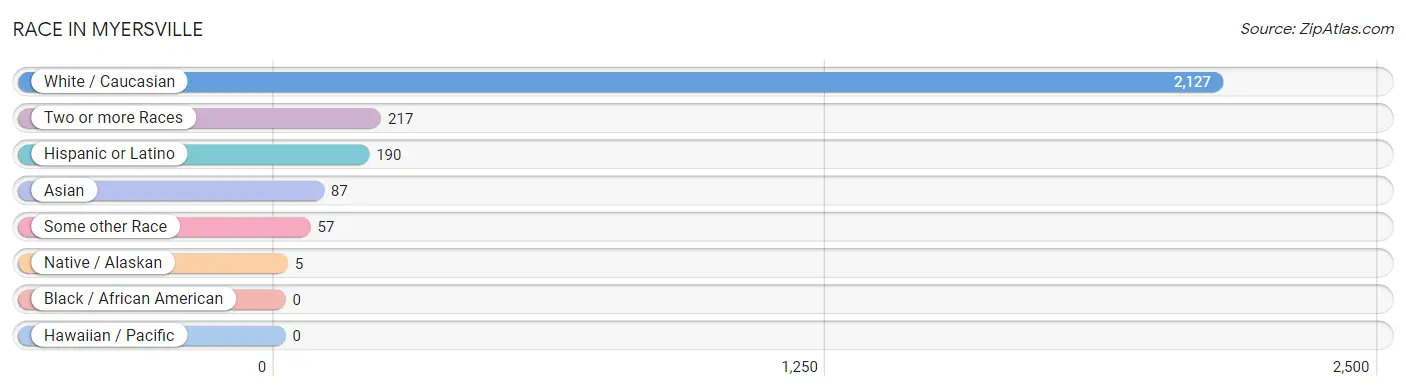
| Race | # Population | % Population |
| Asian | 87 | 3.5% |
| Black / African American | 0 | 0.0% |
| Hawaiian / Pacific | 0 | 0.0% |
| Hispanic or Latino | 190 | 7.6% |
| Native / Alaskan | 5 | 0.2% |
| White / Caucasian | 2,127 | 85.3% |
| Two or more Races | 217 | 8.7% |
| Some other Race | 57 | 2.3% |
| Total | 2,493 | 100.0% |
Ancestry in Myersville
The most populous ancestries reported in Myersville are German (519 | 20.8%), English (380 | 15.2%), Irish (310 | 12.4%), Slavic (173 | 6.9%), and Italian (154 | 6.2%), together accounting for 61.6% of all Myersville residents.
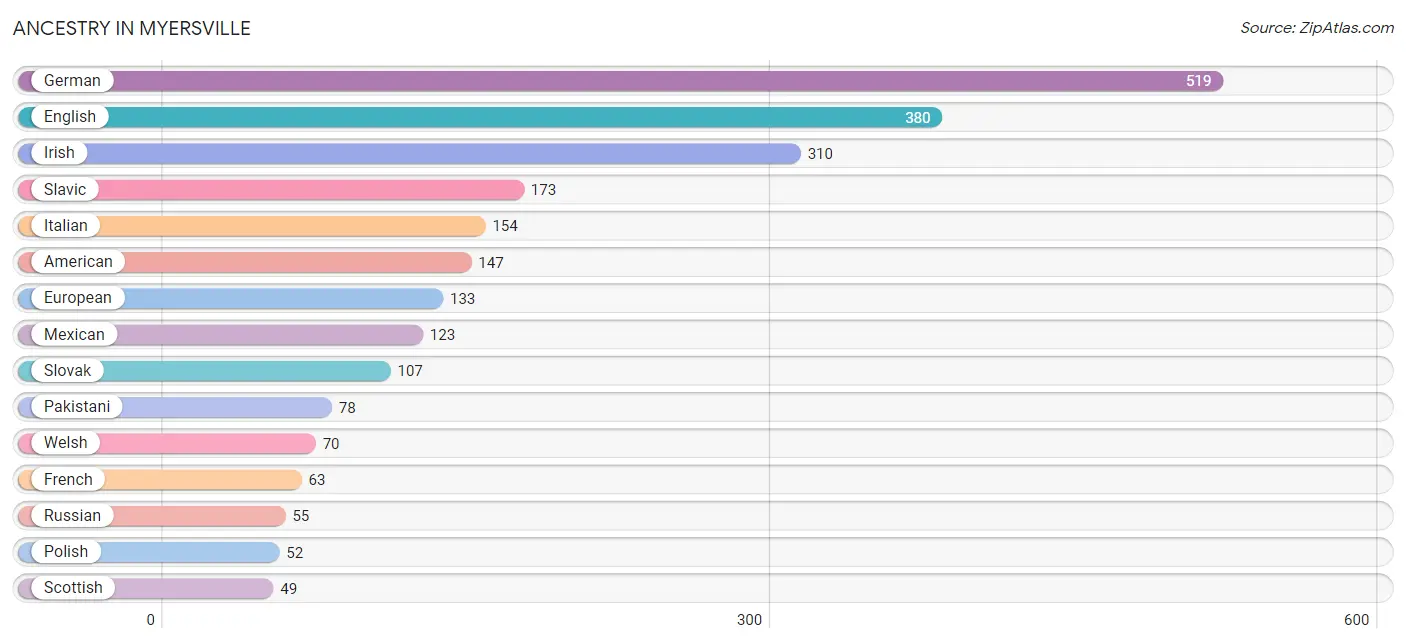
| Ancestry | # Population | % Population |
| African | 7 | 0.3% |
| American | 147 | 5.9% |
| Arab | 22 | 0.9% |
| Austrian | 3 | 0.1% |
| Bhutanese | 5 | 0.2% |
| Blackfeet | 3 | 0.1% |
| Burmese | 30 | 1.2% |
| Central American | 19 | 0.8% |
| Central American Indian | 5 | 0.2% |
| Colombian | 2 | 0.1% |
| Czech | 2 | 0.1% |
| Dutch | 22 | 0.9% |
| English | 380 | 15.2% |
| European | 133 | 5.3% |
| French | 63 | 2.5% |
| French Canadian | 5 | 0.2% |
| German | 519 | 20.8% |
| Greek | 15 | 0.6% |
| Guamanian / Chamorro | 1 | 0.0% |
| Guatemalan | 13 | 0.5% |
| Indian (Asian) | 6 | 0.2% |
| Irish | 310 | 12.4% |
| Italian | 154 | 6.2% |
| Lebanese | 22 | 0.9% |
| Lithuanian | 4 | 0.2% |
| Mexican | 123 | 4.9% |
| Nicaraguan | 6 | 0.2% |
| Northern European | 5 | 0.2% |
| Norwegian | 7 | 0.3% |
| Pakistani | 78 | 3.1% |
| Peruvian | 27 | 1.1% |
| Polish | 52 | 2.1% |
| Romanian | 4 | 0.2% |
| Russian | 55 | 2.2% |
| Scandinavian | 29 | 1.2% |
| Scotch-Irish | 16 | 0.6% |
| Scottish | 49 | 2.0% |
| Senegalese | 21 | 0.8% |
| Slavic | 173 | 6.9% |
| Slovak | 107 | 4.3% |
| South American | 29 | 1.2% |
| South American Indian | 27 | 1.1% |
| Spaniard | 4 | 0.2% |
| Spanish | 3 | 0.1% |
| Sri Lankan | 41 | 1.6% |
| Subsaharan African | 28 | 1.1% |
| Swedish | 32 | 1.3% |
| Thai | 26 | 1.0% |
| Ukrainian | 21 | 0.8% |
| Welsh | 70 | 2.8% | View All 50 Rows |
Immigrants in Myersville
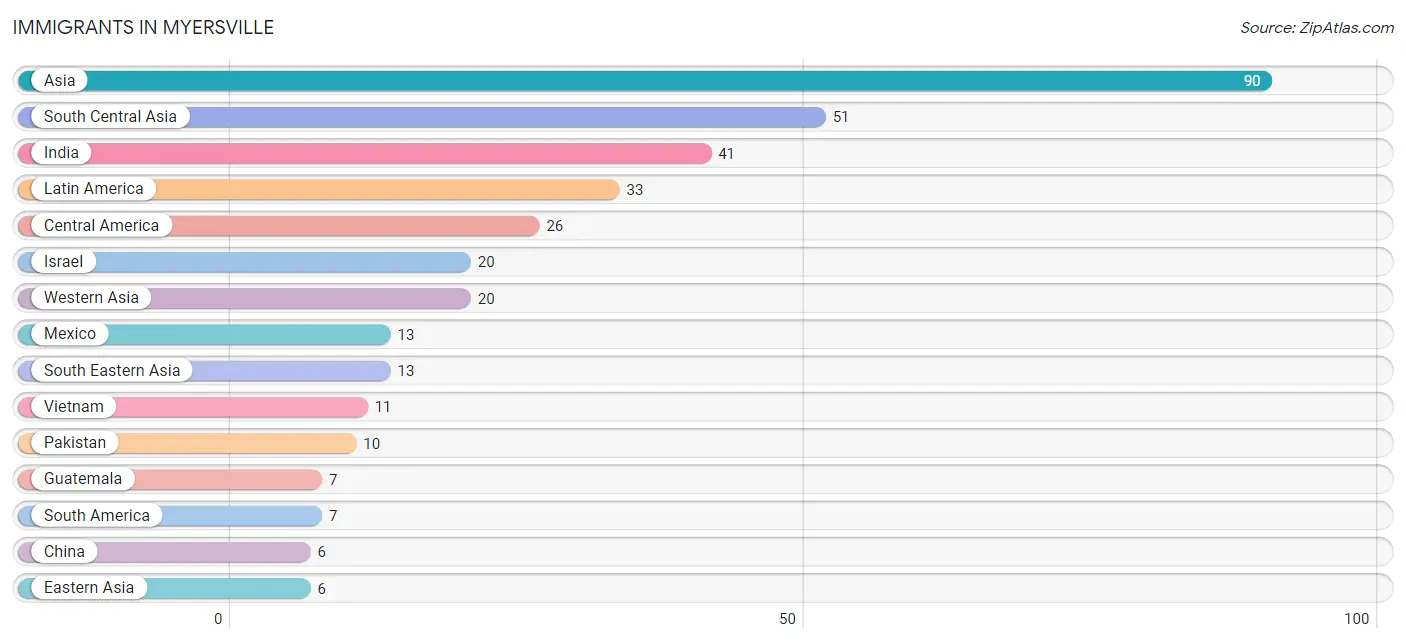
The most numerous immigrant groups reported in Myersville came from Asia (90 | 3.6%), South Central Asia (51 | 2.1%), India (41 | 1.6%), Latin America (33 | 1.3%), and Central America (26 | 1.0%), together accounting for 9.7% of all Myersville residents.
| Immigration Origin | # Population | % Population |
| Asia | 90 | 3.6% |
| Central America | 26 | 1.0% |
| China | 6 | 0.2% |
| Colombia | 2 | 0.1% |
| Eastern Asia | 6 | 0.2% |
| Eastern Europe | 4 | 0.2% |
| Europe | 4 | 0.2% |
| Guatemala | 7 | 0.3% |
| Hong Kong | 6 | 0.2% |
| India | 41 | 1.6% |
| Israel | 20 | 0.8% |
| Latin America | 33 | 1.3% |
| Mexico | 13 | 0.5% |
| Nicaragua | 6 | 0.2% |
| Pakistan | 10 | 0.4% |
| Peru | 5 | 0.2% |
| Russia | 4 | 0.2% |
| South America | 7 | 0.3% |
| South Central Asia | 51 | 2.1% |
| South Eastern Asia | 13 | 0.5% |
| Thailand | 2 | 0.1% |
| Vietnam | 11 | 0.4% |
| Western Asia | 20 | 0.8% | View All 23 Rows |
Sex and Age in Myersville
Sex and Age in Myersville
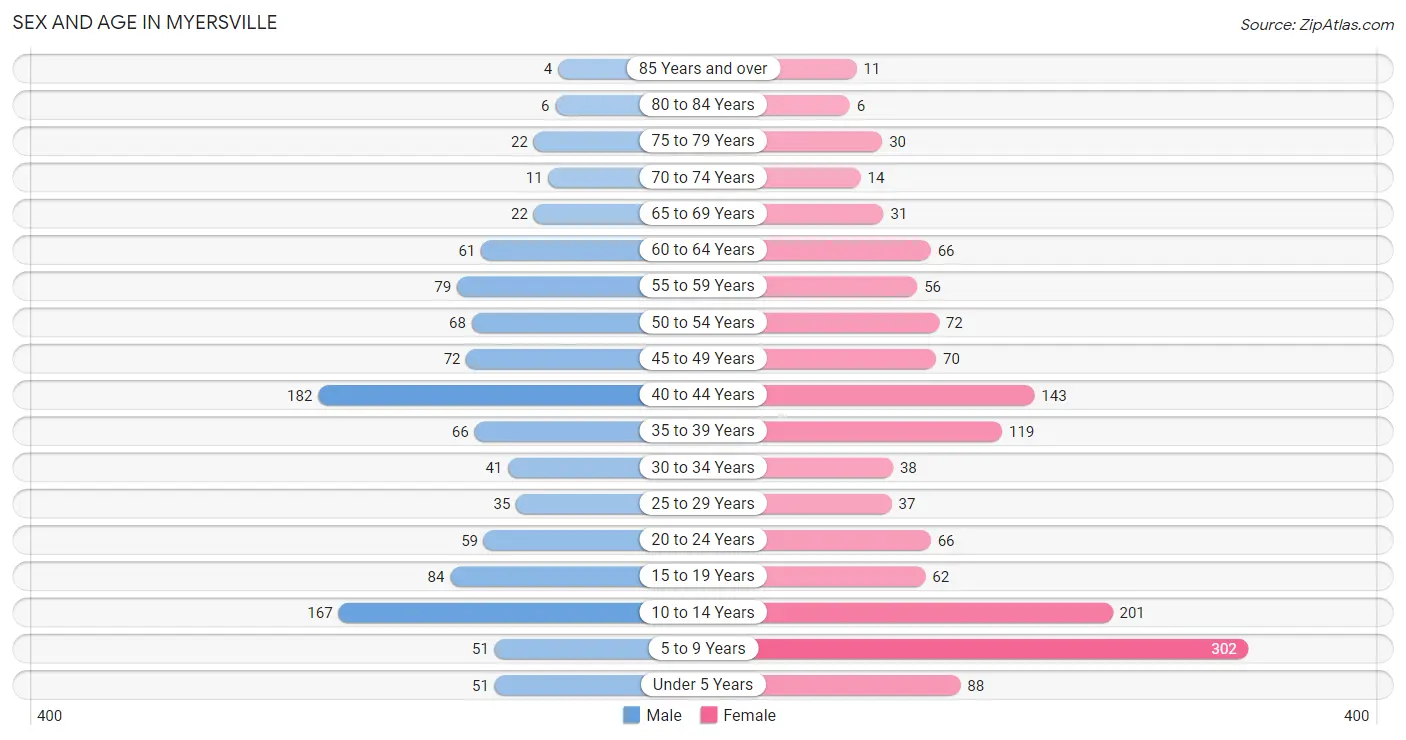
The most populous age groups in Myersville are 40 to 44 Years (182 | 16.8%) for men and 5 to 9 Years (302 | 21.4%) for women.
| Age Bracket | Male | Female |
| Under 5 Years | 51 (4.7%) | 88 (6.2%) |
| 5 to 9 Years | 51 (4.7%) | 302 (21.4%) |
| 10 to 14 Years | 167 (15.4%) | 201 (14.2%) |
| 15 to 19 Years | 84 (7.8%) | 62 (4.4%) |
| 20 to 24 Years | 59 (5.5%) | 66 (4.7%) |
| 25 to 29 Years | 35 (3.2%) | 37 (2.6%) |
| 30 to 34 Years | 41 (3.8%) | 38 (2.7%) |
| 35 to 39 Years | 66 (6.1%) | 119 (8.4%) |
| 40 to 44 Years | 182 (16.8%) | 143 (10.1%) |
| 45 to 49 Years | 72 (6.7%) | 70 (5.0%) |
| 50 to 54 Years | 68 (6.3%) | 72 (5.1%) |
| 55 to 59 Years | 79 (7.3%) | 56 (4.0%) |
| 60 to 64 Years | 61 (5.6%) | 66 (4.7%) |
| 65 to 69 Years | 22 (2.0%) | 31 (2.2%) |
| 70 to 74 Years | 11 (1.0%) | 14 (1.0%) |
| 75 to 79 Years | 22 (2.0%) | 30 (2.1%) |
| 80 to 84 Years | 6 (0.6%) | 6 (0.4%) |
| 85 Years and over | 4 (0.4%) | 11 (0.8%) |
| Total | 1,081 (100.0%) | 1,412 (100.0%) |
Families and Households in Myersville
Median Family Size in Myersville
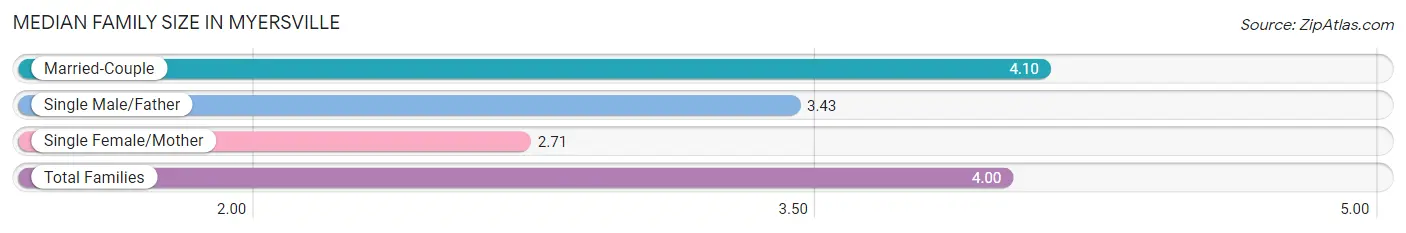
The median family size in Myersville is 4.00 persons per family, with married-couple families (536 | 91.8%) accounting for the largest median family size of 4.1 persons per family. On the other hand, single female/mother families (41 | 7.0%) represent the smallest median family size with 2.71 persons per family.
| Family Type | # Families | Family Size |
| Married-Couple | 536 (91.8%) | 4.10 |
| Single Male/Father | 7 (1.2%) | 3.43 |
| Single Female/Mother | 41 (7.0%) | 2.71 |
| Total Families | 584 (100.0%) | 4.00 |
Median Household Size in Myersville
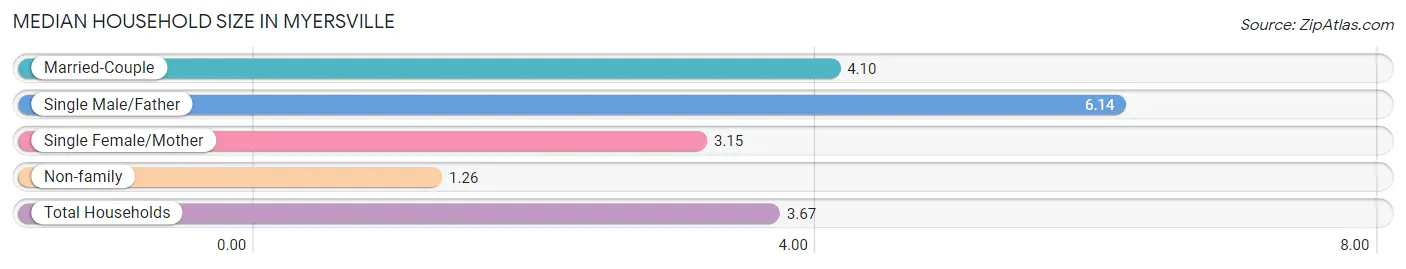
The median household size in Myersville is 3.67 persons per household, with single male/father households (7 | 1.0%) accounting for the largest median household size of 6.14 persons per household. non-family households (95 | 14.0%) represent the smallest median household size with 1.26 persons per household.
| Household Type | # Households | Household Size |
| Married-Couple | 536 (78.9%) | 4.10 |
| Single Male/Father | 7 (1.0%) | 6.14 |
| Single Female/Mother | 41 (6.0%) | 3.15 |
| Non-family | 95 (14.0%) | 1.26 |
| Total Households | 679 (100.0%) | 3.67 |
Household Size by Marriage Status in Myersville
Out of a total of 679 households in Myersville, 584 (86.0%) are family households, while 95 (14.0%) are nonfamily households. The most numerous type of family households are 4-person households, comprising 160, and the most common type of nonfamily households are 1-person households, comprising 69.
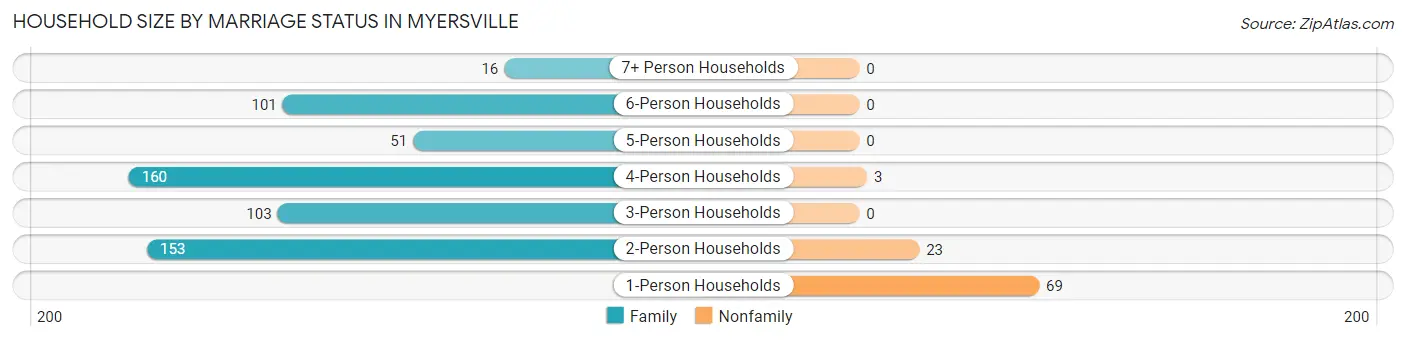
| Household Size | Family Households | Nonfamily Households |
| 1-Person Households | - | 69 (10.2%) |
| 2-Person Households | 153 (22.5%) | 23 (3.4%) |
| 3-Person Households | 103 (15.2%) | 0 (0.0%) |
| 4-Person Households | 160 (23.6%) | 3 (0.4%) |
| 5-Person Households | 51 (7.5%) | 0 (0.0%) |
| 6-Person Households | 101 (14.9%) | 0 (0.0%) |
| 7+ Person Households | 16 (2.4%) | 0 (0.0%) |
| Total | 584 (86.0%) | 95 (14.0%) |
Female Fertility in Myersville
Fertility by Age in Myersville
Average fertility rate in Myersville is 73.0 births per 1,000 women. Women in the age bracket of 35 to 50 years have the highest fertility rate with 94.0 births per 1,000 women. Women in the age bracket of 35 to 50 years acount for 80.0% of all women with births.
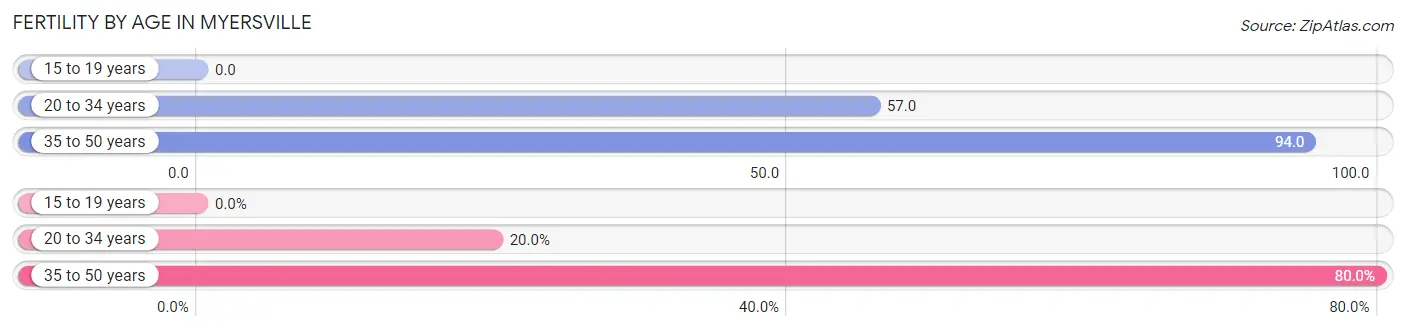
| Age Bracket | Women with Births | Births / 1,000 Women |
| 15 to 19 years | 0 (0.0%) | 0.0 |
| 20 to 34 years | 8 (20.0%) | 57.0 |
| 35 to 50 years | 32 (80.0%) | 94.0 |
| Total | 40 (100.0%) | 73.0 |
Fertility by Age by Marriage Status in Myersville
62.5% of women with births (40) in Myersville are married. The highest percentage of unmarried women with births falls into 20 to 34 years age bracket with 50.0% of them unmarried at the time of birth, while the lowest percentage of unmarried women with births belong to 35 to 50 years age bracket with 34.4% of them unmarried.
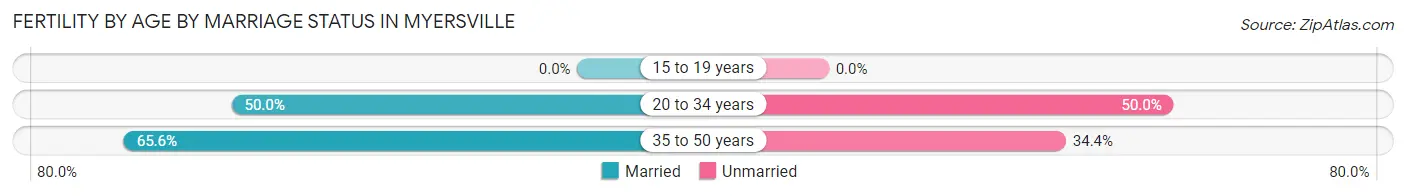
| Age Bracket | Married | Unmarried |
| 15 to 19 years | 0 (0.0%) | 0 (0.0%) |
| 20 to 34 years | 4 (50.0%) | 4 (50.0%) |
| 35 to 50 years | 21 (65.6%) | 11 (34.4%) |
| Total | 25 (62.5%) | 15 (37.5%) |
Fertility by Education in Myersville
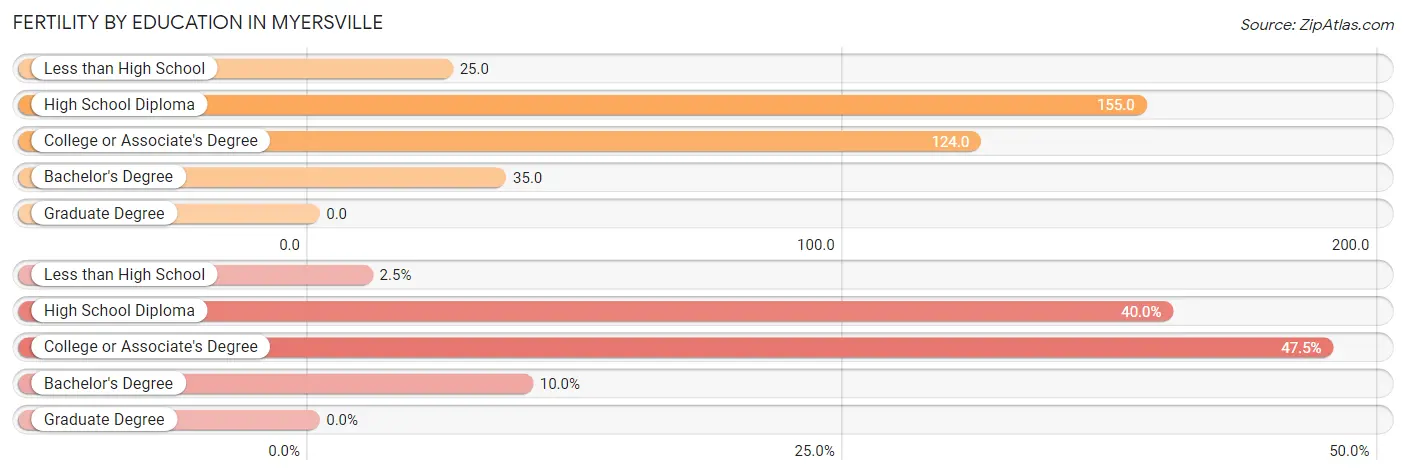
| Educational Attainment | Women with Births | Births / 1,000 Women |
| Less than High School | 1 (2.5%) | 25.0 |
| High School Diploma | 16 (40.0%) | 155.0 |
| College or Associate's Degree | 19 (47.5%) | 124.0 |
| Bachelor's Degree | 4 (10.0%) | 35.0 |
| Graduate Degree | 0 (0.0%) | 0.0 |
| Total | 40 (100.0%) | 73.0 |
Fertility by Education by Marriage Status in Myersville
37.5% of women with births in Myersville are unmarried. Women with the educational attainment of less than high school are most likely to be married with 100.0% of them married at childbirth, while women with the educational attainment of high school diploma are least likely to be married with 68.8% of them unmarried at childbirth.
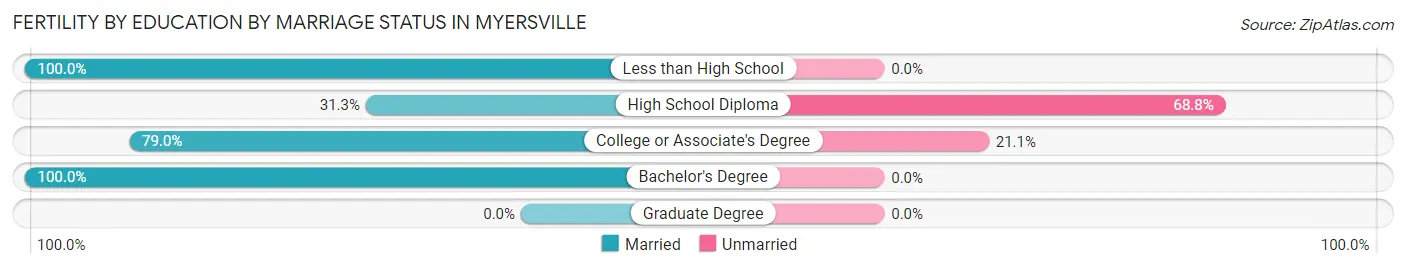
| Educational Attainment | Married | Unmarried |
| Less than High School | 1 (100.0%) | 0 (0.0%) |
| High School Diploma | 5 (31.2%) | 11 (68.8%) |
| College or Associate's Degree | 15 (78.9%) | 4 (21.0%) |
| Bachelor's Degree | 4 (100.0%) | 0 (0.0%) |
| Graduate Degree | 0 (0.0%) | 0 (0.0%) |
| Total | 25 (62.5%) | 15 (37.5%) |
Employment Characteristics in Myersville
Employment by Class of Employer in Myersville
Among the 1,155 employed individuals in Myersville, private company employees (742 | 64.2%), local government employees (153 | 13.3%), and federal government employees (95 | 8.2%) make up the most common classes of employment.
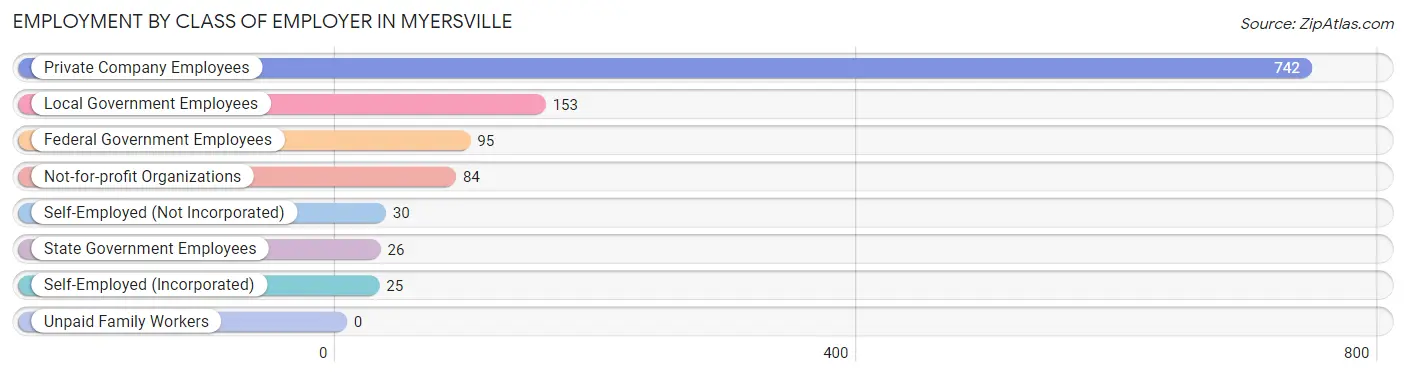
| Employer Class | # Employees | % Employees |
| Private Company Employees | 742 | 64.2% |
| Self-Employed (Incorporated) | 25 | 2.2% |
| Self-Employed (Not Incorporated) | 30 | 2.6% |
| Not-for-profit Organizations | 84 | 7.3% |
| Local Government Employees | 153 | 13.3% |
| State Government Employees | 26 | 2.2% |
| Federal Government Employees | 95 | 8.2% |
| Unpaid Family Workers | 0 | 0.0% |
| Total | 1,155 | 100.0% |
Employment Status by Age in Myersville
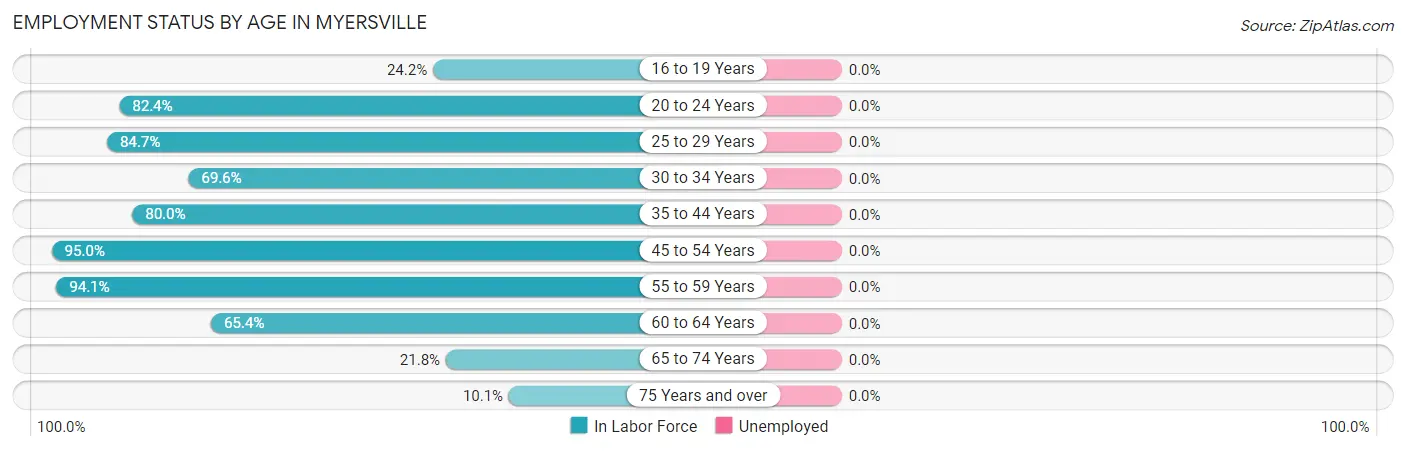
| Age Bracket | In Labor Force | Unemployed |
| 16 to 19 Years | 32 (24.2%) | 0 (0.0%) |
| 20 to 24 Years | 103 (82.4%) | 0 (0.0%) |
| 25 to 29 Years | 61 (84.7%) | 0 (0.0%) |
| 30 to 34 Years | 55 (69.6%) | 0 (0.0%) |
| 35 to 44 Years | 408 (80.0%) | 0 (0.0%) |
| 45 to 54 Years | 268 (95.0%) | 0 (0.0%) |
| 55 to 59 Years | 127 (94.1%) | 0 (0.0%) |
| 60 to 64 Years | 83 (65.4%) | 0 (0.0%) |
| 65 to 74 Years | 17 (21.8%) | 0 (0.0%) |
| 75 Years and over | 8 (10.1%) | 0 (0.0%) |
| Total | 1,162 (71.8%) | 0 (0.0%) |
Employment Status by Educational Attainment in Myersville
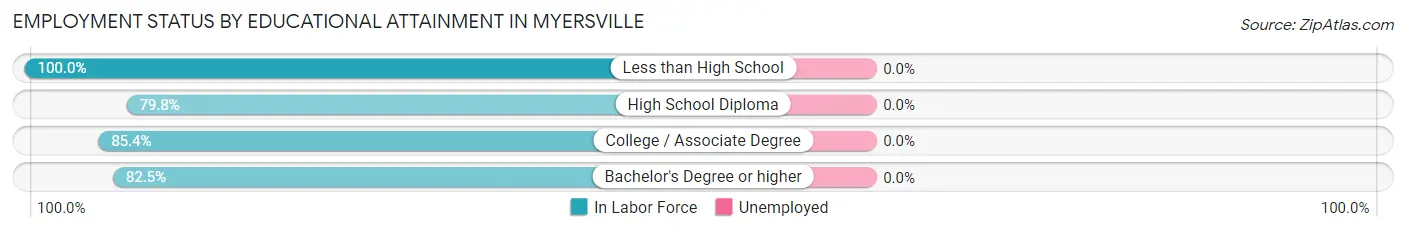
| Educational Attainment | In Labor Force | Unemployed |
| Less than High School | 27 (100.0%) | 0 (0.0%) |
| High School Diploma | 174 (79.8%) | 0 (0.0%) |
| College / Associate Degree | 257 (85.4%) | 0 (0.0%) |
| Bachelor's Degree or higher | 544 (82.5%) | 0 (0.0%) |
| Total | 1,003 (83.2%) | 0 (0.0%) |
Employment Occupations by Sex in Myersville
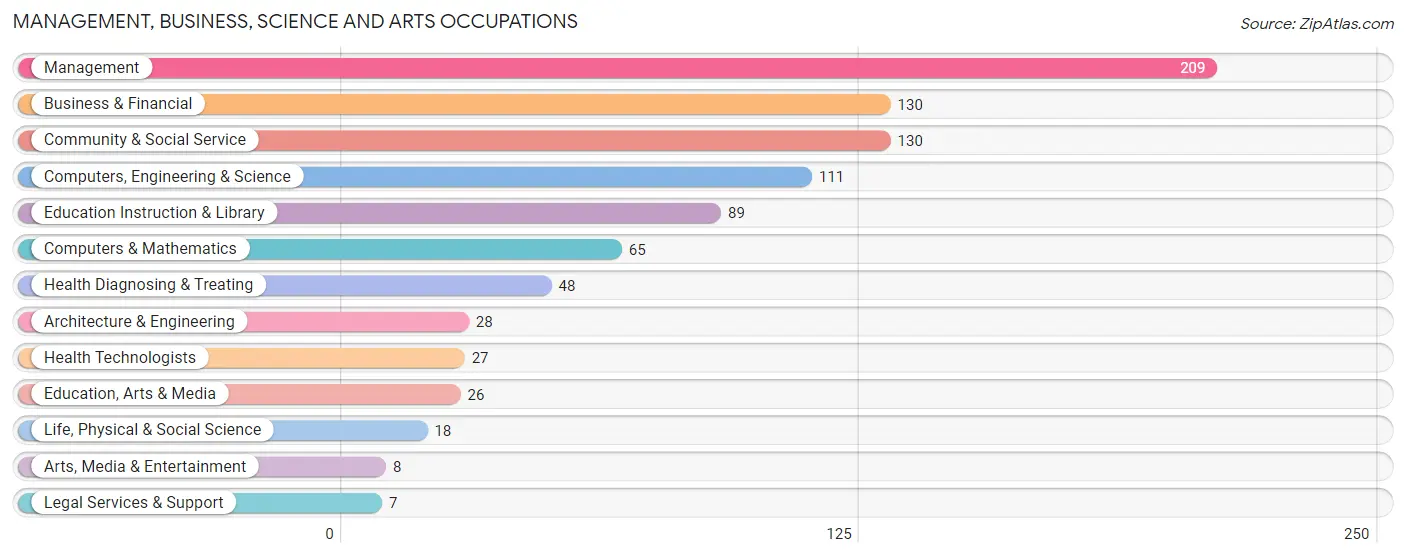
Management, Business, Science and Arts Occupations
The most common Management, Business, Science and Arts occupations in Myersville are Management (209 | 18.1%), Business & Financial (130 | 11.3%), Community & Social Service (130 | 11.3%), Computers, Engineering & Science (111 | 9.6%), and Education Instruction & Library (89 | 7.7%).
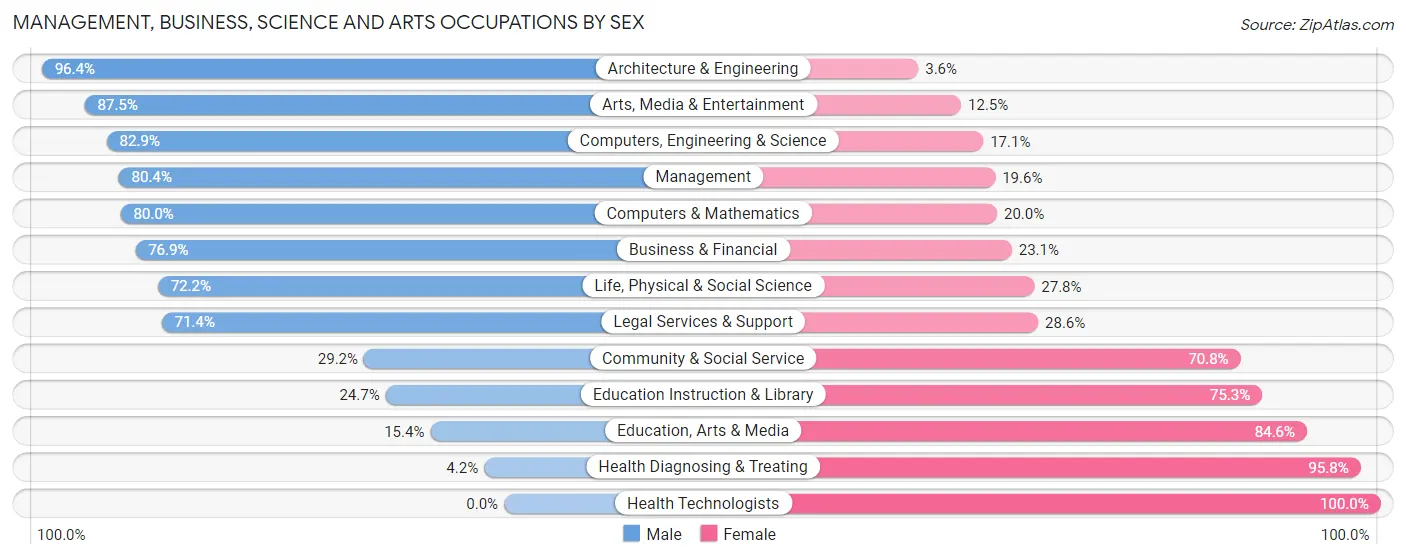
Management, Business, Science and Arts Occupations by Sex
Within the Management, Business, Science and Arts occupations in Myersville, the most male-oriented occupations are Architecture & Engineering (96.4%), Arts, Media & Entertainment (87.5%), and Computers, Engineering & Science (82.9%), while the most female-oriented occupations are Health Technologists (100.0%), Health Diagnosing & Treating (95.8%), and Education, Arts & Media (84.6%).
| Occupation | Male | Female |
| Management | 168 (80.4%) | 41 (19.6%) |
| Business & Financial | 100 (76.9%) | 30 (23.1%) |
| Computers, Engineering & Science | 92 (82.9%) | 19 (17.1%) |
| Computers & Mathematics | 52 (80.0%) | 13 (20.0%) |
| Architecture & Engineering | 27 (96.4%) | 1 (3.6%) |
| Life, Physical & Social Science | 13 (72.2%) | 5 (27.8%) |
| Community & Social Service | 38 (29.2%) | 92 (70.8%) |
| Education, Arts & Media | 4 (15.4%) | 22 (84.6%) |
| Legal Services & Support | 5 (71.4%) | 2 (28.6%) |
| Education Instruction & Library | 22 (24.7%) | 67 (75.3%) |
| Arts, Media & Entertainment | 7 (87.5%) | 1 (12.5%) |
| Health Diagnosing & Treating | 2 (4.2%) | 46 (95.8%) |
| Health Technologists | 0 (0.0%) | 27 (100.0%) |
| Total (Category) | 400 (63.7%) | 228 (36.3%) |
| Total (Overall) | 661 (57.2%) | 495 (42.8%) |
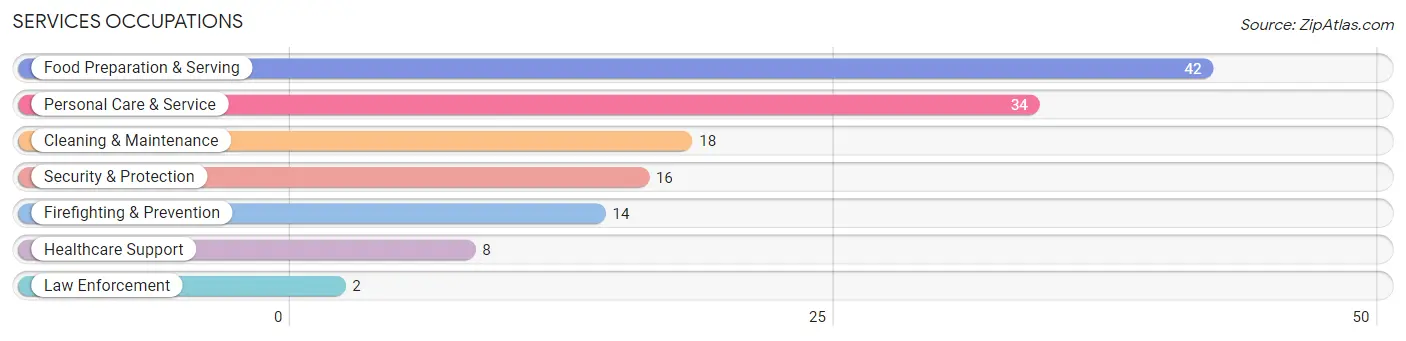
Services Occupations
The most common Services occupations in Myersville are Food Preparation & Serving (42 | 3.6%), Personal Care & Service (34 | 2.9%), Cleaning & Maintenance (18 | 1.6%), Security & Protection (16 | 1.4%), and Firefighting & Prevention (14 | 1.2%).
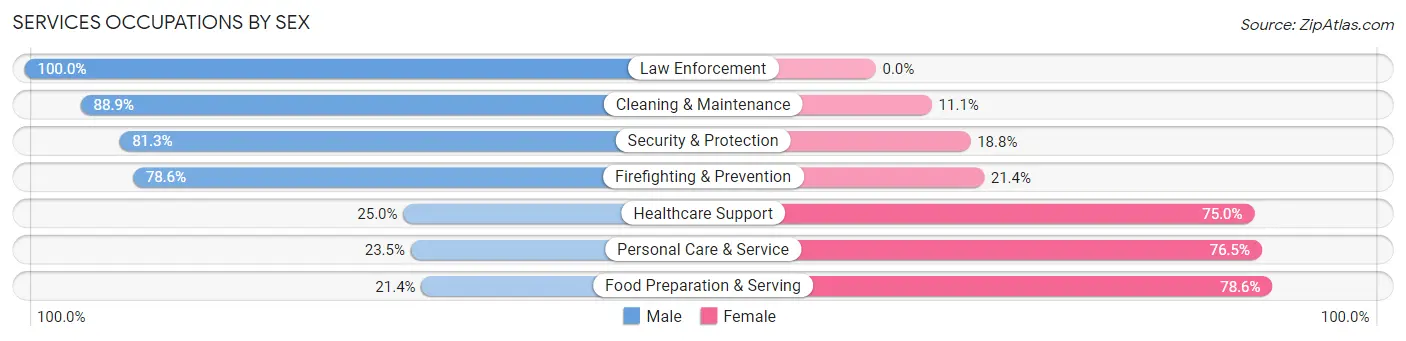
Services Occupations by Sex
Within the Services occupations in Myersville, the most male-oriented occupations are Law Enforcement (100.0%), Cleaning & Maintenance (88.9%), and Security & Protection (81.2%), while the most female-oriented occupations are Food Preparation & Serving (78.6%), Personal Care & Service (76.5%), and Healthcare Support (75.0%).
| Occupation | Male | Female |
| Healthcare Support | 2 (25.0%) | 6 (75.0%) |
| Security & Protection | 13 (81.2%) | 3 (18.8%) |
| Firefighting & Prevention | 11 (78.6%) | 3 (21.4%) |
| Law Enforcement | 2 (100.0%) | 0 (0.0%) |
| Food Preparation & Serving | 9 (21.4%) | 33 (78.6%) |
| Cleaning & Maintenance | 16 (88.9%) | 2 (11.1%) |
| Personal Care & Service | 8 (23.5%) | 26 (76.5%) |
| Total (Category) | 48 (40.7%) | 70 (59.3%) |
| Total (Overall) | 661 (57.2%) | 495 (42.8%) |
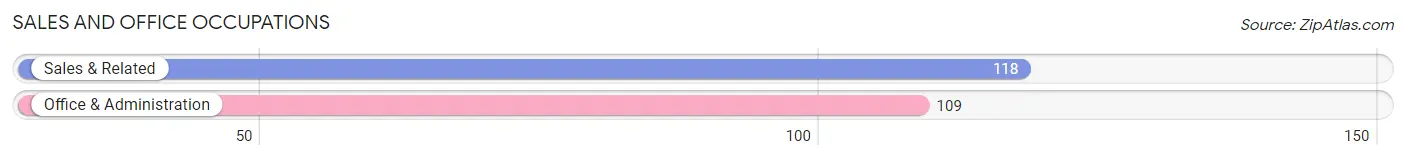
Sales and Office Occupations
The most common Sales and Office occupations in Myersville are Sales & Related (118 | 10.2%), and Office & Administration (109 | 9.4%).
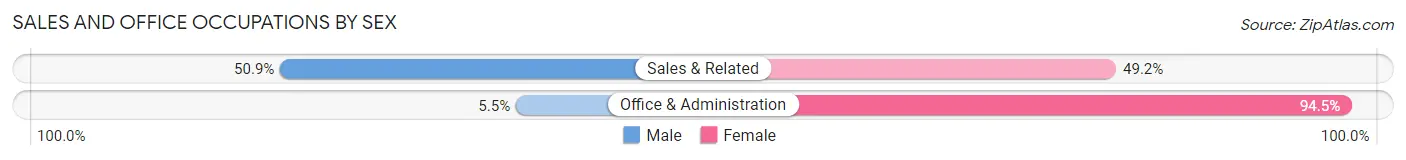
Sales and Office Occupations by Sex
| Occupation | Male | Female |
| Sales & Related | 60 (50.8%) | 58 (49.1%) |
| Office & Administration | 6 (5.5%) | 103 (94.5%) |
| Total (Category) | 66 (29.1%) | 161 (70.9%) |
| Total (Overall) | 661 (57.2%) | 495 (42.8%) |
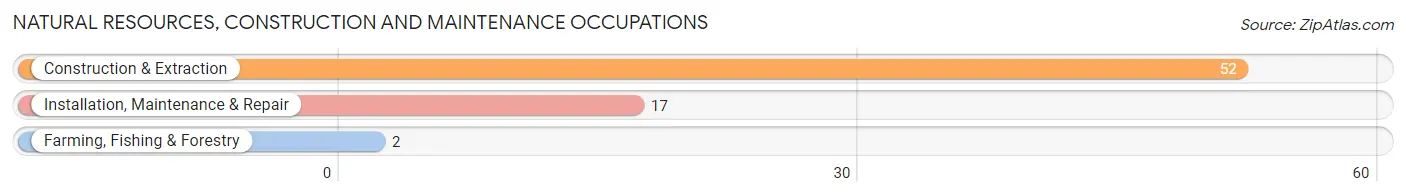
Natural Resources, Construction and Maintenance Occupations
The most common Natural Resources, Construction and Maintenance occupations in Myersville are Construction & Extraction (52 | 4.5%), Installation, Maintenance & Repair (17 | 1.5%), and Farming, Fishing & Forestry (2 | 0.2%).
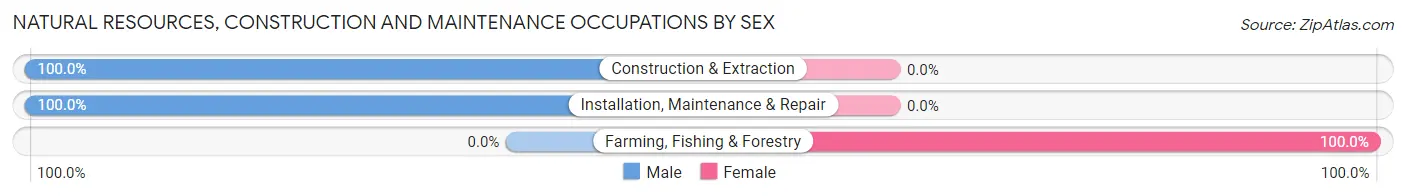
Natural Resources, Construction and Maintenance Occupations by Sex
| Occupation | Male | Female |
| Farming, Fishing & Forestry | 0 (0.0%) | 2 (100.0%) |
| Construction & Extraction | 52 (100.0%) | 0 (0.0%) |
| Installation, Maintenance & Repair | 17 (100.0%) | 0 (0.0%) |
| Total (Category) | 69 (97.2%) | 2 (2.8%) |
| Total (Overall) | 661 (57.2%) | 495 (42.8%) |
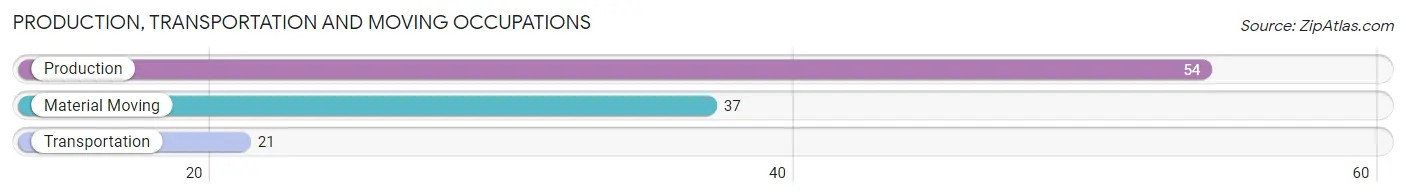
Production, Transportation and Moving Occupations
The most common Production, Transportation and Moving occupations in Myersville are Production (54 | 4.7%), Material Moving (37 | 3.2%), and Transportation (21 | 1.8%).
Production, Transportation and Moving Occupations by Sex
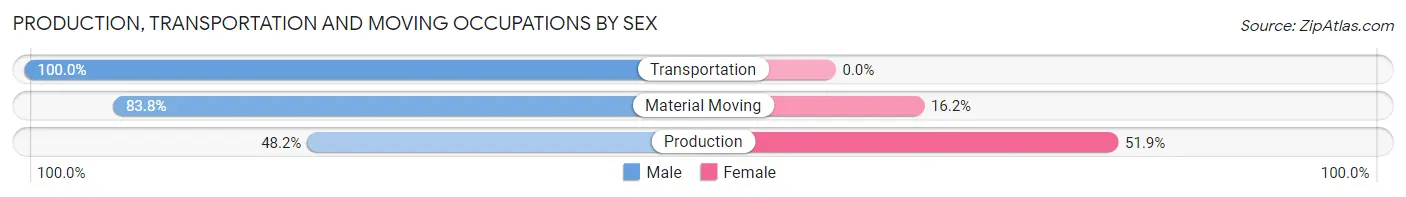
| Occupation | Male | Female |
| Production | 26 (48.1%) | 28 (51.8%) |
| Transportation | 21 (100.0%) | 0 (0.0%) |
| Material Moving | 31 (83.8%) | 6 (16.2%) |
| Total (Category) | 78 (69.6%) | 34 (30.4%) |
| Total (Overall) | 661 (57.2%) | 495 (42.8%) |
Employment Industries by Sex in Myersville
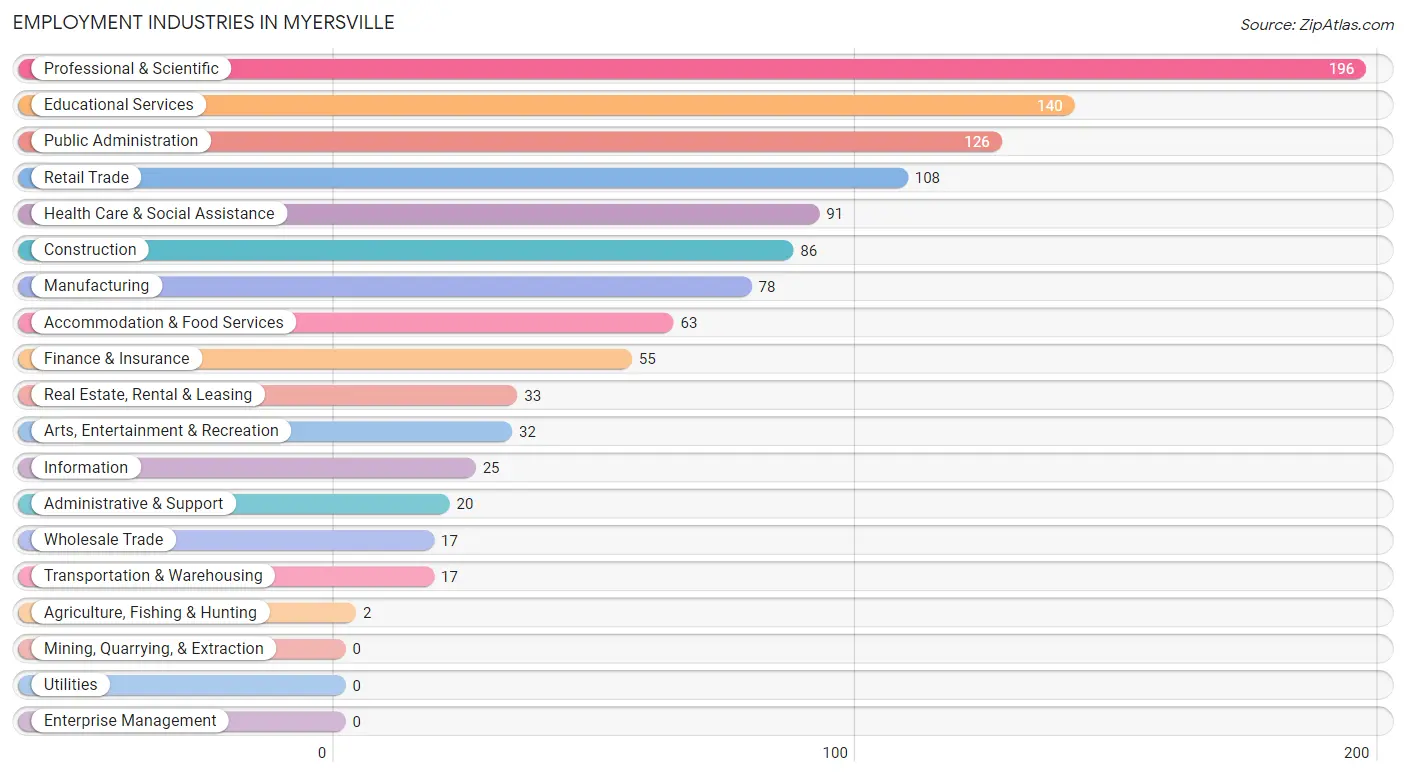
Employment Industries in Myersville
The major employment industries in Myersville include Professional & Scientific (196 | 17.0%), Educational Services (140 | 12.1%), Public Administration (126 | 10.9%), Retail Trade (108 | 9.3%), and Health Care & Social Assistance (91 | 7.9%).
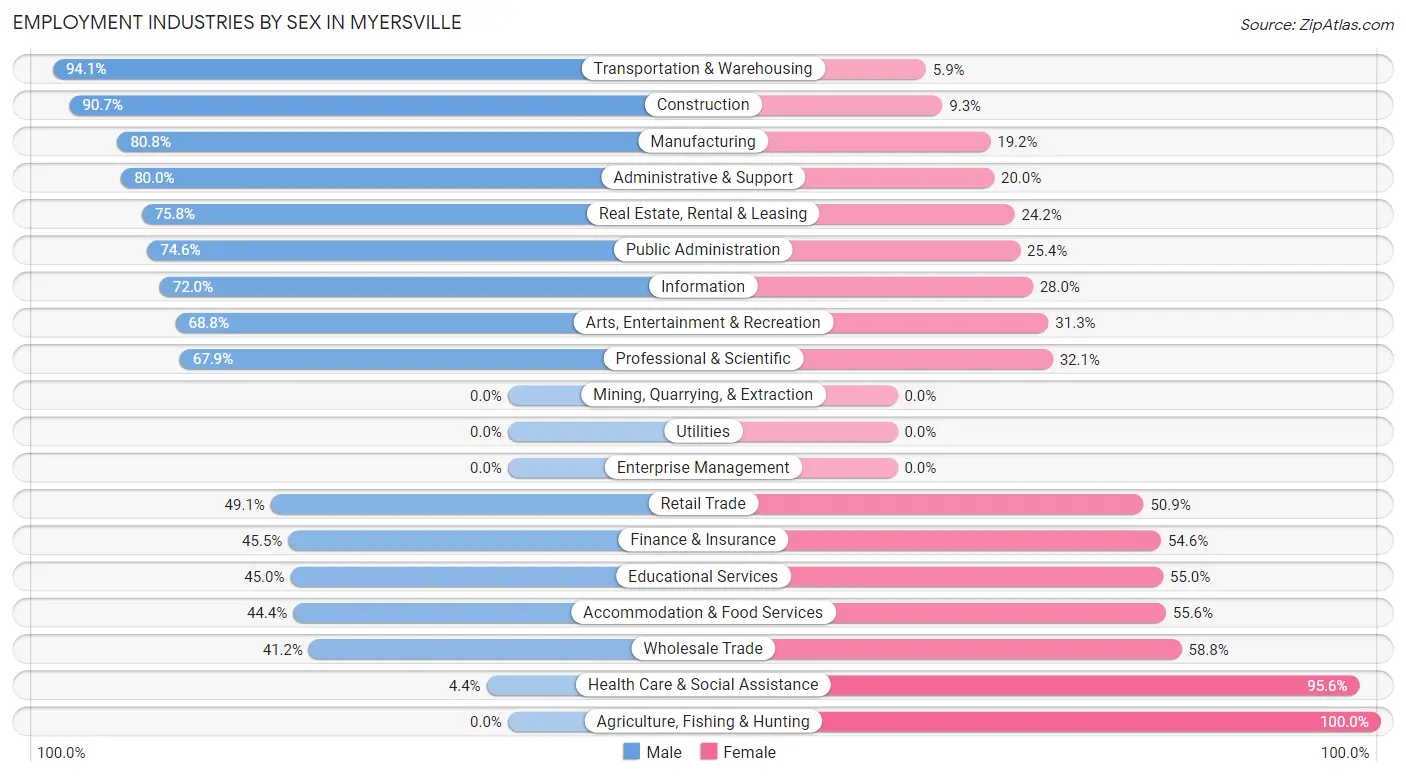
Employment Industries by Sex in Myersville
The Myersville industries that see more men than women are Transportation & Warehousing (94.1%), Construction (90.7%), and Manufacturing (80.8%), whereas the industries that tend to have a higher number of women are Agriculture, Fishing & Hunting (100.0%), Health Care & Social Assistance (95.6%), and Wholesale Trade (58.8%).
| Industry | Male | Female |
| Agriculture, Fishing & Hunting | 0 (0.0%) | 2 (100.0%) |
| Mining, Quarrying, & Extraction | 0 (0.0%) | 0 (0.0%) |
| Construction | 78 (90.7%) | 8 (9.3%) |
| Manufacturing | 63 (80.8%) | 15 (19.2%) |
| Wholesale Trade | 7 (41.2%) | 10 (58.8%) |
| Retail Trade | 53 (49.1%) | 55 (50.9%) |
| Transportation & Warehousing | 16 (94.1%) | 1 (5.9%) |
| Utilities | 0 (0.0%) | 0 (0.0%) |
| Information | 18 (72.0%) | 7 (28.0%) |
| Finance & Insurance | 25 (45.5%) | 30 (54.5%) |
| Real Estate, Rental & Leasing | 25 (75.8%) | 8 (24.2%) |
| Professional & Scientific | 133 (67.9%) | 63 (32.1%) |
| Enterprise Management | 0 (0.0%) | 0 (0.0%) |
| Administrative & Support | 16 (80.0%) | 4 (20.0%) |
| Educational Services | 63 (45.0%) | 77 (55.0%) |
| Health Care & Social Assistance | 4 (4.4%) | 87 (95.6%) |
| Arts, Entertainment & Recreation | 22 (68.8%) | 10 (31.2%) |
| Accommodation & Food Services | 28 (44.4%) | 35 (55.6%) |
| Public Administration | 94 (74.6%) | 32 (25.4%) |
| Total | 661 (57.2%) | 495 (42.8%) |
Education in Myersville
School Enrollment in Myersville
The most common levels of schooling among the 980 students in Myersville are elementary school (325 | 33.2%), middle school (314 | 32.0%), and college / undergraduate (135 | 13.8%).
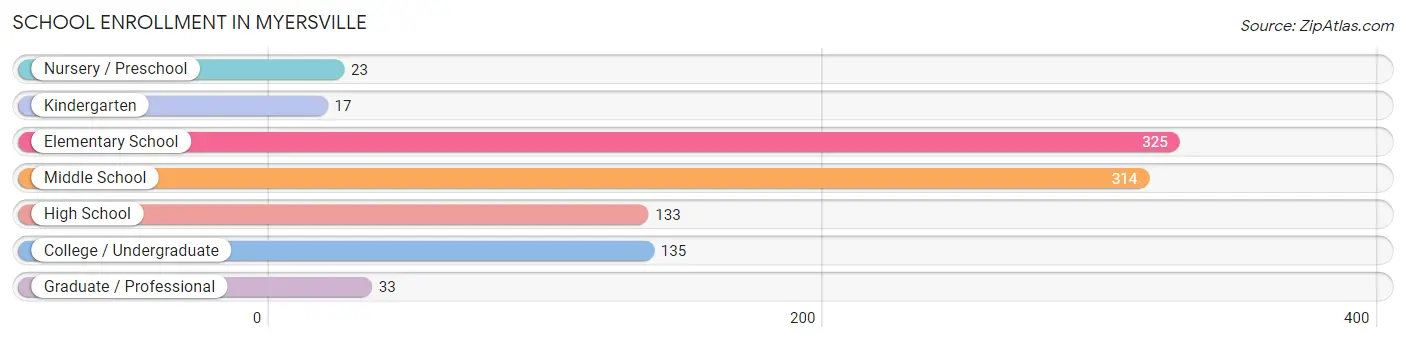
| School Level | # Students | % Students |
| Nursery / Preschool | 23 | 2.4% |
| Kindergarten | 17 | 1.7% |
| Elementary School | 325 | 33.2% |
| Middle School | 314 | 32.0% |
| High School | 133 | 13.6% |
| College / Undergraduate | 135 | 13.8% |
| Graduate / Professional | 33 | 3.4% |
| Total | 980 | 100.0% |
School Enrollment by Age by Funding Source in Myersville
Out of a total of 980 students who are enrolled in schools in Myersville, 158 (16.1%) attend a private institution, while the remaining 822 (83.9%) are enrolled in public schools. The age group of 3 to 4 year olds has the highest likelihood of being enrolled in private schools, with 13 (76.5% in the age bracket) enrolled. Conversely, the age group of 18 to 19 year olds has the lowest likelihood of being enrolled in a private school, with 54 (100.0% in the age bracket) attending a public institution.
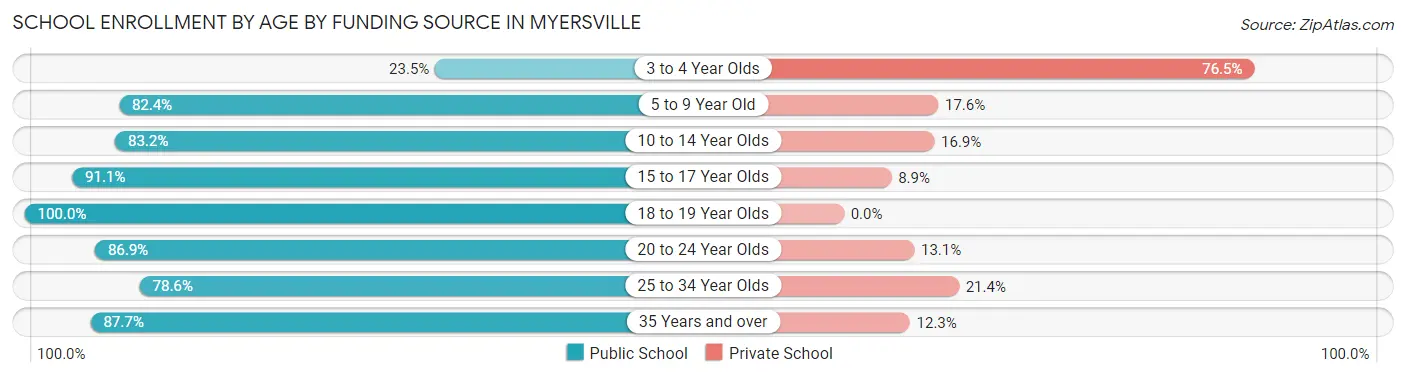
| Age Bracket | Public School | Private School |
| 3 to 4 Year Olds | 4 (23.5%) | 13 (76.5%) |
| 5 to 9 Year Old | 272 (82.4%) | 58 (17.6%) |
| 10 to 14 Year Olds | 306 (83.2%) | 62 (16.9%) |
| 15 to 17 Year Olds | 72 (91.1%) | 7 (8.9%) |
| 18 to 19 Year Olds | 54 (100.0%) | 0 (0.0%) |
| 20 to 24 Year Olds | 53 (86.9%) | 8 (13.1%) |
| 25 to 34 Year Olds | 11 (78.6%) | 3 (21.4%) |
| 35 Years and over | 50 (87.7%) | 7 (12.3%) |
| Total | 822 (83.9%) | 158 (16.1%) |
Educational Attainment by Field of Study in Myersville
Arts & humanities (113 | 14.9%), business (108 | 14.2%), social sciences (99 | 13.0%), psychology (74 | 9.8%), and education (66 | 8.7%) are the most common fields of study among 759 individuals in Myersville who have obtained a bachelor's degree or higher.
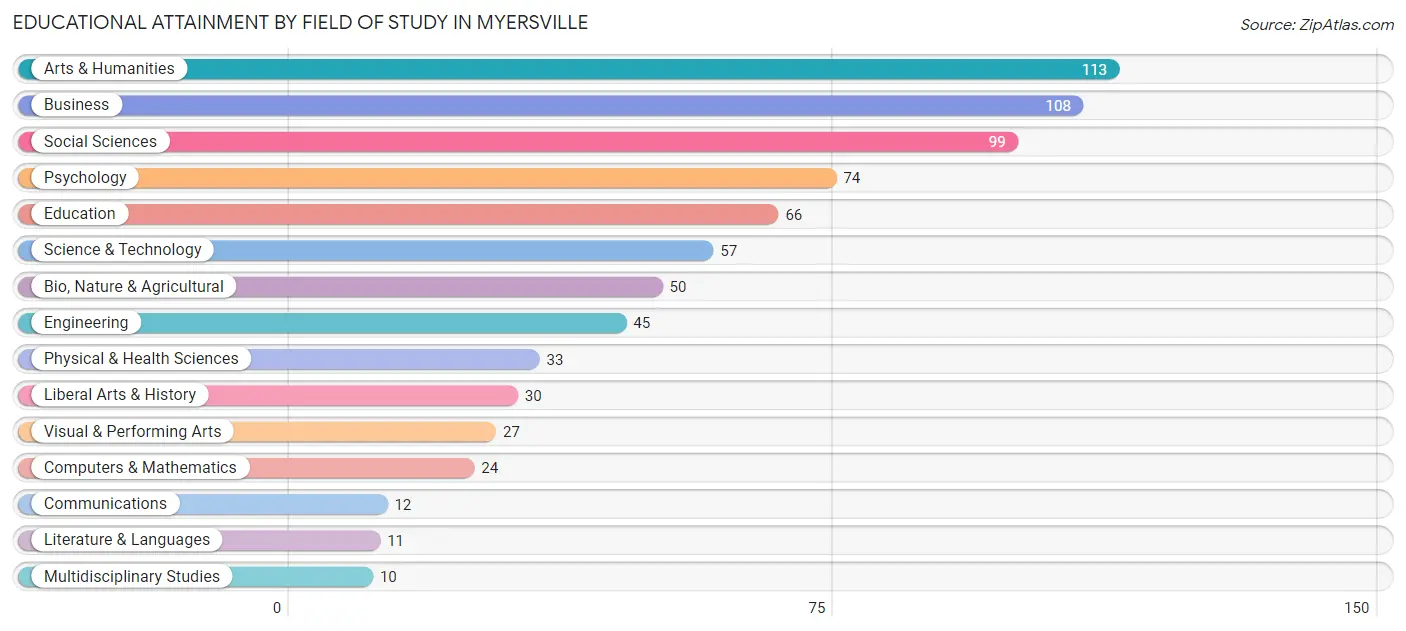
| Field of Study | # Graduates | % Graduates |
| Computers & Mathematics | 24 | 3.2% |
| Bio, Nature & Agricultural | 50 | 6.6% |
| Physical & Health Sciences | 33 | 4.3% |
| Psychology | 74 | 9.8% |
| Social Sciences | 99 | 13.0% |
| Engineering | 45 | 5.9% |
| Multidisciplinary Studies | 10 | 1.3% |
| Science & Technology | 57 | 7.5% |
| Business | 108 | 14.2% |
| Education | 66 | 8.7% |
| Literature & Languages | 11 | 1.5% |
| Liberal Arts & History | 30 | 4.0% |
| Visual & Performing Arts | 27 | 3.6% |
| Communications | 12 | 1.6% |
| Arts & Humanities | 113 | 14.9% |
| Total | 759 | 100.0% |
Transportation & Commute in Myersville
Vehicle Availability by Sex in Myersville
The most prevalent vehicle ownership categories in Myersville are males with 2 vehicles (327, accounting for 49.0%) and females with 2 vehicles (221, making up 67.0%).
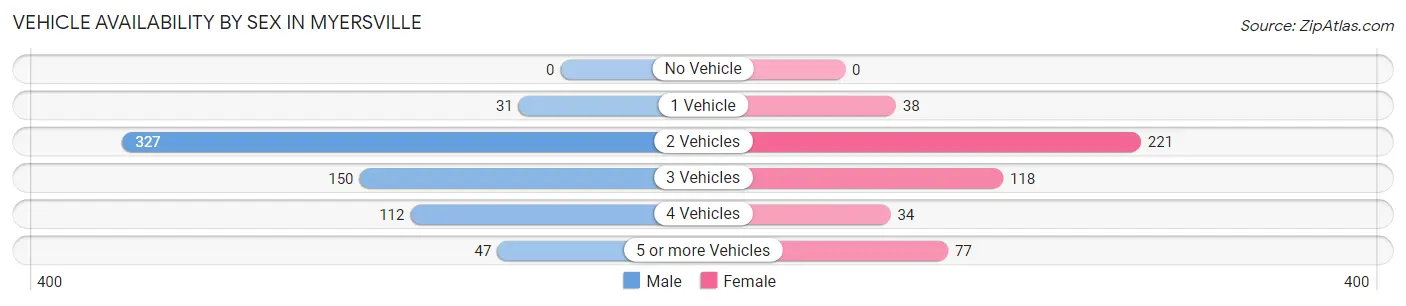
| Vehicles Available | Male | Female |
| No Vehicle | 0 (0.0%) | 0 (0.0%) |
| 1 Vehicle | 31 (4.6%) | 38 (7.8%) |
| 2 Vehicles | 327 (49.0%) | 221 (45.3%) |
| 3 Vehicles | 150 (22.5%) | 118 (24.2%) |
| 4 Vehicles | 112 (16.8%) | 34 (7.0%) |
| 5 or more Vehicles | 47 (7.0%) | 77 (15.8%) |
| Total | 667 (100.0%) | 488 (100.0%) |
Commute Time in Myersville
The most frequently occuring commute durations in Myersville are 20 to 24 minutes (175 commuters, 19.7%), 15 to 19 minutes (107 commuters, 12.0%), and 60 to 89 minutes (105 commuters, 11.8%).
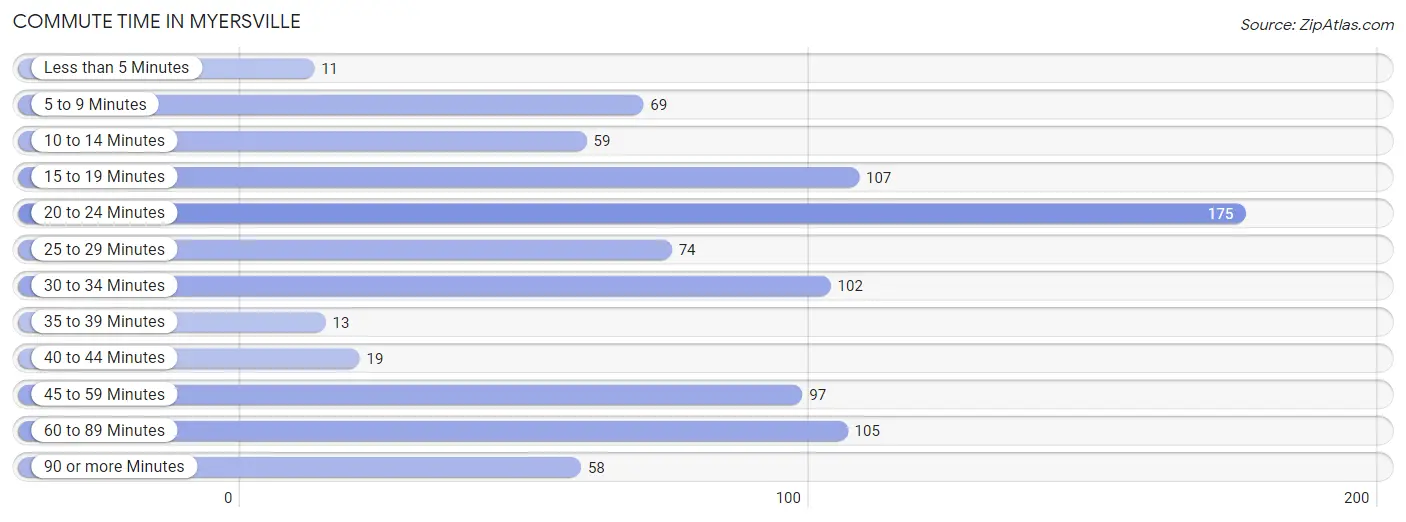
| Commute Time | # Commuters | % Commuters |
| Less than 5 Minutes | 11 | 1.2% |
| 5 to 9 Minutes | 69 | 7.8% |
| 10 to 14 Minutes | 59 | 6.6% |
| 15 to 19 Minutes | 107 | 12.0% |
| 20 to 24 Minutes | 175 | 19.7% |
| 25 to 29 Minutes | 74 | 8.3% |
| 30 to 34 Minutes | 102 | 11.5% |
| 35 to 39 Minutes | 13 | 1.5% |
| 40 to 44 Minutes | 19 | 2.1% |
| 45 to 59 Minutes | 97 | 10.9% |
| 60 to 89 Minutes | 105 | 11.8% |
| 90 or more Minutes | 58 | 6.5% |
Commute Time by Sex in Myersville
The most common commute times in Myersville are 60 to 89 minutes (82 commuters, 17.3%) for males and 20 to 24 minutes (98 commuters, 23.6%) for females.
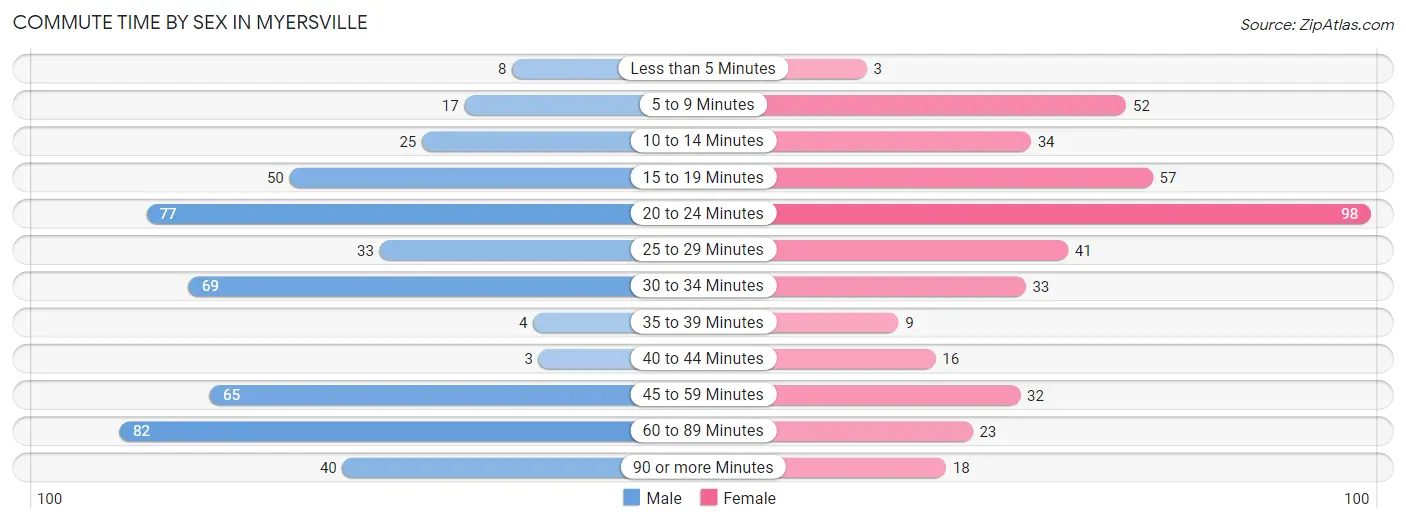
| Commute Time | Male | Female |
| Less than 5 Minutes | 8 (1.7%) | 3 (0.7%) |
| 5 to 9 Minutes | 17 (3.6%) | 52 (12.5%) |
| 10 to 14 Minutes | 25 (5.3%) | 34 (8.2%) |
| 15 to 19 Minutes | 50 (10.6%) | 57 (13.7%) |
| 20 to 24 Minutes | 77 (16.3%) | 98 (23.6%) |
| 25 to 29 Minutes | 33 (7.0%) | 41 (9.9%) |
| 30 to 34 Minutes | 69 (14.6%) | 33 (7.9%) |
| 35 to 39 Minutes | 4 (0.9%) | 9 (2.2%) |
| 40 to 44 Minutes | 3 (0.6%) | 16 (3.8%) |
| 45 to 59 Minutes | 65 (13.7%) | 32 (7.7%) |
| 60 to 89 Minutes | 82 (17.3%) | 23 (5.5%) |
| 90 or more Minutes | 40 (8.5%) | 18 (4.3%) |
Time of Departure to Work by Sex in Myersville
The most frequent times of departure to work in Myersville are 6:30 AM to 6:59 AM (66, 14.0%) for males and 7:00 AM to 7:29 AM (72, 17.3%) for females.
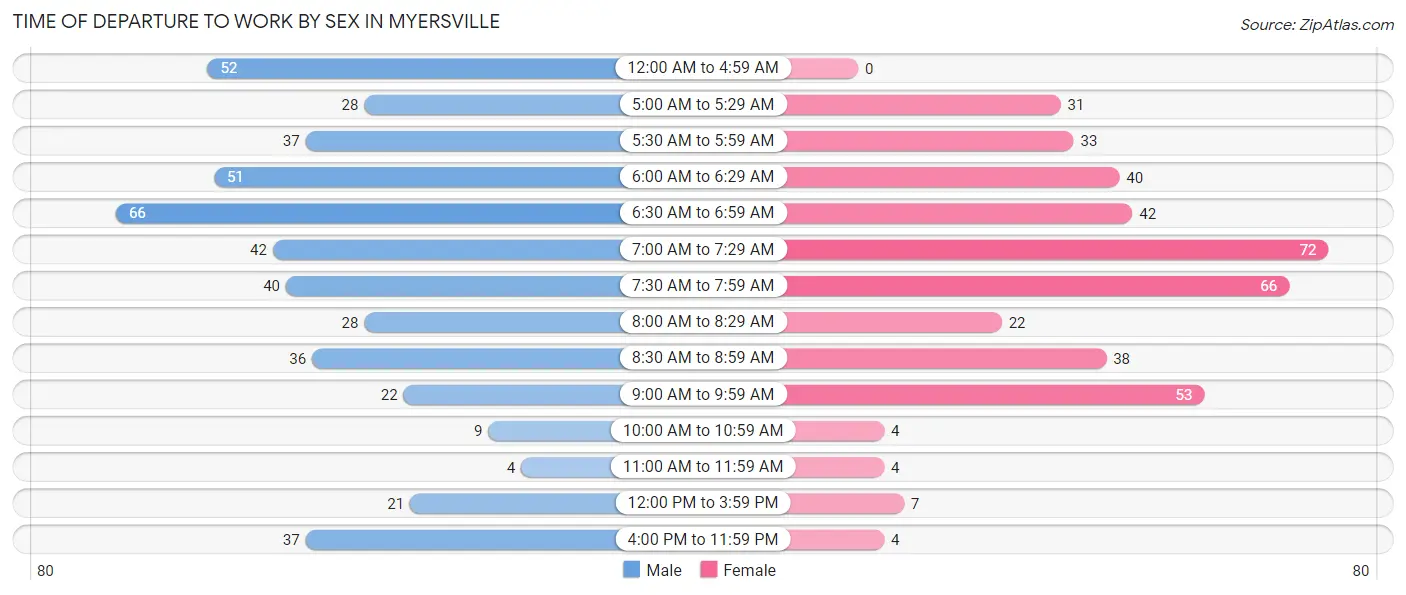
| Time of Departure | Male | Female |
| 12:00 AM to 4:59 AM | 52 (11.0%) | 0 (0.0%) |
| 5:00 AM to 5:29 AM | 28 (5.9%) | 31 (7.4%) |
| 5:30 AM to 5:59 AM | 37 (7.8%) | 33 (7.9%) |
| 6:00 AM to 6:29 AM | 51 (10.8%) | 40 (9.6%) |
| 6:30 AM to 6:59 AM | 66 (14.0%) | 42 (10.1%) |
| 7:00 AM to 7:29 AM | 42 (8.9%) | 72 (17.3%) |
| 7:30 AM to 7:59 AM | 40 (8.5%) | 66 (15.9%) |
| 8:00 AM to 8:29 AM | 28 (5.9%) | 22 (5.3%) |
| 8:30 AM to 8:59 AM | 36 (7.6%) | 38 (9.1%) |
| 9:00 AM to 9:59 AM | 22 (4.6%) | 53 (12.7%) |
| 10:00 AM to 10:59 AM | 9 (1.9%) | 4 (1.0%) |
| 11:00 AM to 11:59 AM | 4 (0.9%) | 4 (1.0%) |
| 12:00 PM to 3:59 PM | 21 (4.4%) | 7 (1.7%) |
| 4:00 PM to 11:59 PM | 37 (7.8%) | 4 (1.0%) |
| Total | 473 (100.0%) | 416 (100.0%) |
Housing Occupancy in Myersville
Occupancy by Ownership in Myersville
Of the total 679 dwellings in Myersville, owner-occupied units account for 633 (93.2%), while renter-occupied units make up 46 (6.8%).
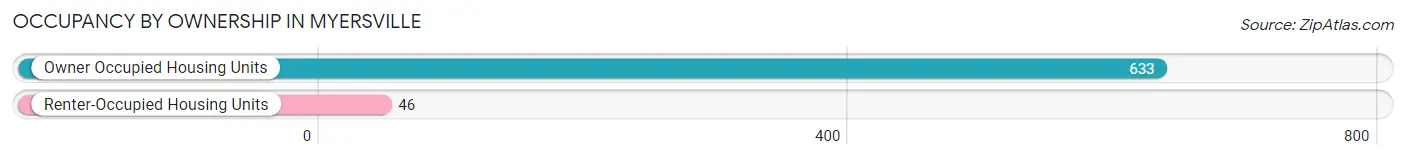
| Occupancy | # Housing Units | % Housing Units |
| Owner Occupied Housing Units | 633 | 93.2% |
| Renter-Occupied Housing Units | 46 | 6.8% |
| Total Occupied Housing Units | 679 | 100.0% |
Occupancy by Household Size in Myersville
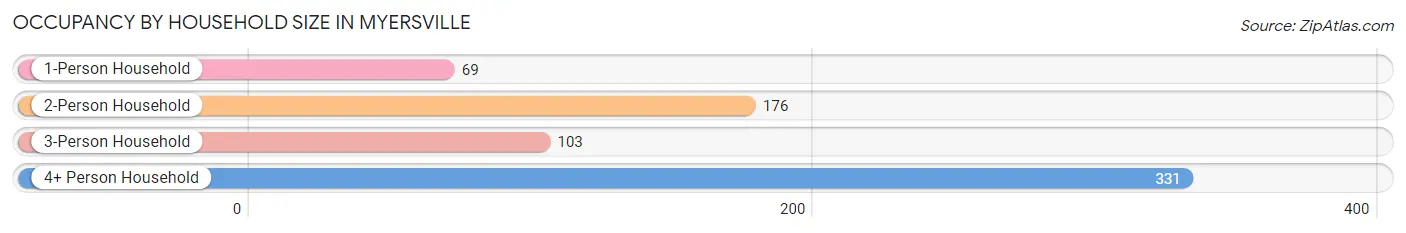
| Household Size | # Housing Units | % Housing Units |
| 1-Person Household | 69 | 10.2% |
| 2-Person Household | 176 | 25.9% |
| 3-Person Household | 103 | 15.2% |
| 4+ Person Household | 331 | 48.7% |
| Total Housing Units | 679 | 100.0% |
Occupancy by Ownership by Household Size in Myersville
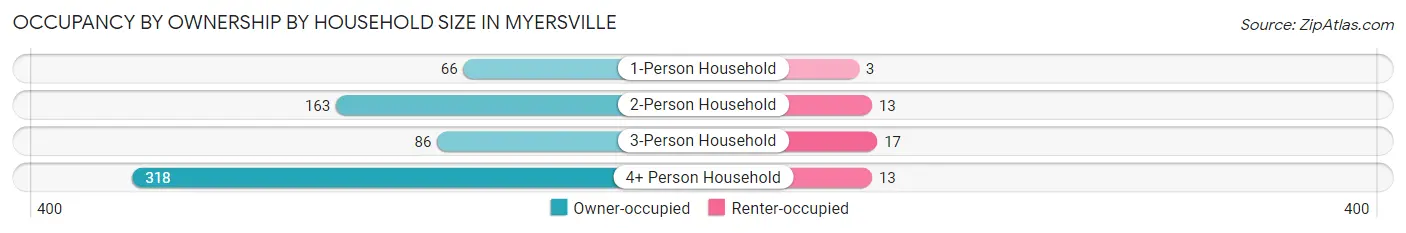
| Household Size | Owner-occupied | Renter-occupied |
| 1-Person Household | 66 (95.7%) | 3 (4.3%) |
| 2-Person Household | 163 (92.6%) | 13 (7.4%) |
| 3-Person Household | 86 (83.5%) | 17 (16.5%) |
| 4+ Person Household | 318 (96.1%) | 13 (3.9%) |
| Total Housing Units | 633 (93.2%) | 46 (6.8%) |
Occupancy by Educational Attainment in Myersville
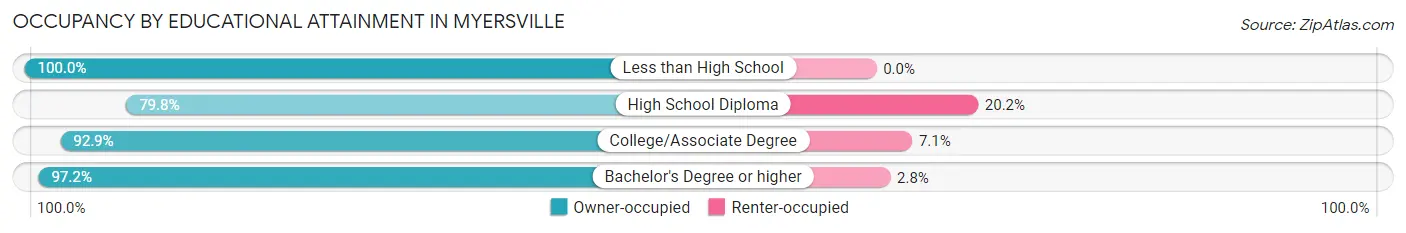
| Household Size | Owner-occupied | Renter-occupied |
| Less than High School | 38 (100.0%) | 0 (0.0%) |
| High School Diploma | 99 (79.8%) | 25 (20.2%) |
| College/Associate Degree | 144 (92.9%) | 11 (7.1%) |
| Bachelor's Degree or higher | 352 (97.2%) | 10 (2.8%) |
Occupancy by Age of Householder in Myersville
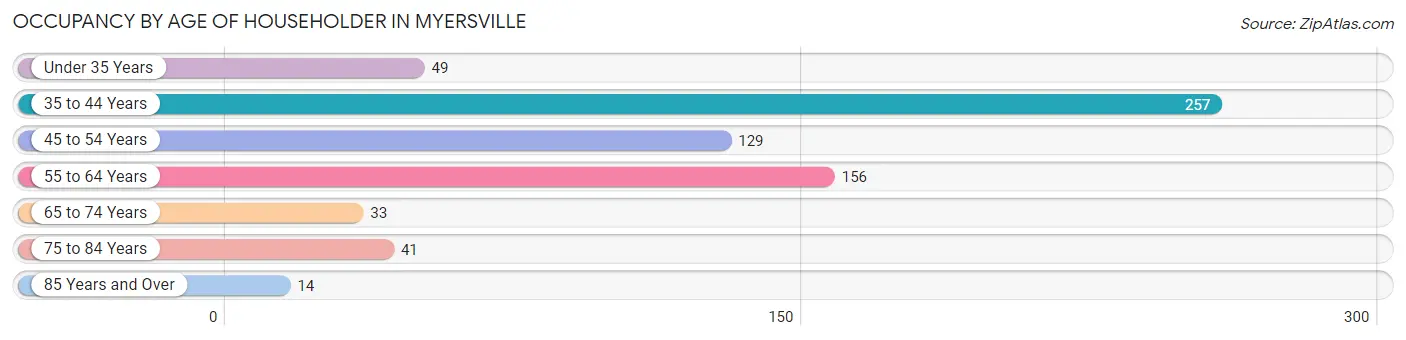
| Age Bracket | # Households | % Households |
| Under 35 Years | 49 | 7.2% |
| 35 to 44 Years | 257 | 37.9% |
| 45 to 54 Years | 129 | 19.0% |
| 55 to 64 Years | 156 | 23.0% |
| 65 to 74 Years | 33 | 4.9% |
| 75 to 84 Years | 41 | 6.0% |
| 85 Years and Over | 14 | 2.1% |
| Total | 679 | 100.0% |
Housing Finances in Myersville
Median Income by Occupancy in Myersville
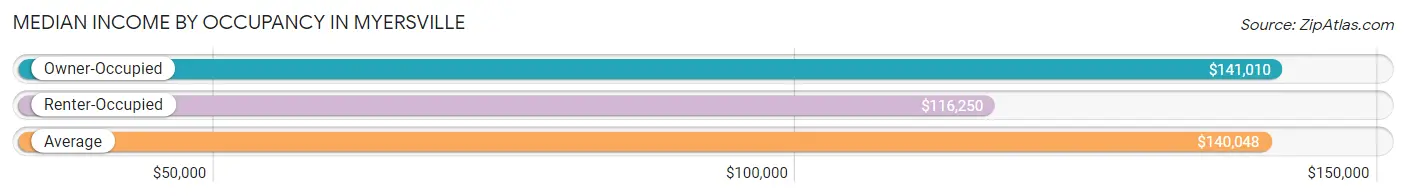
| Occupancy Type | # Households | Median Income |
| Owner-Occupied | 633 (93.2%) | $141,010 |
| Renter-Occupied | 46 (6.8%) | $116,250 |
| Average | 679 (100.0%) | $140,048 |
Occupancy by Householder Income Bracket in Myersville
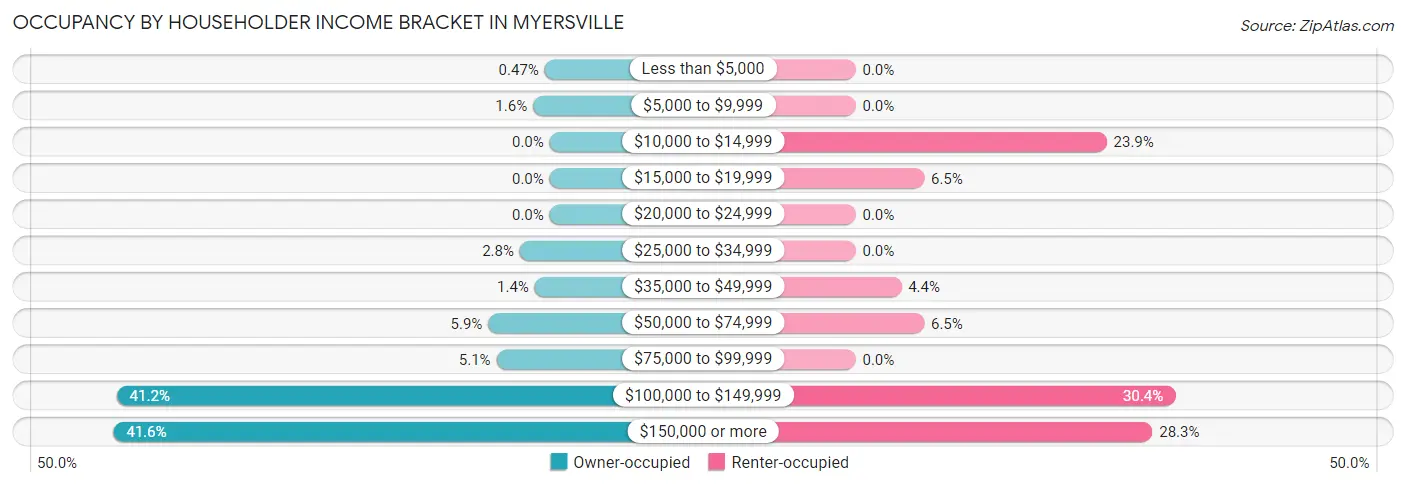
| Income Bracket | Owner-occupied | Renter-occupied |
| Less than $5,000 | 3 (0.5%) | 0 (0.0%) |
| $5,000 to $9,999 | 10 (1.6%) | 0 (0.0%) |
| $10,000 to $14,999 | 0 (0.0%) | 11 (23.9%) |
| $15,000 to $19,999 | 0 (0.0%) | 3 (6.5%) |
| $20,000 to $24,999 | 0 (0.0%) | 0 (0.0%) |
| $25,000 to $34,999 | 18 (2.8%) | 0 (0.0%) |
| $35,000 to $49,999 | 9 (1.4%) | 2 (4.3%) |
| $50,000 to $74,999 | 37 (5.9%) | 3 (6.5%) |
| $75,000 to $99,999 | 32 (5.1%) | 0 (0.0%) |
| $100,000 to $149,999 | 261 (41.2%) | 14 (30.4%) |
| $150,000 or more | 263 (41.5%) | 13 (28.3%) |
| Total | 633 (100.0%) | 46 (100.0%) |
Monthly Housing Cost Tiers in Myersville
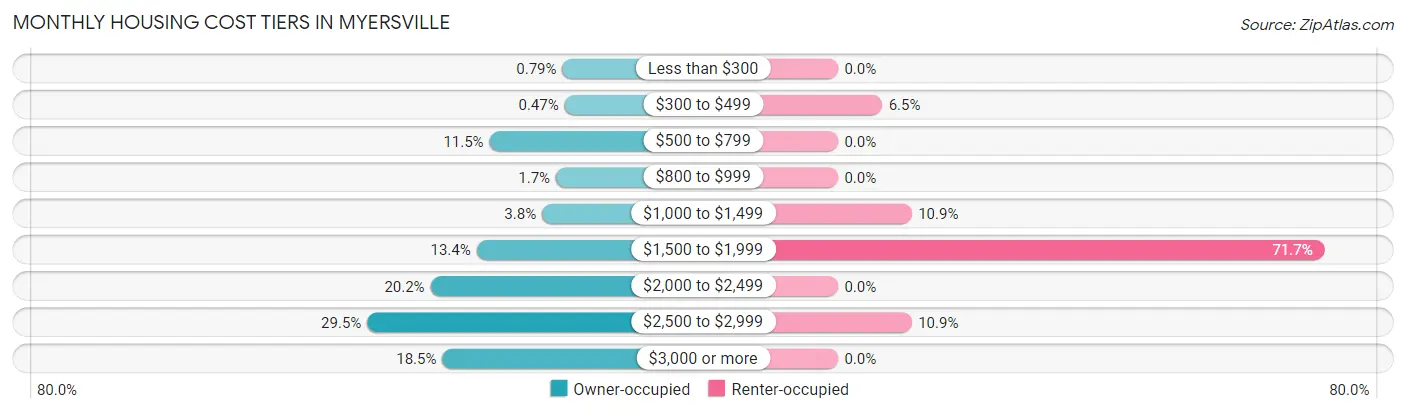
| Monthly Cost | Owner-occupied | Renter-occupied |
| Less than $300 | 5 (0.8%) | 0 (0.0%) |
| $300 to $499 | 3 (0.5%) | 3 (6.5%) |
| $500 to $799 | 73 (11.5%) | 0 (0.0%) |
| $800 to $999 | 11 (1.7%) | 0 (0.0%) |
| $1,000 to $1,499 | 24 (3.8%) | 5 (10.9%) |
| $1,500 to $1,999 | 85 (13.4%) | 33 (71.7%) |
| $2,000 to $2,499 | 128 (20.2%) | 0 (0.0%) |
| $2,500 to $2,999 | 187 (29.5%) | 5 (10.9%) |
| $3,000 or more | 117 (18.5%) | 0 (0.0%) |
| Total | 633 (100.0%) | 46 (100.0%) |
Physical Housing Characteristics in Myersville
Housing Structures in Myersville
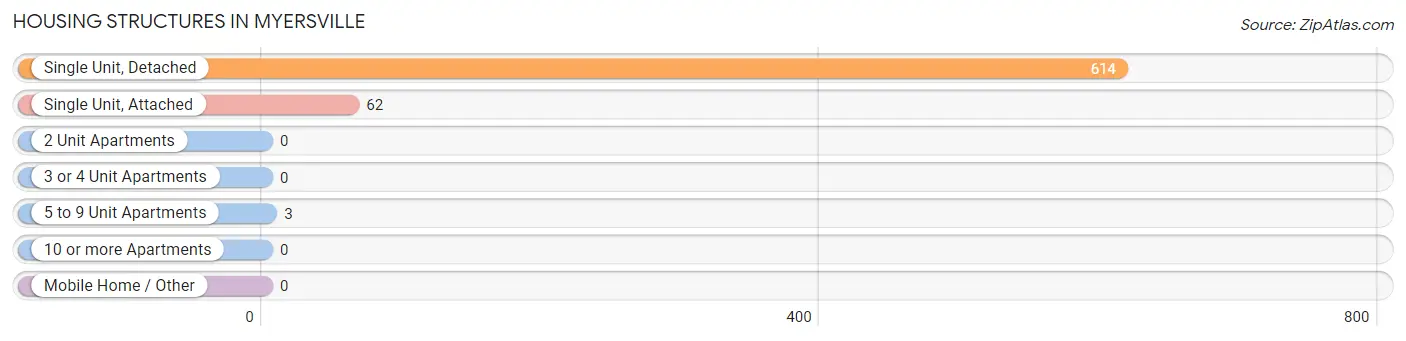
| Structure Type | # Housing Units | % Housing Units |
| Single Unit, Detached | 614 | 90.4% |
| Single Unit, Attached | 62 | 9.1% |
| 2 Unit Apartments | 0 | 0.0% |
| 3 or 4 Unit Apartments | 0 | 0.0% |
| 5 to 9 Unit Apartments | 3 | 0.4% |
| 10 or more Apartments | 0 | 0.0% |
| Mobile Home / Other | 0 | 0.0% |
| Total | 679 | 100.0% |
Housing Structures by Occupancy in Myersville
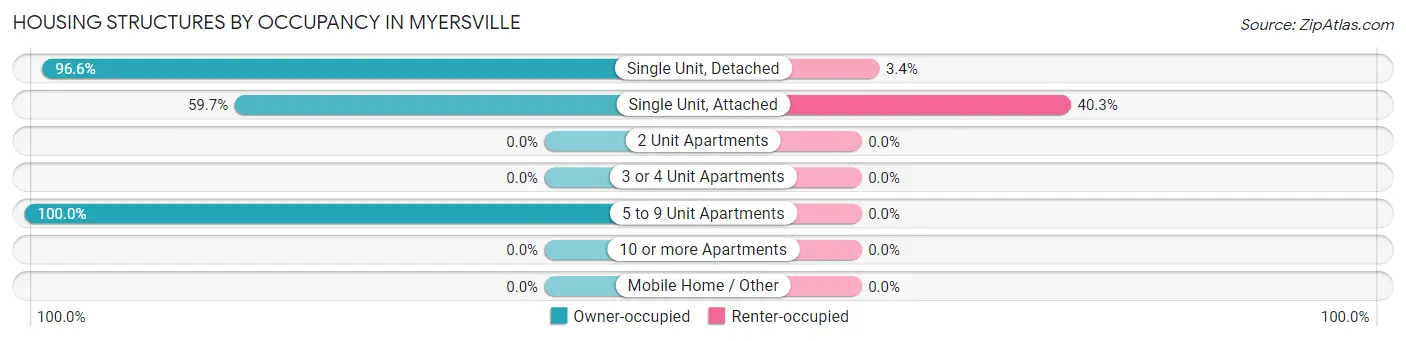
| Structure Type | Owner-occupied | Renter-occupied |
| Single Unit, Detached | 593 (96.6%) | 21 (3.4%) |
| Single Unit, Attached | 37 (59.7%) | 25 (40.3%) |
| 2 Unit Apartments | 0 (0.0%) | 0 (0.0%) |
| 3 or 4 Unit Apartments | 0 (0.0%) | 0 (0.0%) |
| 5 to 9 Unit Apartments | 3 (100.0%) | 0 (0.0%) |
| 10 or more Apartments | 0 (0.0%) | 0 (0.0%) |
| Mobile Home / Other | 0 (0.0%) | 0 (0.0%) |
| Total | 633 (93.2%) | 46 (6.8%) |
Housing Structures by Number of Rooms in Myersville
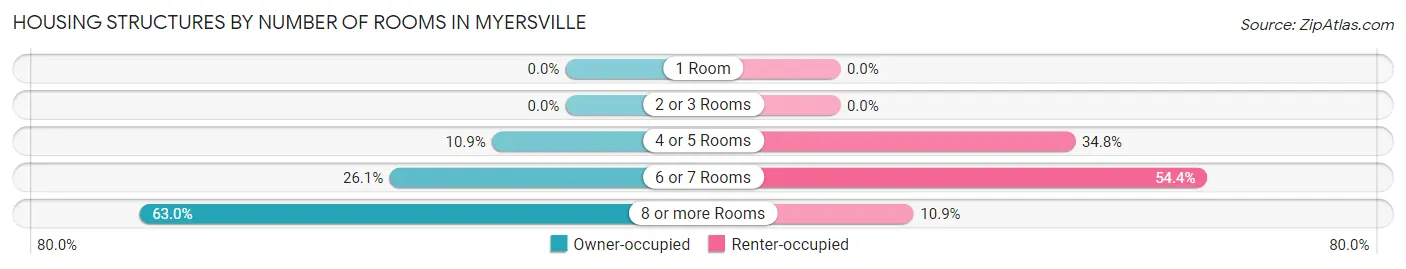
| Number of Rooms | Owner-occupied | Renter-occupied |
| 1 Room | 0 (0.0%) | 0 (0.0%) |
| 2 or 3 Rooms | 0 (0.0%) | 0 (0.0%) |
| 4 or 5 Rooms | 69 (10.9%) | 16 (34.8%) |
| 6 or 7 Rooms | 165 (26.1%) | 25 (54.3%) |
| 8 or more Rooms | 399 (63.0%) | 5 (10.9%) |
| Total | 633 (100.0%) | 46 (100.0%) |
Housing Structure by Heating Type in Myersville
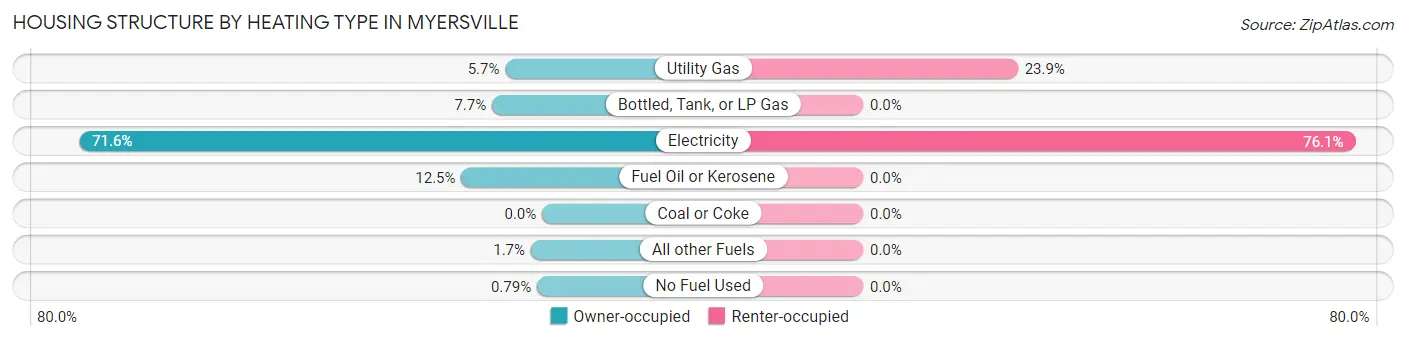
| Heating Type | Owner-occupied | Renter-occupied |
| Utility Gas | 36 (5.7%) | 11 (23.9%) |
| Bottled, Tank, or LP Gas | 49 (7.7%) | 0 (0.0%) |
| Electricity | 453 (71.6%) | 35 (76.1%) |
| Fuel Oil or Kerosene | 79 (12.5%) | 0 (0.0%) |
| Coal or Coke | 0 (0.0%) | 0 (0.0%) |
| All other Fuels | 11 (1.7%) | 0 (0.0%) |
| No Fuel Used | 5 (0.8%) | 0 (0.0%) |
| Total | 633 (100.0%) | 46 (100.0%) |
Household Vehicle Usage in Myersville
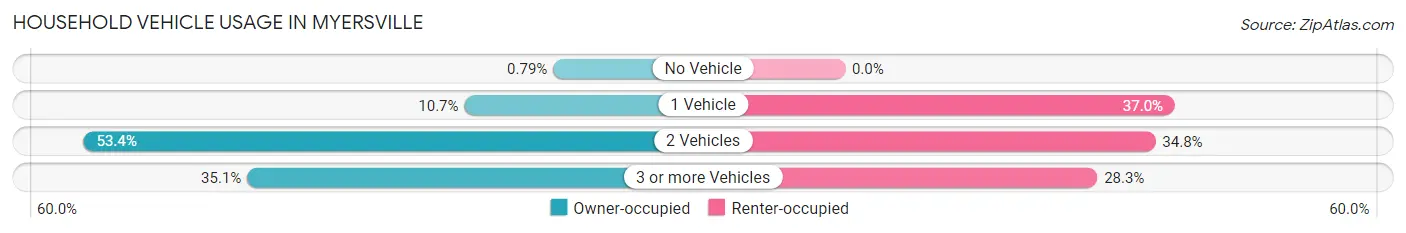
| Vehicles per Household | Owner-occupied | Renter-occupied |
| No Vehicle | 5 (0.8%) | 0 (0.0%) |
| 1 Vehicle | 68 (10.7%) | 17 (37.0%) |
| 2 Vehicles | 338 (53.4%) | 16 (34.8%) |
| 3 or more Vehicles | 222 (35.1%) | 13 (28.3%) |
| Total | 633 (100.0%) | 46 (100.0%) |
Real Estate & Mortgages in Myersville
Real Estate and Mortgage Overview in Myersville
| Characteristic | Without Mortgage | With Mortgage |
| Housing Units | 101 | 532 |
| Median Property Value | $372,000 | $454,500 |
| Median Household Income | $117,656 | $248 |
| Monthly Housing Costs | $681 | $117 |
| Real Estate Taxes | $4,186 | $0 |
Property Value by Mortgage Status in Myersville
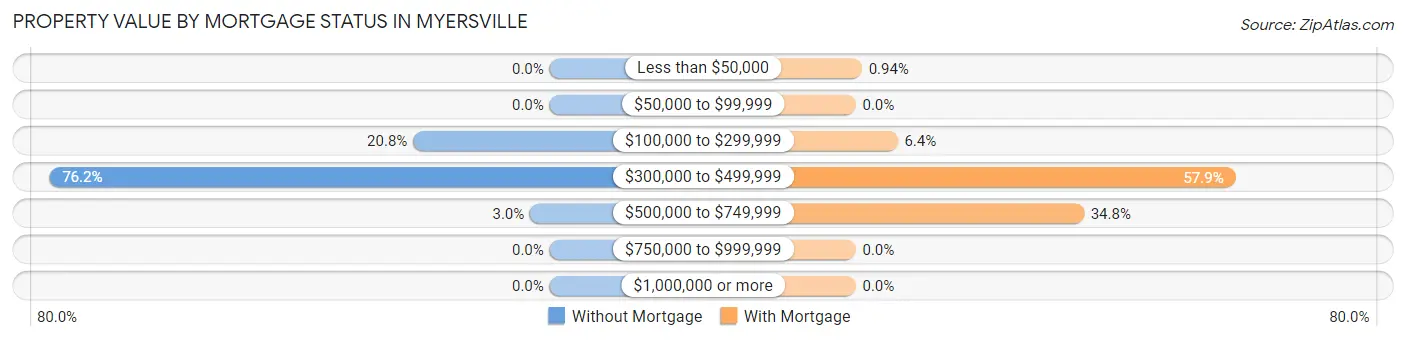
| Property Value | Without Mortgage | With Mortgage |
| Less than $50,000 | 0 (0.0%) | 5 (0.9%) |
| $50,000 to $99,999 | 0 (0.0%) | 0 (0.0%) |
| $100,000 to $299,999 | 21 (20.8%) | 34 (6.4%) |
| $300,000 to $499,999 | 77 (76.2%) | 308 (57.9%) |
| $500,000 to $749,999 | 3 (3.0%) | 185 (34.8%) |
| $750,000 to $999,999 | 0 (0.0%) | 0 (0.0%) |
| $1,000,000 or more | 0 (0.0%) | 0 (0.0%) |
| Total | 101 (100.0%) | 532 (100.0%) |
Household Income by Mortgage Status in Myersville
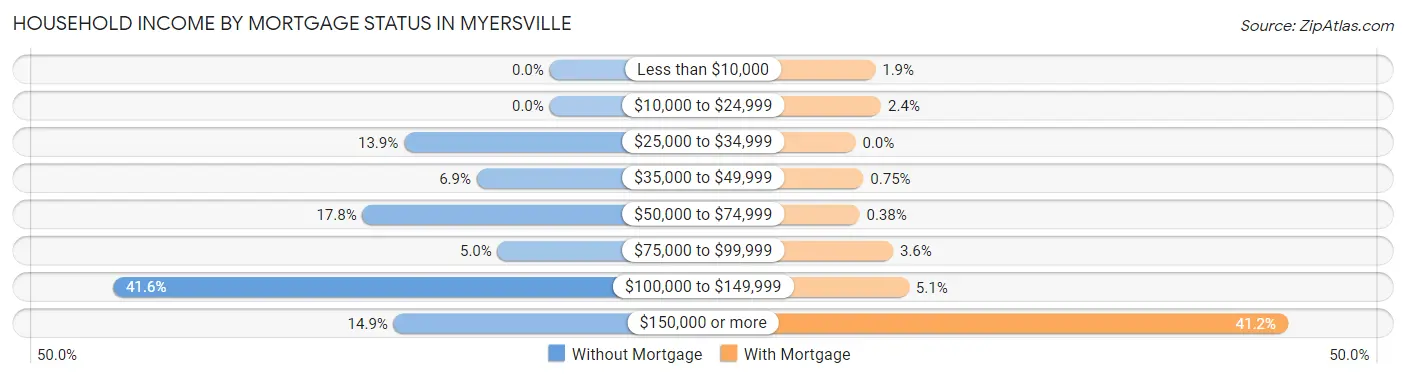
| Household Income | Without Mortgage | With Mortgage |
| Less than $10,000 | 0 (0.0%) | 10 (1.9%) |
| $10,000 to $24,999 | 0 (0.0%) | 13 (2.4%) |
| $25,000 to $34,999 | 14 (13.9%) | 0 (0.0%) |
| $35,000 to $49,999 | 7 (6.9%) | 4 (0.7%) |
| $50,000 to $74,999 | 18 (17.8%) | 2 (0.4%) |
| $75,000 to $99,999 | 5 (5.0%) | 19 (3.6%) |
| $100,000 to $149,999 | 42 (41.6%) | 27 (5.1%) |
| $150,000 or more | 15 (14.8%) | 219 (41.2%) |
| Total | 101 (100.0%) | 532 (100.0%) |
Property Value to Household Income Ratio in Myersville
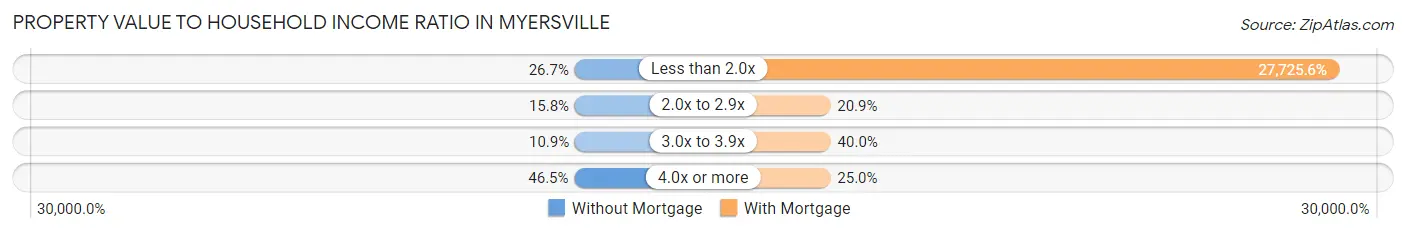
| Value-to-Income Ratio | Without Mortgage | With Mortgage |
| Less than 2.0x | 27 (26.7%) | 147,500 (27,725.6%) |
| 2.0x to 2.9x | 16 (15.8%) | 111 (20.9%) |
| 3.0x to 3.9x | 11 (10.9%) | 213 (40.0%) |
| 4.0x or more | 47 (46.5%) | 133 (25.0%) |
| Total | 101 (100.0%) | 532 (100.0%) |
Real Estate Taxes by Mortgage Status in Myersville
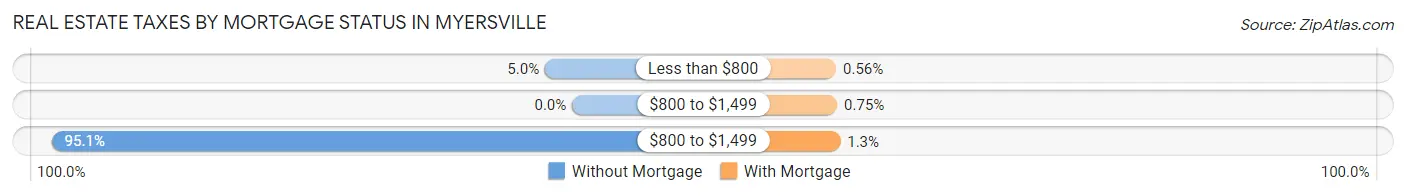
| Property Taxes | Without Mortgage | With Mortgage |
| Less than $800 | 5 (5.0%) | 3 (0.6%) |
| $800 to $1,499 | 0 (0.0%) | 4 (0.7%) |
| $800 to $1,499 | 96 (95.1%) | 7 (1.3%) |
| Total | 101 (100.0%) | 532 (100.0%) |
Health & Disability in Myersville
Health Insurance Coverage by Age in Myersville
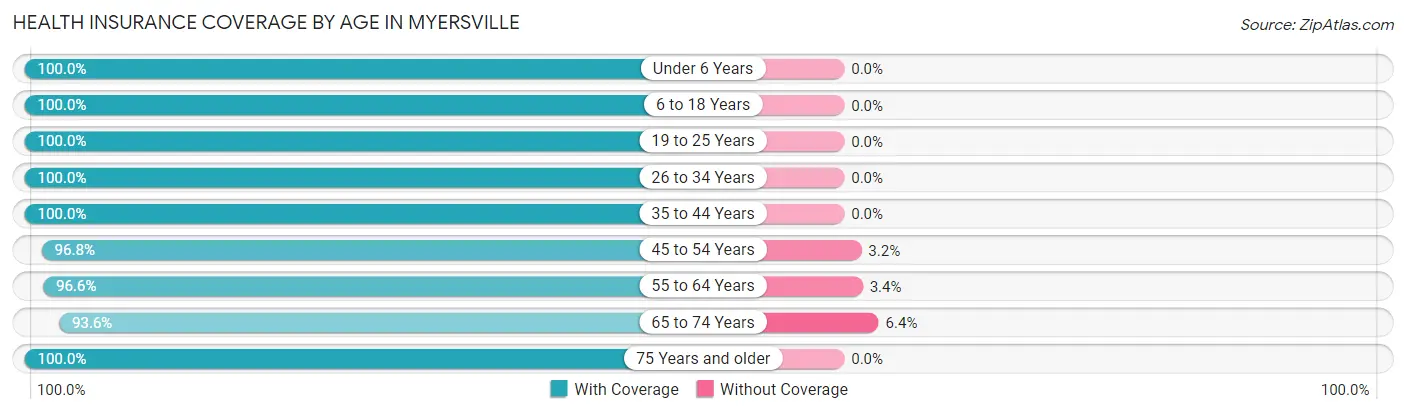
| Age Bracket | With Coverage | Without Coverage |
| Under 6 Years | 177 (100.0%) | 0 (0.0%) |
| 6 to 18 Years | 787 (100.0%) | 0 (0.0%) |
| 19 to 25 Years | 177 (100.0%) | 0 (0.0%) |
| 26 to 34 Years | 141 (100.0%) | 0 (0.0%) |
| 35 to 44 Years | 504 (100.0%) | 0 (0.0%) |
| 45 to 54 Years | 273 (96.8%) | 9 (3.2%) |
| 55 to 64 Years | 253 (96.6%) | 9 (3.4%) |
| 65 to 74 Years | 73 (93.6%) | 5 (6.4%) |
| 75 Years and older | 78 (100.0%) | 0 (0.0%) |
| Total | 2,463 (99.1%) | 23 (0.9%) |
Health Insurance Coverage by Citizenship Status in Myersville
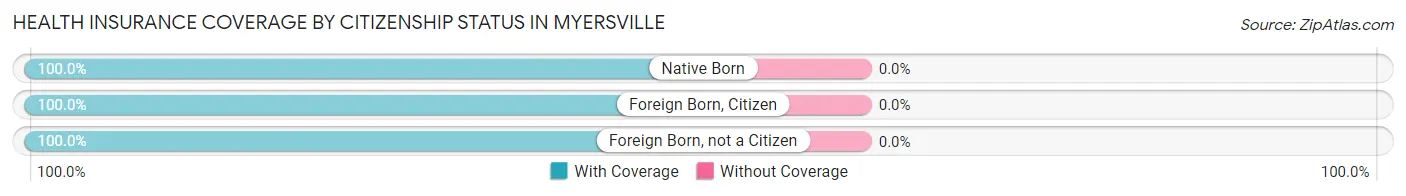
| Citizenship Status | With Coverage | Without Coverage |
| Native Born | 177 (100.0%) | 0 (0.0%) |
| Foreign Born, Citizen | 787 (100.0%) | 0 (0.0%) |
| Foreign Born, not a Citizen | 177 (100.0%) | 0 (0.0%) |
Health Insurance Coverage by Household Income in Myersville
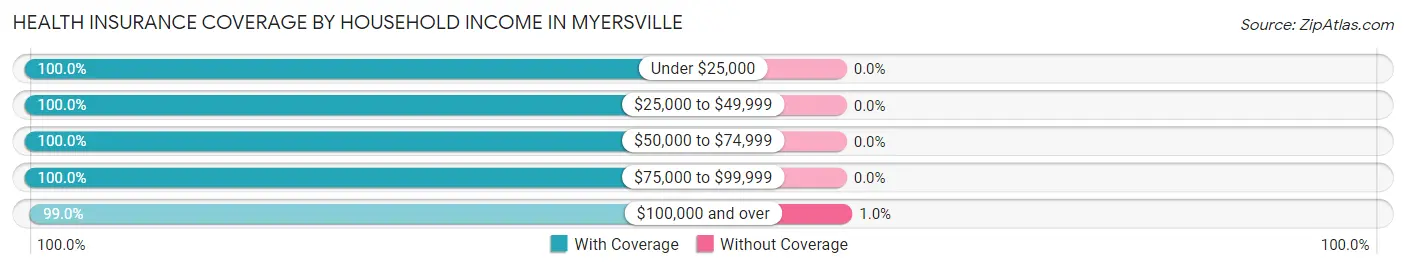
| Household Income | With Coverage | Without Coverage |
| Under $25,000 | 63 (100.0%) | 0 (0.0%) |
| $25,000 to $49,999 | 45 (100.0%) | 0 (0.0%) |
| $50,000 to $74,999 | 54 (100.0%) | 0 (0.0%) |
| $75,000 to $99,999 | 108 (100.0%) | 0 (0.0%) |
| $100,000 and over | 2,193 (99.0%) | 23 (1.0%) |
Public vs Private Health Insurance Coverage by Age in Myersville
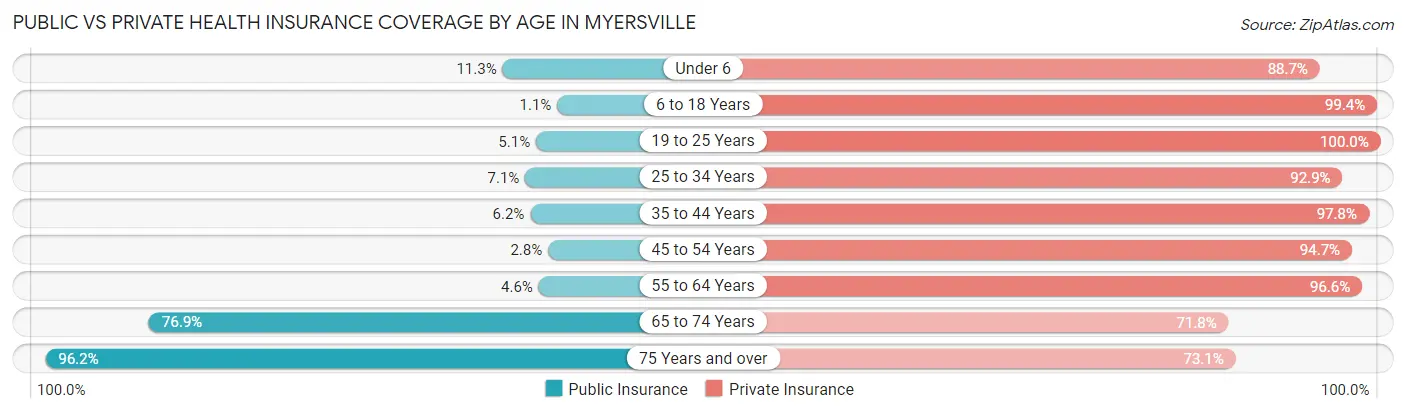
| Age Bracket | Public Insurance | Private Insurance |
| Under 6 | 20 (11.3%) | 157 (88.7%) |
| 6 to 18 Years | 9 (1.1%) | 782 (99.4%) |
| 19 to 25 Years | 9 (5.1%) | 177 (100.0%) |
| 25 to 34 Years | 10 (7.1%) | 131 (92.9%) |
| 35 to 44 Years | 31 (6.1%) | 493 (97.8%) |
| 45 to 54 Years | 8 (2.8%) | 267 (94.7%) |
| 55 to 64 Years | 12 (4.6%) | 253 (96.6%) |
| 65 to 74 Years | 60 (76.9%) | 56 (71.8%) |
| 75 Years and over | 75 (96.2%) | 57 (73.1%) |
| Total | 234 (9.4%) | 2,373 (95.5%) |
Disability Status by Sex by Age in Myersville
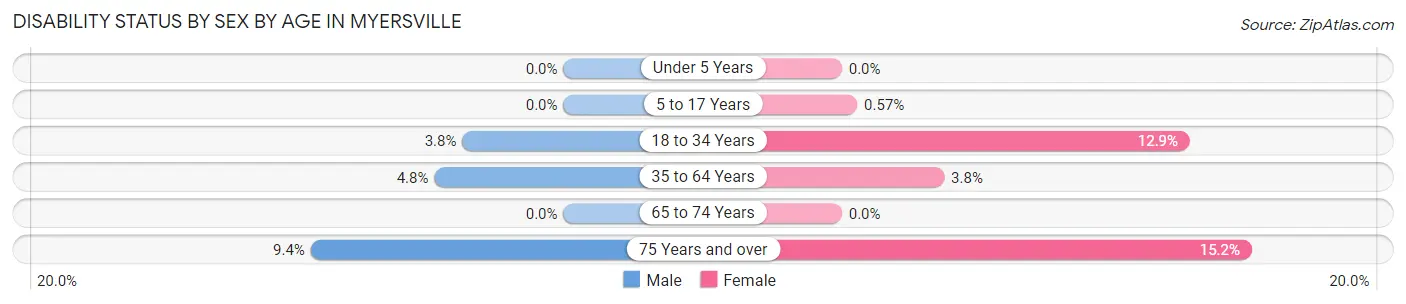
| Age Bracket | Male | Female |
| Under 5 Years | 0 (0.0%) | 0 (0.0%) |
| 5 to 17 Years | 0 (0.0%) | 3 (0.6%) |
| 18 to 34 Years | 6 (3.7%) | 23 (12.9%) |
| 35 to 64 Years | 25 (4.8%) | 20 (3.8%) |
| 65 to 74 Years | 0 (0.0%) | 0 (0.0%) |
| 75 Years and over | 3 (9.4%) | 7 (15.2%) |
Disability Class by Sex by Age in Myersville
Disability Class: Hearing Difficulty
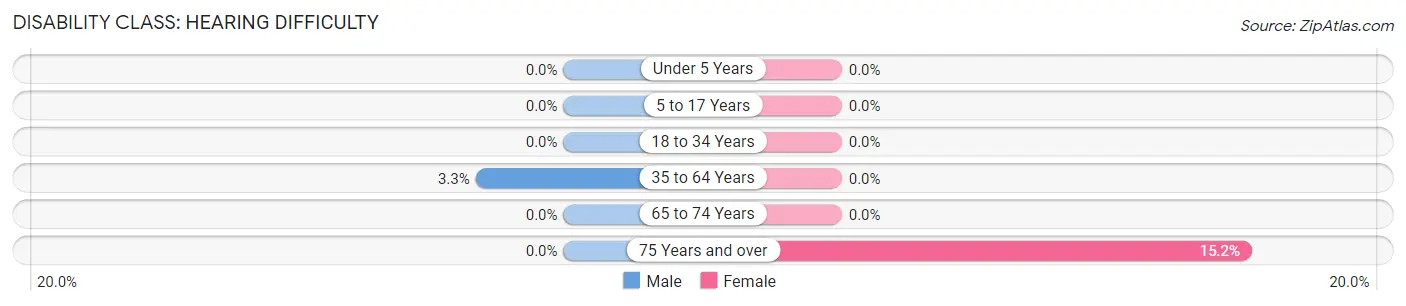
| Age Bracket | Male | Female |
| Under 5 Years | 0 (0.0%) | 0 (0.0%) |
| 5 to 17 Years | 0 (0.0%) | 0 (0.0%) |
| 18 to 34 Years | 0 (0.0%) | 0 (0.0%) |
| 35 to 64 Years | 17 (3.3%) | 0 (0.0%) |
| 65 to 74 Years | 0 (0.0%) | 0 (0.0%) |
| 75 Years and over | 0 (0.0%) | 7 (15.2%) |
Disability Class: Vision Difficulty
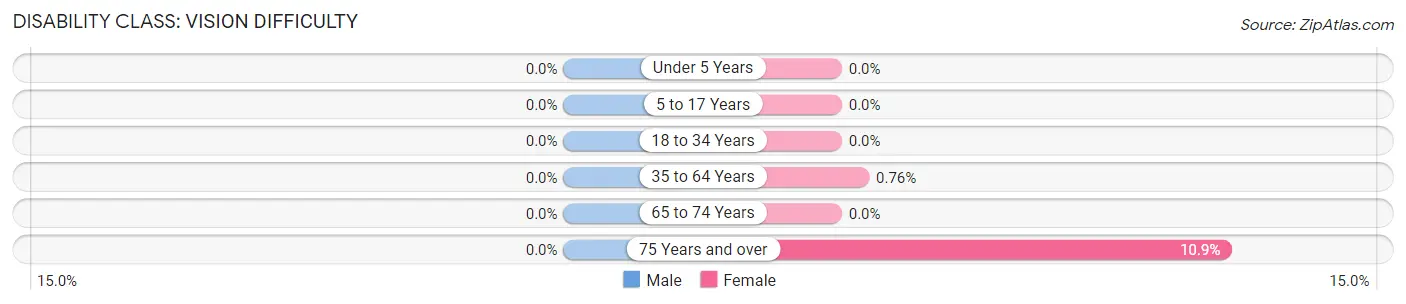
| Age Bracket | Male | Female |
| Under 5 Years | 0 (0.0%) | 0 (0.0%) |
| 5 to 17 Years | 0 (0.0%) | 0 (0.0%) |
| 18 to 34 Years | 0 (0.0%) | 0 (0.0%) |
| 35 to 64 Years | 0 (0.0%) | 4 (0.8%) |
| 65 to 74 Years | 0 (0.0%) | 0 (0.0%) |
| 75 Years and over | 0 (0.0%) | 5 (10.9%) |
Disability Class: Cognitive Difficulty
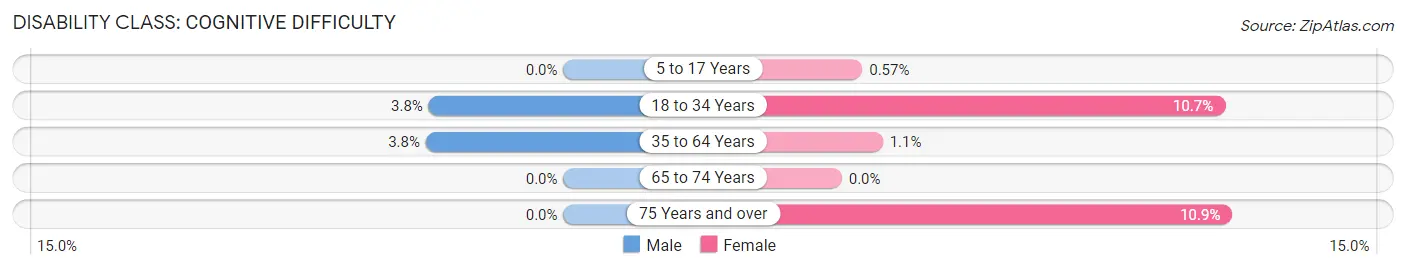
| Age Bracket | Male | Female |
| 5 to 17 Years | 0 (0.0%) | 3 (0.6%) |
| 18 to 34 Years | 6 (3.7%) | 19 (10.7%) |
| 35 to 64 Years | 20 (3.8%) | 6 (1.1%) |
| 65 to 74 Years | 0 (0.0%) | 0 (0.0%) |
| 75 Years and over | 0 (0.0%) | 5 (10.9%) |
Disability Class: Ambulatory Difficulty
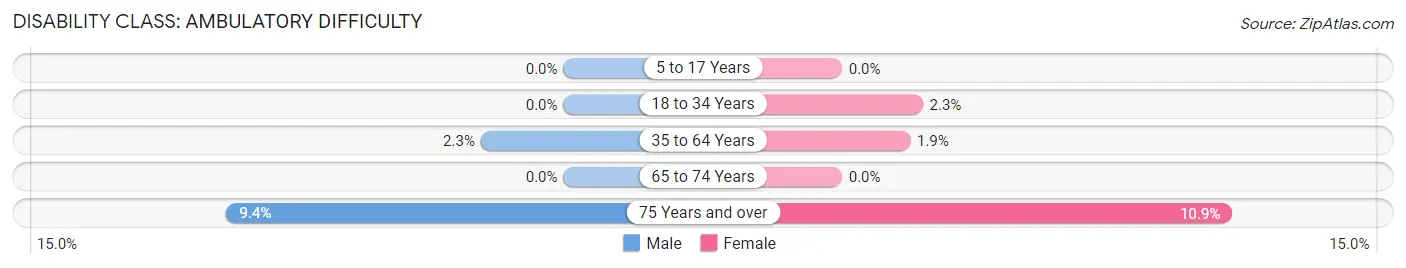
| Age Bracket | Male | Female |
| 5 to 17 Years | 0 (0.0%) | 0 (0.0%) |
| 18 to 34 Years | 0 (0.0%) | 4 (2.2%) |
| 35 to 64 Years | 12 (2.3%) | 10 (1.9%) |
| 65 to 74 Years | 0 (0.0%) | 0 (0.0%) |
| 75 Years and over | 3 (9.4%) | 5 (10.9%) |
Disability Class: Self-Care Difficulty
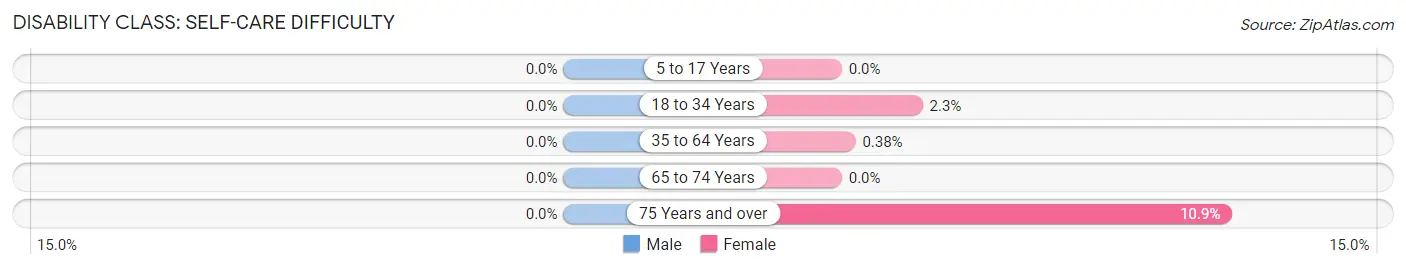
| Age Bracket | Male | Female |
| 5 to 17 Years | 0 (0.0%) | 0 (0.0%) |
| 18 to 34 Years | 0 (0.0%) | 4 (2.2%) |
| 35 to 64 Years | 0 (0.0%) | 2 (0.4%) |
| 65 to 74 Years | 0 (0.0%) | 0 (0.0%) |
| 75 Years and over | 0 (0.0%) | 5 (10.9%) |
Technology Access in Myersville
Computing Device Access in Myersville
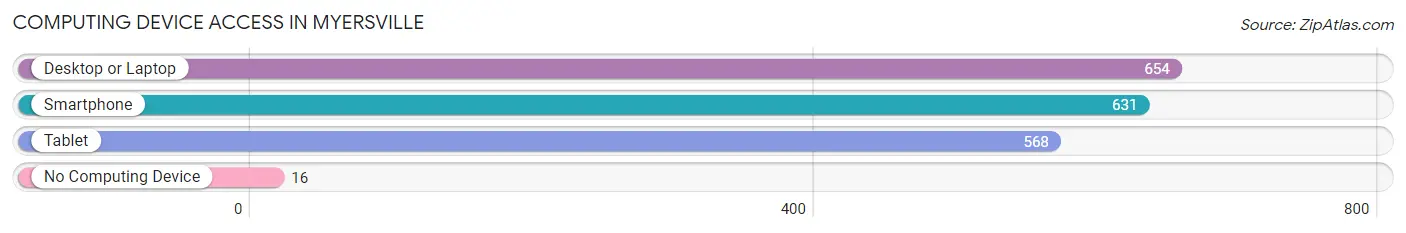
| Device Type | # Households | % Households |
| Desktop or Laptop | 654 | 96.3% |
| Smartphone | 631 | 92.9% |
| Tablet | 568 | 83.7% |
| No Computing Device | 16 | 2.4% |
| Total | 679 | 100.0% |
Internet Access in Myersville
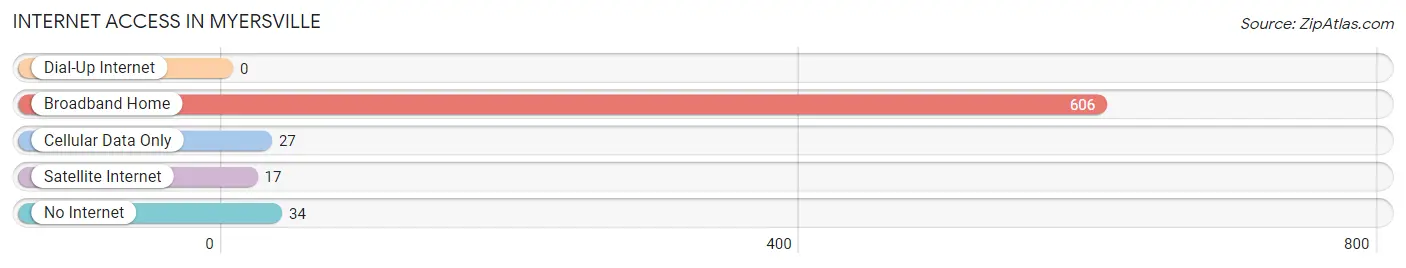
| Internet Type | # Households | % Households |
| Dial-Up Internet | 0 | 0.0% |
| Broadband Home | 606 | 89.2% |
| Cellular Data Only | 27 | 4.0% |
| Satellite Internet | 17 | 2.5% |
| No Internet | 34 | 5.0% |
| Total | 679 | 100.0% |
Myersville Summary
Myersville is a small town located in Frederick County, Maryland, United States. It is situated in the Middletown Valley, approximately 10 miles north of Frederick and 40 miles northwest of Washington, D.C. The town was founded in 1790 and incorporated in 1872. As of the 2010 census, the population of Myersville was 1,626.
History
Myersville was founded in 1790 by John Myers, a German immigrant who had settled in the area in 1760. He purchased a tract of land from the local Native Americans and established a small farm. The town was originally known as “Myers’s Town” and was later shortened to Myersville.
In 1872, the town was officially incorporated and the first mayor was elected. The town grew slowly over the years, but remained a small rural community. In the early 1900s, the town began to experience a period of growth and development. The first bank was established in 1906, and the first post office opened in 1908.
Geography
Myersville is located at 39°27'45" North, 77°30'45" West (39.4625, -77.5125). According to the United States Census Bureau, the town has a total area of 0.9 square miles, all of it land.
The town is situated in the Middletown Valley, which is part of the Great Appalachian Valley. The valley is surrounded by the Catoctin Mountains to the east and the South Mountain to the west. The town is located along the banks of the Monocacy River, which flows through the valley.
Economy
Myersville’s economy is largely based on agriculture and tourism. The town is home to several farms, which produce a variety of crops, including corn, soybeans, wheat, and hay. The town also has several wineries and breweries, which attract tourists from all over the region.
The town is also home to several small businesses, including restaurants, shops, and other services. The town is also home to a few light industrial businesses, such as a printing company and a machine shop.
Demographics
As of the 2010 census, there were 1,626 people, 645 households, and 463 families residing in the town. The population density was 1,811.2 people per square mile. The racial makeup of the town was 94.2% White, 2.2% African American, 0.2% Native American, 0.7% Asian, 0.1% Pacific Islander, 0.9% from other races, and 1.7% from two or more races. Hispanic or Latino of any race were 2.7% of the population.
The median age in the town was 41.2 years. 22.2% of residents were under the age of 18; 6.2% were between the ages of 18 and 24; 25.2% were from 25 to 44; 28.7% were from 45 to 64; and 17.7% were 65 years of age or older. The gender makeup of the town was 48.2% male and 51.8% female.
The median income for a household in the town was $63,958, and the median income for a family was $76,250. Males had a median income of $50,000 versus $37,500 for females. The per capita income for the town was $30,945. About 4.2% of families and 5.7% of the population were below the poverty line, including 8.2% of those under age 18 and 4.2% of those age 65 or over.
Common Questions
What is Per Capita Income in Myersville?
Per Capita income in Myersville is $45,183.
What is the Median Family Income in Myersville?
Median Family Income in Myersville is $145,500.
What is the Median Household income in Myersville?
Median Household Income in Myersville is $140,048.
What is Income or Wage Gap in Myersville?
Income or Wage Gap in Myersville is 52.6%.
Women in Myersville earn 47.4 cents for every dollar earned by a man.
What is Inequality or Gini Index in Myersville?
Inequality or Gini Index in Myersville is 0.30.
What is the Total Population of Myersville?
Total Population of Myersville is 2,493.
What is the Total Male Population of Myersville?
Total Male Population of Myersville is 1,081.
What is the Total Female Population of Myersville?
Total Female Population of Myersville is 1,412.
What is the Ratio of Males per 100 Females in Myersville?
There are 76.56 Males per 100 Females in Myersville.
What is the Ratio of Females per 100 Males in Myersville?
There are 130.62 Females per 100 Males in Myersville.
What is the Median Population Age in Myersville?
Median Population Age in Myersville is 33.3 Years.
What is the Average Family Size in Myersville
Average Family Size in Myersville is 4.0 People.
What is the Average Household Size in Myersville
Average Household Size in Myersville is 3.7 People.
How Large is the Labor Force in Myersville?
There are 1,162 People in the Labor Forcein in Myersville.
What is the Percentage of People in the Labor Force in Myersville?
71.8% of People are in the Labor Force in Myersville.