Zip Codes with the Highest Percentage of Population Employed in Real Estate, Rental & Leasing in Maryland
RELATED REPORTS & OPTIONS
Real Estate, Rental & Leasing
Maryland
Compare Zip Codes
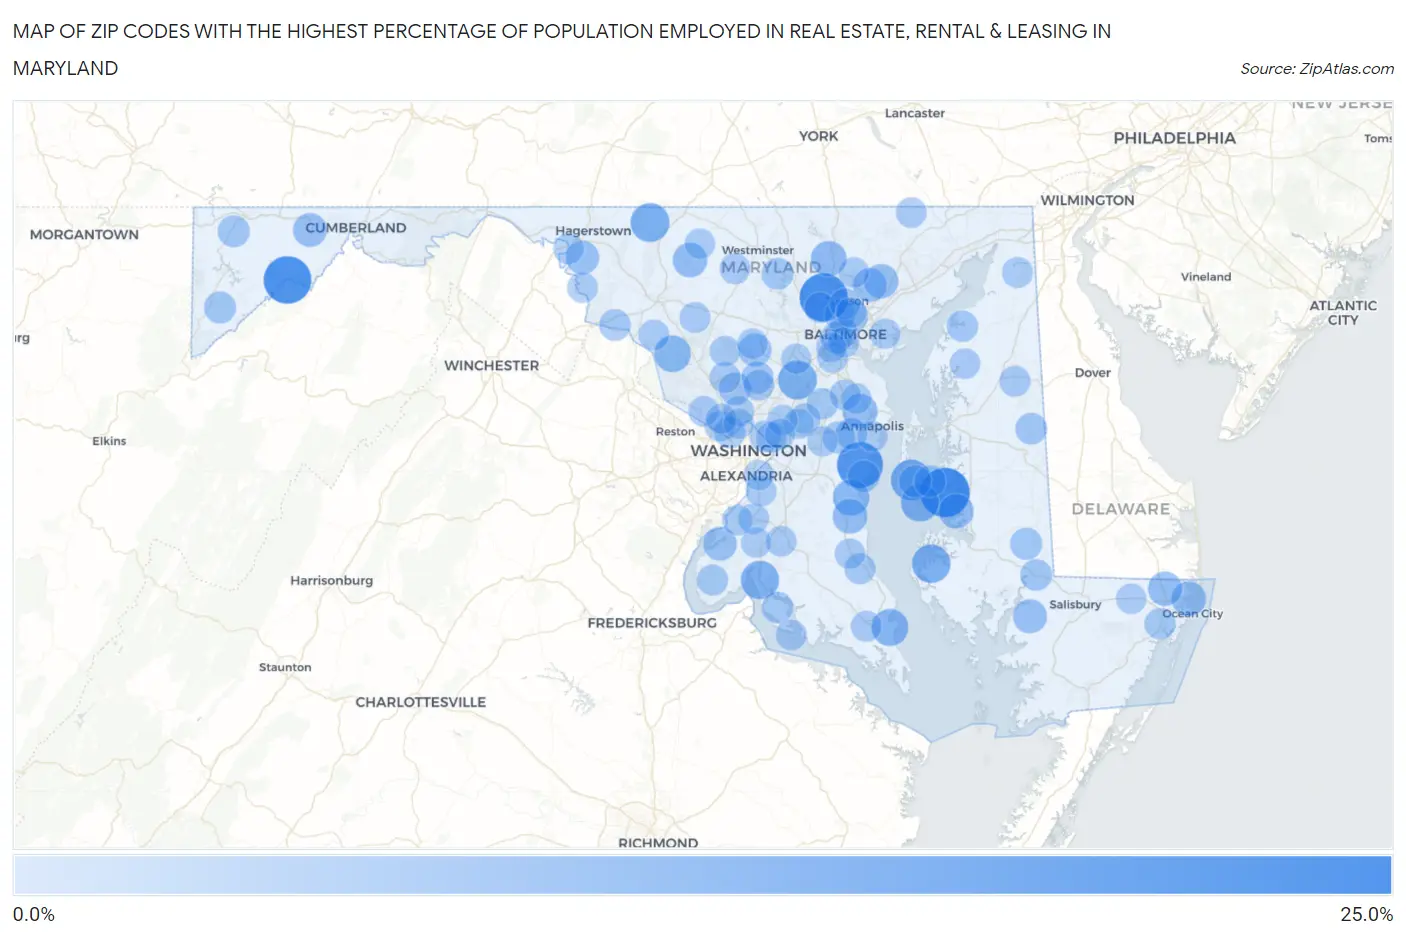
Map of Zip Codes with the Highest Percentage of Population Employed in Real Estate, Rental & Leasing in Maryland
0.0%
25.0%
Zip Codes with the Highest Percentage of Population Employed in Real Estate, Rental & Leasing in Maryland
| Zip Code | % Employed | vs State | vs National | |
| 1. | 21653 | 23.5% | 2.1%(+21.4)#1 | 1.9%(+21.6)#79 |
| 2. | 21153 | 22.2% | 2.1%(+20.1)#2 | 1.9%(+20.3)#90 |
| 3. | 21540 | 21.4% | 2.1%(+19.3)#3 | 1.9%(+19.5)#95 |
| 4. | 20765 | 19.6% | 2.1%(+17.5)#4 | 1.9%(+17.7)#111 |
| 5. | 21665 | 13.9% | 2.1%(+11.8)#5 | 1.9%(+12.0)#200 |
| 6. | 21780 | 12.0% | 2.1%(+9.94)#6 | 1.9%(+10.1)#262 |
| 7. | 20763 | 12.0% | 2.1%(+9.90)#7 | 1.9%(+10.1)#264 |
| 8. | 21648 | 11.6% | 2.1%(+9.48)#8 | 1.9%(+9.68)#282 |
| 9. | 20611 | 11.2% | 2.1%(+9.09)#9 | 1.9%(+9.29)#298 |
| 10. | 21652 | 11.1% | 2.1%(+9.02)#10 | 1.9%(+9.22)#305 |
| 11. | 20670 | 9.8% | 2.1%(+7.72)#11 | 1.9%(+7.92)#394 |
| 12. | 20838 | 9.6% | 2.1%(+7.53)#12 | 1.9%(+7.72)#412 |
| 13. | 20758 | 9.3% | 2.1%(+7.20)#13 | 1.9%(+7.40)#445 |
| 14. | 21152 | 8.4% | 2.1%(+6.26)#14 | 1.9%(+6.46)#512 |
| 15. | 21405 | 7.9% | 2.1%(+5.77)#15 | 1.9%(+5.97)#574 |
| 16. | 21654 | 7.6% | 2.1%(+5.47)#16 | 1.9%(+5.67)#624 |
| 17. | 20689 | 7.5% | 2.1%(+5.45)#17 | 1.9%(+5.65)#628 |
| 18. | 21842 | 7.4% | 2.1%(+5.33)#18 | 1.9%(+5.53)#652 |
| 19. | 21798 | 7.4% | 2.1%(+5.27)#19 | 1.9%(+5.47)#666 |
| 20. | 21051 | 7.1% | 2.1%(+5.05)#20 | 1.9%(+5.25)#706 |
| 21. | 21813 | 7.1% | 2.1%(+5.04)#21 | 1.9%(+5.24)#711 |
| 22. | 21856 | 6.8% | 2.1%(+4.69)#22 | 1.9%(+4.89)#772 |
| 23. | 21543 | 6.7% | 2.1%(+4.58)#23 | 1.9%(+4.77)#790 |
| 24. | 21057 | 6.6% | 2.1%(+4.56)#24 | 1.9%(+4.76)#796 |
| 25. | 20658 | 6.4% | 2.1%(+4.29)#25 | 1.9%(+4.49)#860 |
| 26. | 21733 | 6.1% | 2.1%(+3.97)#26 | 1.9%(+4.17)#953 |
| 27. | 21036 | 5.9% | 2.1%(+3.86)#27 | 1.9%(+4.06)#996 |
| 28. | 20853 | 5.2% | 2.1%(+3.10)#28 | 1.9%(+3.30)#1,291 |
| 29. | 21035 | 5.0% | 2.1%(+2.87)#29 | 1.9%(+3.07)#1,420 |
| 30. | 21676 | 4.9% | 2.1%(+2.83)#30 | 1.9%(+3.03)#1,438 |
| 31. | 21550 | 4.7% | 2.1%(+2.59)#31 | 1.9%(+2.79)#1,580 |
| 32. | 21659 | 4.6% | 2.1%(+2.54)#32 | 1.9%(+2.74)#1,614 |
| 33. | 21520 | 4.6% | 2.1%(+2.50)#33 | 1.9%(+2.70)#1,642 |
| 34. | 20861 | 4.6% | 2.1%(+2.47)#34 | 1.9%(+2.67)#1,667 |
| 35. | 20733 | 4.5% | 2.1%(+2.39)#35 | 1.9%(+2.58)#1,739 |
| 36. | 21837 | 4.4% | 2.1%(+2.35)#36 | 1.9%(+2.55)#1,762 |
| 37. | 21140 | 4.4% | 2.1%(+2.31)#37 | 1.9%(+2.51)#1,787 |
| 38. | 21048 | 4.4% | 2.1%(+2.28)#38 | 1.9%(+2.47)#1,821 |
| 39. | 21663 | 4.4% | 2.1%(+2.28)#39 | 1.9%(+2.47)#1,822 |
| 40. | 21639 | 4.4% | 2.1%(+2.27)#40 | 1.9%(+2.47)#1,823 |
| 41. | 21716 | 4.3% | 2.1%(+2.17)#41 | 1.9%(+2.37)#1,897 |
| 42. | 20712 | 4.2% | 2.1%(+2.08)#42 | 1.9%(+2.28)#1,986 |
| 43. | 21251 | 4.2% | 2.1%(+2.08)#43 | 1.9%(+2.27)#1,994 |
| 44. | 20664 | 4.0% | 2.1%(+1.94)#44 | 1.9%(+2.14)#2,133 |
| 45. | 21678 | 4.0% | 2.1%(+1.86)#45 | 1.9%(+2.06)#2,234 |
| 46. | 20816 | 3.9% | 2.1%(+1.84)#46 | 1.9%(+2.04)#2,254 |
| 47. | 21113 | 3.8% | 2.1%(+1.75)#47 | 1.9%(+1.95)#2,343 |
| 48. | 21223 | 3.7% | 2.1%(+1.64)#48 | 1.9%(+1.84)#2,475 |
| 49. | 20662 | 3.7% | 2.1%(+1.61)#49 | 1.9%(+1.81)#2,511 |
| 50. | 21811 | 3.7% | 2.1%(+1.59)#50 | 1.9%(+1.79)#2,551 |
| 51. | 21210 | 3.7% | 2.1%(+1.58)#51 | 1.9%(+1.78)#2,560 |
| 52. | 21201 | 3.7% | 2.1%(+1.58)#52 | 1.9%(+1.78)#2,566 |
| 53. | 21607 | 3.6% | 2.1%(+1.56)#53 | 1.9%(+1.75)#2,590 |
| 54. | 20676 | 3.6% | 2.1%(+1.55)#54 | 1.9%(+1.75)#2,593 |
| 55. | 20720 | 3.6% | 2.1%(+1.55)#55 | 1.9%(+1.75)#2,594 |
| 56. | 21770 | 3.5% | 2.1%(+1.42)#56 | 1.9%(+1.62)#2,815 |
| 57. | 21208 | 3.5% | 2.1%(+1.41)#57 | 1.9%(+1.61)#2,830 |
| 58. | 21710 | 3.5% | 2.1%(+1.38)#58 | 1.9%(+1.57)#2,904 |
| 59. | 21915 | 3.5% | 2.1%(+1.36)#59 | 1.9%(+1.56)#2,930 |
| 60. | 21090 | 3.4% | 2.1%(+1.36)#60 | 1.9%(+1.56)#2,933 |
| 61. | 20818 | 3.4% | 2.1%(+1.36)#61 | 1.9%(+1.56)#2,935 |
| 62. | 20905 | 3.4% | 2.1%(+1.32)#62 | 1.9%(+1.52)#3,004 |
| 63. | 21252 | 3.4% | 2.1%(+1.31)#63 | 1.9%(+1.51)#3,026 |
| 64. | 20855 | 3.4% | 2.1%(+1.30)#64 | 1.9%(+1.50)#3,045 |
| 65. | 20625 | 3.4% | 2.1%(+1.27)#65 | 1.9%(+1.47)#3,117 |
| 66. | 20619 | 3.3% | 2.1%(+1.23)#66 | 1.9%(+1.43)#3,170 |
| 67. | 21230 | 3.3% | 2.1%(+1.23)#67 | 1.9%(+1.42)#3,172 |
| 68. | 20781 | 3.3% | 2.1%(+1.19)#68 | 1.9%(+1.39)#3,262 |
| 69. | 21782 | 3.3% | 2.1%(+1.18)#69 | 1.9%(+1.38)#3,274 |
| 70. | 21108 | 3.2% | 2.1%(+1.15)#70 | 1.9%(+1.35)#3,341 |
| 71. | 21776 | 3.2% | 2.1%(+1.13)#71 | 1.9%(+1.33)#3,369 |
| 72. | 20607 | 3.2% | 2.1%(+1.13)#72 | 1.9%(+1.33)#3,377 |
| 73. | 20602 | 3.2% | 2.1%(+1.11)#73 | 1.9%(+1.31)#3,415 |
| 74. | 20882 | 3.2% | 2.1%(+1.11)#74 | 1.9%(+1.30)#3,424 |
| 75. | 20854 | 3.2% | 2.1%(+1.10)#75 | 1.9%(+1.30)#3,438 |
| 76. | 21160 | 3.2% | 2.1%(+1.09)#76 | 1.9%(+1.28)#3,459 |
| 77. | 21045 | 3.2% | 2.1%(+1.07)#77 | 1.9%(+1.27)#3,499 |
| 78. | 21239 | 3.1% | 2.1%(+1.05)#78 | 1.9%(+1.25)#3,530 |
| 79. | 20769 | 3.1% | 2.1%(+1.02)#79 | 1.9%(+1.22)#3,598 |
| 80. | 21620 | 3.1% | 2.1%(+1.02)#80 | 1.9%(+1.22)#3,610 |
| 81. | 21131 | 3.1% | 2.1%(+0.994)#81 | 1.9%(+1.19)#3,669 |
| 82. | 21737 | 3.1% | 2.1%(+0.984)#82 | 1.9%(+1.18)#3,692 |
| 83. | 20895 | 3.1% | 2.1%(+0.977)#83 | 1.9%(+1.18)#3,706 |
| 84. | 21757 | 3.1% | 2.1%(+0.973)#84 | 1.9%(+1.17)#3,722 |
| 85. | 21221 | 3.1% | 2.1%(+0.964)#85 | 1.9%(+1.16)#3,744 |
| 86. | 20770 | 3.1% | 2.1%(+0.963)#86 | 1.9%(+1.16)#3,749 |
| 87. | 20744 | 3.0% | 2.1%(+0.959)#87 | 1.9%(+1.16)#3,759 |
| 88. | 21874 | 3.0% | 2.1%(+0.949)#88 | 1.9%(+1.15)#3,784 |
| 89. | 20784 | 3.0% | 2.1%(+0.941)#89 | 1.9%(+1.14)#3,803 |
| 90. | 20675 | 3.0% | 2.1%(+0.940)#90 | 1.9%(+1.14)#3,808 |
| 91. | 21146 | 3.0% | 2.1%(+0.938)#91 | 1.9%(+1.14)#3,816 |
| 92. | 20817 | 3.0% | 2.1%(+0.931)#92 | 1.9%(+1.13)#3,838 |
| 93. | 21795 | 3.0% | 2.1%(+0.928)#93 | 1.9%(+1.13)#3,848 |
| 94. | 20815 | 3.0% | 2.1%(+0.923)#94 | 1.9%(+1.12)#3,868 |
| 95. | 20716 | 3.0% | 2.1%(+0.910)#95 | 1.9%(+1.11)#3,903 |
| 96. | 20745 | 3.0% | 2.1%(+0.902)#96 | 1.9%(+1.10)#3,922 |
| 97. | 20616 | 3.0% | 2.1%(+0.867)#97 | 1.9%(+1.07)#4,021 |
| 98. | 21403 | 2.9% | 2.1%(+0.841)#98 | 1.9%(+1.04)#4,080 |
| 99. | 20678 | 2.9% | 2.1%(+0.825)#99 | 1.9%(+1.02)#4,130 |
| 100. | 21227 | 2.9% | 2.1%(+0.809)#100 | 1.9%(+1.01)#4,174 |
Common Questions
What are the Top 10 Zip Codes with the Highest Percentage of Population Employed in Real Estate, Rental & Leasing in Maryland?
Top 10 Zip Codes with the Highest Percentage of Population Employed in Real Estate, Rental & Leasing in Maryland are:
What zip code has the Highest Percentage of Population Employed in Real Estate, Rental & Leasing in Maryland?
21653 has the Highest Percentage of Population Employed in Real Estate, Rental & Leasing in Maryland with 23.5%.
What is the Percentage of Population Employed in Real Estate, Rental & Leasing in the State of Maryland?
Percentage of Population Employed in Real Estate, Rental & Leasing in Maryland is 2.1%.
What is the Percentage of Population Employed in Real Estate, Rental & Leasing in the United States?
Percentage of Population Employed in Real Estate, Rental & Leasing in the United States is 1.9%.