Potomac Heights, MD Map & Demographics
Potomac Heights Map
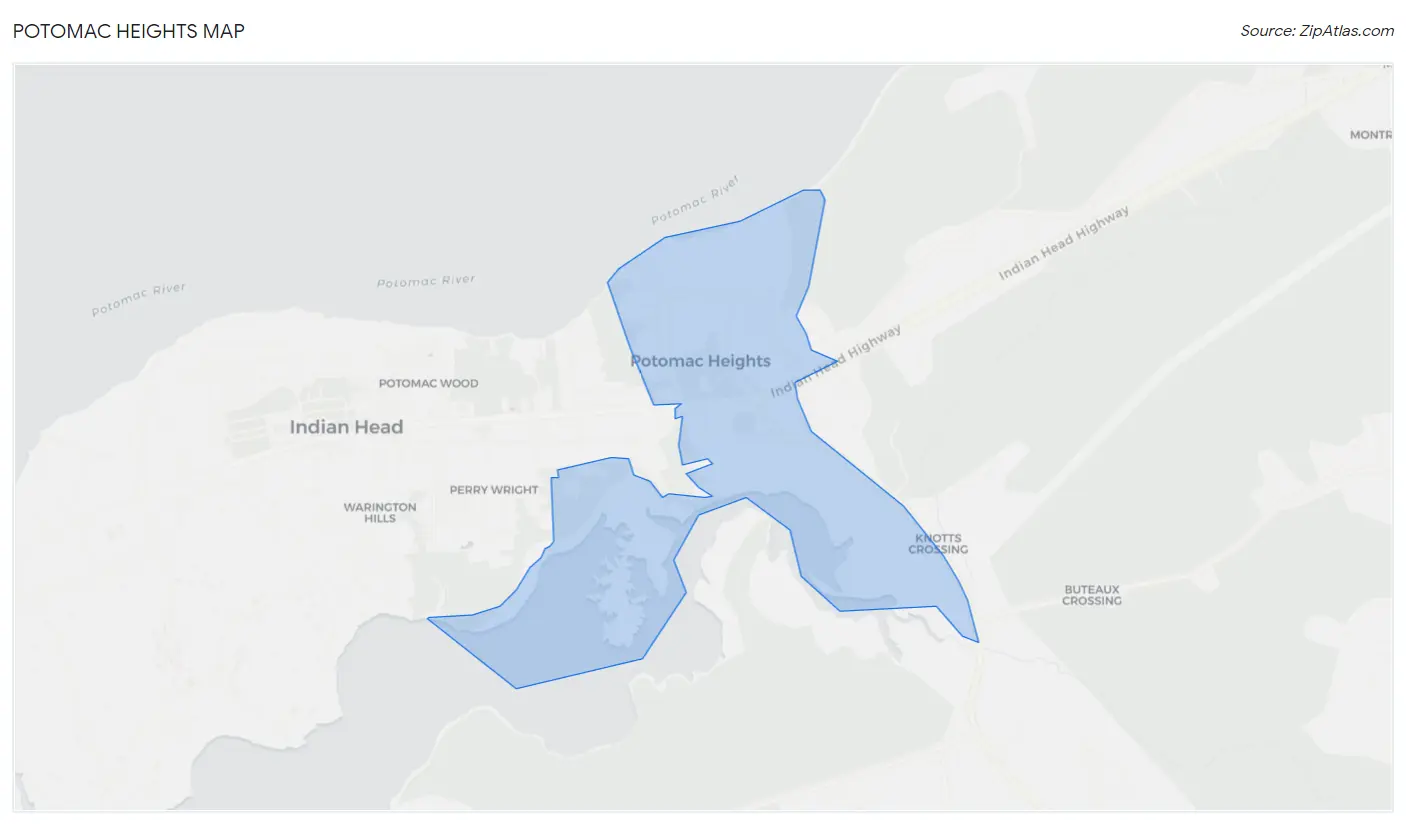
Potomac Heights Overview
$48,283
PER CAPITA INCOME
$114,653
AVG FAMILY INCOME
$66,202
AVG HOUSEHOLD INCOME
19.0%
WAGE / INCOME GAP [ % ]
81.0¢/ $1
WAGE / INCOME GAP [ $ ]
0.40
INEQUALITY / GINI INDEX
1,166
TOTAL POPULATION
461
MALE POPULATION
705
FEMALE POPULATION
65.39
MALES / 100 FEMALES
152.93
FEMALES / 100 MALES
52.7
MEDIAN AGE
3.0
AVG FAMILY SIZE
1.8
AVG HOUSEHOLD SIZE
490
LABOR FORCE [ PEOPLE ]
46.6%
PERCENT IN LABOR FORCE
2.9%
UNEMPLOYMENT RATE
Income in Potomac Heights
Income Overview in Potomac Heights
Per Capita Income in Potomac Heights is $48,283, while median incomes of families and households are $114,653 and $66,202 respectively.
| Characteristic | Number | Measure |
| Per Capita Income | 1,166 | $48,283 |
| Median Family Income | 252 | $114,653 |
| Mean Family Income | 252 | $141,544 |
| Median Household Income | 632 | $66,202 |
| Mean Household Income | 632 | $88,793 |
| Income Deficit | 252 | $0 |
| Wage / Income Gap (%) | 1,166 | 19.01% |
| Wage / Income Gap ($) | 1,166 | 80.99¢ per $1 |
| Gini / Inequality Index | 1,166 | 0.40 |
Earnings by Sex in Potomac Heights
Average Earnings in Potomac Heights are $66,116, $72,188 for men and $58,468 for women, a difference of 19.0%.
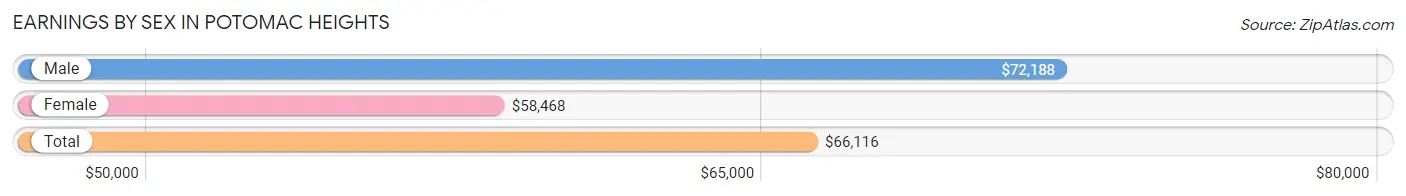
| Sex | Number | Average Earnings |
| Male | 277 (54.4%) | $72,188 |
| Female | 232 (45.6%) | $58,468 |
| Total | 509 (100.0%) | $66,116 |
Earnings by Sex by Income Bracket in Potomac Heights
The most common earnings brackets in Potomac Heights are $75,000 to $99,999 for men (71 | 25.6%) and $100,000+ for women (69 | 29.7%).
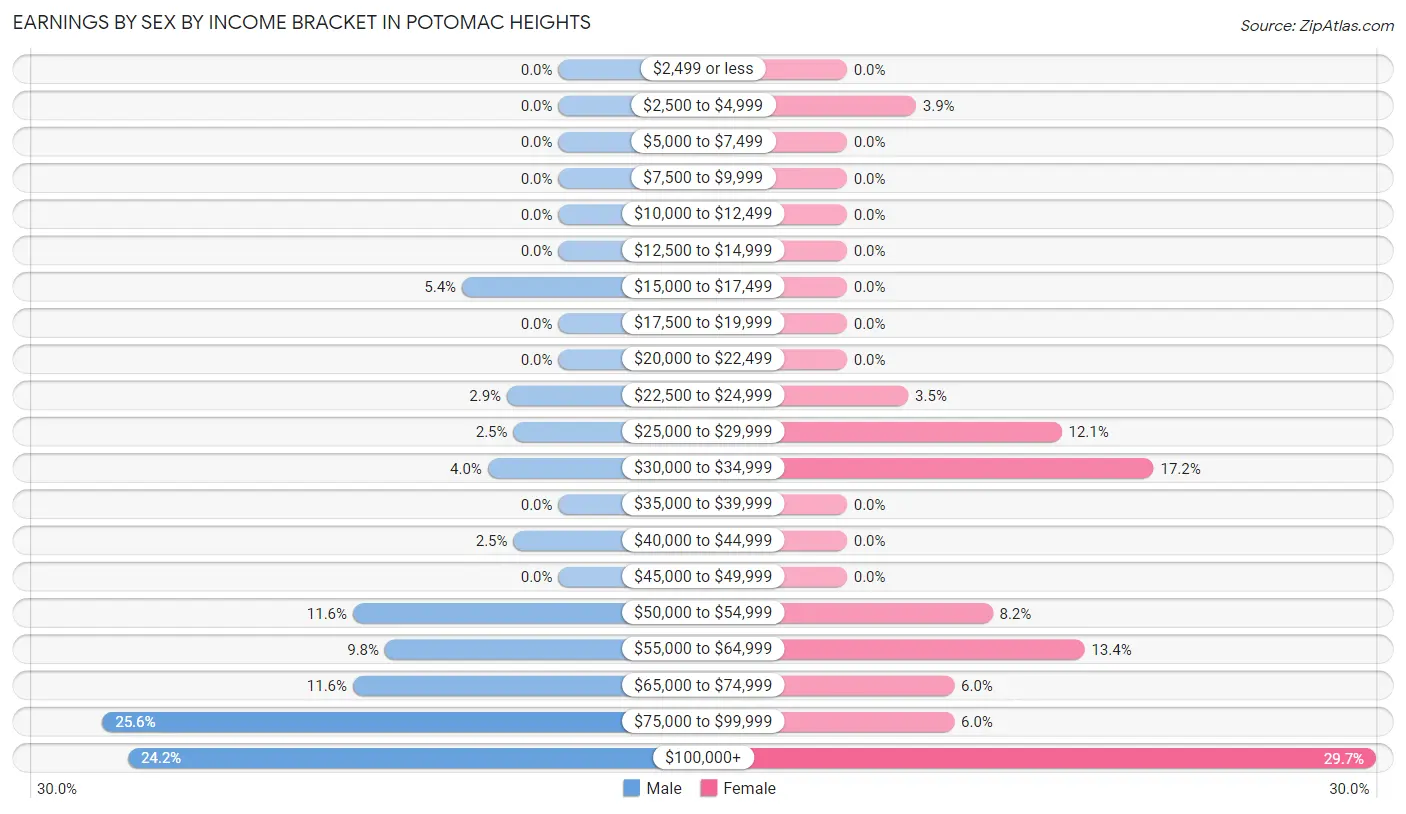
| Income | Male | Female |
| $2,499 or less | 0 (0.0%) | 0 (0.0%) |
| $2,500 to $4,999 | 0 (0.0%) | 9 (3.9%) |
| $5,000 to $7,499 | 0 (0.0%) | 0 (0.0%) |
| $7,500 to $9,999 | 0 (0.0%) | 0 (0.0%) |
| $10,000 to $12,499 | 0 (0.0%) | 0 (0.0%) |
| $12,500 to $14,999 | 0 (0.0%) | 0 (0.0%) |
| $15,000 to $17,499 | 15 (5.4%) | 0 (0.0%) |
| $17,500 to $19,999 | 0 (0.0%) | 0 (0.0%) |
| $20,000 to $22,499 | 0 (0.0%) | 0 (0.0%) |
| $22,500 to $24,999 | 8 (2.9%) | 8 (3.5%) |
| $25,000 to $29,999 | 7 (2.5%) | 28 (12.1%) |
| $30,000 to $34,999 | 11 (4.0%) | 40 (17.2%) |
| $35,000 to $39,999 | 0 (0.0%) | 0 (0.0%) |
| $40,000 to $44,999 | 7 (2.5%) | 0 (0.0%) |
| $45,000 to $49,999 | 0 (0.0%) | 0 (0.0%) |
| $50,000 to $54,999 | 32 (11.6%) | 19 (8.2%) |
| $55,000 to $64,999 | 27 (9.8%) | 31 (13.4%) |
| $65,000 to $74,999 | 32 (11.6%) | 14 (6.0%) |
| $75,000 to $99,999 | 71 (25.6%) | 14 (6.0%) |
| $100,000+ | 67 (24.2%) | 69 (29.7%) |
| Total | 277 (100.0%) | 232 (100.0%) |
Earnings by Sex by Educational Attainment in Potomac Heights
Average earnings in Potomac Heights are $77,978 for men and $58,468 for women, a difference of 25.0%. Men with an educational attainment of bachelor's degree enjoy the highest average annual earnings of $106,635, while those with high school diploma education earn the least with $65,491. Women with an educational attainment of high school diploma earn the most with the average annual earnings of $59,234, while those with college or associate's degree education have the smallest earnings of $31,417.
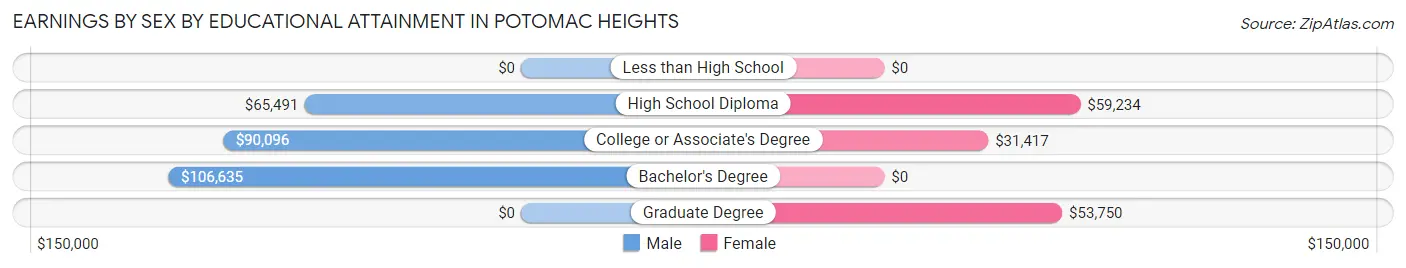
| Educational Attainment | Male Income | Female Income |
| Less than High School | - | - |
| High School Diploma | $65,491 | $59,234 |
| College or Associate's Degree | $90,096 | $31,417 |
| Bachelor's Degree | $106,635 | $0 |
| Graduate Degree | - | - |
| Total | $77,978 | $58,468 |
Family Income in Potomac Heights
Family Income Brackets in Potomac Heights
According to the Potomac Heights family income data, there are 86 families falling into the $100,000 to $149,999 income range, which is the most common income bracket and makes up 34.1% of all families.
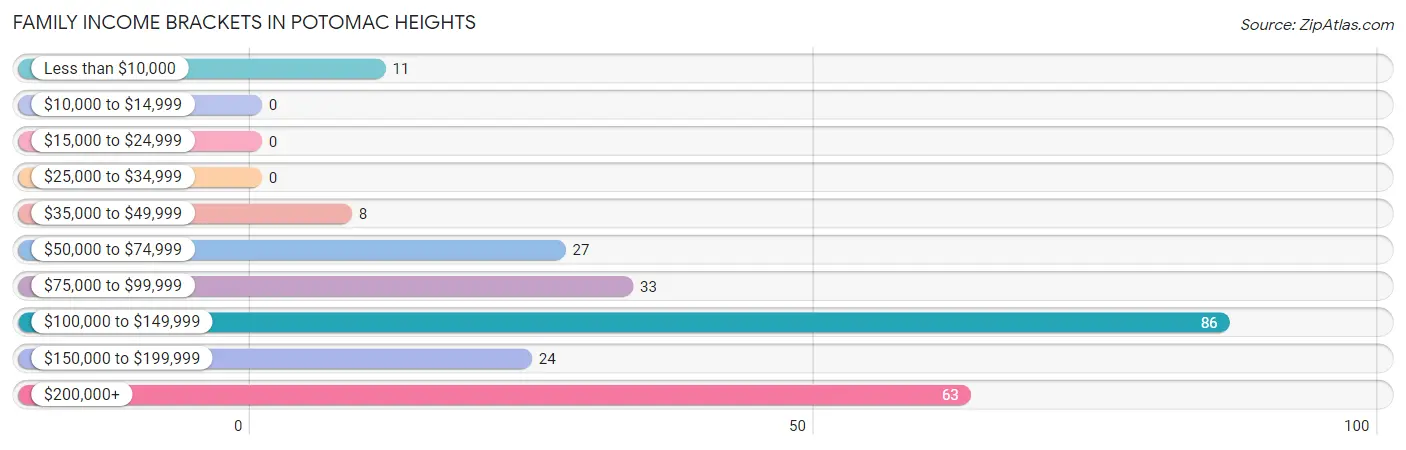
| Income Bracket | # Families | % Families |
| Less than $10,000 | 11 | 4.4% |
| $10,000 to $14,999 | 0 | 0.0% |
| $15,000 to $24,999 | 0 | 0.0% |
| $25,000 to $34,999 | 0 | 0.0% |
| $35,000 to $49,999 | 8 | 3.2% |
| $50,000 to $74,999 | 27 | 10.7% |
| $75,000 to $99,999 | 33 | 13.1% |
| $100,000 to $149,999 | 86 | 34.1% |
| $150,000 to $199,999 | 24 | 9.5% |
| $200,000+ | 63 | 25.0% |
Family Income by Famaliy Size in Potomac Heights
3-person families (122 | 48.4%) account for the highest median family income in Potomac Heights with $139,231 per family, while 3-person families (122 | 48.4%) have the highest median income of $46,410 per family member.
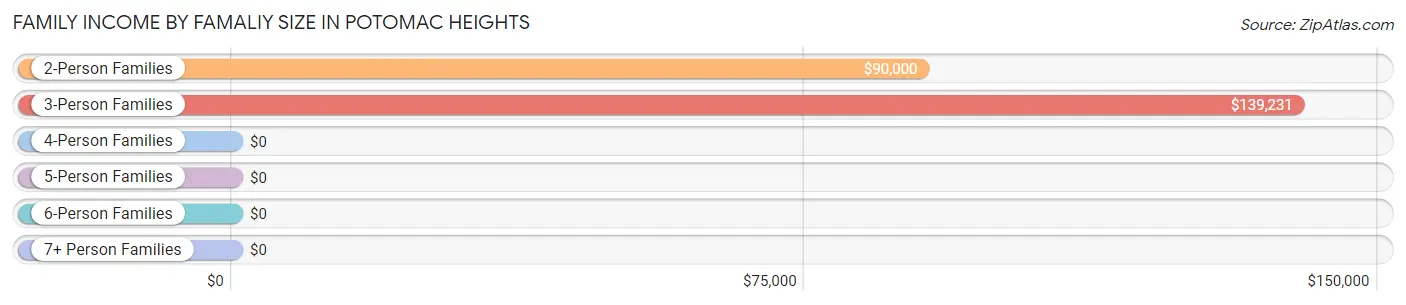
| Income Bracket | # Families | Median Income |
| 2-Person Families | 92 (36.5%) | $90,000 |
| 3-Person Families | 122 (48.4%) | $139,231 |
| 4-Person Families | 8 (3.2%) | $0 |
| 5-Person Families | 24 (9.5%) | $0 |
| 6-Person Families | 0 (0.0%) | $0 |
| 7+ Person Families | 6 (2.4%) | $0 |
| Total | 252 (100.0%) | $114,653 |
Family Income by Number of Earners in Potomac Heights
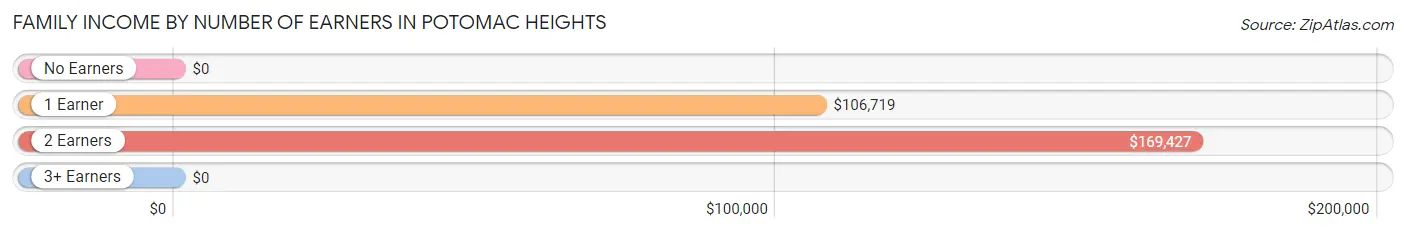
| Number of Earners | # Families | Median Income |
| No Earners | 19 (7.5%) | $0 |
| 1 Earner | 113 (44.8%) | $106,719 |
| 2 Earners | 97 (38.5%) | $169,427 |
| 3+ Earners | 23 (9.1%) | $0 |
| Total | 252 (100.0%) | $114,653 |
Household Income in Potomac Heights
Household Income Brackets in Potomac Heights
With 257 households falling in the category, the $50,000 to $74,999 income range is the most frequent in Potomac Heights, accounting for 40.7% of all households. In contrast, only 17 households (2.7%) fall into the $10,000 to $14,999 income bracket, making it the least populous group.
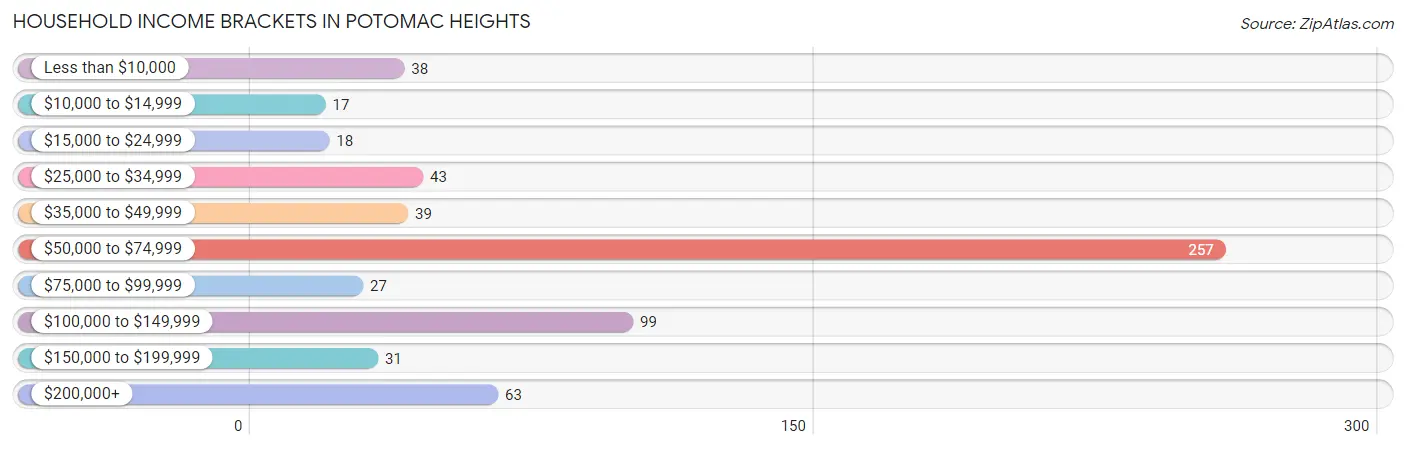
| Income Bracket | # Households | % Households |
| Less than $10,000 | 38 | 6.0% |
| $10,000 to $14,999 | 17 | 2.7% |
| $15,000 to $24,999 | 18 | 2.8% |
| $25,000 to $34,999 | 43 | 6.8% |
| $35,000 to $49,999 | 39 | 6.2% |
| $50,000 to $74,999 | 257 | 40.7% |
| $75,000 to $99,999 | 27 | 4.3% |
| $100,000 to $149,999 | 99 | 15.7% |
| $150,000 to $199,999 | 31 | 4.9% |
| $200,000+ | 63 | 10.0% |
Household Income by Householder Age in Potomac Heights
The median household income in Potomac Heights is $66,202, with the highest median household income of $113,056 found in the 45 to 64 years age bracket for the primary householder. A total of 188 households (29.7%) fall into this category.
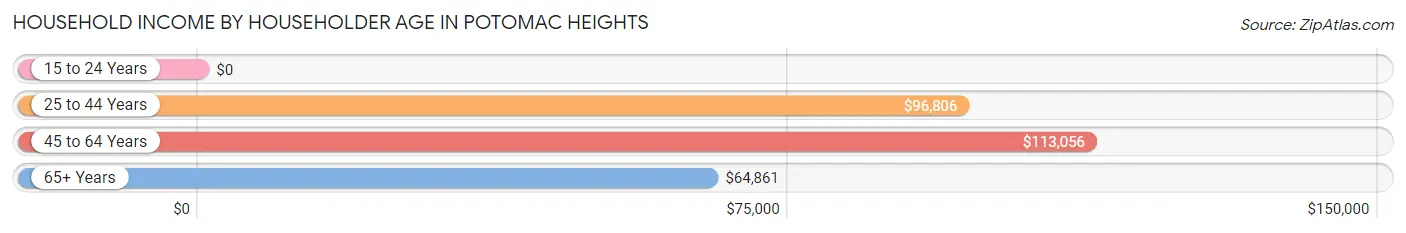
| Income Bracket | # Households | Median Income |
| 15 to 24 Years | 0 (0.0%) | $0 |
| 25 to 44 Years | 117 (18.5%) | $96,806 |
| 45 to 64 Years | 188 (29.7%) | $113,056 |
| 65+ Years | 327 (51.7%) | $64,861 |
| Total | 632 (100.0%) | $66,202 |
Poverty in Potomac Heights
Income Below Poverty by Sex and Age in Potomac Heights
With 3.7% poverty level for males and 5.8% for females among the residents of Potomac Heights, 55 to 64 year old males and 12 to 14 year old females are the most vulnerable to poverty, with 9 males (13.6%) and 11 females (100.0%) in their respective age groups living below the poverty level.
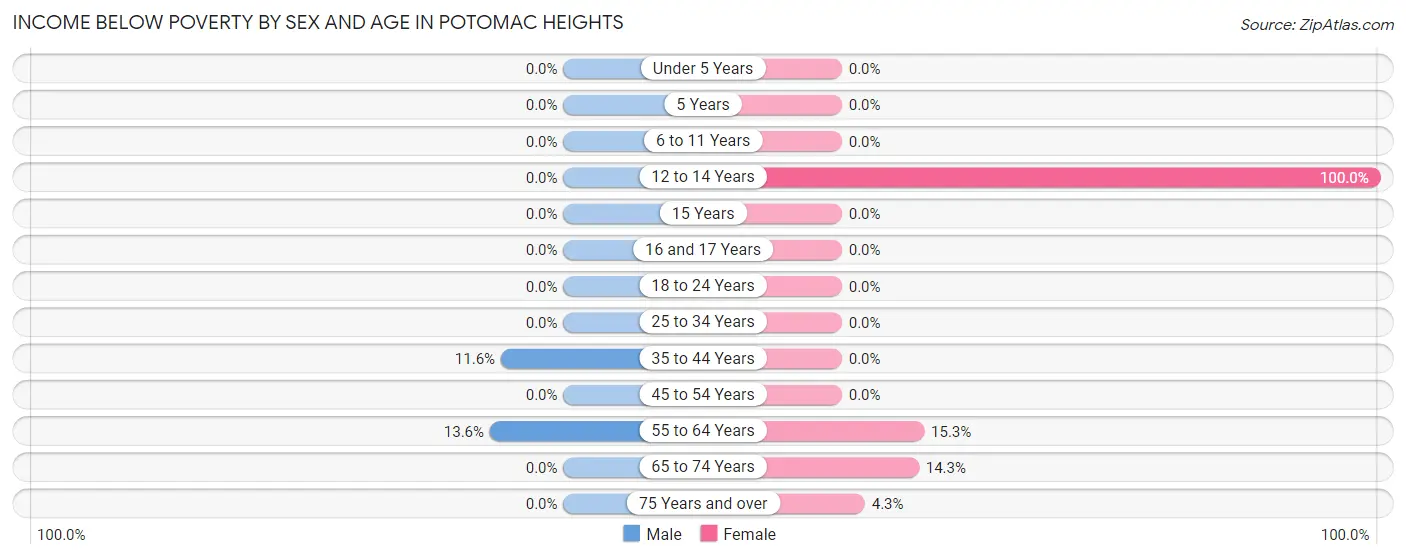
| Age Bracket | Male | Female |
| Under 5 Years | 0 (0.0%) | 0 (0.0%) |
| 5 Years | 0 (0.0%) | 0 (0.0%) |
| 6 to 11 Years | 0 (0.0%) | 0 (0.0%) |
| 12 to 14 Years | 0 (0.0%) | 11 (100.0%) |
| 15 Years | 0 (0.0%) | 0 (0.0%) |
| 16 and 17 Years | 0 (0.0%) | 0 (0.0%) |
| 18 to 24 Years | 0 (0.0%) | 0 (0.0%) |
| 25 to 34 Years | 0 (0.0%) | 0 (0.0%) |
| 35 to 44 Years | 8 (11.6%) | 0 (0.0%) |
| 45 to 54 Years | 0 (0.0%) | 0 (0.0%) |
| 55 to 64 Years | 9 (13.6%) | 11 (15.3%) |
| 65 to 74 Years | 0 (0.0%) | 9 (14.3%) |
| 75 Years and over | 0 (0.0%) | 10 (4.3%) |
| Total | 17 (3.7%) | 41 (5.8%) |
Income Above Poverty by Sex and Age in Potomac Heights
According to the poverty statistics in Potomac Heights, males aged 6 to 11 years and females aged under 5 years are the age groups that are most secure financially, with 100.0% of males and 100.0% of females in these age groups living above the poverty line.
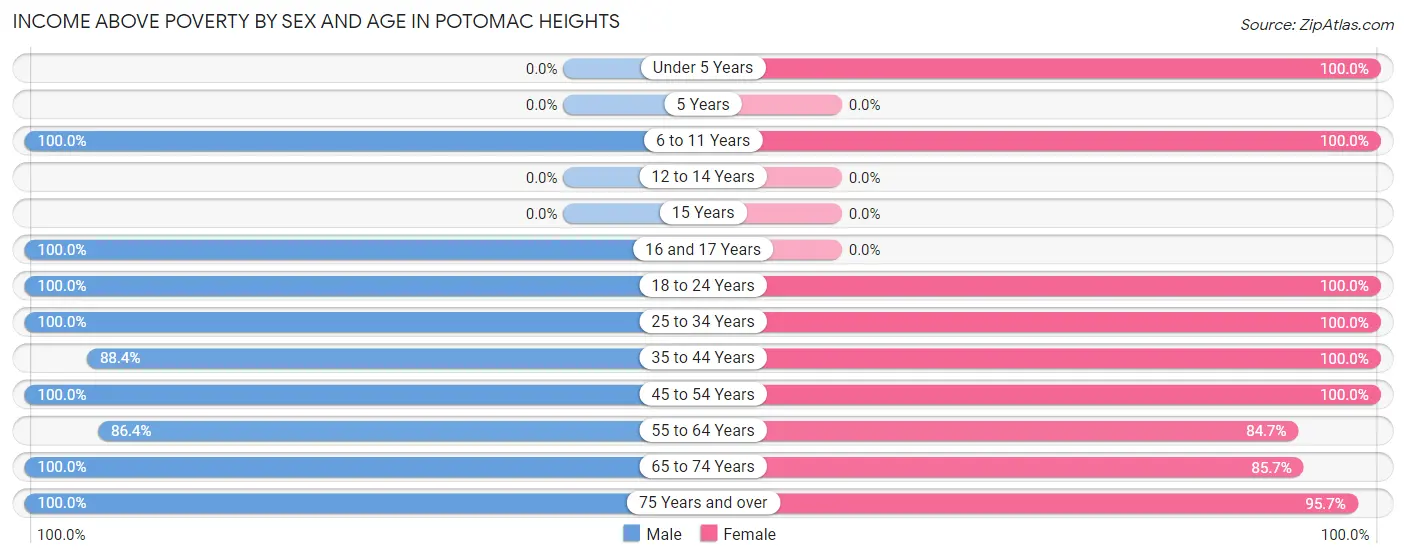
| Age Bracket | Male | Female |
| Under 5 Years | 0 (0.0%) | 7 (100.0%) |
| 5 Years | 0 (0.0%) | 0 (0.0%) |
| 6 to 11 Years | 35 (100.0%) | 61 (100.0%) |
| 12 to 14 Years | 0 (0.0%) | 0 (0.0%) |
| 15 Years | 0 (0.0%) | 0 (0.0%) |
| 16 and 17 Years | 76 (100.0%) | 0 (0.0%) |
| 18 to 24 Years | 23 (100.0%) | 9 (100.0%) |
| 25 to 34 Years | 15 (100.0%) | 40 (100.0%) |
| 35 to 44 Years | 61 (88.4%) | 109 (100.0%) |
| 45 to 54 Years | 123 (100.0%) | 99 (100.0%) |
| 55 to 64 Years | 57 (86.4%) | 61 (84.7%) |
| 65 to 74 Years | 40 (100.0%) | 54 (85.7%) |
| 75 Years and over | 14 (100.0%) | 224 (95.7%) |
| Total | 444 (96.3%) | 664 (94.2%) |
Income Below Poverty Among Married-Couple Families in Potomac Heights
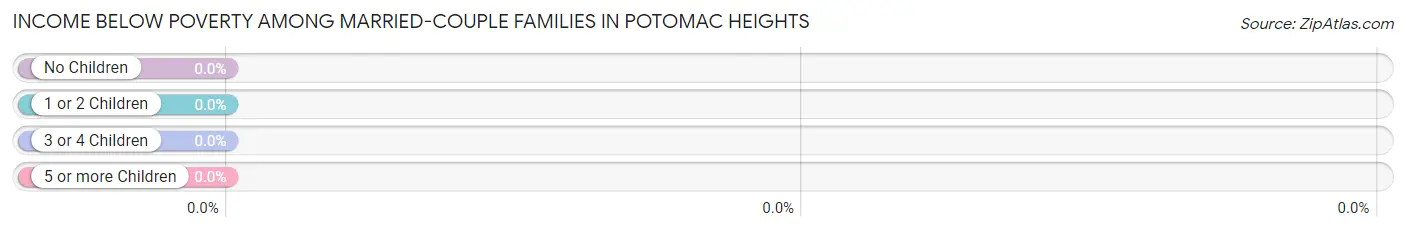
| Children | Above Poverty | Below Poverty |
| No Children | 78 (100.0%) | 0 (0.0%) |
| 1 or 2 Children | 105 (100.0%) | 0 (0.0%) |
| 3 or 4 Children | 24 (100.0%) | 0 (0.0%) |
| 5 or more Children | 0 (0.0%) | 0 (0.0%) |
| Total | 207 (100.0%) | 0 (0.0%) |
Income Below Poverty Among Single-Parent Households in Potomac Heights
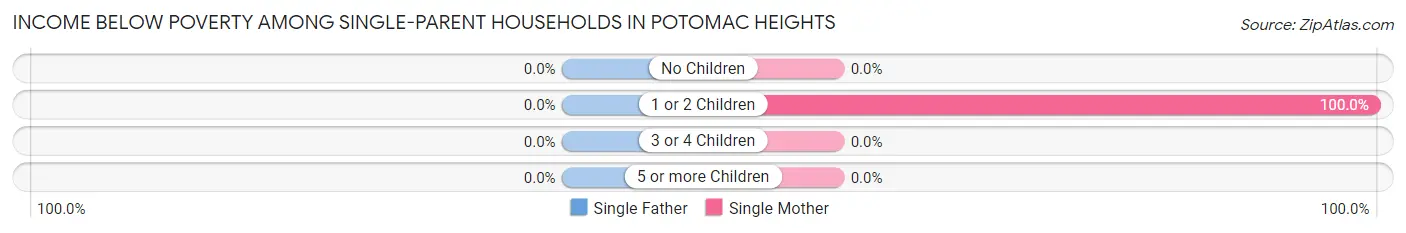
| Children | Single Father | Single Mother |
| No Children | 0 (0.0%) | 0 (0.0%) |
| 1 or 2 Children | 0 (0.0%) | 11 (100.0%) |
| 3 or 4 Children | 0 (0.0%) | 0 (0.0%) |
| 5 or more Children | 0 (0.0%) | 0 (0.0%) |
| Total | 0 (0.0%) | 11 (29.7%) |
Income Below Poverty Among Married-Couple vs Single-Parent Households in Potomac Heights
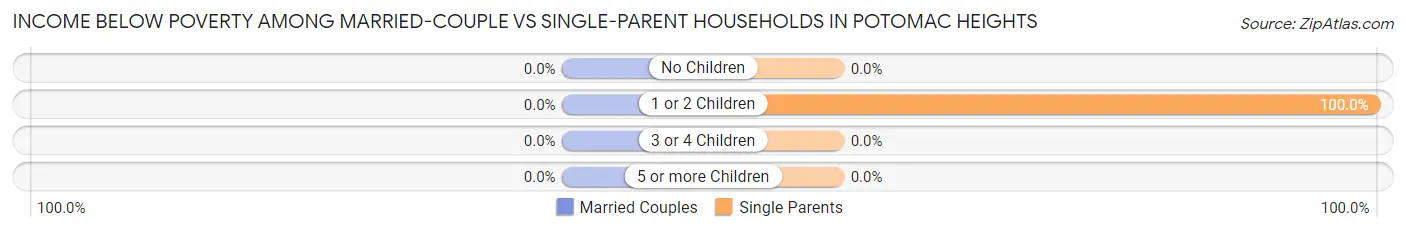
| Children | Married-Couple Families | Single-Parent Households |
| No Children | 0 (0.0%) | 0 (0.0%) |
| 1 or 2 Children | 0 (0.0%) | 11 (100.0%) |
| 3 or 4 Children | 0 (0.0%) | 0 (0.0%) |
| 5 or more Children | 0 (0.0%) | 0 (0.0%) |
| Total | 0 (0.0%) | 11 (24.4%) |
Race in Potomac Heights
The most populous races in Potomac Heights are White / Caucasian (1,027 | 88.1%), Black / African American (74 | 6.4%), and Asian (29 | 2.5%).
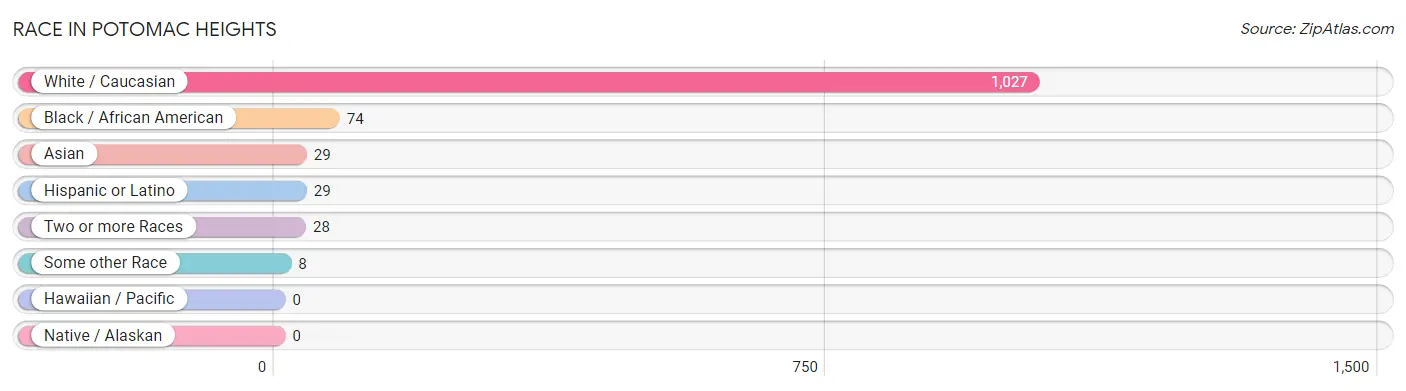
| Race | # Population | % Population |
| Asian | 29 | 2.5% |
| Black / African American | 74 | 6.4% |
| Hawaiian / Pacific | 0 | 0.0% |
| Hispanic or Latino | 29 | 2.5% |
| Native / Alaskan | 0 | 0.0% |
| White / Caucasian | 1,027 | 88.1% |
| Two or more Races | 28 | 2.4% |
| Some other Race | 8 | 0.7% |
| Total | 1,166 | 100.0% |
Ancestry in Potomac Heights
The most populous ancestries reported in Potomac Heights are English (509 | 43.6%), American (139 | 11.9%), Irish (113 | 9.7%), Italian (55 | 4.7%), and German (52 | 4.5%), together accounting for 74.4% of all Potomac Heights residents.
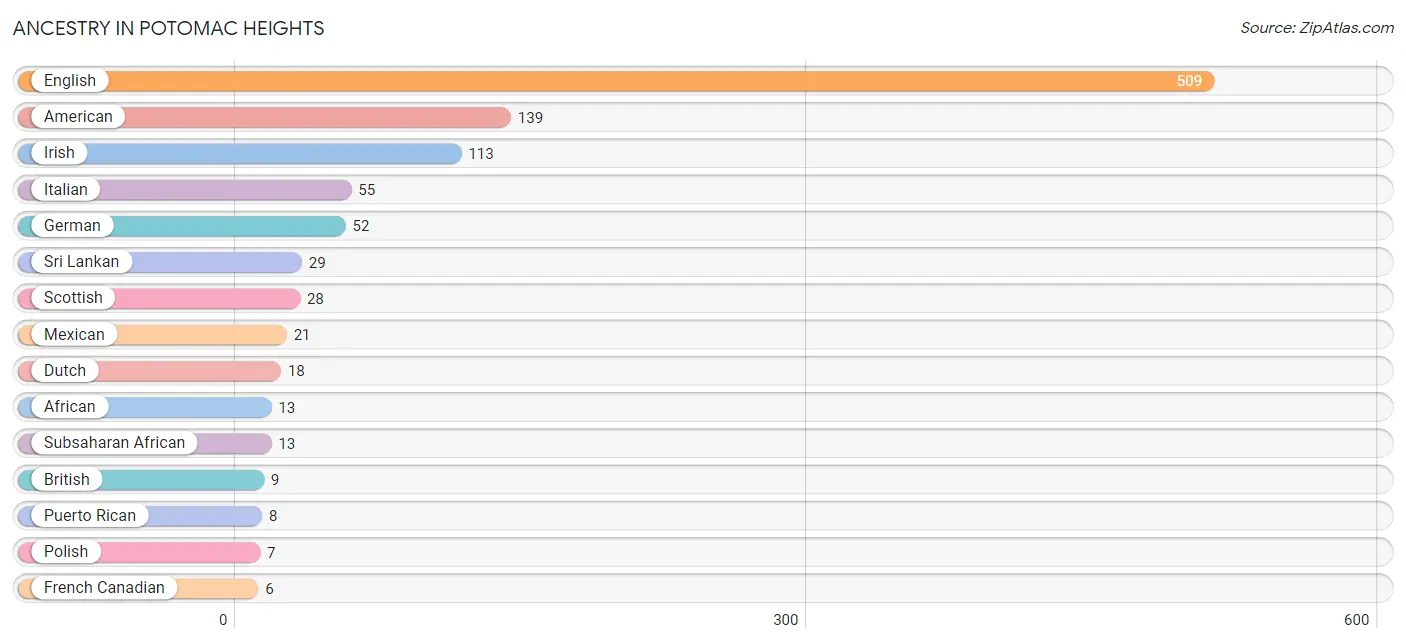
| Ancestry | # Population | % Population |
| African | 13 | 1.1% |
| American | 139 | 11.9% |
| British | 9 | 0.8% |
| Dutch | 18 | 1.5% |
| English | 509 | 43.6% |
| French Canadian | 6 | 0.5% |
| German | 52 | 4.5% |
| Irish | 113 | 9.7% |
| Italian | 55 | 4.7% |
| Mexican | 21 | 1.8% |
| Polish | 7 | 0.6% |
| Puerto Rican | 8 | 0.7% |
| Scottish | 28 | 2.4% |
| Sri Lankan | 29 | 2.5% |
| Subsaharan African | 13 | 1.1% |
| Welsh | 6 | 0.5% | View All 16 Rows |
Immigrants in Potomac Heights
The most numerous immigrant groups reported in Potomac Heights came from Asia (29 | 2.5%), South Eastern Asia (29 | 2.5%), Vietnam (29 | 2.5%), England (10 | 0.9%), and Europe (10 | 0.9%), together accounting for 9.2% of all Potomac Heights residents.
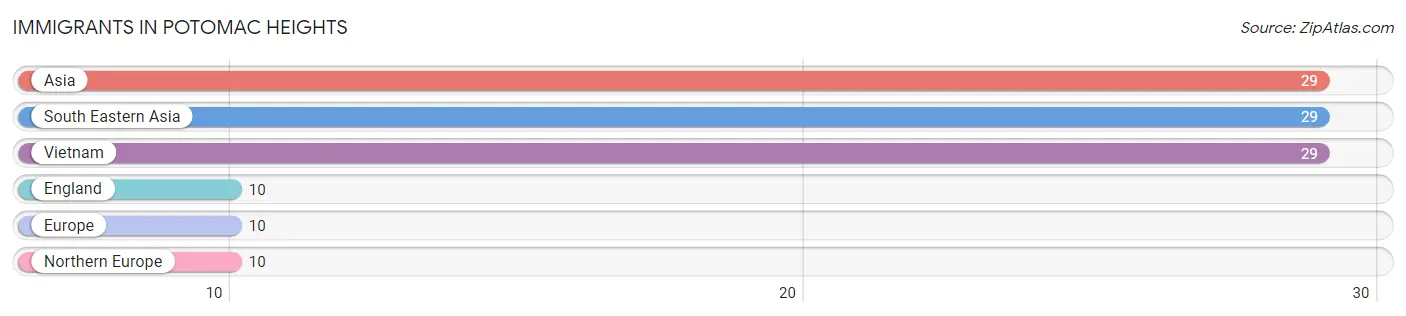
| Immigration Origin | # Population | % Population |
| Asia | 29 | 2.5% |
| England | 10 | 0.9% |
| Europe | 10 | 0.9% |
| Northern Europe | 10 | 0.9% |
| South Eastern Asia | 29 | 2.5% |
| Vietnam | 29 | 2.5% | View All 6 Rows |
Sex and Age in Potomac Heights
Sex and Age in Potomac Heights
The most populous age groups in Potomac Heights are 15 to 19 Years (90 | 19.5%) for men and 85 Years and over (139 | 19.7%) for women.
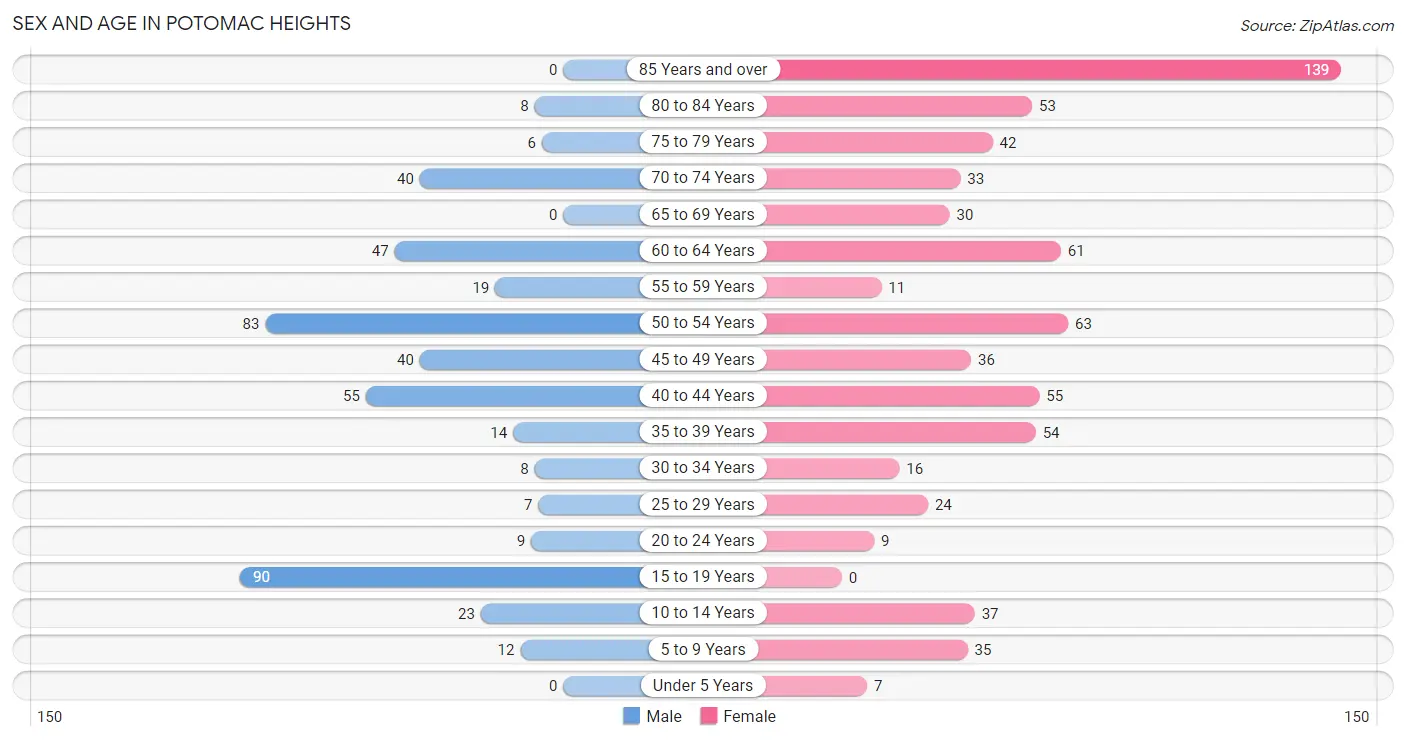
| Age Bracket | Male | Female |
| Under 5 Years | 0 (0.0%) | 7 (1.0%) |
| 5 to 9 Years | 12 (2.6%) | 35 (5.0%) |
| 10 to 14 Years | 23 (5.0%) | 37 (5.2%) |
| 15 to 19 Years | 90 (19.5%) | 0 (0.0%) |
| 20 to 24 Years | 9 (1.9%) | 9 (1.3%) |
| 25 to 29 Years | 7 (1.5%) | 24 (3.4%) |
| 30 to 34 Years | 8 (1.7%) | 16 (2.3%) |
| 35 to 39 Years | 14 (3.0%) | 54 (7.7%) |
| 40 to 44 Years | 55 (11.9%) | 55 (7.8%) |
| 45 to 49 Years | 40 (8.7%) | 36 (5.1%) |
| 50 to 54 Years | 83 (18.0%) | 63 (8.9%) |
| 55 to 59 Years | 19 (4.1%) | 11 (1.6%) |
| 60 to 64 Years | 47 (10.2%) | 61 (8.6%) |
| 65 to 69 Years | 0 (0.0%) | 30 (4.3%) |
| 70 to 74 Years | 40 (8.7%) | 33 (4.7%) |
| 75 to 79 Years | 6 (1.3%) | 42 (6.0%) |
| 80 to 84 Years | 8 (1.7%) | 53 (7.5%) |
| 85 Years and over | 0 (0.0%) | 139 (19.7%) |
| Total | 461 (100.0%) | 705 (100.0%) |
Families and Households in Potomac Heights
Median Family Size in Potomac Heights
The median family size in Potomac Heights is 2.98 persons per family, with married-couple families (207 | 82.1%) accounting for the largest median family size of 3.13 persons per family. On the other hand, single male/father families (8 | 3.2%) represent the smallest median family size with 2.00 persons per family.
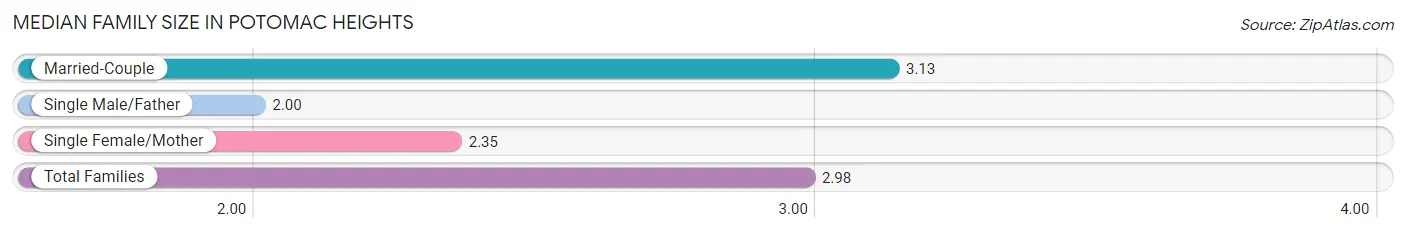
| Family Type | # Families | Family Size |
| Married-Couple | 207 (82.1%) | 3.13 |
| Single Male/Father | 8 (3.2%) | 2.00 |
| Single Female/Mother | 37 (14.7%) | 2.35 |
| Total Families | 252 (100.0%) | 2.98 |
Median Household Size in Potomac Heights
The median household size in Potomac Heights is 1.84 persons per household, with married-couple households (207 | 32.8%) accounting for the largest median household size of 3.2 persons per household. non-family households (380 | 60.1%) represent the smallest median household size with 1.06 persons per household.
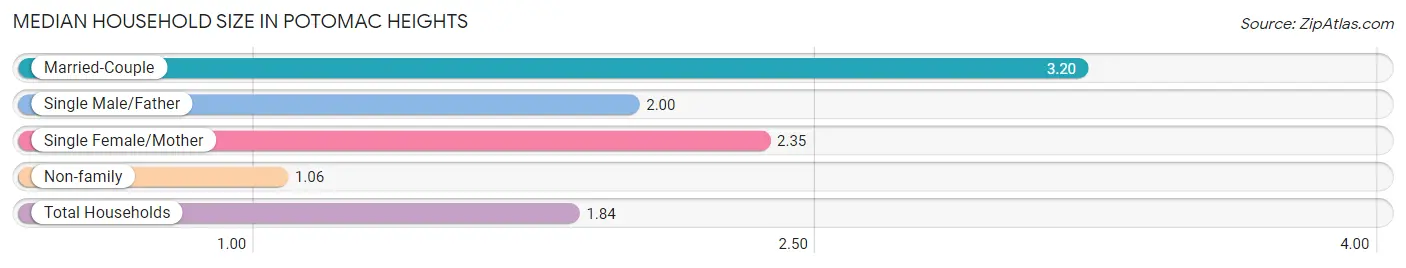
| Household Type | # Households | Household Size |
| Married-Couple | 207 (32.8%) | 3.20 |
| Single Male/Father | 8 (1.3%) | 2.00 |
| Single Female/Mother | 37 (5.9%) | 2.35 |
| Non-family | 380 (60.1%) | 1.06 |
| Total Households | 632 (100.0%) | 1.84 |
Household Size by Marriage Status in Potomac Heights
Out of a total of 632 households in Potomac Heights, 252 (39.9%) are family households, while 380 (60.1%) are nonfamily households. The most numerous type of family households are 3-person households, comprising 122, and the most common type of nonfamily households are 1-person households, comprising 358.
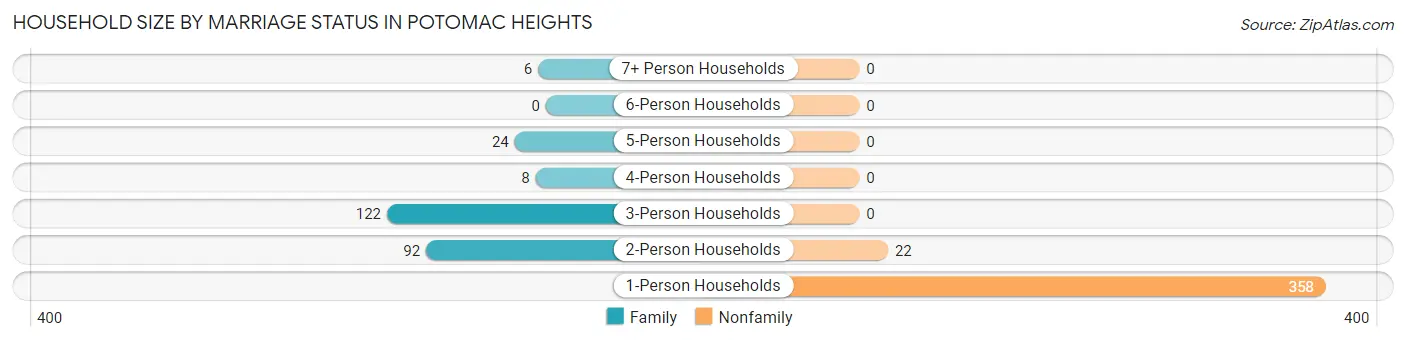
| Household Size | Family Households | Nonfamily Households |
| 1-Person Households | - | 358 (56.7%) |
| 2-Person Households | 92 (14.6%) | 22 (3.5%) |
| 3-Person Households | 122 (19.3%) | 0 (0.0%) |
| 4-Person Households | 8 (1.3%) | 0 (0.0%) |
| 5-Person Households | 24 (3.8%) | 0 (0.0%) |
| 6-Person Households | 0 (0.0%) | 0 (0.0%) |
| 7+ Person Households | 6 (0.9%) | 0 (0.0%) |
| Total | 252 (39.9%) | 380 (60.1%) |
Female Fertility in Potomac Heights
Fertility by Age in Potomac Heights
| Age Bracket | Women with Births | Births / 1,000 Women |
| 15 to 19 years | 0 (0.0%) | 0.0 |
| 20 to 34 years | 0 (0.0%) | 0.0 |
| 35 to 50 years | 0 (0.0%) | 0.0 |
| Total | 0 (0.0%) | 0.0 |
Fertility by Age by Marriage Status in Potomac Heights
| Age Bracket | Married | Unmarried |
| 15 to 19 years | 0 (0.0%) | 0 (0.0%) |
| 20 to 34 years | 0 (0.0%) | 0 (0.0%) |
| 35 to 50 years | 0 (0.0%) | 0 (0.0%) |
| Total | 0 (0.0%) | 0 (0.0%) |
Fertility by Education in Potomac Heights
| Educational Attainment | Women with Births | Births / 1,000 Women |
| Less than High School | 0 (0.0%) | 0.0 |
| High School Diploma | 0 (0.0%) | 0.0 |
| College or Associate's Degree | 0 (0.0%) | 0.0 |
| Bachelor's Degree | 0 (0.0%) | 0.0 |
| Graduate Degree | 0 (0.0%) | 0.0 |
| Total | 0 (0.0%) | 0.0 |
Fertility by Education by Marriage Status in Potomac Heights
| Educational Attainment | Married | Unmarried |
| Less than High School | 0 (0.0%) | 0 (0.0%) |
| High School Diploma | 0 (0.0%) | 0 (0.0%) |
| College or Associate's Degree | 0 (0.0%) | 0 (0.0%) |
| Bachelor's Degree | 0 (0.0%) | 0 (0.0%) |
| Graduate Degree | 0 (0.0%) | 0 (0.0%) |
| Total | 0 (0.0%) | 0 (0.0%) |
Employment Characteristics in Potomac Heights
Employment by Class of Employer in Potomac Heights
Among the 476 employed individuals in Potomac Heights, private company employees (289 | 60.7%), federal government employees (127 | 26.7%), and local government employees (28 | 5.9%) make up the most common classes of employment.
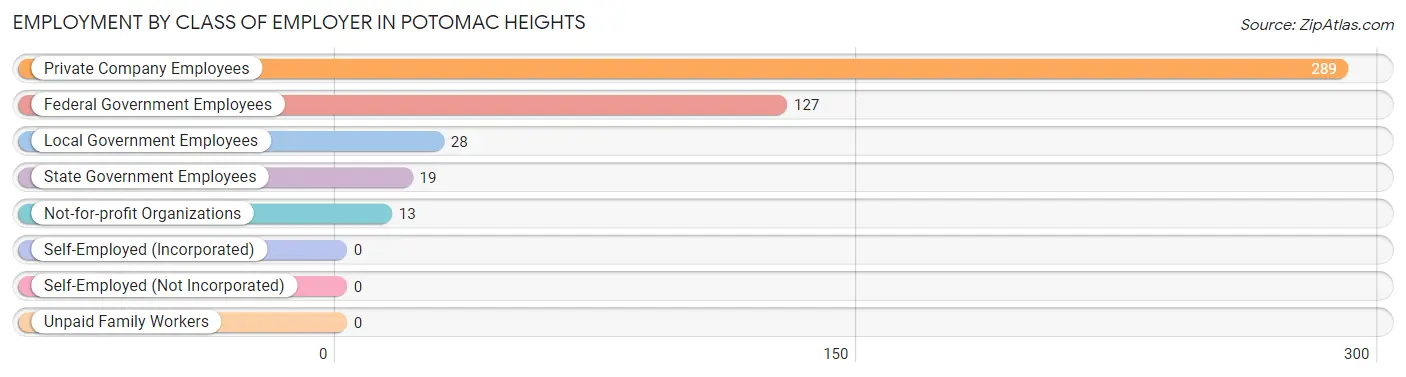
| Employer Class | # Employees | % Employees |
| Private Company Employees | 289 | 60.7% |
| Self-Employed (Incorporated) | 0 | 0.0% |
| Self-Employed (Not Incorporated) | 0 | 0.0% |
| Not-for-profit Organizations | 13 | 2.7% |
| Local Government Employees | 28 | 5.9% |
| State Government Employees | 19 | 4.0% |
| Federal Government Employees | 127 | 26.7% |
| Unpaid Family Workers | 0 | 0.0% |
| Total | 476 | 100.0% |
Employment Status by Age in Potomac Heights
According to the labor force statistics for Potomac Heights, out of the total population over 16 years of age (1,052), 46.6% or 490 individuals are in the labor force, with 2.9% or 14 of them unemployed. The age group with the highest labor force participation rate is 25 to 29 years, with 100.0% or 31 individuals in the labor force. Within the labor force, the 60 to 64 years age range has the highest percentage of unemployed individuals, with 13.5% or 7 of them being unemployed.
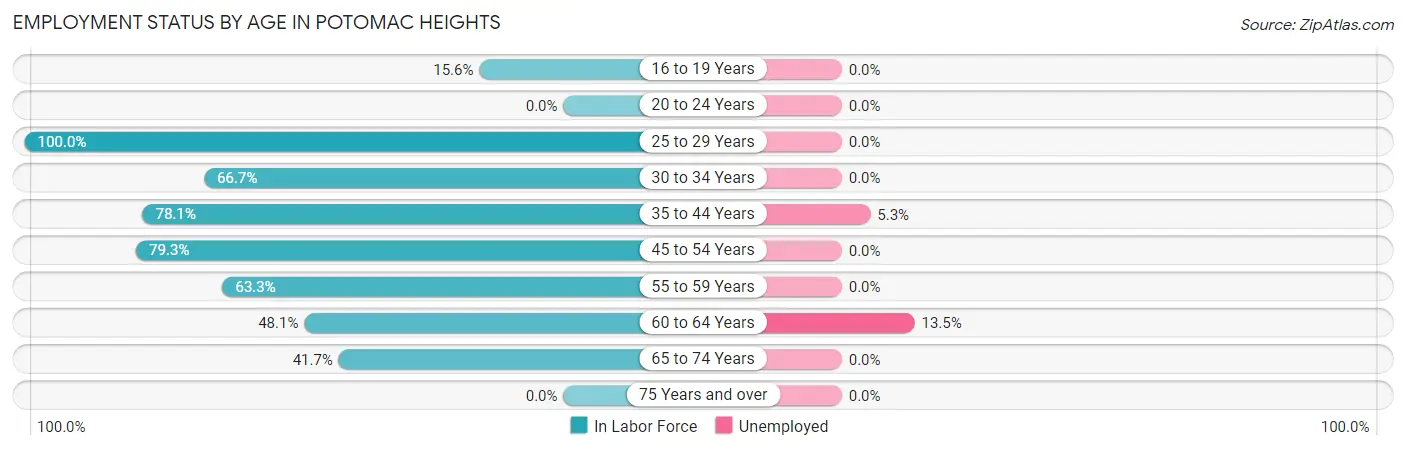
| Age Bracket | In Labor Force | Unemployed |
| 16 to 19 Years | 14 (15.6%) | 0 (0.0%) |
| 20 to 24 Years | 0 (0.0%) | 0 (0.0%) |
| 25 to 29 Years | 31 (100.0%) | 0 (0.0%) |
| 30 to 34 Years | 16 (66.7%) | 0 (0.0%) |
| 35 to 44 Years | 139 (78.1%) | 7 (5.3%) |
| 45 to 54 Years | 176 (79.3%) | 0 (0.0%) |
| 55 to 59 Years | 19 (63.3%) | 0 (0.0%) |
| 60 to 64 Years | 52 (48.1%) | 7 (13.5%) |
| 65 to 74 Years | 43 (41.7%) | 0 (0.0%) |
| 75 Years and over | 0 (0.0%) | 0 (0.0%) |
| Total | 490 (46.6%) | 14 (2.9%) |
Employment Status by Educational Attainment in Potomac Heights
According to labor force statistics for Potomac Heights, 73.0% of individuals (433) out of the total population between 25 and 64 years of age (593) are in the labor force, with 3.3% or 14 of them being unemployed. The group with the highest labor force participation rate are those with the educational attainment of less than high school, with 100.0% or 80 individuals in the labor force. Within the labor force, individuals with bachelor's degree or higher education have the highest percentage of unemployment, with 10.1% or 7 of them being unemployed.
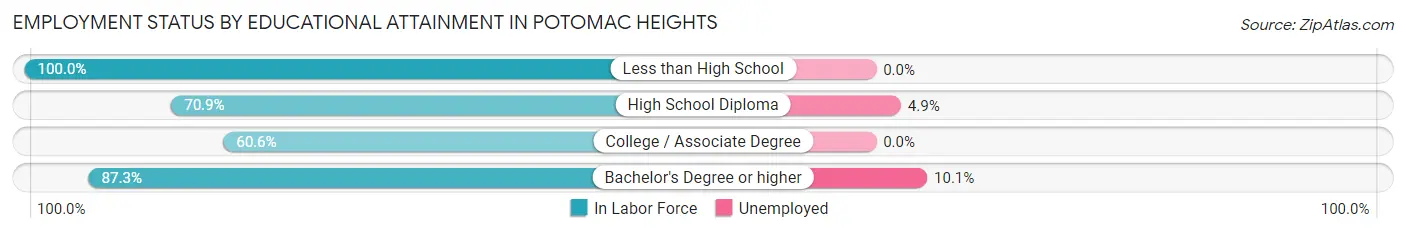
| Educational Attainment | In Labor Force | Unemployed |
| Less than High School | 80 (100.0%) | 0 (0.0%) |
| High School Diploma | 144 (70.9%) | 10 (4.9%) |
| College / Associate Degree | 140 (60.6%) | 0 (0.0%) |
| Bachelor's Degree or higher | 69 (87.3%) | 8 (10.1%) |
| Total | 433 (73.0%) | 20 (3.3%) |
Employment Occupations by Sex in Potomac Heights
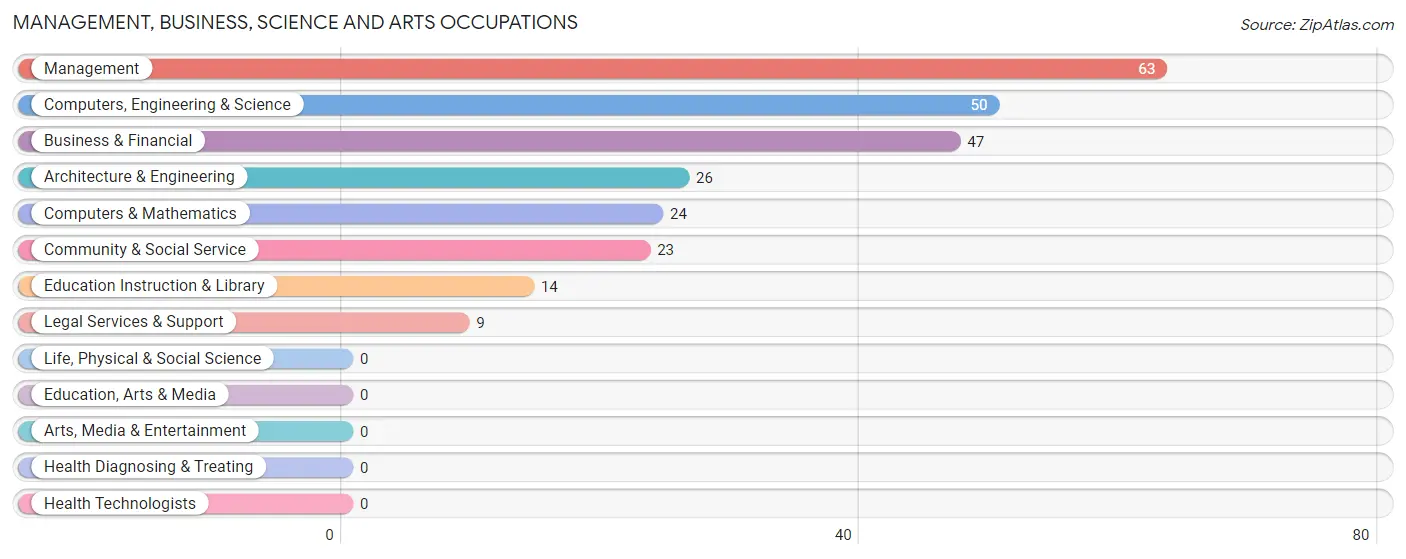
Management, Business, Science and Arts Occupations
The most common Management, Business, Science and Arts occupations in Potomac Heights are Management (63 | 13.4%), Computers, Engineering & Science (50 | 10.7%), Business & Financial (47 | 10.0%), Architecture & Engineering (26 | 5.5%), and Computers & Mathematics (24 | 5.1%).
Management, Business, Science and Arts Occupations by Sex
Within the Management, Business, Science and Arts occupations in Potomac Heights, the most male-oriented occupations are Architecture & Engineering (100.0%), Business & Financial (80.8%), and Computers, Engineering & Science (52.0%), while the most female-oriented occupations are Computers & Mathematics (100.0%), Community & Social Service (100.0%), and Legal Services & Support (100.0%).
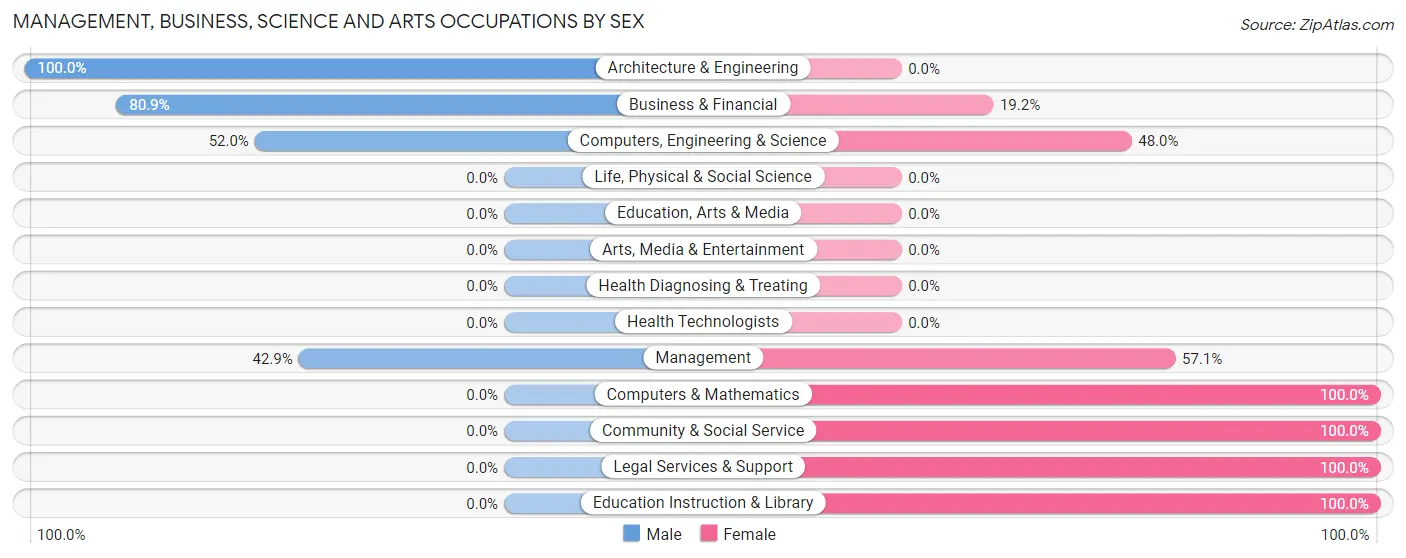
| Occupation | Male | Female |
| Management | 27 (42.9%) | 36 (57.1%) |
| Business & Financial | 38 (80.8%) | 9 (19.2%) |
| Computers, Engineering & Science | 26 (52.0%) | 24 (48.0%) |
| Computers & Mathematics | 0 (0.0%) | 24 (100.0%) |
| Architecture & Engineering | 26 (100.0%) | 0 (0.0%) |
| Life, Physical & Social Science | 0 (0.0%) | 0 (0.0%) |
| Community & Social Service | 0 (0.0%) | 23 (100.0%) |
| Education, Arts & Media | 0 (0.0%) | 0 (0.0%) |
| Legal Services & Support | 0 (0.0%) | 9 (100.0%) |
| Education Instruction & Library | 0 (0.0%) | 14 (100.0%) |
| Arts, Media & Entertainment | 0 (0.0%) | 0 (0.0%) |
| Health Diagnosing & Treating | 0 (0.0%) | 0 (0.0%) |
| Health Technologists | 0 (0.0%) | 0 (0.0%) |
| Total (Category) | 91 (49.7%) | 92 (50.3%) |
| Total (Overall) | 253 (53.9%) | 216 (46.1%) |
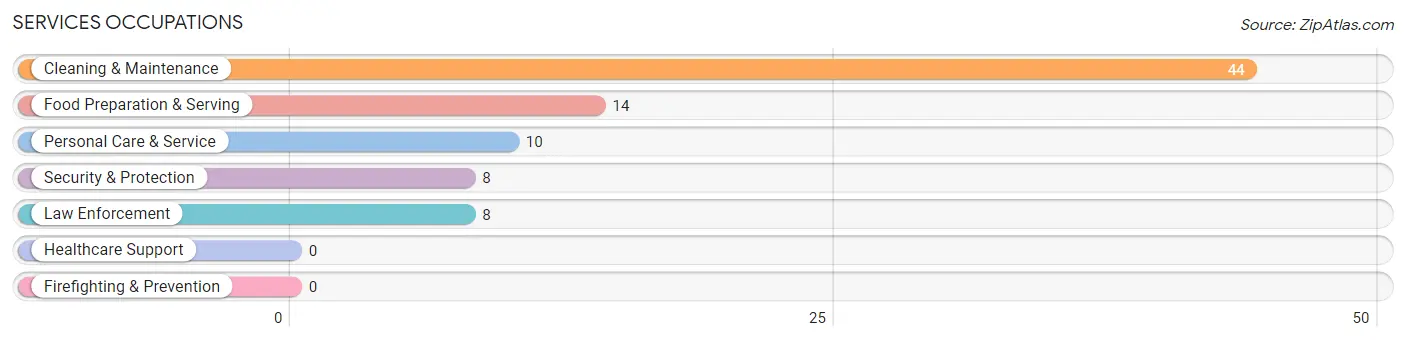
Services Occupations
The most common Services occupations in Potomac Heights are Cleaning & Maintenance (44 | 9.4%), Food Preparation & Serving (14 | 3.0%), Personal Care & Service (10 | 2.1%), Security & Protection (8 | 1.7%), and Law Enforcement (8 | 1.7%).
Services Occupations by Sex
Within the Services occupations in Potomac Heights, the most male-oriented occupations are Security & Protection (100.0%), Law Enforcement (100.0%), and Food Preparation & Serving (100.0%), while the most female-oriented occupations are Cleaning & Maintenance (100.0%), and Personal Care & Service (100.0%).
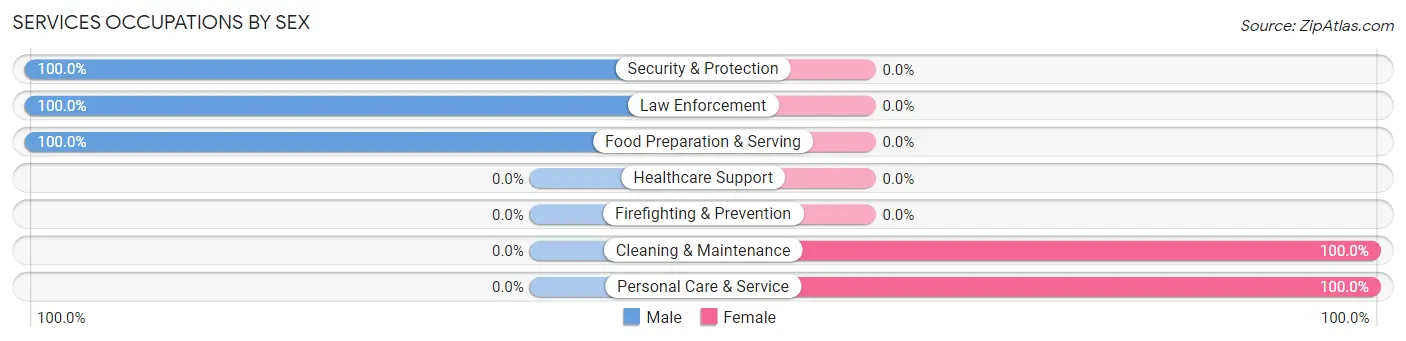
| Occupation | Male | Female |
| Healthcare Support | 0 (0.0%) | 0 (0.0%) |
| Security & Protection | 8 (100.0%) | 0 (0.0%) |
| Firefighting & Prevention | 0 (0.0%) | 0 (0.0%) |
| Law Enforcement | 8 (100.0%) | 0 (0.0%) |
| Food Preparation & Serving | 14 (100.0%) | 0 (0.0%) |
| Cleaning & Maintenance | 0 (0.0%) | 44 (100.0%) |
| Personal Care & Service | 0 (0.0%) | 10 (100.0%) |
| Total (Category) | 22 (28.9%) | 54 (71.1%) |
| Total (Overall) | 253 (53.9%) | 216 (46.1%) |
Sales and Office Occupations
The most common Sales and Office occupations in Potomac Heights are Sales & Related (28 | 6.0%), and Office & Administration (13 | 2.8%).

Sales and Office Occupations by Sex
| Occupation | Male | Female |
| Sales & Related | 4 (14.3%) | 24 (85.7%) |
| Office & Administration | 0 (0.0%) | 13 (100.0%) |
| Total (Category) | 4 (9.8%) | 37 (90.2%) |
| Total (Overall) | 253 (53.9%) | 216 (46.1%) |
Natural Resources, Construction and Maintenance Occupations
The most common Natural Resources, Construction and Maintenance occupations in Potomac Heights are Construction & Extraction (60 | 12.8%), and Installation, Maintenance & Repair (25 | 5.3%).
Natural Resources, Construction and Maintenance Occupations by Sex
| Occupation | Male | Female |
| Farming, Fishing & Forestry | 0 (0.0%) | 0 (0.0%) |
| Construction & Extraction | 60 (100.0%) | 0 (0.0%) |
| Installation, Maintenance & Repair | 25 (100.0%) | 0 (0.0%) |
| Total (Category) | 85 (100.0%) | 0 (0.0%) |
| Total (Overall) | 253 (53.9%) | 216 (46.1%) |
Production, Transportation and Moving Occupations
The most common Production, Transportation and Moving occupations in Potomac Heights are Material Moving (37 | 7.9%), Transportation (32 | 6.8%), and Production (15 | 3.2%).
Production, Transportation and Moving Occupations by Sex
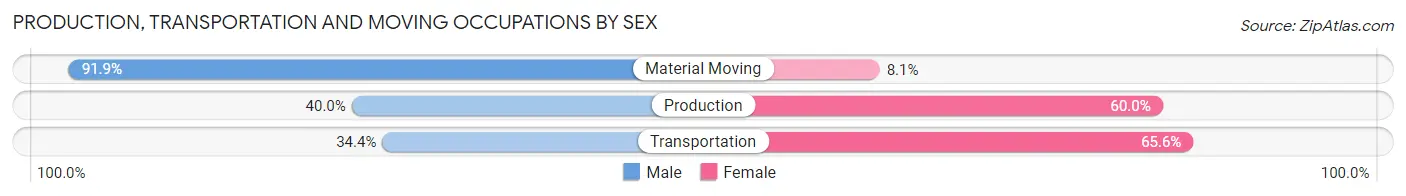
| Occupation | Male | Female |
| Production | 6 (40.0%) | 9 (60.0%) |
| Transportation | 11 (34.4%) | 21 (65.6%) |
| Material Moving | 34 (91.9%) | 3 (8.1%) |
| Total (Category) | 51 (60.7%) | 33 (39.3%) |
| Total (Overall) | 253 (53.9%) | 216 (46.1%) |
Employment Industries by Sex in Potomac Heights
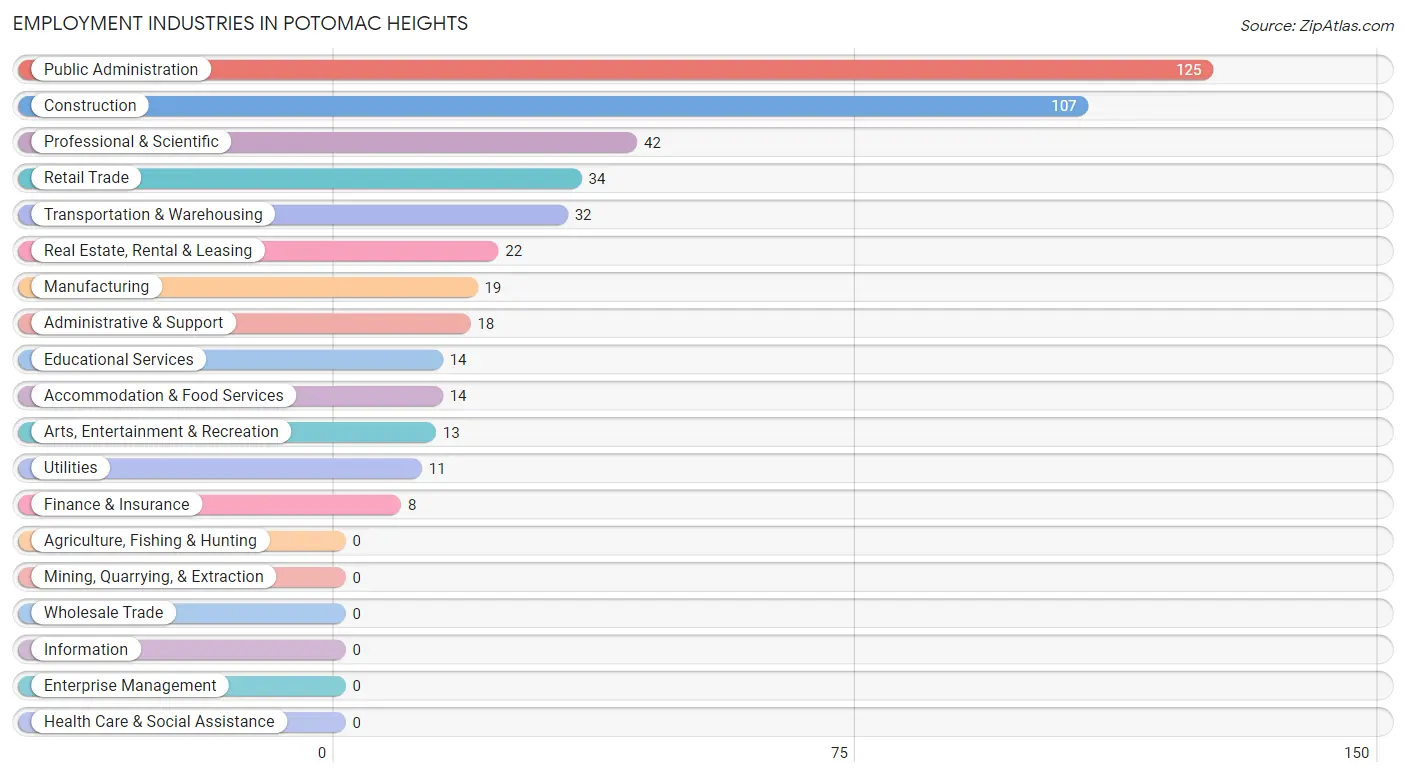
Employment Industries in Potomac Heights
The major employment industries in Potomac Heights include Public Administration (125 | 26.7%), Construction (107 | 22.8%), Professional & Scientific (42 | 9.0%), Retail Trade (34 | 7.2%), and Transportation & Warehousing (32 | 6.8%).
Employment Industries by Sex in Potomac Heights
The Potomac Heights industries that see more men than women are Manufacturing (100.0%), Utilities (100.0%), and Arts, Entertainment & Recreation (100.0%), whereas the industries that tend to have a higher number of women are Finance & Insurance (100.0%), Real Estate, Rental & Leasing (100.0%), and Educational Services (100.0%).
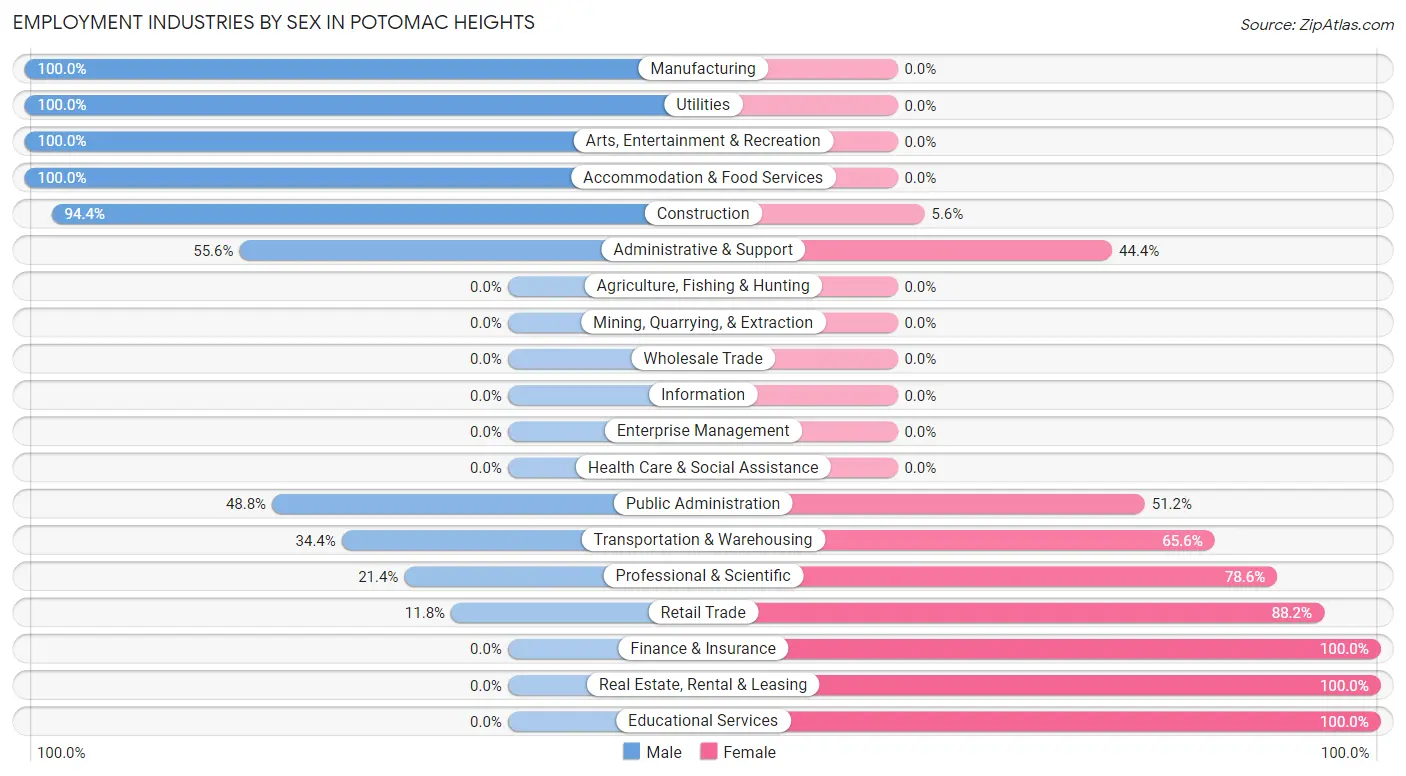
| Industry | Male | Female |
| Agriculture, Fishing & Hunting | 0 (0.0%) | 0 (0.0%) |
| Mining, Quarrying, & Extraction | 0 (0.0%) | 0 (0.0%) |
| Construction | 101 (94.4%) | 6 (5.6%) |
| Manufacturing | 19 (100.0%) | 0 (0.0%) |
| Wholesale Trade | 0 (0.0%) | 0 (0.0%) |
| Retail Trade | 4 (11.8%) | 30 (88.2%) |
| Transportation & Warehousing | 11 (34.4%) | 21 (65.6%) |
| Utilities | 11 (100.0%) | 0 (0.0%) |
| Information | 0 (0.0%) | 0 (0.0%) |
| Finance & Insurance | 0 (0.0%) | 8 (100.0%) |
| Real Estate, Rental & Leasing | 0 (0.0%) | 22 (100.0%) |
| Professional & Scientific | 9 (21.4%) | 33 (78.6%) |
| Enterprise Management | 0 (0.0%) | 0 (0.0%) |
| Administrative & Support | 10 (55.6%) | 8 (44.4%) |
| Educational Services | 0 (0.0%) | 14 (100.0%) |
| Health Care & Social Assistance | 0 (0.0%) | 0 (0.0%) |
| Arts, Entertainment & Recreation | 13 (100.0%) | 0 (0.0%) |
| Accommodation & Food Services | 14 (100.0%) | 0 (0.0%) |
| Public Administration | 61 (48.8%) | 64 (51.2%) |
| Total | 253 (53.9%) | 216 (46.1%) |
Education in Potomac Heights
School Enrollment in Potomac Heights
The most common levels of schooling among the 192 students in Potomac Heights are high school (87 | 45.3%), elementary school (61 | 31.8%), and kindergarten (35 | 18.2%).
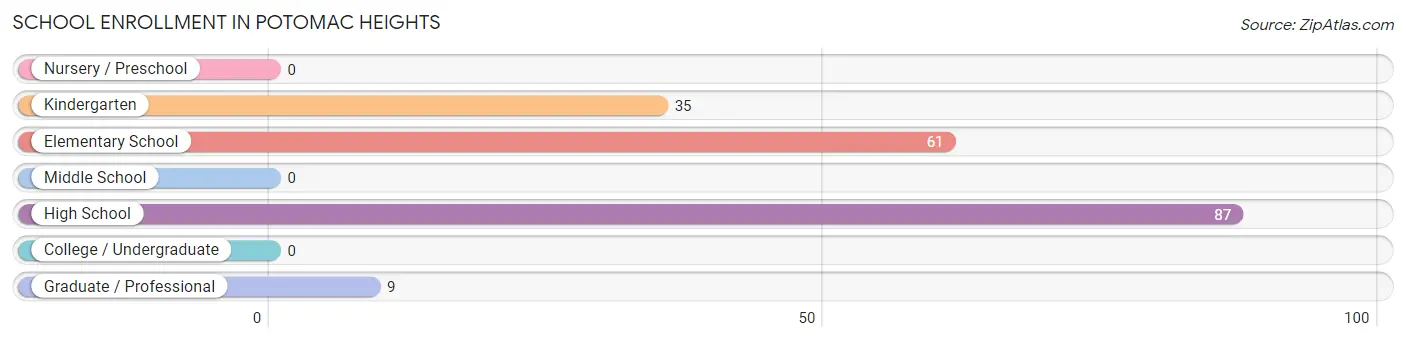
| School Level | # Students | % Students |
| Nursery / Preschool | 0 | 0.0% |
| Kindergarten | 35 | 18.2% |
| Elementary School | 61 | 31.8% |
| Middle School | 0 | 0.0% |
| High School | 87 | 45.3% |
| College / Undergraduate | 0 | 0.0% |
| Graduate / Professional | 9 | 4.7% |
| Total | 192 | 100.0% |
School Enrollment by Age by Funding Source in Potomac Heights
Out of a total of 192 students who are enrolled in schools in Potomac Heights, 9 (4.7%) attend a private institution, while the remaining 183 (95.3%) are enrolled in public schools. The age group of 20 to 24 year olds has the highest likelihood of being enrolled in private schools, with 9 (100.0% in the age bracket) enrolled. Conversely, the age group of 5 to 9 year old has the lowest likelihood of being enrolled in a private school, with 47 (100.0% in the age bracket) attending a public institution.
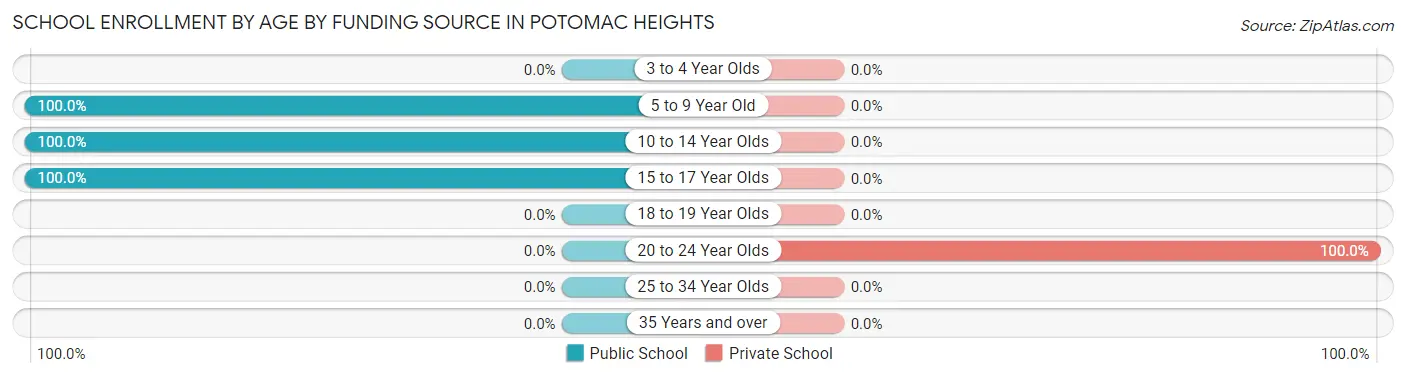
| Age Bracket | Public School | Private School |
| 3 to 4 Year Olds | 0 (0.0%) | 0 (0.0%) |
| 5 to 9 Year Old | 47 (100.0%) | 0 (0.0%) |
| 10 to 14 Year Olds | 60 (100.0%) | 0 (0.0%) |
| 15 to 17 Year Olds | 76 (100.0%) | 0 (0.0%) |
| 18 to 19 Year Olds | 0 (0.0%) | 0 (0.0%) |
| 20 to 24 Year Olds | 0 (0.0%) | 9 (100.0%) |
| 25 to 34 Year Olds | 0 (0.0%) | 0 (0.0%) |
| 35 Years and over | 0 (0.0%) | 0 (0.0%) |
| Total | 183 (95.3%) | 9 (4.7%) |
Educational Attainment by Field of Study in Potomac Heights
Education (149 | 61.6%), engineering (26 | 10.7%), science & technology (13 | 5.4%), visual & performing arts (10 | 4.1%), and social sciences (9 | 3.7%) are the most common fields of study among 242 individuals in Potomac Heights who have obtained a bachelor's degree or higher.
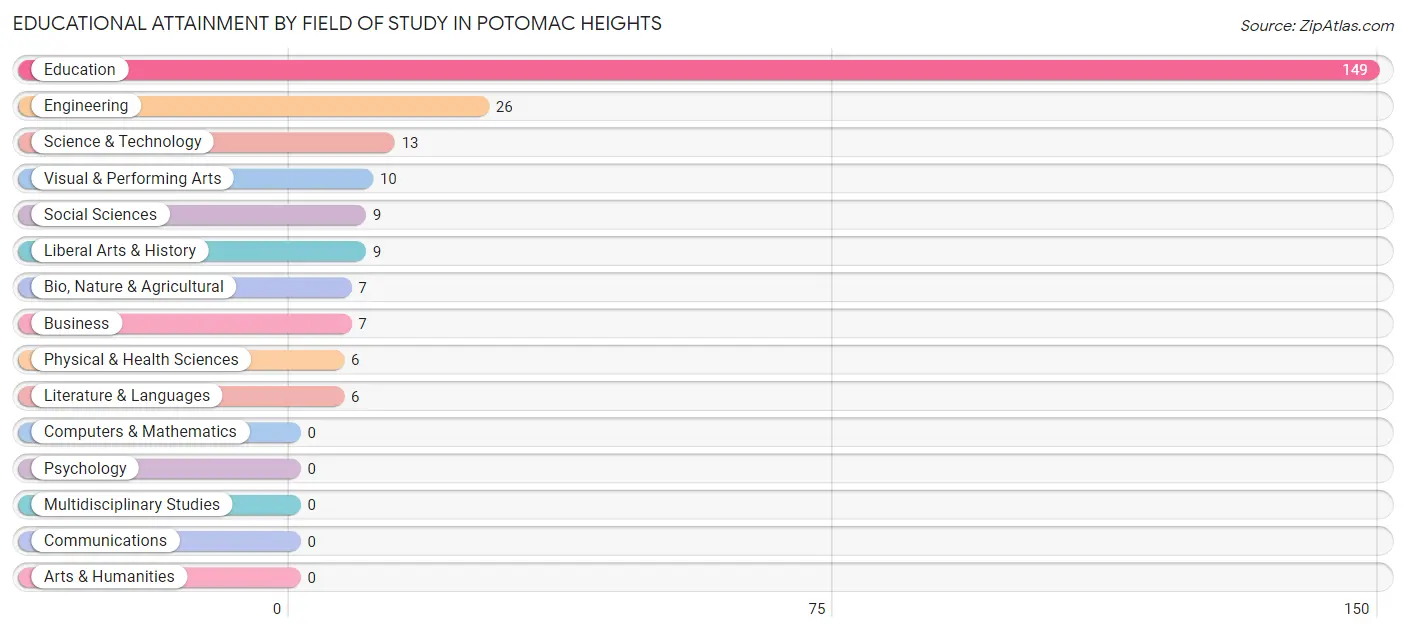
| Field of Study | # Graduates | % Graduates |
| Computers & Mathematics | 0 | 0.0% |
| Bio, Nature & Agricultural | 7 | 2.9% |
| Physical & Health Sciences | 6 | 2.5% |
| Psychology | 0 | 0.0% |
| Social Sciences | 9 | 3.7% |
| Engineering | 26 | 10.7% |
| Multidisciplinary Studies | 0 | 0.0% |
| Science & Technology | 13 | 5.4% |
| Business | 7 | 2.9% |
| Education | 149 | 61.6% |
| Literature & Languages | 6 | 2.5% |
| Liberal Arts & History | 9 | 3.7% |
| Visual & Performing Arts | 10 | 4.1% |
| Communications | 0 | 0.0% |
| Arts & Humanities | 0 | 0.0% |
| Total | 242 | 100.0% |
Transportation & Commute in Potomac Heights
Vehicle Availability by Sex in Potomac Heights
The most prevalent vehicle ownership categories in Potomac Heights are males with 2 vehicles (138, accounting for 54.5%) and females with 2 vehicles (108, making up 61.9%).
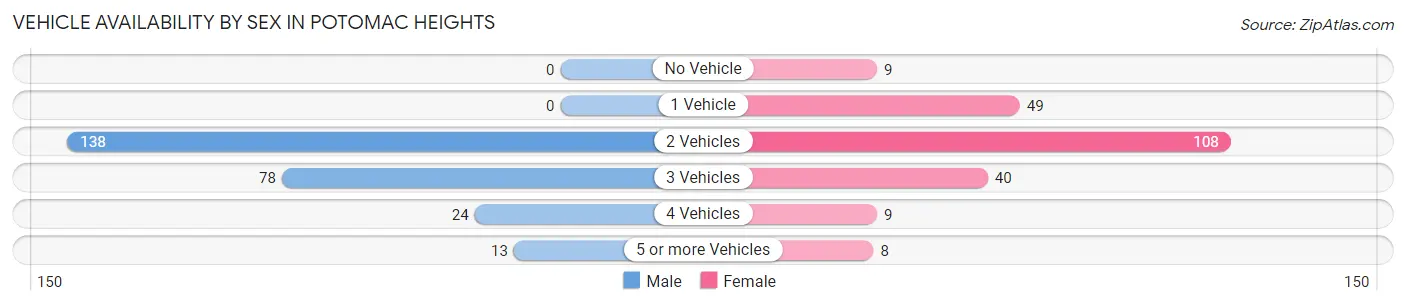
| Vehicles Available | Male | Female |
| No Vehicle | 0 (0.0%) | 9 (4.0%) |
| 1 Vehicle | 0 (0.0%) | 49 (22.0%) |
| 2 Vehicles | 138 (54.5%) | 108 (48.4%) |
| 3 Vehicles | 78 (30.8%) | 40 (17.9%) |
| 4 Vehicles | 24 (9.5%) | 9 (4.0%) |
| 5 or more Vehicles | 13 (5.1%) | 8 (3.6%) |
| Total | 253 (100.0%) | 223 (100.0%) |
Commute Time in Potomac Heights
The most frequently occuring commute durations in Potomac Heights are 60 to 89 minutes (107 commuters, 23.8%), 20 to 24 minutes (83 commuters, 18.5%), and less than 5 minutes (70 commuters, 15.6%).
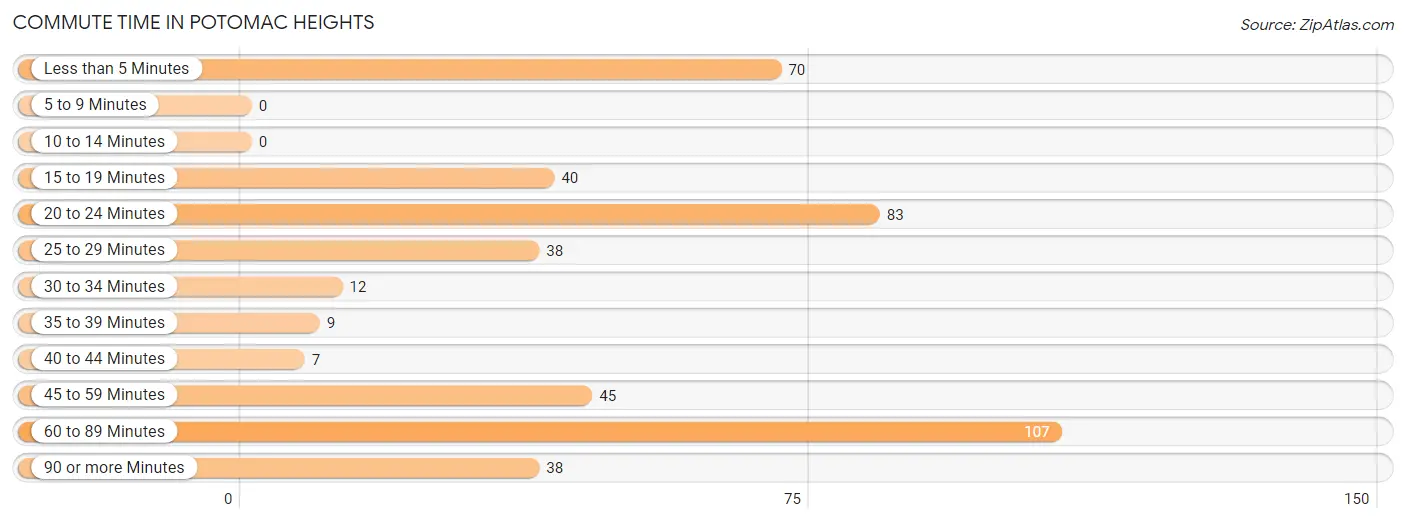
| Commute Time | # Commuters | % Commuters |
| Less than 5 Minutes | 70 | 15.6% |
| 5 to 9 Minutes | 0 | 0.0% |
| 10 to 14 Minutes | 0 | 0.0% |
| 15 to 19 Minutes | 40 | 8.9% |
| 20 to 24 Minutes | 83 | 18.5% |
| 25 to 29 Minutes | 38 | 8.5% |
| 30 to 34 Minutes | 12 | 2.7% |
| 35 to 39 Minutes | 9 | 2.0% |
| 40 to 44 Minutes | 7 | 1.6% |
| 45 to 59 Minutes | 45 | 10.0% |
| 60 to 89 Minutes | 107 | 23.8% |
| 90 or more Minutes | 38 | 8.5% |
Commute Time by Sex in Potomac Heights
The most common commute times in Potomac Heights are 60 to 89 minutes (89 commuters, 39.4%) for males and 20 to 24 minutes (76 commuters, 34.1%) for females.
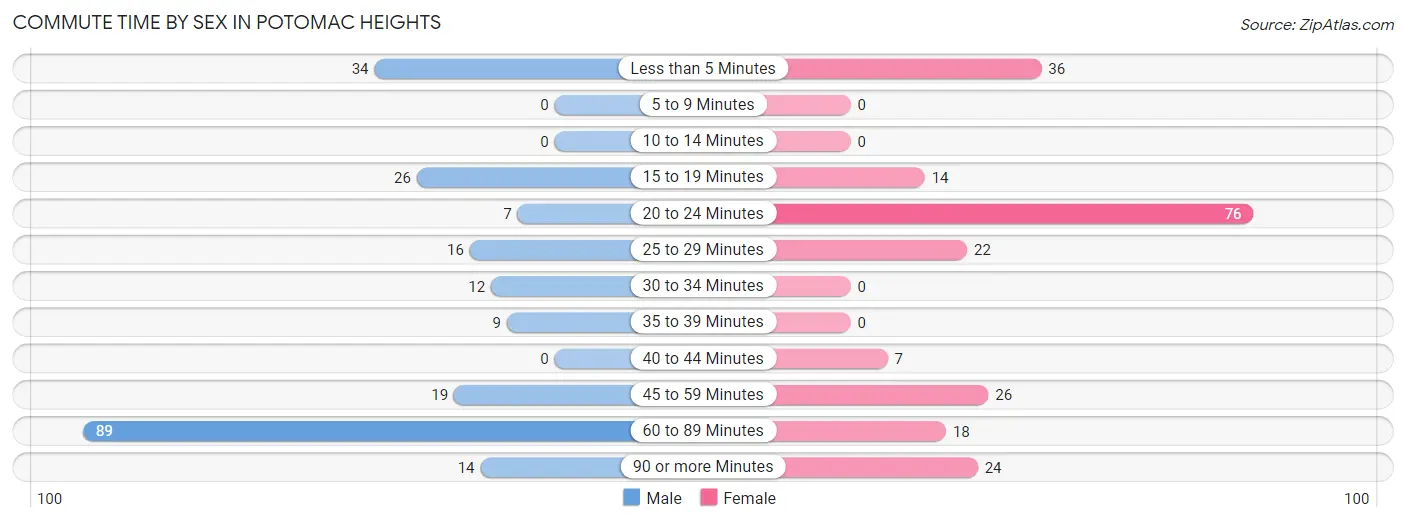
| Commute Time | Male | Female |
| Less than 5 Minutes | 34 (15.0%) | 36 (16.1%) |
| 5 to 9 Minutes | 0 (0.0%) | 0 (0.0%) |
| 10 to 14 Minutes | 0 (0.0%) | 0 (0.0%) |
| 15 to 19 Minutes | 26 (11.5%) | 14 (6.3%) |
| 20 to 24 Minutes | 7 (3.1%) | 76 (34.1%) |
| 25 to 29 Minutes | 16 (7.1%) | 22 (9.9%) |
| 30 to 34 Minutes | 12 (5.3%) | 0 (0.0%) |
| 35 to 39 Minutes | 9 (4.0%) | 0 (0.0%) |
| 40 to 44 Minutes | 0 (0.0%) | 7 (3.1%) |
| 45 to 59 Minutes | 19 (8.4%) | 26 (11.7%) |
| 60 to 89 Minutes | 89 (39.4%) | 18 (8.1%) |
| 90 or more Minutes | 14 (6.2%) | 24 (10.8%) |
Time of Departure to Work by Sex in Potomac Heights
The most frequent times of departure to work in Potomac Heights are 6:30 AM to 6:59 AM (67, 29.6%) for males and 12:00 AM to 4:59 AM (38, 17.0%) for females.
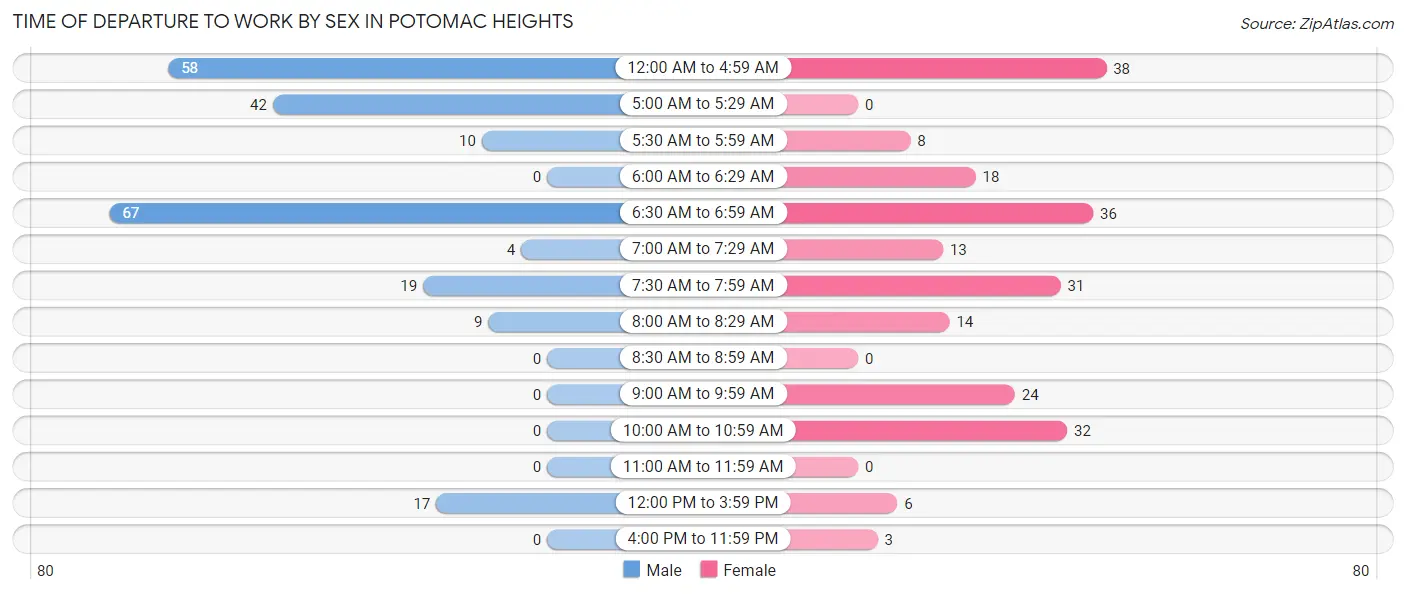
| Time of Departure | Male | Female |
| 12:00 AM to 4:59 AM | 58 (25.7%) | 38 (17.0%) |
| 5:00 AM to 5:29 AM | 42 (18.6%) | 0 (0.0%) |
| 5:30 AM to 5:59 AM | 10 (4.4%) | 8 (3.6%) |
| 6:00 AM to 6:29 AM | 0 (0.0%) | 18 (8.1%) |
| 6:30 AM to 6:59 AM | 67 (29.6%) | 36 (16.1%) |
| 7:00 AM to 7:29 AM | 4 (1.8%) | 13 (5.8%) |
| 7:30 AM to 7:59 AM | 19 (8.4%) | 31 (13.9%) |
| 8:00 AM to 8:29 AM | 9 (4.0%) | 14 (6.3%) |
| 8:30 AM to 8:59 AM | 0 (0.0%) | 0 (0.0%) |
| 9:00 AM to 9:59 AM | 0 (0.0%) | 24 (10.8%) |
| 10:00 AM to 10:59 AM | 0 (0.0%) | 32 (14.3%) |
| 11:00 AM to 11:59 AM | 0 (0.0%) | 0 (0.0%) |
| 12:00 PM to 3:59 PM | 17 (7.5%) | 6 (2.7%) |
| 4:00 PM to 11:59 PM | 0 (0.0%) | 3 (1.3%) |
| Total | 226 (100.0%) | 223 (100.0%) |
Housing Occupancy in Potomac Heights
Occupancy by Ownership in Potomac Heights
Of the total 632 dwellings in Potomac Heights, owner-occupied units account for 502 (79.4%), while renter-occupied units make up 130 (20.6%).
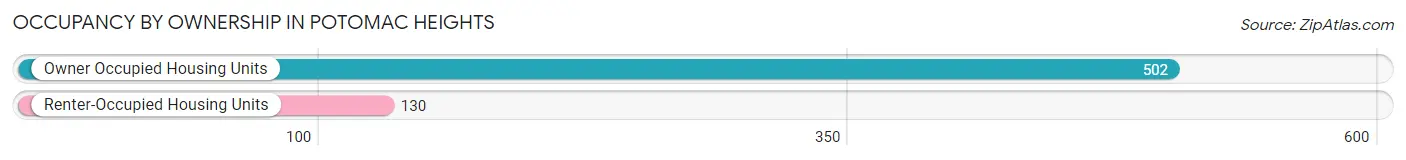
| Occupancy | # Housing Units | % Housing Units |
| Owner Occupied Housing Units | 502 | 79.4% |
| Renter-Occupied Housing Units | 130 | 20.6% |
| Total Occupied Housing Units | 632 | 100.0% |
Occupancy by Household Size in Potomac Heights
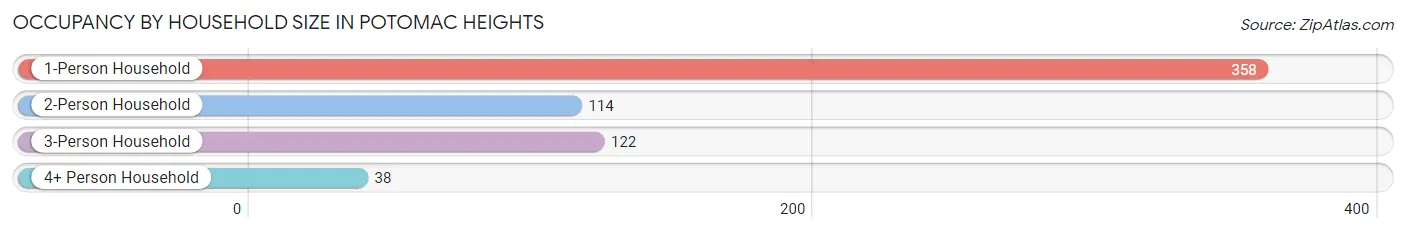
| Household Size | # Housing Units | % Housing Units |
| 1-Person Household | 358 | 56.7% |
| 2-Person Household | 114 | 18.0% |
| 3-Person Household | 122 | 19.3% |
| 4+ Person Household | 38 | 6.0% |
| Total Housing Units | 632 | 100.0% |
Occupancy by Ownership by Household Size in Potomac Heights
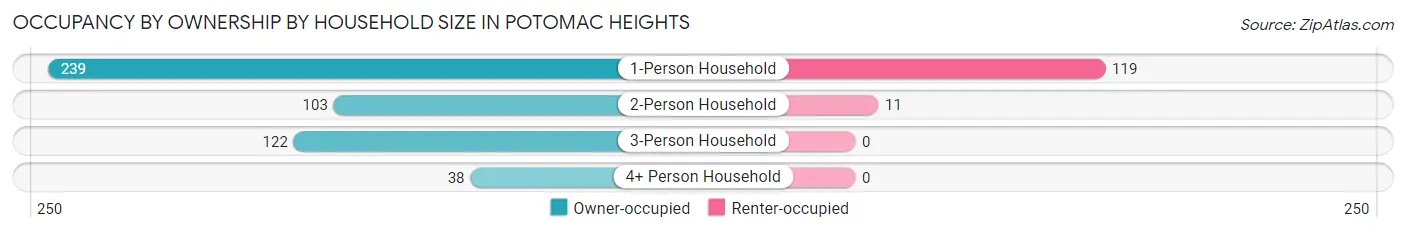
| Household Size | Owner-occupied | Renter-occupied |
| 1-Person Household | 239 (66.8%) | 119 (33.2%) |
| 2-Person Household | 103 (90.3%) | 11 (9.7%) |
| 3-Person Household | 122 (100.0%) | 0 (0.0%) |
| 4+ Person Household | 38 (100.0%) | 0 (0.0%) |
| Total Housing Units | 502 (79.4%) | 130 (20.6%) |
Occupancy by Educational Attainment in Potomac Heights
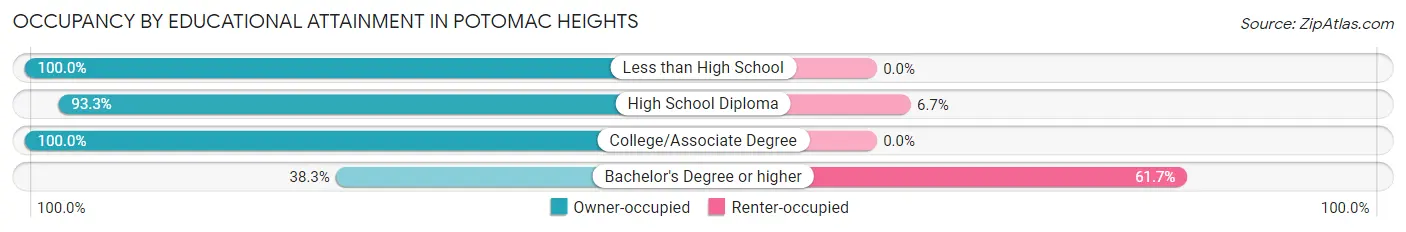
| Household Size | Owner-occupied | Renter-occupied |
| Less than High School | 53 (100.0%) | 0 (0.0%) |
| High School Diploma | 153 (93.3%) | 11 (6.7%) |
| College/Associate Degree | 222 (100.0%) | 0 (0.0%) |
| Bachelor's Degree or higher | 74 (38.3%) | 119 (61.7%) |
Occupancy by Age of Householder in Potomac Heights
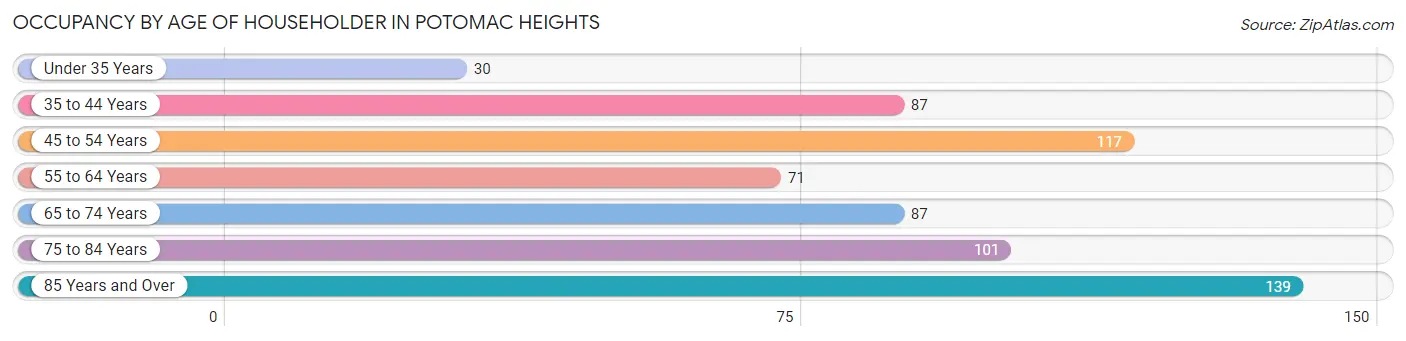
| Age Bracket | # Households | % Households |
| Under 35 Years | 30 | 4.8% |
| 35 to 44 Years | 87 | 13.8% |
| 45 to 54 Years | 117 | 18.5% |
| 55 to 64 Years | 71 | 11.2% |
| 65 to 74 Years | 87 | 13.8% |
| 75 to 84 Years | 101 | 16.0% |
| 85 Years and Over | 139 | 22.0% |
| Total | 632 | 100.0% |
Housing Finances in Potomac Heights
Median Income by Occupancy in Potomac Heights
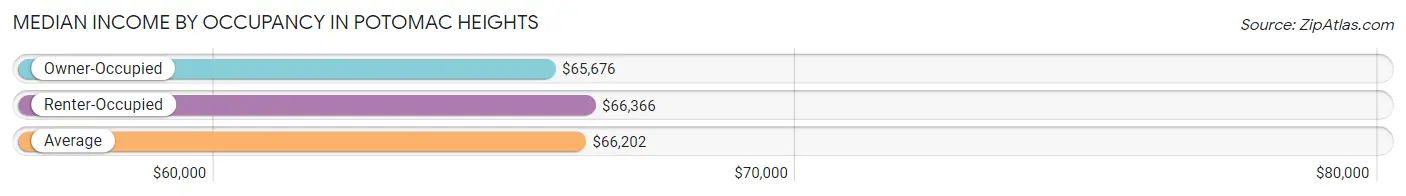
| Occupancy Type | # Households | Median Income |
| Owner-Occupied | 502 (79.4%) | $65,676 |
| Renter-Occupied | 130 (20.6%) | $66,366 |
| Average | 632 (100.0%) | $66,202 |
Occupancy by Householder Income Bracket in Potomac Heights
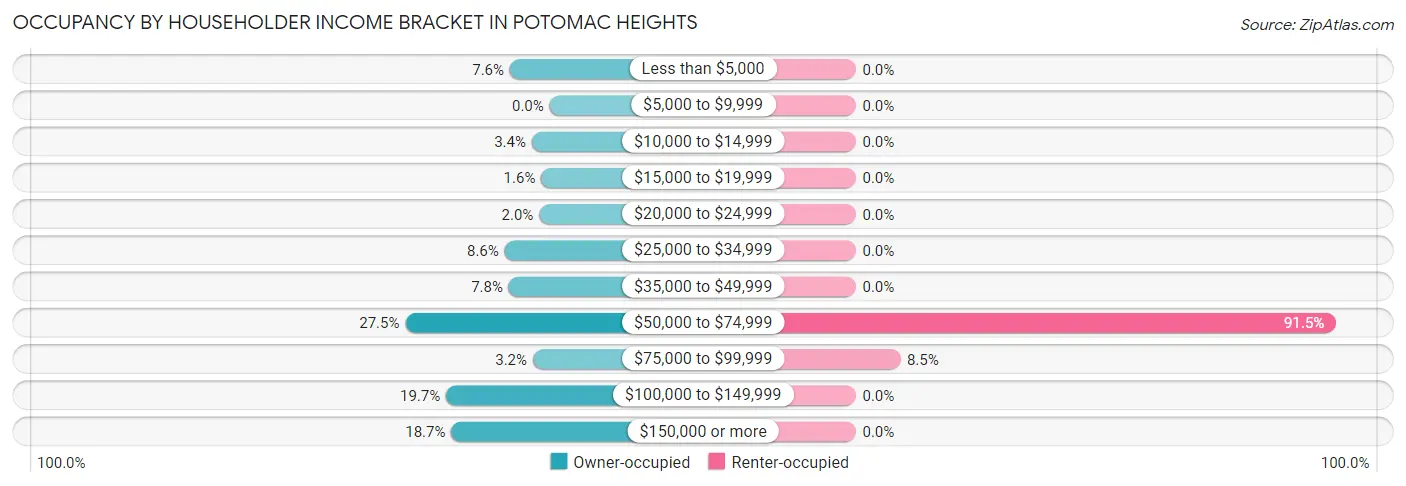
| Income Bracket | Owner-occupied | Renter-occupied |
| Less than $5,000 | 38 (7.6%) | 0 (0.0%) |
| $5,000 to $9,999 | 0 (0.0%) | 0 (0.0%) |
| $10,000 to $14,999 | 17 (3.4%) | 0 (0.0%) |
| $15,000 to $19,999 | 8 (1.6%) | 0 (0.0%) |
| $20,000 to $24,999 | 10 (2.0%) | 0 (0.0%) |
| $25,000 to $34,999 | 43 (8.6%) | 0 (0.0%) |
| $35,000 to $49,999 | 39 (7.8%) | 0 (0.0%) |
| $50,000 to $74,999 | 138 (27.5%) | 119 (91.5%) |
| $75,000 to $99,999 | 16 (3.2%) | 11 (8.5%) |
| $100,000 to $149,999 | 99 (19.7%) | 0 (0.0%) |
| $150,000 or more | 94 (18.7%) | 0 (0.0%) |
| Total | 502 (100.0%) | 130 (100.0%) |
Monthly Housing Cost Tiers in Potomac Heights
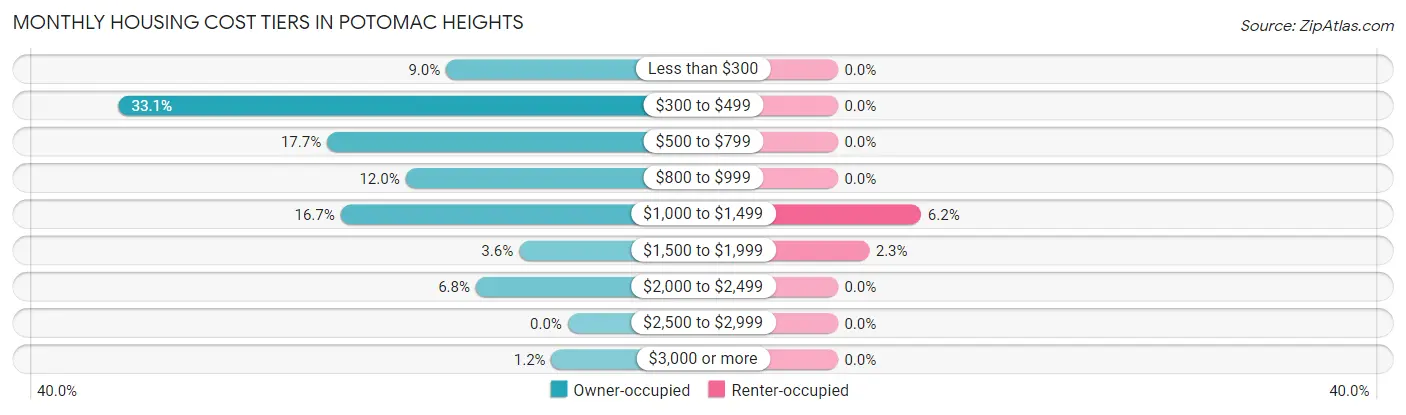
| Monthly Cost | Owner-occupied | Renter-occupied |
| Less than $300 | 45 (9.0%) | 0 (0.0%) |
| $300 to $499 | 166 (33.1%) | 0 (0.0%) |
| $500 to $799 | 89 (17.7%) | 0 (0.0%) |
| $800 to $999 | 60 (11.9%) | 0 (0.0%) |
| $1,000 to $1,499 | 84 (16.7%) | 8 (6.1%) |
| $1,500 to $1,999 | 18 (3.6%) | 3 (2.3%) |
| $2,000 to $2,499 | 34 (6.8%) | 0 (0.0%) |
| $2,500 to $2,999 | 0 (0.0%) | 0 (0.0%) |
| $3,000 or more | 6 (1.2%) | 0 (0.0%) |
| Total | 502 (100.0%) | 130 (100.0%) |
Physical Housing Characteristics in Potomac Heights
Housing Structures in Potomac Heights
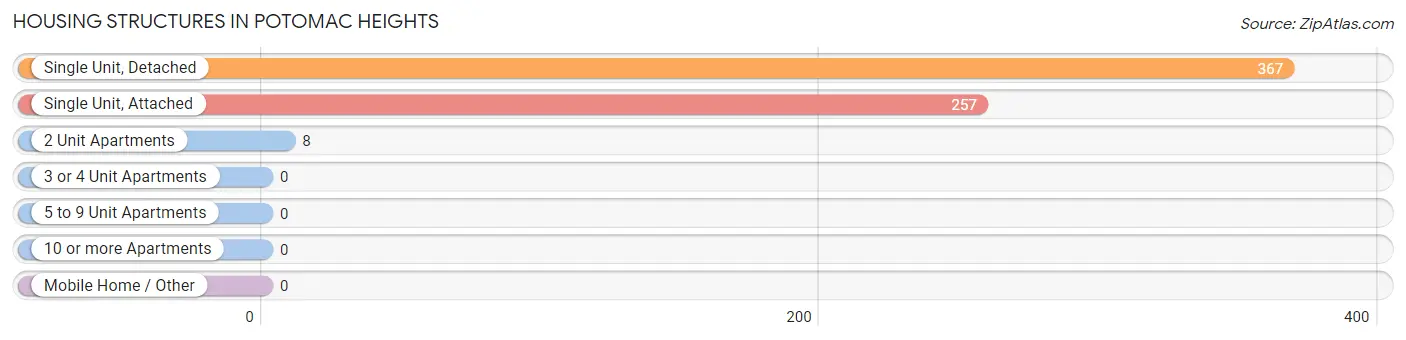
| Structure Type | # Housing Units | % Housing Units |
| Single Unit, Detached | 367 | 58.1% |
| Single Unit, Attached | 257 | 40.7% |
| 2 Unit Apartments | 8 | 1.3% |
| 3 or 4 Unit Apartments | 0 | 0.0% |
| 5 to 9 Unit Apartments | 0 | 0.0% |
| 10 or more Apartments | 0 | 0.0% |
| Mobile Home / Other | 0 | 0.0% |
| Total | 632 | 100.0% |
Housing Structures by Occupancy in Potomac Heights
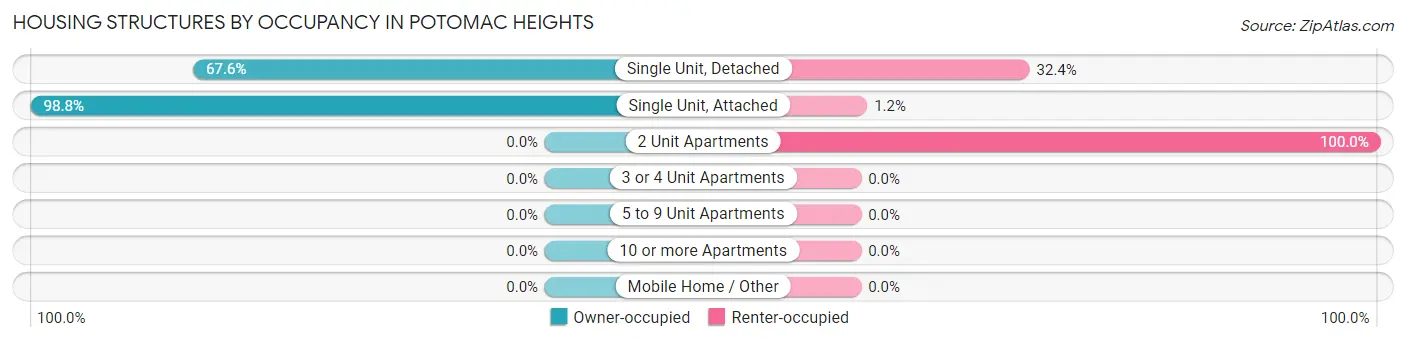
| Structure Type | Owner-occupied | Renter-occupied |
| Single Unit, Detached | 248 (67.6%) | 119 (32.4%) |
| Single Unit, Attached | 254 (98.8%) | 3 (1.2%) |
| 2 Unit Apartments | 0 (0.0%) | 8 (100.0%) |
| 3 or 4 Unit Apartments | 0 (0.0%) | 0 (0.0%) |
| 5 to 9 Unit Apartments | 0 (0.0%) | 0 (0.0%) |
| 10 or more Apartments | 0 (0.0%) | 0 (0.0%) |
| Mobile Home / Other | 0 (0.0%) | 0 (0.0%) |
| Total | 502 (79.4%) | 130 (20.6%) |
Housing Structures by Number of Rooms in Potomac Heights
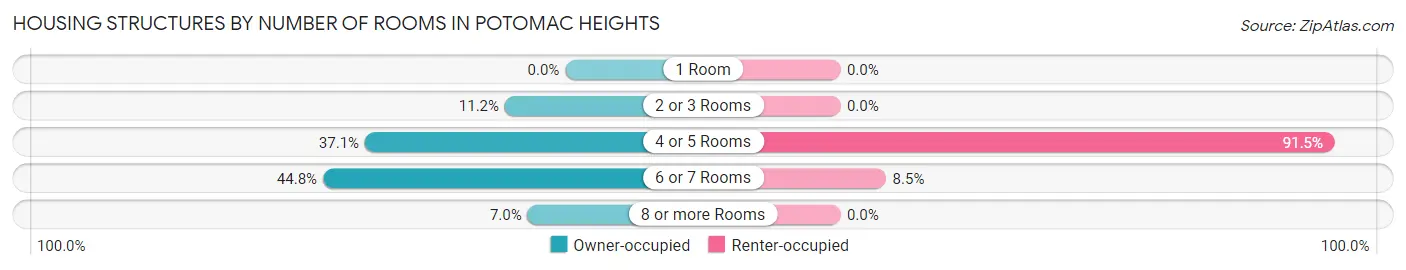
| Number of Rooms | Owner-occupied | Renter-occupied |
| 1 Room | 0 (0.0%) | 0 (0.0%) |
| 2 or 3 Rooms | 56 (11.2%) | 0 (0.0%) |
| 4 or 5 Rooms | 186 (37.0%) | 119 (91.5%) |
| 6 or 7 Rooms | 225 (44.8%) | 11 (8.5%) |
| 8 or more Rooms | 35 (7.0%) | 0 (0.0%) |
| Total | 502 (100.0%) | 130 (100.0%) |
Housing Structure by Heating Type in Potomac Heights
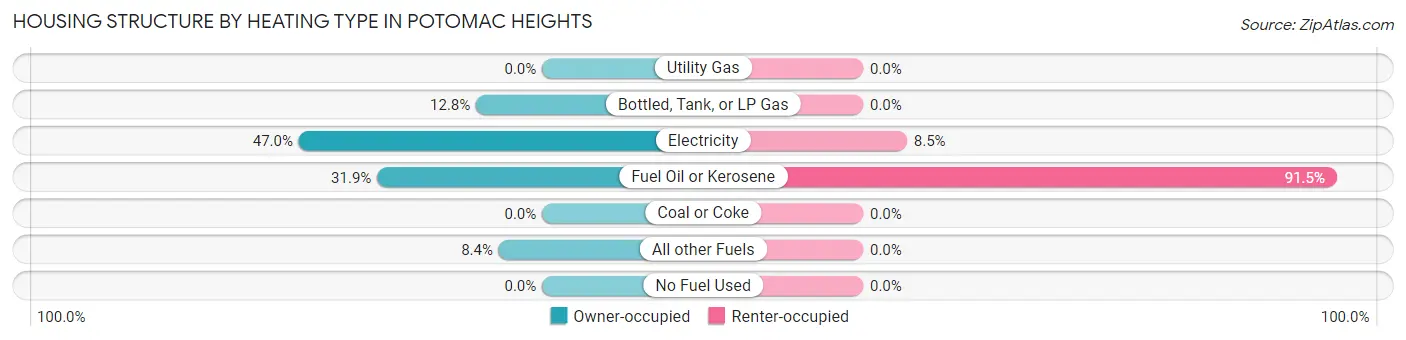
| Heating Type | Owner-occupied | Renter-occupied |
| Utility Gas | 0 (0.0%) | 0 (0.0%) |
| Bottled, Tank, or LP Gas | 64 (12.8%) | 0 (0.0%) |
| Electricity | 236 (47.0%) | 11 (8.5%) |
| Fuel Oil or Kerosene | 160 (31.9%) | 119 (91.5%) |
| Coal or Coke | 0 (0.0%) | 0 (0.0%) |
| All other Fuels | 42 (8.4%) | 0 (0.0%) |
| No Fuel Used | 0 (0.0%) | 0 (0.0%) |
| Total | 502 (100.0%) | 130 (100.0%) |
Household Vehicle Usage in Potomac Heights
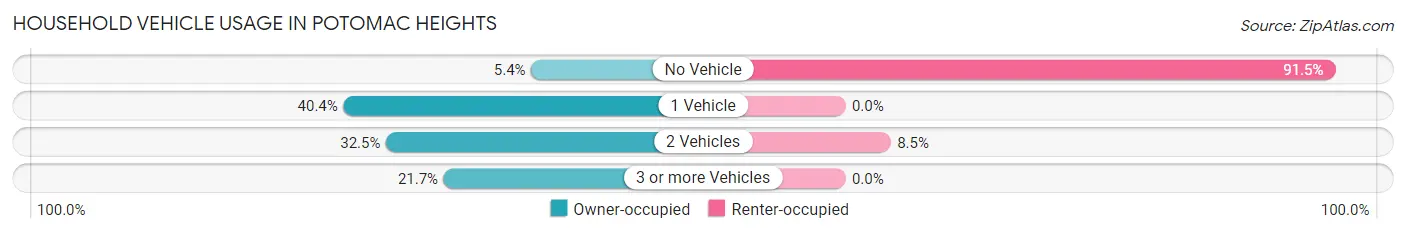
| Vehicles per Household | Owner-occupied | Renter-occupied |
| No Vehicle | 27 (5.4%) | 119 (91.5%) |
| 1 Vehicle | 203 (40.4%) | 0 (0.0%) |
| 2 Vehicles | 163 (32.5%) | 11 (8.5%) |
| 3 or more Vehicles | 109 (21.7%) | 0 (0.0%) |
| Total | 502 (100.0%) | 130 (100.0%) |
Real Estate & Mortgages in Potomac Heights
Real Estate and Mortgage Overview in Potomac Heights
| Characteristic | Without Mortgage | With Mortgage |
| Housing Units | 300 | 202 |
| Median Property Value | $76,300 | $73,800 |
| Median Household Income | $58,468 | $87 |
| Monthly Housing Costs | $462 | $6 |
| Real Estate Taxes | $1,187 | $38 |
Property Value by Mortgage Status in Potomac Heights
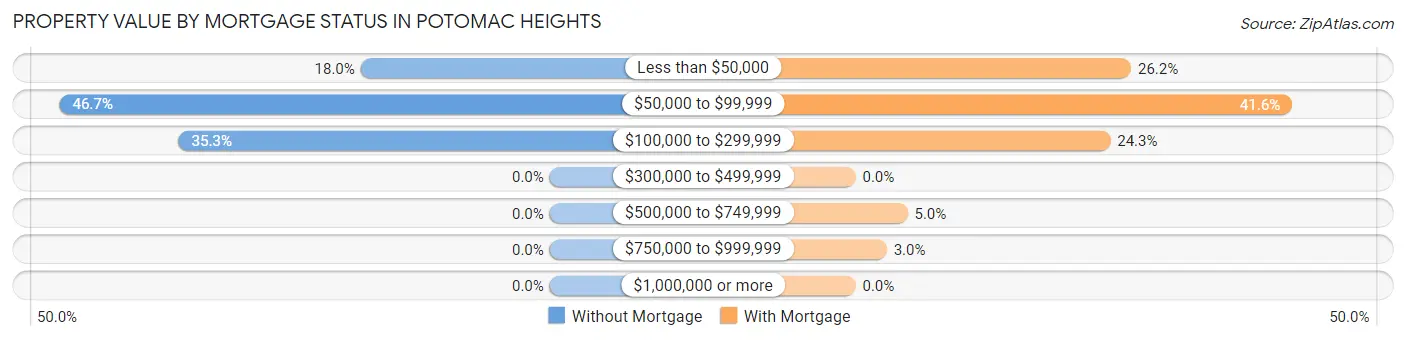
| Property Value | Without Mortgage | With Mortgage |
| Less than $50,000 | 54 (18.0%) | 53 (26.2%) |
| $50,000 to $99,999 | 140 (46.7%) | 84 (41.6%) |
| $100,000 to $299,999 | 106 (35.3%) | 49 (24.3%) |
| $300,000 to $499,999 | 0 (0.0%) | 0 (0.0%) |
| $500,000 to $749,999 | 0 (0.0%) | 10 (5.0%) |
| $750,000 to $999,999 | 0 (0.0%) | 6 (3.0%) |
| $1,000,000 or more | 0 (0.0%) | 0 (0.0%) |
| Total | 300 (100.0%) | 202 (100.0%) |
Household Income by Mortgage Status in Potomac Heights
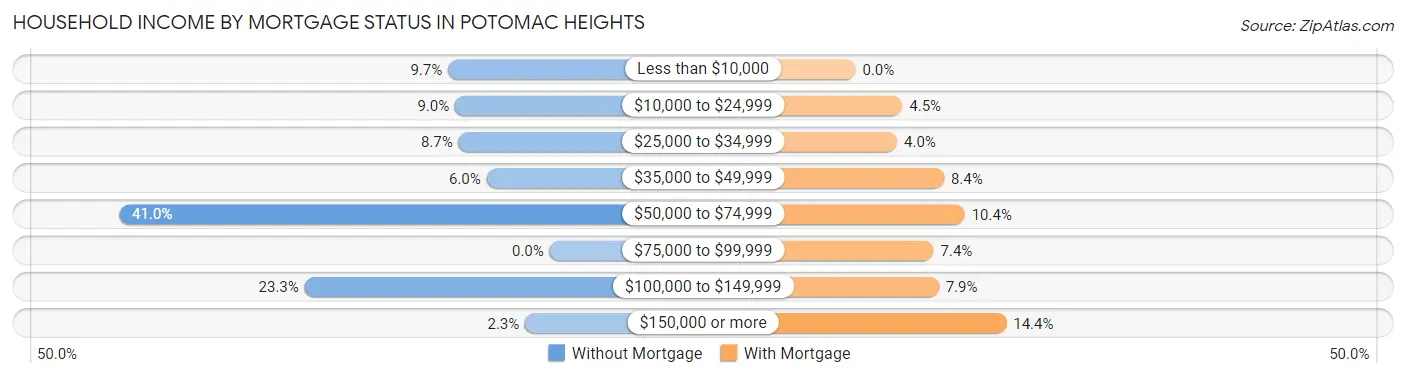
| Household Income | Without Mortgage | With Mortgage |
| Less than $10,000 | 29 (9.7%) | 0 (0.0%) |
| $10,000 to $24,999 | 27 (9.0%) | 9 (4.5%) |
| $25,000 to $34,999 | 26 (8.7%) | 8 (4.0%) |
| $35,000 to $49,999 | 18 (6.0%) | 17 (8.4%) |
| $50,000 to $74,999 | 123 (41.0%) | 21 (10.4%) |
| $75,000 to $99,999 | 0 (0.0%) | 15 (7.4%) |
| $100,000 to $149,999 | 70 (23.3%) | 16 (7.9%) |
| $150,000 or more | 7 (2.3%) | 29 (14.4%) |
| Total | 300 (100.0%) | 202 (100.0%) |
Property Value to Household Income Ratio in Potomac Heights
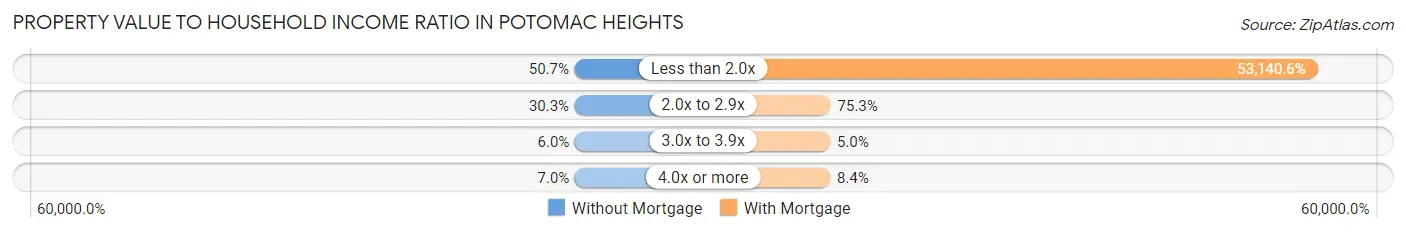
| Value-to-Income Ratio | Without Mortgage | With Mortgage |
| Less than 2.0x | 152 (50.7%) | 107,344 (53,140.6%) |
| 2.0x to 2.9x | 91 (30.3%) | 152 (75.2%) |
| 3.0x to 3.9x | 18 (6.0%) | 10 (5.0%) |
| 4.0x or more | 21 (7.0%) | 17 (8.4%) |
| Total | 300 (100.0%) | 202 (100.0%) |
Real Estate Taxes by Mortgage Status in Potomac Heights
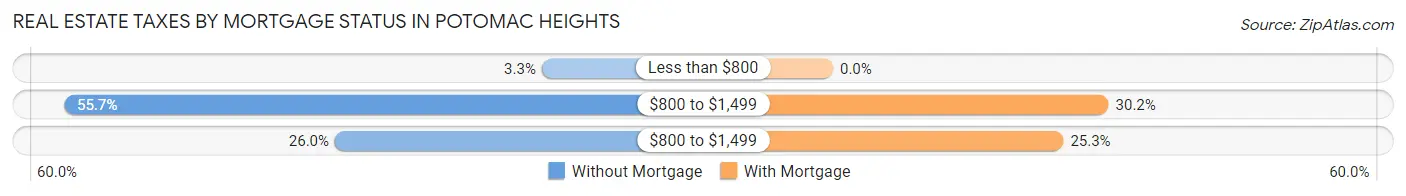
| Property Taxes | Without Mortgage | With Mortgage |
| Less than $800 | 10 (3.3%) | 0 (0.0%) |
| $800 to $1,499 | 167 (55.7%) | 61 (30.2%) |
| $800 to $1,499 | 78 (26.0%) | 51 (25.3%) |
| Total | 300 (100.0%) | 202 (100.0%) |
Health & Disability in Potomac Heights
Health Insurance Coverage by Age in Potomac Heights
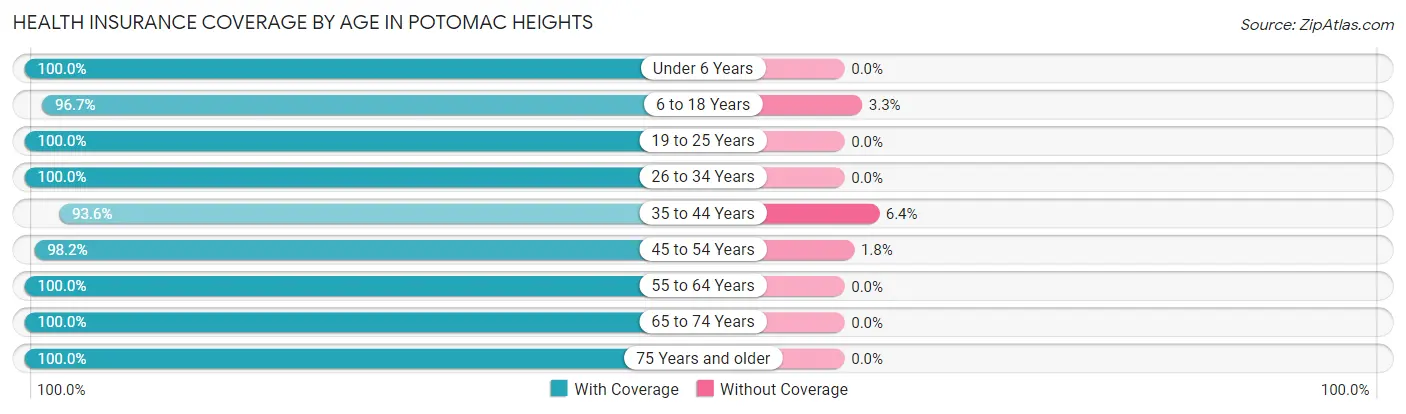
| Age Bracket | With Coverage | Without Coverage |
| Under 6 Years | 7 (100.0%) | 0 (0.0%) |
| 6 to 18 Years | 177 (96.7%) | 6 (3.3%) |
| 19 to 25 Years | 50 (100.0%) | 0 (0.0%) |
| 26 to 34 Years | 37 (100.0%) | 0 (0.0%) |
| 35 to 44 Years | 160 (93.6%) | 11 (6.4%) |
| 45 to 54 Years | 218 (98.2%) | 4 (1.8%) |
| 55 to 64 Years | 138 (100.0%) | 0 (0.0%) |
| 65 to 74 Years | 103 (100.0%) | 0 (0.0%) |
| 75 Years and older | 248 (100.0%) | 0 (0.0%) |
| Total | 1,138 (98.2%) | 21 (1.8%) |
Health Insurance Coverage by Citizenship Status in Potomac Heights
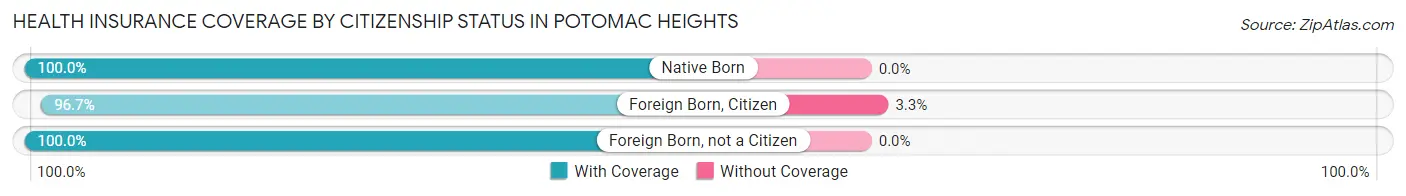
| Citizenship Status | With Coverage | Without Coverage |
| Native Born | 7 (100.0%) | 0 (0.0%) |
| Foreign Born, Citizen | 177 (96.7%) | 6 (3.3%) |
| Foreign Born, not a Citizen | 50 (100.0%) | 0 (0.0%) |
Health Insurance Coverage by Household Income in Potomac Heights
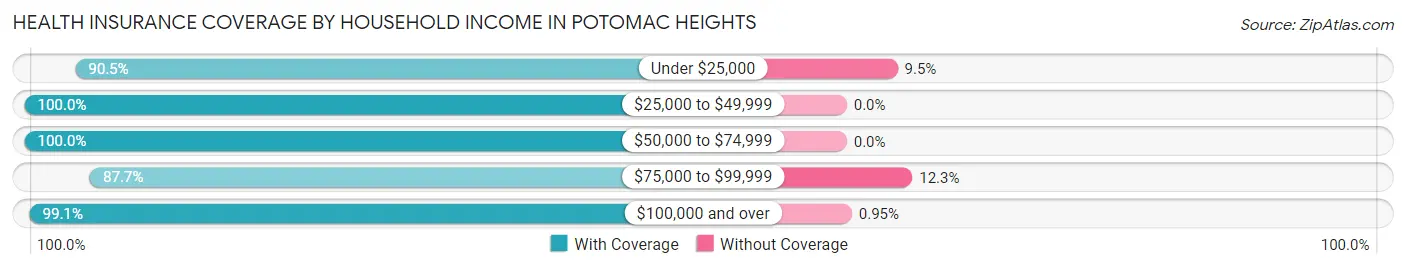
| Household Income | With Coverage | Without Coverage |
| Under $25,000 | 76 (90.5%) | 8 (9.5%) |
| $25,000 to $49,999 | 90 (100.0%) | 0 (0.0%) |
| $50,000 to $74,999 | 297 (100.0%) | 0 (0.0%) |
| $75,000 to $99,999 | 50 (87.7%) | 7 (12.3%) |
| $100,000 and over | 625 (99.1%) | 6 (0.9%) |
Public vs Private Health Insurance Coverage by Age in Potomac Heights
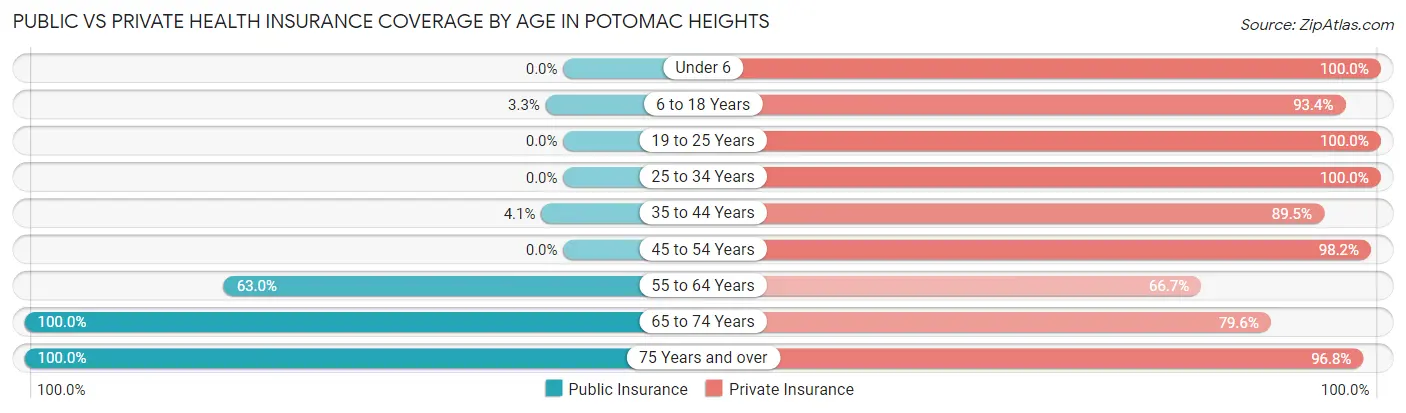
| Age Bracket | Public Insurance | Private Insurance |
| Under 6 | 0 (0.0%) | 7 (100.0%) |
| 6 to 18 Years | 6 (3.3%) | 171 (93.4%) |
| 19 to 25 Years | 0 (0.0%) | 50 (100.0%) |
| 25 to 34 Years | 0 (0.0%) | 37 (100.0%) |
| 35 to 44 Years | 7 (4.1%) | 153 (89.5%) |
| 45 to 54 Years | 0 (0.0%) | 218 (98.2%) |
| 55 to 64 Years | 87 (63.0%) | 92 (66.7%) |
| 65 to 74 Years | 103 (100.0%) | 82 (79.6%) |
| 75 Years and over | 248 (100.0%) | 240 (96.8%) |
| Total | 451 (38.9%) | 1,050 (90.6%) |
Disability Status by Sex by Age in Potomac Heights
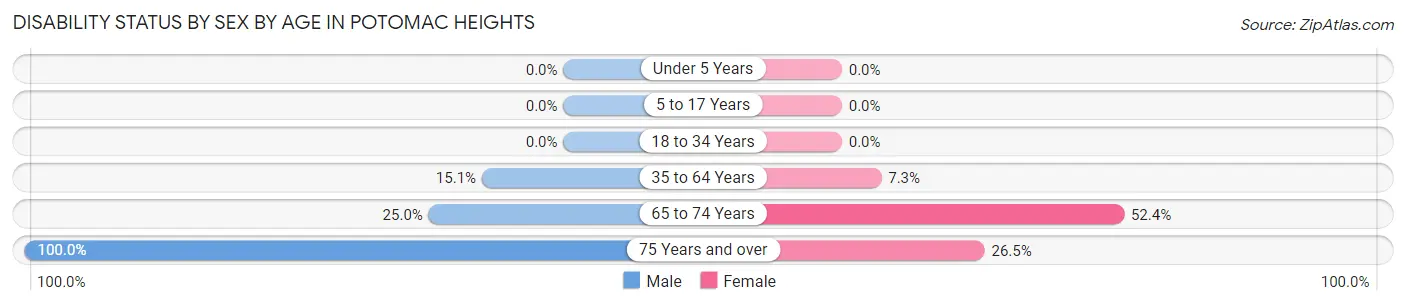
| Age Bracket | Male | Female |
| Under 5 Years | 0 (0.0%) | 0 (0.0%) |
| 5 to 17 Years | 0 (0.0%) | 0 (0.0%) |
| 18 to 34 Years | 0 (0.0%) | 0 (0.0%) |
| 35 to 64 Years | 39 (15.1%) | 20 (7.3%) |
| 65 to 74 Years | 10 (25.0%) | 33 (52.4%) |
| 75 Years and over | 14 (100.0%) | 62 (26.5%) |
Disability Class by Sex by Age in Potomac Heights
Disability Class: Hearing Difficulty
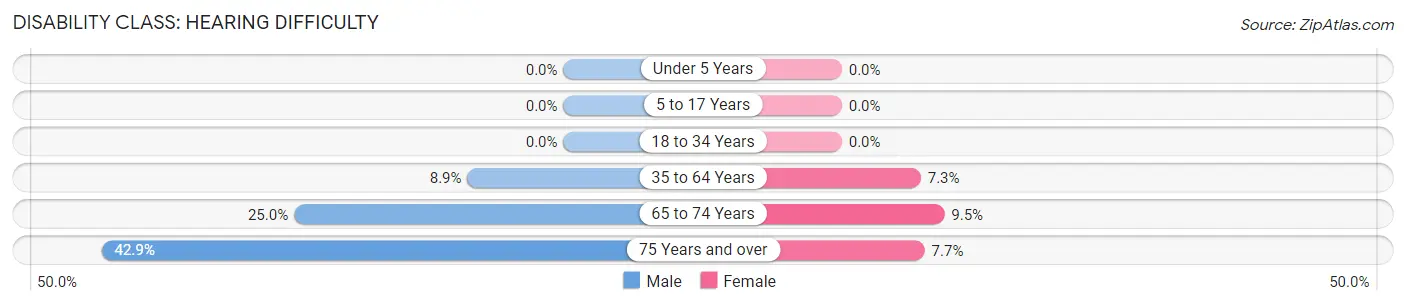
| Age Bracket | Male | Female |
| Under 5 Years | 0 (0.0%) | 0 (0.0%) |
| 5 to 17 Years | 0 (0.0%) | 0 (0.0%) |
| 18 to 34 Years | 0 (0.0%) | 0 (0.0%) |
| 35 to 64 Years | 23 (8.9%) | 20 (7.3%) |
| 65 to 74 Years | 10 (25.0%) | 6 (9.5%) |
| 75 Years and over | 6 (42.9%) | 18 (7.7%) |
Disability Class: Vision Difficulty
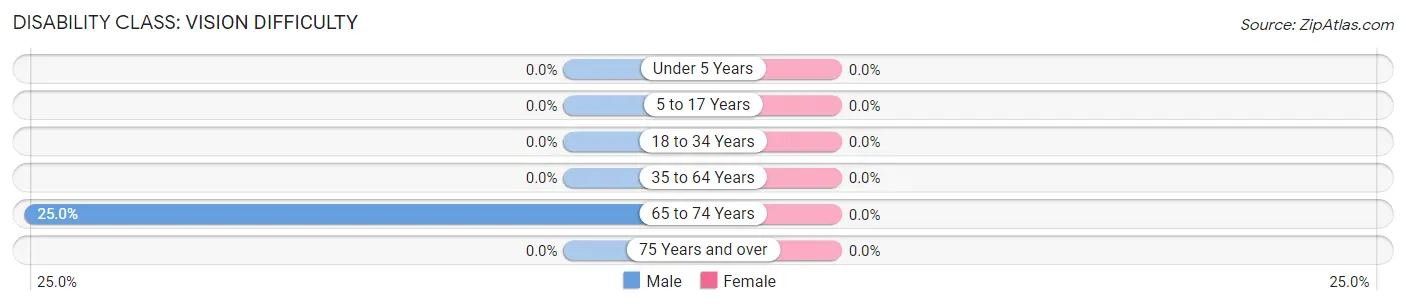
| Age Bracket | Male | Female |
| Under 5 Years | 0 (0.0%) | 0 (0.0%) |
| 5 to 17 Years | 0 (0.0%) | 0 (0.0%) |
| 18 to 34 Years | 0 (0.0%) | 0 (0.0%) |
| 35 to 64 Years | 0 (0.0%) | 0 (0.0%) |
| 65 to 74 Years | 10 (25.0%) | 0 (0.0%) |
| 75 Years and over | 0 (0.0%) | 0 (0.0%) |
Disability Class: Cognitive Difficulty
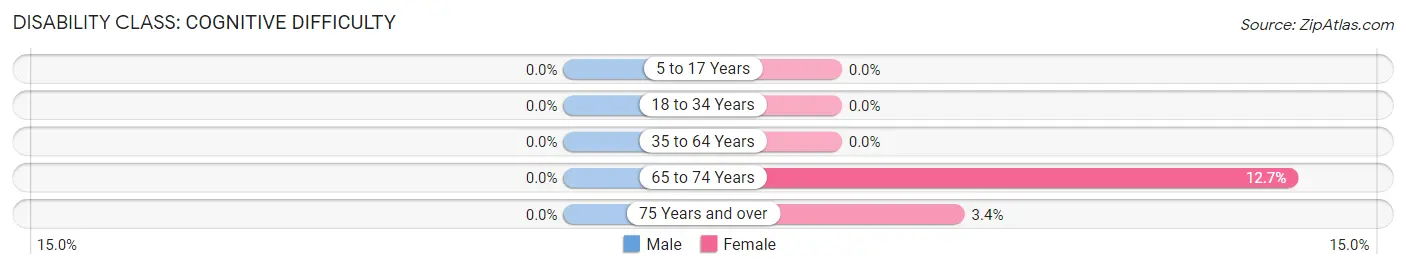
| Age Bracket | Male | Female |
| 5 to 17 Years | 0 (0.0%) | 0 (0.0%) |
| 18 to 34 Years | 0 (0.0%) | 0 (0.0%) |
| 35 to 64 Years | 0 (0.0%) | 0 (0.0%) |
| 65 to 74 Years | 0 (0.0%) | 8 (12.7%) |
| 75 Years and over | 0 (0.0%) | 8 (3.4%) |
Disability Class: Ambulatory Difficulty
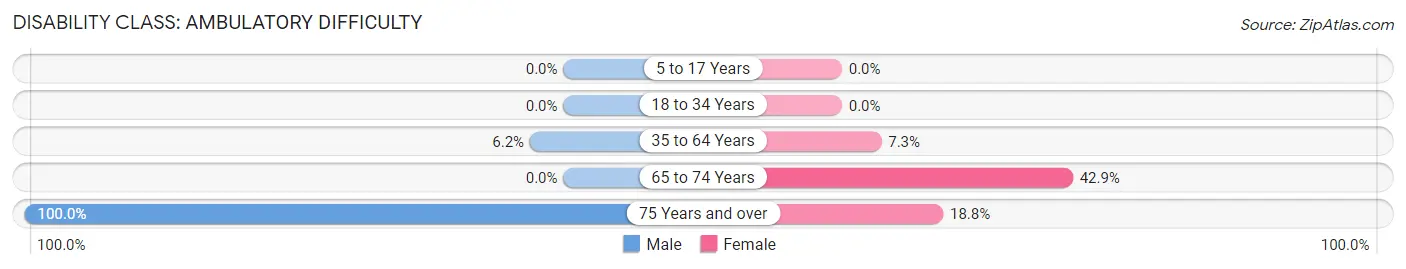
| Age Bracket | Male | Female |
| 5 to 17 Years | 0 (0.0%) | 0 (0.0%) |
| 18 to 34 Years | 0 (0.0%) | 0 (0.0%) |
| 35 to 64 Years | 16 (6.2%) | 20 (7.3%) |
| 65 to 74 Years | 0 (0.0%) | 27 (42.9%) |
| 75 Years and over | 14 (100.0%) | 44 (18.8%) |
Disability Class: Self-Care Difficulty
| Age Bracket | Male | Female |
| 5 to 17 Years | 0 (0.0%) | 0 (0.0%) |
| 18 to 34 Years | 0 (0.0%) | 0 (0.0%) |
| 35 to 64 Years | 9 (3.5%) | 20 (7.3%) |
| 65 to 74 Years | 0 (0.0%) | 0 (0.0%) |
| 75 Years and over | 8 (57.1%) | 18 (7.7%) |
Technology Access in Potomac Heights
Computing Device Access in Potomac Heights
| Device Type | # Households | % Households |
| Desktop or Laptop | 510 | 80.7% |
| Smartphone | 433 | 68.5% |
| Tablet | 304 | 48.1% |
| No Computing Device | 61 | 9.7% |
| Total | 632 | 100.0% |
Internet Access in Potomac Heights
| Internet Type | # Households | % Households |
| Dial-Up Internet | 0 | 0.0% |
| Broadband Home | 509 | 80.5% |
| Cellular Data Only | 36 | 5.7% |
| Satellite Internet | 0 | 0.0% |
| No Internet | 87 | 13.8% |
| Total | 632 | 100.0% |
Potomac Heights Summary
Potomac Heights is a small, unincorporated community located in Charles County, Maryland. It is situated on the Potomac River, just south of the Washington, D.C. metropolitan area. The community is home to a diverse population of approximately 1,000 people, and is known for its scenic views of the river and its close proximity to the nation’s capital.
Geography
Potomac Heights is located in Charles County, Maryland, approximately 25 miles south of Washington, D.C. The community is situated on the Potomac River, and is bordered by the towns of Indian Head and Bryans Road to the north, and the towns of La Plata and Port Tobacco to the south. The community is located in a rural area, and is surrounded by farmland and wooded areas.
The Potomac River is the main geographic feature of the area, and provides a scenic backdrop for the community. The river is a popular destination for fishing, boating, and other recreational activities. The community is also located near several state parks, including Smallwood State Park and Piscataway Park.
History
Potomac Heights was first settled in the early 1800s by a group of farmers and fishermen. The community was originally known as “Potomac Landing”, and was a popular destination for travelers and traders. In the late 1800s, the community was renamed “Potomac Heights”, and the area began to develop into a residential community.
In the early 1900s, the community was home to a number of small businesses, including a general store, a post office, and a blacksmith shop. The community also had a school, which was attended by local children.
In the mid-1900s, the community began to experience rapid growth, as more people moved to the area to take advantage of its close proximity to Washington, D.C. The community was eventually annexed by Charles County in the late 1960s.
Economy
The economy of Potomac Heights is largely based on the service industry. The community is home to a number of small businesses, including restaurants, retail stores, and professional services. The community is also home to a number of government contractors, which provide employment opportunities for local residents.
The community is also home to a number of recreational activities, including fishing, boating, and camping. The Potomac River is a popular destination for recreational activities, and the community is home to several marinas and boat launches.
Demographics
As of the 2010 census, the population of Potomac Heights was 1,000 people. The population is largely white (90%), with a small percentage of African Americans (7%) and Hispanics (3%). The median household income is $75,000, and the median home value is $250,000.
The community is served by the Charles County Public Schools system, and is home to several churches. The community is also home to a number of recreational activities, including fishing, boating, and camping.
Conclusion
Potomac Heights is a small, unincorporated community located in Charles County, Maryland. The community is situated on the Potomac River, and is known for its scenic views and close proximity to Washington, D.C. The community is home to a diverse population of approximately 1,000 people, and is largely supported by the service industry. The community is also home to a number of recreational activities, including fishing, boating, and camping.
Common Questions
What is Per Capita Income in Potomac Heights?
Per Capita income in Potomac Heights is $48,283.
What is the Median Family Income in Potomac Heights?
Median Family Income in Potomac Heights is $114,653.
What is the Median Household income in Potomac Heights?
Median Household Income in Potomac Heights is $66,202.
What is Income or Wage Gap in Potomac Heights?
Income or Wage Gap in Potomac Heights is 19.0%.
Women in Potomac Heights earn 81.0 cents for every dollar earned by a man.
What is Inequality or Gini Index in Potomac Heights?
Inequality or Gini Index in Potomac Heights is 0.40.
What is the Total Population of Potomac Heights?
Total Population of Potomac Heights is 1,166.
What is the Total Male Population of Potomac Heights?
Total Male Population of Potomac Heights is 461.
What is the Total Female Population of Potomac Heights?
Total Female Population of Potomac Heights is 705.
What is the Ratio of Males per 100 Females in Potomac Heights?
There are 65.39 Males per 100 Females in Potomac Heights.
What is the Ratio of Females per 100 Males in Potomac Heights?
There are 152.93 Females per 100 Males in Potomac Heights.
What is the Median Population Age in Potomac Heights?
Median Population Age in Potomac Heights is 52.7 Years.
What is the Average Family Size in Potomac Heights
Average Family Size in Potomac Heights is 3.0 People.
What is the Average Household Size in Potomac Heights
Average Household Size in Potomac Heights is 1.8 People.
How Large is the Labor Force in Potomac Heights?
There are 490 People in the Labor Forcein in Potomac Heights.
What is the Percentage of People in the Labor Force in Potomac Heights?
46.6% of People are in the Labor Force in Potomac Heights.
What is the Unemployment Rate in Potomac Heights?
Unemployment Rate in Potomac Heights is 2.9%.