Zip Codes with the Most Births per 1,000 Women Receiving Public Assitance in Glenview, IL
RELATED REPORTS & OPTIONS
Highest Birth Rate | Public Income
Glenview
Compare Zip Codes
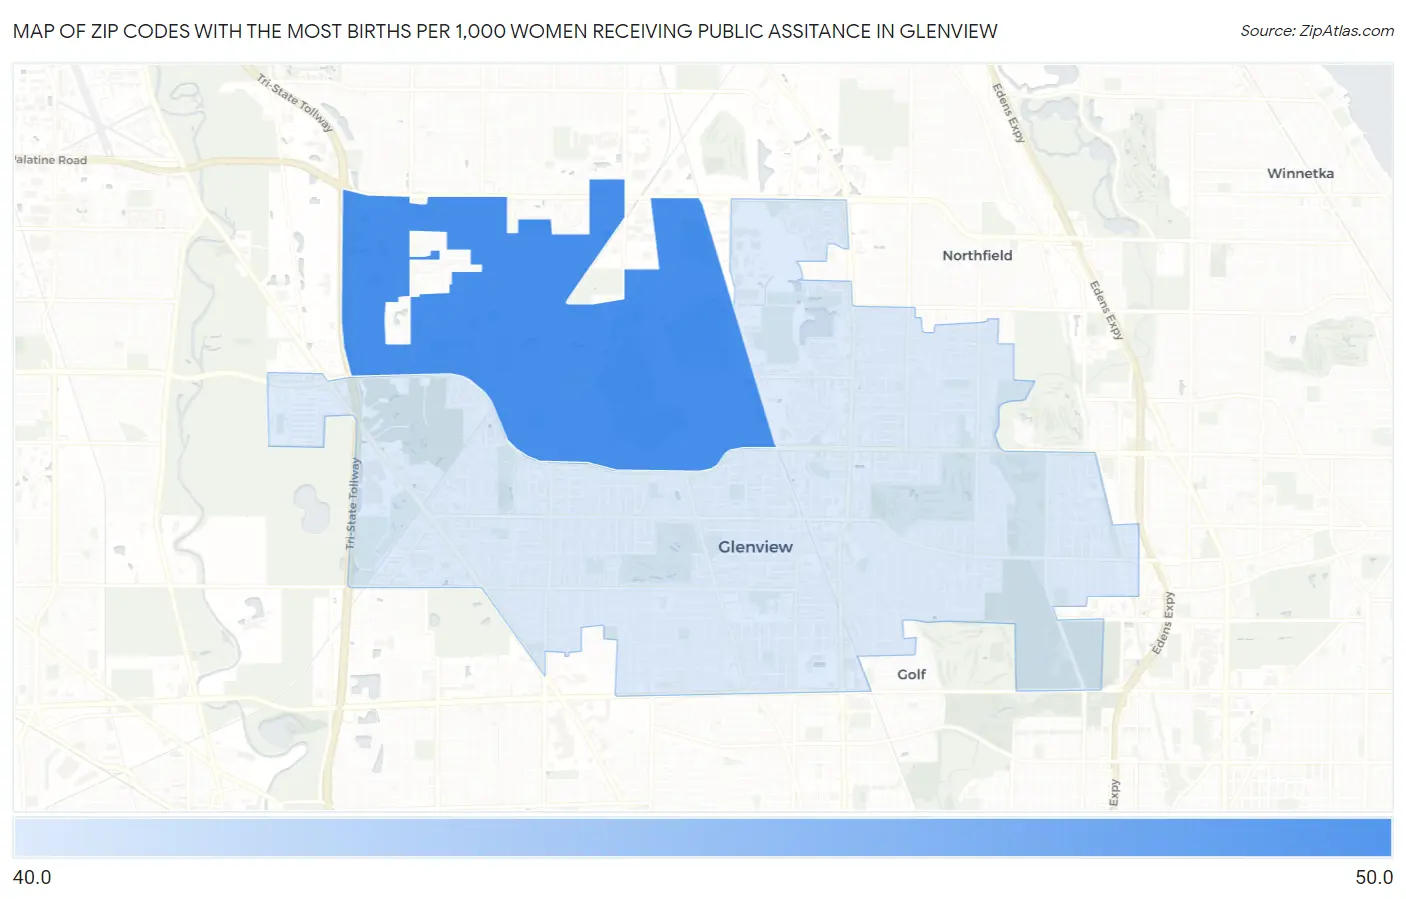
Map of Zip Codes with the Most Births per 1,000 Women Receiving Public Assitance in Glenview
45.0
47.0
Zip Codes with the Most Births per 1,000 Women Receiving Public Assitance in Glenview, IL
| Zip Code | Births / 1,000 Women | vs State | vs National | |
| 1. | 60026 | 47.0 | 51.0(-4.00)#670 | 52.0(-5.00)#14,658 |
| 2. | 60025 | 45.0 | 51.0(-6.00)#693 | 52.0(-7.00)#15,266 |
1
Common Questions
What are the Top Zip Codes with the Most Births per 1,000 Women Receiving Public Assitance in Glenview, IL?
Top Zip Codes with the Most Births per 1,000 Women Receiving Public Assitance in Glenview, IL are:
What zip code has the Most Births per 1,000 Women Receiving Public Assitance in Glenview, IL?
60026 has the Most Births per 1,000 Women Receiving Public Assitance in Glenview, IL with 47.0.
What is the Number of Births per 1,000 Women Receiving Public Assitance in Glenview, IL?
Number of Births per 1,000 Women Receiving Public Assitance in Glenview is 52.0.
What is the Number of Births per 1,000 Women Receiving Public Assitance in Illinois?
Number of Births per 1,000 Women Receiving Public Assitance in Illinois is 51.0.
What is the Number of Births per 1,000 Women Receiving Public Assitance in the United States?
Number of Births per 1,000 Women Receiving Public Assitance in the United States is 52.0.