Marshallton, PA Map & Demographics
Marshallton Map
Marshallton Overview
$25,460
PER CAPITA INCOME
$63,015
AVG FAMILY INCOME
$49,085
AVG HOUSEHOLD INCOME
0.37
INEQUALITY / GINI INDEX
1,228
TOTAL POPULATION
552
MALE POPULATION
676
FEMALE POPULATION
81.66
MALES / 100 FEMALES
122.46
FEMALES / 100 MALES
48.9
MEDIAN AGE
3.2
AVG FAMILY SIZE
2.1
AVG HOUSEHOLD SIZE
619
LABOR FORCE [ PEOPLE ]
55.3%
PERCENT IN LABOR FORCE
14.2%
UNEMPLOYMENT RATE
Income in Marshallton
Income Overview in Marshallton
Per Capita Income in Marshallton is $25,460, while median incomes of families and households are $63,015 and $49,085 respectively.
| Characteristic | Number | Measure |
| Per Capita Income | 1,228 | $25,460 |
| Median Family Income | 289 | $63,015 |
| Mean Family Income | 289 | $76,859 |
| Median Household Income | 572 | $49,085 |
| Mean Household Income | 572 | $55,020 |
| Income Deficit | 289 | $0 |
| Wage / Income Gap (%) | 1,228 | 0.00% |
| Wage / Income Gap ($) | 1,228 | 100.00¢ per $1 |
| Gini / Inequality Index | 1,228 | 0.37 |
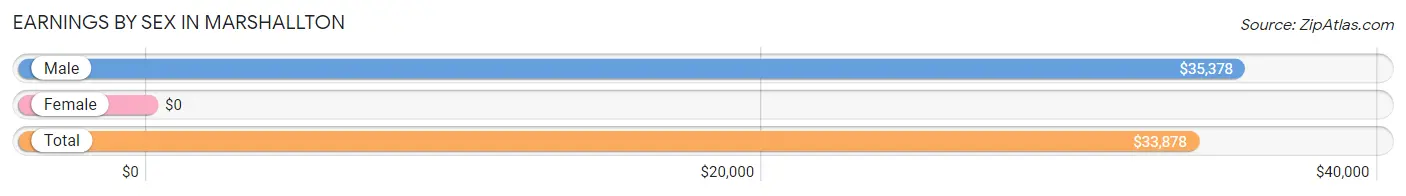
Earnings by Sex in Marshallton
| Sex | Number | Average Earnings |
| Male | 385 (57.6%) | $35,378 |
| Female | 284 (42.4%) | $0 |
| Total | 669 (100.0%) | $33,878 |
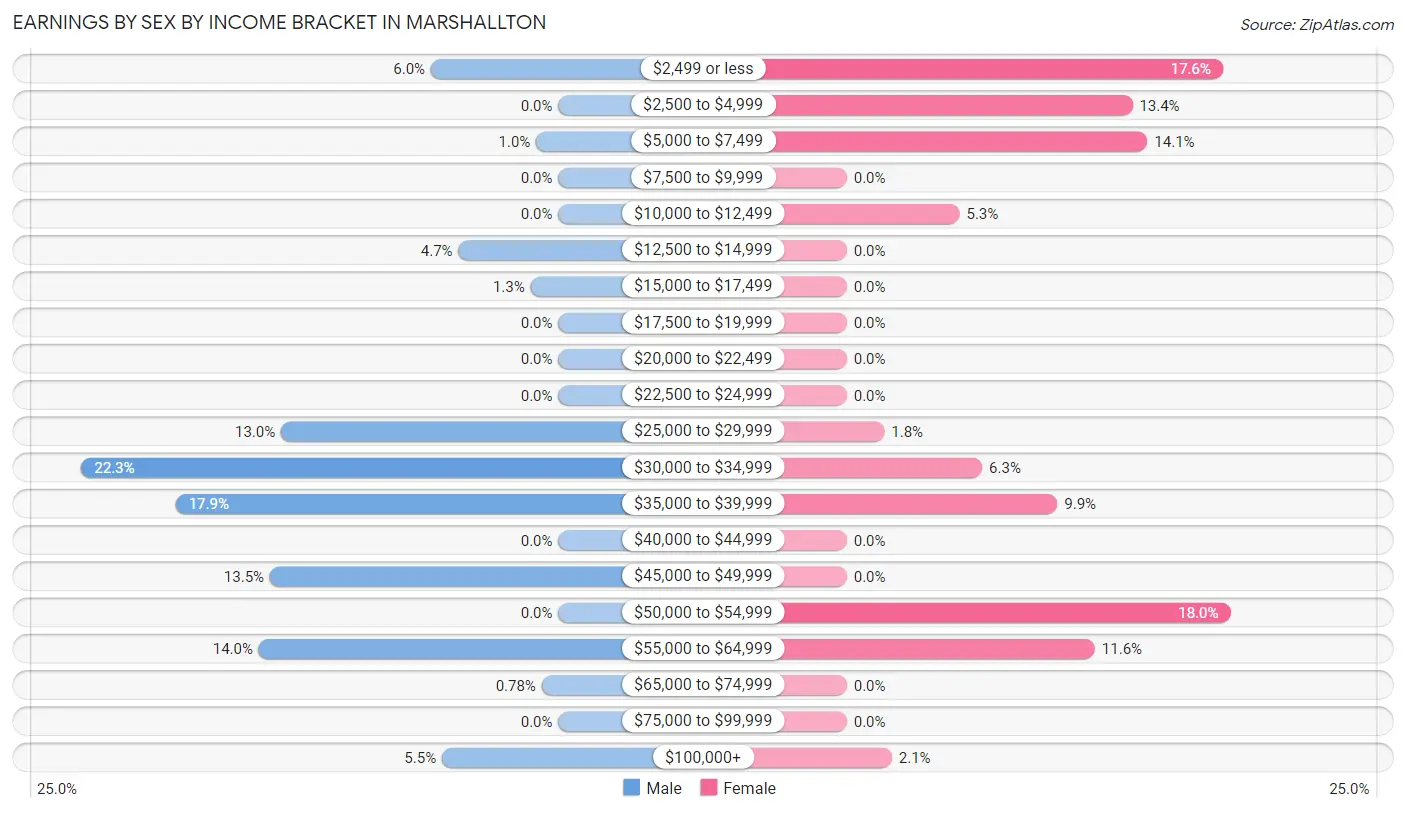
Earnings by Sex by Income Bracket in Marshallton
The most common earnings brackets in Marshallton are $30,000 to $34,999 for men (86 | 22.3%) and $50,000 to $54,999 for women (51 | 18.0%).
| Income | Male | Female |
| $2,499 or less | 23 (6.0%) | 50 (17.6%) |
| $2,500 to $4,999 | 0 (0.0%) | 38 (13.4%) |
| $5,000 to $7,499 | 4 (1.0%) | 40 (14.1%) |
| $7,500 to $9,999 | 0 (0.0%) | 0 (0.0%) |
| $10,000 to $12,499 | 0 (0.0%) | 15 (5.3%) |
| $12,500 to $14,999 | 18 (4.7%) | 0 (0.0%) |
| $15,000 to $17,499 | 5 (1.3%) | 0 (0.0%) |
| $17,500 to $19,999 | 0 (0.0%) | 0 (0.0%) |
| $20,000 to $22,499 | 0 (0.0%) | 0 (0.0%) |
| $22,500 to $24,999 | 0 (0.0%) | 0 (0.0%) |
| $25,000 to $29,999 | 50 (13.0%) | 5 (1.8%) |
| $30,000 to $34,999 | 86 (22.3%) | 18 (6.3%) |
| $35,000 to $39,999 | 69 (17.9%) | 28 (9.9%) |
| $40,000 to $44,999 | 0 (0.0%) | 0 (0.0%) |
| $45,000 to $49,999 | 52 (13.5%) | 0 (0.0%) |
| $50,000 to $54,999 | 0 (0.0%) | 51 (18.0%) |
| $55,000 to $64,999 | 54 (14.0%) | 33 (11.6%) |
| $65,000 to $74,999 | 3 (0.8%) | 0 (0.0%) |
| $75,000 to $99,999 | 0 (0.0%) | 0 (0.0%) |
| $100,000+ | 21 (5.4%) | 6 (2.1%) |
| Total | 385 (100.0%) | 284 (100.0%) |
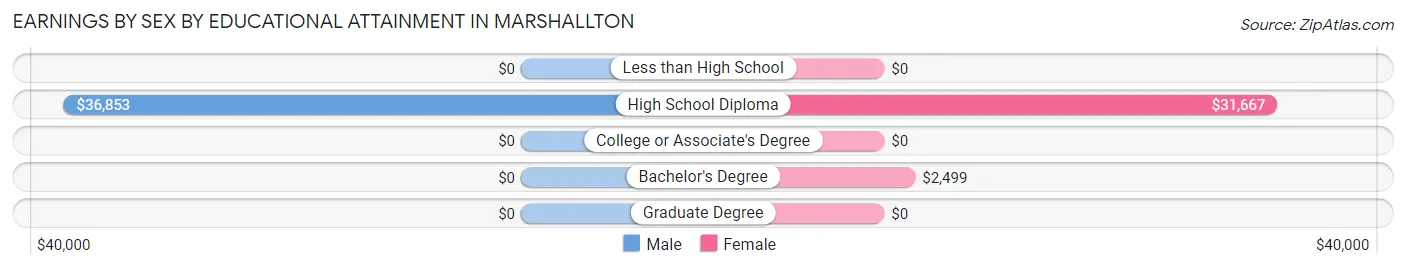
Earnings by Sex by Educational Attainment in Marshallton
| Educational Attainment | Male Income | Female Income |
| Less than High School | - | - |
| High School Diploma | $36,853 | $31,667 |
| College or Associate's Degree | - | - |
| Bachelor's Degree | - | - |
| Graduate Degree | - | - |
| Total | $36,919 | $0 |
Family Income in Marshallton
Family Income Brackets in Marshallton
According to the Marshallton family income data, there are 101 families falling into the $35,000 to $49,999 income range, which is the most common income bracket and makes up 34.9% of all families.
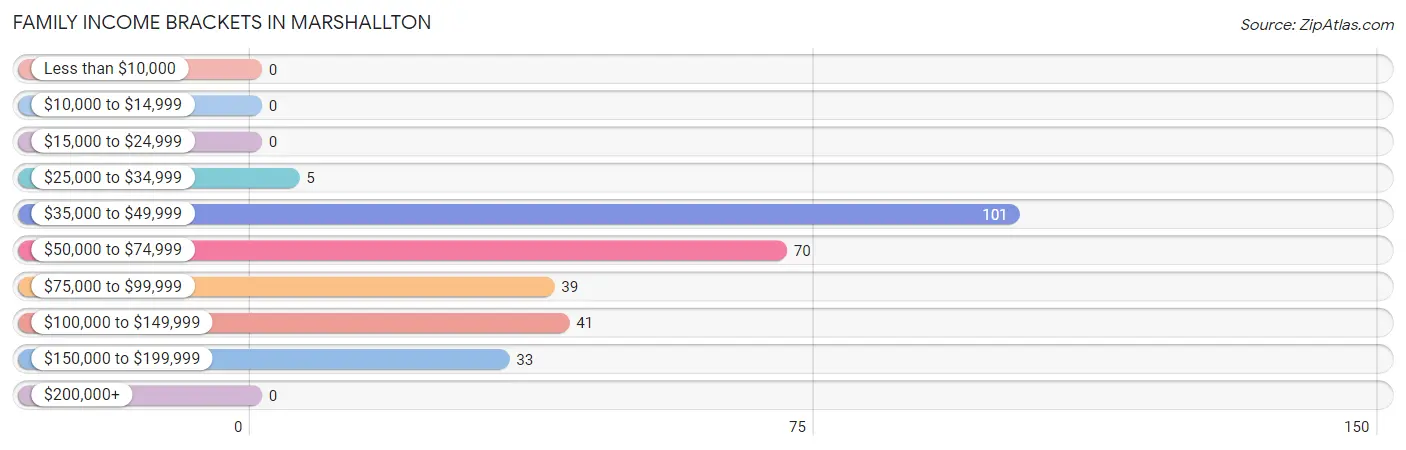
| Income Bracket | # Families | % Families |
| Less than $10,000 | 0 | 0.0% |
| $10,000 to $14,999 | 0 | 0.0% |
| $15,000 to $24,999 | 0 | 0.0% |
| $25,000 to $34,999 | 5 | 1.7% |
| $35,000 to $49,999 | 101 | 34.9% |
| $50,000 to $74,999 | 70 | 24.2% |
| $75,000 to $99,999 | 39 | 13.5% |
| $100,000 to $149,999 | 41 | 14.2% |
| $150,000 to $199,999 | 33 | 11.4% |
| $200,000+ | 0 | 0.0% |
Family Income by Famaliy Size in Marshallton
3-person families (50 | 17.3%) account for the highest median family income in Marshallton with $70,278 per family, while 3-person families (50 | 17.3%) have the highest median income of $23,426 per family member.
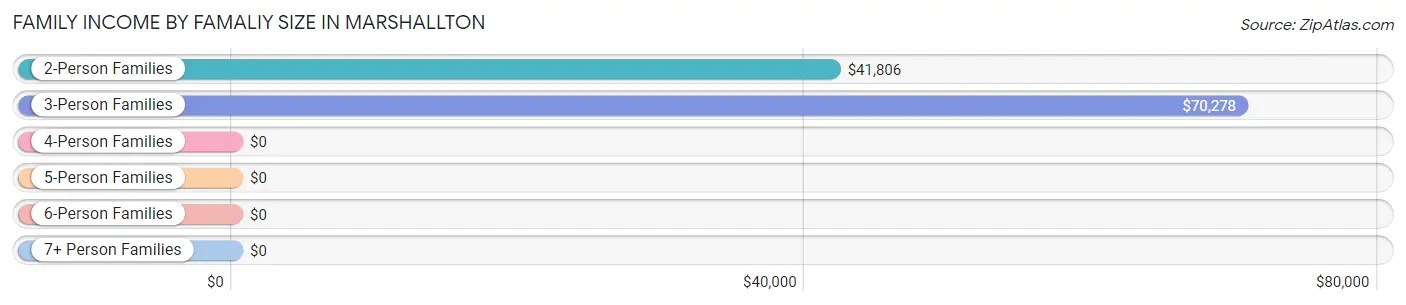
| Income Bracket | # Families | Median Income |
| 2-Person Families | 85 (29.4%) | $41,806 |
| 3-Person Families | 50 (17.3%) | $70,278 |
| 4-Person Families | 123 (42.6%) | $0 |
| 5-Person Families | 31 (10.7%) | $0 |
| 6-Person Families | 0 (0.0%) | $0 |
| 7+ Person Families | 0 (0.0%) | $0 |
| Total | 289 (100.0%) | $63,015 |
Family Income by Number of Earners in Marshallton
The median family income in Marshallton is $63,015, with families comprising 3+ earners (50) having the highest median family income of $158,106, while families with no earners (38) have the lowest median family income of $41,563, accounting for 17.3% and 13.2% of families, respectively.
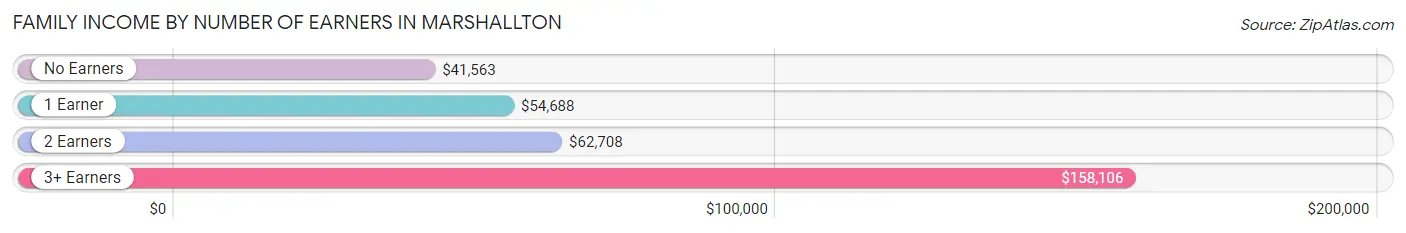
| Number of Earners | # Families | Median Income |
| No Earners | 38 (13.2%) | $41,563 |
| 1 Earner | 78 (27.0%) | $54,688 |
| 2 Earners | 123 (42.6%) | $62,708 |
| 3+ Earners | 50 (17.3%) | $158,106 |
| Total | 289 (100.0%) | $63,015 |
Household Income in Marshallton
Household Income Brackets in Marshallton
With 148 households falling in the category, the $35,000 to $49,999 income range is the most frequent in Marshallton, accounting for 25.9% of all households.
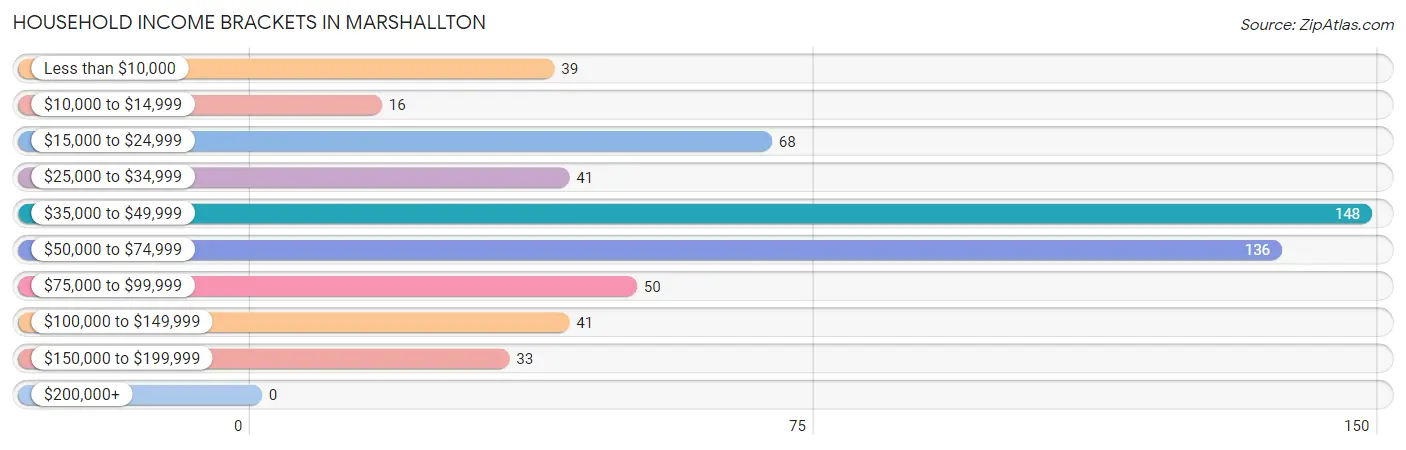
| Income Bracket | # Households | % Households |
| Less than $10,000 | 39 | 6.8% |
| $10,000 to $14,999 | 16 | 2.8% |
| $15,000 to $24,999 | 68 | 11.9% |
| $25,000 to $34,999 | 41 | 7.2% |
| $35,000 to $49,999 | 148 | 25.9% |
| $50,000 to $74,999 | 136 | 23.8% |
| $75,000 to $99,999 | 50 | 8.7% |
| $100,000 to $149,999 | 41 | 7.2% |
| $150,000 to $199,999 | 33 | 5.8% |
| $200,000+ | 0 | 0.0% |
Household Income by Householder Age in Marshallton
The median household income in Marshallton is $49,085, with the highest median household income of $50,151 found in the 25 to 44 years age bracket for the primary householder. A total of 115 households (20.1%) fall into this category. Meanwhile, the 15 to 24 years age bracket for the primary householder has the lowest median household income of $0, with 24 households (4.2%) in this group.
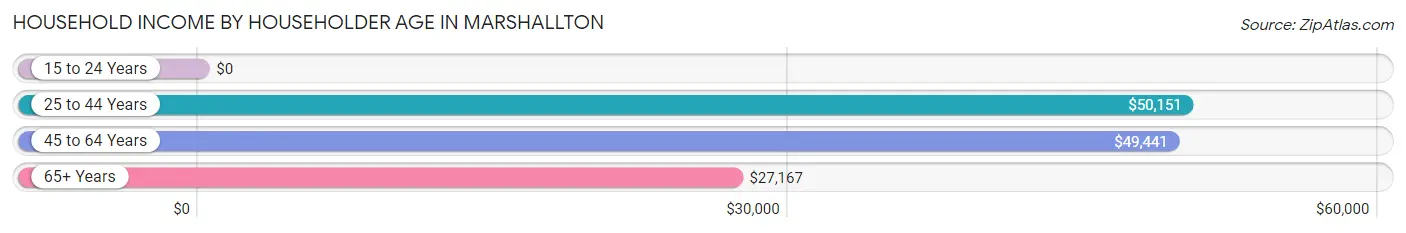
| Income Bracket | # Households | Median Income |
| 15 to 24 Years | 24 (4.2%) | $0 |
| 25 to 44 Years | 115 (20.1%) | $50,151 |
| 45 to 64 Years | 281 (49.1%) | $49,441 |
| 65+ Years | 152 (26.6%) | $27,167 |
| Total | 572 (100.0%) | $49,085 |
Poverty in Marshallton
Income Below Poverty by Sex and Age in Marshallton
With 5.4% poverty level for males and 9.9% for females among the residents of Marshallton, 35 to 44 year old males and 55 to 64 year old females are the most vulnerable to poverty, with 8 males (100.0%) and 24 females (20.3%) in their respective age groups living below the poverty level.
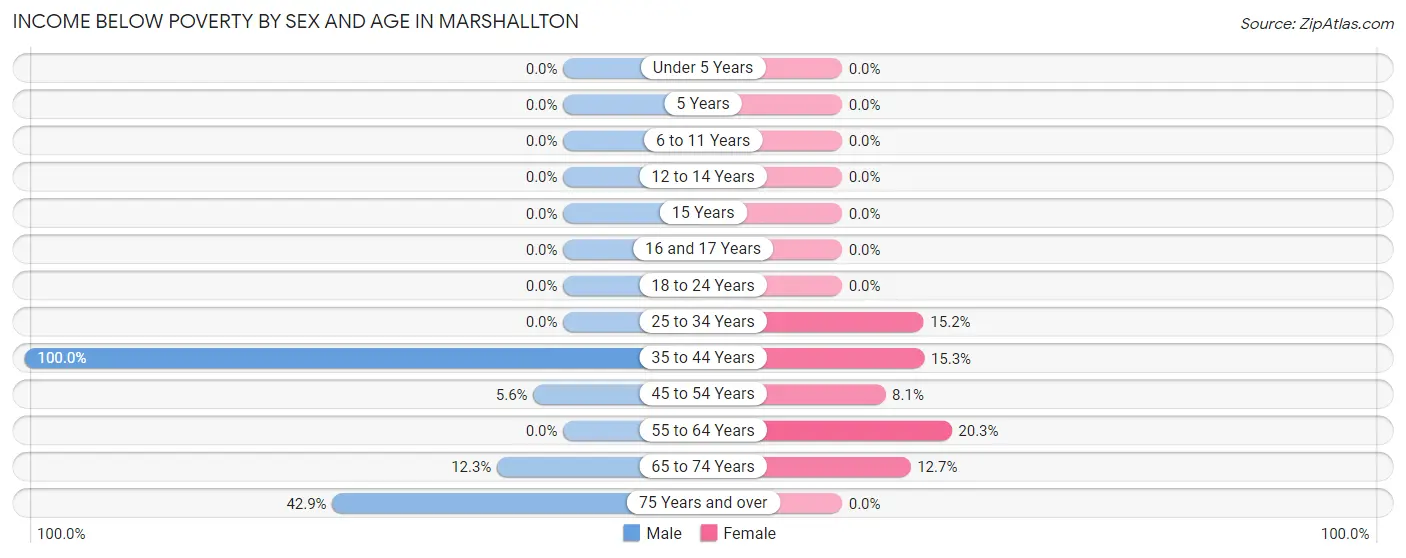
| Age Bracket | Male | Female |
| Under 5 Years | 0 (0.0%) | 0 (0.0%) |
| 5 Years | 0 (0.0%) | 0 (0.0%) |
| 6 to 11 Years | 0 (0.0%) | 0 (0.0%) |
| 12 to 14 Years | 0 (0.0%) | 0 (0.0%) |
| 15 Years | 0 (0.0%) | 0 (0.0%) |
| 16 and 17 Years | 0 (0.0%) | 0 (0.0%) |
| 18 to 24 Years | 0 (0.0%) | 0 (0.0%) |
| 25 to 34 Years | 0 (0.0%) | 10 (15.1%) |
| 35 to 44 Years | 8 (100.0%) | 18 (15.2%) |
| 45 to 54 Years | 6 (5.6%) | 7 (8.1%) |
| 55 to 64 Years | 0 (0.0%) | 24 (20.3%) |
| 65 to 74 Years | 7 (12.3%) | 8 (12.7%) |
| 75 Years and over | 9 (42.9%) | 0 (0.0%) |
| Total | 30 (5.4%) | 67 (9.9%) |
Income Above Poverty by Sex and Age in Marshallton
According to the poverty statistics in Marshallton, males aged under 5 years and females aged under 5 years are the age groups that are most secure financially, with 100.0% of males and 100.0% of females in these age groups living above the poverty line.
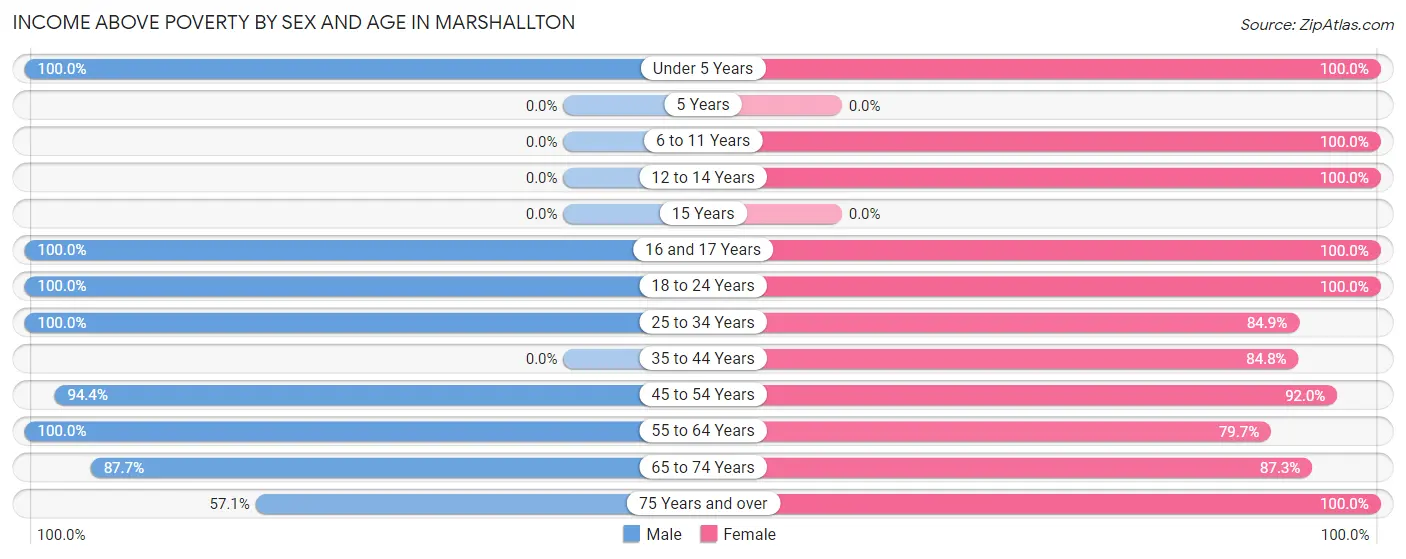
| Age Bracket | Male | Female |
| Under 5 Years | 8 (100.0%) | 55 (100.0%) |
| 5 Years | 0 (0.0%) | 0 (0.0%) |
| 6 to 11 Years | 0 (0.0%) | 36 (100.0%) |
| 12 to 14 Years | 0 (0.0%) | 10 (100.0%) |
| 15 Years | 0 (0.0%) | 0 (0.0%) |
| 16 and 17 Years | 11 (100.0%) | 34 (100.0%) |
| 18 to 24 Years | 72 (100.0%) | 44 (100.0%) |
| 25 to 34 Years | 103 (100.0%) | 56 (84.9%) |
| 35 to 44 Years | 0 (0.0%) | 100 (84.8%) |
| 45 to 54 Years | 102 (94.4%) | 80 (91.9%) |
| 55 to 64 Years | 164 (100.0%) | 94 (79.7%) |
| 65 to 74 Years | 50 (87.7%) | 55 (87.3%) |
| 75 Years and over | 12 (57.1%) | 45 (100.0%) |
| Total | 522 (94.6%) | 609 (90.1%) |
Income Below Poverty Among Married-Couple Families in Marshallton
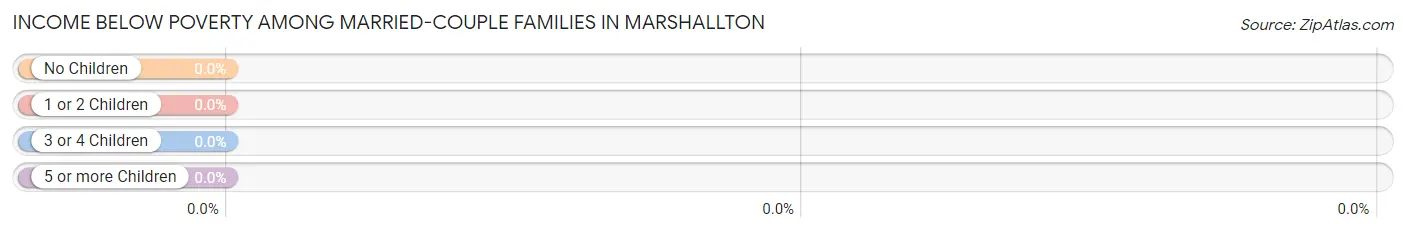
| Children | Above Poverty | Below Poverty |
| No Children | 102 (100.0%) | 0 (0.0%) |
| 1 or 2 Children | 71 (100.0%) | 0 (0.0%) |
| 3 or 4 Children | 22 (100.0%) | 0 (0.0%) |
| 5 or more Children | 0 (0.0%) | 0 (0.0%) |
| Total | 195 (100.0%) | 0 (0.0%) |
Income Below Poverty Among Single-Parent Households in Marshallton
| Children | Single Father | Single Mother |
| No Children | 0 (0.0%) | 0 (0.0%) |
| 1 or 2 Children | 0 (0.0%) | 0 (0.0%) |
| 3 or 4 Children | 0 (0.0%) | 0 (0.0%) |
| 5 or more Children | 0 (0.0%) | 0 (0.0%) |
| Total | 0 (0.0%) | 0 (0.0%) |
Income Below Poverty Among Married-Couple vs Single-Parent Households in Marshallton
| Children | Married-Couple Families | Single-Parent Households |
| No Children | 0 (0.0%) | 0 (0.0%) |
| 1 or 2 Children | 0 (0.0%) | 0 (0.0%) |
| 3 or 4 Children | 0 (0.0%) | 0 (0.0%) |
| 5 or more Children | 0 (0.0%) | 0 (0.0%) |
| Total | 0 (0.0%) | 0 (0.0%) |
Race in Marshallton
The most populous races in Marshallton are White / Caucasian (1,224 | 99.7%), and Black / African American (4 | 0.3%).
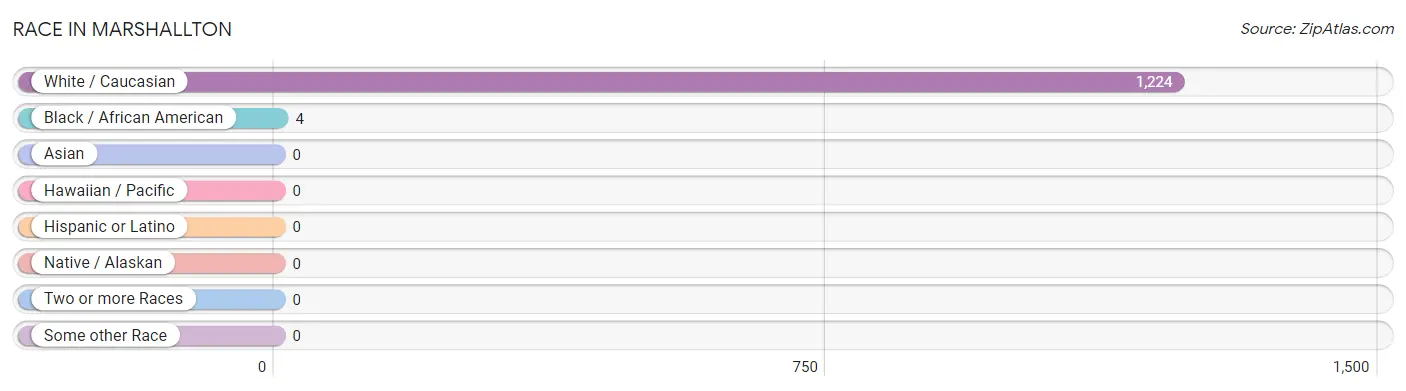
| Race | # Population | % Population |
| Asian | 0 | 0.0% |
| Black / African American | 4 | 0.3% |
| Hawaiian / Pacific | 0 | 0.0% |
| Hispanic or Latino | 0 | 0.0% |
| Native / Alaskan | 0 | 0.0% |
| White / Caucasian | 1,224 | 99.7% |
| Two or more Races | 0 | 0.0% |
| Some other Race | 0 | 0.0% |
| Total | 1,228 | 100.0% |
Ancestry in Marshallton
The most populous ancestries reported in Marshallton are Polish (298 | 24.3%), German (225 | 18.3%), Italian (166 | 13.5%), English (142 | 11.6%), and Slovak (121 | 9.9%), together accounting for 77.5% of all Marshallton residents.
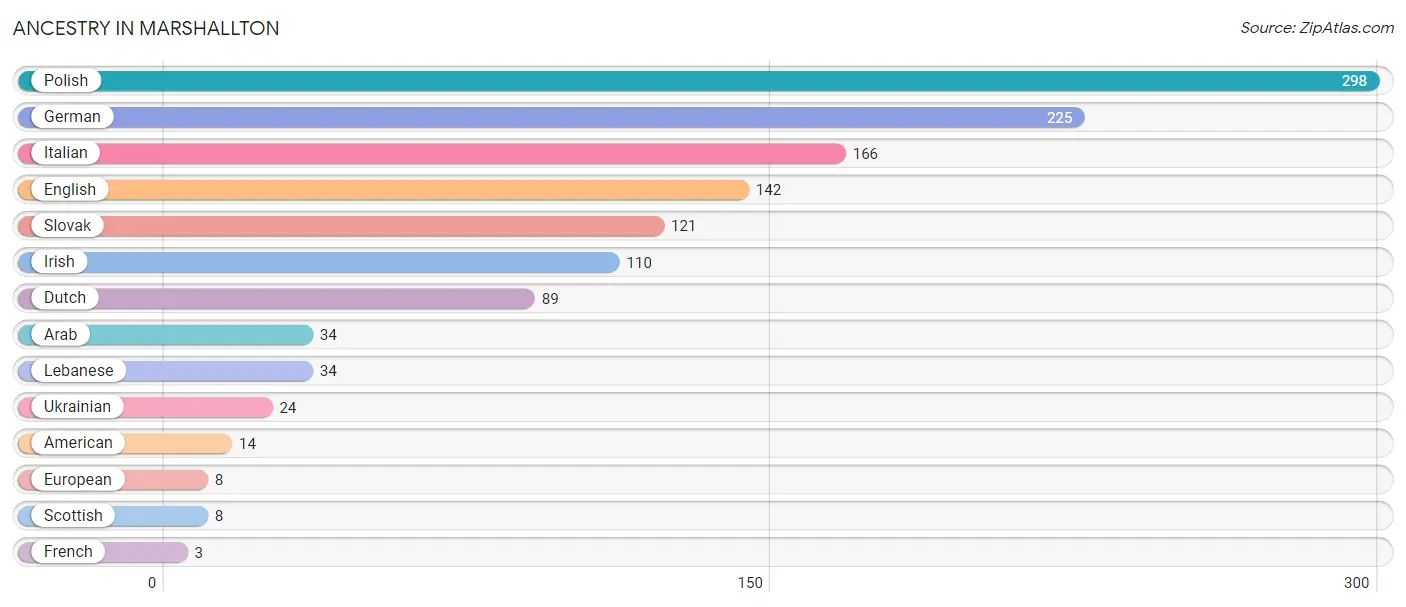
| Ancestry | # Population | % Population |
| American | 14 | 1.1% |
| Arab | 34 | 2.8% |
| Dutch | 89 | 7.2% |
| English | 142 | 11.6% |
| European | 8 | 0.6% |
| French | 3 | 0.2% |
| German | 225 | 18.3% |
| Irish | 110 | 9.0% |
| Italian | 166 | 13.5% |
| Lebanese | 34 | 2.8% |
| Polish | 298 | 24.3% |
| Scottish | 8 | 0.6% |
| Slovak | 121 | 9.9% |
| Ukrainian | 24 | 1.9% | View All 14 Rows |
Immigrants in Marshallton

| Immigration Origin | # Population | % Population | View All 0 Rows |
Sex and Age in Marshallton
Sex and Age in Marshallton
The most populous age groups in Marshallton are 55 to 59 Years (95 | 17.2%) for men and 50 to 54 Years (80 | 11.8%) for women.
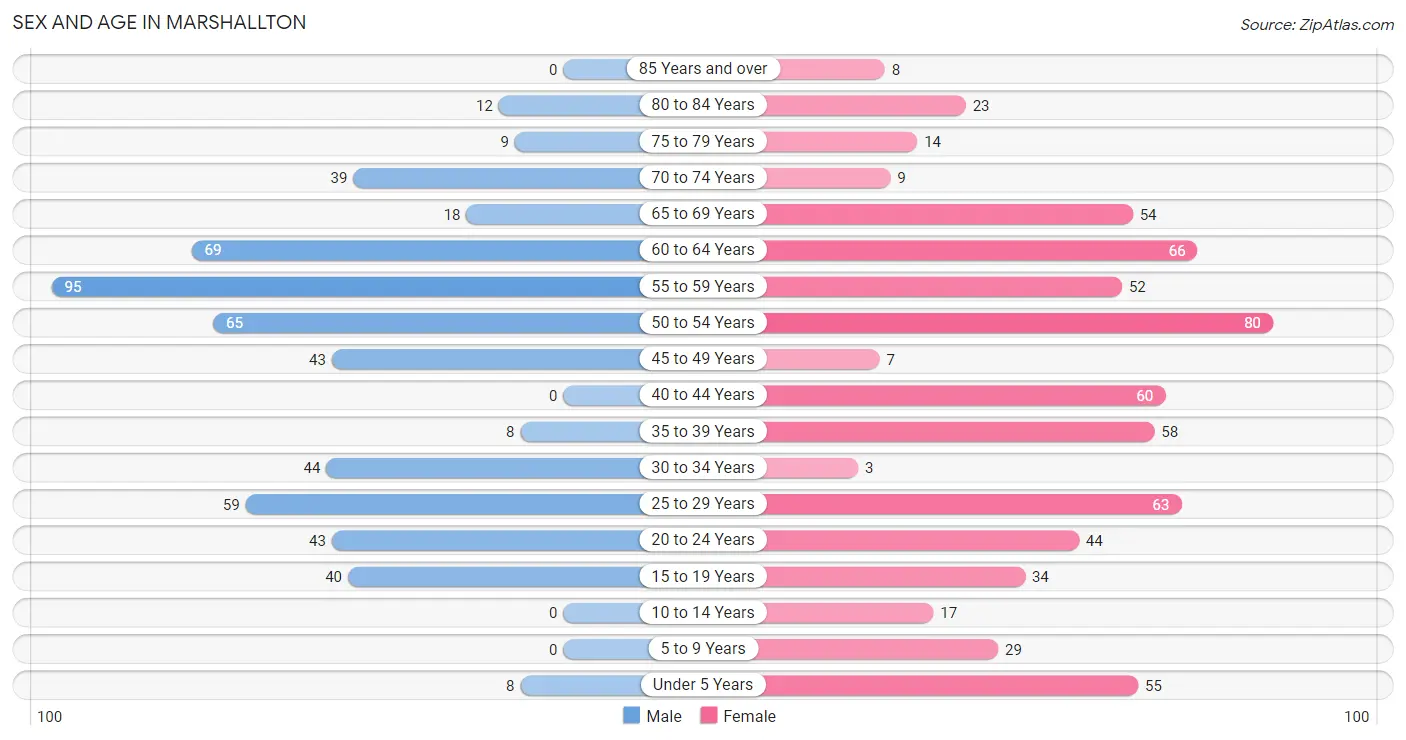
| Age Bracket | Male | Female |
| Under 5 Years | 8 (1.5%) | 55 (8.1%) |
| 5 to 9 Years | 0 (0.0%) | 29 (4.3%) |
| 10 to 14 Years | 0 (0.0%) | 17 (2.5%) |
| 15 to 19 Years | 40 (7.2%) | 34 (5.0%) |
| 20 to 24 Years | 43 (7.8%) | 44 (6.5%) |
| 25 to 29 Years | 59 (10.7%) | 63 (9.3%) |
| 30 to 34 Years | 44 (8.0%) | 3 (0.4%) |
| 35 to 39 Years | 8 (1.5%) | 58 (8.6%) |
| 40 to 44 Years | 0 (0.0%) | 60 (8.9%) |
| 45 to 49 Years | 43 (7.8%) | 7 (1.0%) |
| 50 to 54 Years | 65 (11.8%) | 80 (11.8%) |
| 55 to 59 Years | 95 (17.2%) | 52 (7.7%) |
| 60 to 64 Years | 69 (12.5%) | 66 (9.8%) |
| 65 to 69 Years | 18 (3.3%) | 54 (8.0%) |
| 70 to 74 Years | 39 (7.1%) | 9 (1.3%) |
| 75 to 79 Years | 9 (1.6%) | 14 (2.1%) |
| 80 to 84 Years | 12 (2.2%) | 23 (3.4%) |
| 85 Years and over | 0 (0.0%) | 8 (1.2%) |
| Total | 552 (100.0%) | 676 (100.0%) |
Families and Households in Marshallton
Median Family Size in Marshallton
The median family size in Marshallton is 3.16 persons per family, with single female/mother families (52 | 18.0%) accounting for the largest median family size of 3.85 persons per family. On the other hand, single male/father families (42 | 14.5%) represent the smallest median family size with 2.76 persons per family.
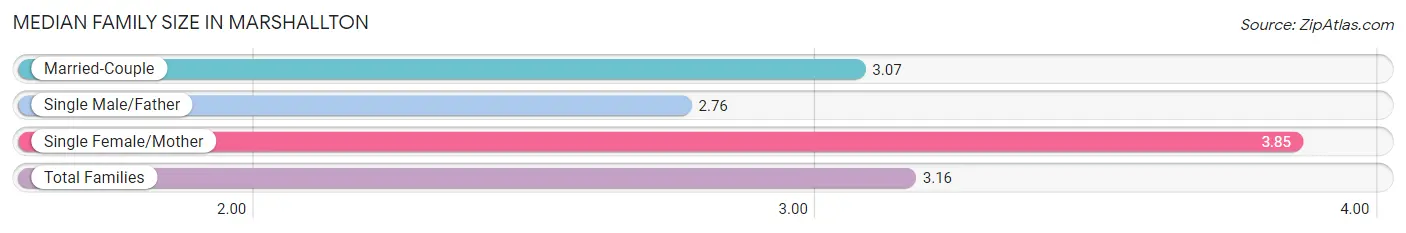
| Family Type | # Families | Family Size |
| Married-Couple | 195 (67.5%) | 3.07 |
| Single Male/Father | 42 (14.5%) | 2.76 |
| Single Female/Mother | 52 (18.0%) | 3.85 |
| Total Families | 289 (100.0%) | 3.16 |
Median Household Size in Marshallton
The median household size in Marshallton is 2.15 persons per household, with single female/mother households (52 | 9.1%) accounting for the largest median household size of 3.85 persons per household. non-family households (283 | 49.5%) represent the smallest median household size with 1.07 persons per household.
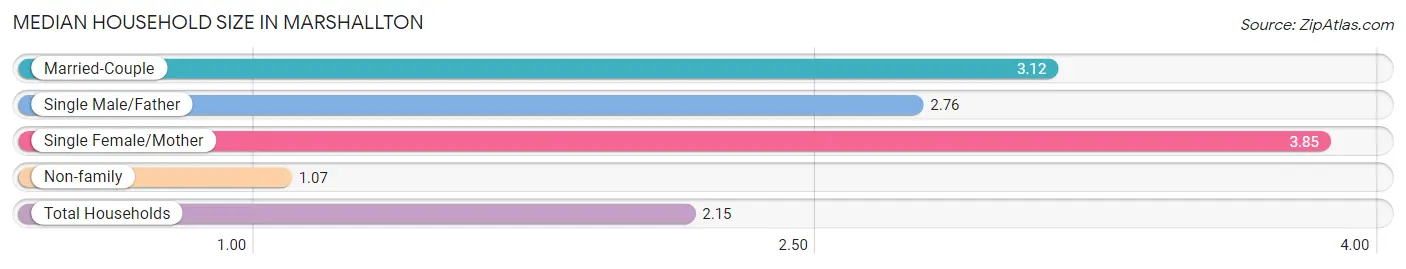
| Household Type | # Households | Household Size |
| Married-Couple | 195 (34.1%) | 3.12 |
| Single Male/Father | 42 (7.3%) | 2.76 |
| Single Female/Mother | 52 (9.1%) | 3.85 |
| Non-family | 283 (49.5%) | 1.07 |
| Total Households | 572 (100.0%) | 2.15 |
Household Size by Marriage Status in Marshallton
Out of a total of 572 households in Marshallton, 289 (50.5%) are family households, while 283 (49.5%) are nonfamily households. The most numerous type of family households are 4-person households, comprising 123, and the most common type of nonfamily households are 1-person households, comprising 258.
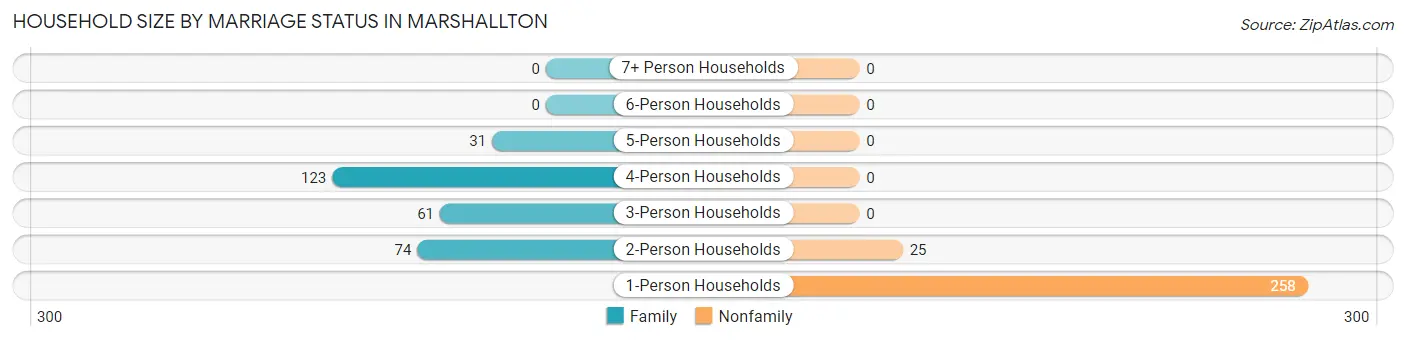
| Household Size | Family Households | Nonfamily Households |
| 1-Person Households | - | 258 (45.1%) |
| 2-Person Households | 74 (12.9%) | 25 (4.4%) |
| 3-Person Households | 61 (10.7%) | 0 (0.0%) |
| 4-Person Households | 123 (21.5%) | 0 (0.0%) |
| 5-Person Households | 31 (5.4%) | 0 (0.0%) |
| 6-Person Households | 0 (0.0%) | 0 (0.0%) |
| 7+ Person Households | 0 (0.0%) | 0 (0.0%) |
| Total | 289 (50.5%) | 283 (49.5%) |
Female Fertility in Marshallton
Fertility by Age in Marshallton
| Age Bracket | Women with Births | Births / 1,000 Women |
| 15 to 19 years | 0 (0.0%) | 0.0 |
| 20 to 34 years | 0 (0.0%) | 0.0 |
| 35 to 50 years | 0 (0.0%) | 0.0 |
| Total | 0 (0.0%) | 0.0 |
Fertility by Age by Marriage Status in Marshallton
| Age Bracket | Married | Unmarried |
| 15 to 19 years | 0 (0.0%) | 0 (0.0%) |
| 20 to 34 years | 0 (0.0%) | 0 (0.0%) |
| 35 to 50 years | 0 (0.0%) | 0 (0.0%) |
| Total | 0 (0.0%) | 0 (0.0%) |
Fertility by Education in Marshallton
| Educational Attainment | Women with Births | Births / 1,000 Women |
| Less than High School | 0 (0.0%) | 0.0 |
| High School Diploma | 0 (0.0%) | 0.0 |
| College or Associate's Degree | 0 (0.0%) | 0.0 |
| Bachelor's Degree | 0 (0.0%) | 0.0 |
| Graduate Degree | 0 (0.0%) | 0.0 |
| Total | 0 (0.0%) | 0.0 |
Fertility by Education by Marriage Status in Marshallton
| Educational Attainment | Married | Unmarried |
| Less than High School | 0 (0.0%) | 0 (0.0%) |
| High School Diploma | 0 (0.0%) | 0 (0.0%) |
| College or Associate's Degree | 0 (0.0%) | 0 (0.0%) |
| Bachelor's Degree | 0 (0.0%) | 0 (0.0%) |
| Graduate Degree | 0 (0.0%) | 0 (0.0%) |
| Total | 0 (0.0%) | 0 (0.0%) |
Employment Characteristics in Marshallton
Employment by Class of Employer in Marshallton
Among the 518 employed individuals in Marshallton, private company employees (389 | 75.1%), not-for-profit organizations (70 | 13.5%), and local government employees (40 | 7.7%) make up the most common classes of employment.
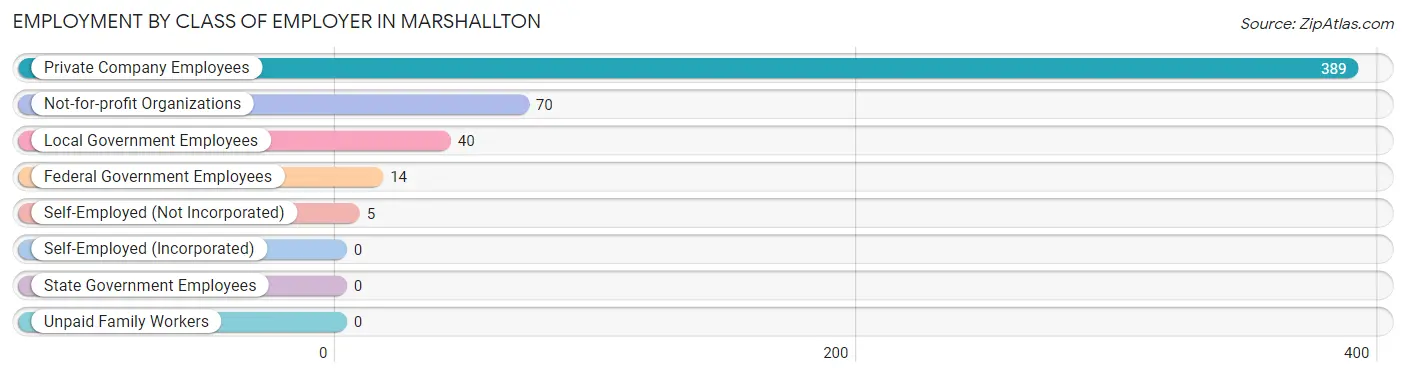
| Employer Class | # Employees | % Employees |
| Private Company Employees | 389 | 75.1% |
| Self-Employed (Incorporated) | 0 | 0.0% |
| Self-Employed (Not Incorporated) | 5 | 1.0% |
| Not-for-profit Organizations | 70 | 13.5% |
| Local Government Employees | 40 | 7.7% |
| State Government Employees | 0 | 0.0% |
| Federal Government Employees | 14 | 2.7% |
| Unpaid Family Workers | 0 | 0.0% |
| Total | 518 | 100.0% |
Employment Status by Age in Marshallton
According to the labor force statistics for Marshallton, out of the total population over 16 years of age (1,119), 55.3% or 619 individuals are in the labor force, with 14.2% or 88 of them unemployed. The age group with the highest labor force participation rate is 35 to 44 years, with 82.5% or 104 individuals in the labor force. Within the labor force, the 16 to 19 years age range has the highest percentage of unemployed individuals, with 100.0% or 10 of them being unemployed.
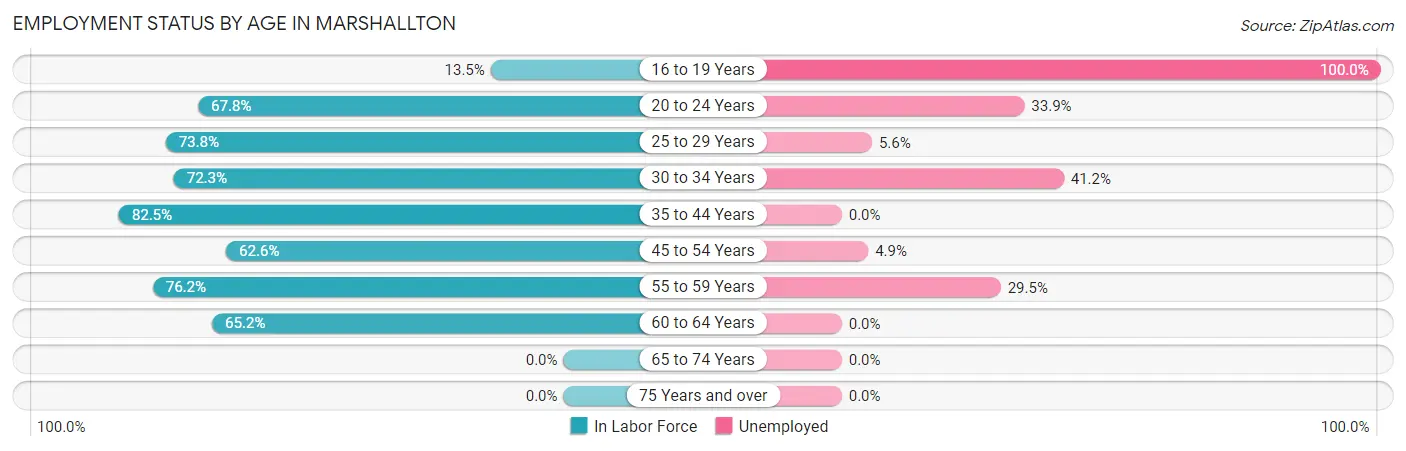
| Age Bracket | In Labor Force | Unemployed |
| 16 to 19 Years | 10 (13.5%) | 10 (100.0%) |
| 20 to 24 Years | 59 (67.8%) | 20 (33.9%) |
| 25 to 29 Years | 90 (73.8%) | 5 (5.6%) |
| 30 to 34 Years | 34 (72.3%) | 14 (41.2%) |
| 35 to 44 Years | 104 (82.5%) | 0 (0.0%) |
| 45 to 54 Years | 122 (62.6%) | 6 (4.9%) |
| 55 to 59 Years | 112 (76.2%) | 33 (29.5%) |
| 60 to 64 Years | 88 (65.2%) | 0 (0.0%) |
| 65 to 74 Years | 0 (0.0%) | 0 (0.0%) |
| 75 Years and over | 0 (0.0%) | 0 (0.0%) |
| Total | 619 (55.3%) | 88 (14.2%) |
Employment Status by Educational Attainment in Marshallton
According to labor force statistics for Marshallton, 71.2% of individuals (550) out of the total population between 25 and 64 years of age (772) are in the labor force, with 10.5% or 58 of them being unemployed. The group with the highest labor force participation rate are those with the educational attainment of less than high school, with 88.9% or 80 individuals in the labor force. Within the labor force, individuals with less than high school education have the highest percentage of unemployment, with 27.5% or 22 of them being unemployed.
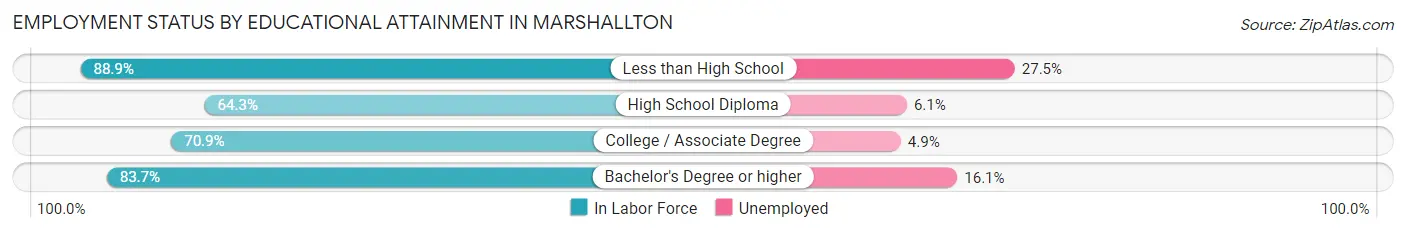
| Educational Attainment | In Labor Force | Unemployed |
| Less than High School | 80 (88.9%) | 25 (27.5%) |
| High School Diploma | 261 (64.3%) | 25 (6.1%) |
| College / Associate Degree | 122 (70.9%) | 8 (4.9%) |
| Bachelor's Degree or higher | 87 (83.7%) | 17 (16.1%) |
| Total | 550 (71.2%) | 81 (10.5%) |
Employment Occupations by Sex in Marshallton
Management, Business, Science and Arts Occupations
The most common Management, Business, Science and Arts occupations in Marshallton are Health Diagnosing & Treating (64 | 12.0%), Health Technologists (36 | 6.8%), Management (19 | 3.6%), Business & Financial (8 | 1.5%), and Computers, Engineering & Science (8 | 1.5%).
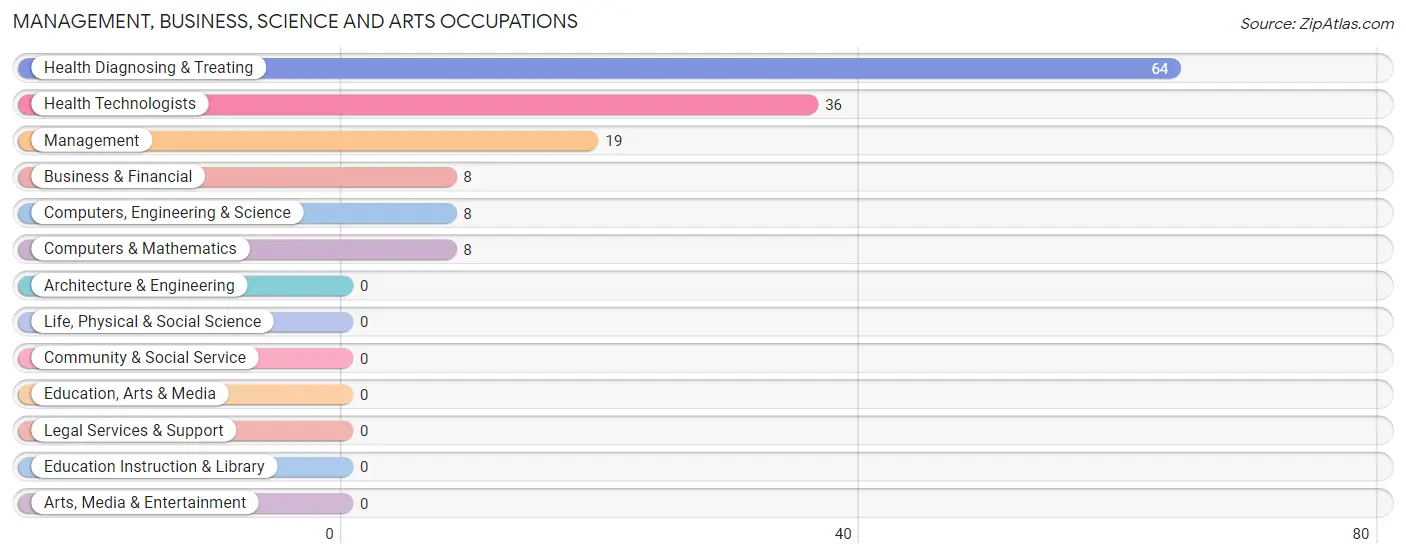
Management, Business, Science and Arts Occupations by Sex
Within the Management, Business, Science and Arts occupations in Marshallton, the most male-oriented occupations are Business & Financial (100.0%), Computers, Engineering & Science (100.0%), and Computers & Mathematics (100.0%), while the most female-oriented occupations are Health Diagnosing & Treating (100.0%), Health Technologists (100.0%), and Management (57.9%).
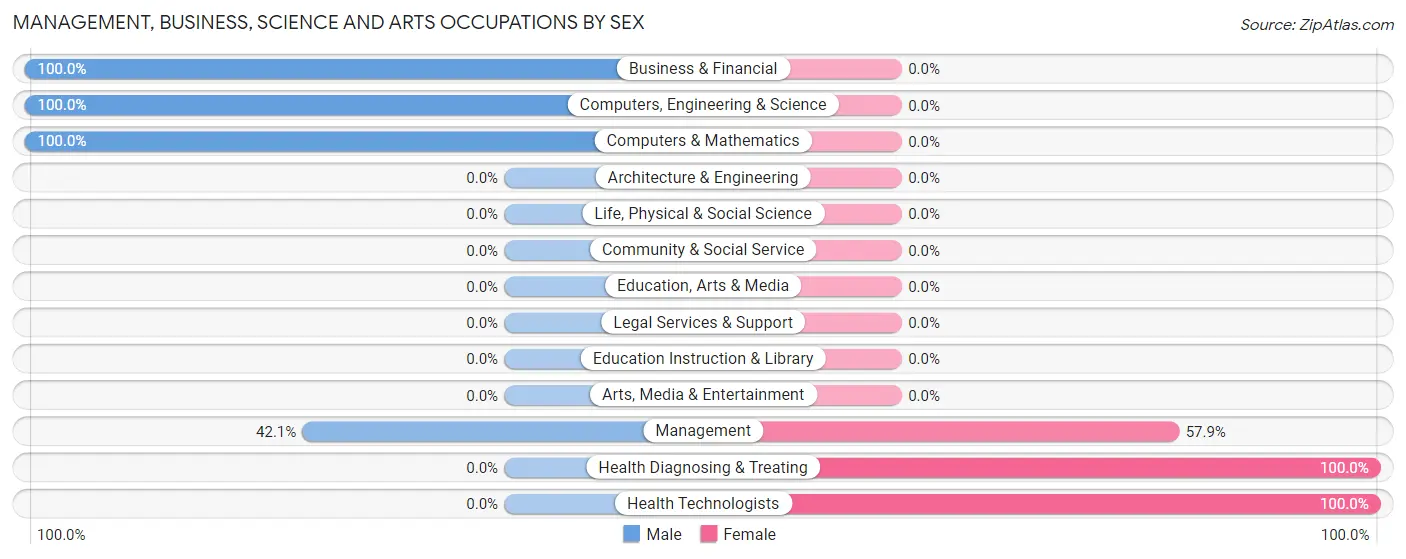
| Occupation | Male | Female |
| Management | 8 (42.1%) | 11 (57.9%) |
| Business & Financial | 8 (100.0%) | 0 (0.0%) |
| Computers, Engineering & Science | 8 (100.0%) | 0 (0.0%) |
| Computers & Mathematics | 8 (100.0%) | 0 (0.0%) |
| Architecture & Engineering | 0 (0.0%) | 0 (0.0%) |
| Life, Physical & Social Science | 0 (0.0%) | 0 (0.0%) |
| Community & Social Service | 0 (0.0%) | 0 (0.0%) |
| Education, Arts & Media | 0 (0.0%) | 0 (0.0%) |
| Legal Services & Support | 0 (0.0%) | 0 (0.0%) |
| Education Instruction & Library | 0 (0.0%) | 0 (0.0%) |
| Arts, Media & Entertainment | 0 (0.0%) | 0 (0.0%) |
| Health Diagnosing & Treating | 0 (0.0%) | 64 (100.0%) |
| Health Technologists | 0 (0.0%) | 36 (100.0%) |
| Total (Category) | 24 (24.2%) | 75 (75.8%) |
| Total (Overall) | 326 (61.4%) | 205 (38.6%) |
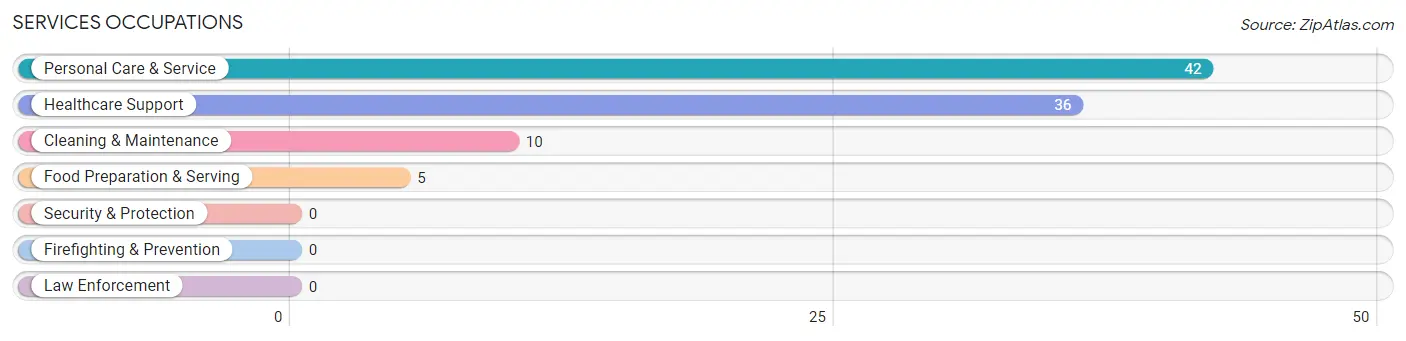
Services Occupations
The most common Services occupations in Marshallton are Personal Care & Service (42 | 7.9%), Healthcare Support (36 | 6.8%), Cleaning & Maintenance (10 | 1.9%), and Food Preparation & Serving (5 | 0.9%).
Services Occupations by Sex
Within the Services occupations in Marshallton, the most male-oriented occupations are Cleaning & Maintenance (100.0%), and Healthcare Support (36.1%), while the most female-oriented occupations are Food Preparation & Serving (100.0%), Personal Care & Service (100.0%), and Healthcare Support (63.9%).
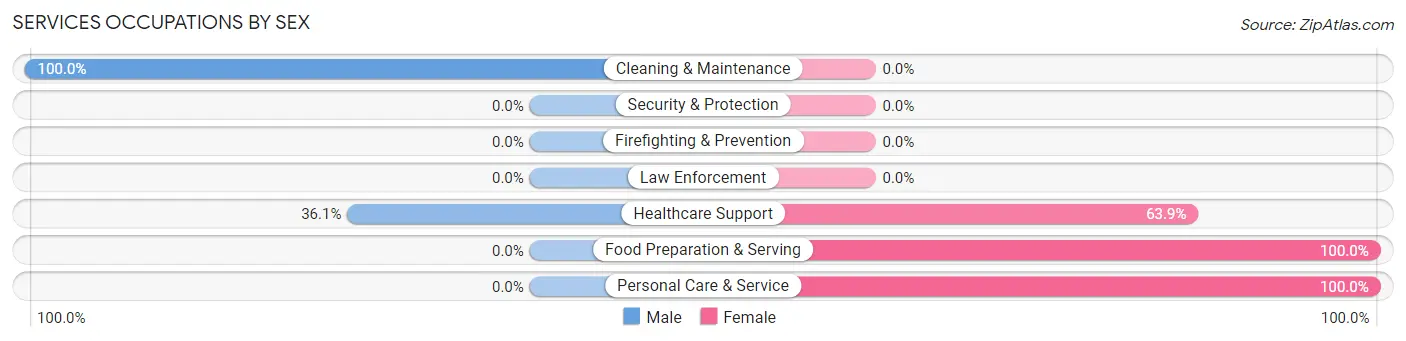
| Occupation | Male | Female |
| Healthcare Support | 13 (36.1%) | 23 (63.9%) |
| Security & Protection | 0 (0.0%) | 0 (0.0%) |
| Firefighting & Prevention | 0 (0.0%) | 0 (0.0%) |
| Law Enforcement | 0 (0.0%) | 0 (0.0%) |
| Food Preparation & Serving | 0 (0.0%) | 5 (100.0%) |
| Cleaning & Maintenance | 10 (100.0%) | 0 (0.0%) |
| Personal Care & Service | 0 (0.0%) | 42 (100.0%) |
| Total (Category) | 23 (24.7%) | 70 (75.3%) |
| Total (Overall) | 326 (61.4%) | 205 (38.6%) |
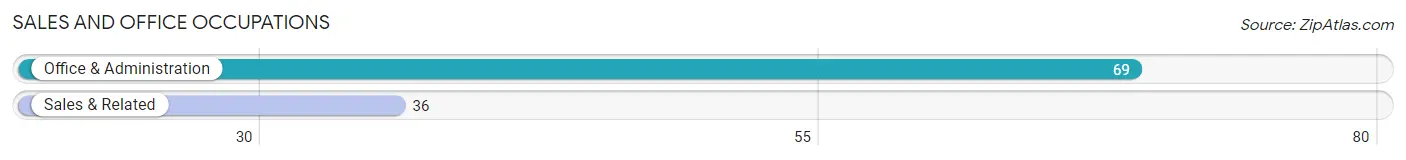
Sales and Office Occupations
The most common Sales and Office occupations in Marshallton are Office & Administration (69 | 13.0%), and Sales & Related (36 | 6.8%).
Sales and Office Occupations by Sex
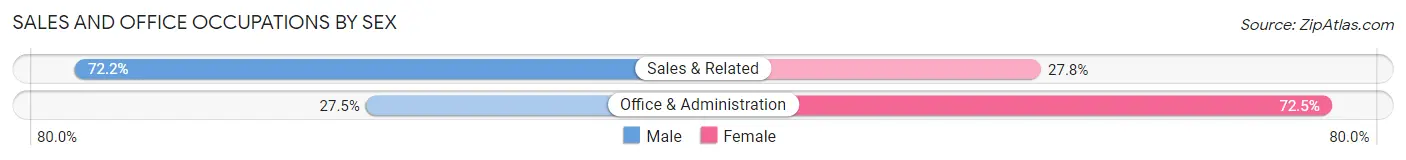
| Occupation | Male | Female |
| Sales & Related | 26 (72.2%) | 10 (27.8%) |
| Office & Administration | 19 (27.5%) | 50 (72.5%) |
| Total (Category) | 45 (42.9%) | 60 (57.1%) |
| Total (Overall) | 326 (61.4%) | 205 (38.6%) |
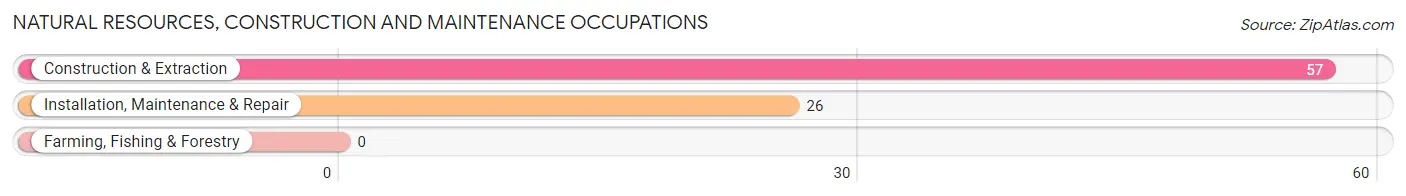
Natural Resources, Construction and Maintenance Occupations
The most common Natural Resources, Construction and Maintenance occupations in Marshallton are Construction & Extraction (57 | 10.7%), and Installation, Maintenance & Repair (26 | 4.9%).
Natural Resources, Construction and Maintenance Occupations by Sex
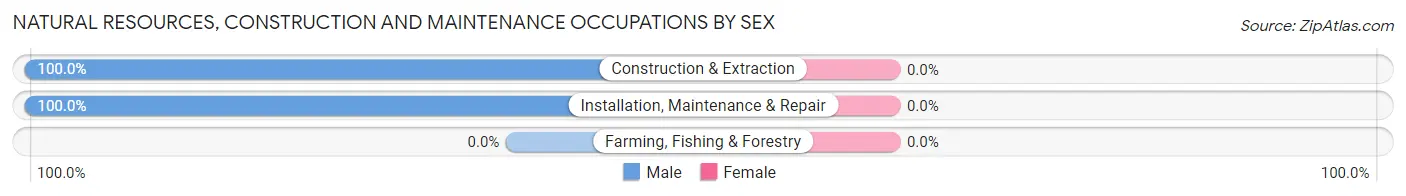
| Occupation | Male | Female |
| Farming, Fishing & Forestry | 0 (0.0%) | 0 (0.0%) |
| Construction & Extraction | 57 (100.0%) | 0 (0.0%) |
| Installation, Maintenance & Repair | 26 (100.0%) | 0 (0.0%) |
| Total (Category) | 83 (100.0%) | 0 (0.0%) |
| Total (Overall) | 326 (61.4%) | 205 (38.6%) |
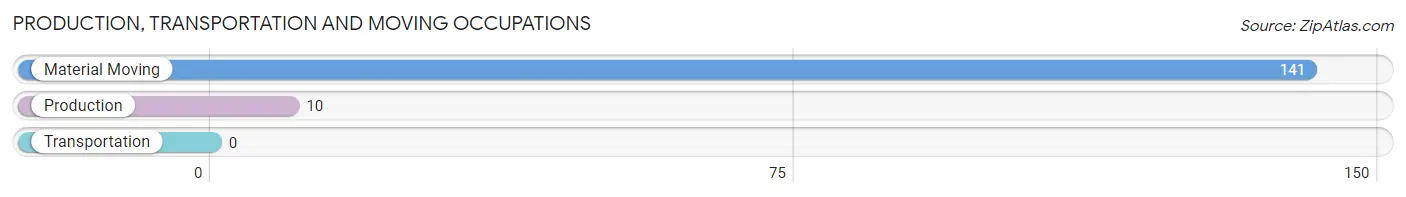
Production, Transportation and Moving Occupations
The most common Production, Transportation and Moving occupations in Marshallton are Material Moving (141 | 26.6%), and Production (10 | 1.9%).
Production, Transportation and Moving Occupations by Sex
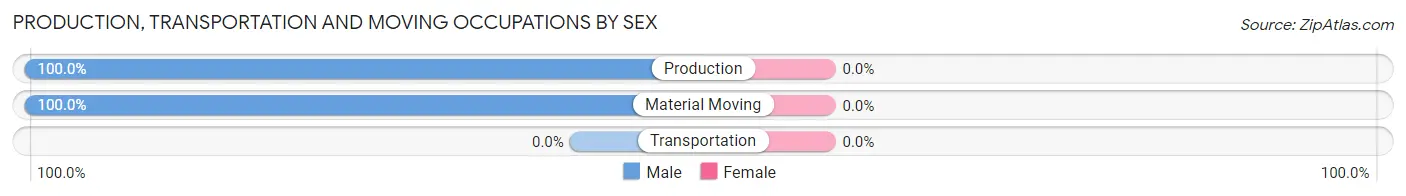
| Occupation | Male | Female |
| Production | 10 (100.0%) | 0 (0.0%) |
| Transportation | 0 (0.0%) | 0 (0.0%) |
| Material Moving | 141 (100.0%) | 0 (0.0%) |
| Total (Category) | 151 (100.0%) | 0 (0.0%) |
| Total (Overall) | 326 (61.4%) | 205 (38.6%) |
Employment Industries by Sex in Marshallton
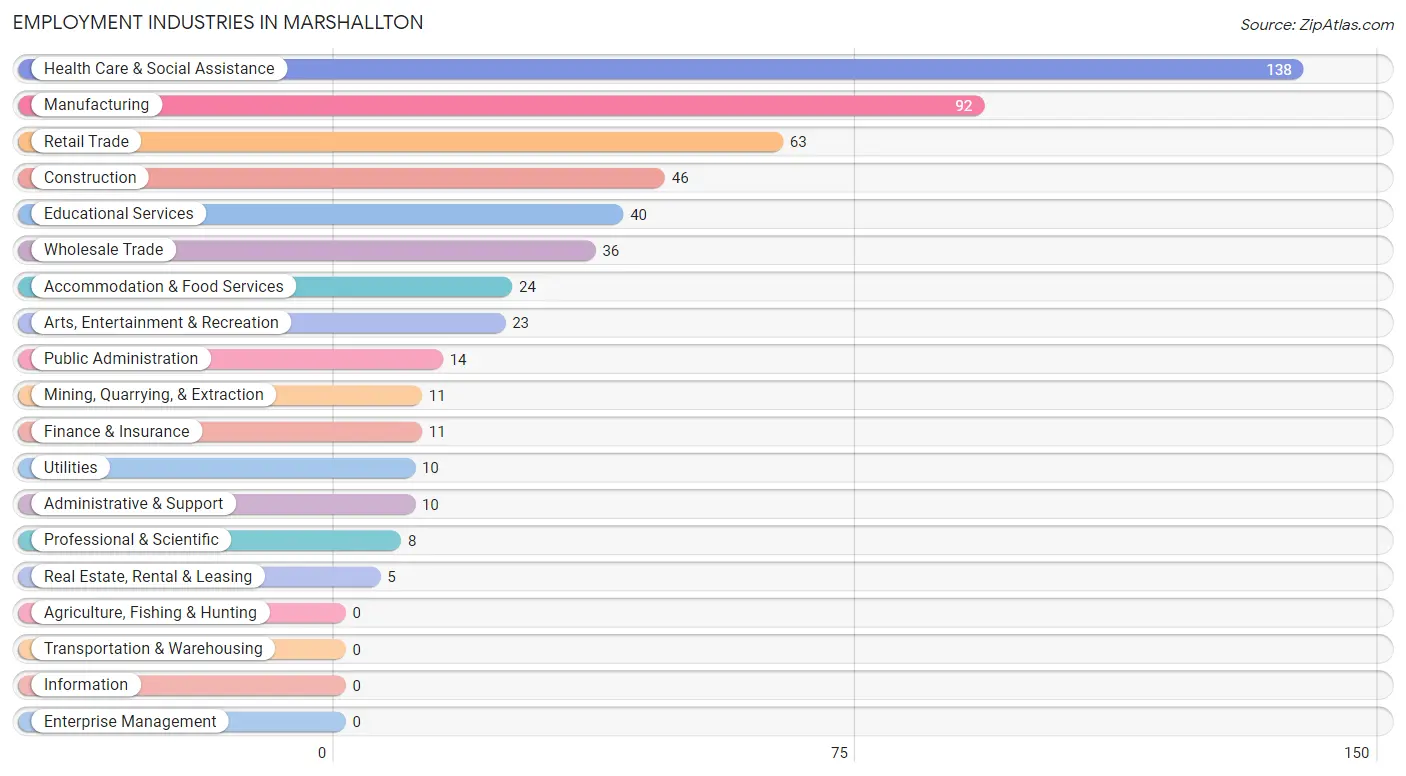
Employment Industries in Marshallton
The major employment industries in Marshallton include Health Care & Social Assistance (138 | 26.0%), Manufacturing (92 | 17.3%), Retail Trade (63 | 11.9%), Construction (46 | 8.7%), and Educational Services (40 | 7.5%).
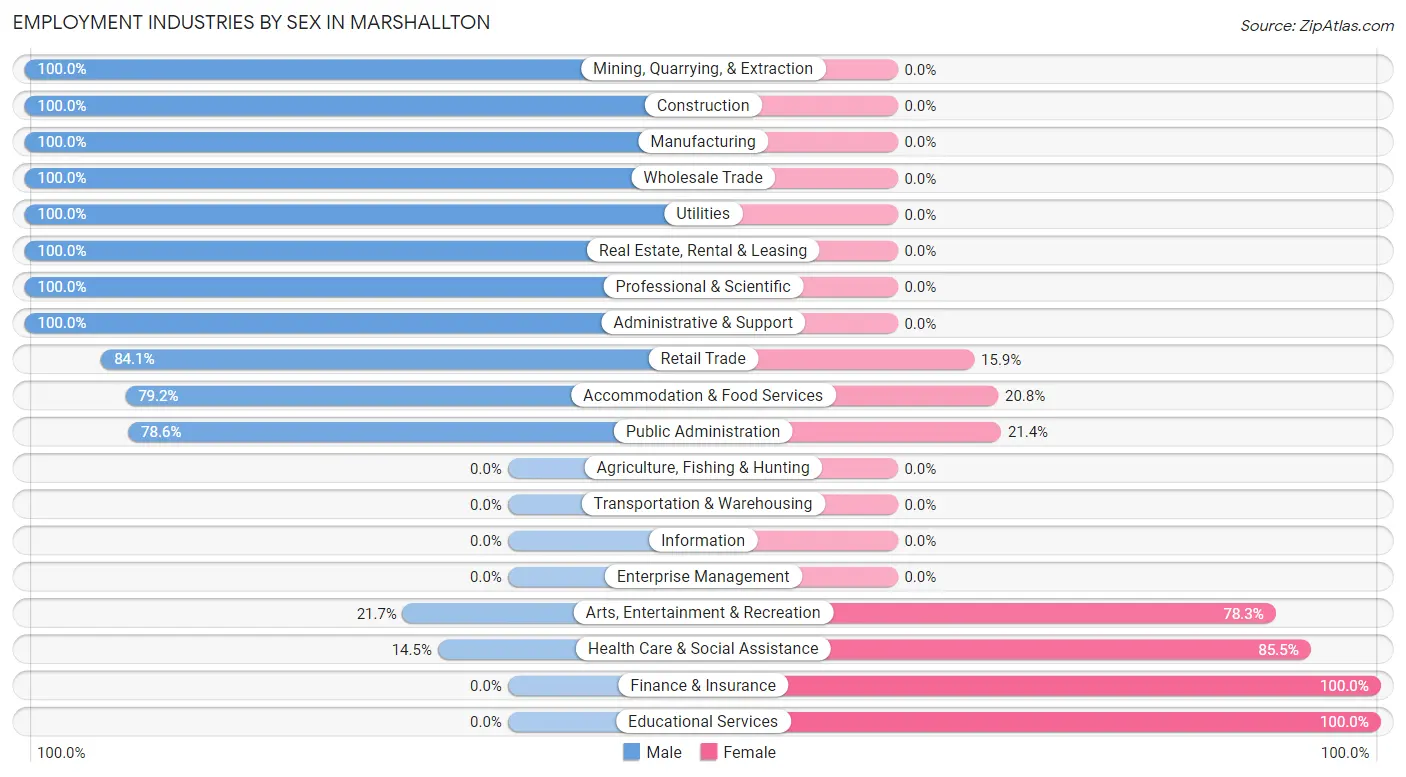
Employment Industries by Sex in Marshallton
The Marshallton industries that see more men than women are Mining, Quarrying, & Extraction (100.0%), Construction (100.0%), and Manufacturing (100.0%), whereas the industries that tend to have a higher number of women are Finance & Insurance (100.0%), Educational Services (100.0%), and Health Care & Social Assistance (85.5%).
| Industry | Male | Female |
| Agriculture, Fishing & Hunting | 0 (0.0%) | 0 (0.0%) |
| Mining, Quarrying, & Extraction | 11 (100.0%) | 0 (0.0%) |
| Construction | 46 (100.0%) | 0 (0.0%) |
| Manufacturing | 92 (100.0%) | 0 (0.0%) |
| Wholesale Trade | 36 (100.0%) | 0 (0.0%) |
| Retail Trade | 53 (84.1%) | 10 (15.9%) |
| Transportation & Warehousing | 0 (0.0%) | 0 (0.0%) |
| Utilities | 10 (100.0%) | 0 (0.0%) |
| Information | 0 (0.0%) | 0 (0.0%) |
| Finance & Insurance | 0 (0.0%) | 11 (100.0%) |
| Real Estate, Rental & Leasing | 5 (100.0%) | 0 (0.0%) |
| Professional & Scientific | 8 (100.0%) | 0 (0.0%) |
| Enterprise Management | 0 (0.0%) | 0 (0.0%) |
| Administrative & Support | 10 (100.0%) | 0 (0.0%) |
| Educational Services | 0 (0.0%) | 40 (100.0%) |
| Health Care & Social Assistance | 20 (14.5%) | 118 (85.5%) |
| Arts, Entertainment & Recreation | 5 (21.7%) | 18 (78.3%) |
| Accommodation & Food Services | 19 (79.2%) | 5 (20.8%) |
| Public Administration | 11 (78.6%) | 3 (21.4%) |
| Total | 326 (61.4%) | 205 (38.6%) |
Education in Marshallton
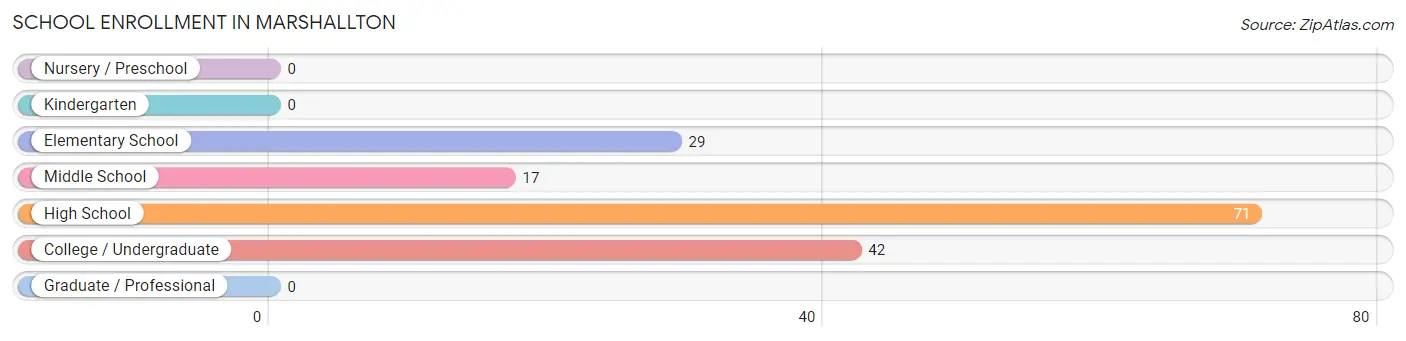
School Enrollment in Marshallton
The most common levels of schooling among the 159 students in Marshallton are high school (71 | 44.7%), college / undergraduate (42 | 26.4%), and elementary school (29 | 18.2%).
| School Level | # Students | % Students |
| Nursery / Preschool | 0 | 0.0% |
| Kindergarten | 0 | 0.0% |
| Elementary School | 29 | 18.2% |
| Middle School | 17 | 10.7% |
| High School | 71 | 44.7% |
| College / Undergraduate | 42 | 26.4% |
| Graduate / Professional | 0 | 0.0% |
| Total | 159 | 100.0% |
School Enrollment by Age by Funding Source in Marshallton
Out of a total of 159 students who are enrolled in schools in Marshallton, 18 (11.3%) attend a private institution, while the remaining 141 (88.7%) are enrolled in public schools. The age group of 35 years and over has the highest likelihood of being enrolled in private schools, with 7 (46.7% in the age bracket) enrolled. Conversely, the age group of 5 to 9 year old has the lowest likelihood of being enrolled in a private school, with 29 (100.0% in the age bracket) attending a public institution.
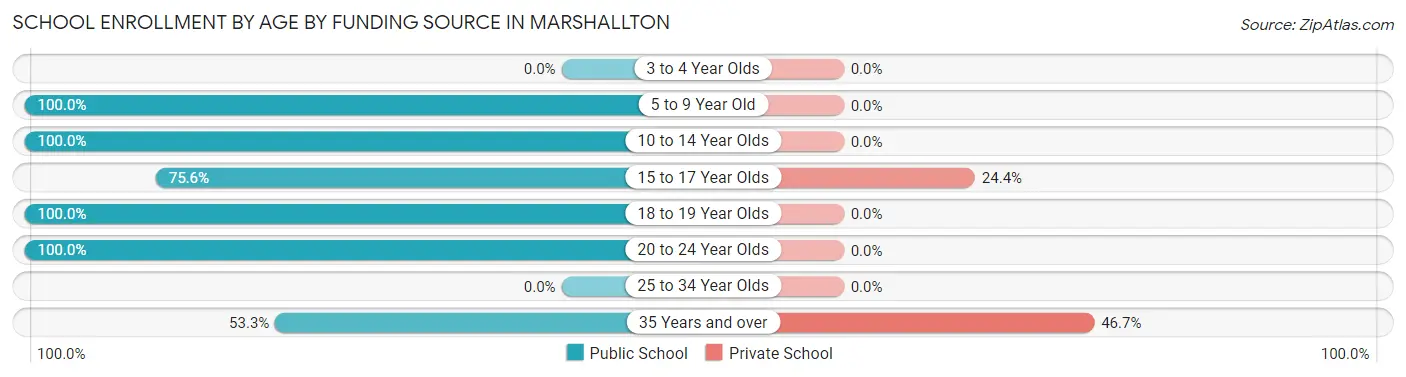
| Age Bracket | Public School | Private School |
| 3 to 4 Year Olds | 0 (0.0%) | 0 (0.0%) |
| 5 to 9 Year Old | 29 (100.0%) | 0 (0.0%) |
| 10 to 14 Year Olds | 17 (100.0%) | 0 (0.0%) |
| 15 to 17 Year Olds | 34 (75.6%) | 11 (24.4%) |
| 18 to 19 Year Olds | 29 (100.0%) | 0 (0.0%) |
| 20 to 24 Year Olds | 24 (100.0%) | 0 (0.0%) |
| 25 to 34 Year Olds | 0 (0.0%) | 0 (0.0%) |
| 35 Years and over | 8 (53.3%) | 7 (46.7%) |
| Total | 141 (88.7%) | 18 (11.3%) |
Educational Attainment by Field of Study in Marshallton
Business (32 | 21.5%), bio, nature & agricultural (30 | 20.1%), education (29 | 19.5%), arts & humanities (16 | 10.7%), and psychology (14 | 9.4%) are the most common fields of study among 149 individuals in Marshallton who have obtained a bachelor's degree or higher.
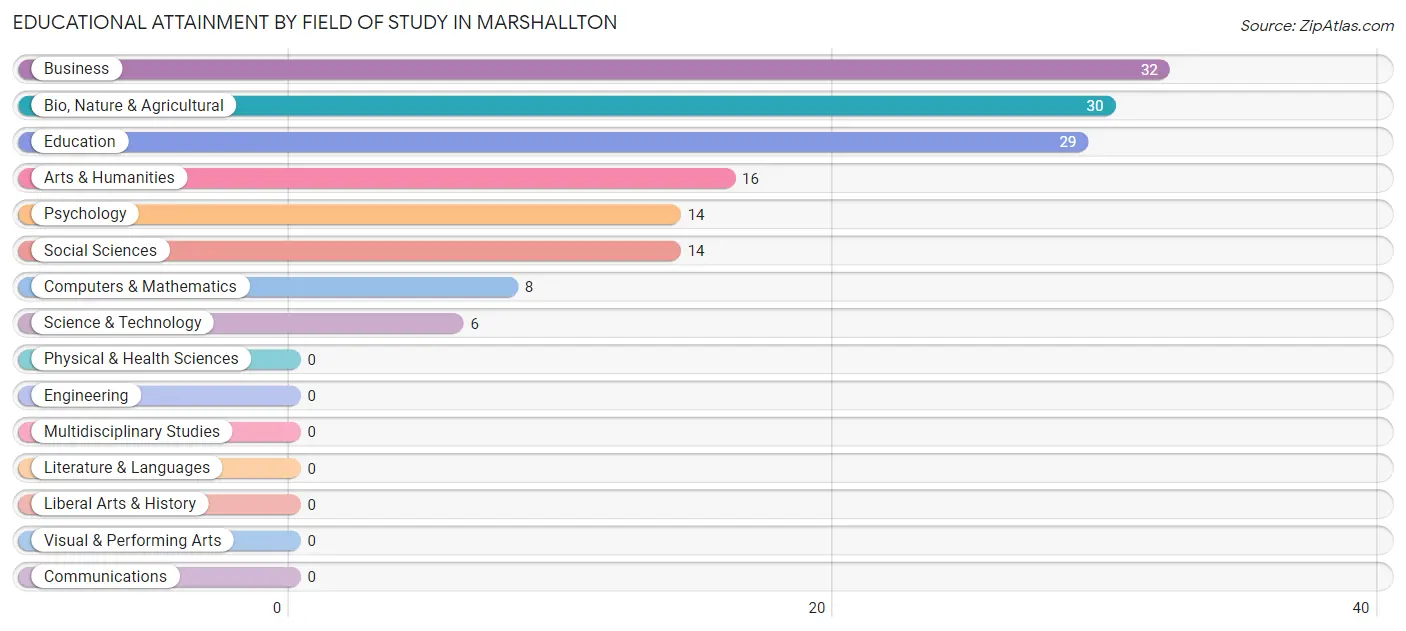
| Field of Study | # Graduates | % Graduates |
| Computers & Mathematics | 8 | 5.4% |
| Bio, Nature & Agricultural | 30 | 20.1% |
| Physical & Health Sciences | 0 | 0.0% |
| Psychology | 14 | 9.4% |
| Social Sciences | 14 | 9.4% |
| Engineering | 0 | 0.0% |
| Multidisciplinary Studies | 0 | 0.0% |
| Science & Technology | 6 | 4.0% |
| Business | 32 | 21.5% |
| Education | 29 | 19.5% |
| Literature & Languages | 0 | 0.0% |
| Liberal Arts & History | 0 | 0.0% |
| Visual & Performing Arts | 0 | 0.0% |
| Communications | 0 | 0.0% |
| Arts & Humanities | 16 | 10.7% |
| Total | 149 | 100.0% |
Transportation & Commute in Marshallton
Vehicle Availability by Sex in Marshallton
The most prevalent vehicle ownership categories in Marshallton are males with 2 vehicles (150, accounting for 47.9%) and females with 2 vehicles (17, making up 73.2%).
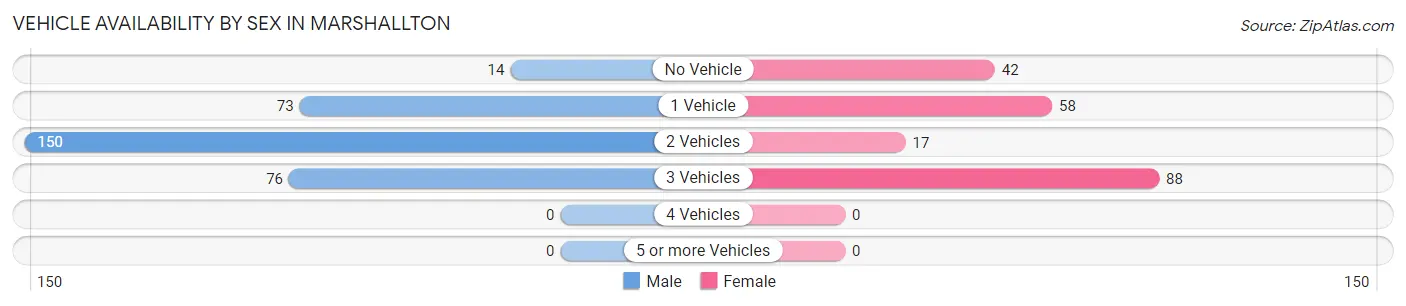
| Vehicles Available | Male | Female |
| No Vehicle | 14 (4.5%) | 42 (20.5%) |
| 1 Vehicle | 73 (23.3%) | 58 (28.3%) |
| 2 Vehicles | 150 (47.9%) | 17 (8.3%) |
| 3 Vehicles | 76 (24.3%) | 88 (42.9%) |
| 4 Vehicles | 0 (0.0%) | 0 (0.0%) |
| 5 or more Vehicles | 0 (0.0%) | 0 (0.0%) |
| Total | 313 (100.0%) | 205 (100.0%) |
Commute Time in Marshallton
The most frequently occuring commute durations in Marshallton are 40 to 44 minutes (91 commuters, 17.7%), 60 to 89 minutes (85 commuters, 16.5%), and 10 to 14 minutes (81 commuters, 15.7%).
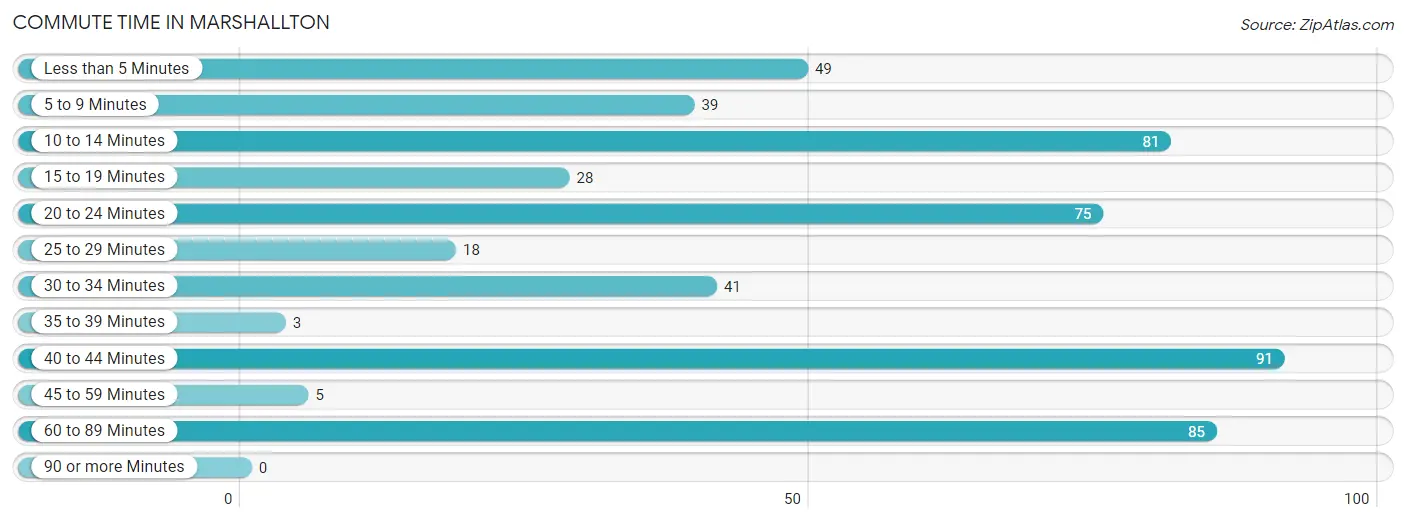
| Commute Time | # Commuters | % Commuters |
| Less than 5 Minutes | 49 | 9.5% |
| 5 to 9 Minutes | 39 | 7.6% |
| 10 to 14 Minutes | 81 | 15.7% |
| 15 to 19 Minutes | 28 | 5.4% |
| 20 to 24 Minutes | 75 | 14.6% |
| 25 to 29 Minutes | 18 | 3.5% |
| 30 to 34 Minutes | 41 | 8.0% |
| 35 to 39 Minutes | 3 | 0.6% |
| 40 to 44 Minutes | 91 | 17.7% |
| 45 to 59 Minutes | 5 | 1.0% |
| 60 to 89 Minutes | 85 | 16.5% |
| 90 or more Minutes | 0 | 0.0% |
Commute Time by Sex in Marshallton
The most common commute times in Marshallton are 60 to 89 minutes (85 commuters, 27.2%) for males and 10 to 14 minutes (70 commuters, 34.6%) for females.
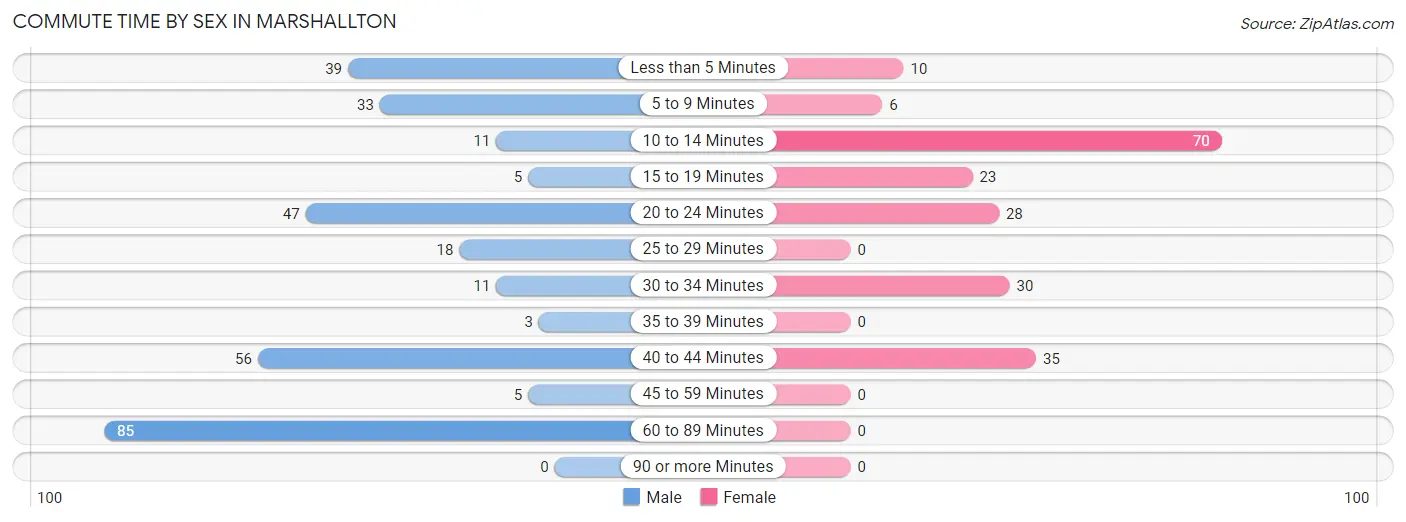
| Commute Time | Male | Female |
| Less than 5 Minutes | 39 (12.5%) | 10 (5.0%) |
| 5 to 9 Minutes | 33 (10.5%) | 6 (3.0%) |
| 10 to 14 Minutes | 11 (3.5%) | 70 (34.6%) |
| 15 to 19 Minutes | 5 (1.6%) | 23 (11.4%) |
| 20 to 24 Minutes | 47 (15.0%) | 28 (13.9%) |
| 25 to 29 Minutes | 18 (5.8%) | 0 (0.0%) |
| 30 to 34 Minutes | 11 (3.5%) | 30 (14.8%) |
| 35 to 39 Minutes | 3 (1.0%) | 0 (0.0%) |
| 40 to 44 Minutes | 56 (17.9%) | 35 (17.3%) |
| 45 to 59 Minutes | 5 (1.6%) | 0 (0.0%) |
| 60 to 89 Minutes | 85 (27.2%) | 0 (0.0%) |
| 90 or more Minutes | 0 (0.0%) | 0 (0.0%) |
Time of Departure to Work by Sex in Marshallton
The most frequent times of departure to work in Marshallton are 6:00 AM to 6:29 AM (74, 23.6%) for males and 7:00 AM to 7:29 AM (135, 66.8%) for females.
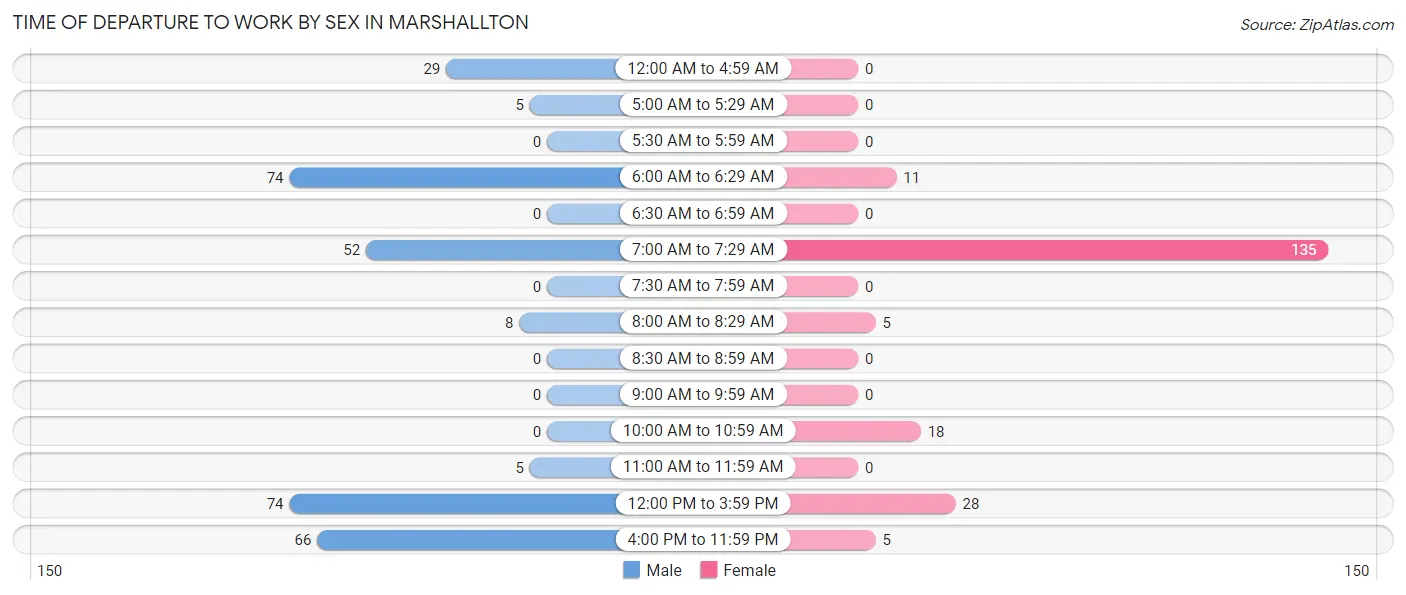
| Time of Departure | Male | Female |
| 12:00 AM to 4:59 AM | 29 (9.3%) | 0 (0.0%) |
| 5:00 AM to 5:29 AM | 5 (1.6%) | 0 (0.0%) |
| 5:30 AM to 5:59 AM | 0 (0.0%) | 0 (0.0%) |
| 6:00 AM to 6:29 AM | 74 (23.6%) | 11 (5.4%) |
| 6:30 AM to 6:59 AM | 0 (0.0%) | 0 (0.0%) |
| 7:00 AM to 7:29 AM | 52 (16.6%) | 135 (66.8%) |
| 7:30 AM to 7:59 AM | 0 (0.0%) | 0 (0.0%) |
| 8:00 AM to 8:29 AM | 8 (2.6%) | 5 (2.5%) |
| 8:30 AM to 8:59 AM | 0 (0.0%) | 0 (0.0%) |
| 9:00 AM to 9:59 AM | 0 (0.0%) | 0 (0.0%) |
| 10:00 AM to 10:59 AM | 0 (0.0%) | 18 (8.9%) |
| 11:00 AM to 11:59 AM | 5 (1.6%) | 0 (0.0%) |
| 12:00 PM to 3:59 PM | 74 (23.6%) | 28 (13.9%) |
| 4:00 PM to 11:59 PM | 66 (21.1%) | 5 (2.5%) |
| Total | 313 (100.0%) | 202 (100.0%) |
Housing Occupancy in Marshallton
Occupancy by Ownership in Marshallton
Of the total 223 dwellings in Marshallton, owner-occupied units account for 201 (90.1%), while renter-occupied units make up 22 (9.9%).
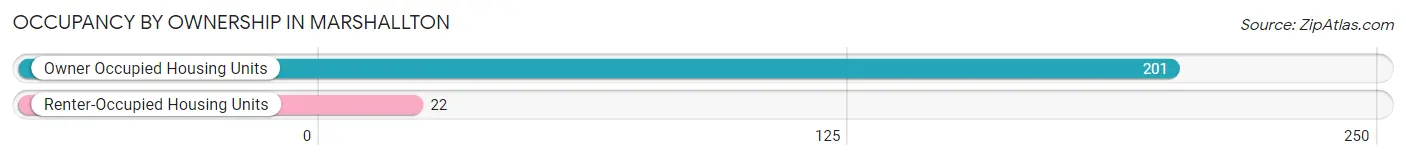
| Occupancy | # Housing Units | % Housing Units |
| Owner Occupied Housing Units | 201 | 90.1% |
| Renter-Occupied Housing Units | 22 | 9.9% |
| Total Occupied Housing Units | 223 | 100.0% |
Occupancy by Household Size in Marshallton
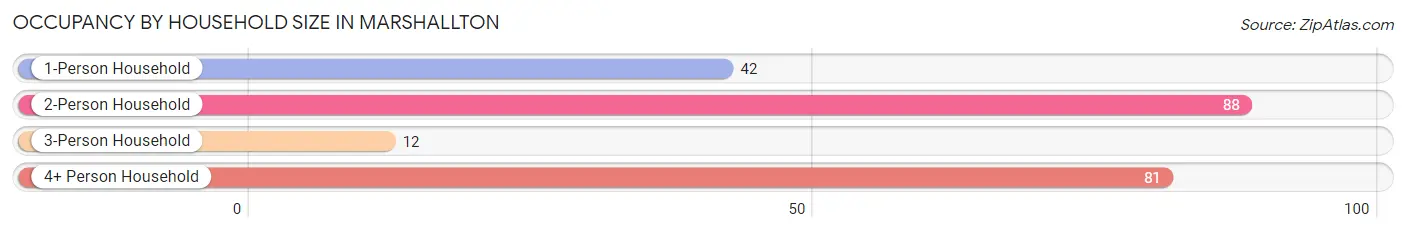
| Household Size | # Housing Units | % Housing Units |
| 1-Person Household | 42 | 18.8% |
| 2-Person Household | 88 | 39.5% |
| 3-Person Household | 12 | 5.4% |
| 4+ Person Household | 81 | 36.3% |
| Total Housing Units | 223 | 100.0% |
Occupancy by Ownership by Household Size in Marshallton
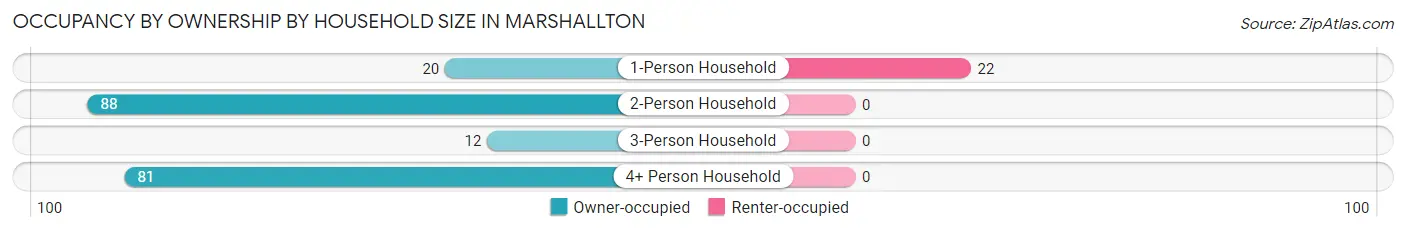
| Household Size | Owner-occupied | Renter-occupied |
| 1-Person Household | 20 (47.6%) | 22 (52.4%) |
| 2-Person Household | 88 (100.0%) | 0 (0.0%) |
| 3-Person Household | 12 (100.0%) | 0 (0.0%) |
| 4+ Person Household | 81 (100.0%) | 0 (0.0%) |
| Total Housing Units | 201 (90.1%) | 22 (9.9%) |
Occupancy by Educational Attainment in Marshallton
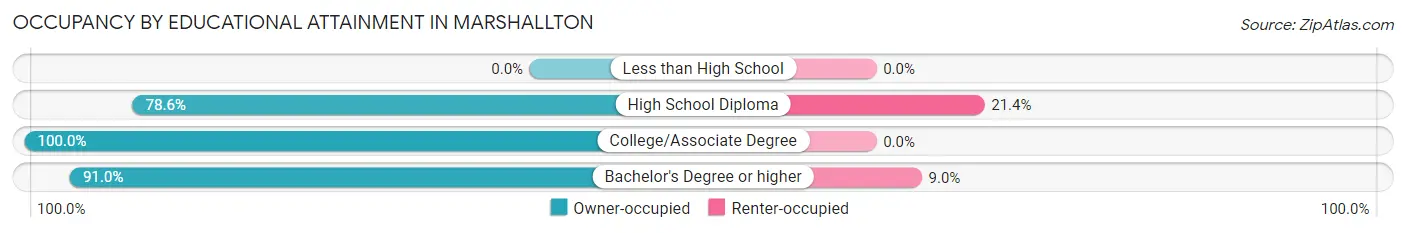
| Household Size | Owner-occupied | Renter-occupied |
| Less than High School | 0 (0.0%) | 0 (0.0%) |
| High School Diploma | 44 (78.6%) | 12 (21.4%) |
| College/Associate Degree | 56 (100.0%) | 0 (0.0%) |
| Bachelor's Degree or higher | 101 (91.0%) | 10 (9.0%) |
Occupancy by Age of Householder in Marshallton
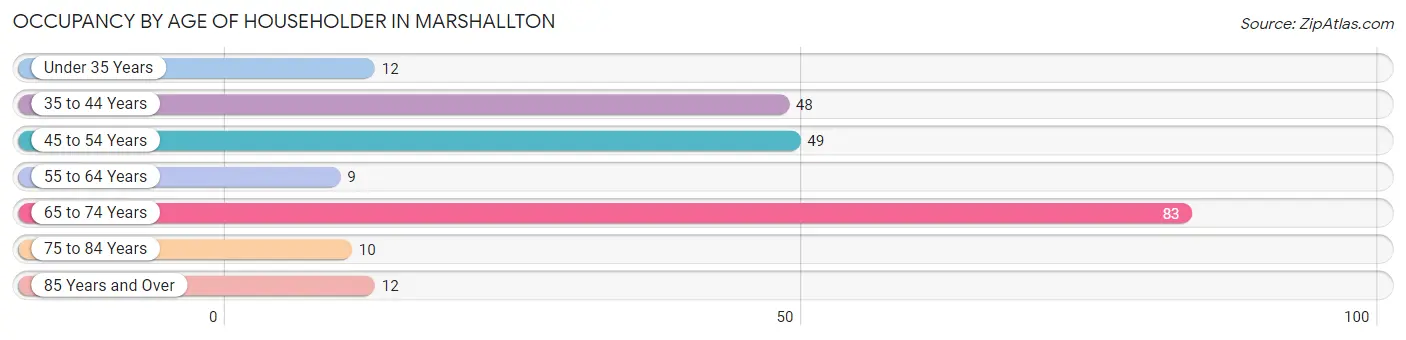
| Age Bracket | # Households | % Households |
| Under 35 Years | 12 | 5.4% |
| 35 to 44 Years | 48 | 21.5% |
| 45 to 54 Years | 49 | 22.0% |
| 55 to 64 Years | 9 | 4.0% |
| 65 to 74 Years | 83 | 37.2% |
| 75 to 84 Years | 10 | 4.5% |
| 85 Years and Over | 12 | 5.4% |
| Total | 223 | 100.0% |
Housing Finances in Marshallton
Median Income by Occupancy in Marshallton
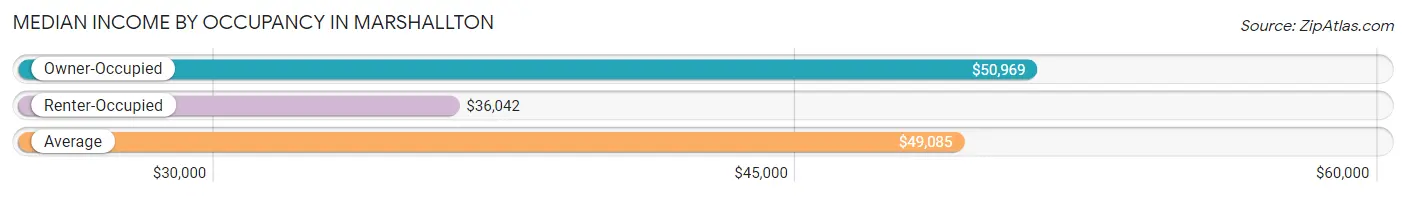
| Occupancy Type | # Households | Median Income |
| Owner-Occupied | 386 (67.5%) | $50,969 |
| Renter-Occupied | 186 (32.5%) | $36,042 |
| Average | 572 (100.0%) | $49,085 |
Occupancy by Householder Income Bracket in Marshallton
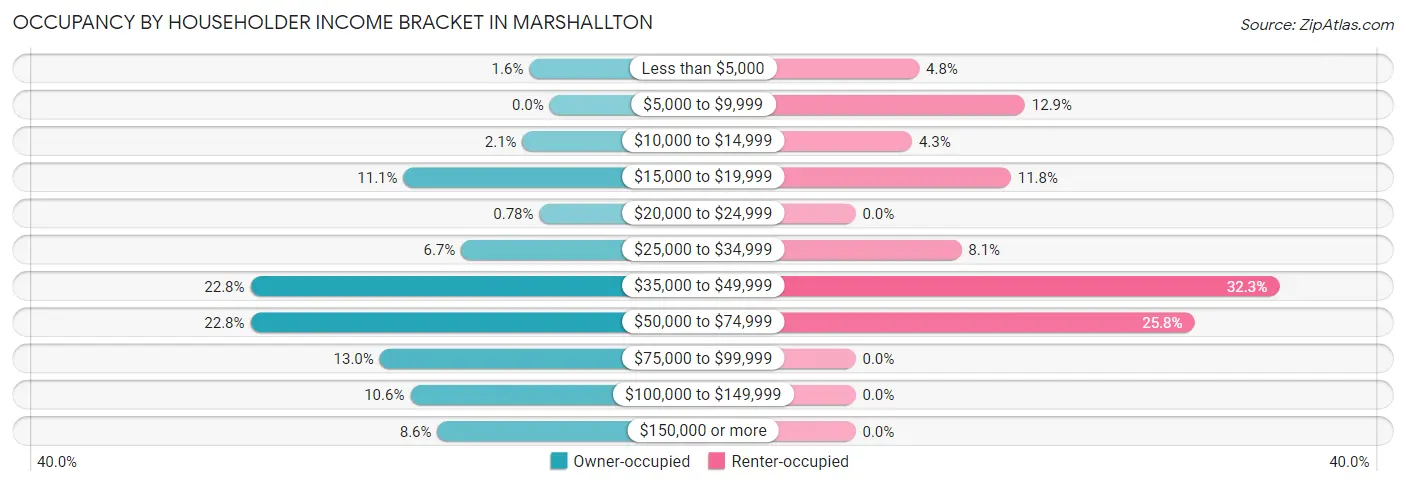
| Income Bracket | Owner-occupied | Renter-occupied |
| Less than $5,000 | 6 (1.5%) | 9 (4.8%) |
| $5,000 to $9,999 | 0 (0.0%) | 24 (12.9%) |
| $10,000 to $14,999 | 8 (2.1%) | 8 (4.3%) |
| $15,000 to $19,999 | 43 (11.1%) | 22 (11.8%) |
| $20,000 to $24,999 | 3 (0.8%) | 0 (0.0%) |
| $25,000 to $34,999 | 26 (6.7%) | 15 (8.1%) |
| $35,000 to $49,999 | 88 (22.8%) | 60 (32.3%) |
| $50,000 to $74,999 | 88 (22.8%) | 48 (25.8%) |
| $75,000 to $99,999 | 50 (13.0%) | 0 (0.0%) |
| $100,000 to $149,999 | 41 (10.6%) | 0 (0.0%) |
| $150,000 or more | 33 (8.6%) | 0 (0.0%) |
| Total | 386 (100.0%) | 186 (100.0%) |
Monthly Housing Cost Tiers in Marshallton
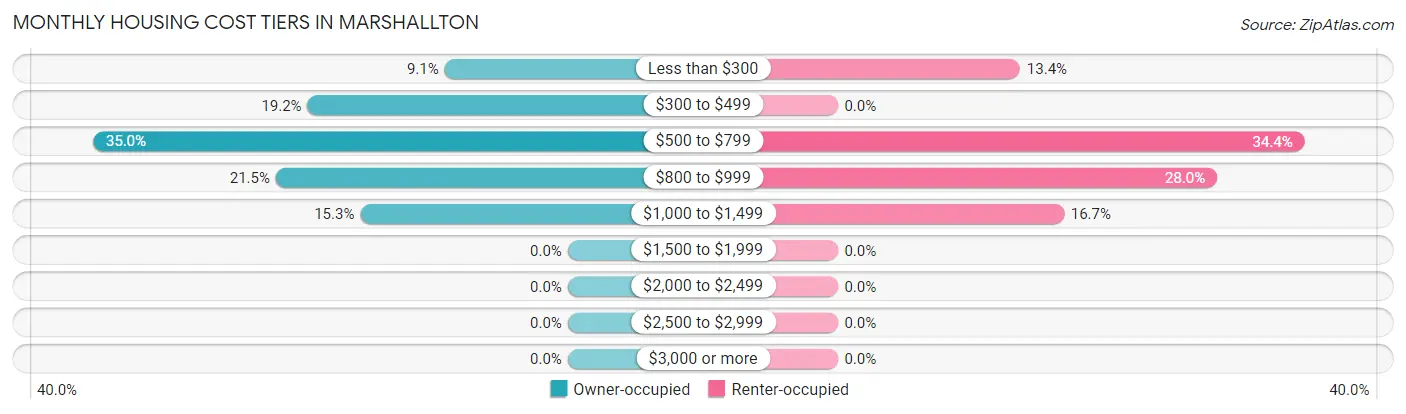
| Monthly Cost | Owner-occupied | Renter-occupied |
| Less than $300 | 35 (9.1%) | 25 (13.4%) |
| $300 to $499 | 74 (19.2%) | 0 (0.0%) |
| $500 to $799 | 135 (35.0%) | 64 (34.4%) |
| $800 to $999 | 83 (21.5%) | 52 (28.0%) |
| $1,000 to $1,499 | 59 (15.3%) | 31 (16.7%) |
| $1,500 to $1,999 | 0 (0.0%) | 0 (0.0%) |
| $2,000 to $2,499 | 0 (0.0%) | 0 (0.0%) |
| $2,500 to $2,999 | 0 (0.0%) | 0 (0.0%) |
| $3,000 or more | 0 (0.0%) | 0 (0.0%) |
| Total | 386 (100.0%) | 186 (100.0%) |
Physical Housing Characteristics in Marshallton
Housing Structures in Marshallton
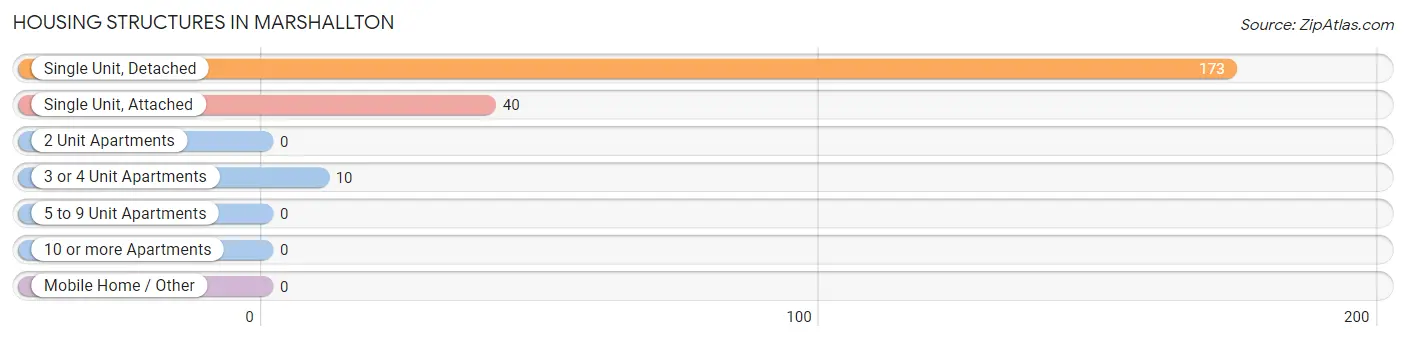
| Structure Type | # Housing Units | % Housing Units |
| Single Unit, Detached | 173 | 77.6% |
| Single Unit, Attached | 40 | 17.9% |
| 2 Unit Apartments | 0 | 0.0% |
| 3 or 4 Unit Apartments | 10 | 4.5% |
| 5 to 9 Unit Apartments | 0 | 0.0% |
| 10 or more Apartments | 0 | 0.0% |
| Mobile Home / Other | 0 | 0.0% |
| Total | 223 | 100.0% |
Housing Structures by Occupancy in Marshallton
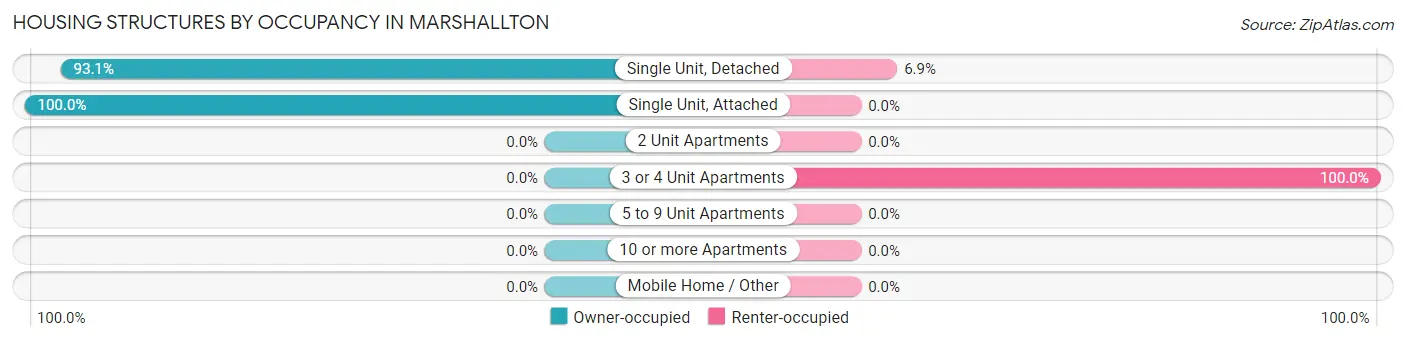
| Structure Type | Owner-occupied | Renter-occupied |
| Single Unit, Detached | 161 (93.1%) | 12 (6.9%) |
| Single Unit, Attached | 40 (100.0%) | 0 (0.0%) |
| 2 Unit Apartments | 0 (0.0%) | 0 (0.0%) |
| 3 or 4 Unit Apartments | 0 (0.0%) | 10 (100.0%) |
| 5 to 9 Unit Apartments | 0 (0.0%) | 0 (0.0%) |
| 10 or more Apartments | 0 (0.0%) | 0 (0.0%) |
| Mobile Home / Other | 0 (0.0%) | 0 (0.0%) |
| Total | 201 (90.1%) | 22 (9.9%) |
Housing Structures by Number of Rooms in Marshallton
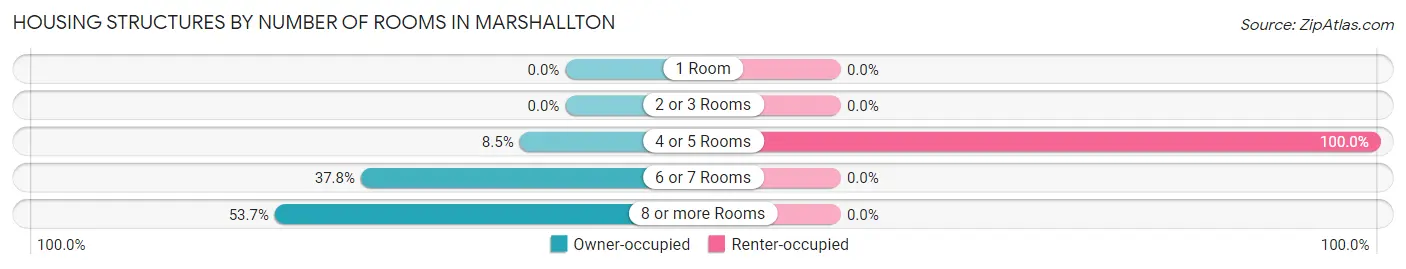
| Number of Rooms | Owner-occupied | Renter-occupied |
| 1 Room | 0 (0.0%) | 0 (0.0%) |
| 2 or 3 Rooms | 0 (0.0%) | 0 (0.0%) |
| 4 or 5 Rooms | 17 (8.5%) | 22 (100.0%) |
| 6 or 7 Rooms | 76 (37.8%) | 0 (0.0%) |
| 8 or more Rooms | 108 (53.7%) | 0 (0.0%) |
| Total | 201 (100.0%) | 22 (100.0%) |
Housing Structure by Heating Type in Marshallton
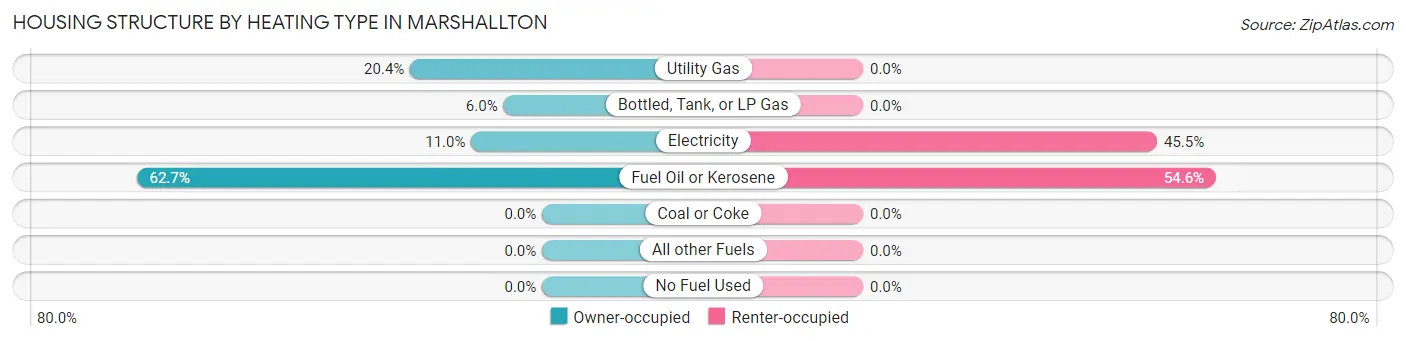
| Heating Type | Owner-occupied | Renter-occupied |
| Utility Gas | 41 (20.4%) | 0 (0.0%) |
| Bottled, Tank, or LP Gas | 12 (6.0%) | 0 (0.0%) |
| Electricity | 22 (11.0%) | 10 (45.5%) |
| Fuel Oil or Kerosene | 126 (62.7%) | 12 (54.5%) |
| Coal or Coke | 0 (0.0%) | 0 (0.0%) |
| All other Fuels | 0 (0.0%) | 0 (0.0%) |
| No Fuel Used | 0 (0.0%) | 0 (0.0%) |
| Total | 201 (100.0%) | 22 (100.0%) |
Household Vehicle Usage in Marshallton
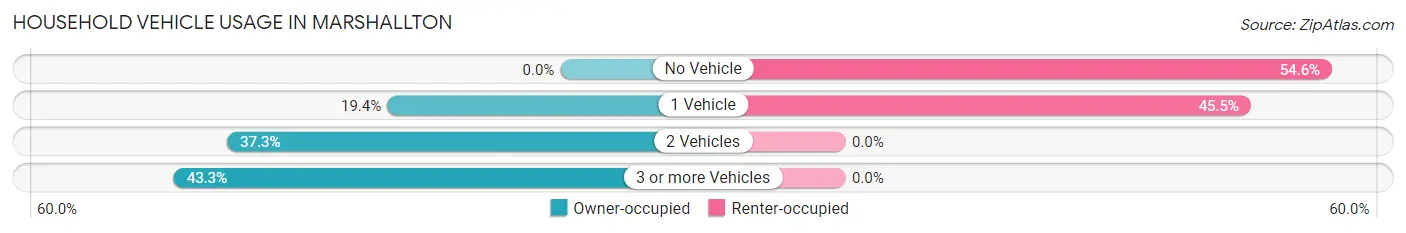
| Vehicles per Household | Owner-occupied | Renter-occupied |
| No Vehicle | 0 (0.0%) | 12 (54.5%) |
| 1 Vehicle | 39 (19.4%) | 10 (45.5%) |
| 2 Vehicles | 75 (37.3%) | 0 (0.0%) |
| 3 or more Vehicles | 87 (43.3%) | 0 (0.0%) |
| Total | 201 (100.0%) | 22 (100.0%) |
Real Estate & Mortgages in Marshallton
Real Estate and Mortgage Overview in Marshallton
| Characteristic | Without Mortgage | With Mortgage |
| Housing Units | 168 | 218 |
| Median Property Value | $83,300 | $59,800 |
| Median Household Income | $41,204 | $0 |
| Monthly Housing Costs | $474 | $0 |
| Real Estate Taxes | $803 | $0 |
Property Value by Mortgage Status in Marshallton
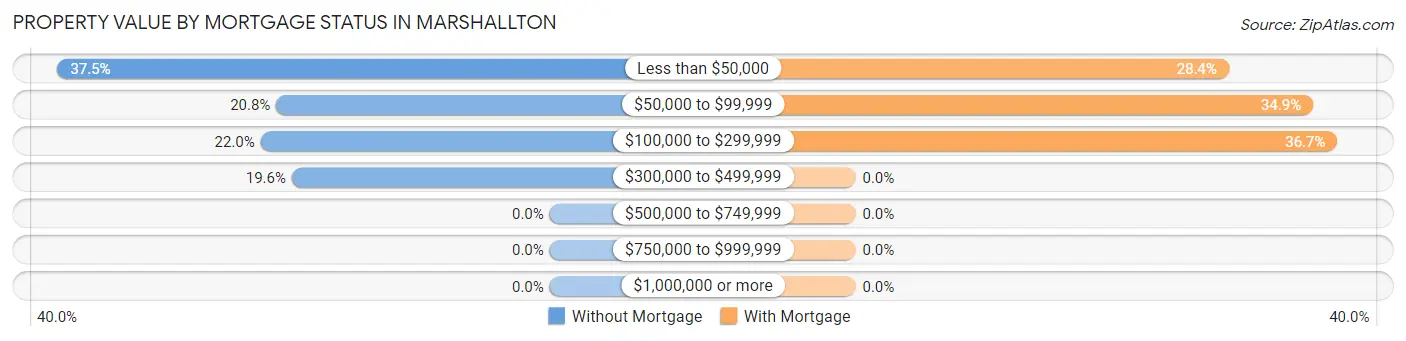
| Property Value | Without Mortgage | With Mortgage |
| Less than $50,000 | 63 (37.5%) | 62 (28.4%) |
| $50,000 to $99,999 | 35 (20.8%) | 76 (34.9%) |
| $100,000 to $299,999 | 37 (22.0%) | 80 (36.7%) |
| $300,000 to $499,999 | 33 (19.6%) | 0 (0.0%) |
| $500,000 to $749,999 | 0 (0.0%) | 0 (0.0%) |
| $750,000 to $999,999 | 0 (0.0%) | 0 (0.0%) |
| $1,000,000 or more | 0 (0.0%) | 0 (0.0%) |
| Total | 168 (100.0%) | 218 (100.0%) |
Household Income by Mortgage Status in Marshallton
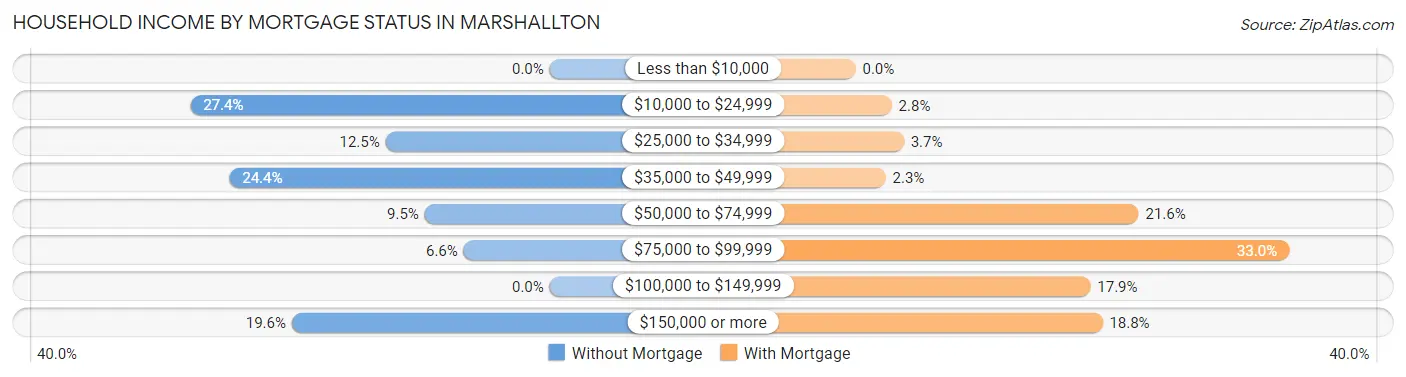
| Household Income | Without Mortgage | With Mortgage |
| Less than $10,000 | 0 (0.0%) | 0 (0.0%) |
| $10,000 to $24,999 | 46 (27.4%) | 6 (2.8%) |
| $25,000 to $34,999 | 21 (12.5%) | 8 (3.7%) |
| $35,000 to $49,999 | 41 (24.4%) | 5 (2.3%) |
| $50,000 to $74,999 | 16 (9.5%) | 47 (21.6%) |
| $75,000 to $99,999 | 11 (6.6%) | 72 (33.0%) |
| $100,000 to $149,999 | 0 (0.0%) | 39 (17.9%) |
| $150,000 or more | 33 (19.6%) | 41 (18.8%) |
| Total | 168 (100.0%) | 218 (100.0%) |
Property Value to Household Income Ratio in Marshallton
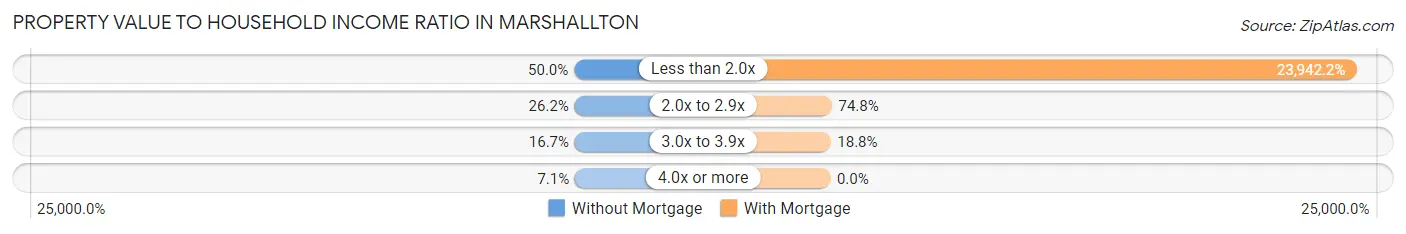
| Value-to-Income Ratio | Without Mortgage | With Mortgage |
| Less than 2.0x | 84 (50.0%) | 52,194 (23,942.2%) |
| 2.0x to 2.9x | 44 (26.2%) | 163 (74.8%) |
| 3.0x to 3.9x | 28 (16.7%) | 41 (18.8%) |
| 4.0x or more | 12 (7.1%) | 0 (0.0%) |
| Total | 168 (100.0%) | 218 (100.0%) |
Real Estate Taxes by Mortgage Status in Marshallton
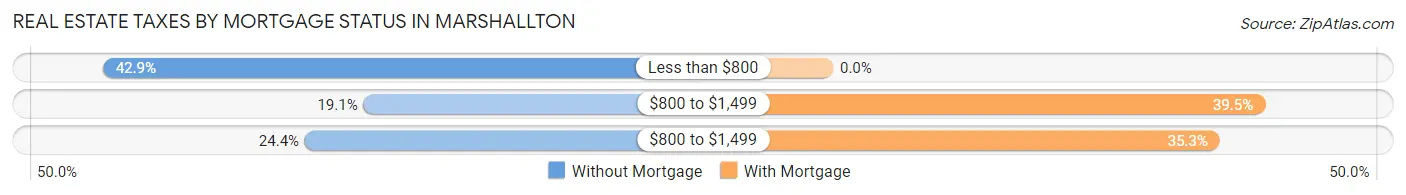
| Property Taxes | Without Mortgage | With Mortgage |
| Less than $800 | 72 (42.9%) | 0 (0.0%) |
| $800 to $1,499 | 32 (19.1%) | 86 (39.5%) |
| $800 to $1,499 | 41 (24.4%) | 77 (35.3%) |
| Total | 168 (100.0%) | 218 (100.0%) |
Health & Disability in Marshallton
Health Insurance Coverage by Age in Marshallton
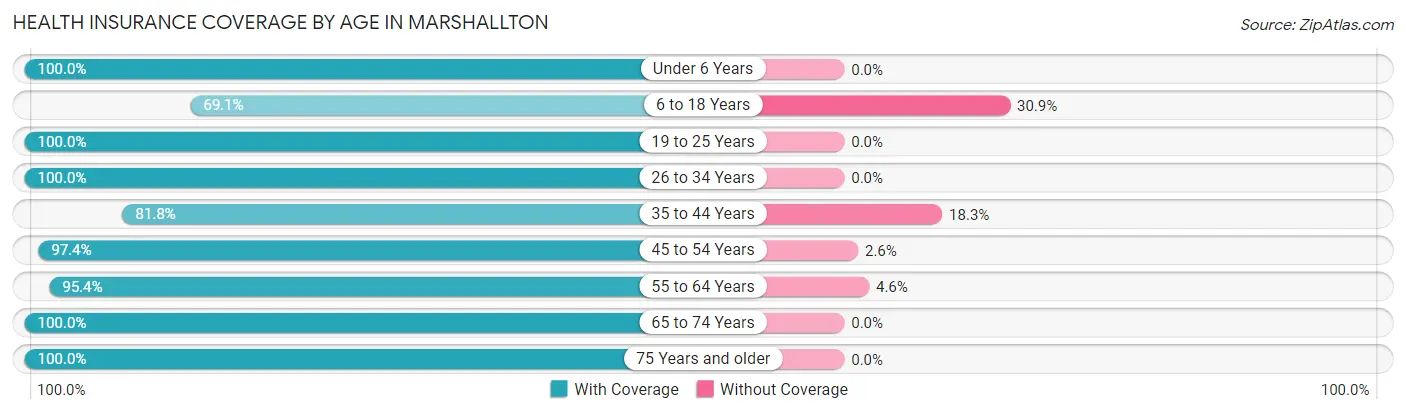
| Age Bracket | With Coverage | Without Coverage |
| Under 6 Years | 63 (100.0%) | 0 (0.0%) |
| 6 to 18 Years | 76 (69.1%) | 34 (30.9%) |
| 19 to 25 Years | 143 (100.0%) | 0 (0.0%) |
| 26 to 34 Years | 123 (100.0%) | 0 (0.0%) |
| 35 to 44 Years | 103 (81.8%) | 23 (18.2%) |
| 45 to 54 Years | 190 (97.4%) | 5 (2.6%) |
| 55 to 64 Years | 269 (95.4%) | 13 (4.6%) |
| 65 to 74 Years | 120 (100.0%) | 0 (0.0%) |
| 75 Years and older | 66 (100.0%) | 0 (0.0%) |
| Total | 1,153 (93.9%) | 75 (6.1%) |
Health Insurance Coverage by Citizenship Status in Marshallton
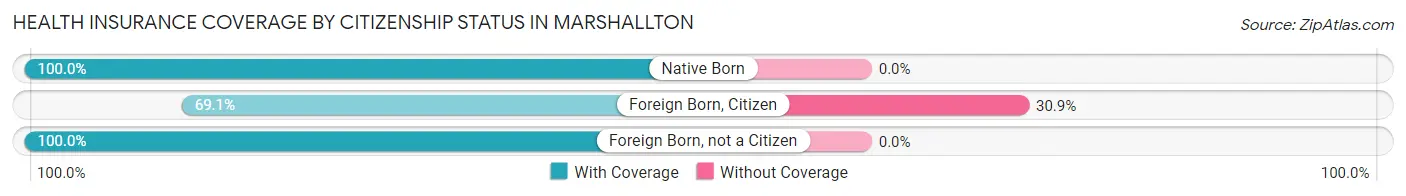
| Citizenship Status | With Coverage | Without Coverage |
| Native Born | 63 (100.0%) | 0 (0.0%) |
| Foreign Born, Citizen | 76 (69.1%) | 34 (30.9%) |
| Foreign Born, not a Citizen | 143 (100.0%) | 0 (0.0%) |
Health Insurance Coverage by Household Income in Marshallton
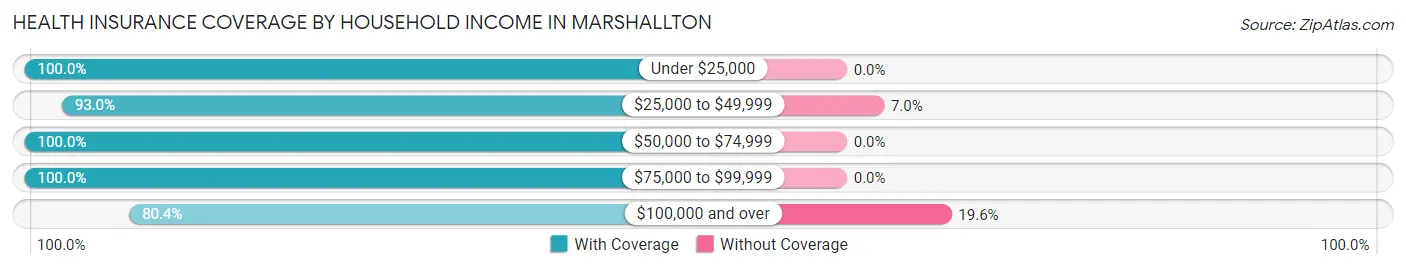
| Household Income | With Coverage | Without Coverage |
| Under $25,000 | 123 (100.0%) | 0 (0.0%) |
| $25,000 to $49,999 | 347 (93.0%) | 26 (7.0%) |
| $50,000 to $74,999 | 285 (100.0%) | 0 (0.0%) |
| $75,000 to $99,999 | 197 (100.0%) | 0 (0.0%) |
| $100,000 and over | 201 (80.4%) | 49 (19.6%) |
Public vs Private Health Insurance Coverage by Age in Marshallton
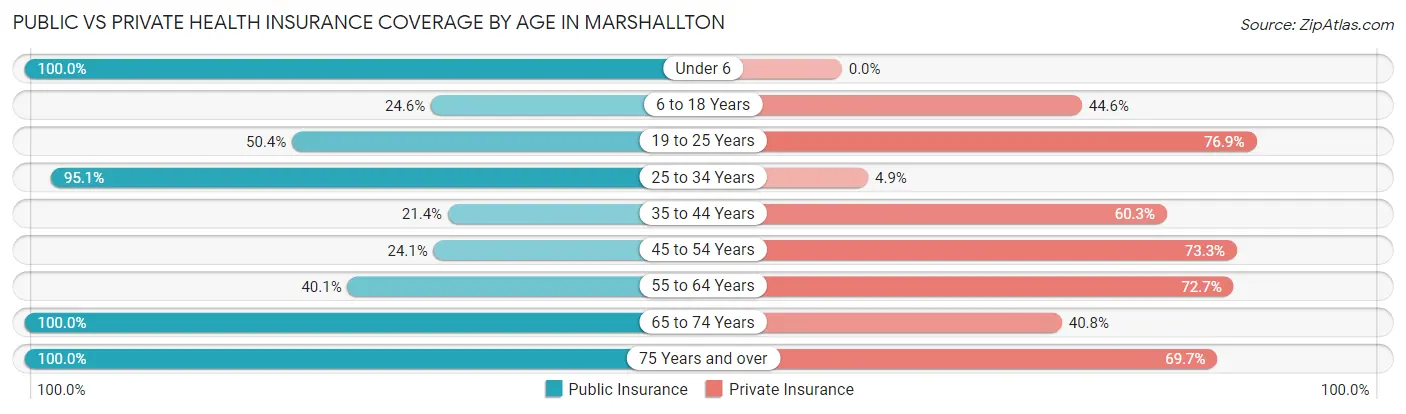
| Age Bracket | Public Insurance | Private Insurance |
| Under 6 | 63 (100.0%) | 0 (0.0%) |
| 6 to 18 Years | 27 (24.5%) | 49 (44.6%) |
| 19 to 25 Years | 72 (50.3%) | 110 (76.9%) |
| 25 to 34 Years | 117 (95.1%) | 6 (4.9%) |
| 35 to 44 Years | 27 (21.4%) | 76 (60.3%) |
| 45 to 54 Years | 47 (24.1%) | 143 (73.3%) |
| 55 to 64 Years | 113 (40.1%) | 205 (72.7%) |
| 65 to 74 Years | 120 (100.0%) | 49 (40.8%) |
| 75 Years and over | 66 (100.0%) | 46 (69.7%) |
| Total | 652 (53.1%) | 684 (55.7%) |
Disability Status by Sex by Age in Marshallton
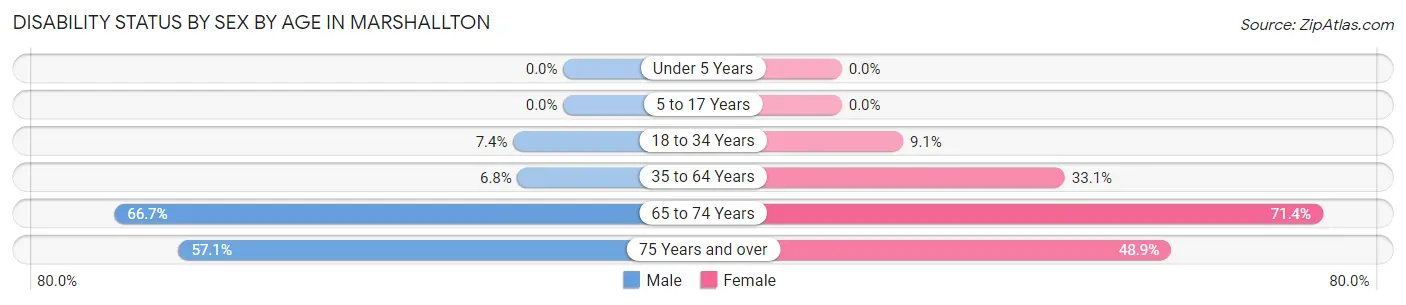
| Age Bracket | Male | Female |
| Under 5 Years | 0 (0.0%) | 0 (0.0%) |
| 5 to 17 Years | 0 (0.0%) | 0 (0.0%) |
| 18 to 34 Years | 13 (7.4%) | 10 (9.1%) |
| 35 to 64 Years | 19 (6.8%) | 107 (33.1%) |
| 65 to 74 Years | 38 (66.7%) | 45 (71.4%) |
| 75 Years and over | 12 (57.1%) | 22 (48.9%) |
Disability Class by Sex by Age in Marshallton
Disability Class: Hearing Difficulty
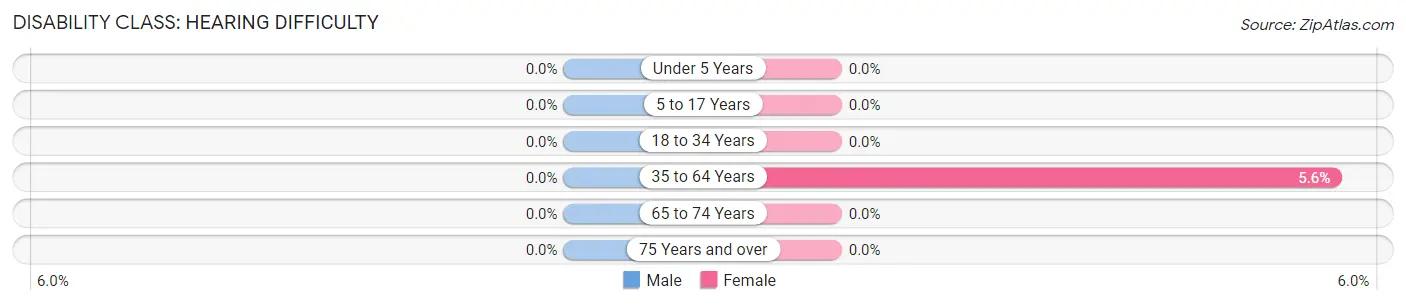
| Age Bracket | Male | Female |
| Under 5 Years | 0 (0.0%) | 0 (0.0%) |
| 5 to 17 Years | 0 (0.0%) | 0 (0.0%) |
| 18 to 34 Years | 0 (0.0%) | 0 (0.0%) |
| 35 to 64 Years | 0 (0.0%) | 18 (5.6%) |
| 65 to 74 Years | 0 (0.0%) | 0 (0.0%) |
| 75 Years and over | 0 (0.0%) | 0 (0.0%) |
Disability Class: Vision Difficulty
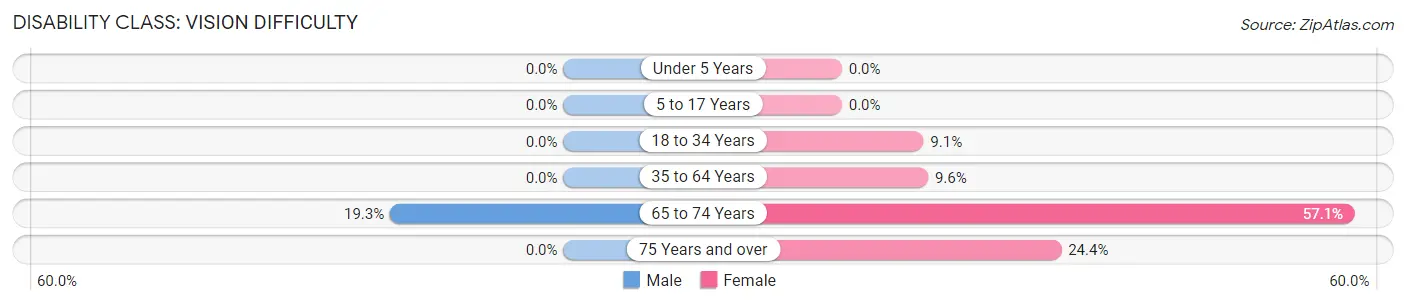
| Age Bracket | Male | Female |
| Under 5 Years | 0 (0.0%) | 0 (0.0%) |
| 5 to 17 Years | 0 (0.0%) | 0 (0.0%) |
| 18 to 34 Years | 0 (0.0%) | 10 (9.1%) |
| 35 to 64 Years | 0 (0.0%) | 31 (9.6%) |
| 65 to 74 Years | 11 (19.3%) | 36 (57.1%) |
| 75 Years and over | 0 (0.0%) | 11 (24.4%) |
Disability Class: Cognitive Difficulty
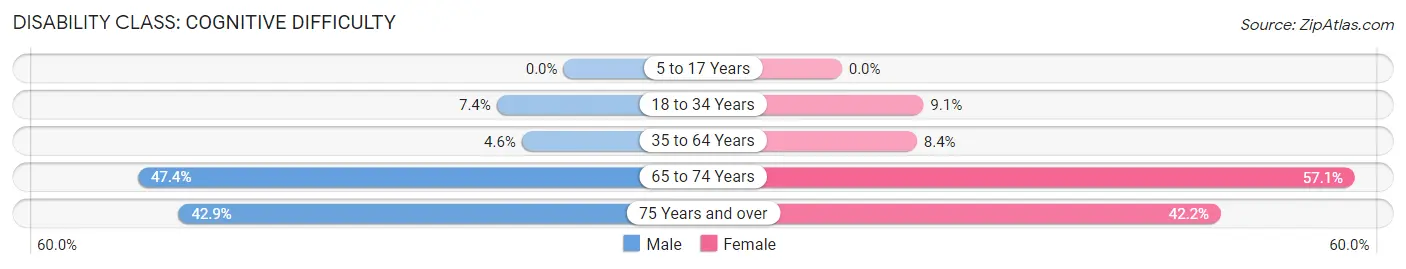
| Age Bracket | Male | Female |
| 5 to 17 Years | 0 (0.0%) | 0 (0.0%) |
| 18 to 34 Years | 13 (7.4%) | 10 (9.1%) |
| 35 to 64 Years | 13 (4.6%) | 27 (8.4%) |
| 65 to 74 Years | 27 (47.4%) | 36 (57.1%) |
| 75 Years and over | 9 (42.9%) | 19 (42.2%) |
Disability Class: Ambulatory Difficulty
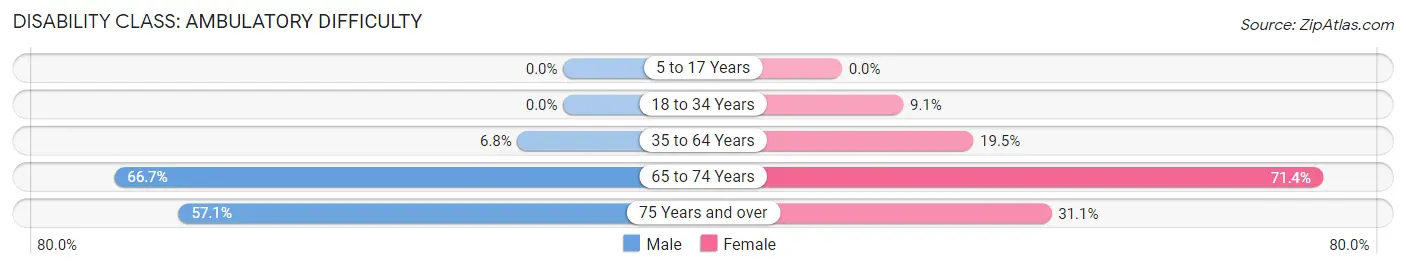
| Age Bracket | Male | Female |
| 5 to 17 Years | 0 (0.0%) | 0 (0.0%) |
| 18 to 34 Years | 0 (0.0%) | 10 (9.1%) |
| 35 to 64 Years | 19 (6.8%) | 63 (19.5%) |
| 65 to 74 Years | 38 (66.7%) | 45 (71.4%) |
| 75 Years and over | 12 (57.1%) | 14 (31.1%) |
Disability Class: Self-Care Difficulty
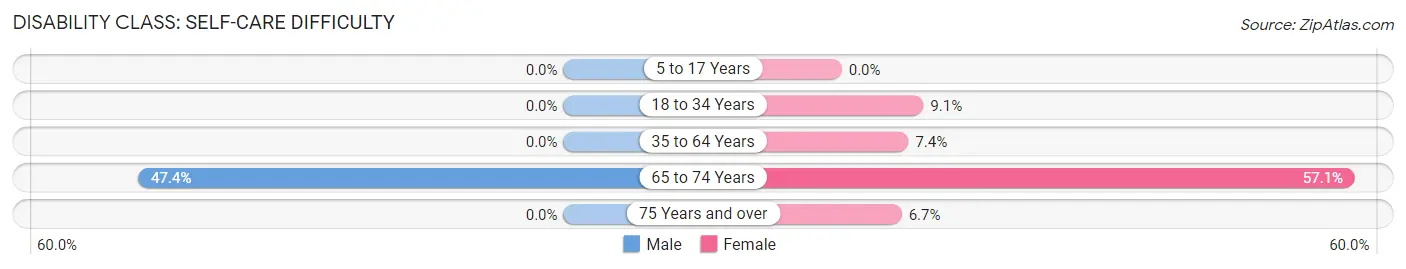
| Age Bracket | Male | Female |
| 5 to 17 Years | 0 (0.0%) | 0 (0.0%) |
| 18 to 34 Years | 0 (0.0%) | 10 (9.1%) |
| 35 to 64 Years | 0 (0.0%) | 24 (7.4%) |
| 65 to 74 Years | 27 (47.4%) | 36 (57.1%) |
| 75 Years and over | 0 (0.0%) | 3 (6.7%) |
Technology Access in Marshallton
Computing Device Access in Marshallton
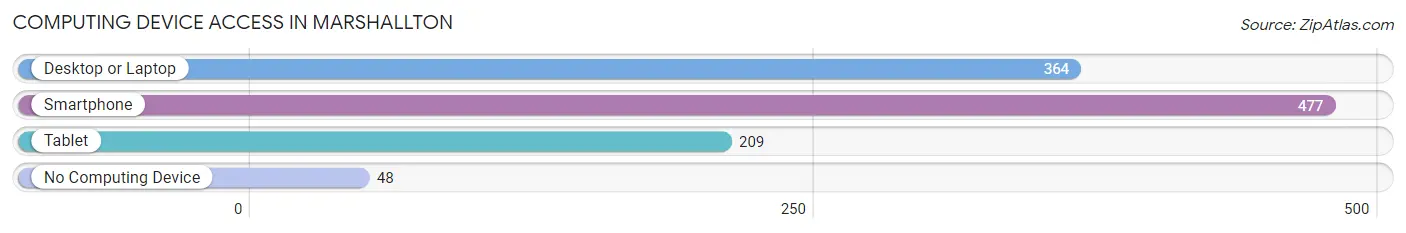
| Device Type | # Households | % Households |
| Desktop or Laptop | 364 | 63.6% |
| Smartphone | 477 | 83.4% |
| Tablet | 209 | 36.5% |
| No Computing Device | 48 | 8.4% |
| Total | 572 | 100.0% |
Internet Access in Marshallton
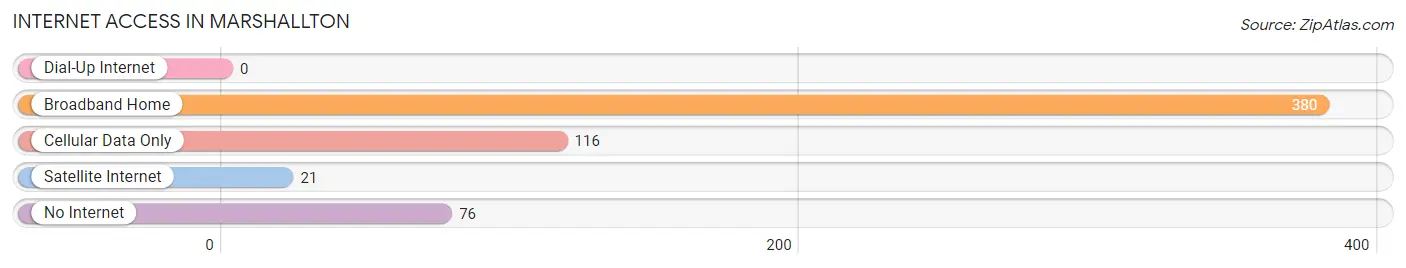
| Internet Type | # Households | % Households |
| Dial-Up Internet | 0 | 0.0% |
| Broadband Home | 380 | 66.4% |
| Cellular Data Only | 116 | 20.3% |
| Satellite Internet | 21 | 3.7% |
| No Internet | 76 | 13.3% |
| Total | 572 | 100.0% |
Marshallton Summary
Marshallton is a small unincorporated community located in West Bradford Township, Chester County, Pennsylvania. It is situated along the West Branch of the Brandywine Creek, approximately 8 miles west of the city of West Chester. The population of Marshallton was estimated to be 1,845 in 2019.
History
Marshallton was founded in 1717 by William Marshall, a Quaker from England. The area was originally known as Marshall’s Town, and was later shortened to Marshallton. The community was a farming village for many years, and the Marshall family owned much of the land in the area. In the late 19th century, Marshallton began to develop into a small industrial center, with several mills and factories located along the Brandywine Creek.
Geography
Marshallton is located in West Bradford Township, Chester County, Pennsylvania. It is situated along the West Branch of the Brandywine Creek, approximately 8 miles west of the city of West Chester. The community is bordered by the townships of East Bradford, West Goshen, and East Caln. The terrain of the area is mostly rolling hills, with some flat areas along the creek.
Economy
Marshallton’s economy is largely based on agriculture and light industry. The area is home to several small businesses, including a few restaurants, a grocery store, and a hardware store. The community also has a few small manufacturing plants, including a paper mill and a plastics factory.
Demographics
As of 2019, the population of Marshallton was estimated to be 1,845. The racial makeup of the community is 94.3% White, 2.2% African American, 0.7% Asian, 0.3% Native American, and 2.5% other. The median household income in Marshallton is $68,945, and the median age is 43.3 years.
Conclusion
Marshallton is a small unincorporated community located in West Bradford Township, Chester County, Pennsylvania. It was founded in 1717 by William Marshall, and has since developed into a small industrial center. The economy of Marshallton is largely based on agriculture and light industry, and the population of the community is estimated to be 1,845. Marshallton is a diverse community, with a median household income of $68,945 and a median age of 43.3 years.
Common Questions
What is Per Capita Income in Marshallton?
Per Capita income in Marshallton is $25,460.
What is the Median Family Income in Marshallton?
Median Family Income in Marshallton is $63,015.
What is the Median Household income in Marshallton?
Median Household Income in Marshallton is $49,085.
What is Inequality or Gini Index in Marshallton?
Inequality or Gini Index in Marshallton is 0.37.
What is the Total Population of Marshallton?
Total Population of Marshallton is 1,228.
What is the Total Male Population of Marshallton?
Total Male Population of Marshallton is 552.
What is the Total Female Population of Marshallton?
Total Female Population of Marshallton is 676.
What is the Ratio of Males per 100 Females in Marshallton?
There are 81.66 Males per 100 Females in Marshallton.
What is the Ratio of Females per 100 Males in Marshallton?
There are 122.46 Females per 100 Males in Marshallton.
What is the Median Population Age in Marshallton?
Median Population Age in Marshallton is 48.9 Years.
What is the Average Family Size in Marshallton
Average Family Size in Marshallton is 3.2 People.
What is the Average Household Size in Marshallton
Average Household Size in Marshallton is 2.1 People.
How Large is the Labor Force in Marshallton?
There are 619 People in the Labor Forcein in Marshallton.
What is the Percentage of People in the Labor Force in Marshallton?
55.3% of People are in the Labor Force in Marshallton.
What is the Unemployment Rate in Marshallton?
Unemployment Rate in Marshallton is 14.2%.