Highland Beach, MD Map & Demographics
Highland Beach Map
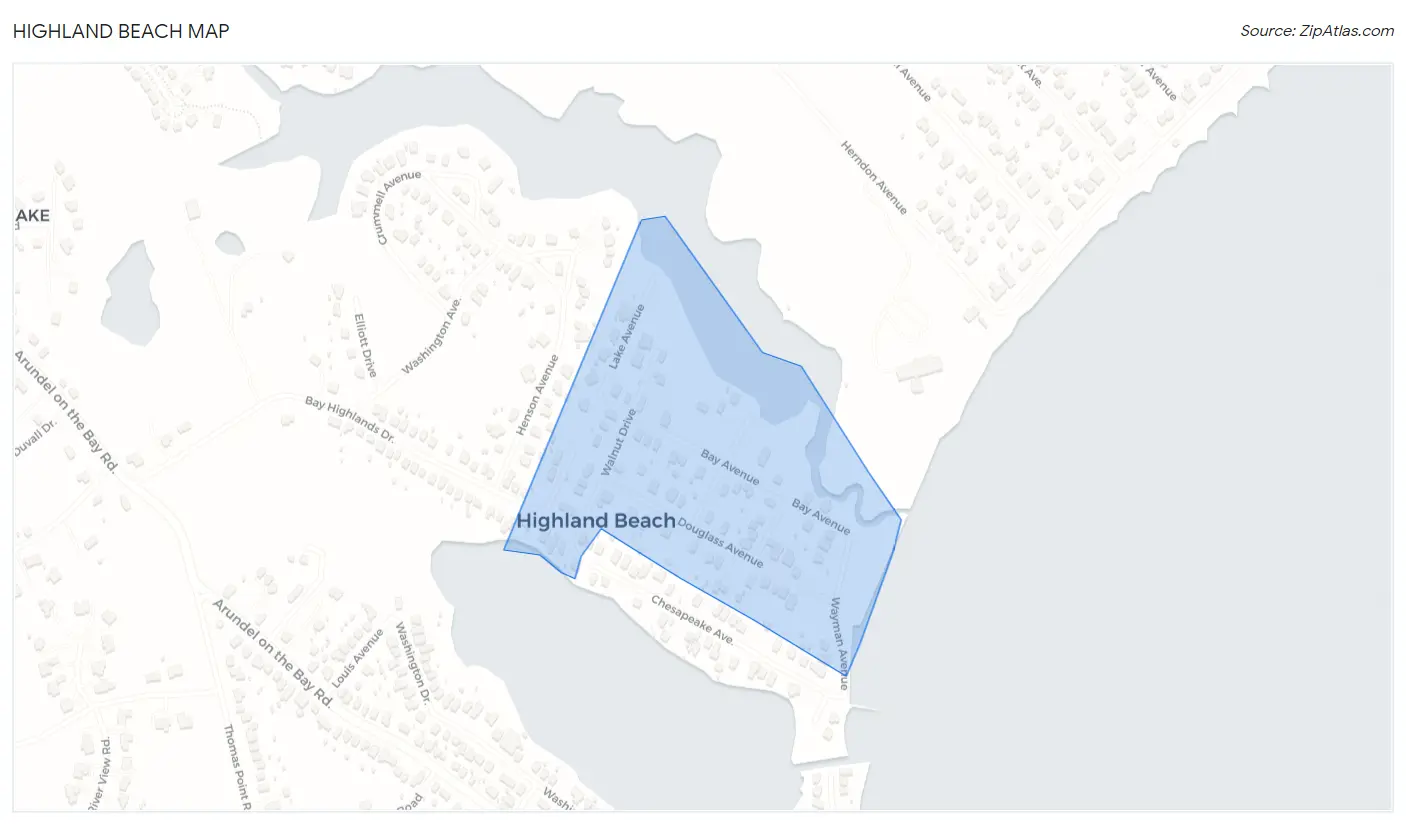
Highland Beach Overview
$98,695
PER CAPITA INCOME
$166,250
AVG FAMILY INCOME
$158,611
AVG HOUSEHOLD INCOME
31.7%
WAGE / INCOME GAP [ % ]
68.3¢/ $1
WAGE / INCOME GAP [ $ ]
0.34
INEQUALITY / GINI INDEX
62
TOTAL POPULATION
26
MALE POPULATION
36
FEMALE POPULATION
72.22
MALES / 100 FEMALES
138.46
FEMALES / 100 MALES
71.3
MEDIAN AGE
2.4
AVG FAMILY SIZE
1.8
AVG HOUSEHOLD SIZE
31
LABOR FORCE [ PEOPLE ]
53.4%
PERCENT IN LABOR FORCE
Income in Highland Beach
Income Overview in Highland Beach
Per Capita Income in Highland Beach is $98,695, while median incomes of families and households are $166,250 and $158,611 respectively.
| Characteristic | Number | Measure |
| Per Capita Income | 62 | $98,695 |
| Median Family Income | 19 | $166,250 |
| Mean Family Income | 19 | $205,042 |
| Median Household Income | 34 | $158,611 |
| Mean Household Income | 34 | $178,332 |
| Income Deficit | 19 | $0 |
| Wage / Income Gap (%) | 62 | 31.72% |
| Wage / Income Gap ($) | 62 | 68.28¢ per $1 |
| Gini / Inequality Index | 62 | 0.34 |
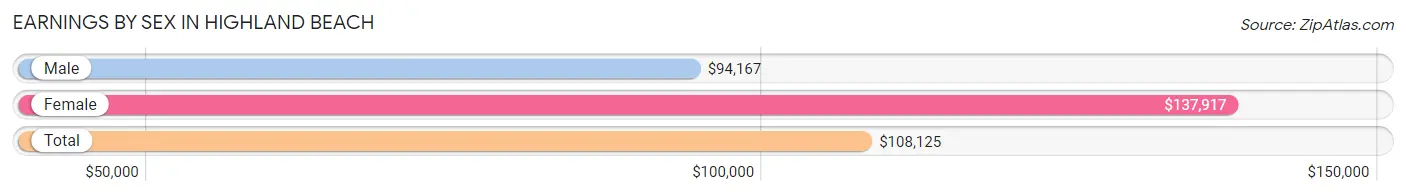
Earnings by Sex in Highland Beach
Average Earnings in Highland Beach are $108,125, $94,167 for men and $137,917 for women, a difference of 31.7%.
| Sex | Number | Average Earnings |
| Male | 10 (30.3%) | $94,167 |
| Female | 23 (69.7%) | $137,917 |
| Total | 33 (100.0%) | $108,125 |
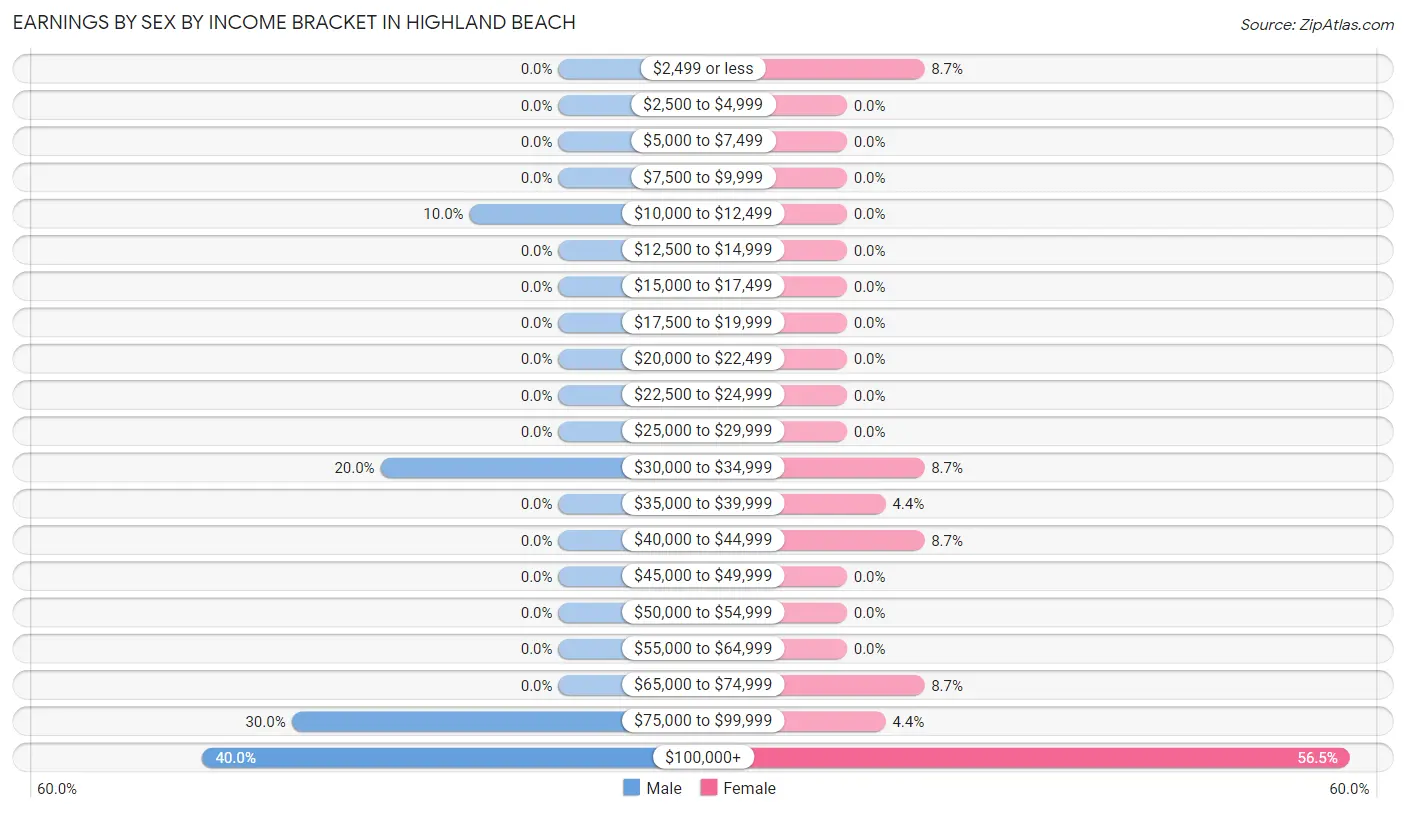
Earnings by Sex by Income Bracket in Highland Beach
The most common earnings brackets in Highland Beach are $100,000+ for men (4 | 40.0%) and $100,000+ for women (13 | 56.5%).
| Income | Male | Female |
| $2,499 or less | 0 (0.0%) | 2 (8.7%) |
| $2,500 to $4,999 | 0 (0.0%) | 0 (0.0%) |
| $5,000 to $7,499 | 0 (0.0%) | 0 (0.0%) |
| $7,500 to $9,999 | 0 (0.0%) | 0 (0.0%) |
| $10,000 to $12,499 | 1 (10.0%) | 0 (0.0%) |
| $12,500 to $14,999 | 0 (0.0%) | 0 (0.0%) |
| $15,000 to $17,499 | 0 (0.0%) | 0 (0.0%) |
| $17,500 to $19,999 | 0 (0.0%) | 0 (0.0%) |
| $20,000 to $22,499 | 0 (0.0%) | 0 (0.0%) |
| $22,500 to $24,999 | 0 (0.0%) | 0 (0.0%) |
| $25,000 to $29,999 | 0 (0.0%) | 0 (0.0%) |
| $30,000 to $34,999 | 2 (20.0%) | 2 (8.7%) |
| $35,000 to $39,999 | 0 (0.0%) | 1 (4.3%) |
| $40,000 to $44,999 | 0 (0.0%) | 2 (8.7%) |
| $45,000 to $49,999 | 0 (0.0%) | 0 (0.0%) |
| $50,000 to $54,999 | 0 (0.0%) | 0 (0.0%) |
| $55,000 to $64,999 | 0 (0.0%) | 0 (0.0%) |
| $65,000 to $74,999 | 0 (0.0%) | 2 (8.7%) |
| $75,000 to $99,999 | 3 (30.0%) | 1 (4.3%) |
| $100,000+ | 4 (40.0%) | 13 (56.5%) |
| Total | 10 (100.0%) | 23 (100.0%) |
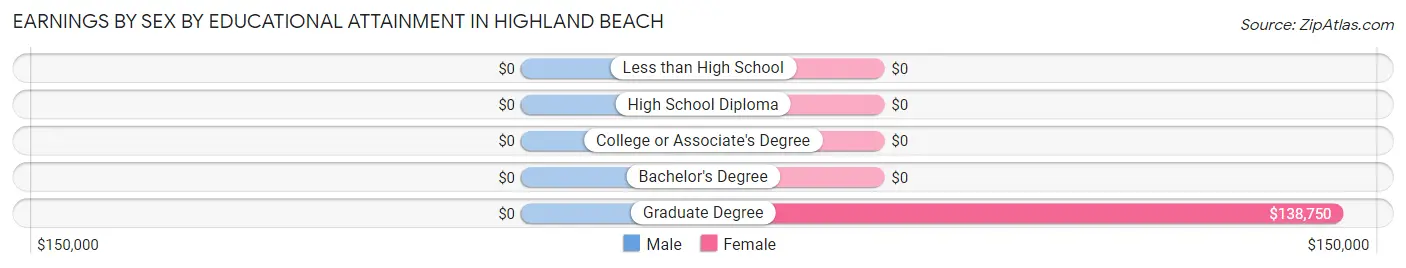
Earnings by Sex by Educational Attainment in Highland Beach
| Educational Attainment | Male Income | Female Income |
| Less than High School | - | - |
| High School Diploma | - | - |
| College or Associate's Degree | - | - |
| Bachelor's Degree | - | - |
| Graduate Degree | - | - |
| Total | $94,167 | $138,194 |
Family Income in Highland Beach
Family Income Brackets in Highland Beach
According to the Highland Beach family income data, there are 8 families falling into the $200,000+ income range, which is the most common income bracket and makes up 42.1% of all families.
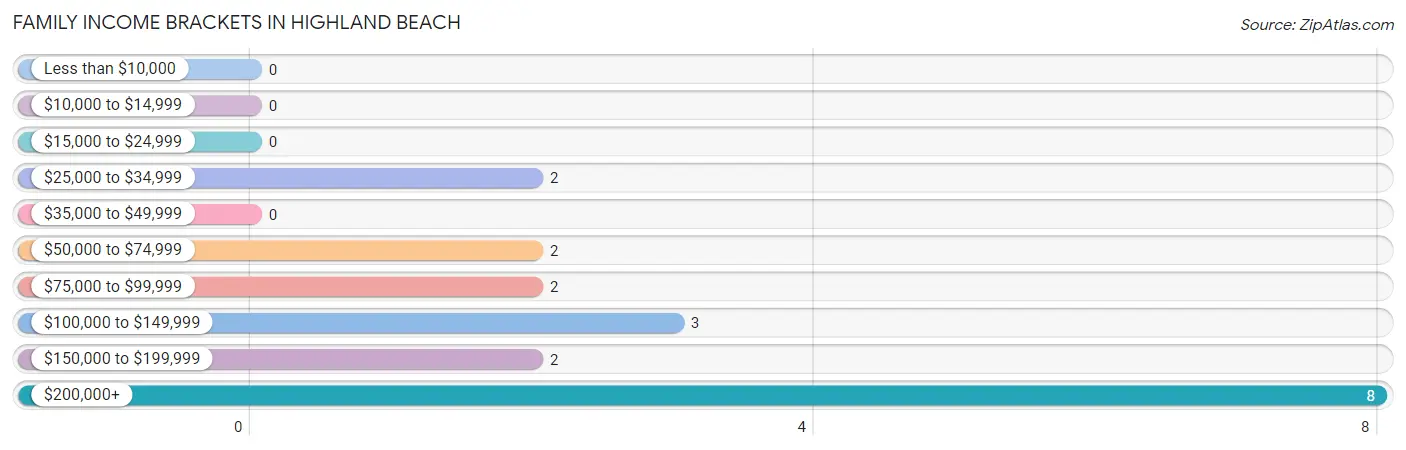
| Income Bracket | # Families | % Families |
| Less than $10,000 | 0 | 0.0% |
| $10,000 to $14,999 | 0 | 0.0% |
| $15,000 to $24,999 | 0 | 0.0% |
| $25,000 to $34,999 | 2 | 10.5% |
| $35,000 to $49,999 | 0 | 0.0% |
| $50,000 to $74,999 | 2 | 10.5% |
| $75,000 to $99,999 | 2 | 10.5% |
| $100,000 to $149,999 | 3 | 15.8% |
| $150,000 to $199,999 | 2 | 10.5% |
| $200,000+ | 8 | 42.1% |
Family Income by Famaliy Size in Highland Beach
2-person families (14 | 73.7%) account for the highest median family income in Highland Beach with $147,500 per family, while 2-person families (14 | 73.7%) have the highest median income of $73,750 per family member.
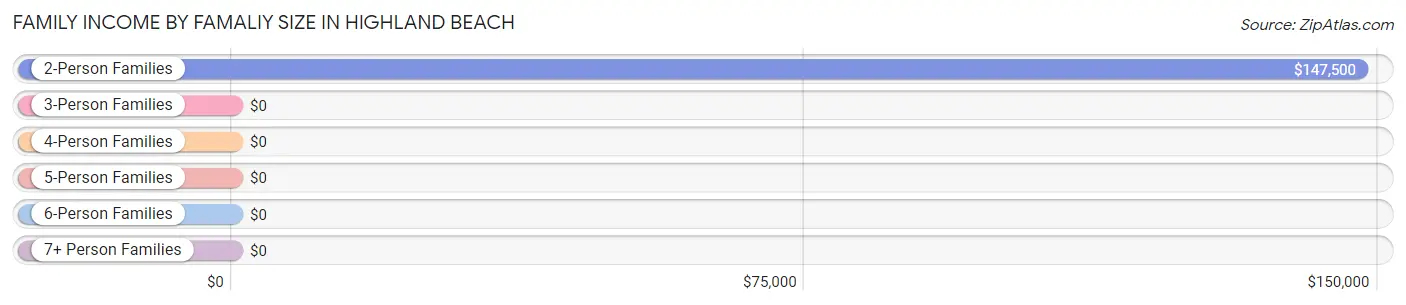
| Income Bracket | # Families | Median Income |
| 2-Person Families | 14 (73.7%) | $147,500 |
| 3-Person Families | 2 (10.5%) | $0 |
| 4-Person Families | 3 (15.8%) | $0 |
| 5-Person Families | 0 (0.0%) | $0 |
| 6-Person Families | 0 (0.0%) | $0 |
| 7+ Person Families | 0 (0.0%) | $0 |
| Total | 19 (100.0%) | $166,250 |
Family Income by Number of Earners in Highland Beach
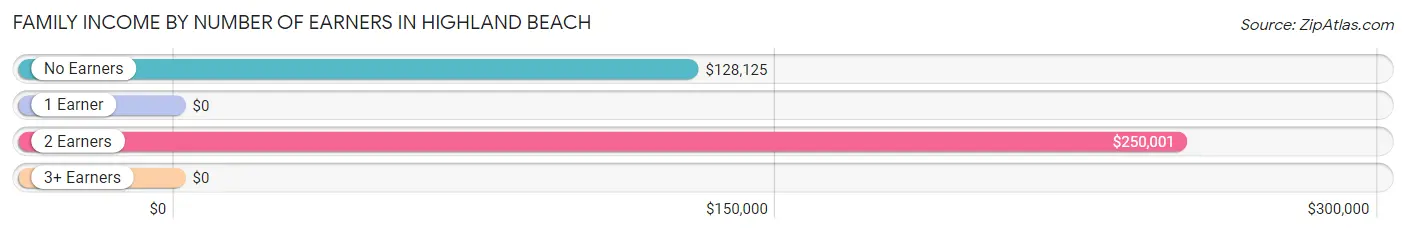
| Number of Earners | # Families | Median Income |
| No Earners | 7 (36.8%) | $128,125 |
| 1 Earner | 5 (26.3%) | $0 |
| 2 Earners | 7 (36.8%) | $250,001 |
| 3+ Earners | 0 (0.0%) | $0 |
| Total | 19 (100.0%) | $166,250 |
Household Income in Highland Beach
Household Income Brackets in Highland Beach
With 13 households falling in the category, the $150,000 to $199,999 income range is the most frequent in Highland Beach, accounting for 38.2% of all households.
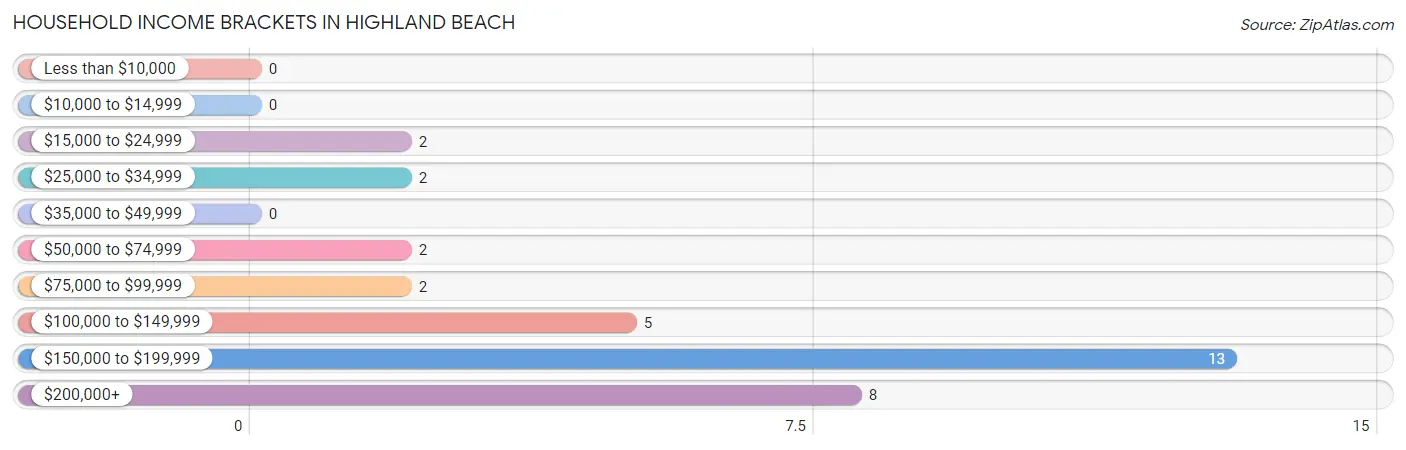
| Income Bracket | # Households | % Households |
| Less than $10,000 | 0 | 0.0% |
| $10,000 to $14,999 | 0 | 0.0% |
| $15,000 to $24,999 | 2 | 5.9% |
| $25,000 to $34,999 | 2 | 5.9% |
| $35,000 to $49,999 | 0 | 0.0% |
| $50,000 to $74,999 | 2 | 5.9% |
| $75,000 to $99,999 | 2 | 5.9% |
| $100,000 to $149,999 | 5 | 14.7% |
| $150,000 to $199,999 | 13 | 38.2% |
| $200,000+ | 8 | 23.5% |
Household Income by Householder Age in Highland Beach
The median household income in Highland Beach is $158,611, with the highest median household income of $158,472 found in the 65+ years age bracket for the primary householder. A total of 25 households (73.5%) fall into this category.
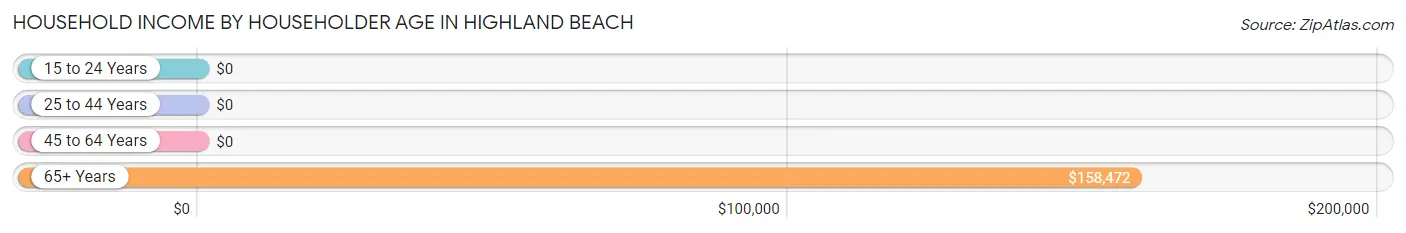
| Income Bracket | # Households | Median Income |
| 15 to 24 Years | 0 (0.0%) | $0 |
| 25 to 44 Years | 1 (2.9%) | $0 |
| 45 to 64 Years | 8 (23.5%) | $0 |
| 65+ Years | 25 (73.5%) | $158,472 |
| Total | 34 (100.0%) | $158,611 |
Poverty in Highland Beach
Income Below Poverty by Sex and Age in Highland Beach
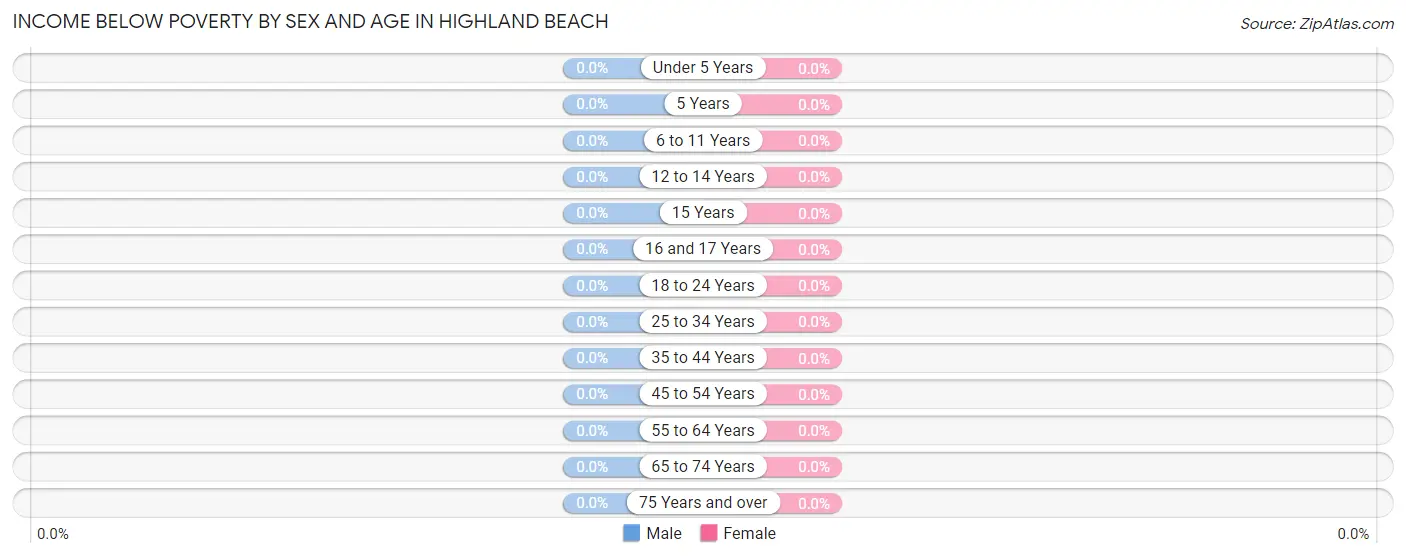
| Age Bracket | Male | Female |
| Under 5 Years | 0 (0.0%) | 0 (0.0%) |
| 5 Years | 0 (0.0%) | 0 (0.0%) |
| 6 to 11 Years | 0 (0.0%) | 0 (0.0%) |
| 12 to 14 Years | 0 (0.0%) | 0 (0.0%) |
| 15 Years | 0 (0.0%) | 0 (0.0%) |
| 16 and 17 Years | 0 (0.0%) | 0 (0.0%) |
| 18 to 24 Years | 0 (0.0%) | 0 (0.0%) |
| 25 to 34 Years | 0 (0.0%) | 0 (0.0%) |
| 35 to 44 Years | 0 (0.0%) | 0 (0.0%) |
| 45 to 54 Years | 0 (0.0%) | 0 (0.0%) |
| 55 to 64 Years | 0 (0.0%) | 0 (0.0%) |
| 65 to 74 Years | 0 (0.0%) | 0 (0.0%) |
| 75 Years and over | 0 (0.0%) | 0 (0.0%) |
| Total | 0 (0.0%) | 0 (0.0%) |
Income Above Poverty by Sex and Age in Highland Beach
According to the poverty statistics in Highland Beach, males aged 5 years and females aged 6 to 11 years are the age groups that are most secure financially, with 100.0% of males and 100.0% of females in these age groups living above the poverty line.
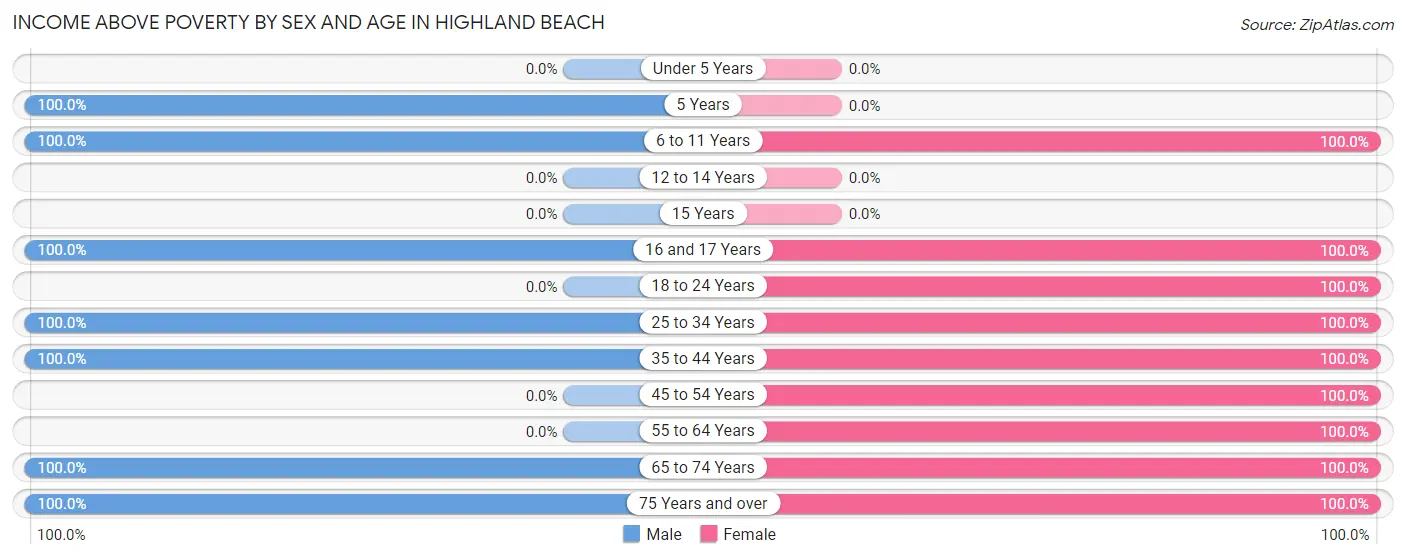
| Age Bracket | Male | Female |
| Under 5 Years | 0 (0.0%) | 0 (0.0%) |
| 5 Years | 1 (100.0%) | 0 (0.0%) |
| 6 to 11 Years | 1 (100.0%) | 2 (100.0%) |
| 12 to 14 Years | 0 (0.0%) | 0 (0.0%) |
| 15 Years | 0 (0.0%) | 0 (0.0%) |
| 16 and 17 Years | 1 (100.0%) | 2 (100.0%) |
| 18 to 24 Years | 0 (0.0%) | 2 (100.0%) |
| 25 to 34 Years | 3 (100.0%) | 2 (100.0%) |
| 35 to 44 Years | 2 (100.0%) | 1 (100.0%) |
| 45 to 54 Years | 0 (0.0%) | 2 (100.0%) |
| 55 to 64 Years | 0 (0.0%) | 6 (100.0%) |
| 65 to 74 Years | 9 (100.0%) | 7 (100.0%) |
| 75 Years and over | 9 (100.0%) | 12 (100.0%) |
| Total | 26 (100.0%) | 36 (100.0%) |
Income Below Poverty Among Married-Couple Families in Highland Beach
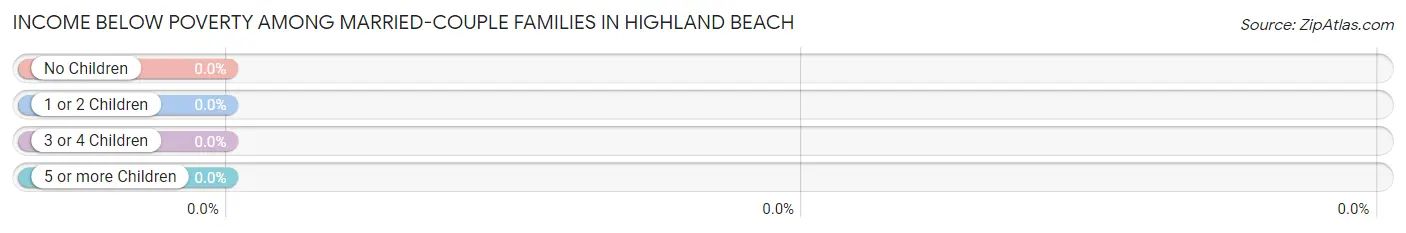
| Children | Above Poverty | Below Poverty |
| No Children | 10 (100.0%) | 0 (0.0%) |
| 1 or 2 Children | 3 (100.0%) | 0 (0.0%) |
| 3 or 4 Children | 0 (0.0%) | 0 (0.0%) |
| 5 or more Children | 0 (0.0%) | 0 (0.0%) |
| Total | 13 (100.0%) | 0 (0.0%) |
Income Below Poverty Among Single-Parent Households in Highland Beach
| Children | Single Father | Single Mother |
| No Children | 0 (0.0%) | 0 (0.0%) |
| 1 or 2 Children | 0 (0.0%) | 0 (0.0%) |
| 3 or 4 Children | 0 (0.0%) | 0 (0.0%) |
| 5 or more Children | 0 (0.0%) | 0 (0.0%) |
| Total | 0 (0.0%) | 0 (0.0%) |
Income Below Poverty Among Married-Couple vs Single-Parent Households in Highland Beach
| Children | Married-Couple Families | Single-Parent Households |
| No Children | 0 (0.0%) | 0 (0.0%) |
| 1 or 2 Children | 0 (0.0%) | 0 (0.0%) |
| 3 or 4 Children | 0 (0.0%) | 0 (0.0%) |
| 5 or more Children | 0 (0.0%) | 0 (0.0%) |
| Total | 0 (0.0%) | 0 (0.0%) |
Race in Highland Beach
The most populous races in Highland Beach are Black / African American (35 | 56.5%), White / Caucasian (16 | 25.8%), and Two or more Races (11 | 17.7%).
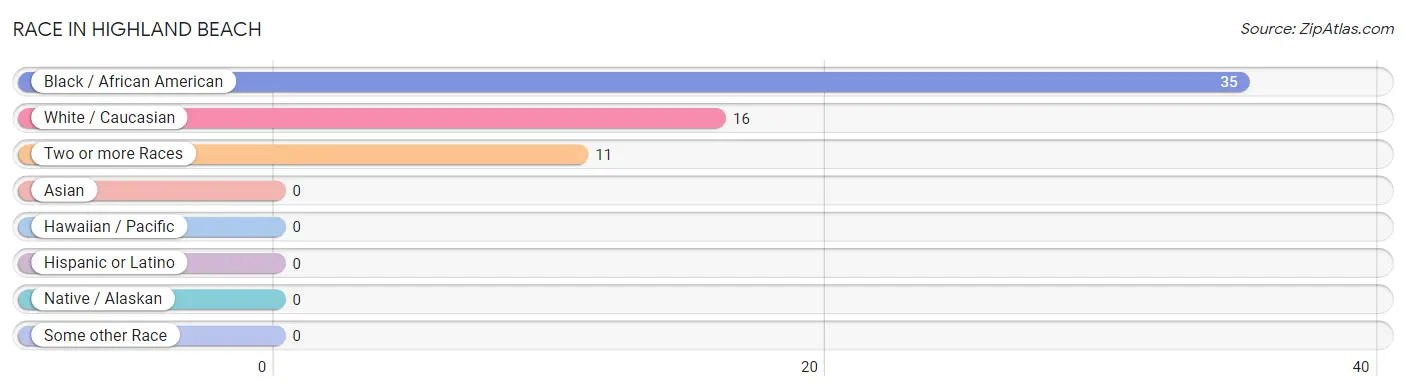
| Race | # Population | % Population |
| Asian | 0 | 0.0% |
| Black / African American | 35 | 56.5% |
| Hawaiian / Pacific | 0 | 0.0% |
| Hispanic or Latino | 0 | 0.0% |
| Native / Alaskan | 0 | 0.0% |
| White / Caucasian | 16 | 25.8% |
| Two or more Races | 11 | 17.7% |
| Some other Race | 0 | 0.0% |
| Total | 62 | 100.0% |
Ancestry in Highland Beach
The most populous ancestries reported in Highland Beach are Irish (13 | 21.0%), German (8 | 12.9%), Subsaharan African (4 | 6.5%), African (2 | 3.2%), and English (2 | 3.2%), together accounting for 46.8% of all Highland Beach residents.
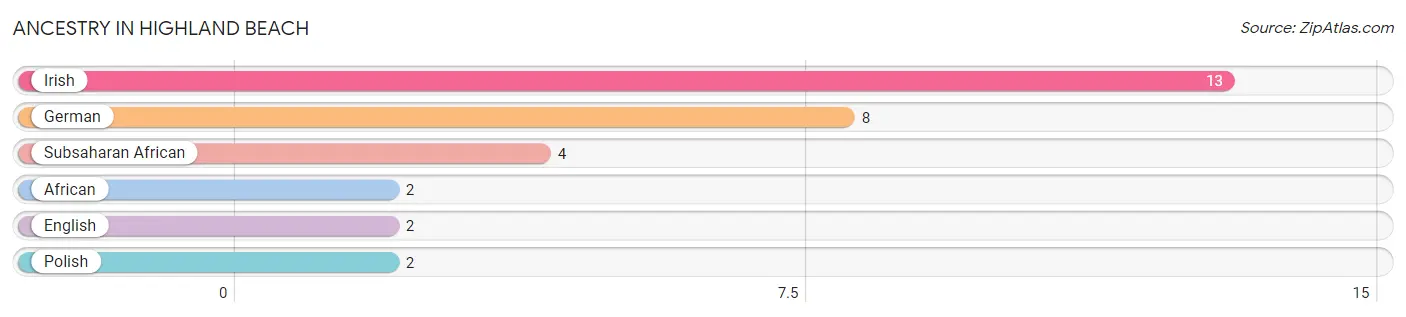
| Ancestry | # Population | % Population |
| African | 2 | 3.2% |
| English | 2 | 3.2% |
| German | 8 | 12.9% |
| Irish | 13 | 21.0% |
| Polish | 2 | 3.2% |
| Subsaharan African | 4 | 6.5% | View All 6 Rows |
Immigrants in Highland Beach

| Immigration Origin | # Population | % Population | View All 0 Rows |
Sex and Age in Highland Beach
Sex and Age in Highland Beach
The most populous age groups in Highland Beach are 70 to 74 Years (9 | 34.6%) for men and 85 Years and over (10 | 27.8%) for women.
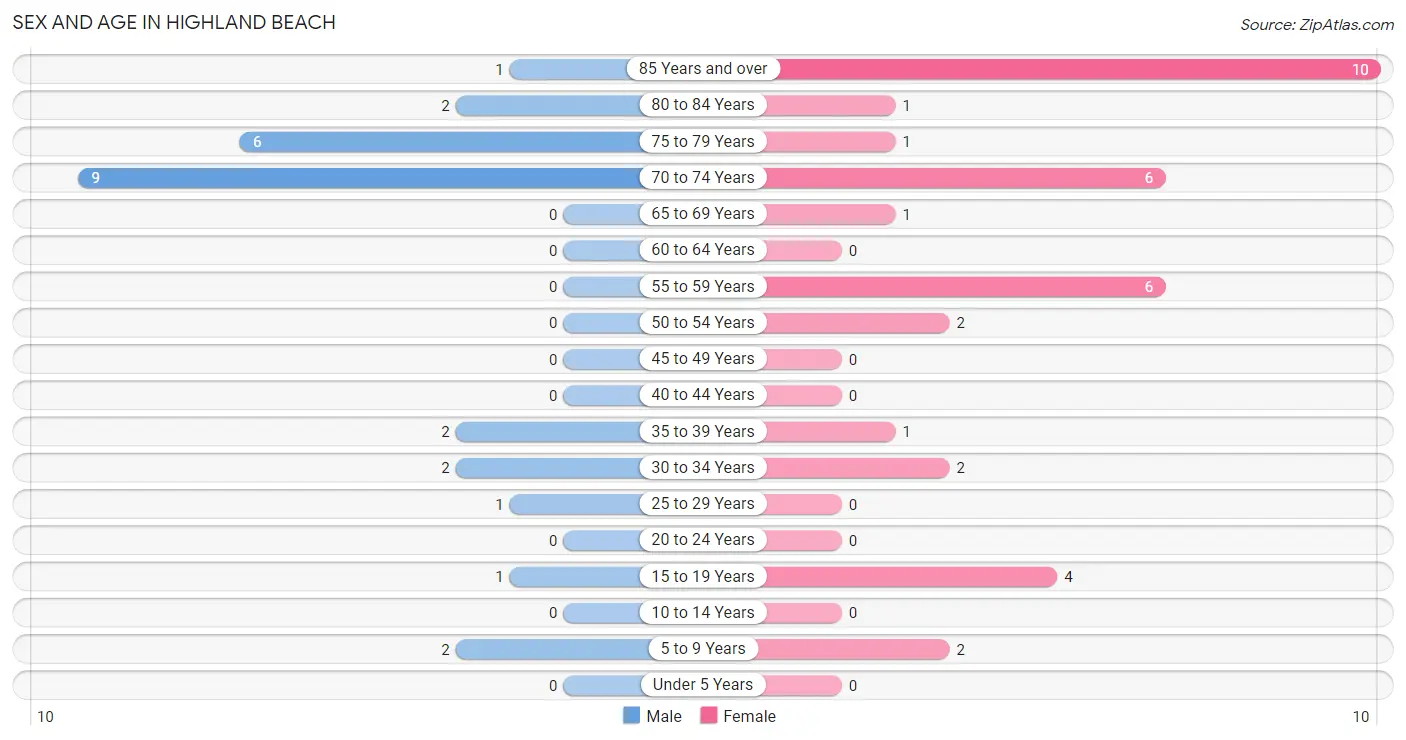
| Age Bracket | Male | Female |
| Under 5 Years | 0 (0.0%) | 0 (0.0%) |
| 5 to 9 Years | 2 (7.7%) | 2 (5.6%) |
| 10 to 14 Years | 0 (0.0%) | 0 (0.0%) |
| 15 to 19 Years | 1 (3.8%) | 4 (11.1%) |
| 20 to 24 Years | 0 (0.0%) | 0 (0.0%) |
| 25 to 29 Years | 1 (3.8%) | 0 (0.0%) |
| 30 to 34 Years | 2 (7.7%) | 2 (5.6%) |
| 35 to 39 Years | 2 (7.7%) | 1 (2.8%) |
| 40 to 44 Years | 0 (0.0%) | 0 (0.0%) |
| 45 to 49 Years | 0 (0.0%) | 0 (0.0%) |
| 50 to 54 Years | 0 (0.0%) | 2 (5.6%) |
| 55 to 59 Years | 0 (0.0%) | 6 (16.7%) |
| 60 to 64 Years | 0 (0.0%) | 0 (0.0%) |
| 65 to 69 Years | 0 (0.0%) | 1 (2.8%) |
| 70 to 74 Years | 9 (34.6%) | 6 (16.7%) |
| 75 to 79 Years | 6 (23.1%) | 1 (2.8%) |
| 80 to 84 Years | 2 (7.7%) | 1 (2.8%) |
| 85 Years and over | 1 (3.8%) | 10 (27.8%) |
| Total | 26 (100.0%) | 36 (100.0%) |
Families and Households in Highland Beach
Median Family Size in Highland Beach
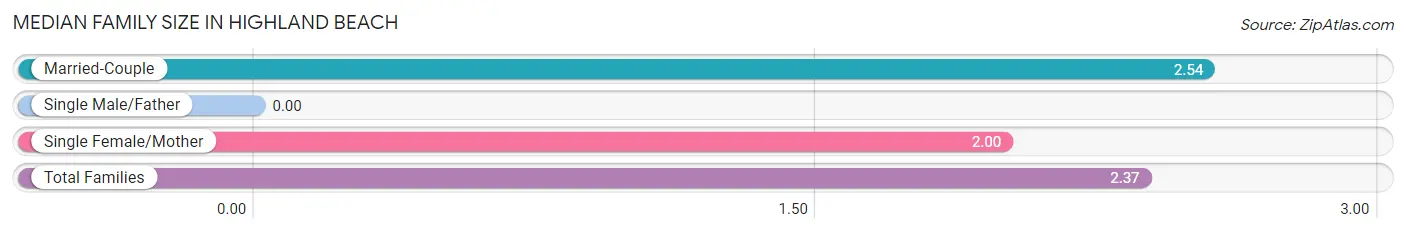
| Family Type | # Families | Family Size |
| Married-Couple | 13 (68.4%) | 2.54 |
| Single Male/Father | 0 (0.0%) | - |
| Single Female/Mother | 6 (31.6%) | 2.00 |
| Total Families | 19 (100.0%) | 2.37 |
Median Household Size in Highland Beach
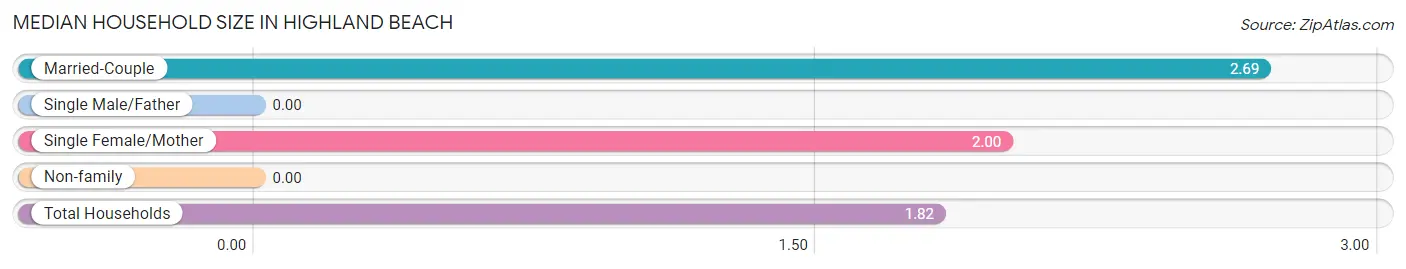
| Household Type | # Households | Household Size |
| Married-Couple | 13 (38.2%) | 2.69 |
| Single Male/Father | 0 (0.0%) | - |
| Single Female/Mother | 6 (17.6%) | 2.00 |
| Non-family | 15 (44.1%) | - |
| Total Households | 34 (100.0%) | 1.82 |
Household Size by Marriage Status in Highland Beach
Out of a total of 34 households in Highland Beach, 19 (55.9%) are family households, while 15 (44.1%) are nonfamily households. The most numerous type of family households are 2-person households, comprising 14, and the most common type of nonfamily households are 1-person households, comprising 15.
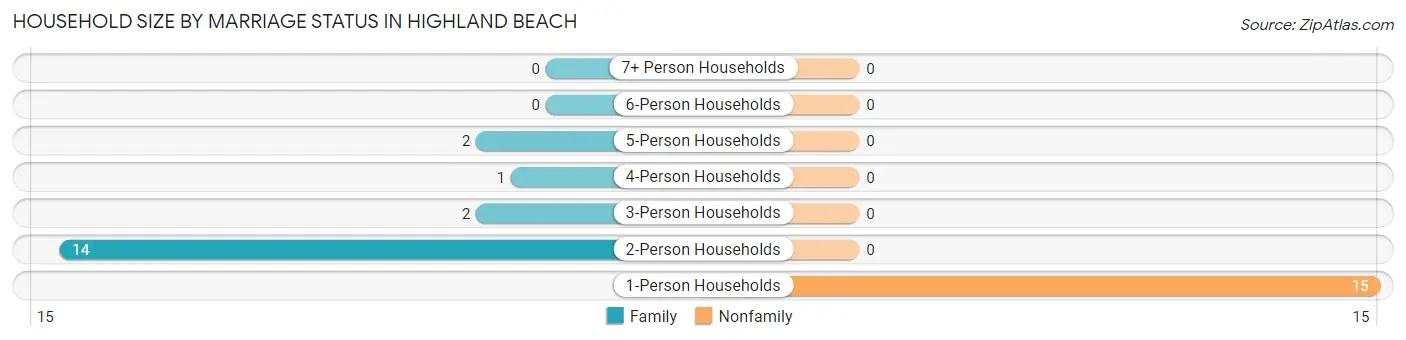
| Household Size | Family Households | Nonfamily Households |
| 1-Person Households | - | 15 (44.1%) |
| 2-Person Households | 14 (41.2%) | 0 (0.0%) |
| 3-Person Households | 2 (5.9%) | 0 (0.0%) |
| 4-Person Households | 1 (2.9%) | 0 (0.0%) |
| 5-Person Households | 2 (5.9%) | 0 (0.0%) |
| 6-Person Households | 0 (0.0%) | 0 (0.0%) |
| 7+ Person Households | 0 (0.0%) | 0 (0.0%) |
| Total | 19 (55.9%) | 15 (44.1%) |
Female Fertility in Highland Beach
Fertility by Age in Highland Beach
| Age Bracket | Women with Births | Births / 1,000 Women |
| 15 to 19 years | 0 (0.0%) | 0.0 |
| 20 to 34 years | 0 (0.0%) | 0.0 |
| 35 to 50 years | 0 (0.0%) | 0.0 |
| Total | 0 (0.0%) | 0.0 |
Fertility by Age by Marriage Status in Highland Beach
| Age Bracket | Married | Unmarried |
| 15 to 19 years | 0 (0.0%) | 0 (0.0%) |
| 20 to 34 years | 0 (0.0%) | 0 (0.0%) |
| 35 to 50 years | 0 (0.0%) | 0 (0.0%) |
| Total | 0 (0.0%) | 0 (0.0%) |
Fertility by Education in Highland Beach
| Educational Attainment | Women with Births | Births / 1,000 Women |
| Less than High School | 0 (0.0%) | 0.0 |
| High School Diploma | 0 (0.0%) | 0.0 |
| College or Associate's Degree | 0 (0.0%) | 0.0 |
| Bachelor's Degree | 0 (0.0%) | 0.0 |
| Graduate Degree | 0 (0.0%) | 0.0 |
| Total | 0 (0.0%) | 0.0 |
Fertility by Education by Marriage Status in Highland Beach
| Educational Attainment | Married | Unmarried |
| Less than High School | 0 (0.0%) | 0 (0.0%) |
| High School Diploma | 0 (0.0%) | 0 (0.0%) |
| College or Associate's Degree | 0 (0.0%) | 0 (0.0%) |
| Bachelor's Degree | 0 (0.0%) | 0 (0.0%) |
| Graduate Degree | 0 (0.0%) | 0 (0.0%) |
| Total | 0 (0.0%) | 0 (0.0%) |
Employment Characteristics in Highland Beach
Employment by Class of Employer in Highland Beach
Among the 31 employed individuals in Highland Beach, private company employees (11 | 35.5%), self-employed (not incorporated) (11 | 35.5%), and federal government employees (5 | 16.1%) make up the most common classes of employment.
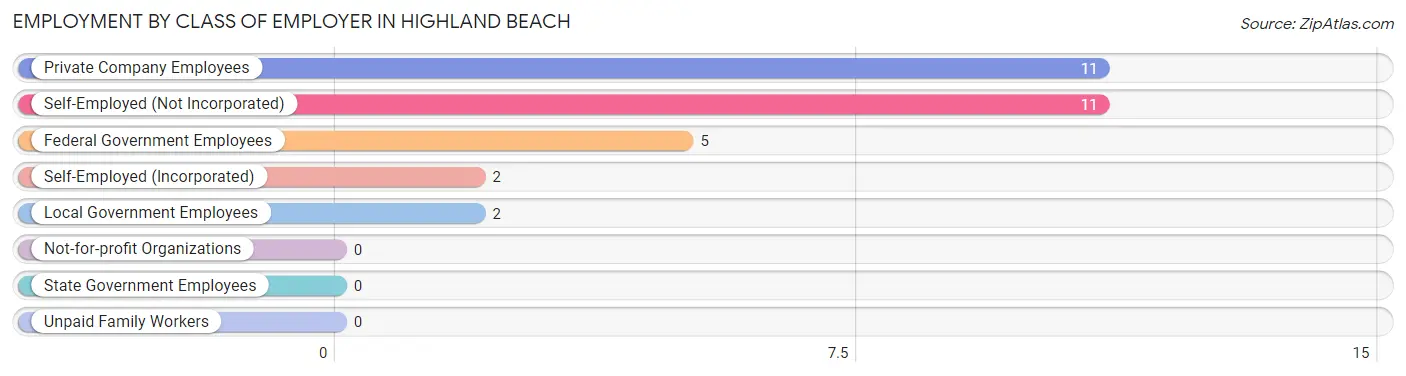
| Employer Class | # Employees | % Employees |
| Private Company Employees | 11 | 35.5% |
| Self-Employed (Incorporated) | 2 | 6.5% |
| Self-Employed (Not Incorporated) | 11 | 35.5% |
| Not-for-profit Organizations | 0 | 0.0% |
| Local Government Employees | 2 | 6.5% |
| State Government Employees | 0 | 0.0% |
| Federal Government Employees | 5 | 16.1% |
| Unpaid Family Workers | 0 | 0.0% |
| Total | 31 | 100.0% |
Employment Status by Age in Highland Beach
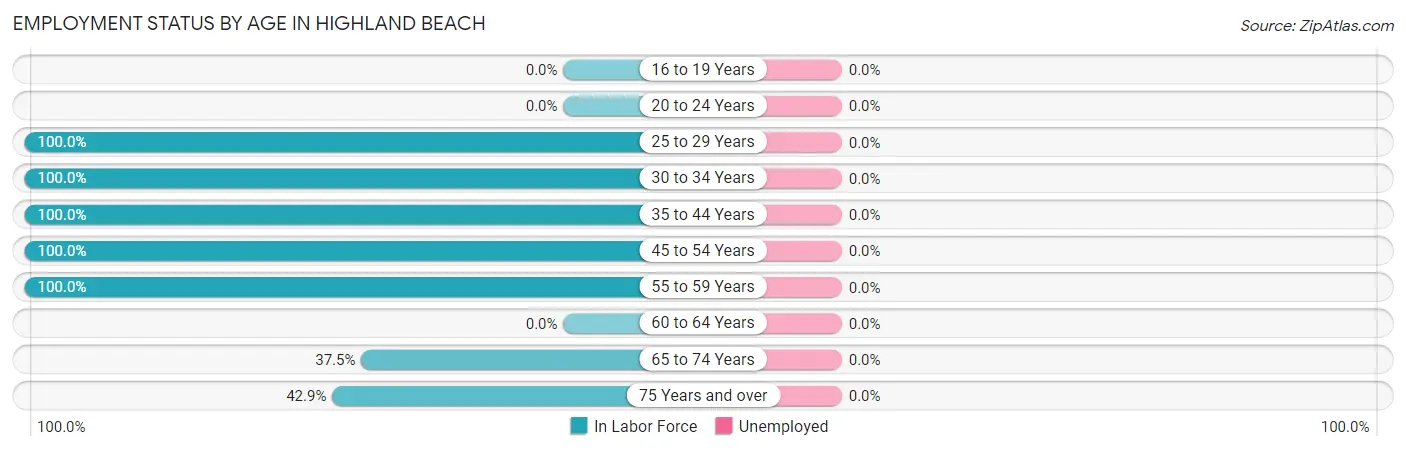
| Age Bracket | In Labor Force | Unemployed |
| 16 to 19 Years | 0 (0.0%) | 0 (0.0%) |
| 20 to 24 Years | 0 (0.0%) | 0 (0.0%) |
| 25 to 29 Years | 1 (100.0%) | 0 (0.0%) |
| 30 to 34 Years | 4 (100.0%) | 0 (0.0%) |
| 35 to 44 Years | 3 (100.0%) | 0 (0.0%) |
| 45 to 54 Years | 2 (100.0%) | 0 (0.0%) |
| 55 to 59 Years | 6 (100.0%) | 0 (0.0%) |
| 60 to 64 Years | 0 (0.0%) | 0 (0.0%) |
| 65 to 74 Years | 6 (37.5%) | 0 (0.0%) |
| 75 Years and over | 9 (42.9%) | 0 (0.0%) |
| Total | 31 (53.4%) | 0 (0.0%) |
Employment Status by Educational Attainment in Highland Beach
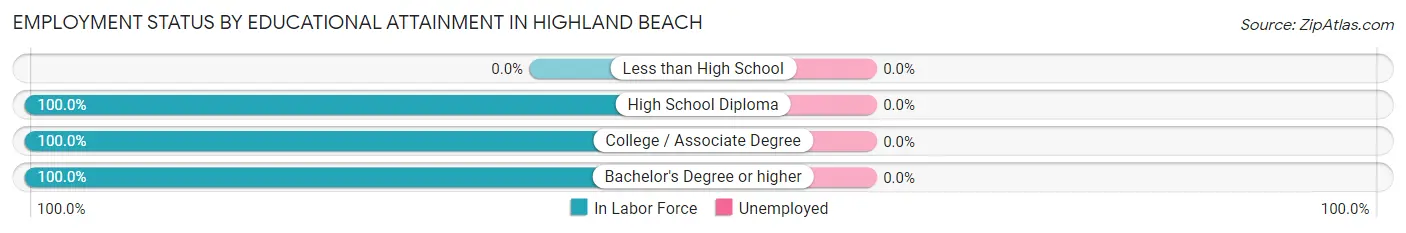
| Educational Attainment | In Labor Force | Unemployed |
| Less than High School | 0 (0.0%) | 0 (0.0%) |
| High School Diploma | 2 (100.0%) | 0 (0.0%) |
| College / Associate Degree | 4 (100.0%) | 0 (0.0%) |
| Bachelor's Degree or higher | 10 (100.0%) | 0 (0.0%) |
| Total | 16 (100.0%) | 0 (0.0%) |
Employment Occupations by Sex in Highland Beach
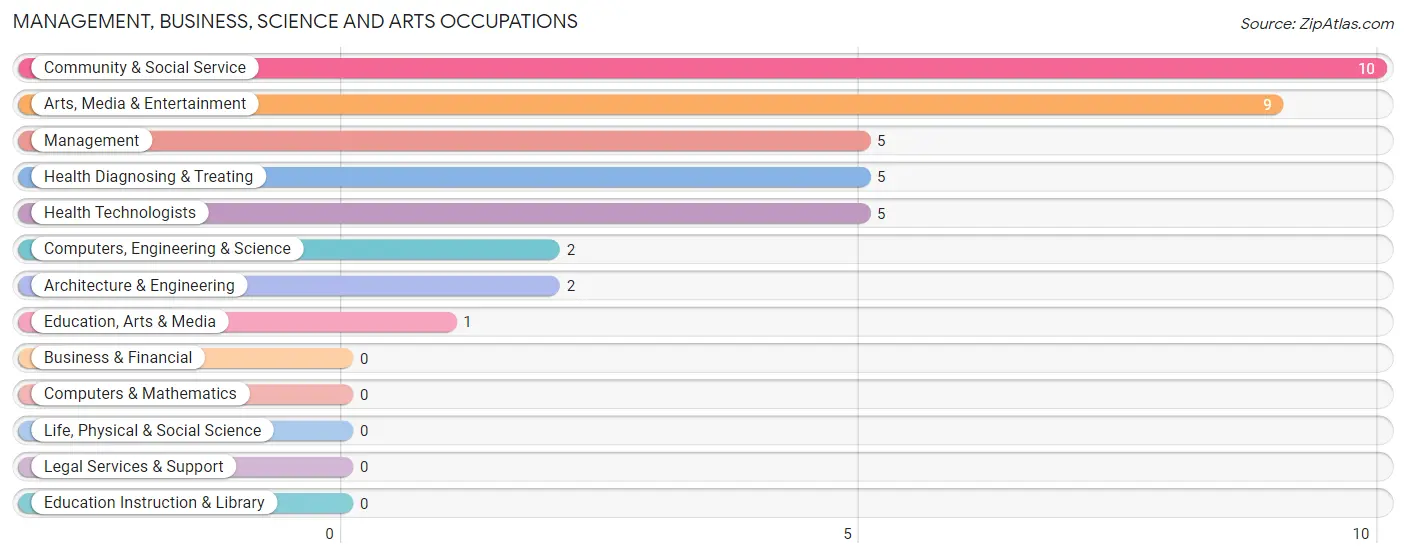
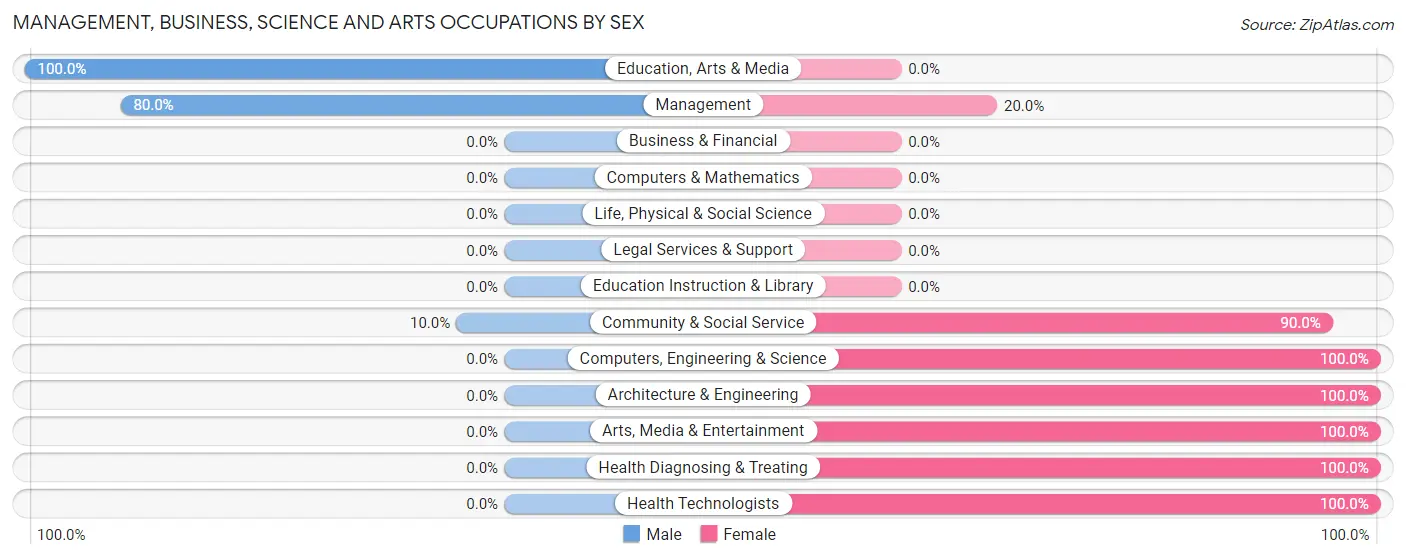
Management, Business, Science and Arts Occupations
The most common Management, Business, Science and Arts occupations in Highland Beach are Community & Social Service (10 | 32.3%), Arts, Media & Entertainment (9 | 29.0%), Management (5 | 16.1%), Health Diagnosing & Treating (5 | 16.1%), and Health Technologists (5 | 16.1%).
Management, Business, Science and Arts Occupations by Sex
Within the Management, Business, Science and Arts occupations in Highland Beach, the most male-oriented occupations are Education, Arts & Media (100.0%), Management (80.0%), and Community & Social Service (10.0%), while the most female-oriented occupations are Computers, Engineering & Science (100.0%), Architecture & Engineering (100.0%), and Arts, Media & Entertainment (100.0%).
| Occupation | Male | Female |
| Management | 4 (80.0%) | 1 (20.0%) |
| Business & Financial | 0 (0.0%) | 0 (0.0%) |
| Computers, Engineering & Science | 0 (0.0%) | 2 (100.0%) |
| Computers & Mathematics | 0 (0.0%) | 0 (0.0%) |
| Architecture & Engineering | 0 (0.0%) | 2 (100.0%) |
| Life, Physical & Social Science | 0 (0.0%) | 0 (0.0%) |
| Community & Social Service | 1 (10.0%) | 9 (90.0%) |
| Education, Arts & Media | 1 (100.0%) | 0 (0.0%) |
| Legal Services & Support | 0 (0.0%) | 0 (0.0%) |
| Education Instruction & Library | 0 (0.0%) | 0 (0.0%) |
| Arts, Media & Entertainment | 0 (0.0%) | 9 (100.0%) |
| Health Diagnosing & Treating | 0 (0.0%) | 5 (100.0%) |
| Health Technologists | 0 (0.0%) | 5 (100.0%) |
| Total (Category) | 5 (22.7%) | 17 (77.3%) |
| Total (Overall) | 10 (32.3%) | 21 (67.7%) |
Services Occupations
The most common Services occupations in Highland Beach are Healthcare Support (2 | 6.5%), Food Preparation & Serving (2 | 6.5%), and Personal Care & Service (2 | 6.5%).
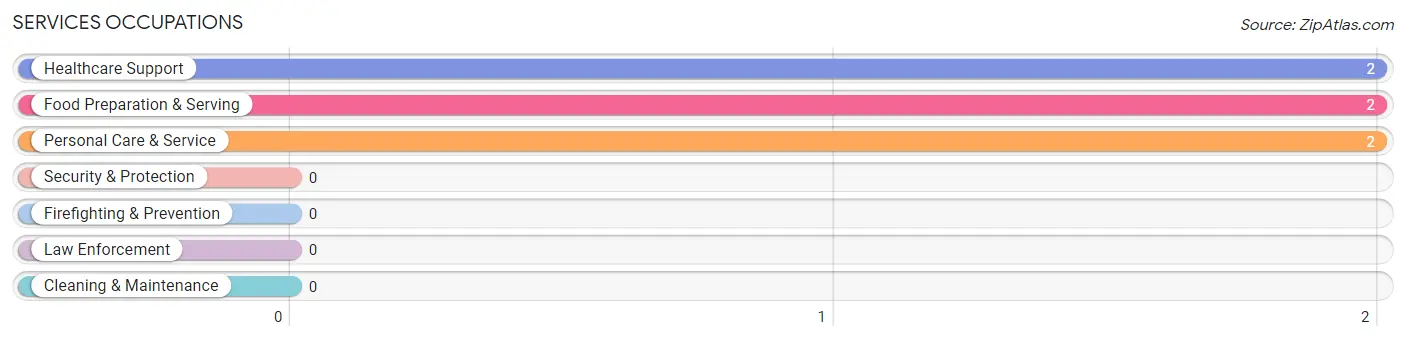
Services Occupations by Sex
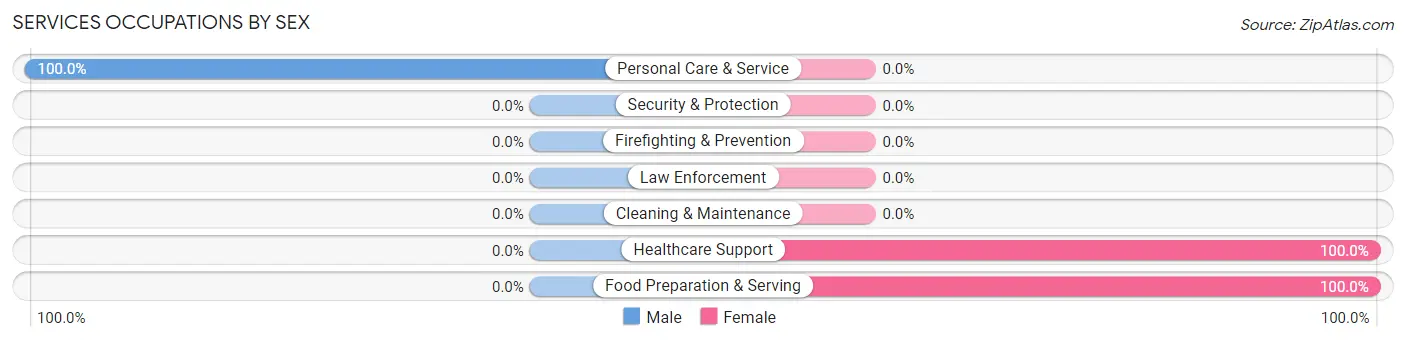
| Occupation | Male | Female |
| Healthcare Support | 0 (0.0%) | 2 (100.0%) |
| Security & Protection | 0 (0.0%) | 0 (0.0%) |
| Firefighting & Prevention | 0 (0.0%) | 0 (0.0%) |
| Law Enforcement | 0 (0.0%) | 0 (0.0%) |
| Food Preparation & Serving | 0 (0.0%) | 2 (100.0%) |
| Cleaning & Maintenance | 0 (0.0%) | 0 (0.0%) |
| Personal Care & Service | 2 (100.0%) | 0 (0.0%) |
| Total (Category) | 2 (33.3%) | 4 (66.7%) |
| Total (Overall) | 10 (32.3%) | 21 (67.7%) |
Sales and Office Occupations
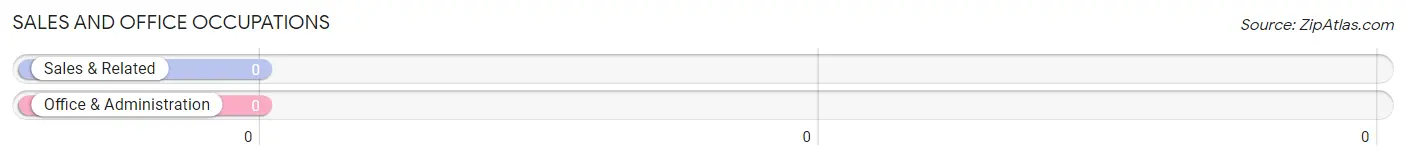
Sales and Office Occupations by Sex
| Occupation | Male | Female |
| Sales & Related | 0 (0.0%) | 0 (0.0%) |
| Office & Administration | 0 (0.0%) | 0 (0.0%) |
| Total (Category) | 0 (0.0%) | 0 (0.0%) |
| Total (Overall) | 10 (32.3%) | 21 (67.7%) |
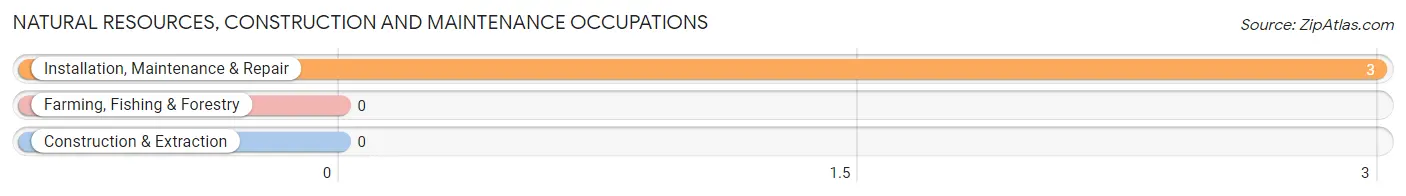
Natural Resources, Construction and Maintenance Occupations
The most common Natural Resources, Construction and Maintenance occupations in Highland Beach are , and Installation, Maintenance & Repair (3 | 9.7%).
Natural Resources, Construction and Maintenance Occupations by Sex
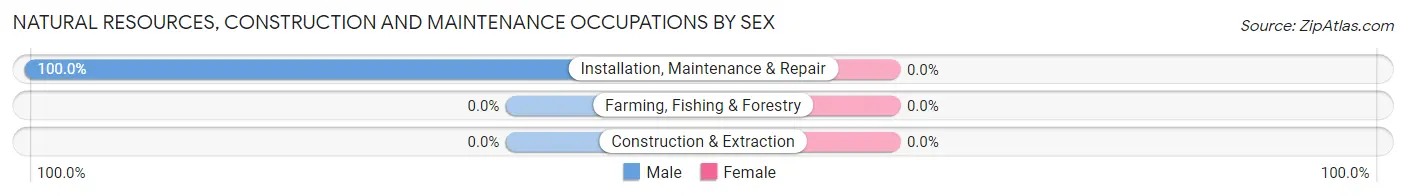
| Occupation | Male | Female |
| Farming, Fishing & Forestry | 0 (0.0%) | 0 (0.0%) |
| Construction & Extraction | 0 (0.0%) | 0 (0.0%) |
| Installation, Maintenance & Repair | 3 (100.0%) | 0 (0.0%) |
| Total (Category) | 3 (100.0%) | 0 (0.0%) |
| Total (Overall) | 10 (32.3%) | 21 (67.7%) |
Production, Transportation and Moving Occupations
Production, Transportation and Moving Occupations by Sex
| Occupation | Male | Female |
| Production | 0 (0.0%) | 0 (0.0%) |
| Transportation | 0 (0.0%) | 0 (0.0%) |
| Material Moving | 0 (0.0%) | 0 (0.0%) |
| Total (Category) | 0 (0.0%) | 0 (0.0%) |
| Total (Overall) | 10 (32.3%) | 21 (67.7%) |
Employment Industries by Sex in Highland Beach
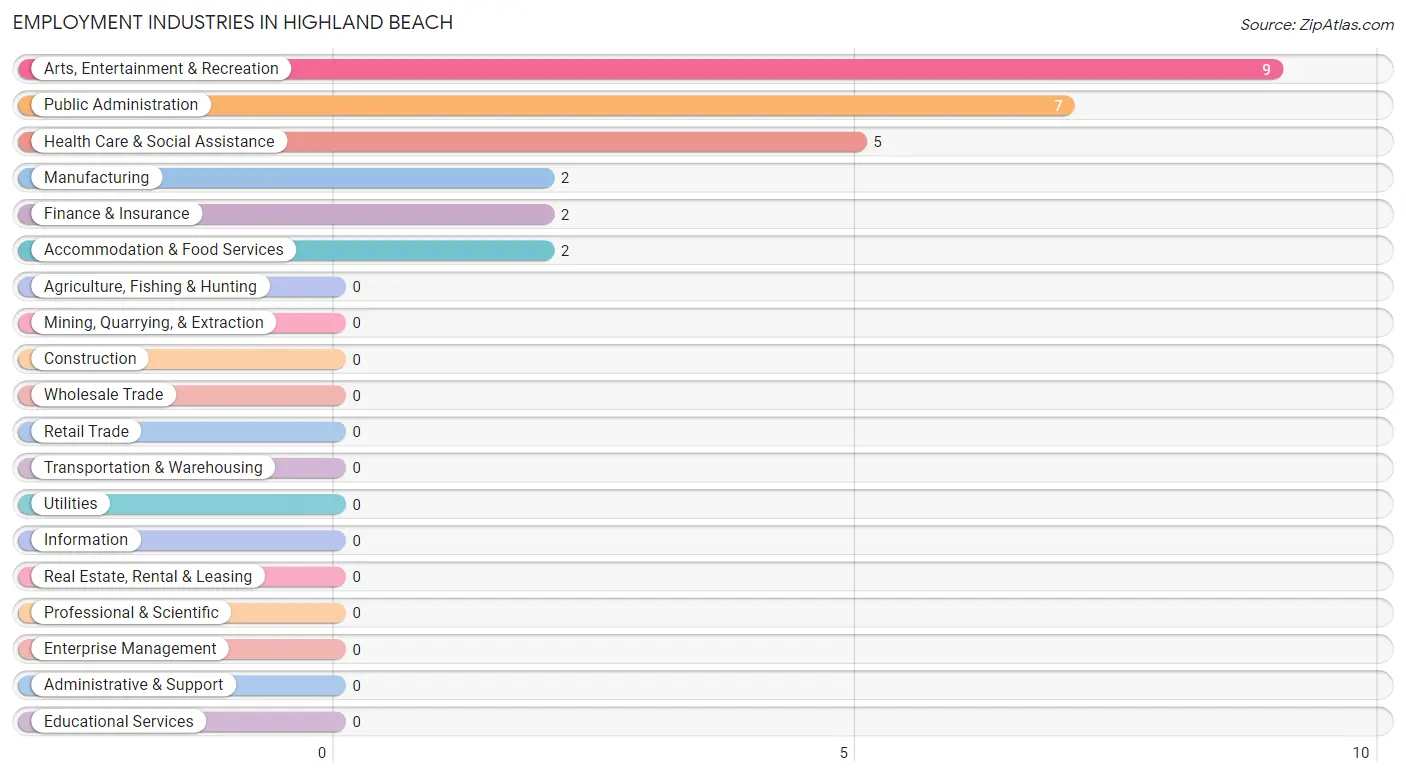
Employment Industries in Highland Beach
The major employment industries in Highland Beach include Arts, Entertainment & Recreation (9 | 29.0%), Public Administration (7 | 22.6%), Health Care & Social Assistance (5 | 16.1%), Manufacturing (2 | 6.5%), and Finance & Insurance (2 | 6.5%).
Employment Industries by Sex in Highland Beach
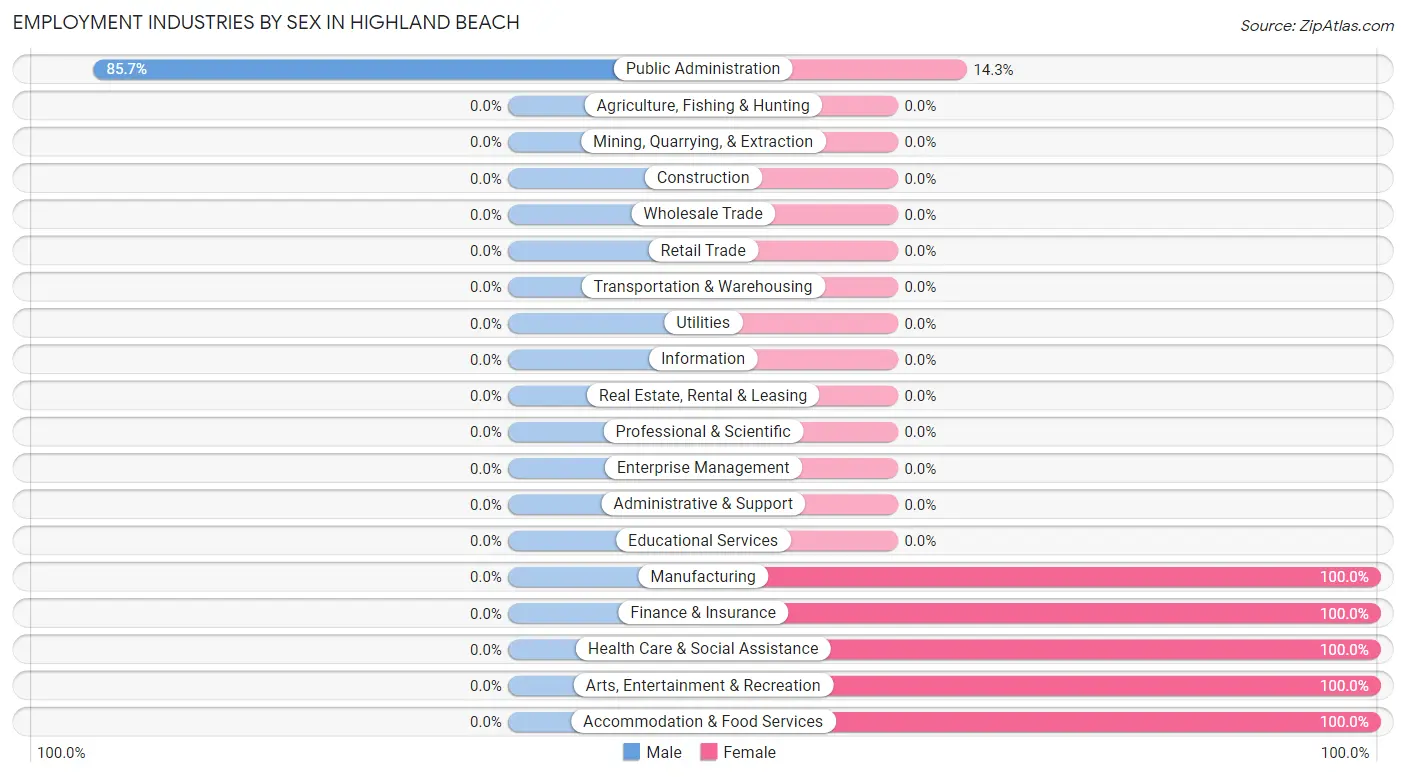
| Industry | Male | Female |
| Agriculture, Fishing & Hunting | 0 (0.0%) | 0 (0.0%) |
| Mining, Quarrying, & Extraction | 0 (0.0%) | 0 (0.0%) |
| Construction | 0 (0.0%) | 0 (0.0%) |
| Manufacturing | 0 (0.0%) | 2 (100.0%) |
| Wholesale Trade | 0 (0.0%) | 0 (0.0%) |
| Retail Trade | 0 (0.0%) | 0 (0.0%) |
| Transportation & Warehousing | 0 (0.0%) | 0 (0.0%) |
| Utilities | 0 (0.0%) | 0 (0.0%) |
| Information | 0 (0.0%) | 0 (0.0%) |
| Finance & Insurance | 0 (0.0%) | 2 (100.0%) |
| Real Estate, Rental & Leasing | 0 (0.0%) | 0 (0.0%) |
| Professional & Scientific | 0 (0.0%) | 0 (0.0%) |
| Enterprise Management | 0 (0.0%) | 0 (0.0%) |
| Administrative & Support | 0 (0.0%) | 0 (0.0%) |
| Educational Services | 0 (0.0%) | 0 (0.0%) |
| Health Care & Social Assistance | 0 (0.0%) | 5 (100.0%) |
| Arts, Entertainment & Recreation | 0 (0.0%) | 9 (100.0%) |
| Accommodation & Food Services | 0 (0.0%) | 2 (100.0%) |
| Public Administration | 6 (85.7%) | 1 (14.3%) |
| Total | 10 (32.3%) | 21 (67.7%) |
Education in Highland Beach
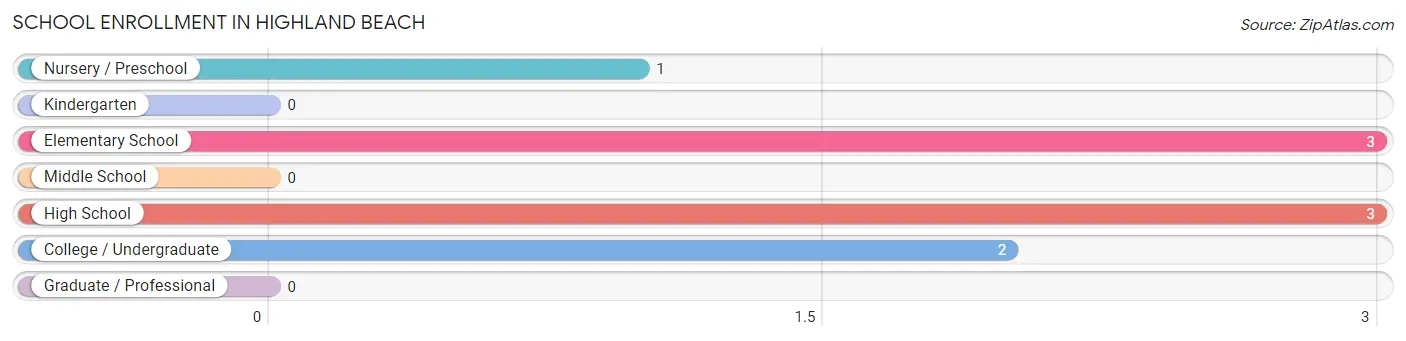
School Enrollment in Highland Beach
The most common levels of schooling among the 9 students in Highland Beach are elementary school (3 | 33.3%), high school (3 | 33.3%), and college / undergraduate (2 | 22.2%).
| School Level | # Students | % Students |
| Nursery / Preschool | 1 | 11.1% |
| Kindergarten | 0 | 0.0% |
| Elementary School | 3 | 33.3% |
| Middle School | 0 | 0.0% |
| High School | 3 | 33.3% |
| College / Undergraduate | 2 | 22.2% |
| Graduate / Professional | 0 | 0.0% |
| Total | 9 | 100.0% |
School Enrollment by Age by Funding Source in Highland Beach
Out of a total of 9 students who are enrolled in schools in Highland Beach, 6 (66.7%) attend a private institution, while the remaining 3 (33.3%) are enrolled in public schools. The age group of 18 to 19 year olds has the highest likelihood of being enrolled in private schools, with 2 (100.0% in the age bracket) enrolled. Conversely, the age group of 15 to 17 year olds has the lowest likelihood of being enrolled in a private school, with 2 (66.7% in the age bracket) attending a public institution.
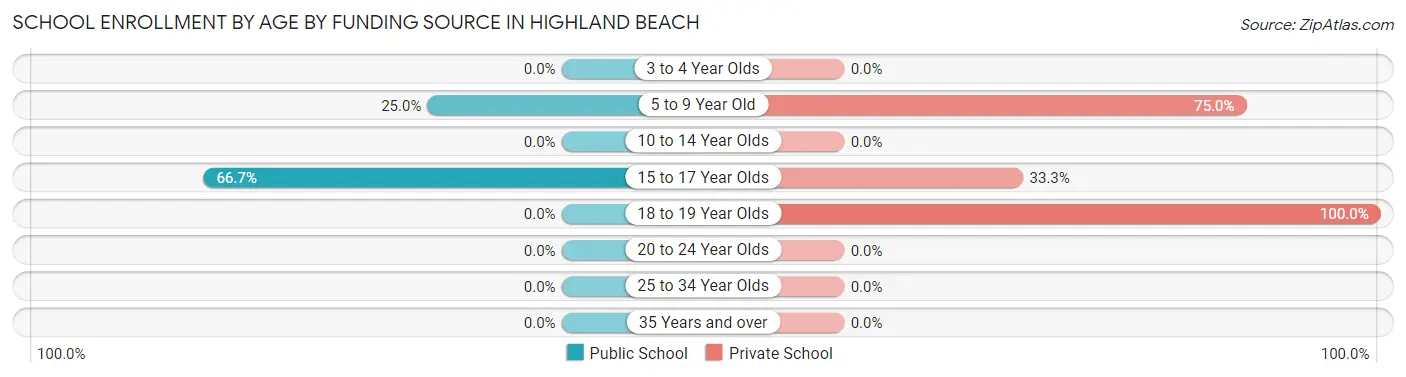
| Age Bracket | Public School | Private School |
| 3 to 4 Year Olds | 0 (0.0%) | 0 (0.0%) |
| 5 to 9 Year Old | 1 (25.0%) | 3 (75.0%) |
| 10 to 14 Year Olds | 0 (0.0%) | 0 (0.0%) |
| 15 to 17 Year Olds | 2 (66.7%) | 1 (33.3%) |
| 18 to 19 Year Olds | 0 (0.0%) | 2 (100.0%) |
| 20 to 24 Year Olds | 0 (0.0%) | 0 (0.0%) |
| 25 to 34 Year Olds | 0 (0.0%) | 0 (0.0%) |
| 35 Years and over | 0 (0.0%) | 0 (0.0%) |
| Total | 3 (33.3%) | 6 (66.7%) |
Educational Attainment by Field of Study in Highland Beach
Education (14 | 32.6%), social sciences (6 | 14.0%), physical & health sciences (5 | 11.6%), engineering (4 | 9.3%), and visual & performing arts (4 | 9.3%) are the most common fields of study among 43 individuals in Highland Beach who have obtained a bachelor's degree or higher.
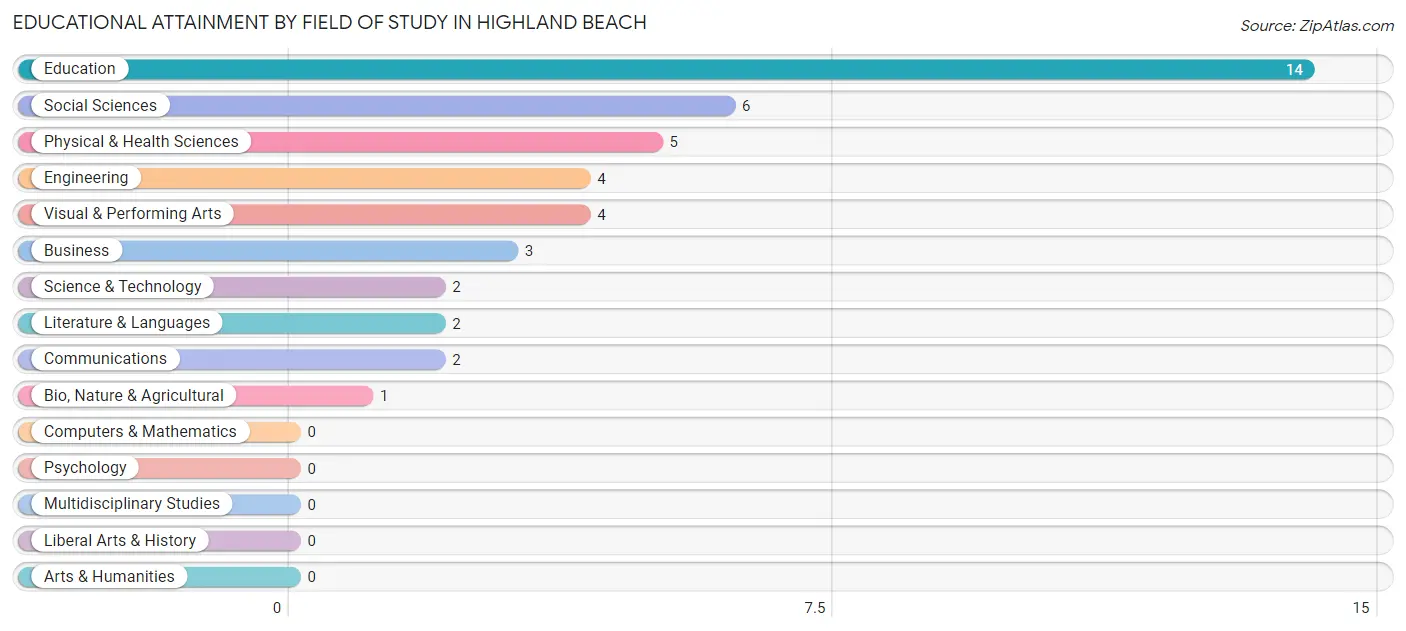
| Field of Study | # Graduates | % Graduates |
| Computers & Mathematics | 0 | 0.0% |
| Bio, Nature & Agricultural | 1 | 2.3% |
| Physical & Health Sciences | 5 | 11.6% |
| Psychology | 0 | 0.0% |
| Social Sciences | 6 | 14.0% |
| Engineering | 4 | 9.3% |
| Multidisciplinary Studies | 0 | 0.0% |
| Science & Technology | 2 | 4.6% |
| Business | 3 | 7.0% |
| Education | 14 | 32.6% |
| Literature & Languages | 2 | 4.6% |
| Liberal Arts & History | 0 | 0.0% |
| Visual & Performing Arts | 4 | 9.3% |
| Communications | 2 | 4.6% |
| Arts & Humanities | 0 | 0.0% |
| Total | 43 | 100.0% |
Transportation & Commute in Highland Beach
Vehicle Availability by Sex in Highland Beach
The most prevalent vehicle ownership categories in Highland Beach are males with 2 vehicles (5, accounting for 50.0%) and females with 2 vehicles (3, making up 23.8%).
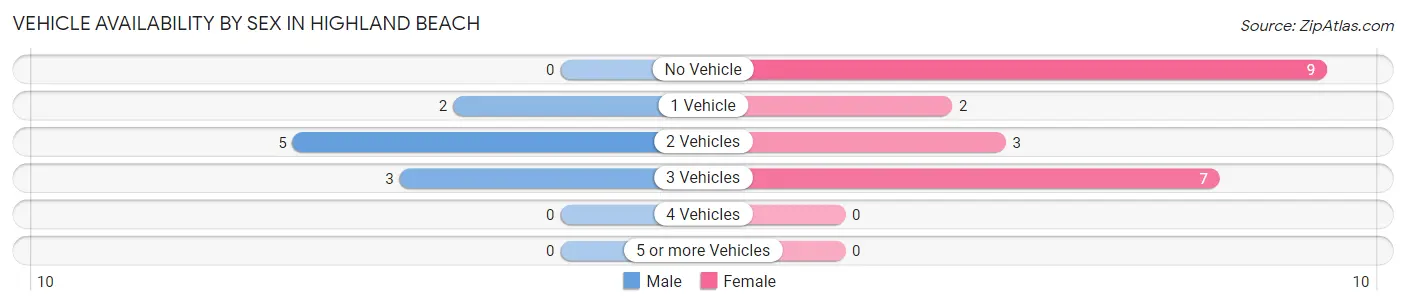
| Vehicles Available | Male | Female |
| No Vehicle | 0 (0.0%) | 9 (42.9%) |
| 1 Vehicle | 2 (20.0%) | 2 (9.5%) |
| 2 Vehicles | 5 (50.0%) | 3 (14.3%) |
| 3 Vehicles | 3 (30.0%) | 7 (33.3%) |
| 4 Vehicles | 0 (0.0%) | 0 (0.0%) |
| 5 or more Vehicles | 0 (0.0%) | 0 (0.0%) |
| Total | 10 (100.0%) | 21 (100.0%) |
Commute Time in Highland Beach
The most frequently occuring commute durations in Highland Beach are 20 to 24 minutes (4 commuters, 22.2%), 60 to 89 minutes (3 commuters, 16.7%), and 5 to 9 minutes (2 commuters, 11.1%).
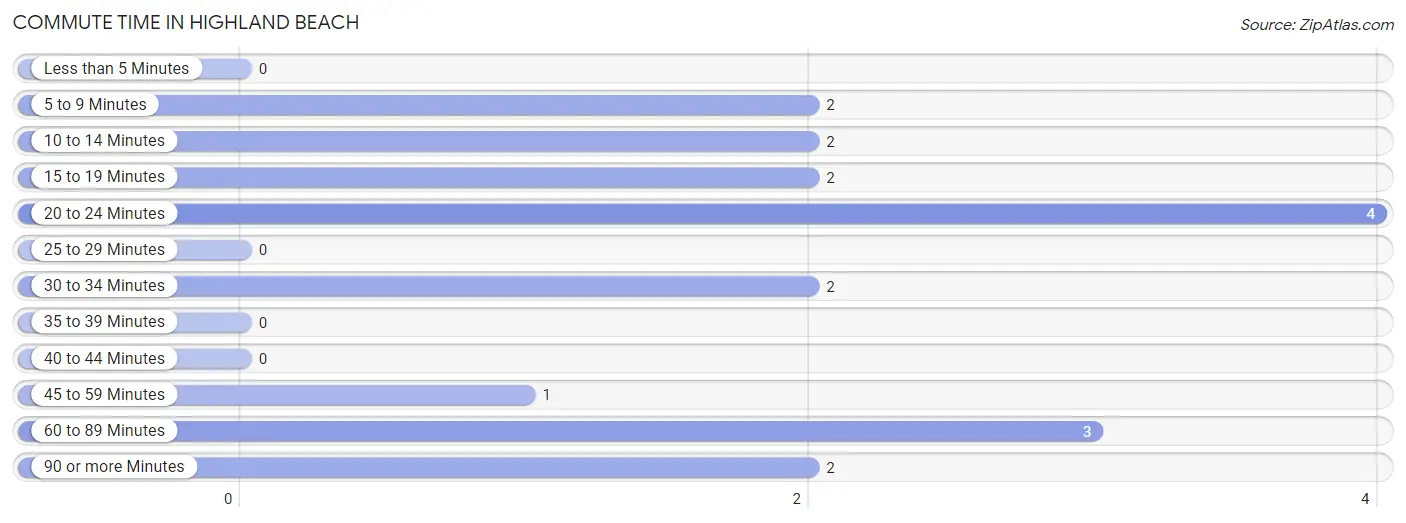
| Commute Time | # Commuters | % Commuters |
| Less than 5 Minutes | 0 | 0.0% |
| 5 to 9 Minutes | 2 | 11.1% |
| 10 to 14 Minutes | 2 | 11.1% |
| 15 to 19 Minutes | 2 | 11.1% |
| 20 to 24 Minutes | 4 | 22.2% |
| 25 to 29 Minutes | 0 | 0.0% |
| 30 to 34 Minutes | 2 | 11.1% |
| 35 to 39 Minutes | 0 | 0.0% |
| 40 to 44 Minutes | 0 | 0.0% |
| 45 to 59 Minutes | 1 | 5.6% |
| 60 to 89 Minutes | 3 | 16.7% |
| 90 or more Minutes | 2 | 11.1% |
Commute Time by Sex in Highland Beach
The most common commute times in Highland Beach are 60 to 89 minutes (3 commuters, 30.0%) for males and 20 to 24 minutes (4 commuters, 50.0%) for females.
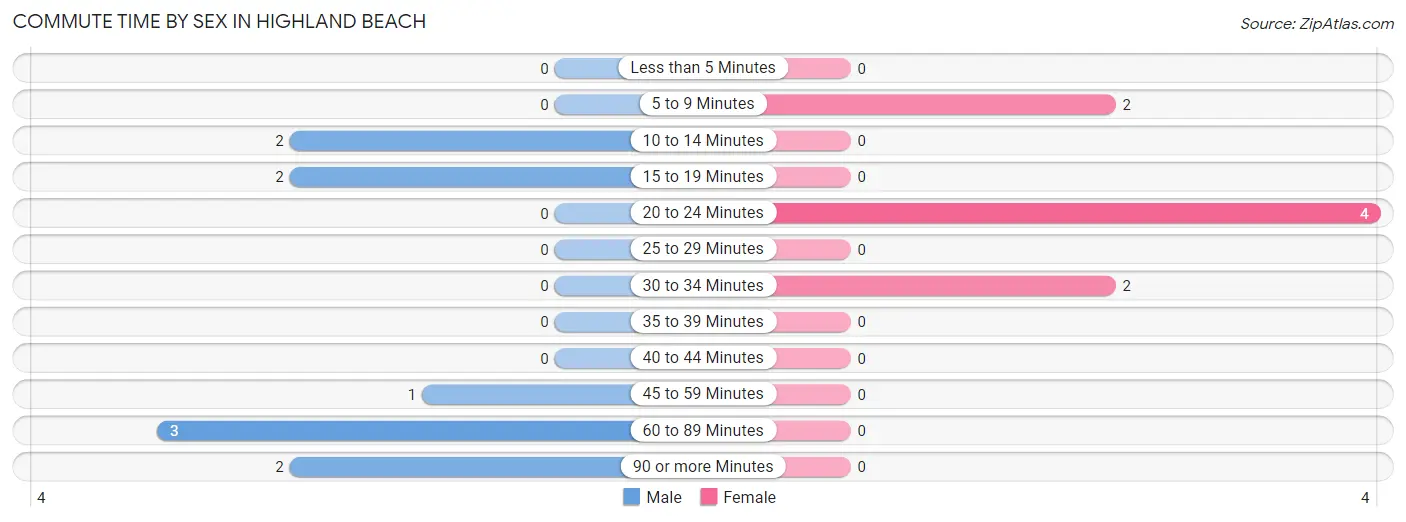
| Commute Time | Male | Female |
| Less than 5 Minutes | 0 (0.0%) | 0 (0.0%) |
| 5 to 9 Minutes | 0 (0.0%) | 2 (25.0%) |
| 10 to 14 Minutes | 2 (20.0%) | 0 (0.0%) |
| 15 to 19 Minutes | 2 (20.0%) | 0 (0.0%) |
| 20 to 24 Minutes | 0 (0.0%) | 4 (50.0%) |
| 25 to 29 Minutes | 0 (0.0%) | 0 (0.0%) |
| 30 to 34 Minutes | 0 (0.0%) | 2 (25.0%) |
| 35 to 39 Minutes | 0 (0.0%) | 0 (0.0%) |
| 40 to 44 Minutes | 0 (0.0%) | 0 (0.0%) |
| 45 to 59 Minutes | 1 (10.0%) | 0 (0.0%) |
| 60 to 89 Minutes | 3 (30.0%) | 0 (0.0%) |
| 90 or more Minutes | 2 (20.0%) | 0 (0.0%) |
Time of Departure to Work by Sex in Highland Beach
The most frequent times of departure to work in Highland Beach are 11:00 AM to 11:59 AM (4, 40.0%) for males and 8:00 AM to 8:29 AM (3, 37.5%) for females.
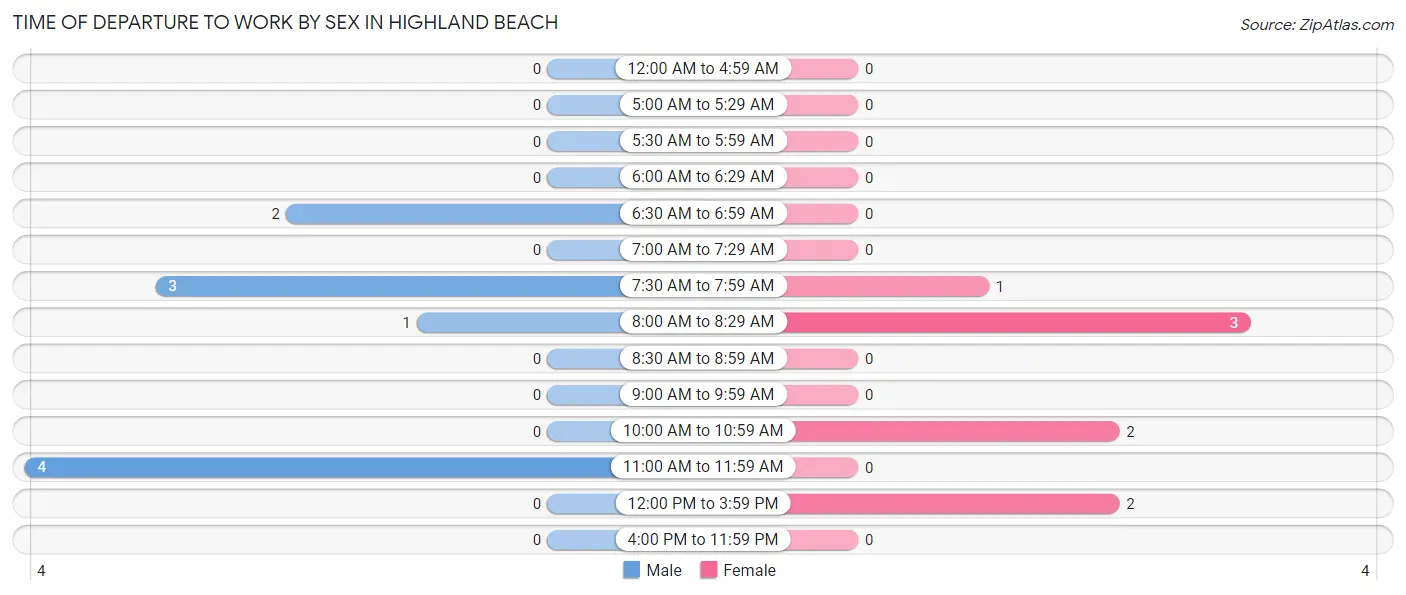
| Time of Departure | Male | Female |
| 12:00 AM to 4:59 AM | 0 (0.0%) | 0 (0.0%) |
| 5:00 AM to 5:29 AM | 0 (0.0%) | 0 (0.0%) |
| 5:30 AM to 5:59 AM | 0 (0.0%) | 0 (0.0%) |
| 6:00 AM to 6:29 AM | 0 (0.0%) | 0 (0.0%) |
| 6:30 AM to 6:59 AM | 2 (20.0%) | 0 (0.0%) |
| 7:00 AM to 7:29 AM | 0 (0.0%) | 0 (0.0%) |
| 7:30 AM to 7:59 AM | 3 (30.0%) | 1 (12.5%) |
| 8:00 AM to 8:29 AM | 1 (10.0%) | 3 (37.5%) |
| 8:30 AM to 8:59 AM | 0 (0.0%) | 0 (0.0%) |
| 9:00 AM to 9:59 AM | 0 (0.0%) | 0 (0.0%) |
| 10:00 AM to 10:59 AM | 0 (0.0%) | 2 (25.0%) |
| 11:00 AM to 11:59 AM | 4 (40.0%) | 0 (0.0%) |
| 12:00 PM to 3:59 PM | 0 (0.0%) | 2 (25.0%) |
| 4:00 PM to 11:59 PM | 0 (0.0%) | 0 (0.0%) |
| Total | 10 (100.0%) | 8 (100.0%) |
Housing Occupancy in Highland Beach
Occupancy by Ownership in Highland Beach
Of the total 34 dwellings in Highland Beach, owner-occupied units account for 32 (94.1%), while renter-occupied units make up 2 (5.9%).
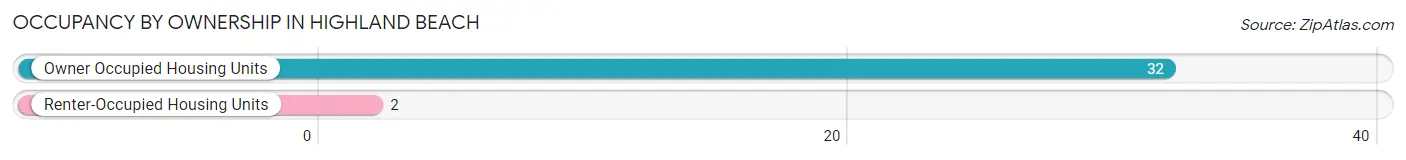
| Occupancy | # Housing Units | % Housing Units |
| Owner Occupied Housing Units | 32 | 94.1% |
| Renter-Occupied Housing Units | 2 | 5.9% |
| Total Occupied Housing Units | 34 | 100.0% |
Occupancy by Household Size in Highland Beach
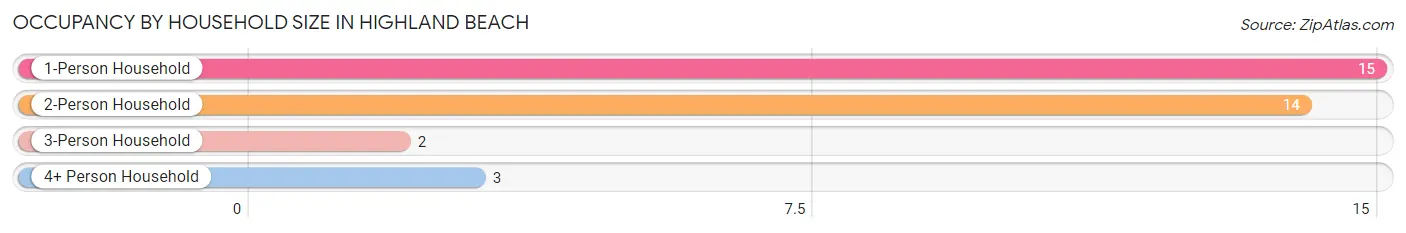
| Household Size | # Housing Units | % Housing Units |
| 1-Person Household | 15 | 44.1% |
| 2-Person Household | 14 | 41.2% |
| 3-Person Household | 2 | 5.9% |
| 4+ Person Household | 3 | 8.8% |
| Total Housing Units | 34 | 100.0% |
Occupancy by Ownership by Household Size in Highland Beach
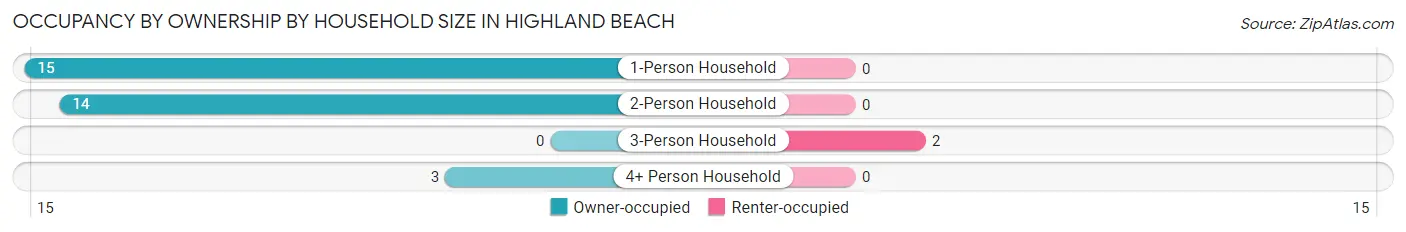
| Household Size | Owner-occupied | Renter-occupied |
| 1-Person Household | 15 (100.0%) | 0 (0.0%) |
| 2-Person Household | 14 (100.0%) | 0 (0.0%) |
| 3-Person Household | 0 (0.0%) | 2 (100.0%) |
| 4+ Person Household | 3 (100.0%) | 0 (0.0%) |
| Total Housing Units | 32 (94.1%) | 2 (5.9%) |
Occupancy by Educational Attainment in Highland Beach
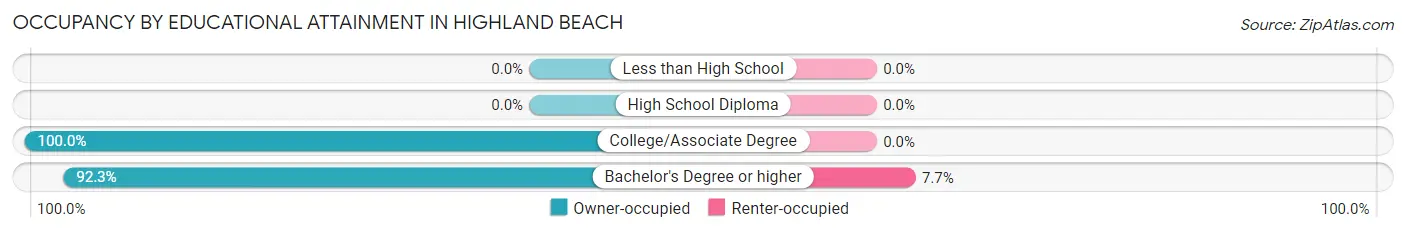
| Household Size | Owner-occupied | Renter-occupied |
| Less than High School | 0 (0.0%) | 0 (0.0%) |
| High School Diploma | 0 (0.0%) | 0 (0.0%) |
| College/Associate Degree | 8 (100.0%) | 0 (0.0%) |
| Bachelor's Degree or higher | 24 (92.3%) | 2 (7.7%) |
Occupancy by Age of Householder in Highland Beach
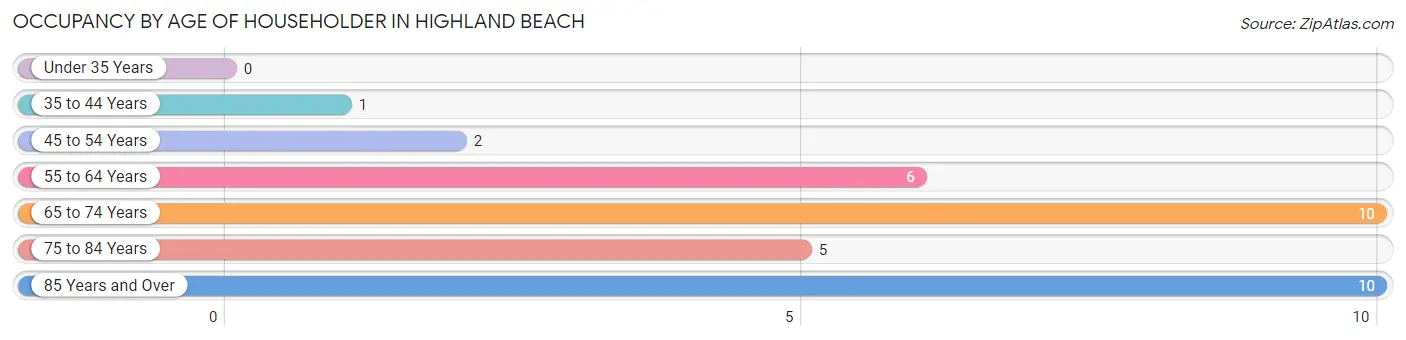
| Age Bracket | # Households | % Households |
| Under 35 Years | 0 | 0.0% |
| 35 to 44 Years | 1 | 2.9% |
| 45 to 54 Years | 2 | 5.9% |
| 55 to 64 Years | 6 | 17.6% |
| 65 to 74 Years | 10 | 29.4% |
| 75 to 84 Years | 5 | 14.7% |
| 85 Years and Over | 10 | 29.4% |
| Total | 34 | 100.0% |
Housing Finances in Highland Beach
Median Income by Occupancy in Highland Beach
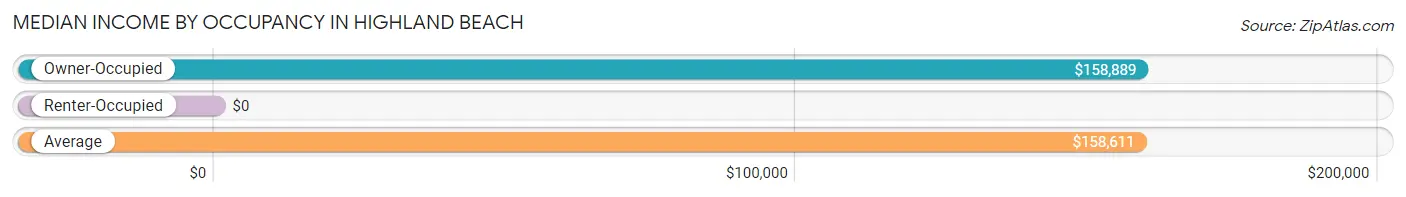
| Occupancy Type | # Households | Median Income |
| Owner-Occupied | 32 (94.1%) | $158,889 |
| Renter-Occupied | 2 (5.9%) | $0 |
| Average | 34 (100.0%) | $158,611 |
Occupancy by Householder Income Bracket in Highland Beach
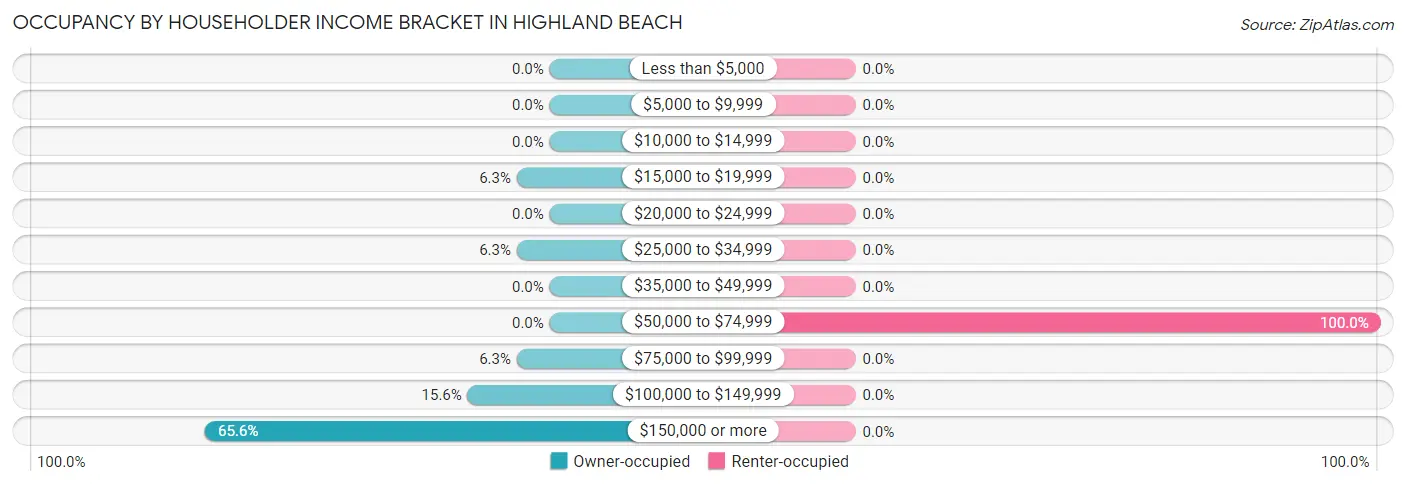
| Income Bracket | Owner-occupied | Renter-occupied |
| Less than $5,000 | 0 (0.0%) | 0 (0.0%) |
| $5,000 to $9,999 | 0 (0.0%) | 0 (0.0%) |
| $10,000 to $14,999 | 0 (0.0%) | 0 (0.0%) |
| $15,000 to $19,999 | 2 (6.2%) | 0 (0.0%) |
| $20,000 to $24,999 | 0 (0.0%) | 0 (0.0%) |
| $25,000 to $34,999 | 2 (6.2%) | 0 (0.0%) |
| $35,000 to $49,999 | 0 (0.0%) | 0 (0.0%) |
| $50,000 to $74,999 | 0 (0.0%) | 2 (100.0%) |
| $75,000 to $99,999 | 2 (6.2%) | 0 (0.0%) |
| $100,000 to $149,999 | 5 (15.6%) | 0 (0.0%) |
| $150,000 or more | 21 (65.6%) | 0 (0.0%) |
| Total | 32 (100.0%) | 2 (100.0%) |
Monthly Housing Cost Tiers in Highland Beach
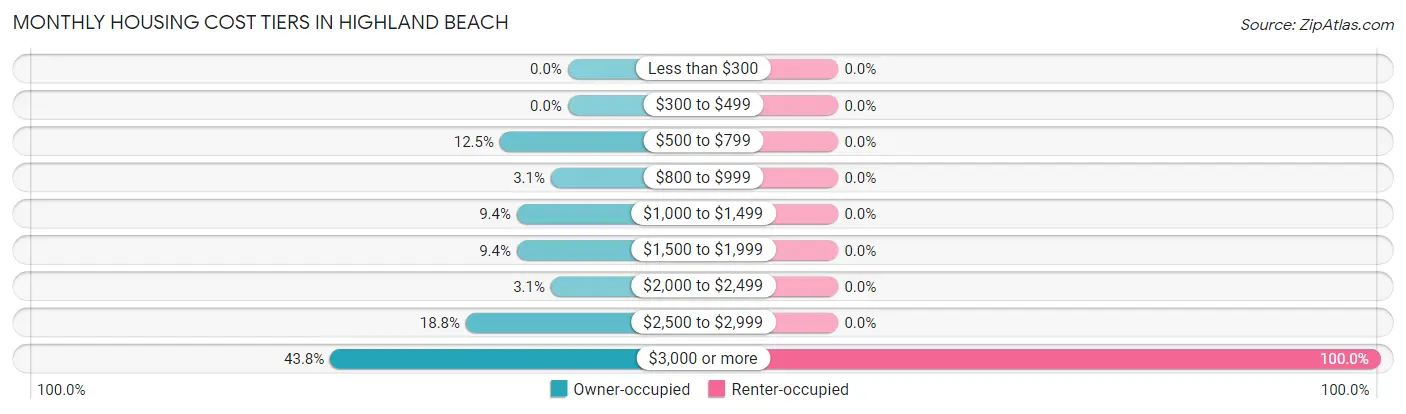
| Monthly Cost | Owner-occupied | Renter-occupied |
| Less than $300 | 0 (0.0%) | 0 (0.0%) |
| $300 to $499 | 0 (0.0%) | 0 (0.0%) |
| $500 to $799 | 4 (12.5%) | 0 (0.0%) |
| $800 to $999 | 1 (3.1%) | 0 (0.0%) |
| $1,000 to $1,499 | 3 (9.4%) | 0 (0.0%) |
| $1,500 to $1,999 | 3 (9.4%) | 0 (0.0%) |
| $2,000 to $2,499 | 1 (3.1%) | 0 (0.0%) |
| $2,500 to $2,999 | 6 (18.8%) | 0 (0.0%) |
| $3,000 or more | 14 (43.8%) | 2 (100.0%) |
| Total | 32 (100.0%) | 2 (100.0%) |
Physical Housing Characteristics in Highland Beach
Housing Structures in Highland Beach
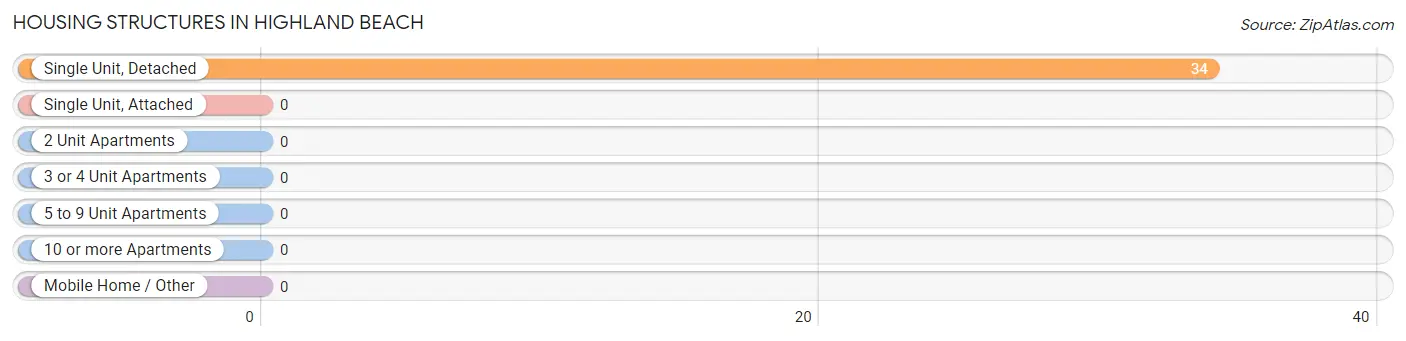
| Structure Type | # Housing Units | % Housing Units |
| Single Unit, Detached | 34 | 100.0% |
| Single Unit, Attached | 0 | 0.0% |
| 2 Unit Apartments | 0 | 0.0% |
| 3 or 4 Unit Apartments | 0 | 0.0% |
| 5 to 9 Unit Apartments | 0 | 0.0% |
| 10 or more Apartments | 0 | 0.0% |
| Mobile Home / Other | 0 | 0.0% |
| Total | 34 | 100.0% |
Housing Structures by Occupancy in Highland Beach
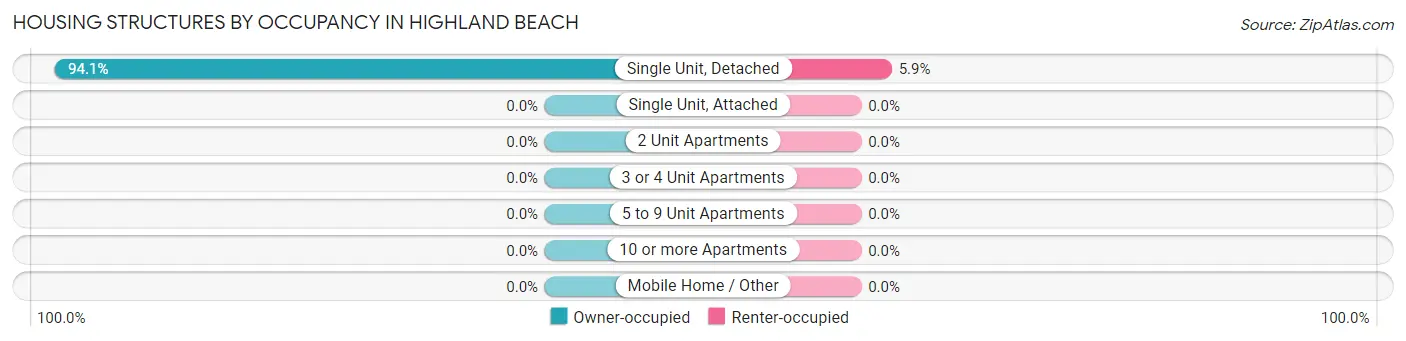
| Structure Type | Owner-occupied | Renter-occupied |
| Single Unit, Detached | 32 (94.1%) | 2 (5.9%) |
| Single Unit, Attached | 0 (0.0%) | 0 (0.0%) |
| 2 Unit Apartments | 0 (0.0%) | 0 (0.0%) |
| 3 or 4 Unit Apartments | 0 (0.0%) | 0 (0.0%) |
| 5 to 9 Unit Apartments | 0 (0.0%) | 0 (0.0%) |
| 10 or more Apartments | 0 (0.0%) | 0 (0.0%) |
| Mobile Home / Other | 0 (0.0%) | 0 (0.0%) |
| Total | 32 (94.1%) | 2 (5.9%) |
Housing Structures by Number of Rooms in Highland Beach
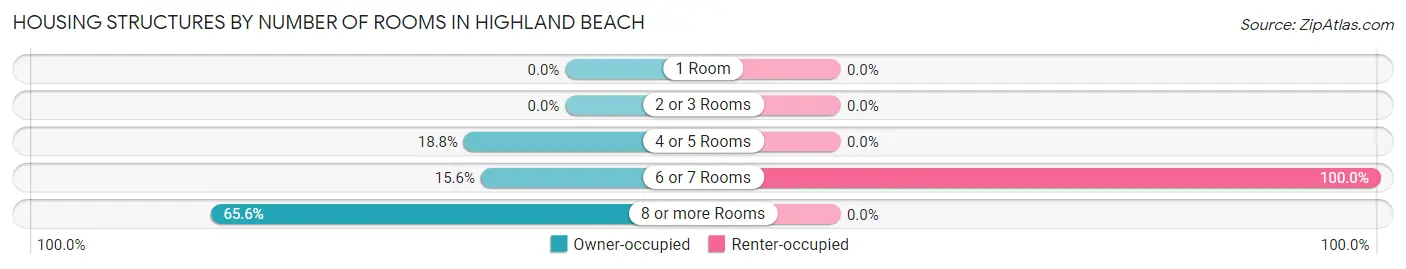
| Number of Rooms | Owner-occupied | Renter-occupied |
| 1 Room | 0 (0.0%) | 0 (0.0%) |
| 2 or 3 Rooms | 0 (0.0%) | 0 (0.0%) |
| 4 or 5 Rooms | 6 (18.8%) | 0 (0.0%) |
| 6 or 7 Rooms | 5 (15.6%) | 2 (100.0%) |
| 8 or more Rooms | 21 (65.6%) | 0 (0.0%) |
| Total | 32 (100.0%) | 2 (100.0%) |
Housing Structure by Heating Type in Highland Beach
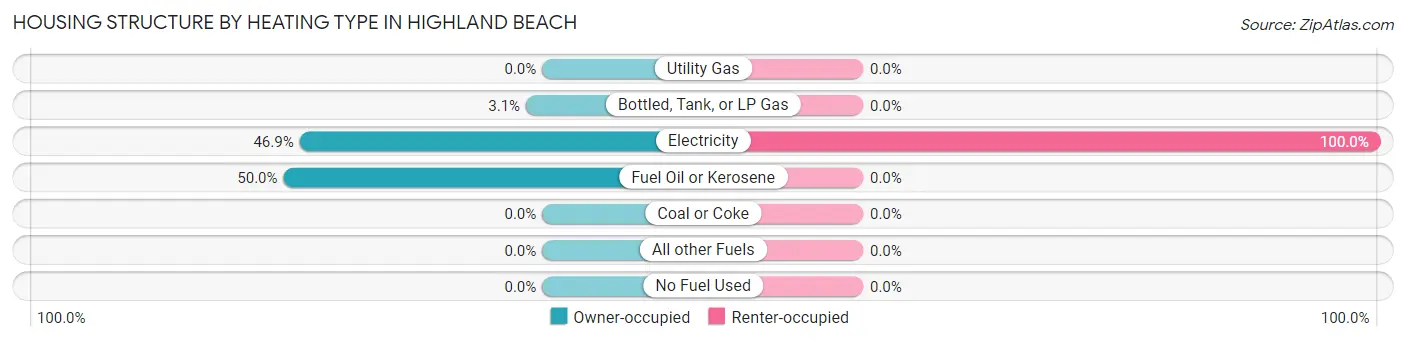
| Heating Type | Owner-occupied | Renter-occupied |
| Utility Gas | 0 (0.0%) | 0 (0.0%) |
| Bottled, Tank, or LP Gas | 1 (3.1%) | 0 (0.0%) |
| Electricity | 15 (46.9%) | 2 (100.0%) |
| Fuel Oil or Kerosene | 16 (50.0%) | 0 (0.0%) |
| Coal or Coke | 0 (0.0%) | 0 (0.0%) |
| All other Fuels | 0 (0.0%) | 0 (0.0%) |
| No Fuel Used | 0 (0.0%) | 0 (0.0%) |
| Total | 32 (100.0%) | 2 (100.0%) |
Household Vehicle Usage in Highland Beach
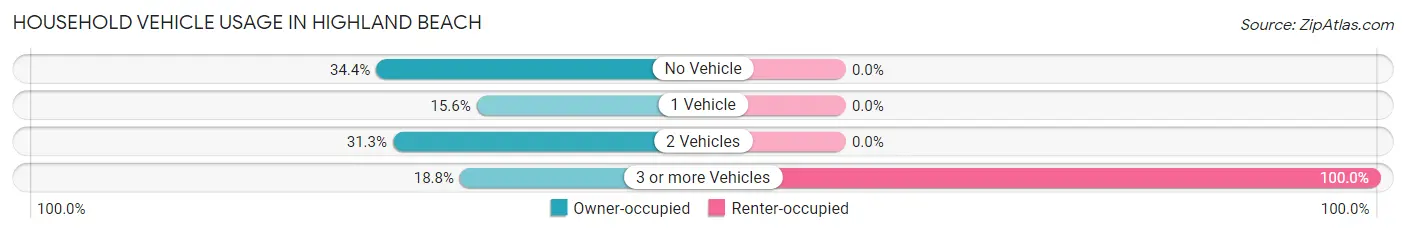
| Vehicles per Household | Owner-occupied | Renter-occupied |
| No Vehicle | 11 (34.4%) | 0 (0.0%) |
| 1 Vehicle | 5 (15.6%) | 0 (0.0%) |
| 2 Vehicles | 10 (31.2%) | 0 (0.0%) |
| 3 or more Vehicles | 6 (18.8%) | 2 (100.0%) |
| Total | 32 (100.0%) | 2 (100.0%) |
Real Estate & Mortgages in Highland Beach
Real Estate and Mortgage Overview in Highland Beach
| Characteristic | Without Mortgage | With Mortgage |
| Housing Units | 9 | 23 |
| Median Property Value | - | - |
| Median Household Income | $250,001 | $15 |
| Monthly Housing Costs | $950 | $14 |
| Real Estate Taxes | $4,563 | $0 |
Property Value by Mortgage Status in Highland Beach
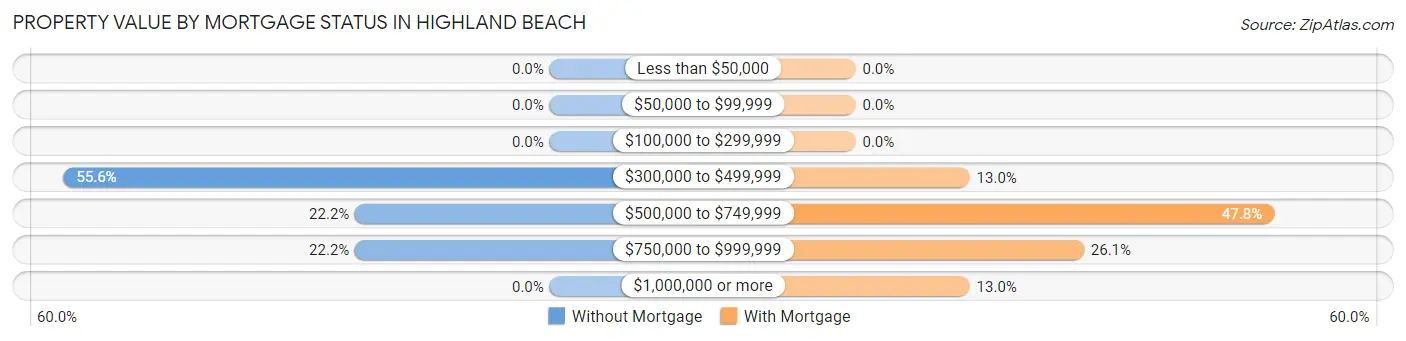
| Property Value | Without Mortgage | With Mortgage |
| Less than $50,000 | 0 (0.0%) | 0 (0.0%) |
| $50,000 to $99,999 | 0 (0.0%) | 0 (0.0%) |
| $100,000 to $299,999 | 0 (0.0%) | 0 (0.0%) |
| $300,000 to $499,999 | 5 (55.6%) | 3 (13.0%) |
| $500,000 to $749,999 | 2 (22.2%) | 11 (47.8%) |
| $750,000 to $999,999 | 2 (22.2%) | 6 (26.1%) |
| $1,000,000 or more | 0 (0.0%) | 3 (13.0%) |
| Total | 9 (100.0%) | 23 (100.0%) |
Household Income by Mortgage Status in Highland Beach
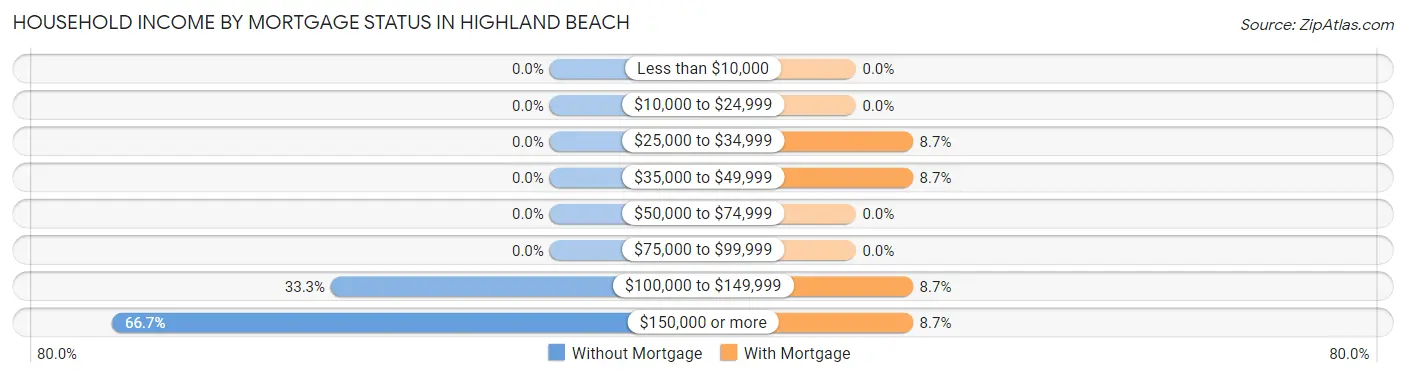
| Household Income | Without Mortgage | With Mortgage |
| Less than $10,000 | 0 (0.0%) | 0 (0.0%) |
| $10,000 to $24,999 | 0 (0.0%) | 0 (0.0%) |
| $25,000 to $34,999 | 0 (0.0%) | 2 (8.7%) |
| $35,000 to $49,999 | 0 (0.0%) | 2 (8.7%) |
| $50,000 to $74,999 | 0 (0.0%) | 0 (0.0%) |
| $75,000 to $99,999 | 0 (0.0%) | 0 (0.0%) |
| $100,000 to $149,999 | 3 (33.3%) | 2 (8.7%) |
| $150,000 or more | 6 (66.7%) | 2 (8.7%) |
| Total | 9 (100.0%) | 23 (100.0%) |
Property Value to Household Income Ratio in Highland Beach
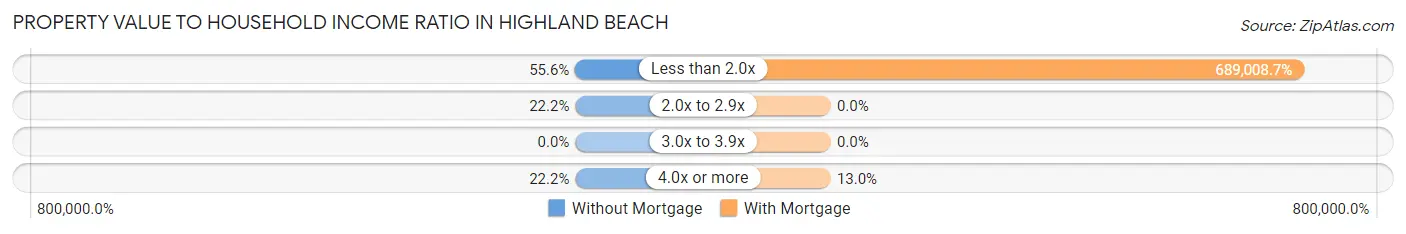
| Value-to-Income Ratio | Without Mortgage | With Mortgage |
| Less than 2.0x | 5 (55.6%) | 158,472 (689,008.7%) |
| 2.0x to 2.9x | 2 (22.2%) | 0 (0.0%) |
| 3.0x to 3.9x | 0 (0.0%) | 0 (0.0%) |
| 4.0x or more | 2 (22.2%) | 3 (13.0%) |
| Total | 9 (100.0%) | 23 (100.0%) |
Real Estate Taxes by Mortgage Status in Highland Beach
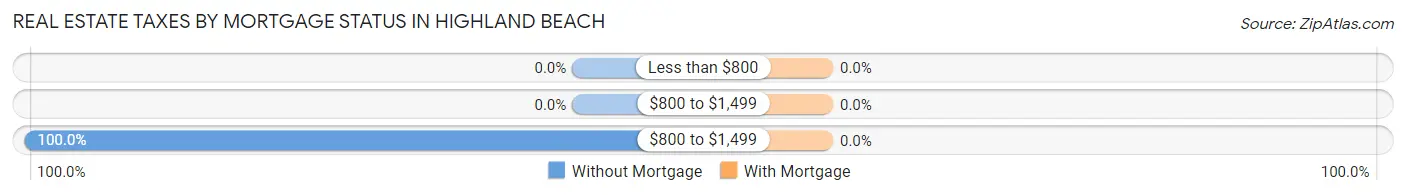
| Property Taxes | Without Mortgage | With Mortgage |
| Less than $800 | 0 (0.0%) | 0 (0.0%) |
| $800 to $1,499 | 0 (0.0%) | 0 (0.0%) |
| $800 to $1,499 | 9 (100.0%) | 0 (0.0%) |
| Total | 9 (100.0%) | 23 (100.0%) |
Health & Disability in Highland Beach
Health Insurance Coverage by Age in Highland Beach
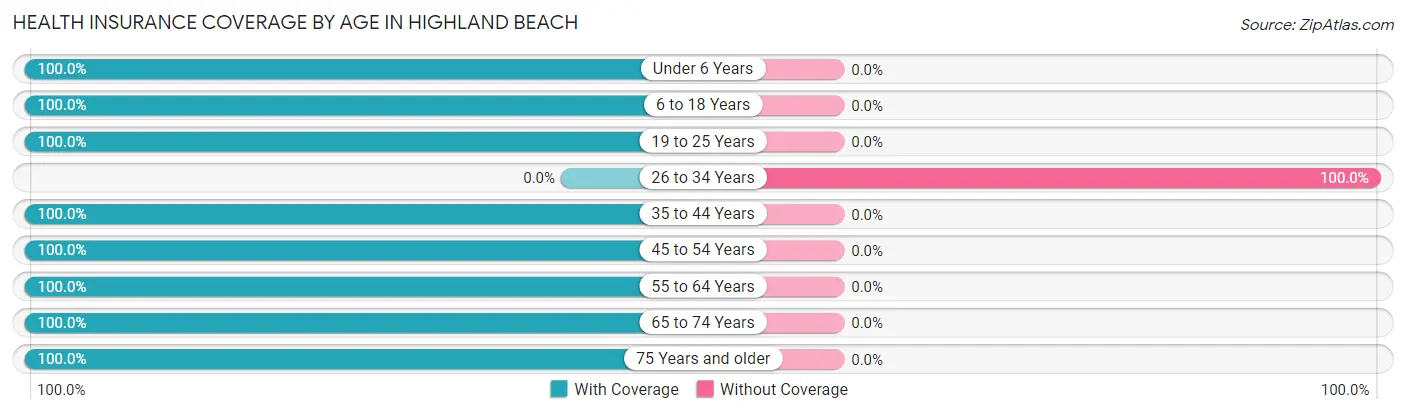
| Age Bracket | With Coverage | Without Coverage |
| Under 6 Years | 1 (100.0%) | 0 (0.0%) |
| 6 to 18 Years | 8 (100.0%) | 0 (0.0%) |
| 19 to 25 Years | 1 (100.0%) | 0 (0.0%) |
| 26 to 34 Years | 0 (0.0%) | 4 (100.0%) |
| 35 to 44 Years | 3 (100.0%) | 0 (0.0%) |
| 45 to 54 Years | 2 (100.0%) | 0 (0.0%) |
| 55 to 64 Years | 6 (100.0%) | 0 (0.0%) |
| 65 to 74 Years | 16 (100.0%) | 0 (0.0%) |
| 75 Years and older | 21 (100.0%) | 0 (0.0%) |
| Total | 58 (93.5%) | 4 (6.5%) |
Health Insurance Coverage by Citizenship Status in Highland Beach
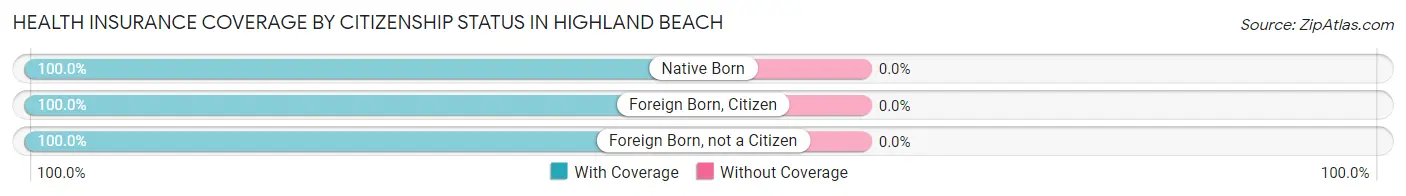
| Citizenship Status | With Coverage | Without Coverage |
| Native Born | 1 (100.0%) | 0 (0.0%) |
| Foreign Born, Citizen | 8 (100.0%) | 0 (0.0%) |
| Foreign Born, not a Citizen | 1 (100.0%) | 0 (0.0%) |
Health Insurance Coverage by Household Income in Highland Beach
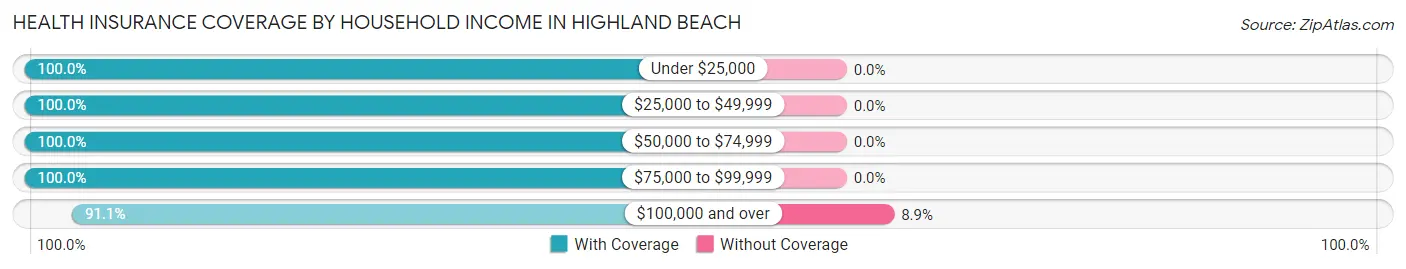
| Household Income | With Coverage | Without Coverage |
| Under $25,000 | 2 (100.0%) | 0 (0.0%) |
| $25,000 to $49,999 | 4 (100.0%) | 0 (0.0%) |
| $50,000 to $74,999 | 5 (100.0%) | 0 (0.0%) |
| $75,000 to $99,999 | 6 (100.0%) | 0 (0.0%) |
| $100,000 and over | 41 (91.1%) | 4 (8.9%) |
Public vs Private Health Insurance Coverage by Age in Highland Beach
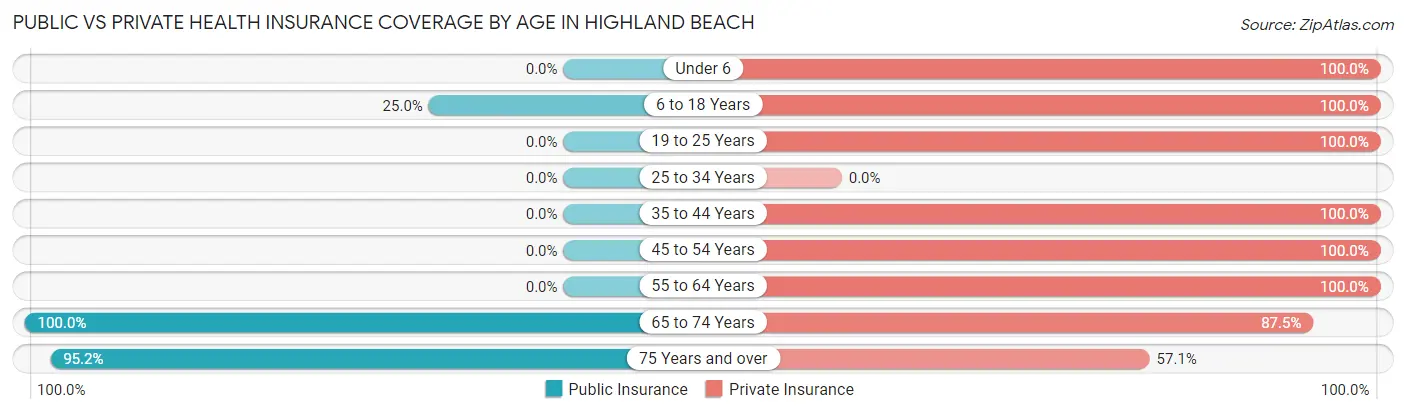
| Age Bracket | Public Insurance | Private Insurance |
| Under 6 | 0 (0.0%) | 1 (100.0%) |
| 6 to 18 Years | 2 (25.0%) | 8 (100.0%) |
| 19 to 25 Years | 0 (0.0%) | 1 (100.0%) |
| 25 to 34 Years | 0 (0.0%) | 0 (0.0%) |
| 35 to 44 Years | 0 (0.0%) | 3 (100.0%) |
| 45 to 54 Years | 0 (0.0%) | 2 (100.0%) |
| 55 to 64 Years | 0 (0.0%) | 6 (100.0%) |
| 65 to 74 Years | 16 (100.0%) | 14 (87.5%) |
| 75 Years and over | 20 (95.2%) | 12 (57.1%) |
| Total | 38 (61.3%) | 47 (75.8%) |
Disability Status by Sex by Age in Highland Beach
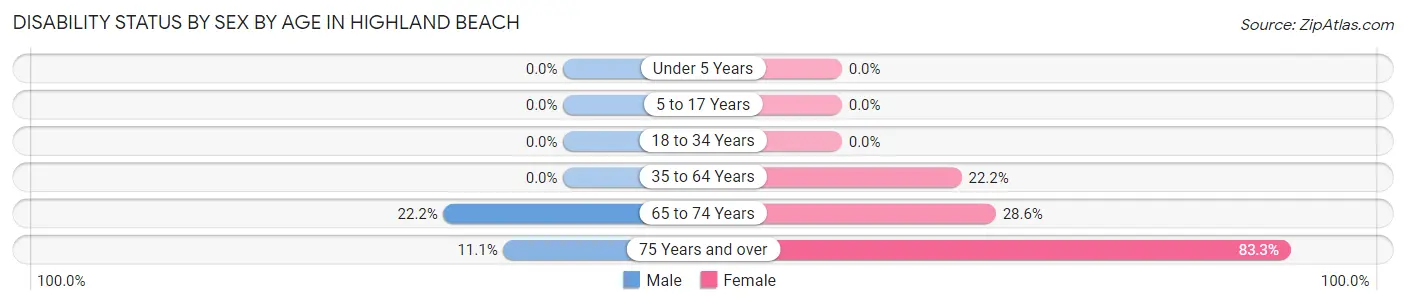
| Age Bracket | Male | Female |
| Under 5 Years | 0 (0.0%) | 0 (0.0%) |
| 5 to 17 Years | 0 (0.0%) | 0 (0.0%) |
| 18 to 34 Years | 0 (0.0%) | 0 (0.0%) |
| 35 to 64 Years | 0 (0.0%) | 2 (22.2%) |
| 65 to 74 Years | 2 (22.2%) | 2 (28.6%) |
| 75 Years and over | 1 (11.1%) | 10 (83.3%) |
Disability Class by Sex by Age in Highland Beach
Disability Class: Hearing Difficulty
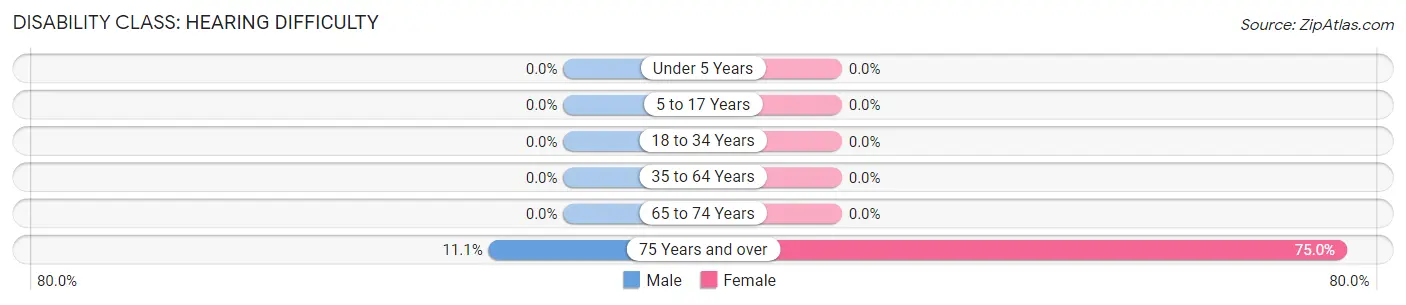
| Age Bracket | Male | Female |
| Under 5 Years | 0 (0.0%) | 0 (0.0%) |
| 5 to 17 Years | 0 (0.0%) | 0 (0.0%) |
| 18 to 34 Years | 0 (0.0%) | 0 (0.0%) |
| 35 to 64 Years | 0 (0.0%) | 0 (0.0%) |
| 65 to 74 Years | 0 (0.0%) | 0 (0.0%) |
| 75 Years and over | 1 (11.1%) | 9 (75.0%) |
Disability Class: Vision Difficulty
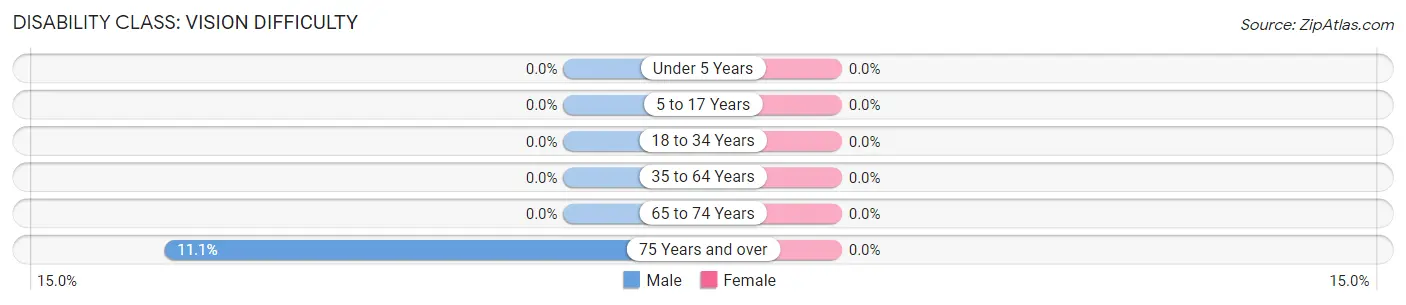
| Age Bracket | Male | Female |
| Under 5 Years | 0 (0.0%) | 0 (0.0%) |
| 5 to 17 Years | 0 (0.0%) | 0 (0.0%) |
| 18 to 34 Years | 0 (0.0%) | 0 (0.0%) |
| 35 to 64 Years | 0 (0.0%) | 0 (0.0%) |
| 65 to 74 Years | 0 (0.0%) | 0 (0.0%) |
| 75 Years and over | 1 (11.1%) | 0 (0.0%) |
Disability Class: Cognitive Difficulty
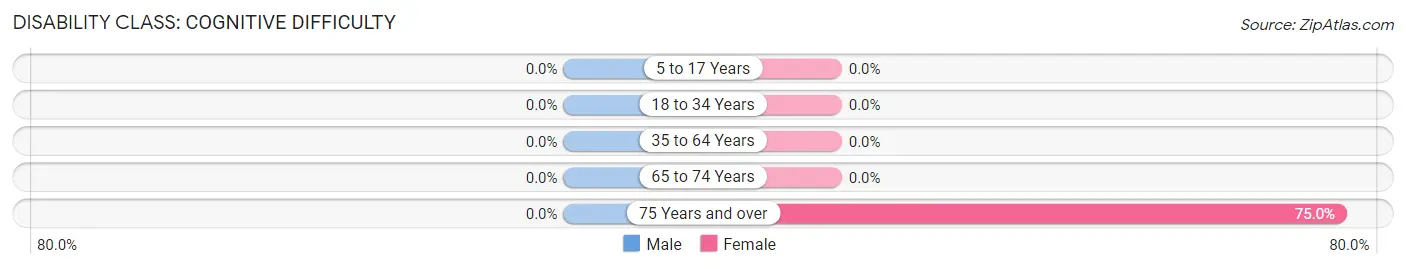
| Age Bracket | Male | Female |
| 5 to 17 Years | 0 (0.0%) | 0 (0.0%) |
| 18 to 34 Years | 0 (0.0%) | 0 (0.0%) |
| 35 to 64 Years | 0 (0.0%) | 0 (0.0%) |
| 65 to 74 Years | 0 (0.0%) | 0 (0.0%) |
| 75 Years and over | 0 (0.0%) | 9 (75.0%) |
Disability Class: Ambulatory Difficulty
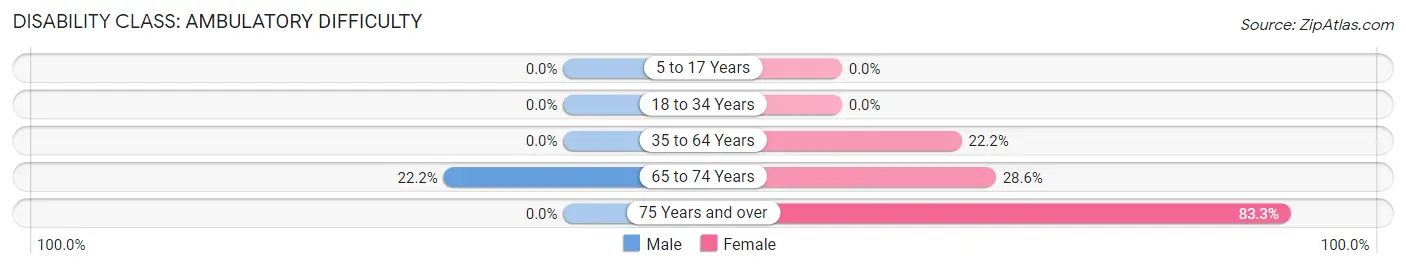
| Age Bracket | Male | Female |
| 5 to 17 Years | 0 (0.0%) | 0 (0.0%) |
| 18 to 34 Years | 0 (0.0%) | 0 (0.0%) |
| 35 to 64 Years | 0 (0.0%) | 2 (22.2%) |
| 65 to 74 Years | 2 (22.2%) | 2 (28.6%) |
| 75 Years and over | 0 (0.0%) | 10 (83.3%) |
Disability Class: Self-Care Difficulty
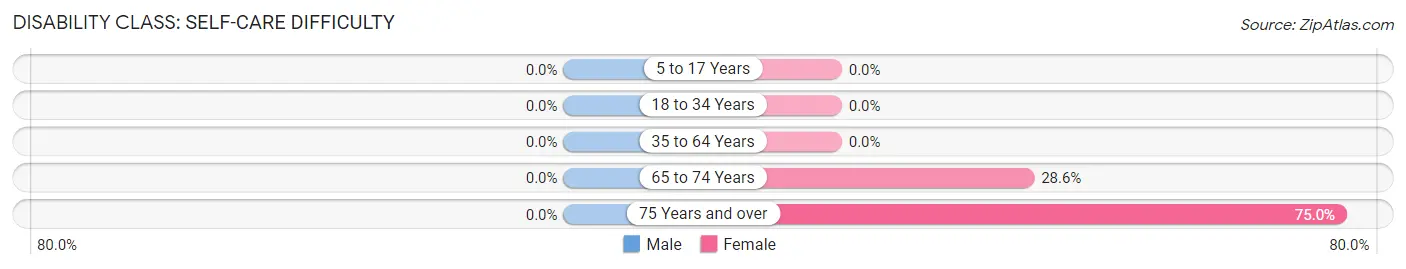
| Age Bracket | Male | Female |
| 5 to 17 Years | 0 (0.0%) | 0 (0.0%) |
| 18 to 34 Years | 0 (0.0%) | 0 (0.0%) |
| 35 to 64 Years | 0 (0.0%) | 0 (0.0%) |
| 65 to 74 Years | 0 (0.0%) | 2 (28.6%) |
| 75 Years and over | 0 (0.0%) | 9 (75.0%) |
Technology Access in Highland Beach
Computing Device Access in Highland Beach
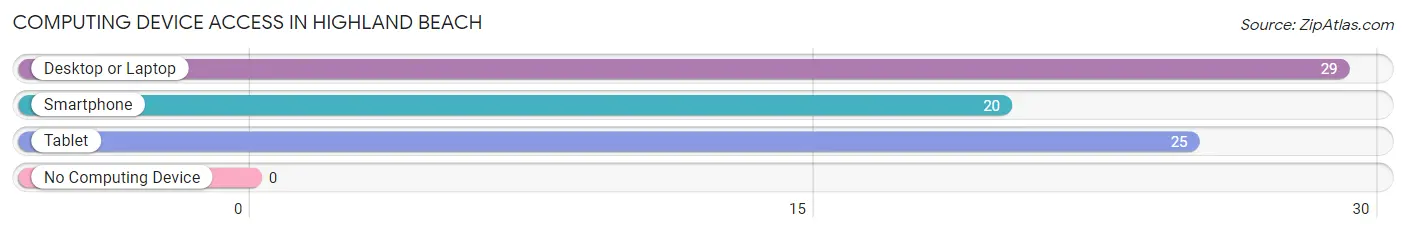
| Device Type | # Households | % Households |
| Desktop or Laptop | 29 | 85.3% |
| Smartphone | 20 | 58.8% |
| Tablet | 25 | 73.5% |
| No Computing Device | 0 | 0.0% |
| Total | 34 | 100.0% |
Internet Access in Highland Beach
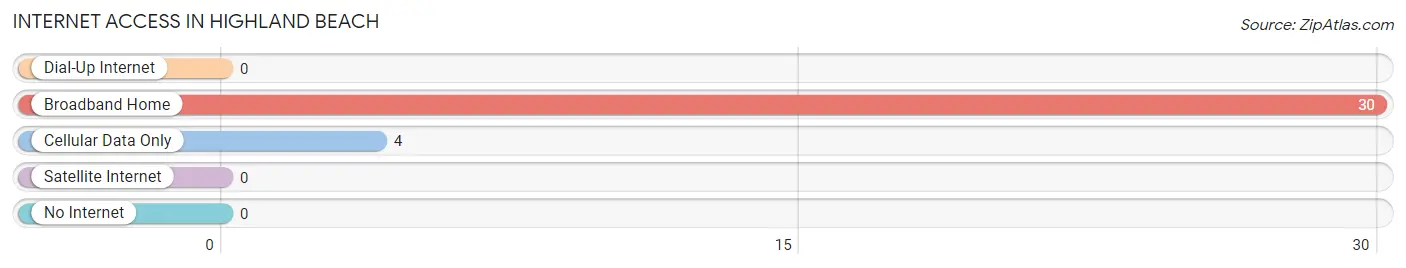
| Internet Type | # Households | % Households |
| Dial-Up Internet | 0 | 0.0% |
| Broadband Home | 30 | 88.2% |
| Cellular Data Only | 4 | 11.8% |
| Satellite Internet | 0 | 0.0% |
| No Internet | 0 | 0.0% |
| Total | 34 | 100.0% |
Highland Beach Summary
Highland Beach is a small town located in Anne Arundel County, Maryland, United States. It is situated on the Chesapeake Bay, just south of Annapolis. The town was founded in 1887 by a group of wealthy Baltimoreans who wanted to escape the hustle and bustle of the city. The town has a population of just over 1,000 people and is known for its beautiful beaches, waterfront views, and relaxed atmosphere.
History
Highland Beach was founded in 1887 by a group of wealthy Baltimoreans who wanted to escape the hustle and bustle of the city. The town was originally called “Highland Beach Park” and was developed as a summer resort for the wealthy. The town was incorporated in 1895 and was named after the high elevation of the land.
The town was a popular destination for wealthy vacationers from Baltimore and Washington, D.C. who wanted to escape the heat of the city. The town was also known for its beautiful beaches and waterfront views.
In the early 1900s, the town began to attract more permanent residents. The town was home to a number of prominent families, including the Duvalls, the Bakers, and the Wilsons. The town was also home to a number of prominent African-American families, including the Johnsons, the Smiths, and the Washingtons.
Geography
Highland Beach is located in Anne Arundel County, Maryland, United States. It is situated on the Chesapeake Bay, just south of Annapolis. The town is bordered by the Magothy River to the north and the South River to the south. The town is located on a peninsula, with the Chesapeake Bay to the east and the Magothy River to the west.
The town has a total area of 0.7 square miles, all of which is land. The town has a humid subtropical climate, with hot, humid summers and mild winters.
Economy
Highland Beach is a small, residential town with a limited economy. The town is home to a number of small businesses, including restaurants, shops, and marinas. The town is also home to a number of vacation rental properties, which attract visitors from around the region.
The town is also home to a number of waterfront properties, which are popular with wealthy vacationers. The town is also home to a number of marinas, which attract boaters from around the region.
Demographics
Highland Beach has a population of just over 1,000 people. The town is predominantly white, with a small African-American population. The median household income in the town is $75,000, and the median home value is $400,000. The town has a low crime rate and is considered to be a safe place to live.
Common Questions
What is Per Capita Income in Highland Beach?
Per Capita income in Highland Beach is $98,695.
What is the Median Family Income in Highland Beach?
Median Family Income in Highland Beach is $166,250.
What is the Median Household income in Highland Beach?
Median Household Income in Highland Beach is $158,611.
What is Income or Wage Gap in Highland Beach?
Income or Wage Gap in Highland Beach is 31.7%.
Women in Highland Beach earn 68.3 cents for every dollar earned by a man.
What is Inequality or Gini Index in Highland Beach?
Inequality or Gini Index in Highland Beach is 0.34.
What is the Total Population of Highland Beach?
Total Population of Highland Beach is 62.
What is the Total Male Population of Highland Beach?
Total Male Population of Highland Beach is 26.
What is the Total Female Population of Highland Beach?
Total Female Population of Highland Beach is 36.
What is the Ratio of Males per 100 Females in Highland Beach?
There are 72.22 Males per 100 Females in Highland Beach.
What is the Ratio of Females per 100 Males in Highland Beach?
There are 138.46 Females per 100 Males in Highland Beach.
What is the Median Population Age in Highland Beach?
Median Population Age in Highland Beach is 71.3 Years.
What is the Average Family Size in Highland Beach
Average Family Size in Highland Beach is 2.4 People.
What is the Average Household Size in Highland Beach
Average Household Size in Highland Beach is 1.8 People.
How Large is the Labor Force in Highland Beach?
There are 31 People in the Labor Forcein in Highland Beach.
What is the Percentage of People in the Labor Force in Highland Beach?
53.4% of People are in the Labor Force in Highland Beach.