Konterra, MD Map & Demographics
Konterra Map
Konterra Overview
$61,569
PER CAPITA INCOME
$150,903
AVG FAMILY INCOME
$150,274
AVG HOUSEHOLD INCOME
21.1%
WAGE / INCOME GAP [ % ]
78.9¢/ $1
WAGE / INCOME GAP [ $ ]
0.35
INEQUALITY / GINI INDEX
3,104
TOTAL POPULATION
1,343
MALE POPULATION
1,761
FEMALE POPULATION
76.26
MALES / 100 FEMALES
131.12
FEMALES / 100 MALES
51.1
MEDIAN AGE
3.0
AVG FAMILY SIZE
2.6
AVG HOUSEHOLD SIZE
1,573
LABOR FORCE [ PEOPLE ]
61.5%
PERCENT IN LABOR FORCE
7.6%
UNEMPLOYMENT RATE
Income in Konterra
Income Overview in Konterra
Per Capita Income in Konterra is $61,569, while median incomes of families and households are $150,903 and $150,274 respectively.
| Characteristic | Number | Measure |
| Per Capita Income | 3,104 | $61,569 |
| Median Family Income | 894 | $150,903 |
| Mean Family Income | 894 | $174,757 |
| Median Household Income | 1,184 | $150,274 |
| Mean Household Income | 1,184 | $158,710 |
| Income Deficit | 894 | $0 |
| Wage / Income Gap (%) | 3,104 | 21.09% |
| Wage / Income Gap ($) | 3,104 | 78.91¢ per $1 |
| Gini / Inequality Index | 3,104 | 0.35 |
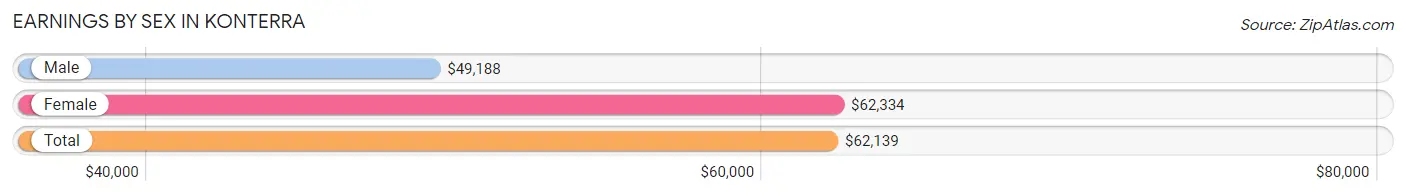
Earnings by Sex in Konterra
Average Earnings in Konterra are $62,139, $49,188 for men and $62,334 for women, a difference of 21.1%.
| Sex | Number | Average Earnings |
| Male | 731 (46.3%) | $49,188 |
| Female | 849 (53.7%) | $62,334 |
| Total | 1,580 (100.0%) | $62,139 |
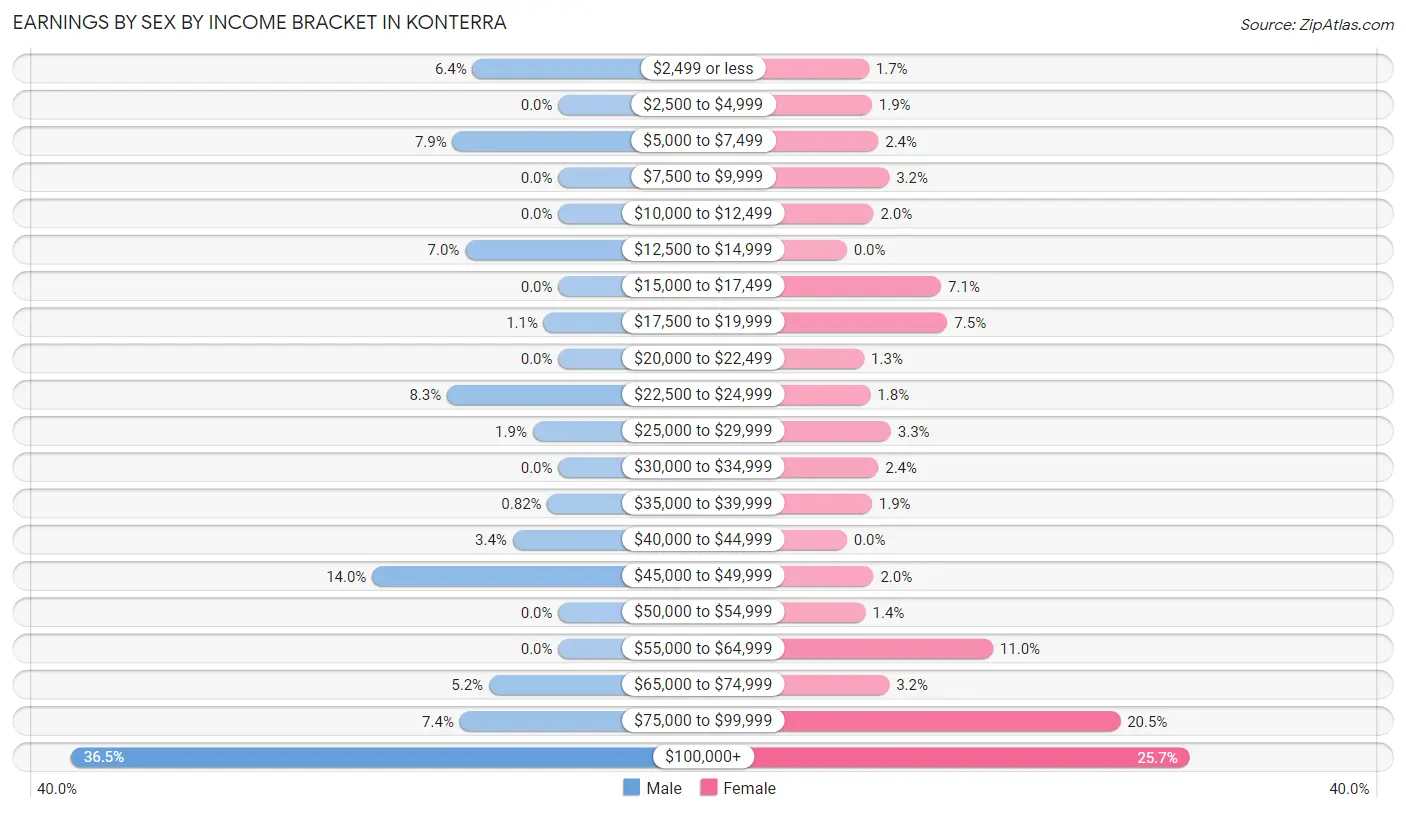
Earnings by Sex by Income Bracket in Konterra
The most common earnings brackets in Konterra are $100,000+ for men (267 | 36.5%) and $100,000+ for women (218 | 25.7%).
| Income | Male | Female |
| $2,499 or less | 47 (6.4%) | 14 (1.7%) |
| $2,500 to $4,999 | 0 (0.0%) | 16 (1.9%) |
| $5,000 to $7,499 | 58 (7.9%) | 20 (2.4%) |
| $7,500 to $9,999 | 0 (0.0%) | 27 (3.2%) |
| $10,000 to $12,499 | 0 (0.0%) | 17 (2.0%) |
| $12,500 to $14,999 | 51 (7.0%) | 0 (0.0%) |
| $15,000 to $17,499 | 0 (0.0%) | 60 (7.1%) |
| $17,500 to $19,999 | 8 (1.1%) | 64 (7.5%) |
| $20,000 to $22,499 | 0 (0.0%) | 11 (1.3%) |
| $22,500 to $24,999 | 61 (8.3%) | 15 (1.8%) |
| $25,000 to $29,999 | 14 (1.9%) | 28 (3.3%) |
| $30,000 to $34,999 | 0 (0.0%) | 20 (2.4%) |
| $35,000 to $39,999 | 6 (0.8%) | 16 (1.9%) |
| $40,000 to $44,999 | 25 (3.4%) | 0 (0.0%) |
| $45,000 to $49,999 | 102 (14.0%) | 17 (2.0%) |
| $50,000 to $54,999 | 0 (0.0%) | 12 (1.4%) |
| $55,000 to $64,999 | 0 (0.0%) | 93 (11.0%) |
| $65,000 to $74,999 | 38 (5.2%) | 27 (3.2%) |
| $75,000 to $99,999 | 54 (7.4%) | 174 (20.5%) |
| $100,000+ | 267 (36.5%) | 218 (25.7%) |
| Total | 731 (100.0%) | 849 (100.0%) |
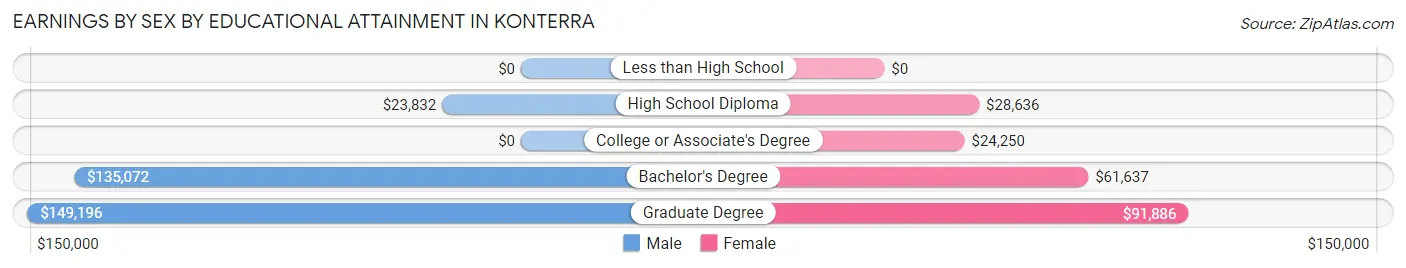
Earnings by Sex by Educational Attainment in Konterra
Average earnings in Konterra are $67,560 for men and $76,094 for women, a difference of 11.2%. Men with an educational attainment of graduate degree enjoy the highest average annual earnings of $149,196, while those with high school diploma education earn the least with $23,832. Women with an educational attainment of graduate degree earn the most with the average annual earnings of $91,886, while those with college or associate's degree education have the smallest earnings of $24,250.
| Educational Attainment | Male Income | Female Income |
| Less than High School | - | - |
| High School Diploma | $23,832 | $28,636 |
| College or Associate's Degree | - | - |
| Bachelor's Degree | $135,072 | $61,637 |
| Graduate Degree | $149,196 | $91,886 |
| Total | $67,560 | $76,094 |
Family Income in Konterra
Family Income Brackets in Konterra
According to the Konterra family income data, there are 399 families falling into the $200,000+ income range, which is the most common income bracket and makes up 44.6% of all families.
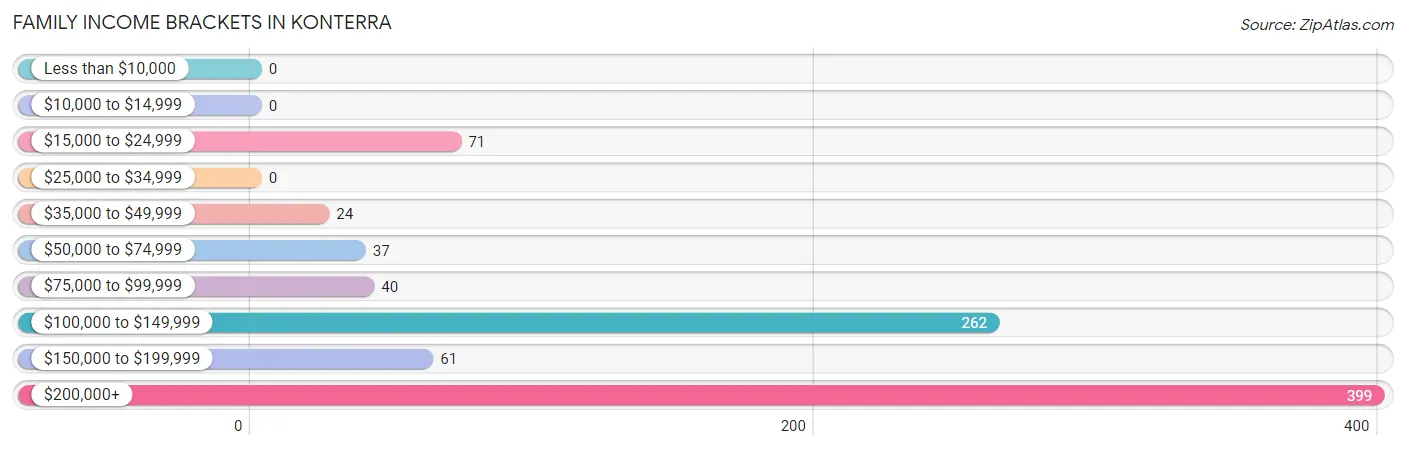
| Income Bracket | # Families | % Families |
| Less than $10,000 | 0 | 0.0% |
| $10,000 to $14,999 | 0 | 0.0% |
| $15,000 to $24,999 | 71 | 7.9% |
| $25,000 to $34,999 | 0 | 0.0% |
| $35,000 to $49,999 | 24 | 2.7% |
| $50,000 to $74,999 | 37 | 4.1% |
| $75,000 to $99,999 | 40 | 4.5% |
| $100,000 to $149,999 | 262 | 29.3% |
| $150,000 to $199,999 | 61 | 6.8% |
| $200,000+ | 399 | 44.6% |
Family Income by Famaliy Size in Konterra
4-person families (86 | 9.6%) account for the highest median family income in Konterra with $211,000 per family, while 2-person families (498 | 55.7%) have the highest median income of $69,241 per family member.
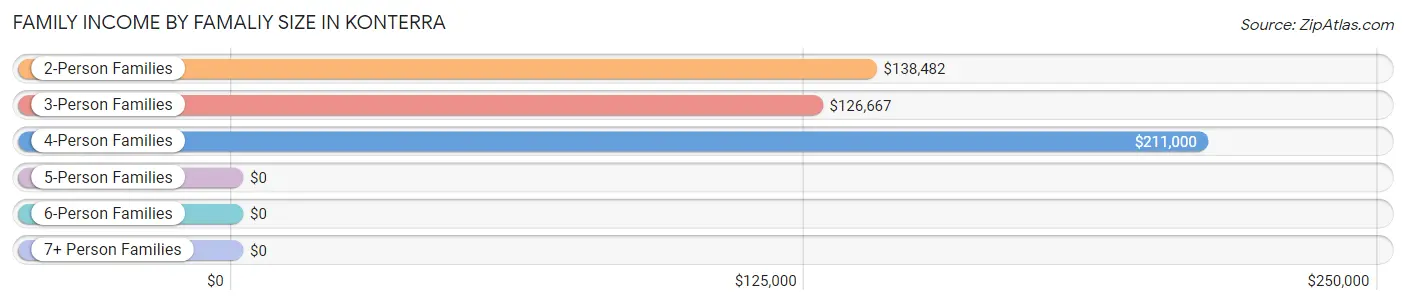
| Income Bracket | # Families | Median Income |
| 2-Person Families | 498 (55.7%) | $138,482 |
| 3-Person Families | 202 (22.6%) | $126,667 |
| 4-Person Families | 86 (9.6%) | $211,000 |
| 5-Person Families | 35 (3.9%) | $0 |
| 6-Person Families | 4 (0.4%) | $0 |
| 7+ Person Families | 69 (7.7%) | $0 |
| Total | 894 (100.0%) | $150,903 |
Family Income by Number of Earners in Konterra
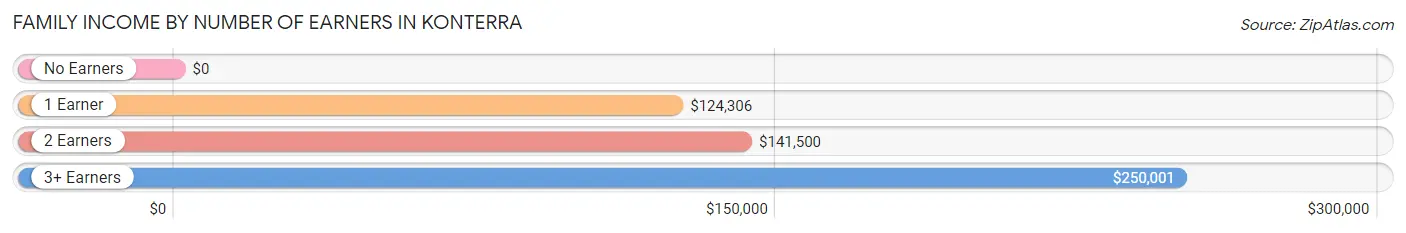
| Number of Earners | # Families | Median Income |
| No Earners | 113 (12.6%) | $0 |
| 1 Earner | 325 (36.3%) | $124,306 |
| 2 Earners | 334 (37.4%) | $141,500 |
| 3+ Earners | 122 (13.7%) | $250,001 |
| Total | 894 (100.0%) | $150,903 |
Household Income in Konterra
Household Income Brackets in Konterra
With 448 households falling in the category, the $200,000+ income range is the most frequent in Konterra, accounting for 37.8% of all households.
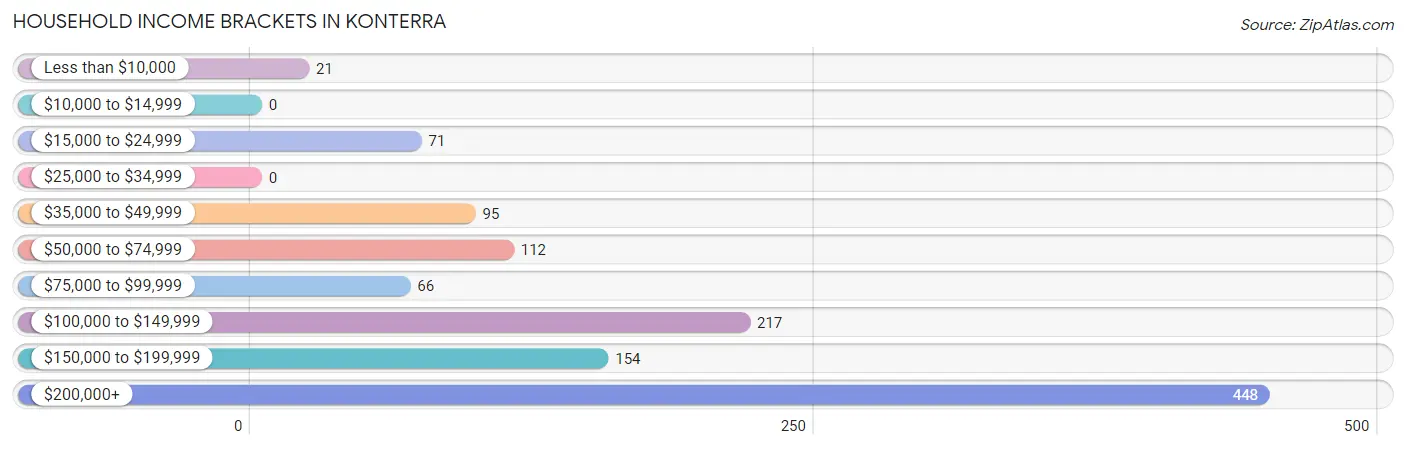
| Income Bracket | # Households | % Households |
| Less than $10,000 | 21 | 1.8% |
| $10,000 to $14,999 | 0 | 0.0% |
| $15,000 to $24,999 | 71 | 6.0% |
| $25,000 to $34,999 | 0 | 0.0% |
| $35,000 to $49,999 | 95 | 8.0% |
| $50,000 to $74,999 | 112 | 9.5% |
| $75,000 to $99,999 | 66 | 5.6% |
| $100,000 to $149,999 | 217 | 18.3% |
| $150,000 to $199,999 | 154 | 13.0% |
| $200,000+ | 448 | 37.8% |
Household Income by Householder Age in Konterra
The median household income in Konterra is $150,274, with the highest median household income of $203,750 found in the 25 to 44 years age bracket for the primary householder. A total of 223 households (18.8%) fall into this category.
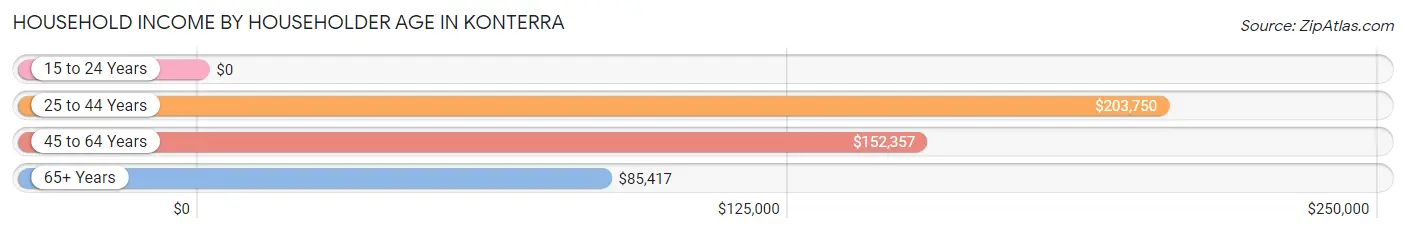
| Income Bracket | # Households | Median Income |
| 15 to 24 Years | 0 (0.0%) | $0 |
| 25 to 44 Years | 223 (18.8%) | $203,750 |
| 45 to 64 Years | 449 (37.9%) | $152,357 |
| 65+ Years | 512 (43.2%) | $85,417 |
| Total | 1,184 (100.0%) | $150,274 |
Poverty in Konterra
Income Below Poverty by Sex and Age in Konterra
With 10.6% poverty level for males and 6.1% for females among the residents of Konterra, 12 to 14 year old males and 5 year old females are the most vulnerable to poverty, with 37 males (72.6%) and 31 females (100.0%) in their respective age groups living below the poverty level.
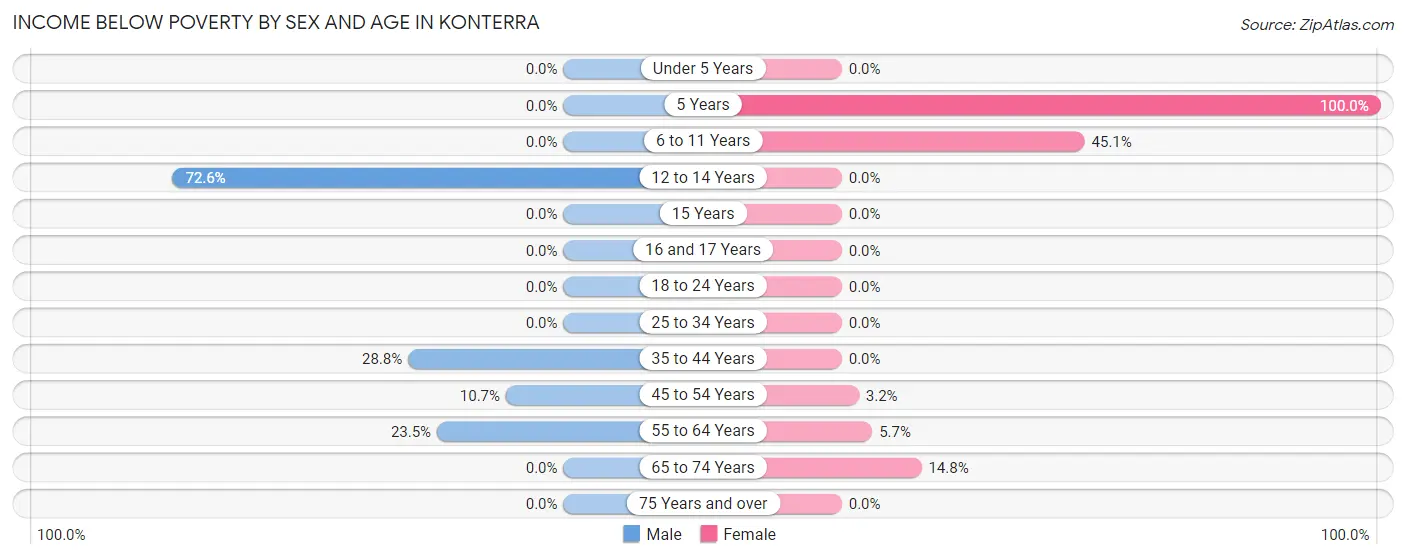
| Age Bracket | Male | Female |
| Under 5 Years | 0 (0.0%) | 0 (0.0%) |
| 5 Years | 0 (0.0%) | 31 (100.0%) |
| 6 to 11 Years | 0 (0.0%) | 32 (45.1%) |
| 12 to 14 Years | 37 (72.6%) | 0 (0.0%) |
| 15 Years | 0 (0.0%) | 0 (0.0%) |
| 16 and 17 Years | 0 (0.0%) | 0 (0.0%) |
| 18 to 24 Years | 0 (0.0%) | 0 (0.0%) |
| 25 to 34 Years | 0 (0.0%) | 0 (0.0%) |
| 35 to 44 Years | 32 (28.8%) | 0 (0.0%) |
| 45 to 54 Years | 35 (10.7%) | 7 (3.2%) |
| 55 to 64 Years | 38 (23.5%) | 17 (5.7%) |
| 65 to 74 Years | 0 (0.0%) | 21 (14.8%) |
| 75 Years and over | 0 (0.0%) | 0 (0.0%) |
| Total | 142 (10.6%) | 108 (6.1%) |
Income Above Poverty by Sex and Age in Konterra
According to the poverty statistics in Konterra, males aged under 5 years and females aged under 5 years are the age groups that are most secure financially, with 100.0% of males and 100.0% of females in these age groups living above the poverty line.
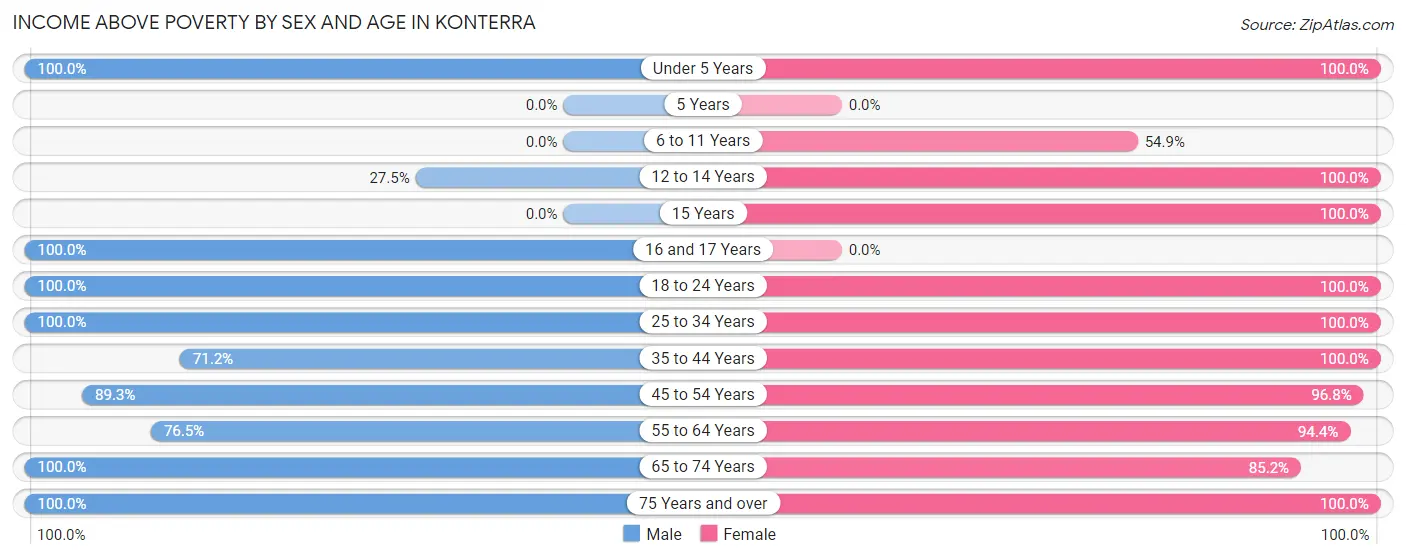
| Age Bracket | Male | Female |
| Under 5 Years | 180 (100.0%) | 156 (100.0%) |
| 5 Years | 0 (0.0%) | 0 (0.0%) |
| 6 to 11 Years | 0 (0.0%) | 39 (54.9%) |
| 12 to 14 Years | 14 (27.5%) | 50 (100.0%) |
| 15 Years | 0 (0.0%) | 8 (100.0%) |
| 16 and 17 Years | 27 (100.0%) | 0 (0.0%) |
| 18 to 24 Years | 21 (100.0%) | 116 (100.0%) |
| 25 to 34 Years | 144 (100.0%) | 122 (100.0%) |
| 35 to 44 Years | 79 (71.2%) | 159 (100.0%) |
| 45 to 54 Years | 293 (89.3%) | 214 (96.8%) |
| 55 to 64 Years | 124 (76.5%) | 284 (94.4%) |
| 65 to 74 Years | 141 (100.0%) | 121 (85.2%) |
| 75 Years and over | 176 (100.0%) | 382 (100.0%) |
| Total | 1,199 (89.4%) | 1,651 (93.9%) |
Income Below Poverty Among Married-Couple Families in Konterra
The poverty statistics for married-couple families in Konterra show that 8.4% or 52 of the total 616 families live below the poverty line. Families with 3 or 4 children have the highest poverty rate of 33.7%, comprising of 35 families. On the other hand, families with 1 or 2 children have the lowest poverty rate of 0.0%, which includes 0 families.
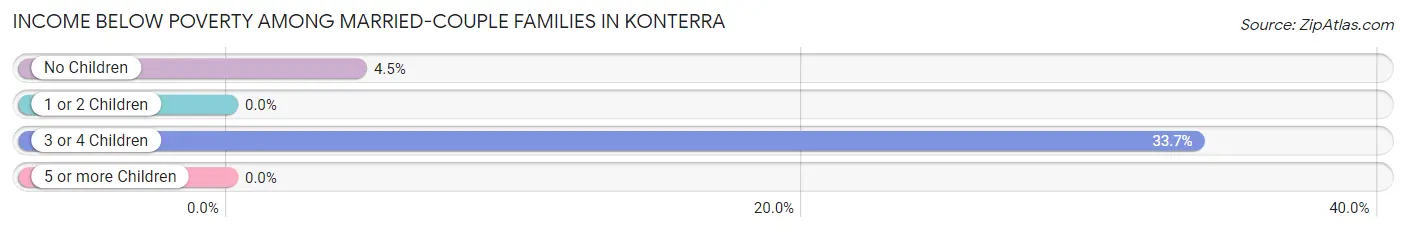
| Children | Above Poverty | Below Poverty |
| No Children | 362 (95.5%) | 17 (4.5%) |
| 1 or 2 Children | 133 (100.0%) | 0 (0.0%) |
| 3 or 4 Children | 69 (66.3%) | 35 (33.7%) |
| 5 or more Children | 0 (0.0%) | 0 (0.0%) |
| Total | 564 (91.6%) | 52 (8.4%) |
Income Below Poverty Among Single-Parent Households in Konterra
| Children | Single Father | Single Mother |
| No Children | 0 (0.0%) | 0 (0.0%) |
| 1 or 2 Children | 0 (0.0%) | 0 (0.0%) |
| 3 or 4 Children | 0 (0.0%) | 0 (0.0%) |
| 5 or more Children | 0 (0.0%) | 0 (0.0%) |
| Total | 0 (0.0%) | 0 (0.0%) |
Income Below Poverty Among Married-Couple vs Single-Parent Households in Konterra
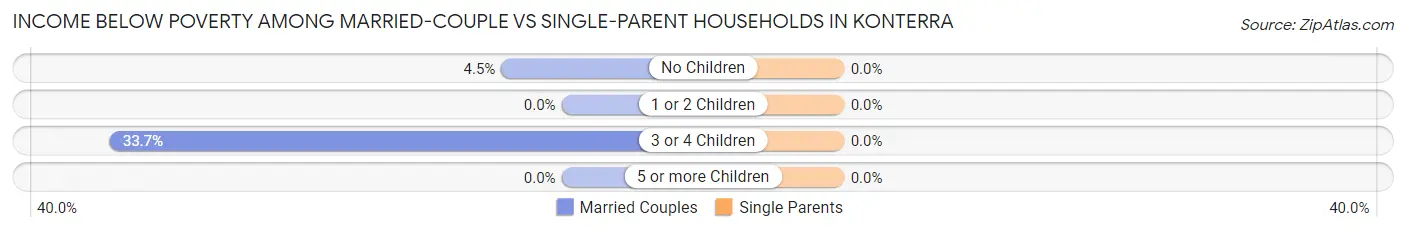
| Children | Married-Couple Families | Single-Parent Households |
| No Children | 17 (4.5%) | 0 (0.0%) |
| 1 or 2 Children | 0 (0.0%) | 0 (0.0%) |
| 3 or 4 Children | 35 (33.7%) | 0 (0.0%) |
| 5 or more Children | 0 (0.0%) | 0 (0.0%) |
| Total | 52 (8.4%) | 0 (0.0%) |
Race in Konterra
The most populous races in Konterra are Black / African American (1,990 | 64.1%), Asian (542 | 17.5%), and White / Caucasian (381 | 12.3%).
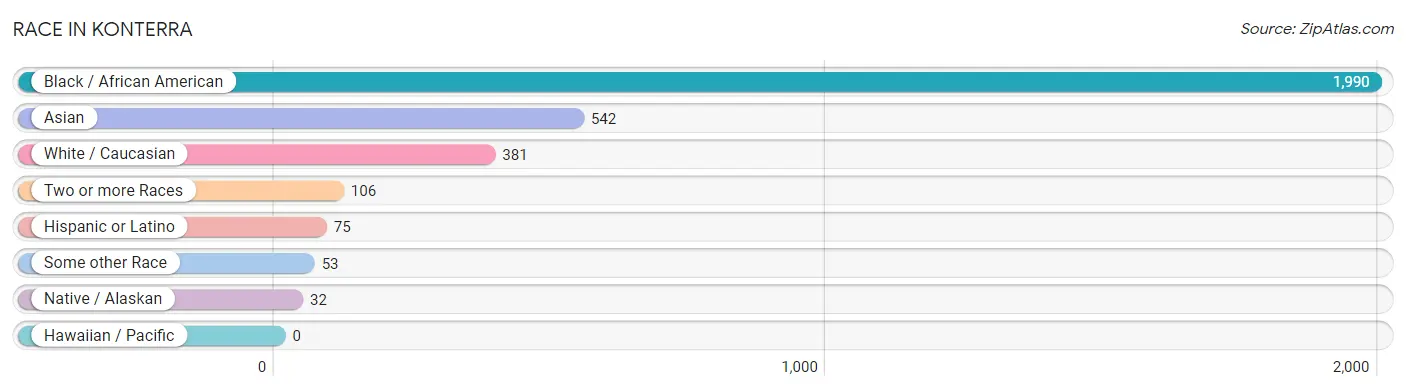
| Race | # Population | % Population |
| Asian | 542 | 17.5% |
| Black / African American | 1,990 | 64.1% |
| Hawaiian / Pacific | 0 | 0.0% |
| Hispanic or Latino | 75 | 2.4% |
| Native / Alaskan | 32 | 1.0% |
| White / Caucasian | 381 | 12.3% |
| Two or more Races | 106 | 3.4% |
| Some other Race | 53 | 1.7% |
| Total | 3,104 | 100.0% |
Ancestry in Konterra
The most populous ancestries reported in Konterra are Subsaharan African (525 | 16.9%), African (490 | 15.8%), Sri Lankan (325 | 10.5%), Thai (155 | 5.0%), and Italian (113 | 3.6%), together accounting for 51.8% of all Konterra residents.
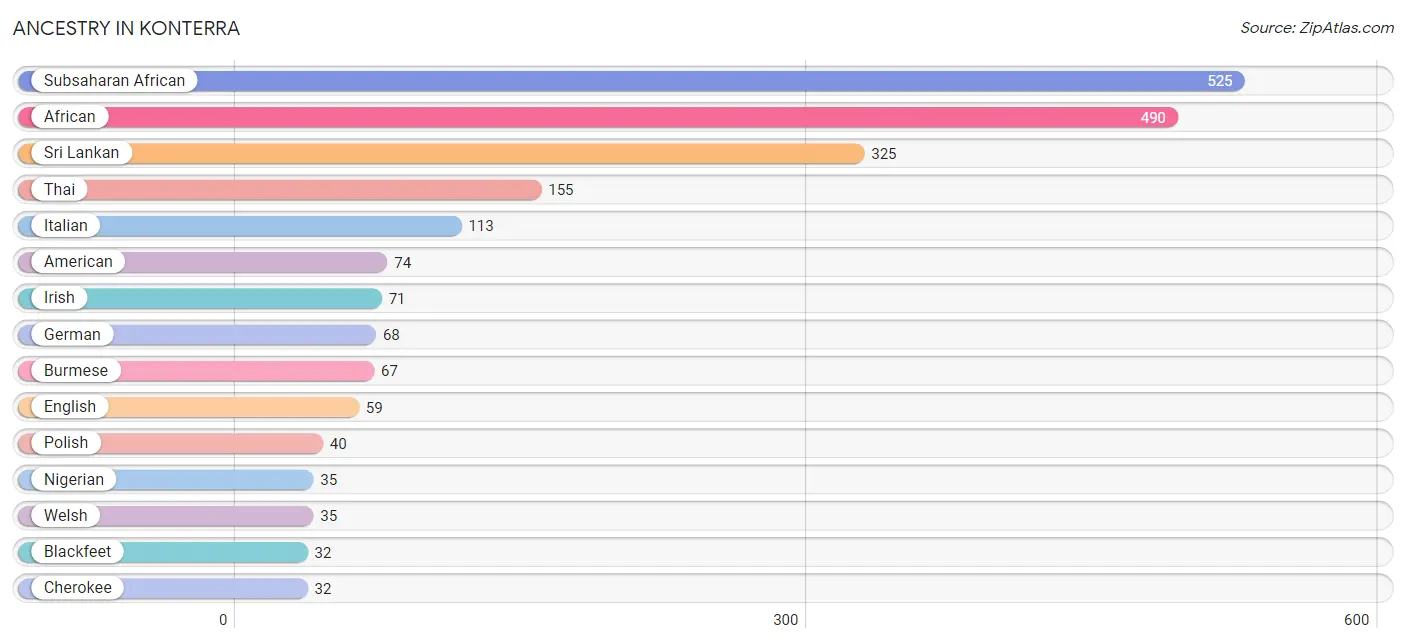
| Ancestry | # Population | % Population |
| African | 490 | 15.8% |
| American | 74 | 2.4% |
| Barbadian | 5 | 0.2% |
| Blackfeet | 32 | 1.0% |
| British | 7 | 0.2% |
| Burmese | 67 | 2.2% |
| Central American | 22 | 0.7% |
| Cherokee | 32 | 1.0% |
| Danish | 14 | 0.4% |
| Dominican | 27 | 0.9% |
| English | 59 | 1.9% |
| European | 9 | 0.3% |
| French | 12 | 0.4% |
| French Canadian | 10 | 0.3% |
| German | 68 | 2.2% |
| Indonesian | 30 | 1.0% |
| Irish | 71 | 2.3% |
| Italian | 113 | 3.6% |
| Korean | 31 | 1.0% |
| Mexican | 26 | 0.8% |
| Nicaraguan | 22 | 0.7% |
| Nigerian | 35 | 1.1% |
| Norwegian | 10 | 0.3% |
| Polish | 40 | 1.3% |
| Scandinavian | 14 | 0.4% |
| Slovene | 29 | 0.9% |
| Sri Lankan | 325 | 10.5% |
| Subsaharan African | 525 | 16.9% |
| Thai | 155 | 5.0% |
| Welsh | 35 | 1.1% | View All 30 Rows |
Immigrants in Konterra
The most numerous immigrant groups reported in Konterra came from Africa (314 | 10.1%), Asia (299 | 9.6%), Cameroon (277 | 8.9%), Middle Africa (277 | 8.9%), and South Eastern Asia (163 | 5.2%), together accounting for 42.8% of all Konterra residents.
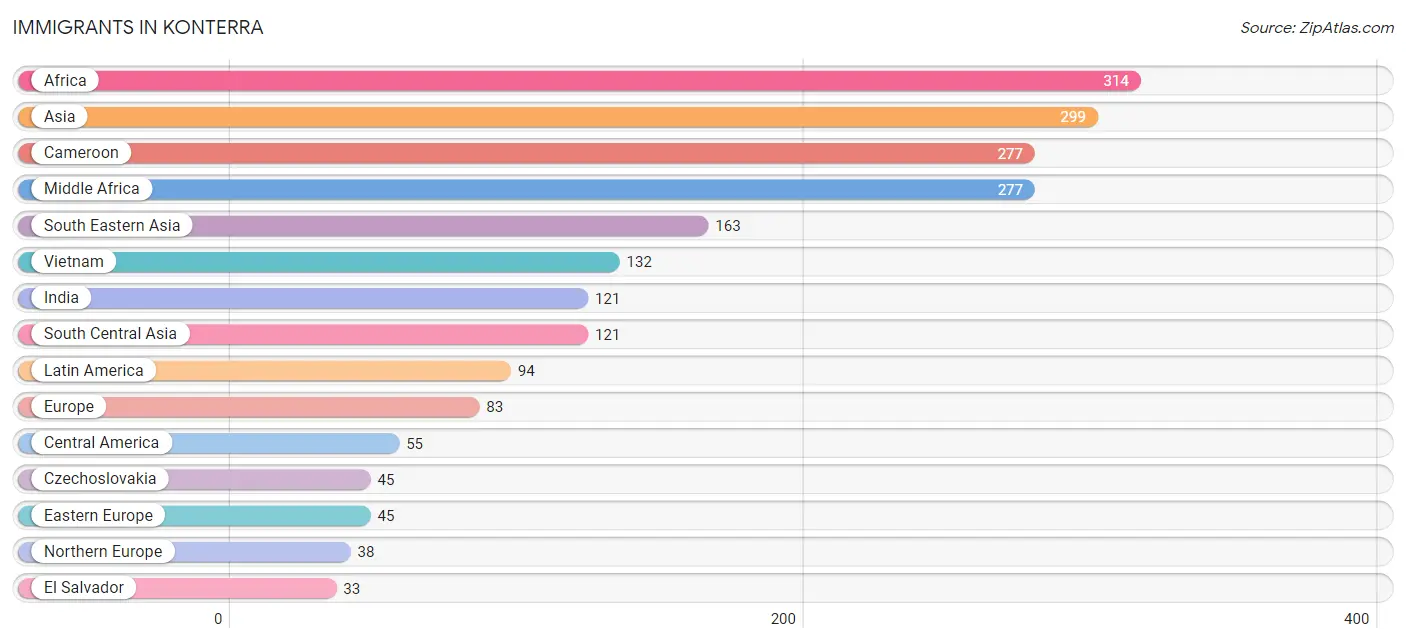
| Immigration Origin | # Population | % Population |
| Africa | 314 | 10.1% |
| Asia | 299 | 9.6% |
| Barbados | 5 | 0.2% |
| Cameroon | 277 | 8.9% |
| Caribbean | 24 | 0.8% |
| Central America | 55 | 1.8% |
| Czechoslovakia | 45 | 1.5% |
| Dominican Republic | 19 | 0.6% |
| Eastern Asia | 15 | 0.5% |
| Eastern Europe | 45 | 1.5% |
| El Salvador | 33 | 1.1% |
| Europe | 83 | 2.7% |
| Guyana | 15 | 0.5% |
| India | 121 | 3.9% |
| Korea | 15 | 0.5% |
| Latin America | 94 | 3.0% |
| Middle Africa | 277 | 8.9% |
| Nicaragua | 22 | 0.7% |
| Nigeria | 17 | 0.5% |
| Northern Europe | 38 | 1.2% |
| Philippines | 12 | 0.4% |
| Scotland | 20 | 0.6% |
| South America | 15 | 0.5% |
| South Central Asia | 121 | 3.9% |
| South Eastern Asia | 163 | 5.2% |
| Vietnam | 132 | 4.3% |
| Western Africa | 17 | 0.5% | View All 27 Rows |
Sex and Age in Konterra
Sex and Age in Konterra
The most populous age groups in Konterra are 50 to 54 Years (245 | 18.2%) for men and 80 to 84 Years (244 | 13.9%) for women.
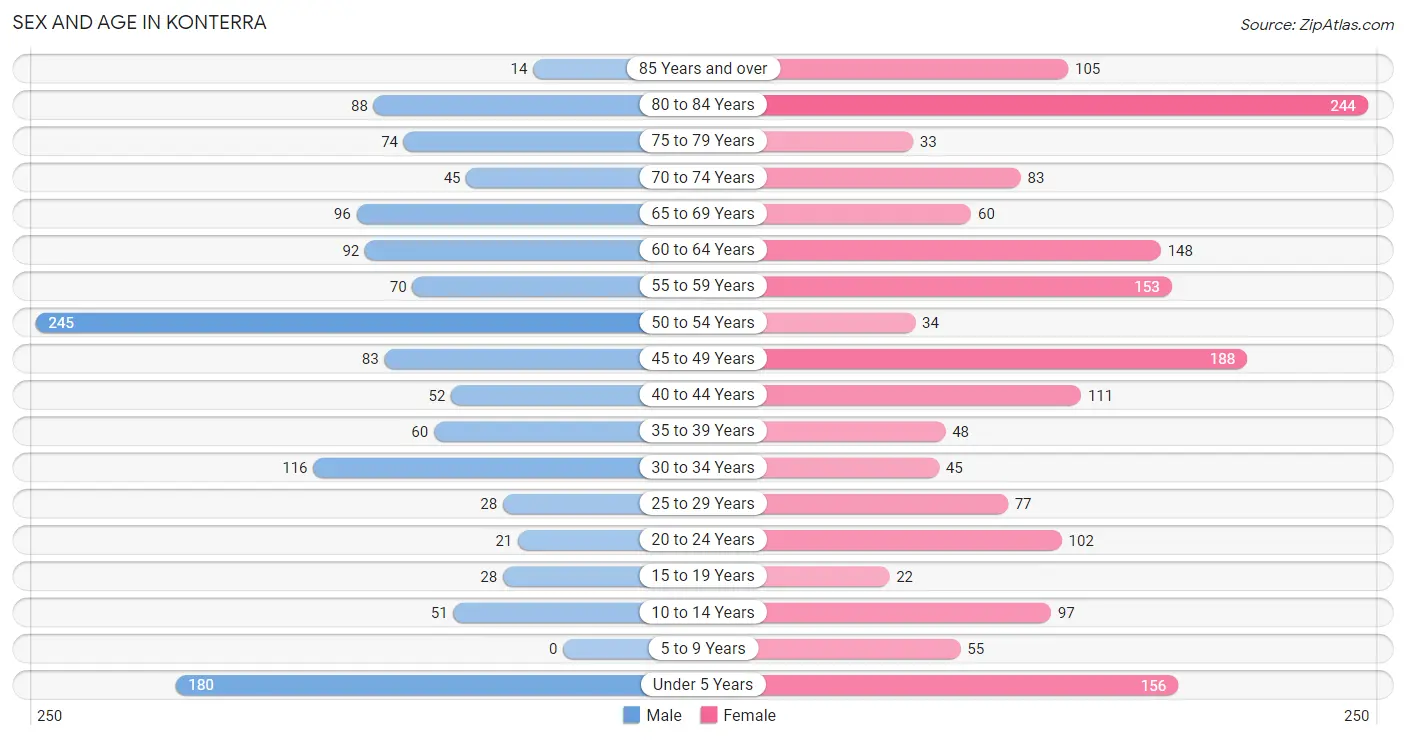
| Age Bracket | Male | Female |
| Under 5 Years | 180 (13.4%) | 156 (8.9%) |
| 5 to 9 Years | 0 (0.0%) | 55 (3.1%) |
| 10 to 14 Years | 51 (3.8%) | 97 (5.5%) |
| 15 to 19 Years | 28 (2.1%) | 22 (1.3%) |
| 20 to 24 Years | 21 (1.6%) | 102 (5.8%) |
| 25 to 29 Years | 28 (2.1%) | 77 (4.4%) |
| 30 to 34 Years | 116 (8.6%) | 45 (2.6%) |
| 35 to 39 Years | 60 (4.5%) | 48 (2.7%) |
| 40 to 44 Years | 52 (3.9%) | 111 (6.3%) |
| 45 to 49 Years | 83 (6.2%) | 188 (10.7%) |
| 50 to 54 Years | 245 (18.2%) | 34 (1.9%) |
| 55 to 59 Years | 70 (5.2%) | 153 (8.7%) |
| 60 to 64 Years | 92 (6.9%) | 148 (8.4%) |
| 65 to 69 Years | 96 (7.1%) | 60 (3.4%) |
| 70 to 74 Years | 45 (3.4%) | 83 (4.7%) |
| 75 to 79 Years | 74 (5.5%) | 33 (1.9%) |
| 80 to 84 Years | 88 (6.6%) | 244 (13.9%) |
| 85 Years and over | 14 (1.0%) | 105 (6.0%) |
| Total | 1,343 (100.0%) | 1,761 (100.0%) |
Families and Households in Konterra
Median Family Size in Konterra
The median family size in Konterra is 3.01 persons per family, with single male/father families (70 | 7.8%) accounting for the largest median family size of 3.3 persons per family. On the other hand, single female/mother families (208 | 23.3%) represent the smallest median family size with 2.47 persons per family.
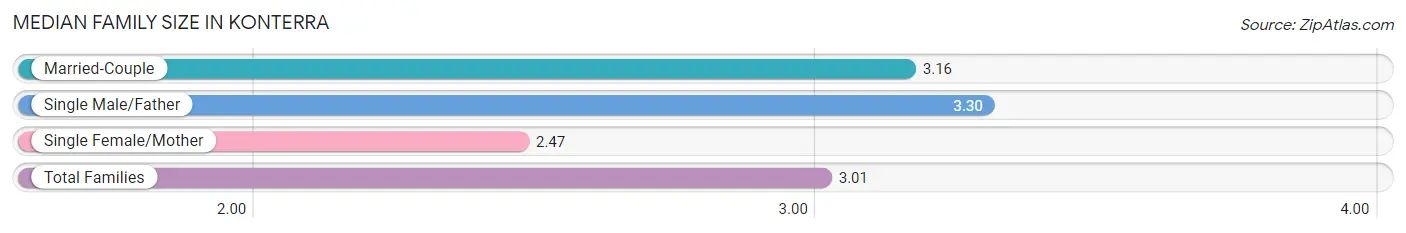
| Family Type | # Families | Family Size |
| Married-Couple | 616 (68.9%) | 3.16 |
| Single Male/Father | 70 (7.8%) | 3.30 |
| Single Female/Mother | 208 (23.3%) | 2.47 |
| Total Families | 894 (100.0%) | 3.01 |
Median Household Size in Konterra
The median household size in Konterra is 2.62 persons per household, with single male/father households (70 | 5.9%) accounting for the largest median household size of 4.34 persons per household. non-family households (290 | 24.5%) represent the smallest median household size with 1.04 persons per household.
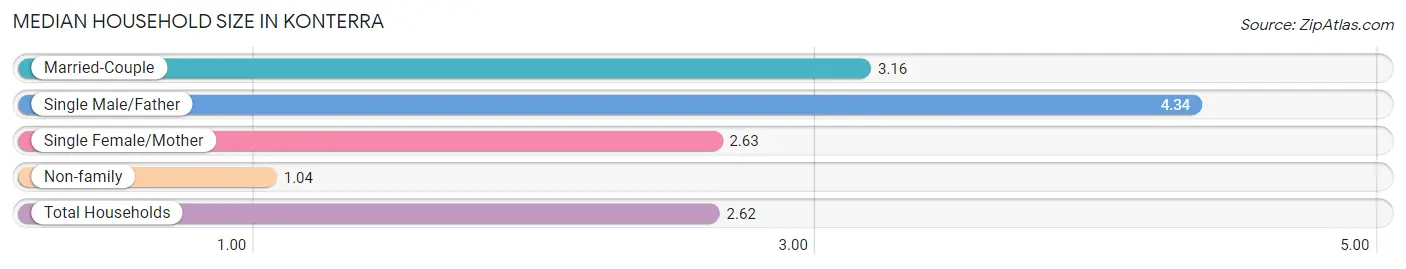
| Household Type | # Households | Household Size |
| Married-Couple | 616 (52.0%) | 3.16 |
| Single Male/Father | 70 (5.9%) | 4.34 |
| Single Female/Mother | 208 (17.6%) | 2.63 |
| Non-family | 290 (24.5%) | 1.04 |
| Total Households | 1,184 (100.0%) | 2.62 |
Household Size by Marriage Status in Konterra
Out of a total of 1,184 households in Konterra, 894 (75.5%) are family households, while 290 (24.5%) are nonfamily households. The most numerous type of family households are 2-person households, comprising 483, and the most common type of nonfamily households are 1-person households, comprising 279.
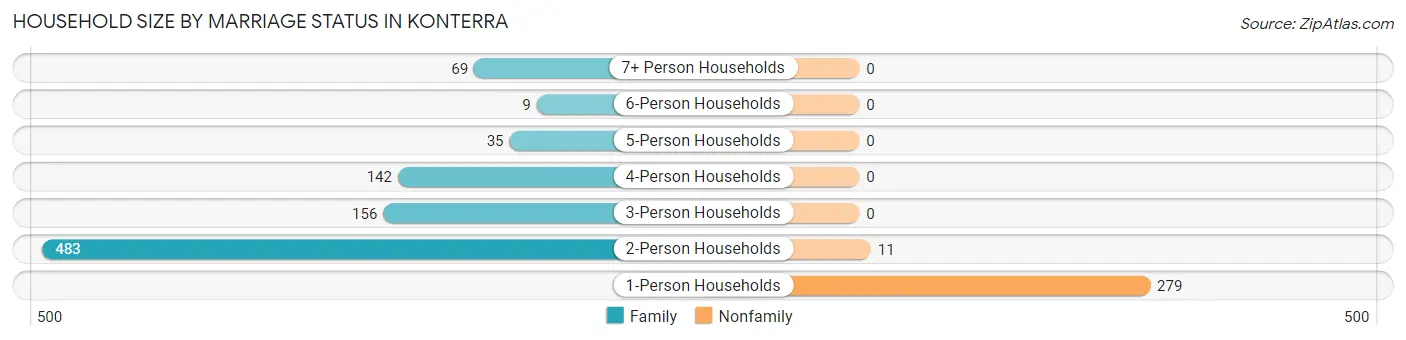
| Household Size | Family Households | Nonfamily Households |
| 1-Person Households | - | 279 (23.6%) |
| 2-Person Households | 483 (40.8%) | 11 (0.9%) |
| 3-Person Households | 156 (13.2%) | 0 (0.0%) |
| 4-Person Households | 142 (12.0%) | 0 (0.0%) |
| 5-Person Households | 35 (3.0%) | 0 (0.0%) |
| 6-Person Households | 9 (0.8%) | 0 (0.0%) |
| 7+ Person Households | 69 (5.8%) | 0 (0.0%) |
| Total | 894 (75.5%) | 290 (24.5%) |
Female Fertility in Konterra
Fertility by Age in Konterra
Average fertility rate in Konterra is 212.0 births per 1,000 women. Women in the age bracket of 20 to 34 years have the highest fertility rate with 540.0 births per 1,000 women. Women in the age bracket of 20 to 34 years acount for 96.0% of all women with births.
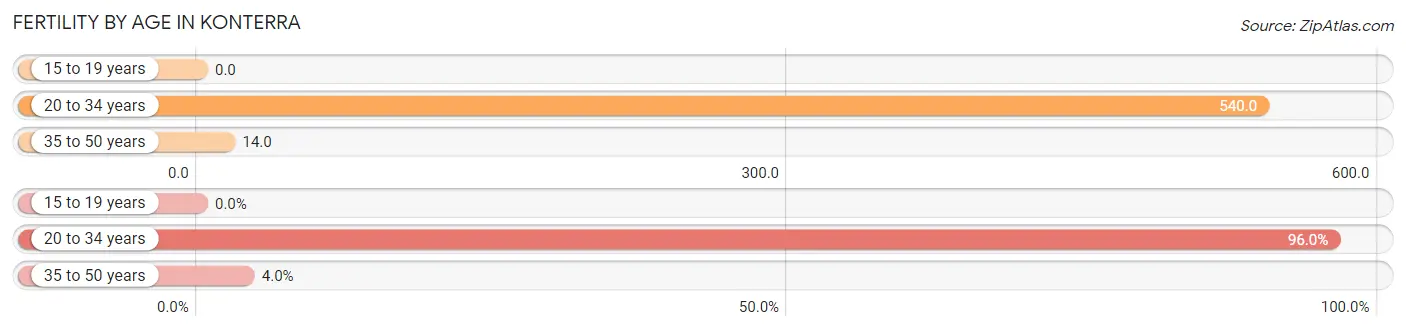
| Age Bracket | Women with Births | Births / 1,000 Women |
| 15 to 19 years | 0 (0.0%) | 0.0 |
| 20 to 34 years | 121 (96.0%) | 540.0 |
| 35 to 50 years | 5 (4.0%) | 14.0 |
| Total | 126 (100.0%) | 212.0 |
Fertility by Age by Marriage Status in Konterra
49.2% of women with births (126) in Konterra are married. The highest percentage of unmarried women with births falls into 20 to 34 years age bracket with 52.9% of them unmarried at the time of birth, while the lowest percentage of unmarried women with births belong to 35 to 50 years age bracket with 0.0% of them unmarried.
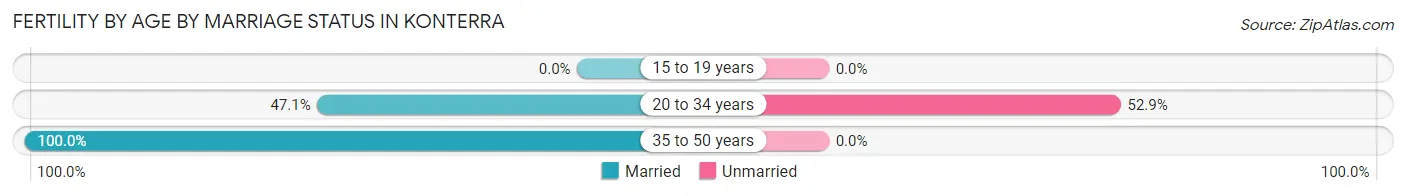
| Age Bracket | Married | Unmarried |
| 15 to 19 years | 0 (0.0%) | 0 (0.0%) |
| 20 to 34 years | 57 (47.1%) | 64 (52.9%) |
| 35 to 50 years | 5 (100.0%) | 0 (0.0%) |
| Total | 62 (49.2%) | 64 (50.8%) |
Fertility by Education in Konterra
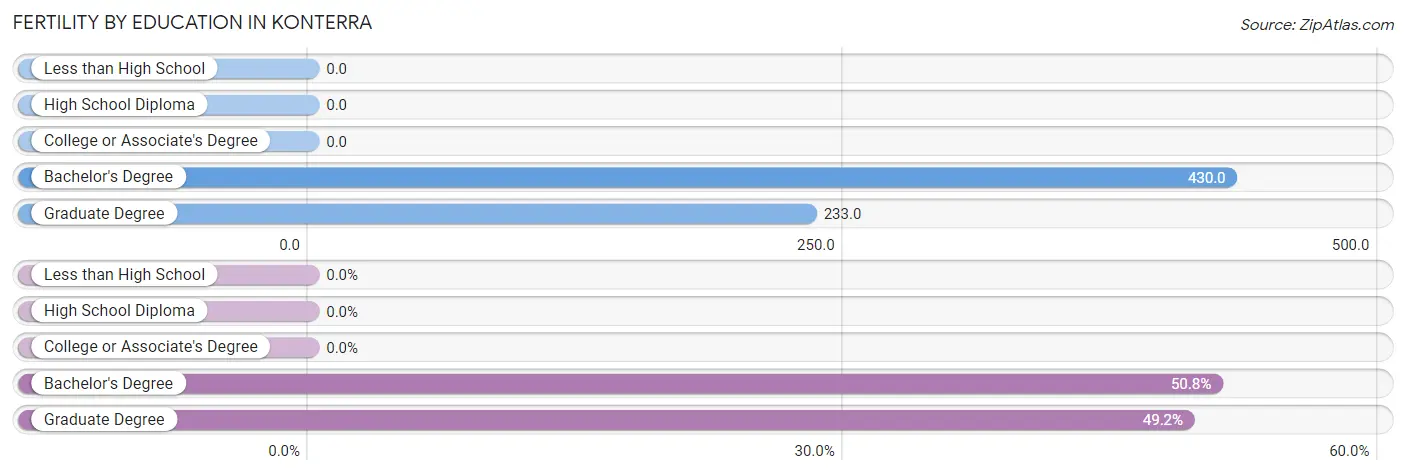
| Educational Attainment | Women with Births | Births / 1,000 Women |
| Less than High School | 0 (0.0%) | 0.0 |
| High School Diploma | 0 (0.0%) | 0.0 |
| College or Associate's Degree | 0 (0.0%) | 0.0 |
| Bachelor's Degree | 64 (50.8%) | 430.0 |
| Graduate Degree | 62 (49.2%) | 233.0 |
| Total | 126 (100.0%) | 212.0 |
Fertility by Education by Marriage Status in Konterra
50.8% of women with births in Konterra are unmarried. Women with the educational attainment of graduate degree are most likely to be married with 100.0% of them married at childbirth, while women with the educational attainment of bachelor's degree are least likely to be married with 100.0% of them unmarried at childbirth.
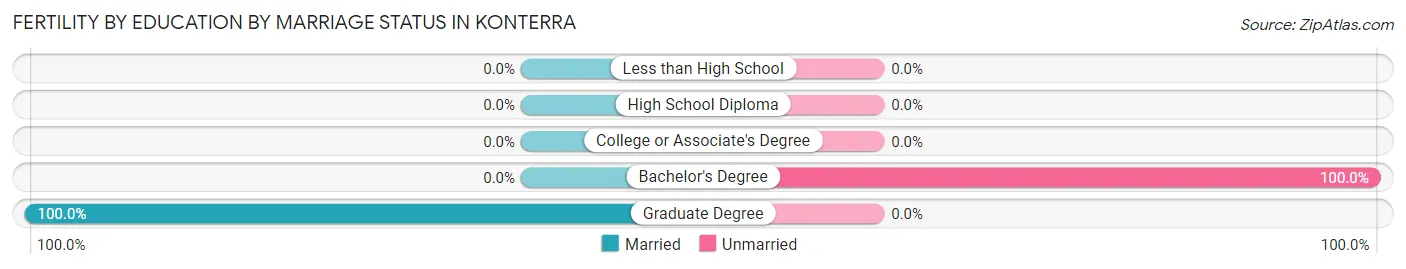
| Educational Attainment | Married | Unmarried |
| Less than High School | 0 (0.0%) | 0 (0.0%) |
| High School Diploma | 0 (0.0%) | 0 (0.0%) |
| College or Associate's Degree | 0 (0.0%) | 0 (0.0%) |
| Bachelor's Degree | 0 (0.0%) | 64 (100.0%) |
| Graduate Degree | 62 (100.0%) | 0 (0.0%) |
| Total | 62 (49.2%) | 64 (50.8%) |
Employment Characteristics in Konterra
Employment by Class of Employer in Konterra
Among the 1,386 employed individuals in Konterra, private company employees (720 | 51.9%), federal government employees (223 | 16.1%), and state government employees (149 | 10.7%) make up the most common classes of employment.
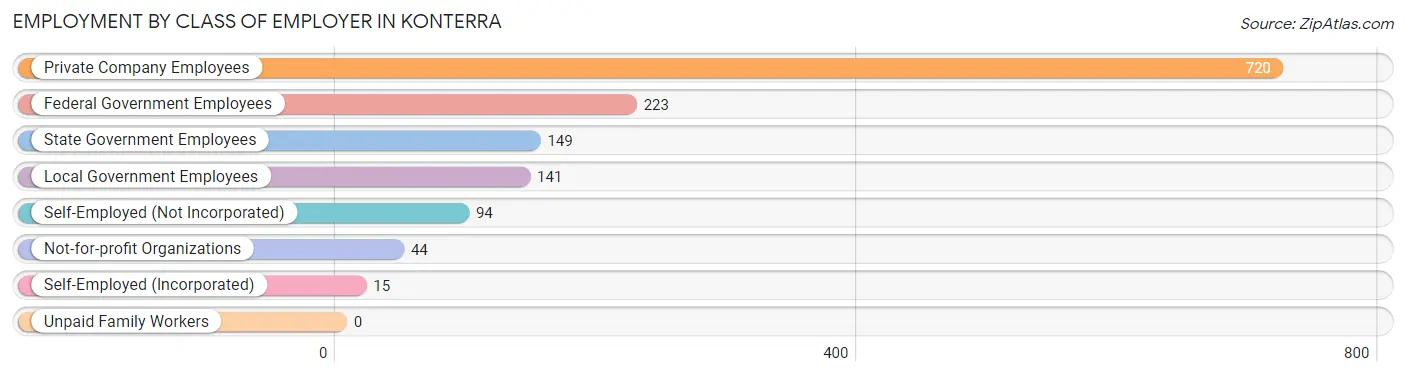
| Employer Class | # Employees | % Employees |
| Private Company Employees | 720 | 51.9% |
| Self-Employed (Incorporated) | 15 | 1.1% |
| Self-Employed (Not Incorporated) | 94 | 6.8% |
| Not-for-profit Organizations | 44 | 3.2% |
| Local Government Employees | 141 | 10.2% |
| State Government Employees | 149 | 10.7% |
| Federal Government Employees | 223 | 16.1% |
| Unpaid Family Workers | 0 | 0.0% |
| Total | 1,386 | 100.0% |
Employment Status by Age in Konterra
According to the labor force statistics for Konterra, out of the total population over 16 years of age (2,557), 61.5% or 1,573 individuals are in the labor force, with 7.6% or 120 of them unemployed. The age group with the highest labor force participation rate is 25 to 29 years, with 100.0% or 105 individuals in the labor force. Within the labor force, the 45 to 54 years age range has the highest percentage of unemployed individuals, with 25.8% or 99 of them being unemployed.
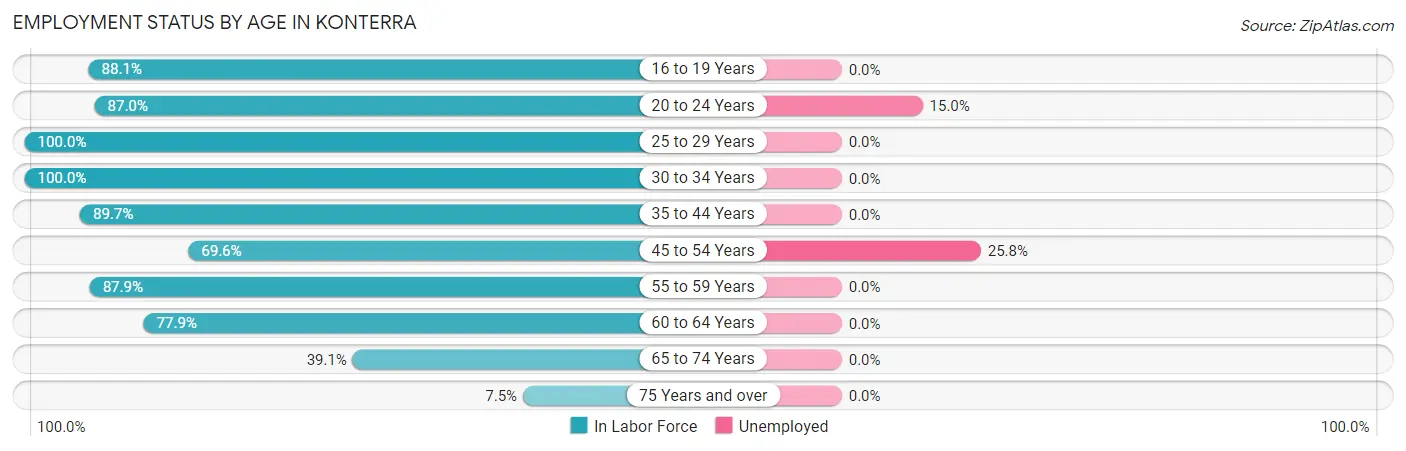
| Age Bracket | In Labor Force | Unemployed |
| 16 to 19 Years | 37 (88.1%) | 0 (0.0%) |
| 20 to 24 Years | 107 (87.0%) | 16 (15.0%) |
| 25 to 29 Years | 105 (100.0%) | 0 (0.0%) |
| 30 to 34 Years | 161 (100.0%) | 0 (0.0%) |
| 35 to 44 Years | 243 (89.7%) | 0 (0.0%) |
| 45 to 54 Years | 383 (69.6%) | 99 (25.8%) |
| 55 to 59 Years | 196 (87.9%) | 0 (0.0%) |
| 60 to 64 Years | 187 (77.9%) | 0 (0.0%) |
| 65 to 74 Years | 111 (39.1%) | 0 (0.0%) |
| 75 Years and over | 42 (7.5%) | 0 (0.0%) |
| Total | 1,573 (61.5%) | 120 (7.6%) |
Employment Status by Educational Attainment in Konterra
According to labor force statistics for Konterra, 82.3% of individuals (1,276) out of the total population between 25 and 64 years of age (1,550) are in the labor force, with 8.2% or 105 of them being unemployed. The group with the highest labor force participation rate are those with the educational attainment of bachelor's degree or higher, with 96.2% or 816 individuals in the labor force. Within the labor force, individuals with high school diploma education have the highest percentage of unemployment, with 22.0% or 61 of them being unemployed.
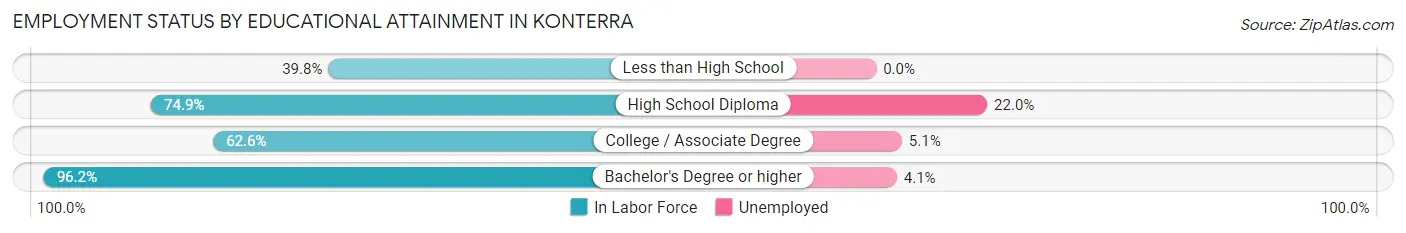
| Educational Attainment | In Labor Force | Unemployed |
| Less than High School | 45 (39.8%) | 0 (0.0%) |
| High School Diploma | 277 (74.9%) | 81 (22.0%) |
| College / Associate Degree | 137 (62.6%) | 11 (5.1%) |
| Bachelor's Degree or higher | 816 (96.2%) | 35 (4.1%) |
| Total | 1,276 (82.3%) | 127 (8.2%) |
Employment Occupations by Sex in Konterra
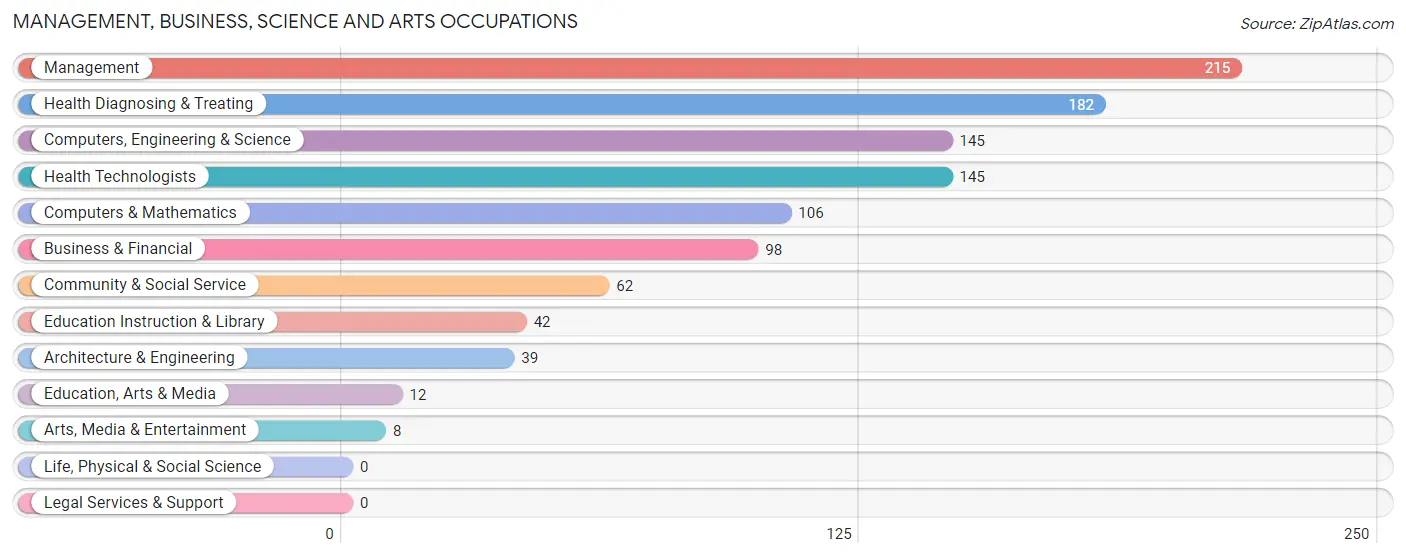
Management, Business, Science and Arts Occupations
The most common Management, Business, Science and Arts occupations in Konterra are Management (215 | 15.5%), Health Diagnosing & Treating (182 | 13.1%), Computers, Engineering & Science (145 | 10.4%), Health Technologists (145 | 10.4%), and Computers & Mathematics (106 | 7.6%).
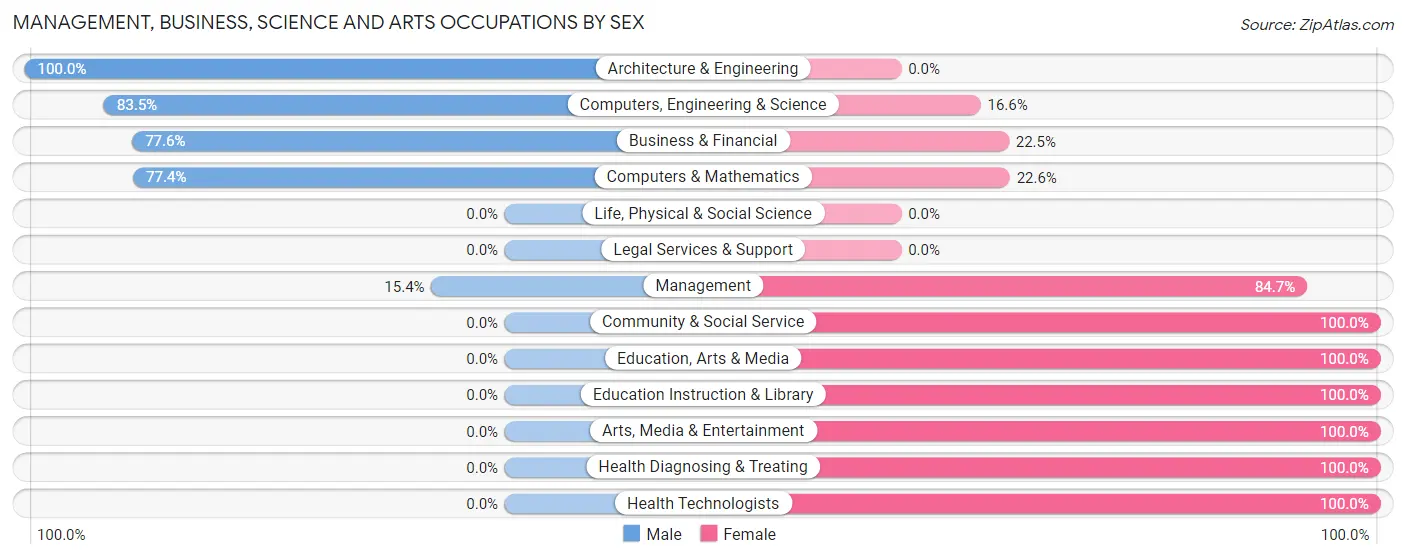
Management, Business, Science and Arts Occupations by Sex
Within the Management, Business, Science and Arts occupations in Konterra, the most male-oriented occupations are Architecture & Engineering (100.0%), Computers, Engineering & Science (83.5%), and Business & Financial (77.5%), while the most female-oriented occupations are Community & Social Service (100.0%), Education, Arts & Media (100.0%), and Education Instruction & Library (100.0%).
| Occupation | Male | Female |
| Management | 33 (15.3%) | 182 (84.7%) |
| Business & Financial | 76 (77.5%) | 22 (22.5%) |
| Computers, Engineering & Science | 121 (83.5%) | 24 (16.6%) |
| Computers & Mathematics | 82 (77.4%) | 24 (22.6%) |
| Architecture & Engineering | 39 (100.0%) | 0 (0.0%) |
| Life, Physical & Social Science | 0 (0.0%) | 0 (0.0%) |
| Community & Social Service | 0 (0.0%) | 62 (100.0%) |
| Education, Arts & Media | 0 (0.0%) | 12 (100.0%) |
| Legal Services & Support | 0 (0.0%) | 0 (0.0%) |
| Education Instruction & Library | 0 (0.0%) | 42 (100.0%) |
| Arts, Media & Entertainment | 0 (0.0%) | 8 (100.0%) |
| Health Diagnosing & Treating | 0 (0.0%) | 182 (100.0%) |
| Health Technologists | 0 (0.0%) | 145 (100.0%) |
| Total (Category) | 230 (32.8%) | 472 (67.2%) |
| Total (Overall) | 641 (46.1%) | 750 (53.9%) |
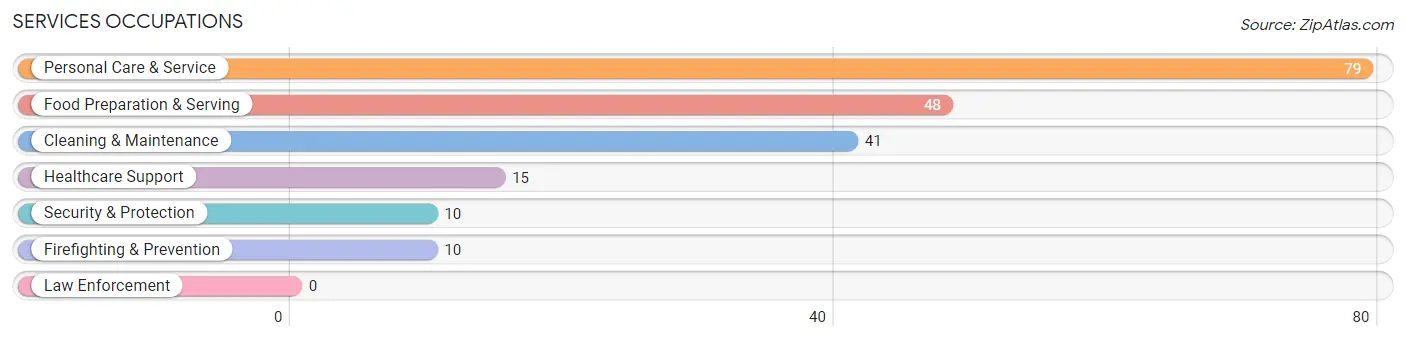
Services Occupations
The most common Services occupations in Konterra are Personal Care & Service (79 | 5.7%), Food Preparation & Serving (48 | 3.5%), Cleaning & Maintenance (41 | 2.9%), Healthcare Support (15 | 1.1%), and Security & Protection (10 | 0.7%).
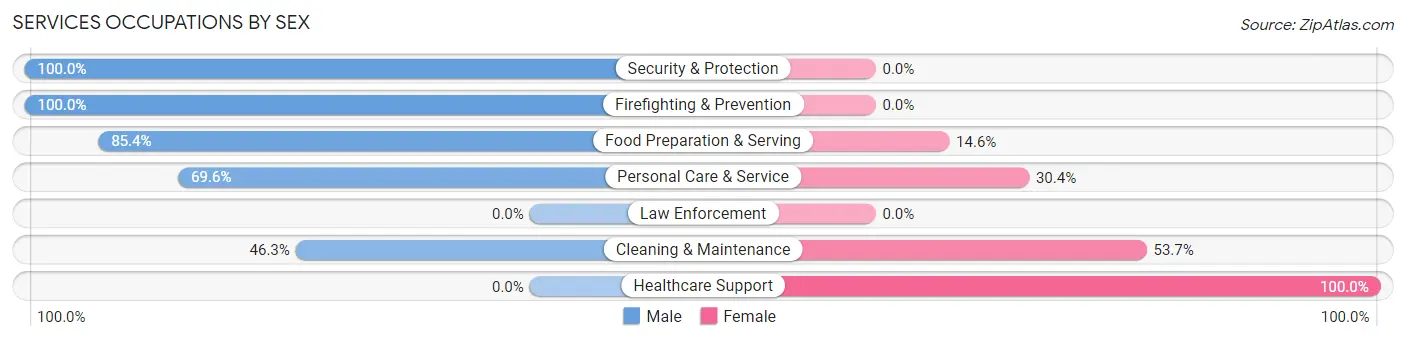
Services Occupations by Sex
Within the Services occupations in Konterra, the most male-oriented occupations are Security & Protection (100.0%), Firefighting & Prevention (100.0%), and Food Preparation & Serving (85.4%), while the most female-oriented occupations are Healthcare Support (100.0%), Cleaning & Maintenance (53.7%), and Personal Care & Service (30.4%).
| Occupation | Male | Female |
| Healthcare Support | 0 (0.0%) | 15 (100.0%) |
| Security & Protection | 10 (100.0%) | 0 (0.0%) |
| Firefighting & Prevention | 10 (100.0%) | 0 (0.0%) |
| Law Enforcement | 0 (0.0%) | 0 (0.0%) |
| Food Preparation & Serving | 41 (85.4%) | 7 (14.6%) |
| Cleaning & Maintenance | 19 (46.3%) | 22 (53.7%) |
| Personal Care & Service | 55 (69.6%) | 24 (30.4%) |
| Total (Category) | 125 (64.8%) | 68 (35.2%) |
| Total (Overall) | 641 (46.1%) | 750 (53.9%) |
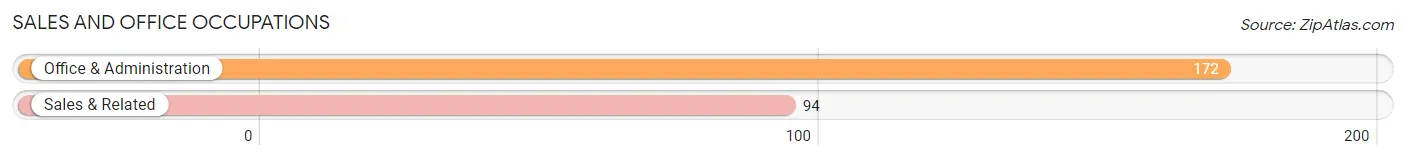
Sales and Office Occupations
The most common Sales and Office occupations in Konterra are Office & Administration (172 | 12.4%), and Sales & Related (94 | 6.8%).
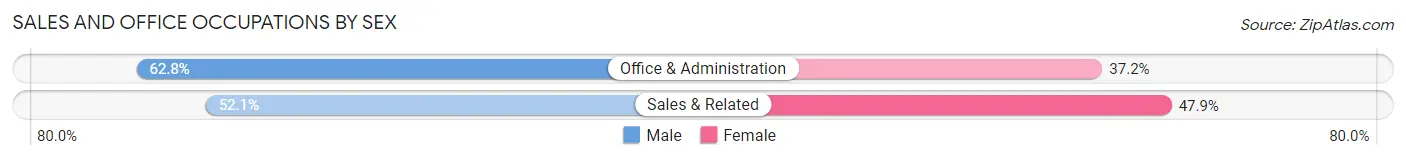
Sales and Office Occupations by Sex
| Occupation | Male | Female |
| Sales & Related | 49 (52.1%) | 45 (47.9%) |
| Office & Administration | 108 (62.8%) | 64 (37.2%) |
| Total (Category) | 157 (59.0%) | 109 (41.0%) |
| Total (Overall) | 641 (46.1%) | 750 (53.9%) |
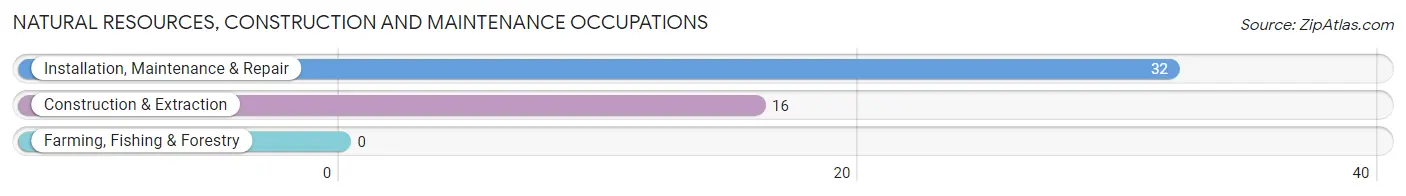
Natural Resources, Construction and Maintenance Occupations
The most common Natural Resources, Construction and Maintenance occupations in Konterra are Installation, Maintenance & Repair (32 | 2.3%), and Construction & Extraction (16 | 1.1%).
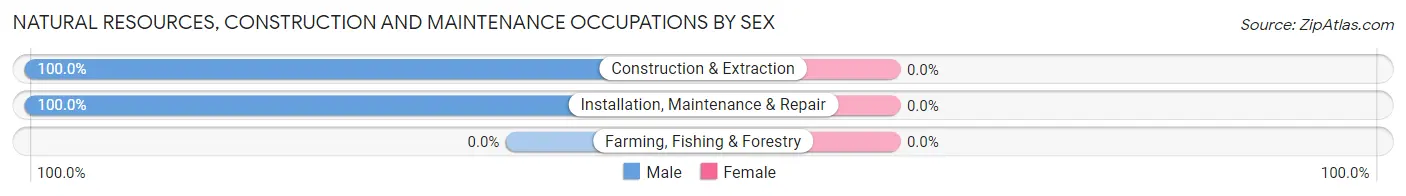
Natural Resources, Construction and Maintenance Occupations by Sex
| Occupation | Male | Female |
| Farming, Fishing & Forestry | 0 (0.0%) | 0 (0.0%) |
| Construction & Extraction | 16 (100.0%) | 0 (0.0%) |
| Installation, Maintenance & Repair | 32 (100.0%) | 0 (0.0%) |
| Total (Category) | 48 (100.0%) | 0 (0.0%) |
| Total (Overall) | 641 (46.1%) | 750 (53.9%) |
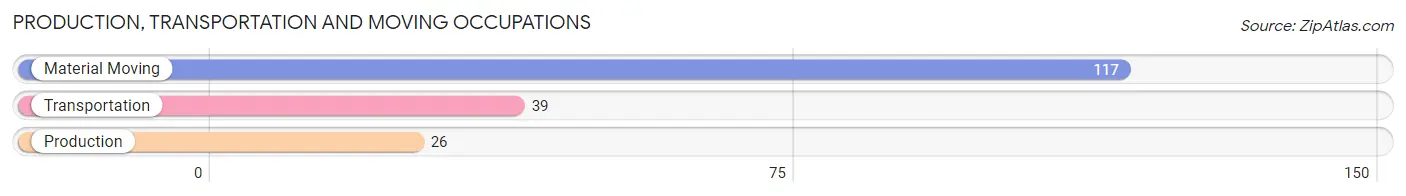
Production, Transportation and Moving Occupations
The most common Production, Transportation and Moving occupations in Konterra are Material Moving (117 | 8.4%), Transportation (39 | 2.8%), and Production (26 | 1.9%).
Production, Transportation and Moving Occupations by Sex
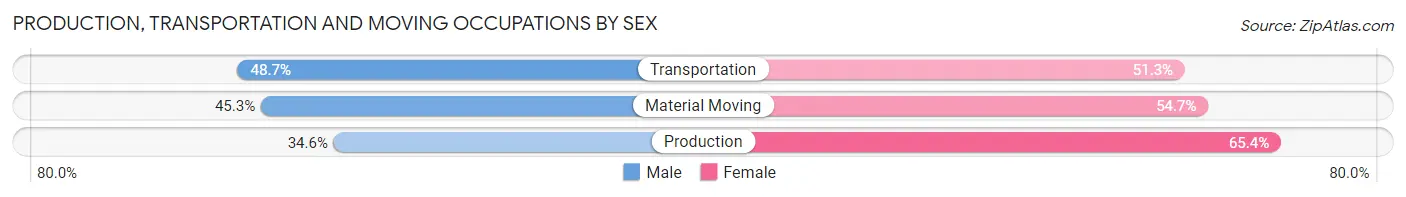
| Occupation | Male | Female |
| Production | 9 (34.6%) | 17 (65.4%) |
| Transportation | 19 (48.7%) | 20 (51.3%) |
| Material Moving | 53 (45.3%) | 64 (54.7%) |
| Total (Category) | 81 (44.5%) | 101 (55.5%) |
| Total (Overall) | 641 (46.1%) | 750 (53.9%) |
Employment Industries by Sex in Konterra
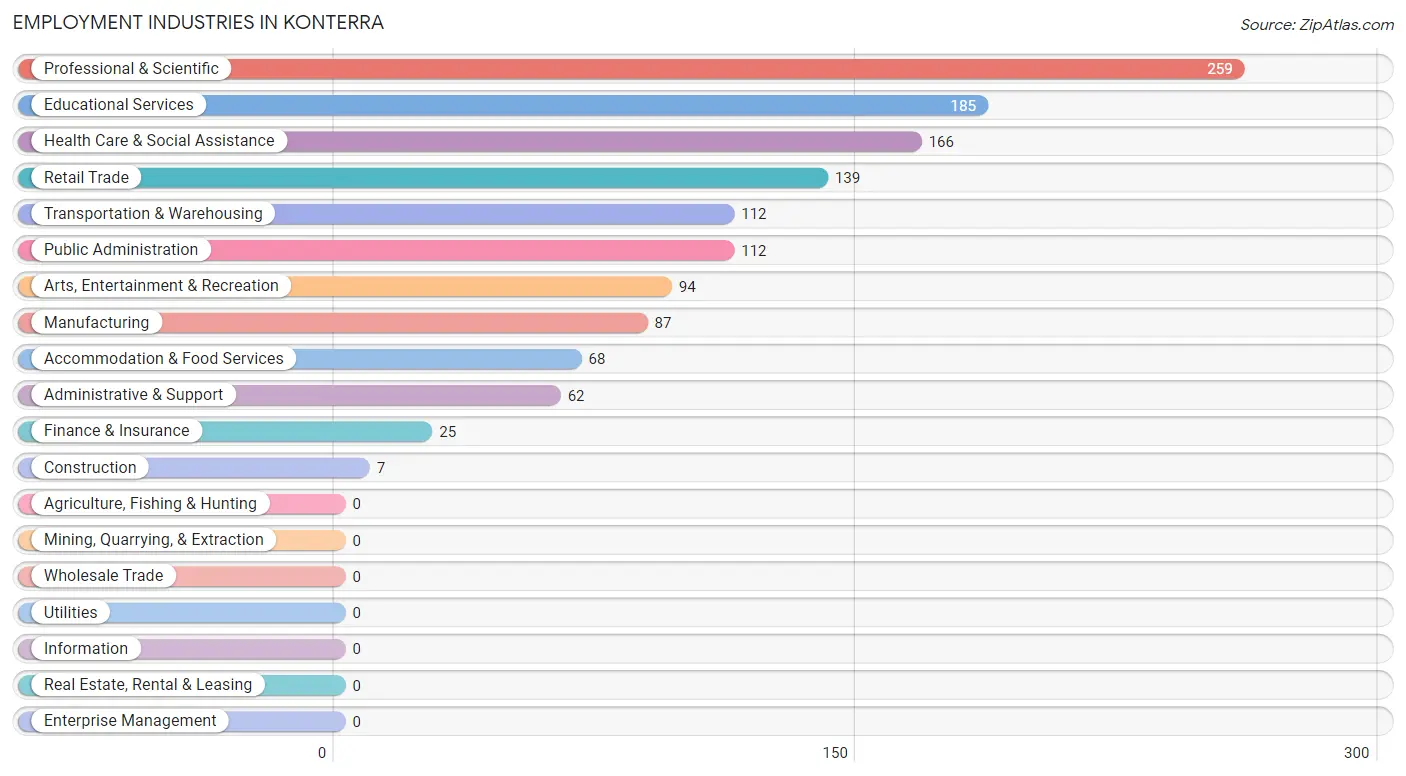
Employment Industries in Konterra
The major employment industries in Konterra include Professional & Scientific (259 | 18.6%), Educational Services (185 | 13.3%), Health Care & Social Assistance (166 | 11.9%), Retail Trade (139 | 10.0%), and Transportation & Warehousing (112 | 8.1%).
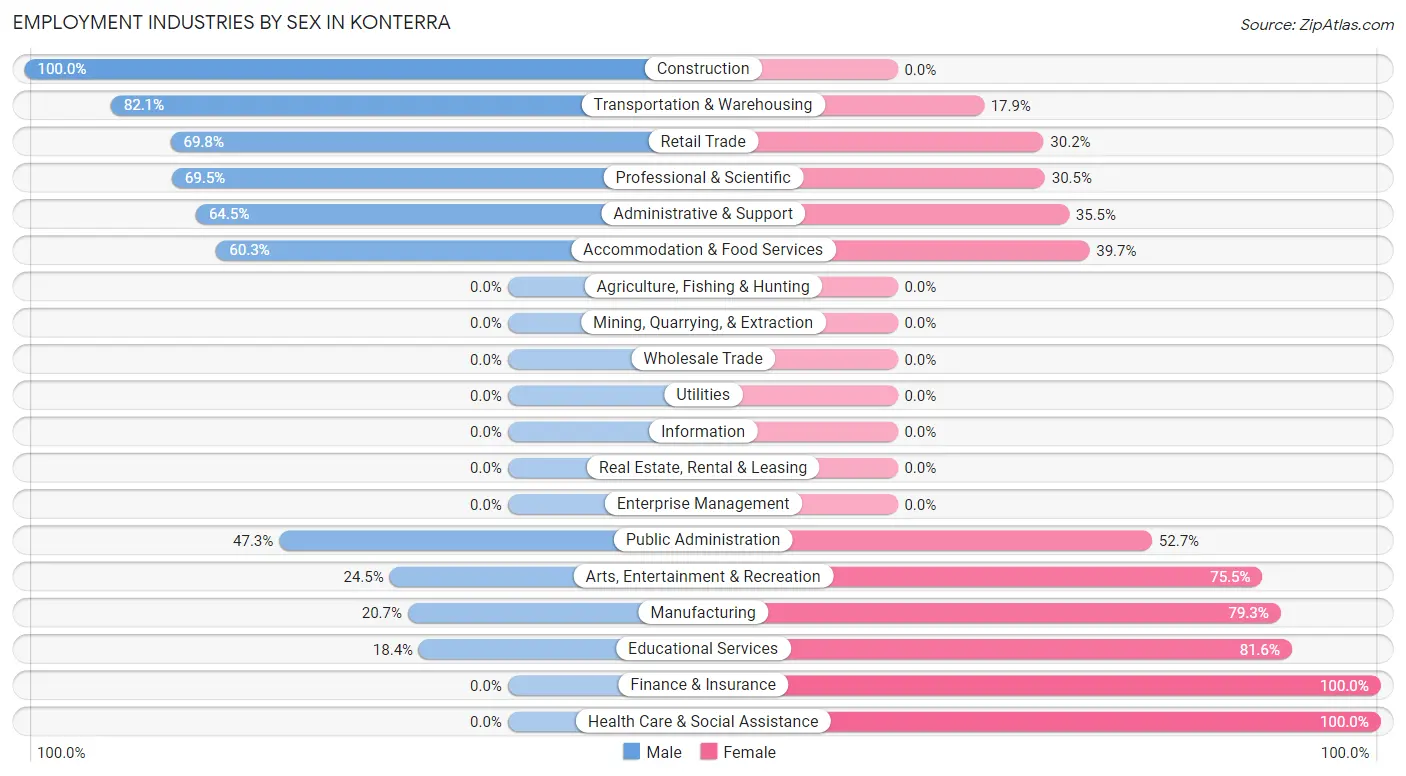
Employment Industries by Sex in Konterra
The Konterra industries that see more men than women are Construction (100.0%), Transportation & Warehousing (82.1%), and Retail Trade (69.8%), whereas the industries that tend to have a higher number of women are Finance & Insurance (100.0%), Health Care & Social Assistance (100.0%), and Educational Services (81.6%).
| Industry | Male | Female |
| Agriculture, Fishing & Hunting | 0 (0.0%) | 0 (0.0%) |
| Mining, Quarrying, & Extraction | 0 (0.0%) | 0 (0.0%) |
| Construction | 7 (100.0%) | 0 (0.0%) |
| Manufacturing | 18 (20.7%) | 69 (79.3%) |
| Wholesale Trade | 0 (0.0%) | 0 (0.0%) |
| Retail Trade | 97 (69.8%) | 42 (30.2%) |
| Transportation & Warehousing | 92 (82.1%) | 20 (17.9%) |
| Utilities | 0 (0.0%) | 0 (0.0%) |
| Information | 0 (0.0%) | 0 (0.0%) |
| Finance & Insurance | 0 (0.0%) | 25 (100.0%) |
| Real Estate, Rental & Leasing | 0 (0.0%) | 0 (0.0%) |
| Professional & Scientific | 180 (69.5%) | 79 (30.5%) |
| Enterprise Management | 0 (0.0%) | 0 (0.0%) |
| Administrative & Support | 40 (64.5%) | 22 (35.5%) |
| Educational Services | 34 (18.4%) | 151 (81.6%) |
| Health Care & Social Assistance | 0 (0.0%) | 166 (100.0%) |
| Arts, Entertainment & Recreation | 23 (24.5%) | 71 (75.5%) |
| Accommodation & Food Services | 41 (60.3%) | 27 (39.7%) |
| Public Administration | 53 (47.3%) | 59 (52.7%) |
| Total | 641 (46.1%) | 750 (53.9%) |
Education in Konterra
School Enrollment in Konterra
The most common levels of schooling among the 557 students in Konterra are graduate / professional (156 | 28.0%), middle school (116 | 20.8%), and nursery / preschool (106 | 19.0%).
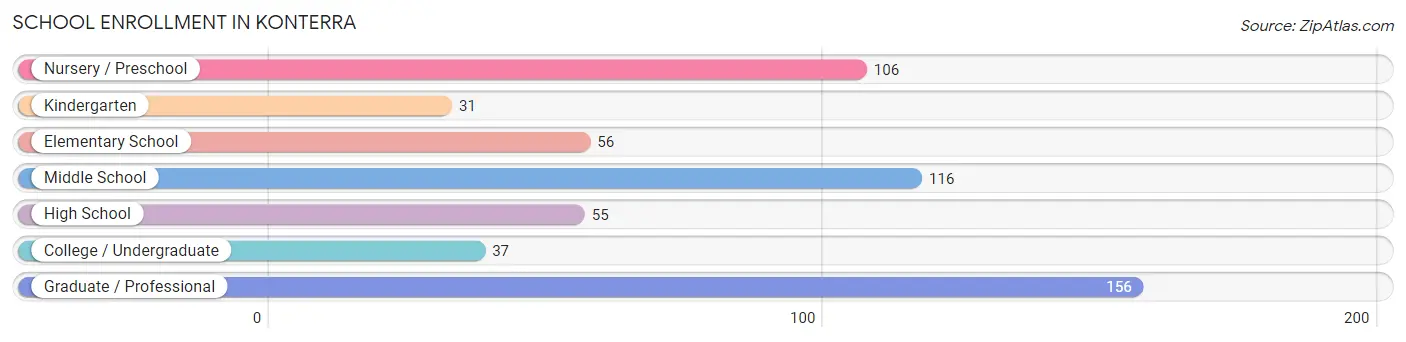
| School Level | # Students | % Students |
| Nursery / Preschool | 106 | 19.0% |
| Kindergarten | 31 | 5.6% |
| Elementary School | 56 | 10.1% |
| Middle School | 116 | 20.8% |
| High School | 55 | 9.9% |
| College / Undergraduate | 37 | 6.6% |
| Graduate / Professional | 156 | 28.0% |
| Total | 557 | 100.0% |
School Enrollment by Age by Funding Source in Konterra
Out of a total of 557 students who are enrolled in schools in Konterra, 168 (30.2%) attend a private institution, while the remaining 389 (69.8%) are enrolled in public schools. The age group of 3 to 4 year olds has the highest likelihood of being enrolled in private schools, with 106 (100.0% in the age bracket) enrolled. Conversely, the age group of 5 to 9 year old has the lowest likelihood of being enrolled in a private school, with 55 (100.0% in the age bracket) attending a public institution.
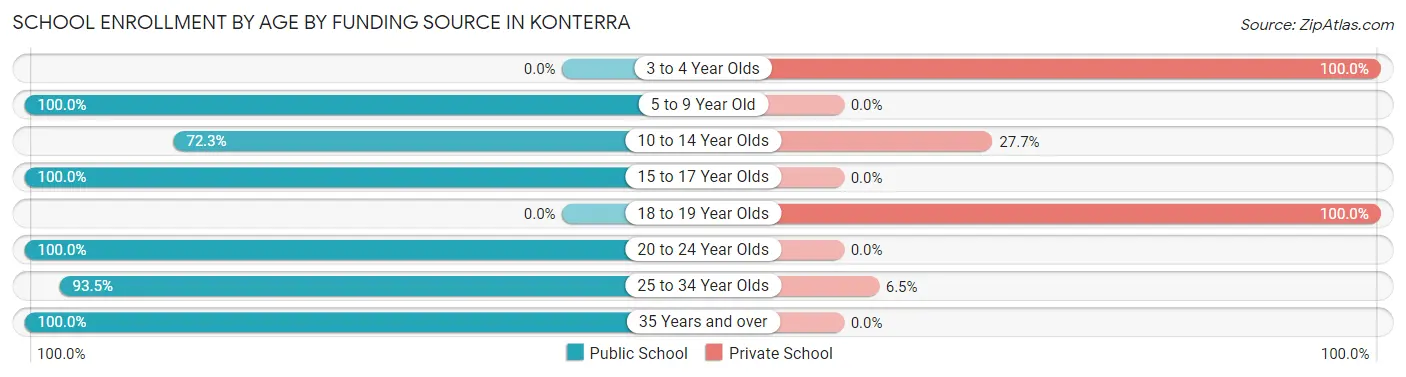
| Age Bracket | Public School | Private School |
| 3 to 4 Year Olds | 0 (0.0%) | 106 (100.0%) |
| 5 to 9 Year Old | 55 (100.0%) | 0 (0.0%) |
| 10 to 14 Year Olds | 107 (72.3%) | 41 (27.7%) |
| 15 to 17 Year Olds | 35 (100.0%) | 0 (0.0%) |
| 18 to 19 Year Olds | 0 (0.0%) | 14 (100.0%) |
| 20 to 24 Year Olds | 37 (100.0%) | 0 (0.0%) |
| 25 to 34 Year Olds | 100 (93.5%) | 7 (6.5%) |
| 35 Years and over | 55 (100.0%) | 0 (0.0%) |
| Total | 389 (69.8%) | 168 (30.2%) |
Educational Attainment by Field of Study in Konterra
Education (263 | 17.3%), business (238 | 15.7%), science & technology (174 | 11.5%), arts & humanities (154 | 10.2%), and literature & languages (147 | 9.7%) are the most common fields of study among 1,516 individuals in Konterra who have obtained a bachelor's degree or higher.
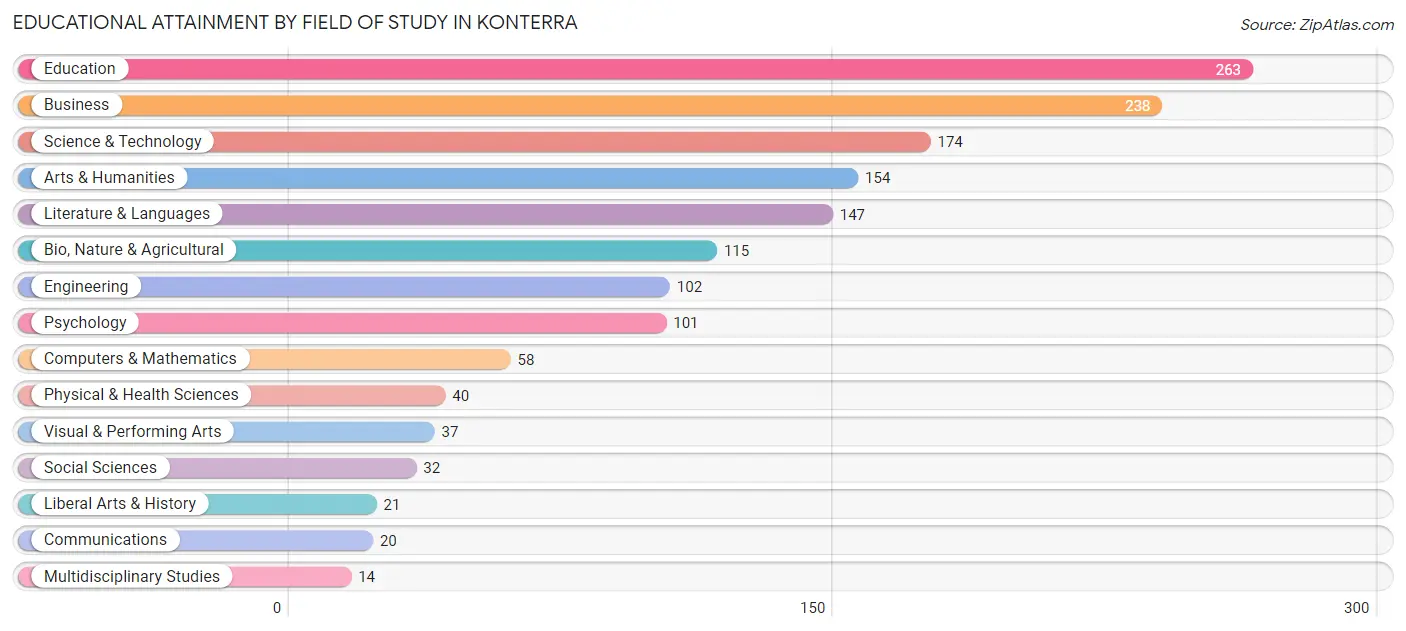
| Field of Study | # Graduates | % Graduates |
| Computers & Mathematics | 58 | 3.8% |
| Bio, Nature & Agricultural | 115 | 7.6% |
| Physical & Health Sciences | 40 | 2.6% |
| Psychology | 101 | 6.7% |
| Social Sciences | 32 | 2.1% |
| Engineering | 102 | 6.7% |
| Multidisciplinary Studies | 14 | 0.9% |
| Science & Technology | 174 | 11.5% |
| Business | 238 | 15.7% |
| Education | 263 | 17.3% |
| Literature & Languages | 147 | 9.7% |
| Liberal Arts & History | 21 | 1.4% |
| Visual & Performing Arts | 37 | 2.4% |
| Communications | 20 | 1.3% |
| Arts & Humanities | 154 | 10.2% |
| Total | 1,516 | 100.0% |
Transportation & Commute in Konterra
Vehicle Availability by Sex in Konterra
The most prevalent vehicle ownership categories in Konterra are males with 3 vehicles (275, accounting for 42.3%) and females with 3 vehicles (178, making up 37.4%).
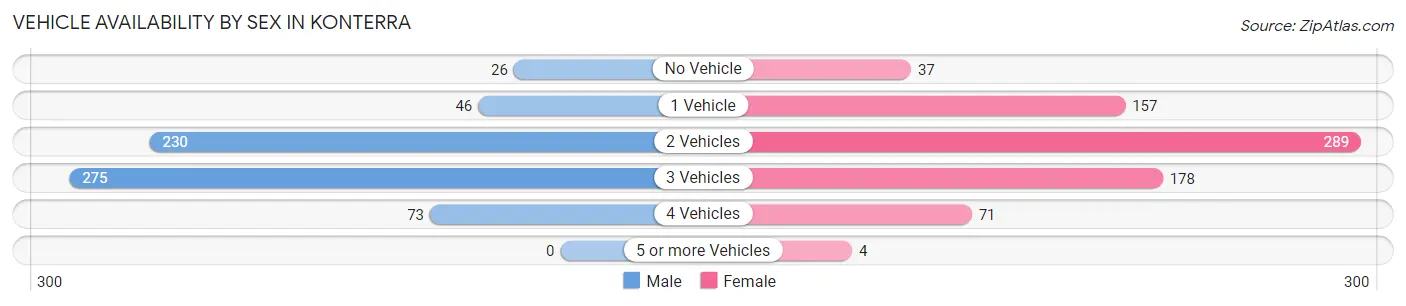
| Vehicles Available | Male | Female |
| No Vehicle | 26 (4.0%) | 37 (5.0%) |
| 1 Vehicle | 46 (7.1%) | 157 (21.3%) |
| 2 Vehicles | 230 (35.4%) | 289 (39.3%) |
| 3 Vehicles | 275 (42.3%) | 178 (24.2%) |
| 4 Vehicles | 73 (11.2%) | 71 (9.7%) |
| 5 or more Vehicles | 0 (0.0%) | 4 (0.5%) |
| Total | 650 (100.0%) | 736 (100.0%) |
Commute Time in Konterra
The most frequently occuring commute durations in Konterra are 30 to 34 minutes (251 commuters, 22.3%), 45 to 59 minutes (137 commuters, 12.2%), and 20 to 24 minutes (135 commuters, 12.0%).
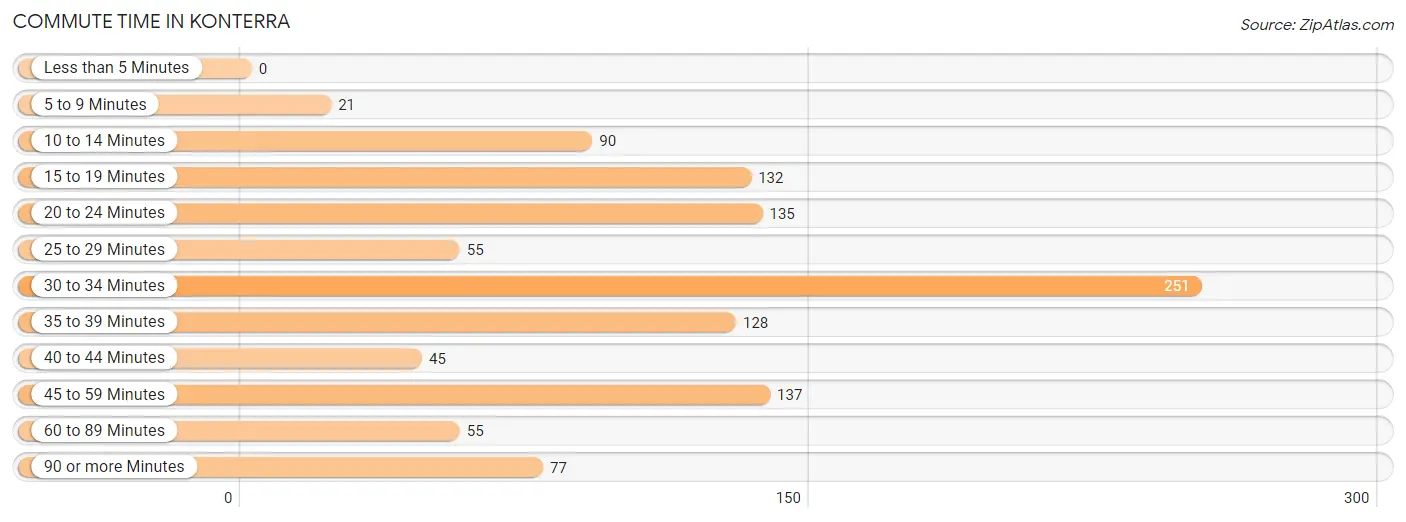
| Commute Time | # Commuters | % Commuters |
| Less than 5 Minutes | 0 | 0.0% |
| 5 to 9 Minutes | 21 | 1.9% |
| 10 to 14 Minutes | 90 | 8.0% |
| 15 to 19 Minutes | 132 | 11.7% |
| 20 to 24 Minutes | 135 | 12.0% |
| 25 to 29 Minutes | 55 | 4.9% |
| 30 to 34 Minutes | 251 | 22.3% |
| 35 to 39 Minutes | 128 | 11.4% |
| 40 to 44 Minutes | 45 | 4.0% |
| 45 to 59 Minutes | 137 | 12.2% |
| 60 to 89 Minutes | 55 | 4.9% |
| 90 or more Minutes | 77 | 6.8% |
Commute Time by Sex in Konterra
The most common commute times in Konterra are 30 to 34 minutes (161 commuters, 31.6%) for males and 35 to 39 minutes (122 commuters, 19.8%) for females.
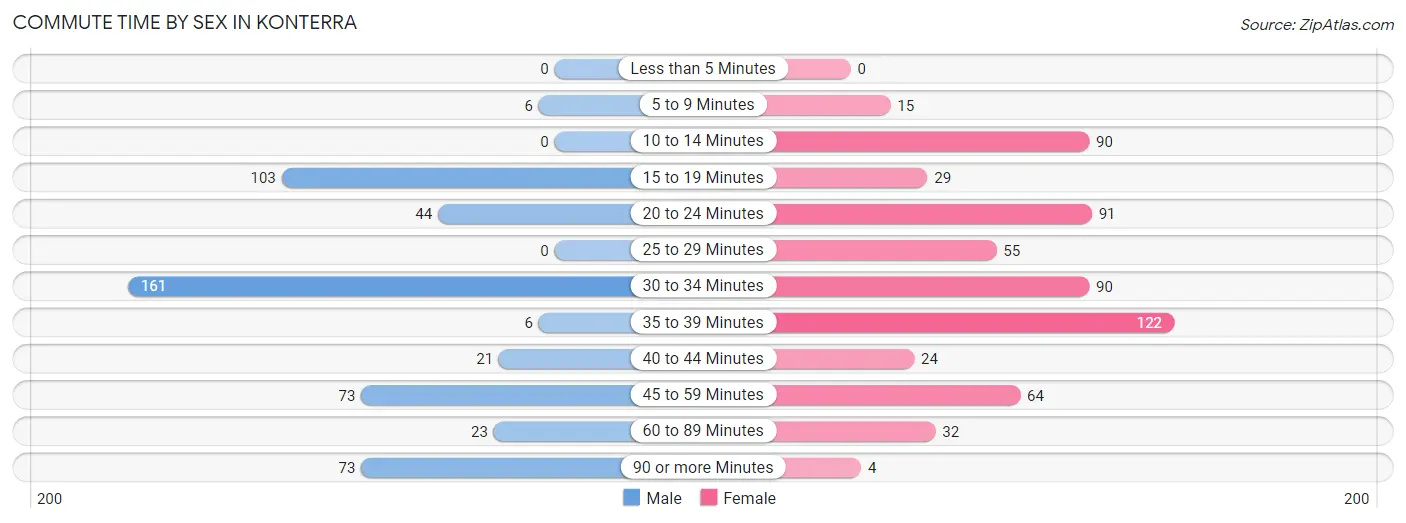
| Commute Time | Male | Female |
| Less than 5 Minutes | 0 (0.0%) | 0 (0.0%) |
| 5 to 9 Minutes | 6 (1.2%) | 15 (2.4%) |
| 10 to 14 Minutes | 0 (0.0%) | 90 (14.6%) |
| 15 to 19 Minutes | 103 (20.2%) | 29 (4.7%) |
| 20 to 24 Minutes | 44 (8.6%) | 91 (14.8%) |
| 25 to 29 Minutes | 0 (0.0%) | 55 (8.9%) |
| 30 to 34 Minutes | 161 (31.6%) | 90 (14.6%) |
| 35 to 39 Minutes | 6 (1.2%) | 122 (19.8%) |
| 40 to 44 Minutes | 21 (4.1%) | 24 (3.9%) |
| 45 to 59 Minutes | 73 (14.3%) | 64 (10.4%) |
| 60 to 89 Minutes | 23 (4.5%) | 32 (5.2%) |
| 90 or more Minutes | 73 (14.3%) | 4 (0.6%) |
Time of Departure to Work by Sex in Konterra
The most frequent times of departure to work in Konterra are 12:00 AM to 4:59 AM (93, 18.2%) for males and 8:30 AM to 8:59 AM (198, 32.1%) for females.
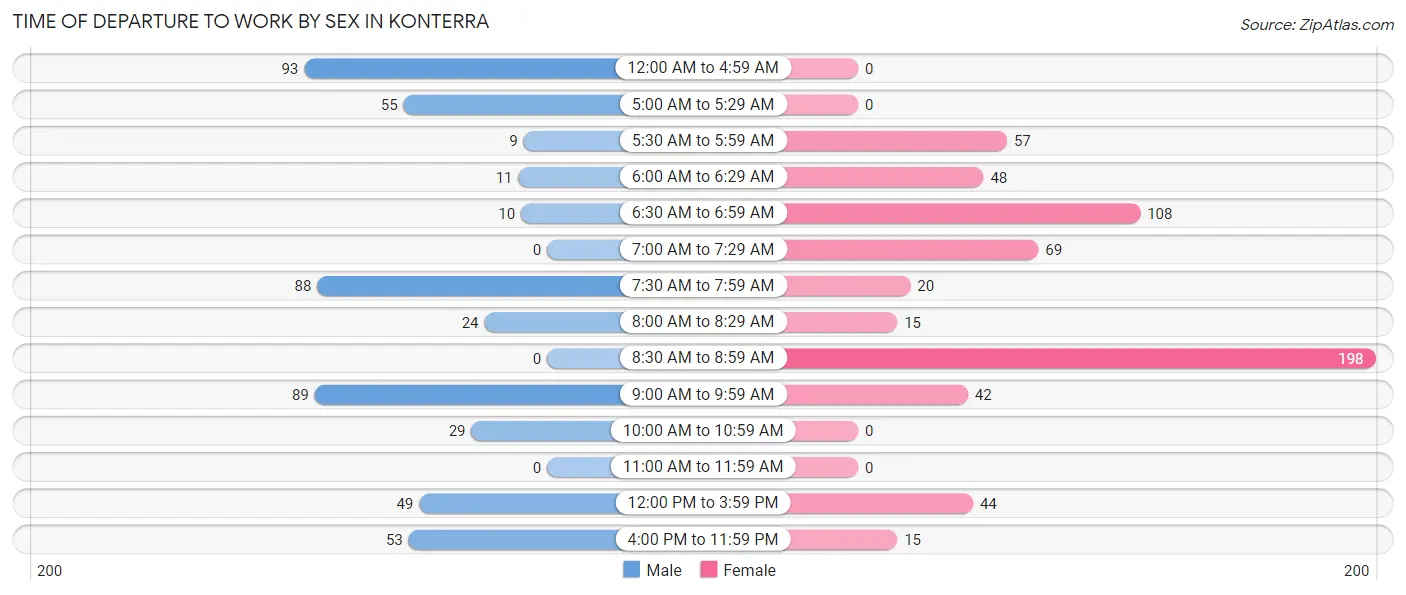
| Time of Departure | Male | Female |
| 12:00 AM to 4:59 AM | 93 (18.2%) | 0 (0.0%) |
| 5:00 AM to 5:29 AM | 55 (10.8%) | 0 (0.0%) |
| 5:30 AM to 5:59 AM | 9 (1.8%) | 57 (9.2%) |
| 6:00 AM to 6:29 AM | 11 (2.2%) | 48 (7.8%) |
| 6:30 AM to 6:59 AM | 10 (2.0%) | 108 (17.5%) |
| 7:00 AM to 7:29 AM | 0 (0.0%) | 69 (11.2%) |
| 7:30 AM to 7:59 AM | 88 (17.2%) | 20 (3.3%) |
| 8:00 AM to 8:29 AM | 24 (4.7%) | 15 (2.4%) |
| 8:30 AM to 8:59 AM | 0 (0.0%) | 198 (32.1%) |
| 9:00 AM to 9:59 AM | 89 (17.4%) | 42 (6.8%) |
| 10:00 AM to 10:59 AM | 29 (5.7%) | 0 (0.0%) |
| 11:00 AM to 11:59 AM | 0 (0.0%) | 0 (0.0%) |
| 12:00 PM to 3:59 PM | 49 (9.6%) | 44 (7.1%) |
| 4:00 PM to 11:59 PM | 53 (10.4%) | 15 (2.4%) |
| Total | 510 (100.0%) | 616 (100.0%) |
Housing Occupancy in Konterra
Occupancy by Ownership in Konterra
Of the total 1,184 dwellings in Konterra, owner-occupied units account for 1,030 (87.0%), while renter-occupied units make up 154 (13.0%).
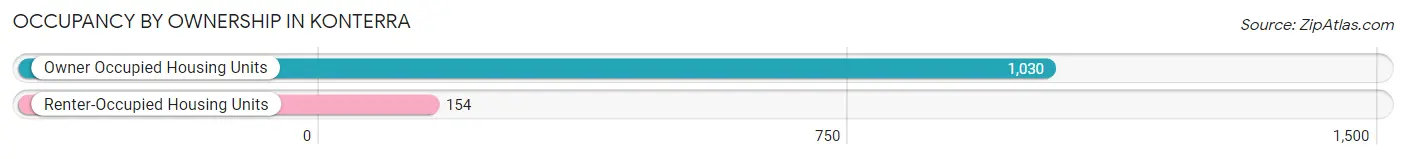
| Occupancy | # Housing Units | % Housing Units |
| Owner Occupied Housing Units | 1,030 | 87.0% |
| Renter-Occupied Housing Units | 154 | 13.0% |
| Total Occupied Housing Units | 1,184 | 100.0% |
Occupancy by Household Size in Konterra
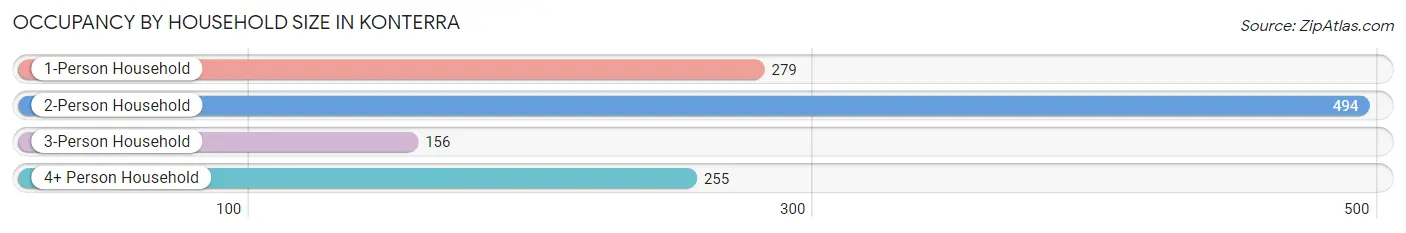
| Household Size | # Housing Units | % Housing Units |
| 1-Person Household | 279 | 23.6% |
| 2-Person Household | 494 | 41.7% |
| 3-Person Household | 156 | 13.2% |
| 4+ Person Household | 255 | 21.5% |
| Total Housing Units | 1,184 | 100.0% |
Occupancy by Ownership by Household Size in Konterra
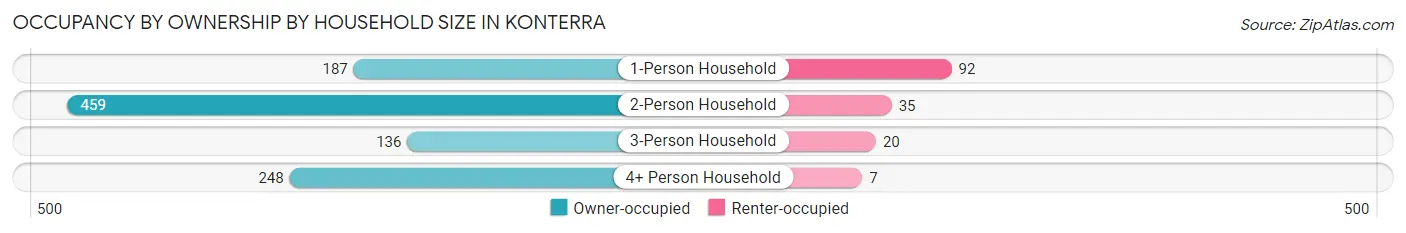
| Household Size | Owner-occupied | Renter-occupied |
| 1-Person Household | 187 (67.0%) | 92 (33.0%) |
| 2-Person Household | 459 (92.9%) | 35 (7.1%) |
| 3-Person Household | 136 (87.2%) | 20 (12.8%) |
| 4+ Person Household | 248 (97.3%) | 7 (2.8%) |
| Total Housing Units | 1,030 (87.0%) | 154 (13.0%) |
Occupancy by Educational Attainment in Konterra
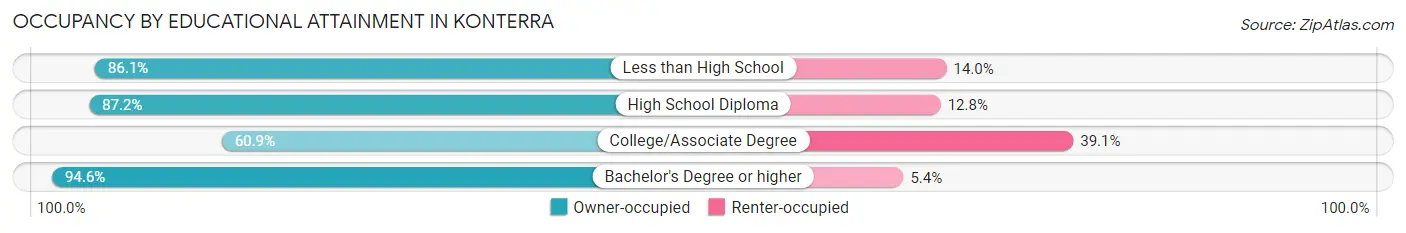
| Household Size | Owner-occupied | Renter-occupied |
| Less than High School | 37 (86.1%) | 6 (14.0%) |
| High School Diploma | 143 (87.2%) | 21 (12.8%) |
| College/Associate Degree | 134 (60.9%) | 86 (39.1%) |
| Bachelor's Degree or higher | 716 (94.6%) | 41 (5.4%) |
Occupancy by Age of Householder in Konterra
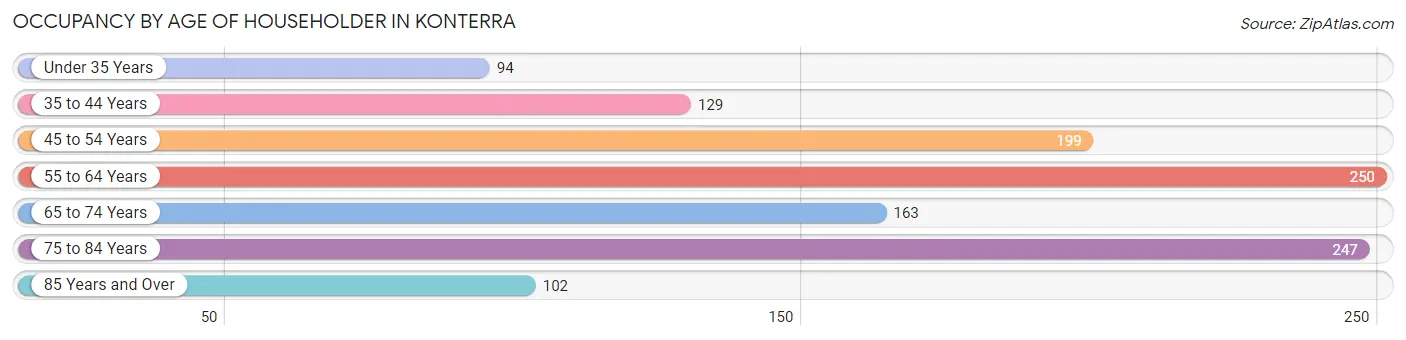
| Age Bracket | # Households | % Households |
| Under 35 Years | 94 | 7.9% |
| 35 to 44 Years | 129 | 10.9% |
| 45 to 54 Years | 199 | 16.8% |
| 55 to 64 Years | 250 | 21.1% |
| 65 to 74 Years | 163 | 13.8% |
| 75 to 84 Years | 247 | 20.9% |
| 85 Years and Over | 102 | 8.6% |
| Total | 1,184 | 100.0% |
Housing Finances in Konterra
Median Income by Occupancy in Konterra
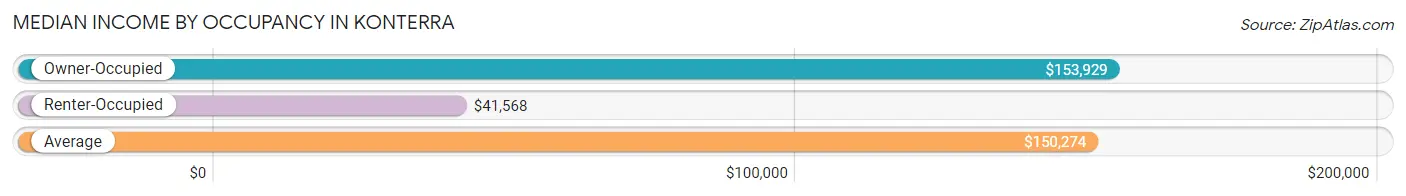
| Occupancy Type | # Households | Median Income |
| Owner-Occupied | 1,030 (87.0%) | $153,929 |
| Renter-Occupied | 154 (13.0%) | $41,568 |
| Average | 1,184 (100.0%) | $150,274 |
Occupancy by Householder Income Bracket in Konterra
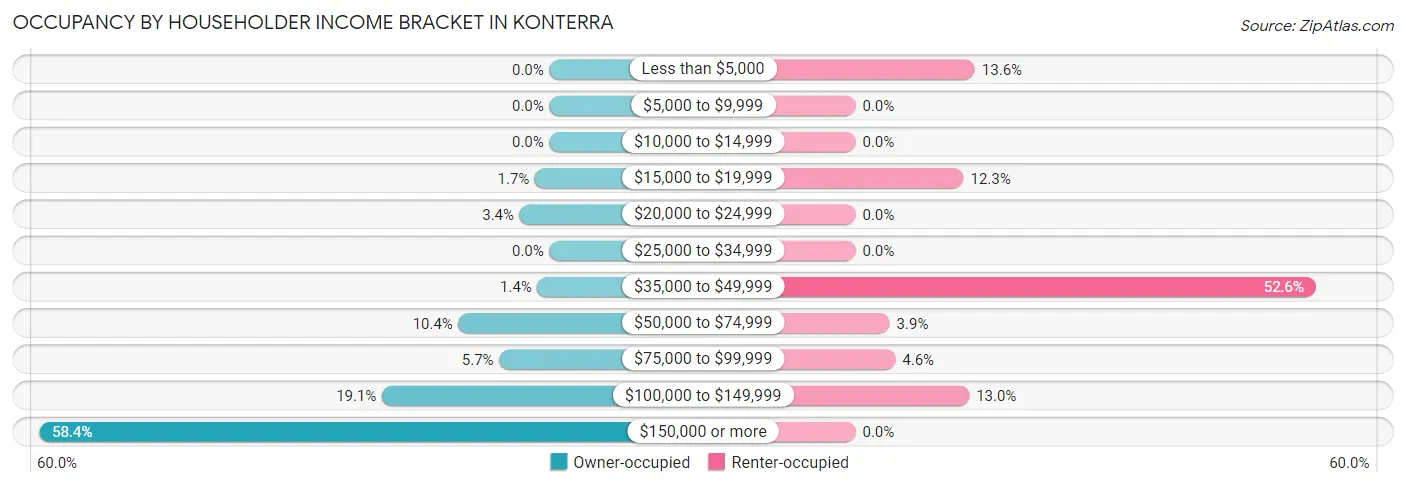
| Income Bracket | Owner-occupied | Renter-occupied |
| Less than $5,000 | 0 (0.0%) | 21 (13.6%) |
| $5,000 to $9,999 | 0 (0.0%) | 0 (0.0%) |
| $10,000 to $14,999 | 0 (0.0%) | 0 (0.0%) |
| $15,000 to $19,999 | 17 (1.7%) | 19 (12.3%) |
| $20,000 to $24,999 | 35 (3.4%) | 0 (0.0%) |
| $25,000 to $34,999 | 0 (0.0%) | 0 (0.0%) |
| $35,000 to $49,999 | 14 (1.4%) | 81 (52.6%) |
| $50,000 to $74,999 | 107 (10.4%) | 6 (3.9%) |
| $75,000 to $99,999 | 59 (5.7%) | 7 (4.5%) |
| $100,000 to $149,999 | 197 (19.1%) | 20 (13.0%) |
| $150,000 or more | 601 (58.4%) | 0 (0.0%) |
| Total | 1,030 (100.0%) | 154 (100.0%) |
Monthly Housing Cost Tiers in Konterra
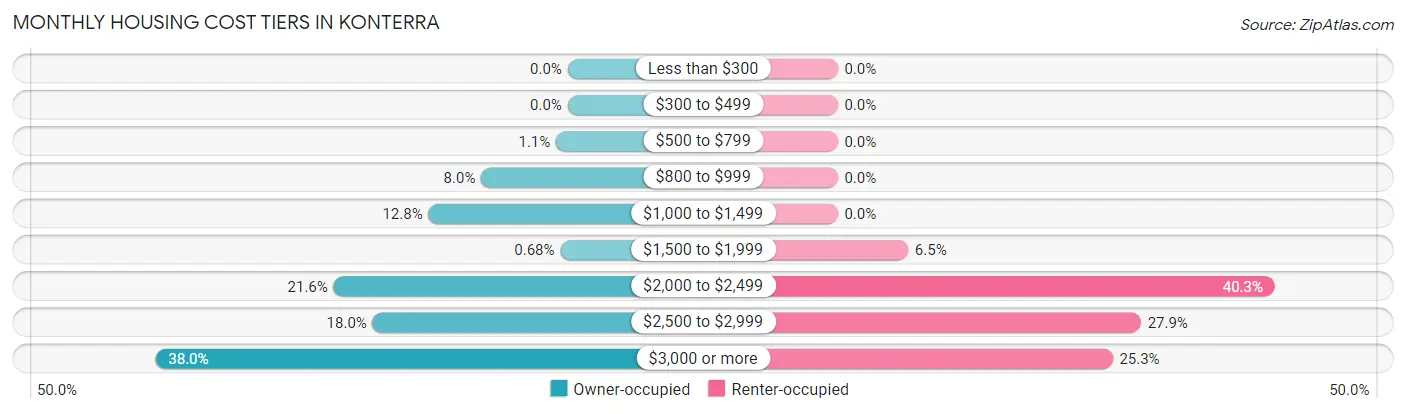
| Monthly Cost | Owner-occupied | Renter-occupied |
| Less than $300 | 0 (0.0%) | 0 (0.0%) |
| $300 to $499 | 0 (0.0%) | 0 (0.0%) |
| $500 to $799 | 11 (1.1%) | 0 (0.0%) |
| $800 to $999 | 82 (8.0%) | 0 (0.0%) |
| $1,000 to $1,499 | 132 (12.8%) | 0 (0.0%) |
| $1,500 to $1,999 | 7 (0.7%) | 10 (6.5%) |
| $2,000 to $2,499 | 222 (21.5%) | 62 (40.3%) |
| $2,500 to $2,999 | 185 (18.0%) | 43 (27.9%) |
| $3,000 or more | 391 (38.0%) | 39 (25.3%) |
| Total | 1,030 (100.0%) | 154 (100.0%) |
Physical Housing Characteristics in Konterra
Housing Structures in Konterra
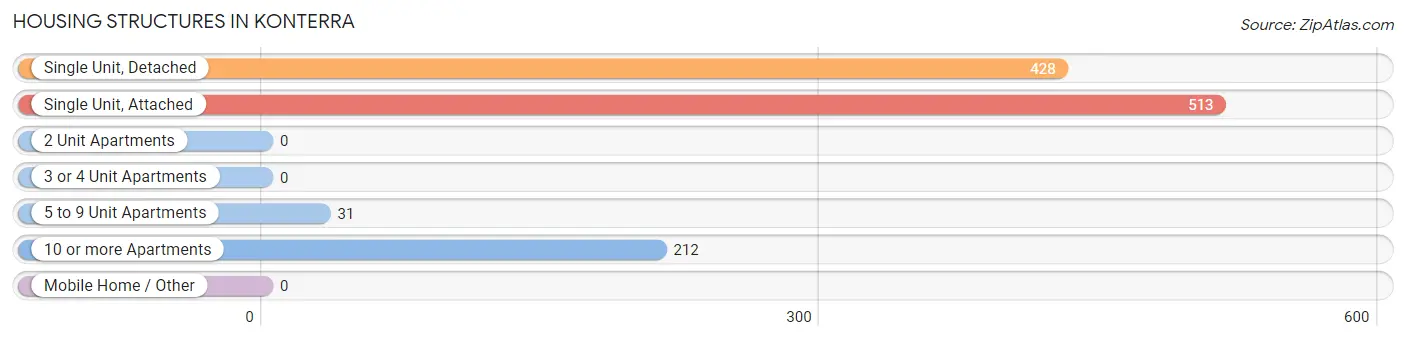
| Structure Type | # Housing Units | % Housing Units |
| Single Unit, Detached | 428 | 36.1% |
| Single Unit, Attached | 513 | 43.3% |
| 2 Unit Apartments | 0 | 0.0% |
| 3 or 4 Unit Apartments | 0 | 0.0% |
| 5 to 9 Unit Apartments | 31 | 2.6% |
| 10 or more Apartments | 212 | 17.9% |
| Mobile Home / Other | 0 | 0.0% |
| Total | 1,184 | 100.0% |
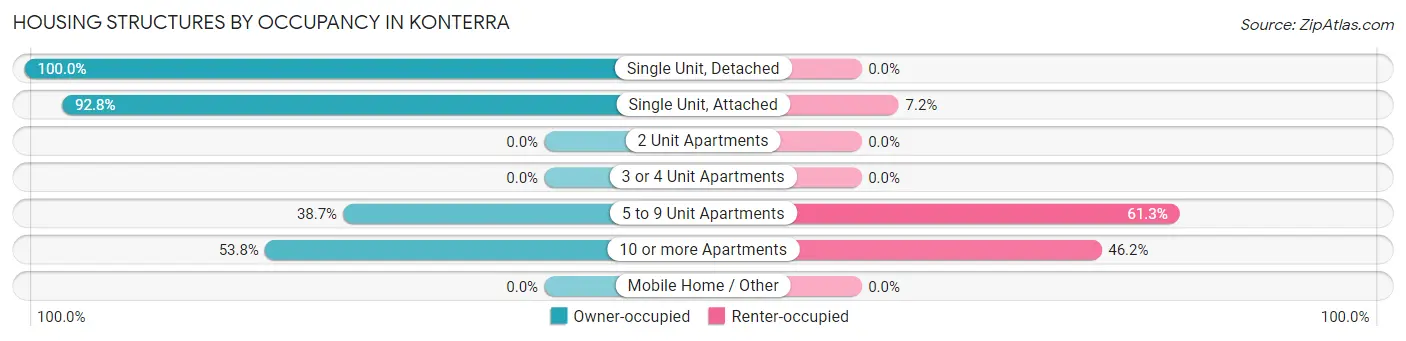
Housing Structures by Occupancy in Konterra
| Structure Type | Owner-occupied | Renter-occupied |
| Single Unit, Detached | 428 (100.0%) | 0 (0.0%) |
| Single Unit, Attached | 476 (92.8%) | 37 (7.2%) |
| 2 Unit Apartments | 0 (0.0%) | 0 (0.0%) |
| 3 or 4 Unit Apartments | 0 (0.0%) | 0 (0.0%) |
| 5 to 9 Unit Apartments | 12 (38.7%) | 19 (61.3%) |
| 10 or more Apartments | 114 (53.8%) | 98 (46.2%) |
| Mobile Home / Other | 0 (0.0%) | 0 (0.0%) |
| Total | 1,030 (87.0%) | 154 (13.0%) |
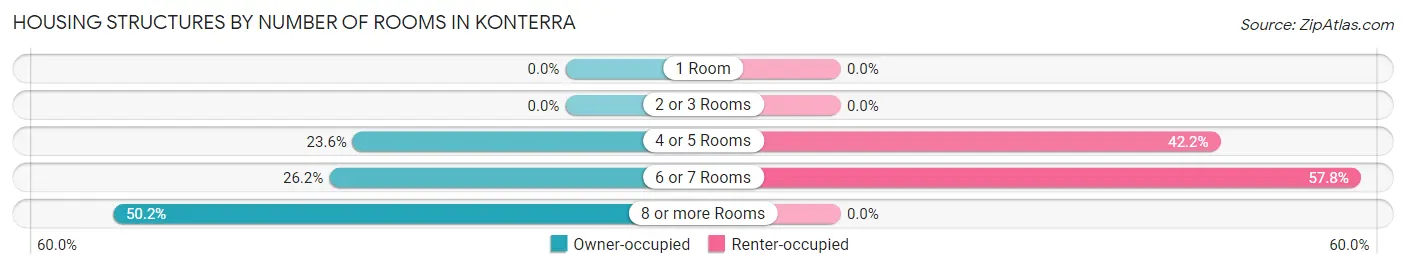
Housing Structures by Number of Rooms in Konterra
| Number of Rooms | Owner-occupied | Renter-occupied |
| 1 Room | 0 (0.0%) | 0 (0.0%) |
| 2 or 3 Rooms | 0 (0.0%) | 0 (0.0%) |
| 4 or 5 Rooms | 243 (23.6%) | 65 (42.2%) |
| 6 or 7 Rooms | 270 (26.2%) | 89 (57.8%) |
| 8 or more Rooms | 517 (50.2%) | 0 (0.0%) |
| Total | 1,030 (100.0%) | 154 (100.0%) |
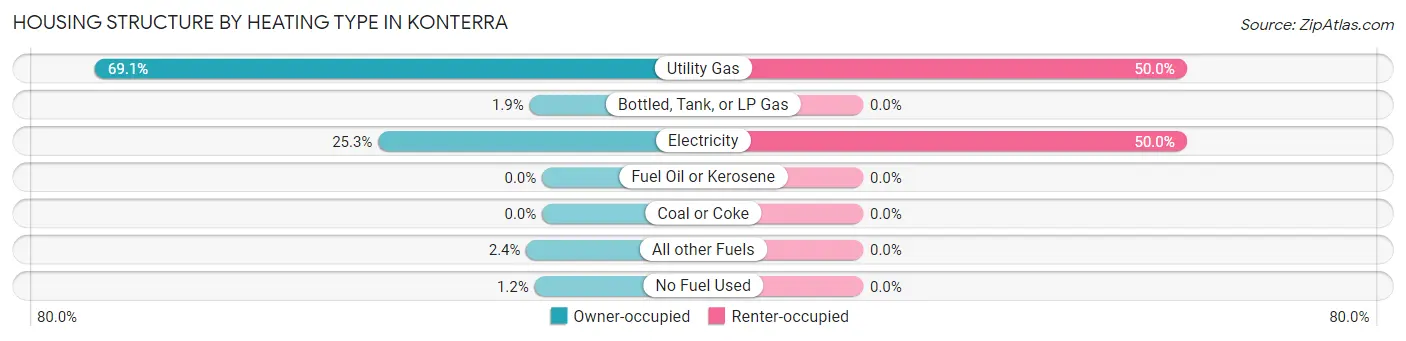
Housing Structure by Heating Type in Konterra
| Heating Type | Owner-occupied | Renter-occupied |
| Utility Gas | 712 (69.1%) | 77 (50.0%) |
| Bottled, Tank, or LP Gas | 20 (1.9%) | 0 (0.0%) |
| Electricity | 261 (25.3%) | 77 (50.0%) |
| Fuel Oil or Kerosene | 0 (0.0%) | 0 (0.0%) |
| Coal or Coke | 0 (0.0%) | 0 (0.0%) |
| All other Fuels | 25 (2.4%) | 0 (0.0%) |
| No Fuel Used | 12 (1.2%) | 0 (0.0%) |
| Total | 1,030 (100.0%) | 154 (100.0%) |
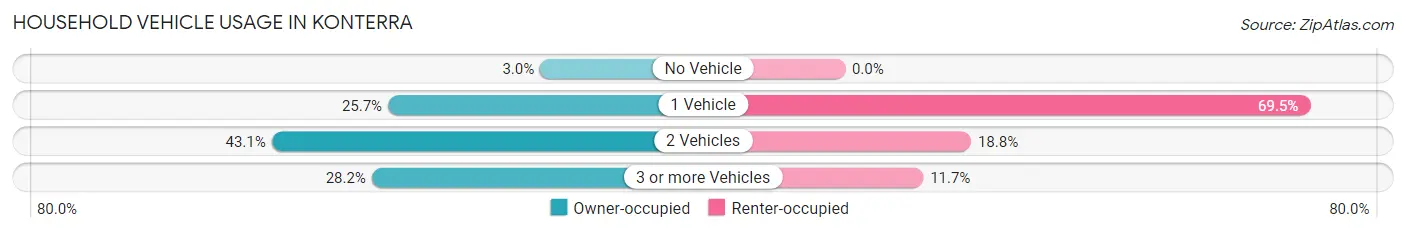
Household Vehicle Usage in Konterra
| Vehicles per Household | Owner-occupied | Renter-occupied |
| No Vehicle | 31 (3.0%) | 0 (0.0%) |
| 1 Vehicle | 265 (25.7%) | 107 (69.5%) |
| 2 Vehicles | 444 (43.1%) | 29 (18.8%) |
| 3 or more Vehicles | 290 (28.2%) | 18 (11.7%) |
| Total | 1,030 (100.0%) | 154 (100.0%) |
Real Estate & Mortgages in Konterra
Real Estate and Mortgage Overview in Konterra
| Characteristic | Without Mortgage | With Mortgage |
| Housing Units | 220 | 810 |
| Median Property Value | $386,600 | $534,300 |
| Median Household Income | $86,875 | $525 |
| Monthly Housing Costs | $1,025 | $384 |
| Real Estate Taxes | $6,677 | $29 |
Property Value by Mortgage Status in Konterra
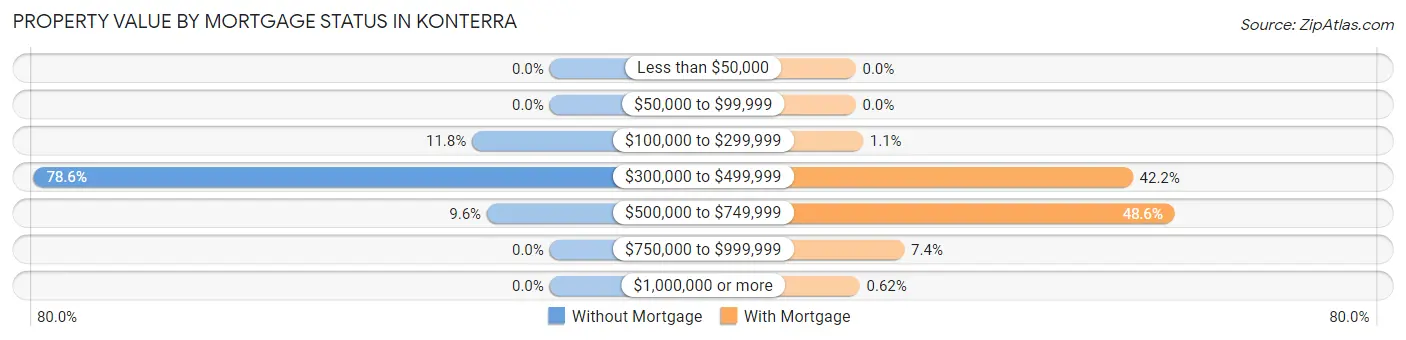
| Property Value | Without Mortgage | With Mortgage |
| Less than $50,000 | 0 (0.0%) | 0 (0.0%) |
| $50,000 to $99,999 | 0 (0.0%) | 0 (0.0%) |
| $100,000 to $299,999 | 26 (11.8%) | 9 (1.1%) |
| $300,000 to $499,999 | 173 (78.6%) | 342 (42.2%) |
| $500,000 to $749,999 | 21 (9.6%) | 394 (48.6%) |
| $750,000 to $999,999 | 0 (0.0%) | 60 (7.4%) |
| $1,000,000 or more | 0 (0.0%) | 5 (0.6%) |
| Total | 220 (100.0%) | 810 (100.0%) |
Household Income by Mortgage Status in Konterra
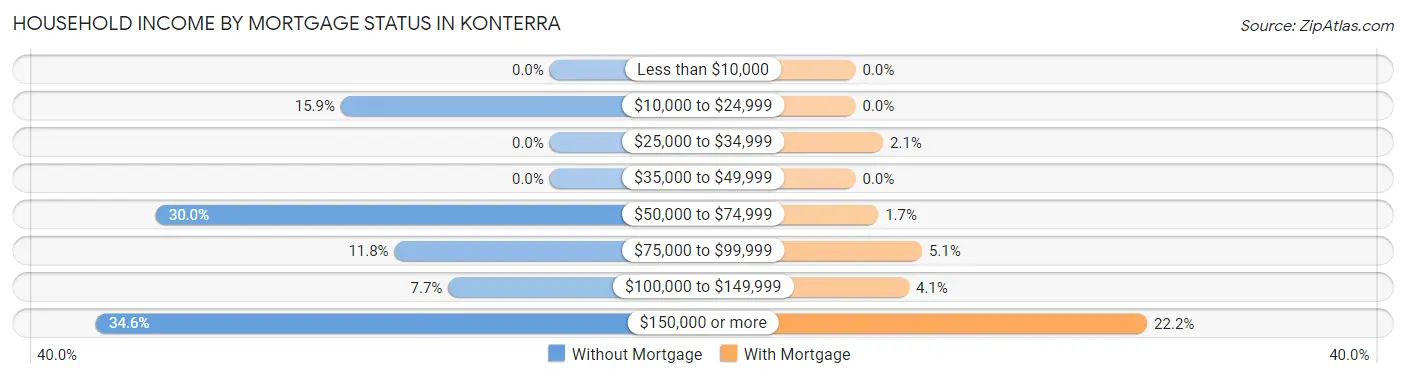
| Household Income | Without Mortgage | With Mortgage |
| Less than $10,000 | 0 (0.0%) | 0 (0.0%) |
| $10,000 to $24,999 | 35 (15.9%) | 0 (0.0%) |
| $25,000 to $34,999 | 0 (0.0%) | 17 (2.1%) |
| $35,000 to $49,999 | 0 (0.0%) | 0 (0.0%) |
| $50,000 to $74,999 | 66 (30.0%) | 14 (1.7%) |
| $75,000 to $99,999 | 26 (11.8%) | 41 (5.1%) |
| $100,000 to $149,999 | 17 (7.7%) | 33 (4.1%) |
| $150,000 or more | 76 (34.5%) | 180 (22.2%) |
| Total | 220 (100.0%) | 810 (100.0%) |
Property Value to Household Income Ratio in Konterra
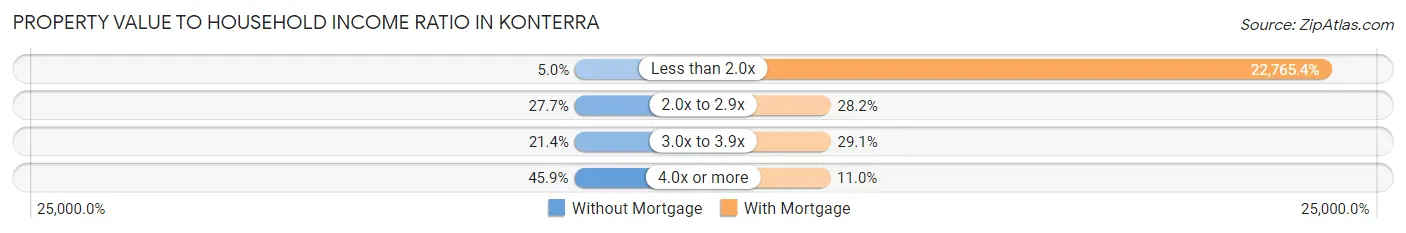
| Value-to-Income Ratio | Without Mortgage | With Mortgage |
| Less than 2.0x | 11 (5.0%) | 184,400 (22,765.4%) |
| 2.0x to 2.9x | 61 (27.7%) | 228 (28.1%) |
| 3.0x to 3.9x | 47 (21.4%) | 236 (29.1%) |
| 4.0x or more | 101 (45.9%) | 89 (11.0%) |
| Total | 220 (100.0%) | 810 (100.0%) |
Real Estate Taxes by Mortgage Status in Konterra
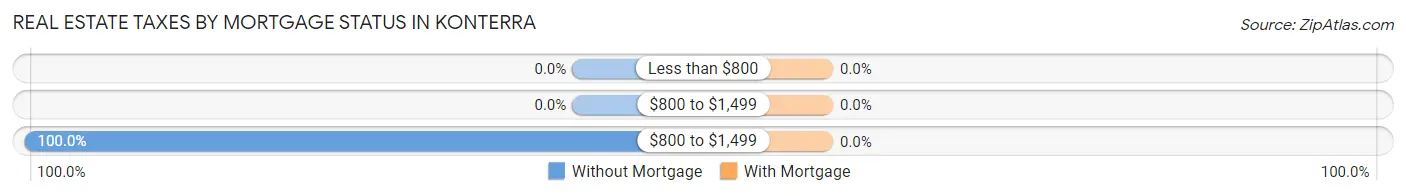
| Property Taxes | Without Mortgage | With Mortgage |
| Less than $800 | 0 (0.0%) | 0 (0.0%) |
| $800 to $1,499 | 0 (0.0%) | 0 (0.0%) |
| $800 to $1,499 | 220 (100.0%) | 0 (0.0%) |
| Total | 220 (100.0%) | 810 (100.0%) |
Health & Disability in Konterra
Health Insurance Coverage by Age in Konterra
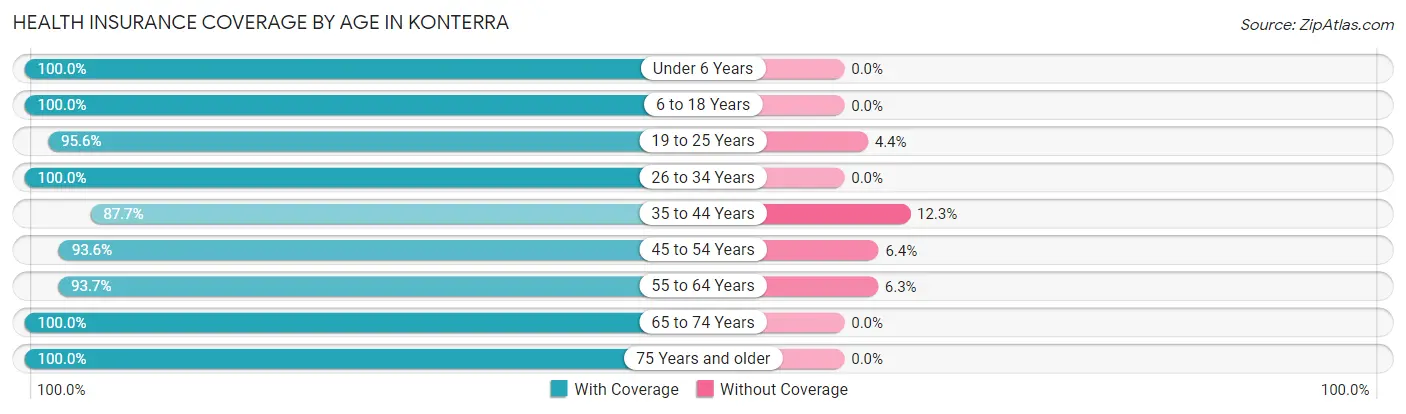
| Age Bracket | With Coverage | Without Coverage |
| Under 6 Years | 367 (100.0%) | 0 (0.0%) |
| 6 to 18 Years | 207 (100.0%) | 0 (0.0%) |
| 19 to 25 Years | 131 (95.6%) | 6 (4.4%) |
| 26 to 34 Years | 209 (100.0%) | 0 (0.0%) |
| 35 to 44 Years | 229 (87.7%) | 32 (12.3%) |
| 45 to 54 Years | 514 (93.6%) | 35 (6.4%) |
| 55 to 64 Years | 434 (93.7%) | 29 (6.3%) |
| 65 to 74 Years | 283 (100.0%) | 0 (0.0%) |
| 75 Years and older | 558 (100.0%) | 0 (0.0%) |
| Total | 2,932 (96.6%) | 102 (3.4%) |
Health Insurance Coverage by Citizenship Status in Konterra
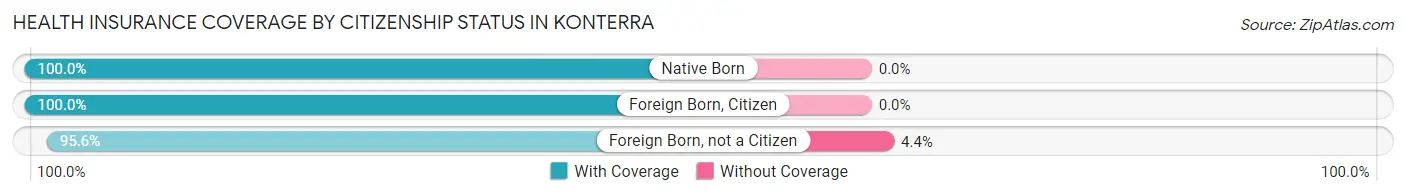
| Citizenship Status | With Coverage | Without Coverage |
| Native Born | 367 (100.0%) | 0 (0.0%) |
| Foreign Born, Citizen | 207 (100.0%) | 0 (0.0%) |
| Foreign Born, not a Citizen | 131 (95.6%) | 6 (4.4%) |
Health Insurance Coverage by Household Income in Konterra
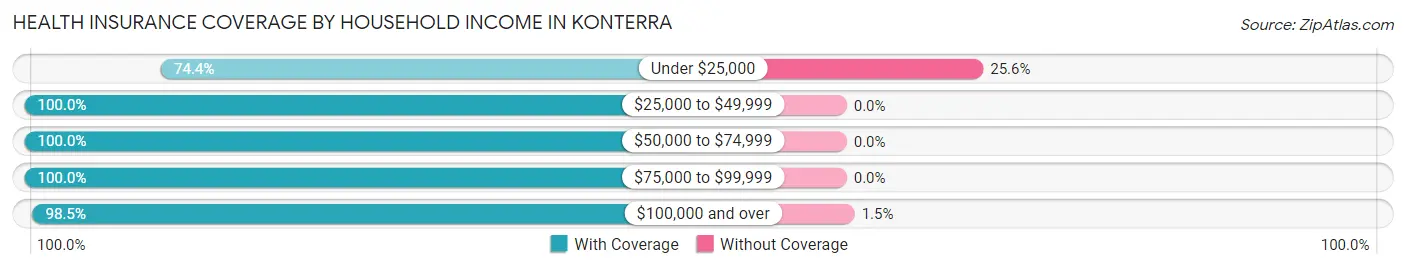
| Household Income | With Coverage | Without Coverage |
| Under $25,000 | 195 (74.4%) | 67 (25.6%) |
| $25,000 to $49,999 | 138 (100.0%) | 0 (0.0%) |
| $50,000 to $74,999 | 168 (100.0%) | 0 (0.0%) |
| $75,000 to $99,999 | 123 (100.0%) | 0 (0.0%) |
| $100,000 and over | 2,308 (98.5%) | 35 (1.5%) |
Public vs Private Health Insurance Coverage by Age in Konterra
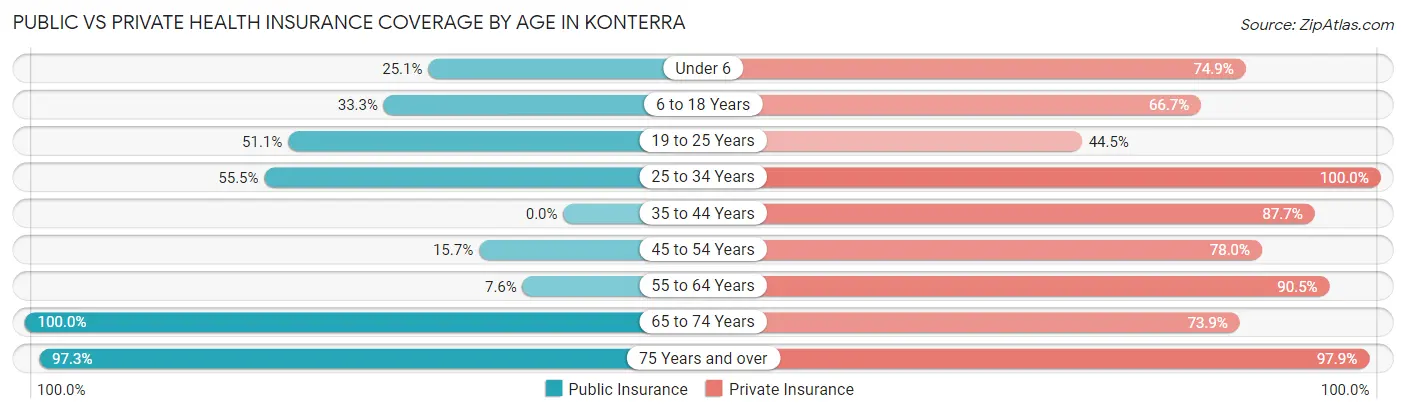
| Age Bracket | Public Insurance | Private Insurance |
| Under 6 | 92 (25.1%) | 275 (74.9%) |
| 6 to 18 Years | 69 (33.3%) | 138 (66.7%) |
| 19 to 25 Years | 70 (51.1%) | 61 (44.5%) |
| 25 to 34 Years | 116 (55.5%) | 209 (100.0%) |
| 35 to 44 Years | 0 (0.0%) | 229 (87.7%) |
| 45 to 54 Years | 86 (15.7%) | 428 (78.0%) |
| 55 to 64 Years | 35 (7.6%) | 419 (90.5%) |
| 65 to 74 Years | 283 (100.0%) | 209 (73.9%) |
| 75 Years and over | 543 (97.3%) | 546 (97.9%) |
| Total | 1,294 (42.6%) | 2,514 (82.9%) |
Disability Status by Sex by Age in Konterra
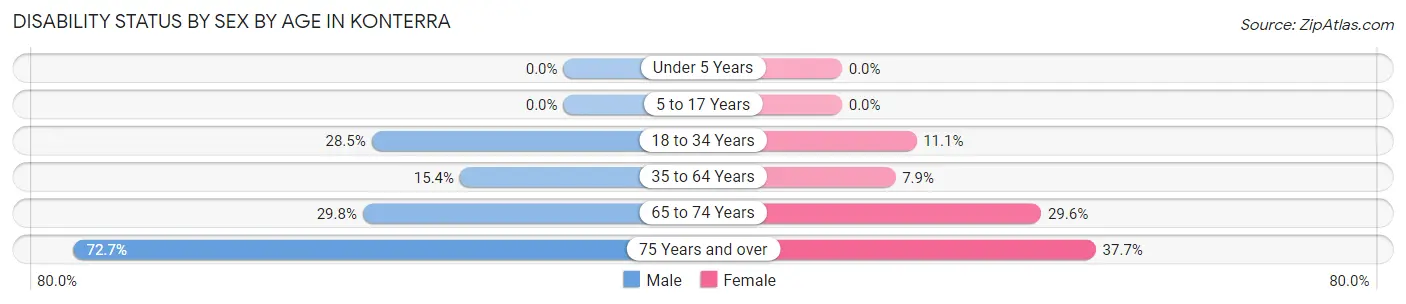
| Age Bracket | Male | Female |
| Under 5 Years | 0 (0.0%) | 0 (0.0%) |
| 5 to 17 Years | 0 (0.0%) | 0 (0.0%) |
| 18 to 34 Years | 47 (28.5%) | 20 (11.1%) |
| 35 to 64 Years | 91 (15.4%) | 54 (7.9%) |
| 65 to 74 Years | 42 (29.8%) | 42 (29.6%) |
| 75 Years and over | 128 (72.7%) | 144 (37.7%) |
Disability Class by Sex by Age in Konterra
Disability Class: Hearing Difficulty
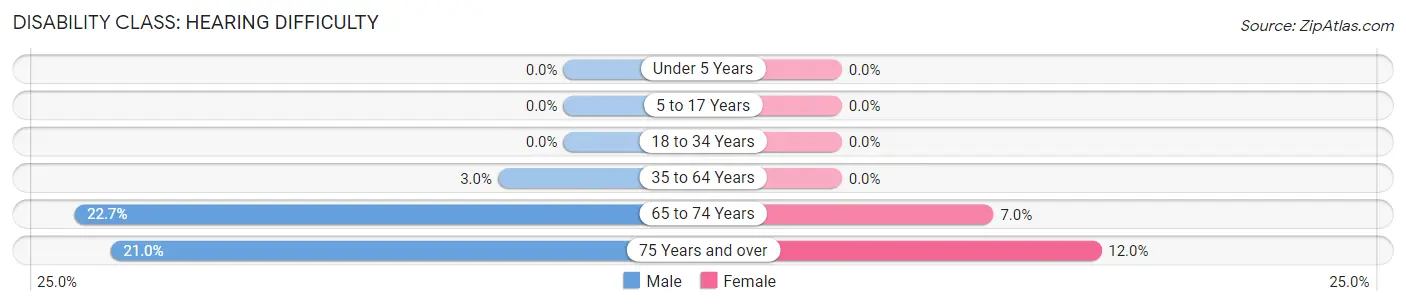
| Age Bracket | Male | Female |
| Under 5 Years | 0 (0.0%) | 0 (0.0%) |
| 5 to 17 Years | 0 (0.0%) | 0 (0.0%) |
| 18 to 34 Years | 0 (0.0%) | 0 (0.0%) |
| 35 to 64 Years | 18 (3.0%) | 0 (0.0%) |
| 65 to 74 Years | 32 (22.7%) | 10 (7.0%) |
| 75 Years and over | 37 (21.0%) | 46 (12.0%) |
Disability Class: Vision Difficulty
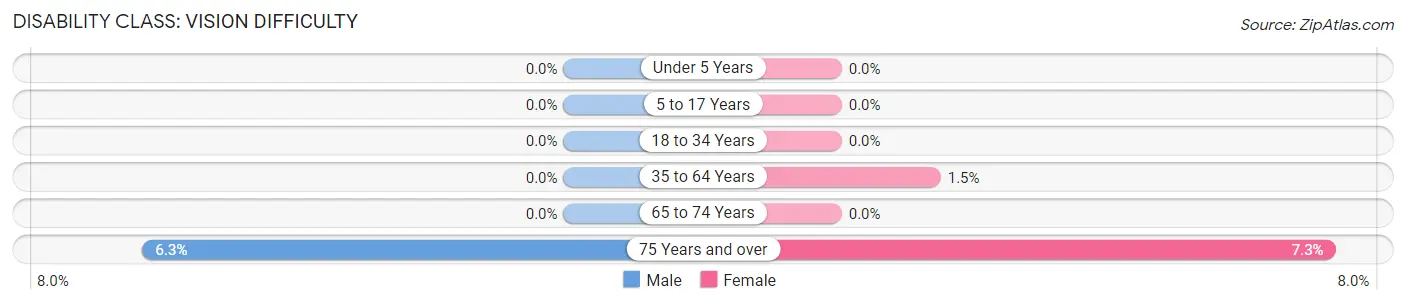
| Age Bracket | Male | Female |
| Under 5 Years | 0 (0.0%) | 0 (0.0%) |
| 5 to 17 Years | 0 (0.0%) | 0 (0.0%) |
| 18 to 34 Years | 0 (0.0%) | 0 (0.0%) |
| 35 to 64 Years | 0 (0.0%) | 10 (1.5%) |
| 65 to 74 Years | 0 (0.0%) | 0 (0.0%) |
| 75 Years and over | 11 (6.2%) | 28 (7.3%) |
Disability Class: Cognitive Difficulty
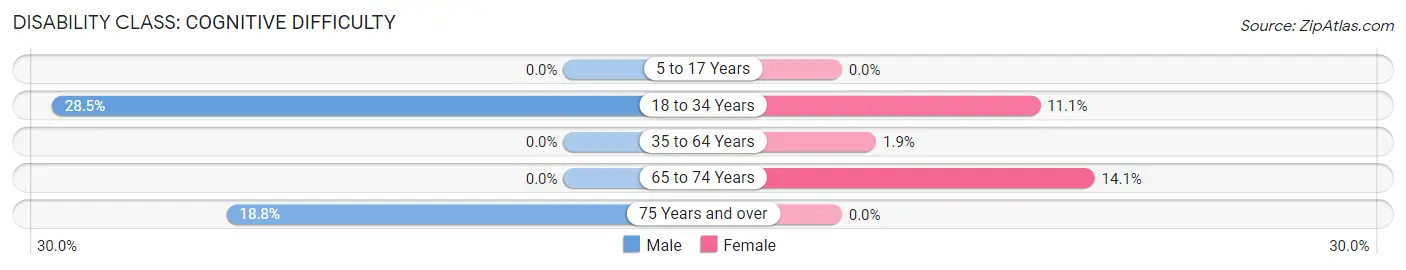
| Age Bracket | Male | Female |
| 5 to 17 Years | 0 (0.0%) | 0 (0.0%) |
| 18 to 34 Years | 47 (28.5%) | 20 (11.1%) |
| 35 to 64 Years | 0 (0.0%) | 13 (1.9%) |
| 65 to 74 Years | 0 (0.0%) | 20 (14.1%) |
| 75 Years and over | 33 (18.8%) | 0 (0.0%) |
Disability Class: Ambulatory Difficulty
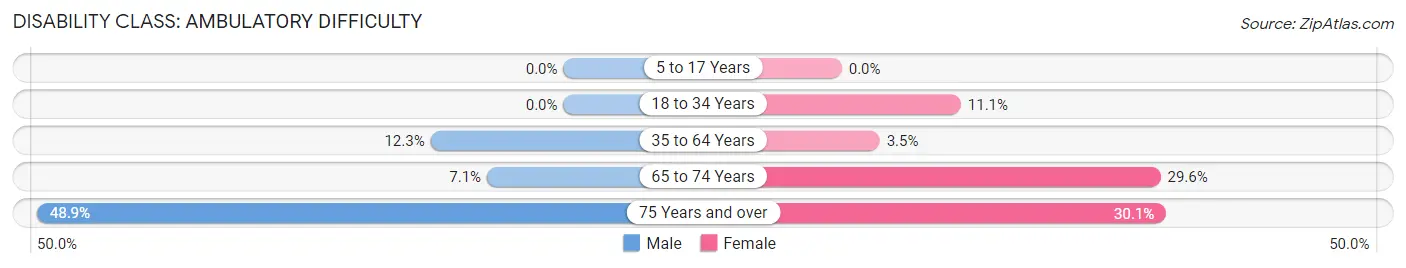
| Age Bracket | Male | Female |
| 5 to 17 Years | 0 (0.0%) | 0 (0.0%) |
| 18 to 34 Years | 0 (0.0%) | 20 (11.1%) |
| 35 to 64 Years | 73 (12.3%) | 24 (3.5%) |
| 65 to 74 Years | 10 (7.1%) | 42 (29.6%) |
| 75 Years and over | 86 (48.9%) | 115 (30.1%) |
Disability Class: Self-Care Difficulty
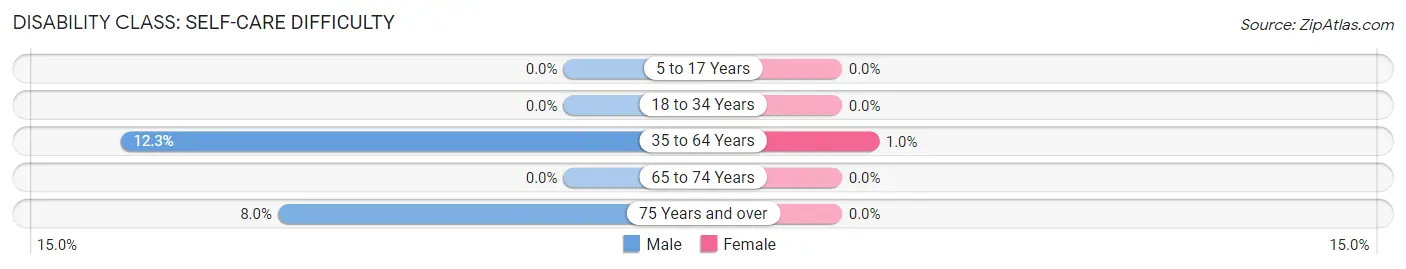
| Age Bracket | Male | Female |
| 5 to 17 Years | 0 (0.0%) | 0 (0.0%) |
| 18 to 34 Years | 0 (0.0%) | 0 (0.0%) |
| 35 to 64 Years | 73 (12.3%) | 7 (1.0%) |
| 65 to 74 Years | 0 (0.0%) | 0 (0.0%) |
| 75 Years and over | 14 (8.0%) | 0 (0.0%) |
Technology Access in Konterra
Computing Device Access in Konterra
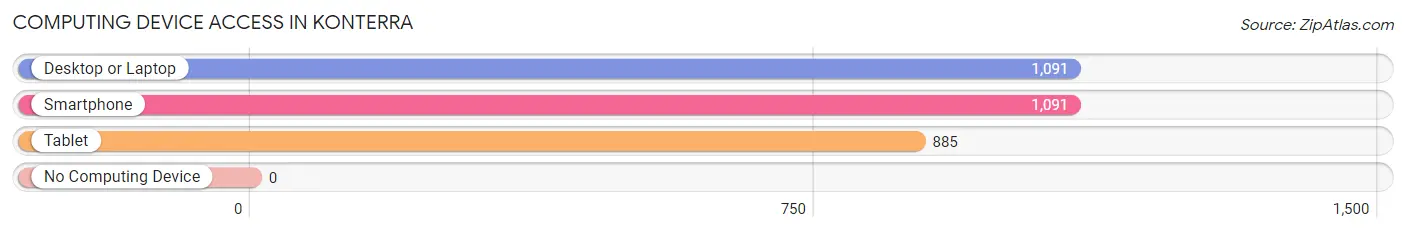
| Device Type | # Households | % Households |
| Desktop or Laptop | 1,091 | 92.1% |
| Smartphone | 1,091 | 92.1% |
| Tablet | 885 | 74.8% |
| No Computing Device | 0 | 0.0% |
| Total | 1,184 | 100.0% |
Internet Access in Konterra
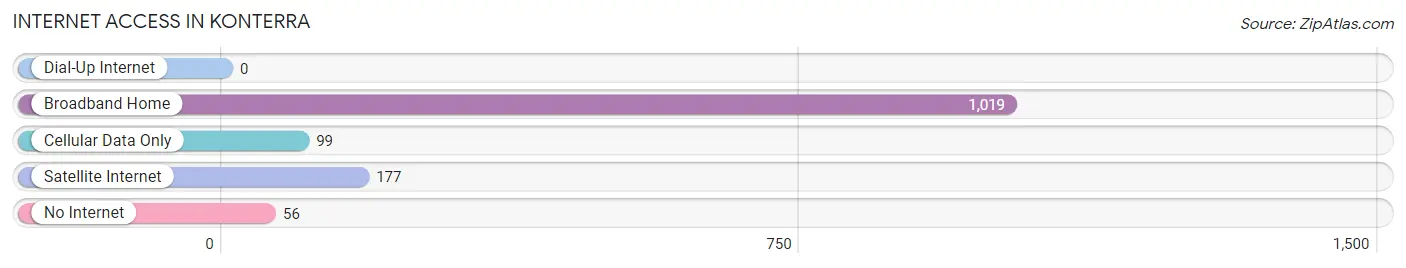
| Internet Type | # Households | % Households |
| Dial-Up Internet | 0 | 0.0% |
| Broadband Home | 1,019 | 86.1% |
| Cellular Data Only | 99 | 8.4% |
| Satellite Internet | 177 | 14.9% |
| No Internet | 56 | 4.7% |
| Total | 1,184 | 100.0% |
Konterra Summary
Konterra is a city located in the state of Maryland, United States. It is located in Prince George's County, and is part of the Washington Metropolitan Area. The city has a population of approximately 30,000 people, and is located about 20 miles east of Washington, D.C.
History
Konterra was founded in 1791 by a group of settlers from Pennsylvania. The city was originally known as "Konterraville," and was named after the Konterra family, who were among the first settlers. The city was incorporated in 1802, and was the first city in Prince George's County to be incorporated.
In the early 19th century, Konterra was a small farming community, and the main industry was tobacco farming. The city was also home to a number of small businesses, including a blacksmith, a general store, and a post office.
In the late 19th century, Konterra began to grow and develop. The city was connected to the Washington, D.C. area by the Baltimore and Ohio Railroad in 1873, and the city's population began to grow. By the early 20th century, Konterra had become a thriving community, with a variety of businesses and industries.
Geography
Konterra is located in Prince George's County, Maryland, and is part of the Washington Metropolitan Area. The city is located about 20 miles east of Washington, D.C., and is bordered by the cities of Bowie, Upper Marlboro, and Clinton.
Konterra is located in a hilly area, and is surrounded by forests and wetlands. The city is located on the banks of the Patuxent River, and is home to a number of parks and recreational areas.
Economy
Konterra's economy is largely based on the service industry, with a number of businesses providing services to the local community. The city is also home to a number of government offices, including the Prince George's County Courthouse and the Prince George's County Police Department.
Konterra is also home to a number of retail stores, restaurants, and other businesses. The city is also home to a number of industrial parks, which provide jobs for many of the city's residents.
Demographics
As of the 2010 census, Konterra had a population of 30,000 people. The city has a diverse population, with a variety of racial and ethnic backgrounds. The largest racial group in the city is African American, making up about 60% of the population. The city also has a large Hispanic population, making up about 20% of the population. The remaining population is made up of whites, Asians, and other racial and ethnic groups.
Konterra is a relatively affluent city, with a median household income of $75,000. The city also has a high rate of homeownership, with about 70% of the population owning their own homes.
Common Questions
What is Per Capita Income in Konterra?
Per Capita income in Konterra is $61,569.
What is the Median Family Income in Konterra?
Median Family Income in Konterra is $150,903.
What is the Median Household income in Konterra?
Median Household Income in Konterra is $150,274.
What is Income or Wage Gap in Konterra?
Income or Wage Gap in Konterra is 21.1%.
Women in Konterra earn 78.9 cents for every dollar earned by a man.
What is Inequality or Gini Index in Konterra?
Inequality or Gini Index in Konterra is 0.35.
What is the Total Population of Konterra?
Total Population of Konterra is 3,104.
What is the Total Male Population of Konterra?
Total Male Population of Konterra is 1,343.
What is the Total Female Population of Konterra?
Total Female Population of Konterra is 1,761.
What is the Ratio of Males per 100 Females in Konterra?
There are 76.26 Males per 100 Females in Konterra.
What is the Ratio of Females per 100 Males in Konterra?
There are 131.12 Females per 100 Males in Konterra.
What is the Median Population Age in Konterra?
Median Population Age in Konterra is 51.1 Years.
What is the Average Family Size in Konterra
Average Family Size in Konterra is 3.0 People.
What is the Average Household Size in Konterra
Average Household Size in Konterra is 2.6 People.
How Large is the Labor Force in Konterra?
There are 1,573 People in the Labor Forcein in Konterra.
What is the Percentage of People in the Labor Force in Konterra?
61.5% of People are in the Labor Force in Konterra.
What is the Unemployment Rate in Konterra?
Unemployment Rate in Konterra is 7.6%.