Zip Codes with the Highest Percentage of Families with Income Above $200,000 in Maryland
RELATED REPORTS & OPTIONS
Family Income | $200k+
Maryland
Compare Zip Codes
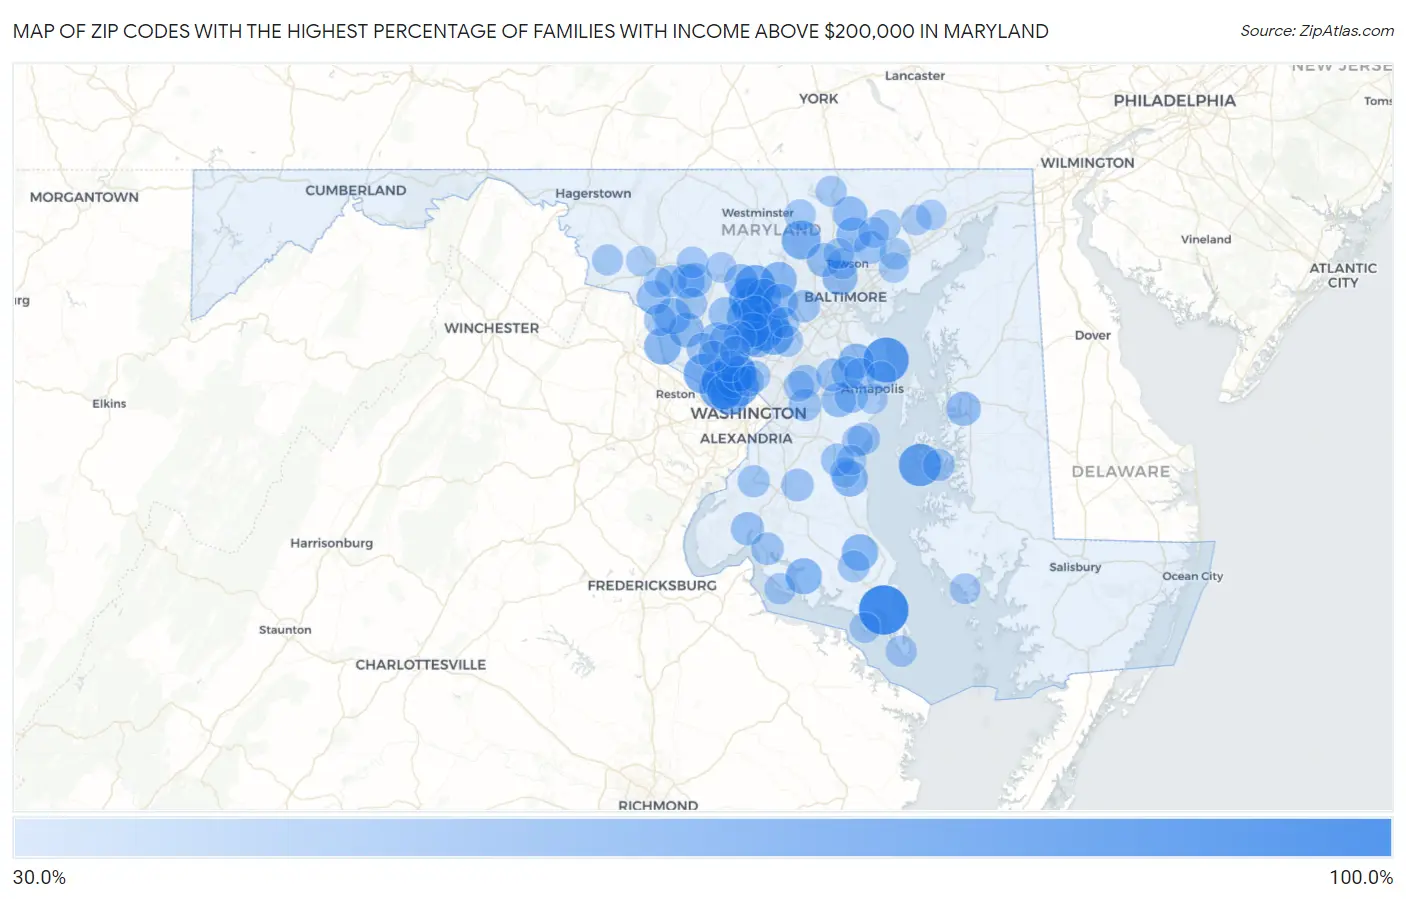
Map of Zip Codes with the Highest Percentage of Families with Income Above $200,000 in Maryland
30.0%
100.0%
Zip Codes with the Highest Percentage of Families with Income Above $200,000 in Maryland
| Zip Code | Families with Income > $200k | vs State | vs National | |
| 1. | 20667 | 100.0% | 23.6%(+76.4)#1 | 14.8%(+85.2)#17 |
| 2. | 21056 | 84.6% | 23.6%(+61.0)#2 | 14.8%(+69.8)#61 |
| 3. | 21652 | 75.0% | 23.6%(+51.4)#3 | 14.8%(+60.2)#84 |
| 4. | 21738 | 72.9% | 23.6%(+49.3)#4 | 14.8%(+58.1)#92 |
| 5. | 20818 | 70.9% | 23.6%(+47.3)#5 | 14.8%(+56.1)#114 |
| 6. | 21737 | 70.0% | 23.6%(+46.4)#6 | 14.8%(+55.2)#122 |
| 7. | 20896 | 67.6% | 23.6%(+44.0)#7 | 14.8%(+52.8)#149 |
| 8. | 21723 | 67.2% | 23.6%(+43.6)#8 | 14.8%(+52.4)#156 |
| 9. | 20854 | 67.0% | 23.6%(+43.4)#9 | 14.8%(+52.2)#157 |
| 10. | 20817 | 66.6% | 23.6%(+43.0)#10 | 14.8%(+51.8)#165 |
| 11. | 20815 | 66.2% | 23.6%(+42.6)#11 | 14.8%(+51.4)#170 |
| 12. | 21029 | 65.1% | 23.6%(+41.5)#12 | 14.8%(+50.3)#185 |
| 13. | 20816 | 64.7% | 23.6%(+41.1)#13 | 14.8%(+49.9)#191 |
| 14. | 20759 | 64.7% | 23.6%(+41.1)#14 | 14.8%(+49.9)#192 |
| 15. | 20777 | 63.6% | 23.6%(+40.0)#15 | 14.8%(+48.8)#210 |
| 16. | 21071 | 62.9% | 23.6%(+39.3)#16 | 14.8%(+48.1)#227 |
| 17. | 20837 | 55.7% | 23.6%(+32.1)#17 | 14.8%(+40.9)#428 |
| 18. | 20615 | 54.5% | 23.6%(+30.9)#18 | 14.8%(+39.7)#475 |
| 19. | 20833 | 54.4% | 23.6%(+30.8)#19 | 14.8%(+39.6)#483 |
| 20. | 20814 | 54.3% | 23.6%(+30.7)#20 | 14.8%(+39.5)#488 |
| 21. | 20812 | 54.1% | 23.6%(+30.5)#21 | 14.8%(+39.3)#497 |
| 22. | 21104 | 53.7% | 23.6%(+30.1)#22 | 14.8%(+38.9)#508 |
| 23. | 20838 | 53.7% | 23.6%(+30.1)#23 | 14.8%(+38.9)#510 |
| 24. | 20621 | 53.2% | 23.6%(+29.6)#24 | 14.8%(+38.4)#529 |
| 25. | 20895 | 53.1% | 23.6%(+29.5)#25 | 14.8%(+38.3)#531 |
| 26. | 20689 | 52.5% | 23.6%(+28.9)#26 | 14.8%(+37.7)#552 |
| 27. | 21146 | 50.5% | 23.6%(+26.9)#27 | 14.8%(+35.7)#641 |
| 28. | 21210 | 50.4% | 23.6%(+26.8)#28 | 14.8%(+35.6)#645 |
| 29. | 20880 | 50.0% | 23.6%(+26.4)#29 | 14.8%(+35.2)#663 |
| 30. | 21794 | 49.9% | 23.6%(+26.3)#30 | 14.8%(+35.1)#677 |
| 31. | 20841 | 49.8% | 23.6%(+26.2)#31 | 14.8%(+35.0)#681 |
| 32. | 21042 | 49.5% | 23.6%(+25.9)#32 | 14.8%(+34.7)#690 |
| 33. | 20860 | 49.2% | 23.6%(+25.6)#33 | 14.8%(+34.4)#709 |
| 34. | 21131 | 48.8% | 23.6%(+25.2)#34 | 14.8%(+34.0)#722 |
| 35. | 21111 | 48.7% | 23.6%(+25.1)#35 | 14.8%(+33.9)#728 |
| 36. | 20861 | 48.4% | 23.6%(+24.8)#36 | 14.8%(+33.6)#741 |
| 37. | 20862 | 47.9% | 23.6%(+24.3)#37 | 14.8%(+33.1)#770 |
| 38. | 21754 | 47.8% | 23.6%(+24.2)#38 | 14.8%(+33.0)#774 |
| 39. | 21035 | 47.6% | 23.6%(+24.0)#39 | 14.8%(+32.8)#782 |
| 40. | 21797 | 47.1% | 23.6%(+23.5)#40 | 14.8%(+32.3)#814 |
| 41. | 21679 | 47.1% | 23.6%(+23.5)#41 | 14.8%(+32.3)#816 |
| 42. | 21036 | 46.9% | 23.6%(+23.3)#42 | 14.8%(+32.1)#823 |
| 43. | 21770 | 46.4% | 23.6%(+22.8)#43 | 14.8%(+31.6)#847 |
| 44. | 21153 | 46.4% | 23.6%(+22.8)#44 | 14.8%(+31.6)#848 |
| 45. | 21710 | 45.7% | 23.6%(+22.1)#45 | 14.8%(+30.9)#893 |
| 46. | 21140 | 44.0% | 23.6%(+20.4)#46 | 14.8%(+29.2)#990 |
| 47. | 20677 | 44.0% | 23.6%(+20.4)#47 | 14.8%(+29.2)#992 |
| 48. | 21057 | 43.1% | 23.6%(+19.5)#48 | 14.8%(+28.3)#1,048 |
| 49. | 20882 | 42.8% | 23.6%(+19.2)#49 | 14.8%(+28.0)#1,066 |
| 50. | 20754 | 42.5% | 23.6%(+18.9)#50 | 14.8%(+27.7)#1,096 |
| 51. | 20720 | 42.3% | 23.6%(+18.7)#51 | 14.8%(+27.5)#1,112 |
| 52. | 21054 | 42.3% | 23.6%(+18.7)#52 | 14.8%(+27.5)#1,114 |
| 53. | 21032 | 42.0% | 23.6%(+18.4)#53 | 14.8%(+27.2)#1,140 |
| 54. | 20832 | 41.8% | 23.6%(+18.2)#54 | 14.8%(+27.0)#1,158 |
| 55. | 20632 | 41.8% | 23.6%(+18.2)#55 | 14.8%(+27.0)#1,162 |
| 56. | 20721 | 41.2% | 23.6%(+17.6)#56 | 14.8%(+26.4)#1,201 |
| 57. | 20613 | 41.2% | 23.6%(+17.6)#57 | 14.8%(+26.4)#1,204 |
| 58. | 21043 | 41.1% | 23.6%(+17.5)#58 | 14.8%(+26.3)#1,212 |
| 59. | 20733 | 41.0% | 23.6%(+17.4)#59 | 14.8%(+26.2)#1,229 |
| 60. | 20842 | 40.3% | 23.6%(+16.7)#60 | 14.8%(+25.5)#1,284 |
| 61. | 20878 | 39.9% | 23.6%(+16.3)#61 | 14.8%(+25.1)#1,321 |
| 62. | 20607 | 39.8% | 23.6%(+16.2)#62 | 14.8%(+25.0)#1,333 |
| 63. | 21662 | 39.7% | 23.6%(+16.1)#63 | 14.8%(+24.9)#1,342 |
| 64. | 21704 | 39.5% | 23.6%(+15.9)#64 | 14.8%(+24.7)#1,357 |
| 65. | 20636 | 38.8% | 23.6%(+15.2)#65 | 14.8%(+24.0)#1,435 |
| 66. | 20871 | 38.7% | 23.6%(+15.1)#66 | 14.8%(+23.9)#1,442 |
| 67. | 20855 | 38.4% | 23.6%(+14.8)#67 | 14.8%(+23.6)#1,475 |
| 68. | 21405 | 38.4% | 23.6%(+14.8)#68 | 14.8%(+23.6)#1,477 |
| 69. | 21774 | 38.3% | 23.6%(+14.7)#69 | 14.8%(+23.5)#1,482 |
| 70. | 20852 | 38.0% | 23.6%(+14.4)#70 | 14.8%(+23.2)#1,500 |
| 71. | 21156 | 37.8% | 23.6%(+14.2)#71 | 14.8%(+23.0)#1,521 |
| 72. | 21155 | 37.5% | 23.6%(+13.9)#72 | 14.8%(+22.7)#1,557 |
| 73. | 20645 | 37.5% | 23.6%(+13.9)#73 | 14.8%(+22.7)#1,558 |
| 74. | 20687 | 37.0% | 23.6%(+13.4)#74 | 14.8%(+22.2)#1,613 |
| 75. | 20850 | 36.7% | 23.6%(+13.1)#75 | 14.8%(+21.9)#1,639 |
| 76. | 21047 | 36.7% | 23.6%(+13.1)#76 | 14.8%(+21.9)#1,644 |
| 77. | 21120 | 36.5% | 23.6%(+12.9)#77 | 14.8%(+21.7)#1,673 |
| 78. | 20751 | 36.5% | 23.6%(+12.9)#78 | 14.8%(+21.7)#1,675 |
| 79. | 21779 | 36.5% | 23.6%(+12.9)#79 | 14.8%(+21.7)#1,676 |
| 80. | 20723 | 36.4% | 23.6%(+12.8)#80 | 14.8%(+21.6)#1,679 |
| 81. | 21204 | 36.4% | 23.6%(+12.8)#81 | 14.8%(+21.6)#1,685 |
| 82. | 21093 | 36.2% | 23.6%(+12.6)#82 | 14.8%(+21.4)#1,704 |
| 83. | 20901 | 36.2% | 23.6%(+12.6)#83 | 14.8%(+21.4)#1,705 |
| 84. | 21013 | 36.2% | 23.6%(+12.6)#84 | 14.8%(+21.4)#1,710 |
| 85. | 21044 | 36.0% | 23.6%(+12.4)#85 | 14.8%(+21.2)#1,724 |
| 86. | 20910 | 36.0% | 23.6%(+12.4)#86 | 14.8%(+21.2)#1,725 |
| 87. | 20769 | 36.0% | 23.6%(+12.4)#87 | 14.8%(+21.2)#1,732 |
| 88. | 20690 | 35.8% | 23.6%(+12.2)#88 | 14.8%(+21.0)#1,751 |
| 89. | 21675 | 35.3% | 23.6%(+11.7)#89 | 14.8%(+20.5)#1,815 |
| 90. | 21771 | 35.1% | 23.6%(+11.5)#90 | 14.8%(+20.3)#1,827 |
| 91. | 20853 | 34.7% | 23.6%(+11.1)#91 | 14.8%(+19.9)#1,874 |
| 92. | 21015 | 34.5% | 23.6%(+10.9)#92 | 14.8%(+19.7)#1,902 |
| 93. | 21403 | 34.4% | 23.6%(+10.8)#93 | 14.8%(+19.6)#1,912 |
| 94. | 21028 | 34.4% | 23.6%(+10.8)#94 | 14.8%(+19.6)#1,918 |
| 95. | 21714 | 34.3% | 23.6%(+10.7)#95 | 14.8%(+19.5)#1,931 |
| 96. | 21162 | 33.9% | 23.6%(+10.3)#96 | 14.8%(+19.1)#1,978 |
| 97. | 21717 | 33.9% | 23.6%(+10.3)#97 | 14.8%(+19.1)#1,982 |
| 98. | 20736 | 33.8% | 23.6%(+10.2)#98 | 14.8%(+19.0)#1,991 |
| 99. | 21409 | 33.7% | 23.6%(+10.1)#99 | 14.8%(+18.9)#2,000 |
| 100. | 20758 | 33.7% | 23.6%(+10.1)#100 | 14.8%(+18.9)#2,003 |
Common Questions
What are the Top 10 Zip Codes with the Highest Percentage of Families with Income Above $200,000 in Maryland?
Top 10 Zip Codes with the Highest Percentage of Families with Income Above $200,000 in Maryland are:
What zip code has the Highest Percentage of Families with Income Above $200,000 in Maryland?
20667 has the Highest Percentage of Families with Income Above $200,000 in Maryland with 100.0%.
What is the Percentage of Families with Income Above $200,000 in the State of Maryland?
Percentage of Families with Income Above $200,000 in Maryland is 23.6%.
What is the Percentage of Families with Income Above $200,000 in the United States?
Percentage of Families with Income Above $200,000 in the United States is 14.8%.