Chewsville, MD Map & Demographics
Chewsville Map
Chewsville Overview
$54,147
PER CAPITA INCOME
$207,557
AVG FAMILY INCOME
$151,161
AVG HOUSEHOLD INCOME
58.0%
WAGE / INCOME GAP [ % ]
42.0¢/ $1
WAGE / INCOME GAP [ $ ]
0.30
INEQUALITY / GINI INDEX
262
TOTAL POPULATION
161
MALE POPULATION
101
FEMALE POPULATION
159.41
MALES / 100 FEMALES
62.73
FEMALES / 100 MALES
37.2
MEDIAN AGE
2.9
AVG FAMILY SIZE
2.5
AVG HOUSEHOLD SIZE
165
LABOR FORCE [ PEOPLE ]
84.6%
PERCENT IN LABOR FORCE
Chewsville Area Codes
Income in Chewsville
Income Overview in Chewsville
Per Capita Income in Chewsville is $54,147, while median incomes of families and households are $207,557 and $151,161 respectively.
| Characteristic | Number | Measure |
| Per Capita Income | 262 | $54,147 |
| Median Family Income | 86 | $207,557 |
| Mean Family Income | 86 | $156,438 |
| Median Household Income | 103 | $151,161 |
| Mean Household Income | 103 | $135,061 |
| Income Deficit | 86 | $0 |
| Wage / Income Gap (%) | 262 | 57.97% |
| Wage / Income Gap ($) | 262 | 42.03¢ per $1 |
| Gini / Inequality Index | 262 | 0.30 |
Earnings by Sex in Chewsville
Average Earnings in Chewsville are $62,306, $61,033 for men and $145,199 for women, a difference of 58.0%.
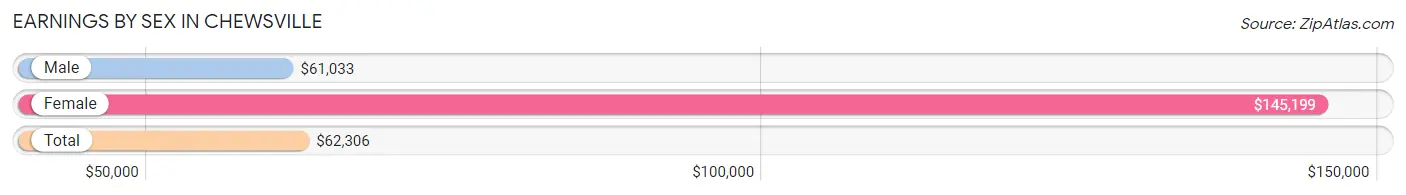
| Sex | Number | Average Earnings |
| Male | 84 (50.9%) | $61,033 |
| Female | 81 (49.1%) | $145,199 |
| Total | 165 (100.0%) | $62,306 |
Earnings by Sex by Income Bracket in Chewsville
The most common earnings brackets in Chewsville are $55,000 to $64,999 for men (46 | 54.8%) and $100,000+ for women (44 | 54.3%).
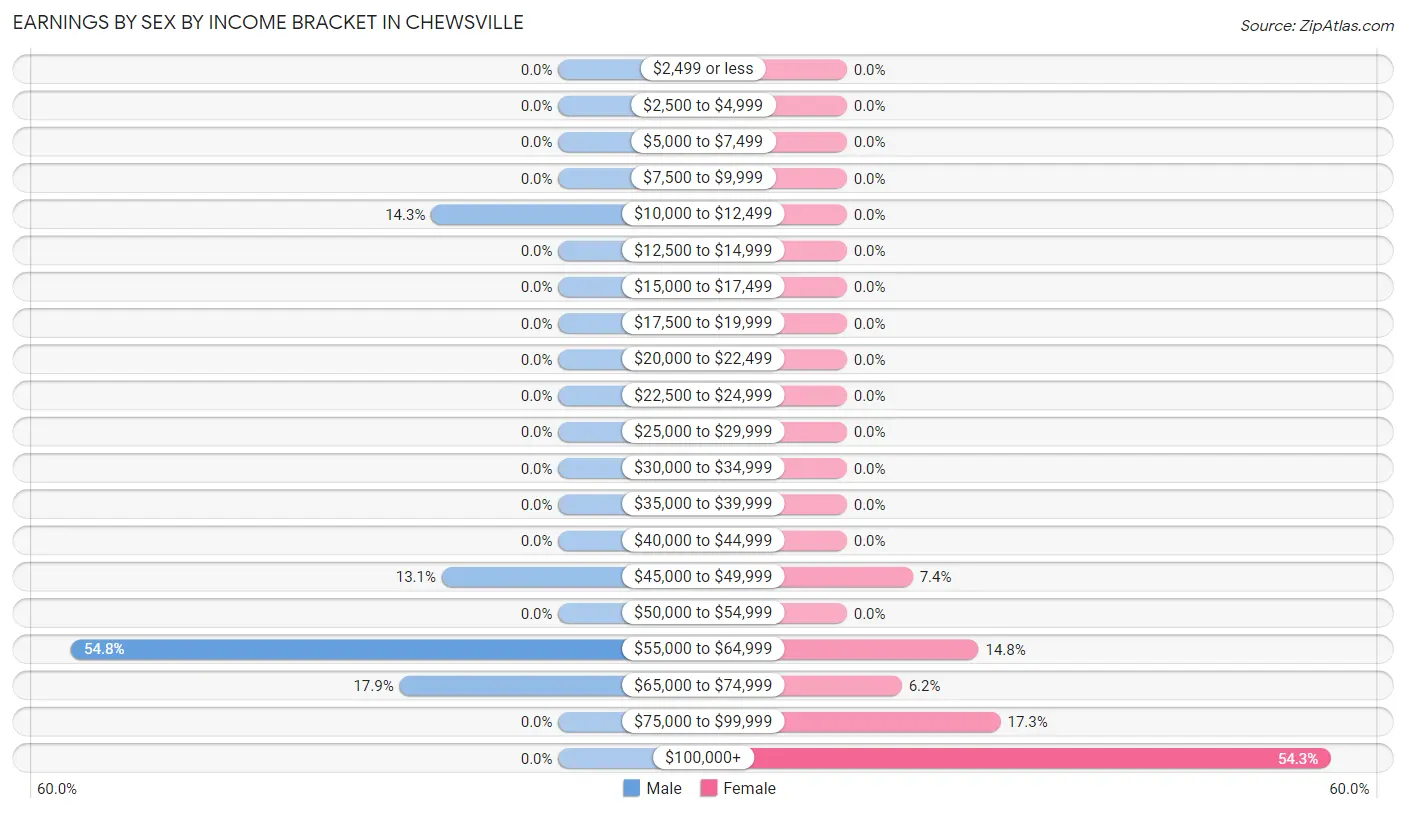
| Income | Male | Female |
| $2,499 or less | 0 (0.0%) | 0 (0.0%) |
| $2,500 to $4,999 | 0 (0.0%) | 0 (0.0%) |
| $5,000 to $7,499 | 0 (0.0%) | 0 (0.0%) |
| $7,500 to $9,999 | 0 (0.0%) | 0 (0.0%) |
| $10,000 to $12,499 | 12 (14.3%) | 0 (0.0%) |
| $12,500 to $14,999 | 0 (0.0%) | 0 (0.0%) |
| $15,000 to $17,499 | 0 (0.0%) | 0 (0.0%) |
| $17,500 to $19,999 | 0 (0.0%) | 0 (0.0%) |
| $20,000 to $22,499 | 0 (0.0%) | 0 (0.0%) |
| $22,500 to $24,999 | 0 (0.0%) | 0 (0.0%) |
| $25,000 to $29,999 | 0 (0.0%) | 0 (0.0%) |
| $30,000 to $34,999 | 0 (0.0%) | 0 (0.0%) |
| $35,000 to $39,999 | 0 (0.0%) | 0 (0.0%) |
| $40,000 to $44,999 | 0 (0.0%) | 0 (0.0%) |
| $45,000 to $49,999 | 11 (13.1%) | 6 (7.4%) |
| $50,000 to $54,999 | 0 (0.0%) | 0 (0.0%) |
| $55,000 to $64,999 | 46 (54.8%) | 12 (14.8%) |
| $65,000 to $74,999 | 15 (17.9%) | 5 (6.2%) |
| $75,000 to $99,999 | 0 (0.0%) | 14 (17.3%) |
| $100,000+ | 0 (0.0%) | 44 (54.3%) |
| Total | 84 (100.0%) | 81 (100.0%) |
Earnings by Sex by Educational Attainment in Chewsville
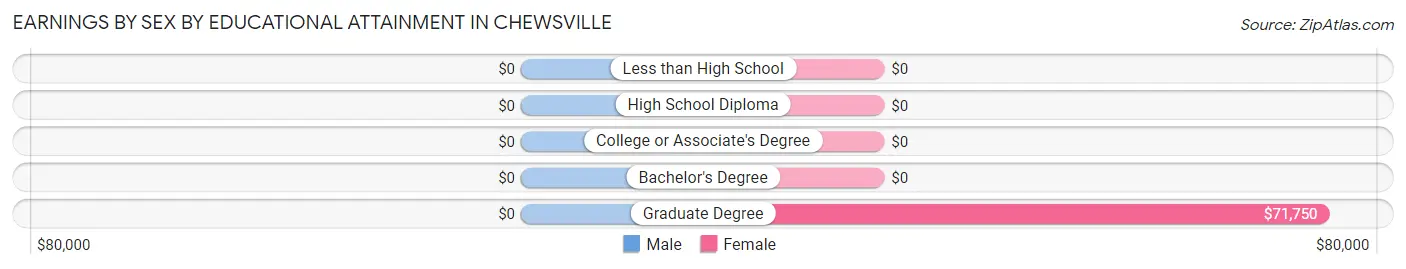
| Educational Attainment | Male Income | Female Income |
| Less than High School | - | - |
| High School Diploma | - | - |
| College or Associate's Degree | - | - |
| Bachelor's Degree | - | - |
| Graduate Degree | - | - |
| Total | $61,033 | $145,199 |
Family Income in Chewsville
Family Income Brackets in Chewsville
According to the Chewsville family income data, there are 44 families falling into the $200,000+ income range, which is the most common income bracket and makes up 51.2% of all families.
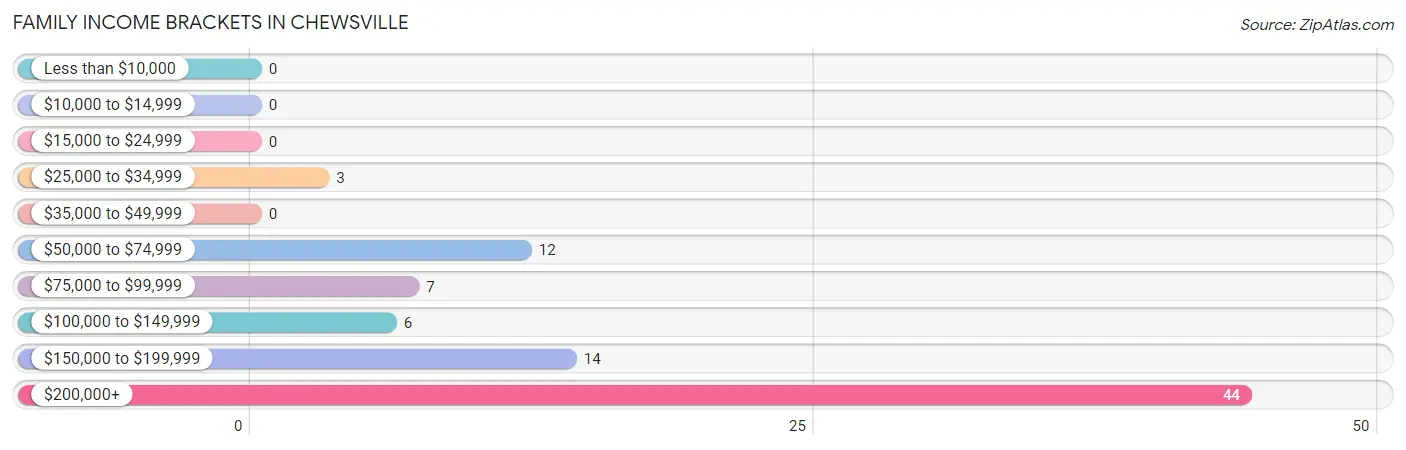
| Income Bracket | # Families | % Families |
| Less than $10,000 | 0 | 0.0% |
| $10,000 to $14,999 | 0 | 0.0% |
| $15,000 to $24,999 | 0 | 0.0% |
| $25,000 to $34,999 | 3 | 3.5% |
| $35,000 to $49,999 | 0 | 0.0% |
| $50,000 to $74,999 | 12 | 14.0% |
| $75,000 to $99,999 | 7 | 8.1% |
| $100,000 to $149,999 | 6 | 7.0% |
| $150,000 to $199,999 | 14 | 16.3% |
| $200,000+ | 44 | 51.2% |
Family Income by Famaliy Size in Chewsville
2-person families (28 | 32.6%) account for the highest median family income in Chewsville with $72,292 per family, while 2-person families (28 | 32.6%) have the highest median income of $36,146 per family member.
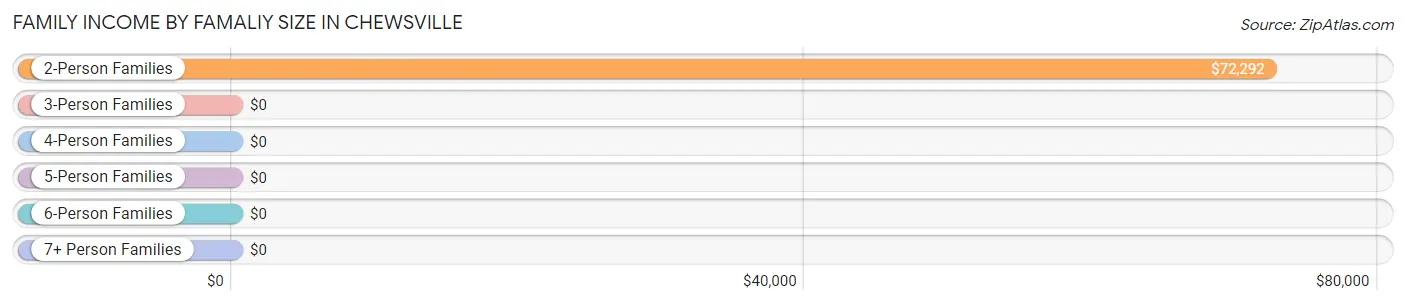
| Income Bracket | # Families | Median Income |
| 2-Person Families | 28 (32.6%) | $72,292 |
| 3-Person Families | 44 (51.2%) | $0 |
| 4-Person Families | 14 (16.3%) | $0 |
| 5-Person Families | 0 (0.0%) | $0 |
| 6-Person Families | 0 (0.0%) | $0 |
| 7+ Person Families | 0 (0.0%) | $0 |
| Total | 86 (100.0%) | $207,557 |
Family Income by Number of Earners in Chewsville
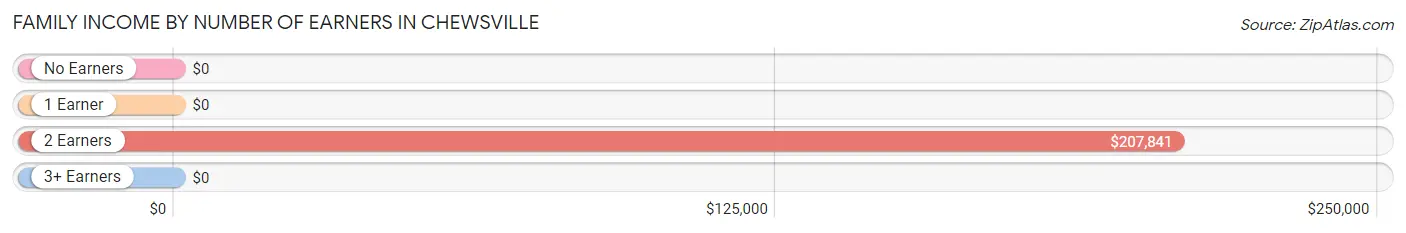
| Number of Earners | # Families | Median Income |
| No Earners | 3 (3.5%) | $0 |
| 1 Earner | 7 (8.1%) | $0 |
| 2 Earners | 76 (88.4%) | $207,841 |
| 3+ Earners | 0 (0.0%) | $0 |
| Total | 86 (100.0%) | $207,557 |
Household Income in Chewsville
Household Income Brackets in Chewsville
With 44 households falling in the category, the $200,000+ income range is the most frequent in Chewsville, accounting for 42.7% of all households.
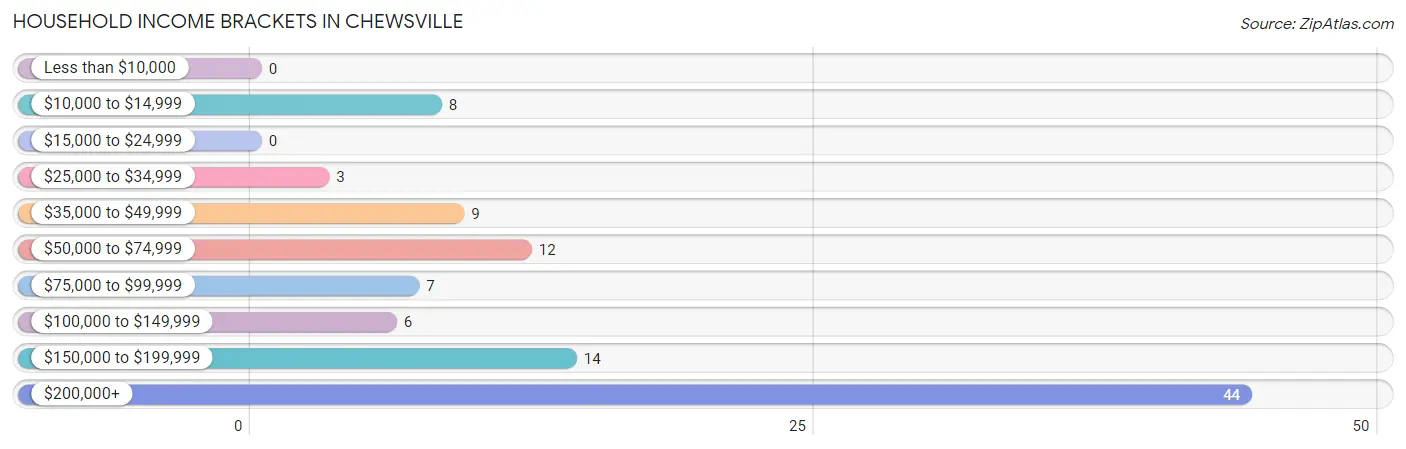
| Income Bracket | # Households | % Households |
| Less than $10,000 | 0 | 0.0% |
| $10,000 to $14,999 | 8 | 7.8% |
| $15,000 to $24,999 | 0 | 0.0% |
| $25,000 to $34,999 | 3 | 2.9% |
| $35,000 to $49,999 | 9 | 8.7% |
| $50,000 to $74,999 | 12 | 11.7% |
| $75,000 to $99,999 | 7 | 6.8% |
| $100,000 to $149,999 | 6 | 5.8% |
| $150,000 to $199,999 | 14 | 13.6% |
| $200,000+ | 44 | 42.7% |
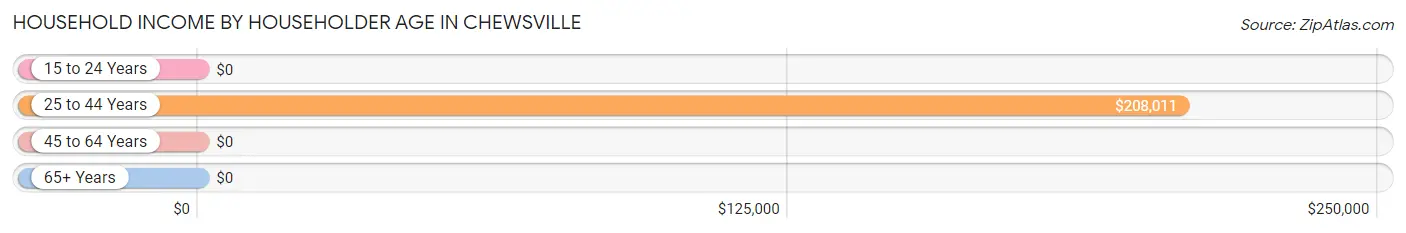
Household Income by Householder Age in Chewsville
The median household income in Chewsville is $151,161, with the highest median household income of $208,011 found in the 25 to 44 years age bracket for the primary householder. A total of 70 households (68.0%) fall into this category.
| Income Bracket | # Households | Median Income |
| 15 to 24 Years | 0 (0.0%) | $0 |
| 25 to 44 Years | 70 (68.0%) | $208,011 |
| 45 to 64 Years | 21 (20.4%) | $0 |
| 65+ Years | 12 (11.7%) | $0 |
| Total | 103 (100.0%) | $151,161 |
Poverty in Chewsville
Income Below Poverty by Sex and Age in Chewsville
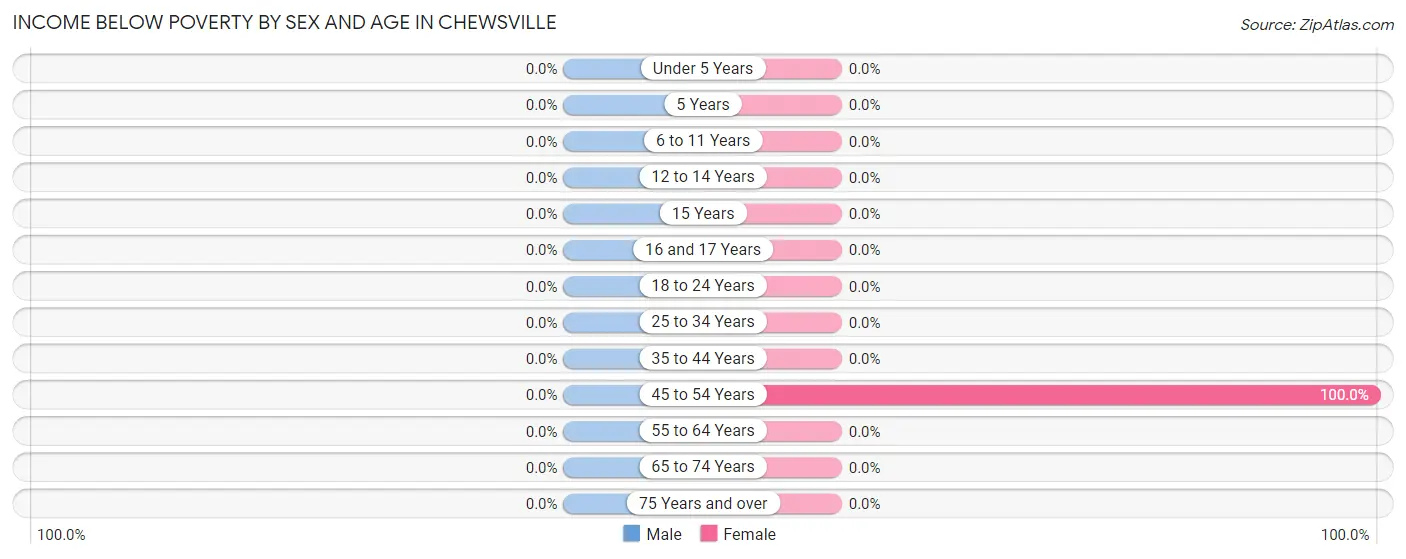
| Age Bracket | Male | Female |
| Under 5 Years | 0 (0.0%) | 0 (0.0%) |
| 5 Years | 0 (0.0%) | 0 (0.0%) |
| 6 to 11 Years | 0 (0.0%) | 0 (0.0%) |
| 12 to 14 Years | 0 (0.0%) | 0 (0.0%) |
| 15 Years | 0 (0.0%) | 0 (0.0%) |
| 16 and 17 Years | 0 (0.0%) | 0 (0.0%) |
| 18 to 24 Years | 0 (0.0%) | 0 (0.0%) |
| 25 to 34 Years | 0 (0.0%) | 0 (0.0%) |
| 35 to 44 Years | 0 (0.0%) | 0 (0.0%) |
| 45 to 54 Years | 0 (0.0%) | 8 (100.0%) |
| 55 to 64 Years | 0 (0.0%) | 0 (0.0%) |
| 65 to 74 Years | 0 (0.0%) | 0 (0.0%) |
| 75 Years and over | 0 (0.0%) | 0 (0.0%) |
| Total | 0 (0.0%) | 8 (7.9%) |
Income Above Poverty by Sex and Age in Chewsville
According to the poverty statistics in Chewsville, males aged under 5 years and females aged 25 to 34 years are the age groups that are most secure financially, with 100.0% of males and 100.0% of females in these age groups living above the poverty line.
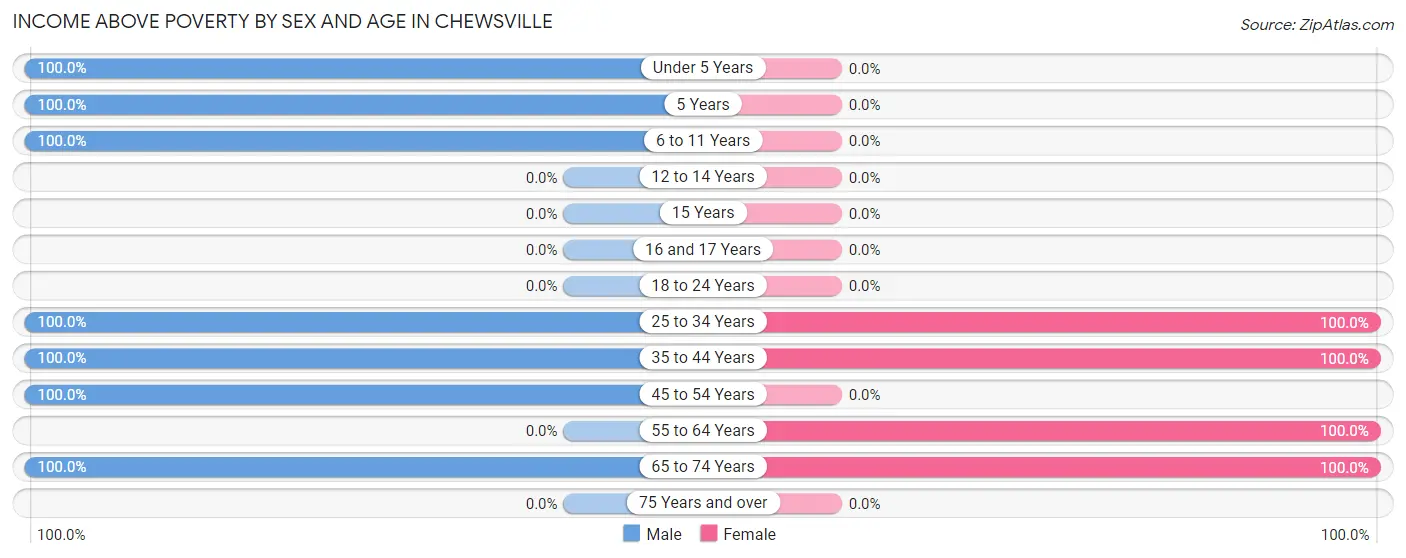
| Age Bracket | Male | Female |
| Under 5 Years | 37 (100.0%) | 0 (0.0%) |
| 5 Years | 15 (100.0%) | 0 (0.0%) |
| 6 to 11 Years | 15 (100.0%) | 0 (0.0%) |
| 12 to 14 Years | 0 (0.0%) | 0 (0.0%) |
| 15 Years | 0 (0.0%) | 0 (0.0%) |
| 16 and 17 Years | 0 (0.0%) | 0 (0.0%) |
| 18 to 24 Years | 0 (0.0%) | 0 (0.0%) |
| 25 to 34 Years | 11 (100.0%) | 12 (100.0%) |
| 35 to 44 Years | 73 (100.0%) | 58 (100.0%) |
| 45 to 54 Years | 7 (100.0%) | 0 (0.0%) |
| 55 to 64 Years | 0 (0.0%) | 11 (100.0%) |
| 65 to 74 Years | 3 (100.0%) | 12 (100.0%) |
| 75 Years and over | 0 (0.0%) | 0 (0.0%) |
| Total | 161 (100.0%) | 93 (92.1%) |
Income Below Poverty Among Married-Couple Families in Chewsville
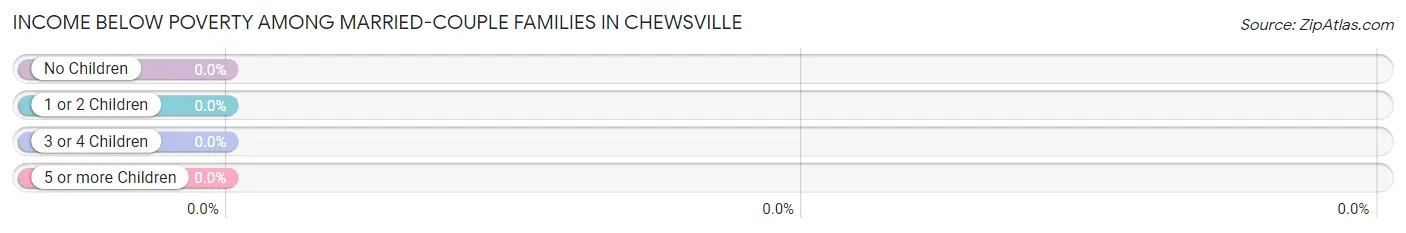
| Children | Above Poverty | Below Poverty |
| No Children | 15 (100.0%) | 0 (0.0%) |
| 1 or 2 Children | 58 (100.0%) | 0 (0.0%) |
| 3 or 4 Children | 0 (0.0%) | 0 (0.0%) |
| 5 or more Children | 0 (0.0%) | 0 (0.0%) |
| Total | 73 (100.0%) | 0 (0.0%) |
Income Below Poverty Among Single-Parent Households in Chewsville
| Children | Single Father | Single Mother |
| No Children | 0 (0.0%) | 0 (0.0%) |
| 1 or 2 Children | 0 (0.0%) | 0 (0.0%) |
| 3 or 4 Children | 0 (0.0%) | 0 (0.0%) |
| 5 or more Children | 0 (0.0%) | 0 (0.0%) |
| Total | 0 (0.0%) | 0 (0.0%) |
Income Below Poverty Among Married-Couple vs Single-Parent Households in Chewsville
| Children | Married-Couple Families | Single-Parent Households |
| No Children | 0 (0.0%) | 0 (0.0%) |
| 1 or 2 Children | 0 (0.0%) | 0 (0.0%) |
| 3 or 4 Children | 0 (0.0%) | 0 (0.0%) |
| 5 or more Children | 0 (0.0%) | 0 (0.0%) |
| Total | 0 (0.0%) | 0 (0.0%) |
Race in Chewsville
The most populous races in Chewsville are White / Caucasian (225 | 85.9%), Hispanic or Latino (37 | 14.1%), and Two or more Races (37 | 14.1%).
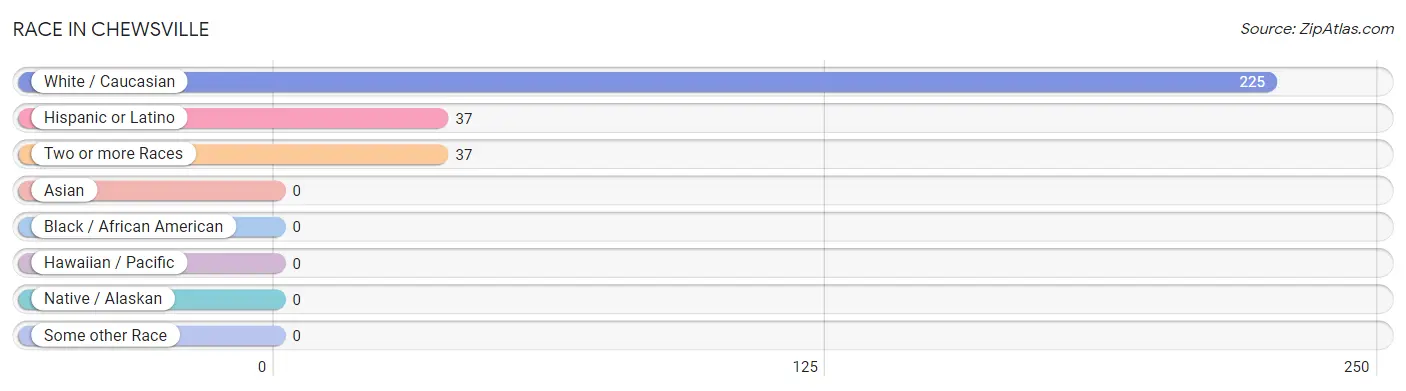
| Race | # Population | % Population |
| Asian | 0 | 0.0% |
| Black / African American | 0 | 0.0% |
| Hawaiian / Pacific | 0 | 0.0% |
| Hispanic or Latino | 37 | 14.1% |
| Native / Alaskan | 0 | 0.0% |
| White / Caucasian | 225 | 85.9% |
| Two or more Races | 37 | 14.1% |
| Some other Race | 0 | 0.0% |
| Total | 262 | 100.0% |
Ancestry in Chewsville
The most populous ancestries reported in Chewsville are Italian (110 | 42.0%), Irish (78 | 29.8%), German (74 | 28.2%), Scottish (65 | 24.8%), and Mexican (37 | 14.1%), together accounting for 138.9% of all Chewsville residents.
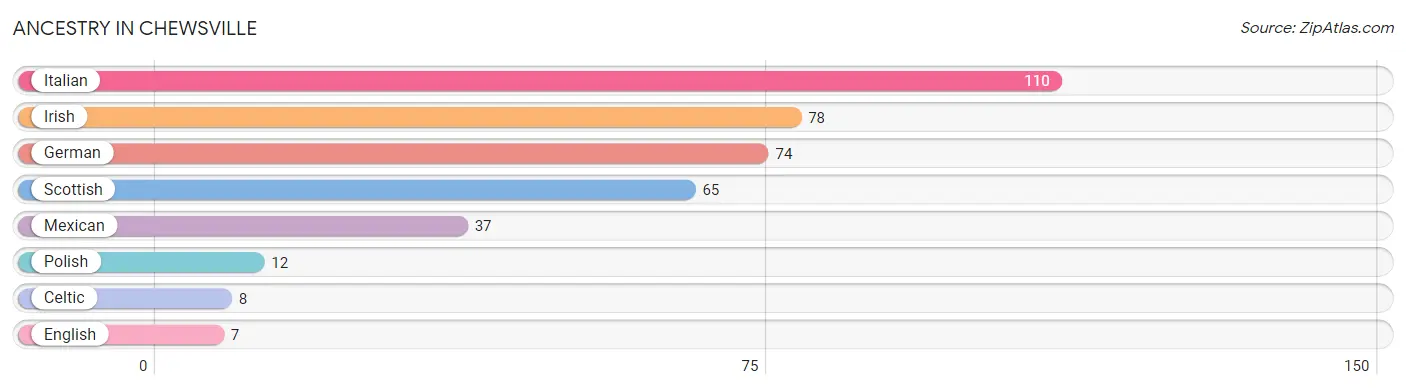
| Ancestry | # Population | % Population |
| Celtic | 8 | 3.0% |
| English | 7 | 2.7% |
| German | 74 | 28.2% |
| Irish | 78 | 29.8% |
| Italian | 110 | 42.0% |
| Mexican | 37 | 14.1% |
| Polish | 12 | 4.6% |
| Scottish | 65 | 24.8% | View All 8 Rows |
Immigrants in Chewsville

| Immigration Origin | # Population | % Population | View All 0 Rows |
Sex and Age in Chewsville
Sex and Age in Chewsville
The most populous age groups in Chewsville are 35 to 39 Years (73 | 45.3%) for men and 35 to 39 Years (58 | 57.4%) for women.
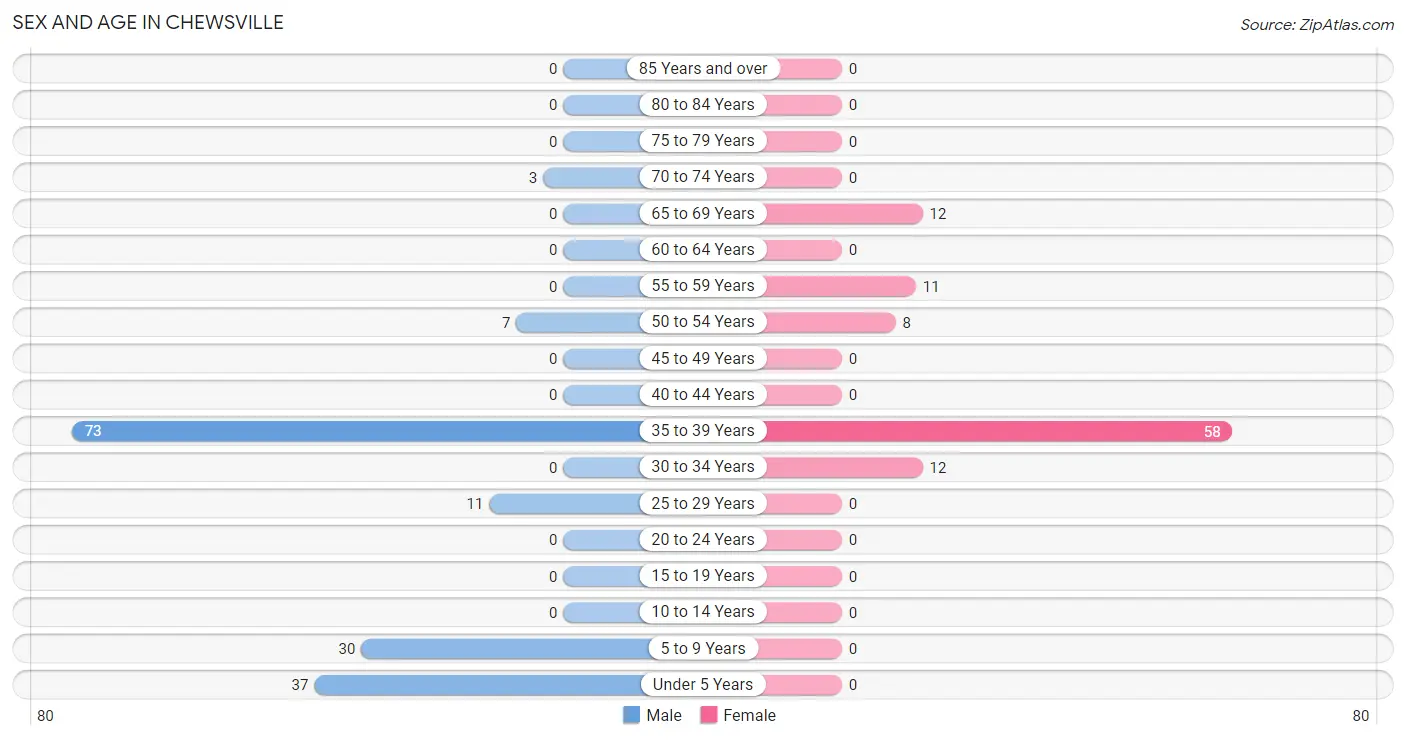
| Age Bracket | Male | Female |
| Under 5 Years | 37 (23.0%) | 0 (0.0%) |
| 5 to 9 Years | 30 (18.6%) | 0 (0.0%) |
| 10 to 14 Years | 0 (0.0%) | 0 (0.0%) |
| 15 to 19 Years | 0 (0.0%) | 0 (0.0%) |
| 20 to 24 Years | 0 (0.0%) | 0 (0.0%) |
| 25 to 29 Years | 11 (6.8%) | 0 (0.0%) |
| 30 to 34 Years | 0 (0.0%) | 12 (11.9%) |
| 35 to 39 Years | 73 (45.3%) | 58 (57.4%) |
| 40 to 44 Years | 0 (0.0%) | 0 (0.0%) |
| 45 to 49 Years | 0 (0.0%) | 0 (0.0%) |
| 50 to 54 Years | 7 (4.3%) | 8 (7.9%) |
| 55 to 59 Years | 0 (0.0%) | 11 (10.9%) |
| 60 to 64 Years | 0 (0.0%) | 0 (0.0%) |
| 65 to 69 Years | 0 (0.0%) | 12 (11.9%) |
| 70 to 74 Years | 3 (1.9%) | 0 (0.0%) |
| 75 to 79 Years | 0 (0.0%) | 0 (0.0%) |
| 80 to 84 Years | 0 (0.0%) | 0 (0.0%) |
| 85 Years and over | 0 (0.0%) | 0 (0.0%) |
| Total | 161 (100.0%) | 101 (100.0%) |
Families and Households in Chewsville
Median Family Size in Chewsville
The median family size in Chewsville is 2.85 persons per family, with married-couple families (73 | 84.9%) accounting for the largest median family size of 2.96 persons per family. On the other hand, single male/father families (7 | 8.1%) represent the smallest median family size with 1.71 persons per family.
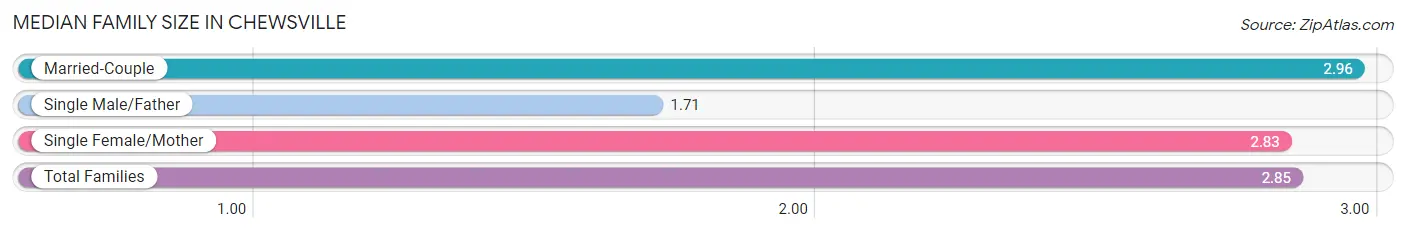
| Family Type | # Families | Family Size |
| Married-Couple | 73 (84.9%) | 2.96 |
| Single Male/Father | 7 (8.1%) | 1.71 |
| Single Female/Mother | 6 (7.0%) | 2.83 |
| Total Families | 86 (100.0%) | 2.85 |
Median Household Size in Chewsville
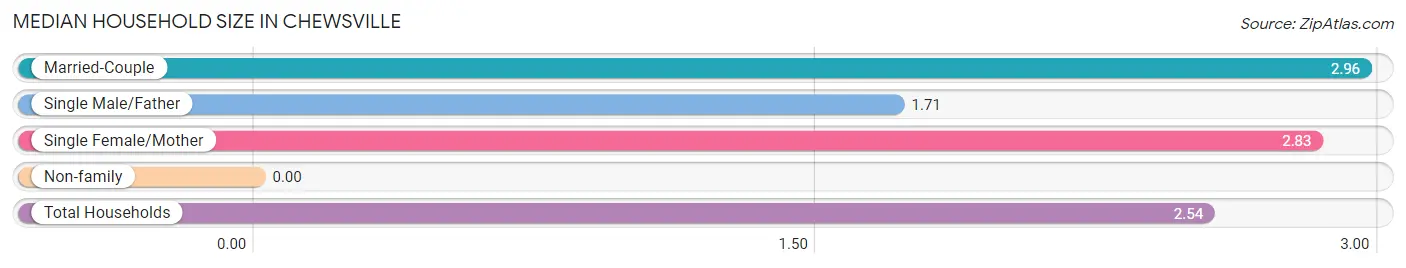
| Household Type | # Households | Household Size |
| Married-Couple | 73 (70.9%) | 2.96 |
| Single Male/Father | 7 (6.8%) | 1.71 |
| Single Female/Mother | 6 (5.8%) | 2.83 |
| Non-family | 17 (16.5%) | - |
| Total Households | 103 (100.0%) | 2.54 |
Household Size by Marriage Status in Chewsville
Out of a total of 103 households in Chewsville, 86 (83.5%) are family households, while 17 (16.5%) are nonfamily households. The most numerous type of family households are 3-person households, comprising 44, and the most common type of nonfamily households are 1-person households, comprising 17.
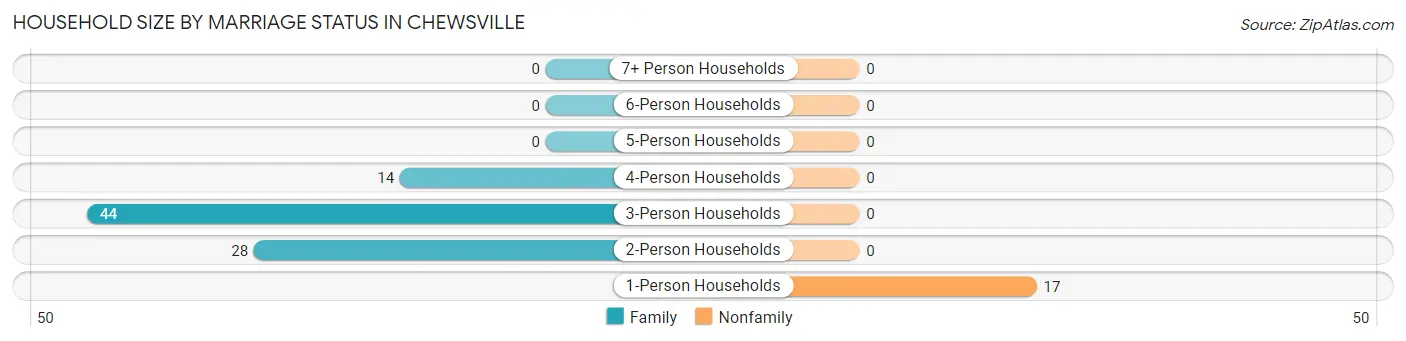
| Household Size | Family Households | Nonfamily Households |
| 1-Person Households | - | 17 (16.5%) |
| 2-Person Households | 28 (27.2%) | 0 (0.0%) |
| 3-Person Households | 44 (42.7%) | 0 (0.0%) |
| 4-Person Households | 14 (13.6%) | 0 (0.0%) |
| 5-Person Households | 0 (0.0%) | 0 (0.0%) |
| 6-Person Households | 0 (0.0%) | 0 (0.0%) |
| 7+ Person Households | 0 (0.0%) | 0 (0.0%) |
| Total | 86 (83.5%) | 17 (16.5%) |
Female Fertility in Chewsville
Fertility by Age in Chewsville
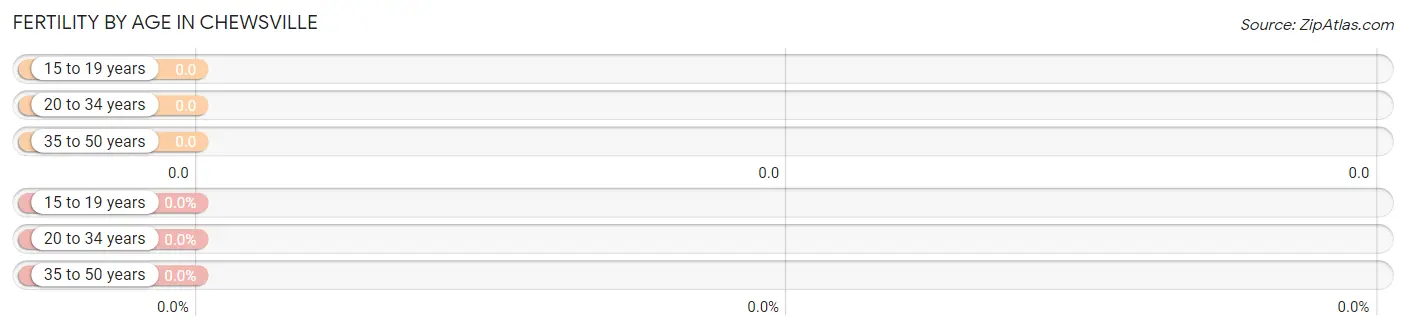
| Age Bracket | Women with Births | Births / 1,000 Women |
| 15 to 19 years | 0 (0.0%) | 0.0 |
| 20 to 34 years | 0 (0.0%) | 0.0 |
| 35 to 50 years | 0 (0.0%) | 0.0 |
| Total | 0 (0.0%) | 0.0 |
Fertility by Age by Marriage Status in Chewsville
| Age Bracket | Married | Unmarried |
| 15 to 19 years | 0 (0.0%) | 0 (0.0%) |
| 20 to 34 years | 0 (0.0%) | 0 (0.0%) |
| 35 to 50 years | 0 (0.0%) | 0 (0.0%) |
| Total | 0 (0.0%) | 0 (0.0%) |
Fertility by Education in Chewsville
| Educational Attainment | Women with Births | Births / 1,000 Women |
| Less than High School | 0 (0.0%) | 0.0 |
| High School Diploma | 0 (0.0%) | 0.0 |
| College or Associate's Degree | 0 (0.0%) | 0.0 |
| Bachelor's Degree | 0 (0.0%) | 0.0 |
| Graduate Degree | 0 (0.0%) | 0.0 |
| Total | 0 (0.0%) | 0.0 |
Fertility by Education by Marriage Status in Chewsville
| Educational Attainment | Married | Unmarried |
| Less than High School | 0 (0.0%) | 0 (0.0%) |
| High School Diploma | 0 (0.0%) | 0 (0.0%) |
| College or Associate's Degree | 0 (0.0%) | 0 (0.0%) |
| Bachelor's Degree | 0 (0.0%) | 0 (0.0%) |
| Graduate Degree | 0 (0.0%) | 0 (0.0%) |
| Total | 0 (0.0%) | 0 (0.0%) |
Employment Characteristics in Chewsville
Employment by Class of Employer in Chewsville
Among the 165 employed individuals in Chewsville, local government employees (63 | 38.2%), not-for-profit organizations (44 | 26.7%), and private company employees (29 | 17.6%) make up the most common classes of employment.
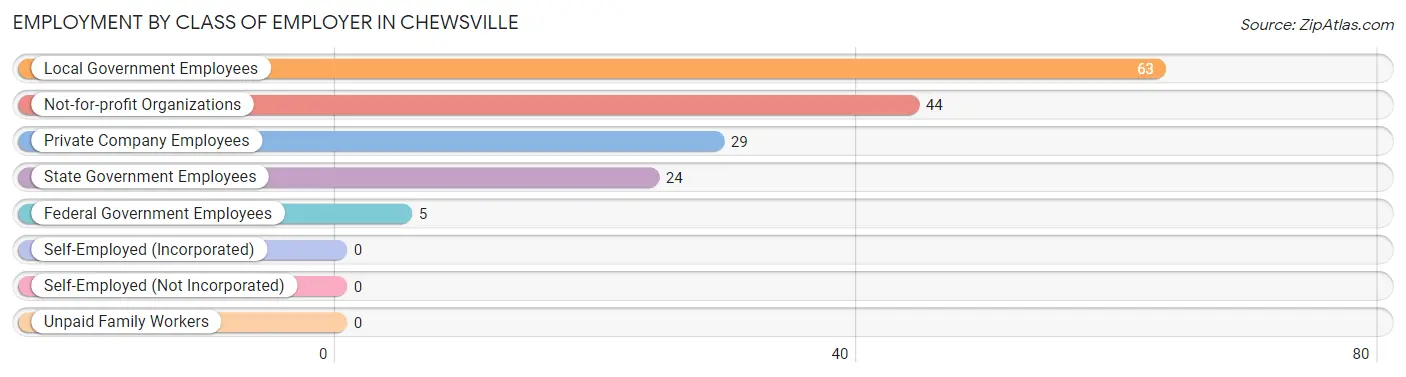
| Employer Class | # Employees | % Employees |
| Private Company Employees | 29 | 17.6% |
| Self-Employed (Incorporated) | 0 | 0.0% |
| Self-Employed (Not Incorporated) | 0 | 0.0% |
| Not-for-profit Organizations | 44 | 26.7% |
| Local Government Employees | 63 | 38.2% |
| State Government Employees | 24 | 14.5% |
| Federal Government Employees | 5 | 3.0% |
| Unpaid Family Workers | 0 | 0.0% |
| Total | 165 | 100.0% |
Employment Status by Age in Chewsville
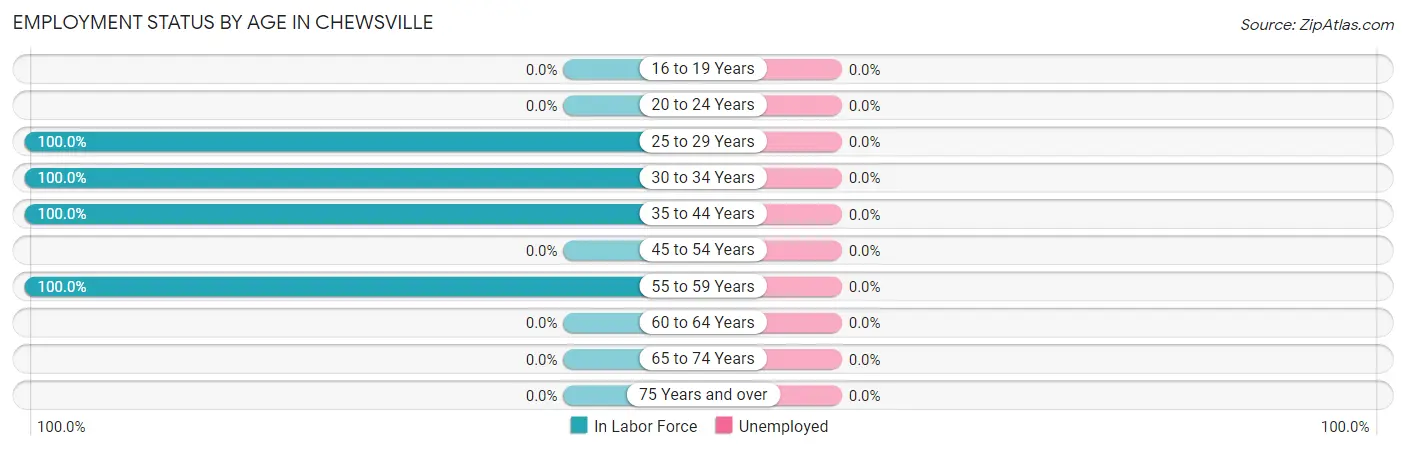
| Age Bracket | In Labor Force | Unemployed |
| 16 to 19 Years | 0 (0.0%) | 0 (0.0%) |
| 20 to 24 Years | 0 (0.0%) | 0 (0.0%) |
| 25 to 29 Years | 11 (100.0%) | 0 (0.0%) |
| 30 to 34 Years | 12 (100.0%) | 0 (0.0%) |
| 35 to 44 Years | 131 (100.0%) | 0 (0.0%) |
| 45 to 54 Years | 0 (0.0%) | 0 (0.0%) |
| 55 to 59 Years | 11 (100.0%) | 0 (0.0%) |
| 60 to 64 Years | 0 (0.0%) | 0 (0.0%) |
| 65 to 74 Years | 0 (0.0%) | 0 (0.0%) |
| 75 Years and over | 0 (0.0%) | 0 (0.0%) |
| Total | 165 (84.6%) | 0 (0.0%) |
Employment Status by Educational Attainment in Chewsville
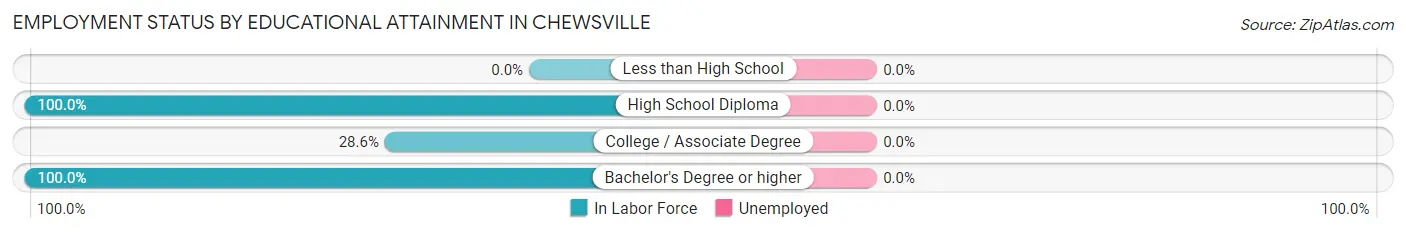
| Educational Attainment | In Labor Force | Unemployed |
| Less than High School | 0 (0.0%) | 0 (0.0%) |
| High School Diploma | 15 (100.0%) | 0 (0.0%) |
| College / Associate Degree | 6 (28.6%) | 0 (0.0%) |
| Bachelor's Degree or higher | 144 (100.0%) | 0 (0.0%) |
| Total | 165 (91.7%) | 0 (0.0%) |
Employment Occupations by Sex in Chewsville
Management, Business, Science and Arts Occupations
The most common Management, Business, Science and Arts occupations in Chewsville are Community & Social Service (125 | 75.8%), Education Instruction & Library (125 | 75.8%), Management (14 | 8.5%), Computers, Engineering & Science (5 | 3.0%), and Computers & Mathematics (5 | 3.0%).
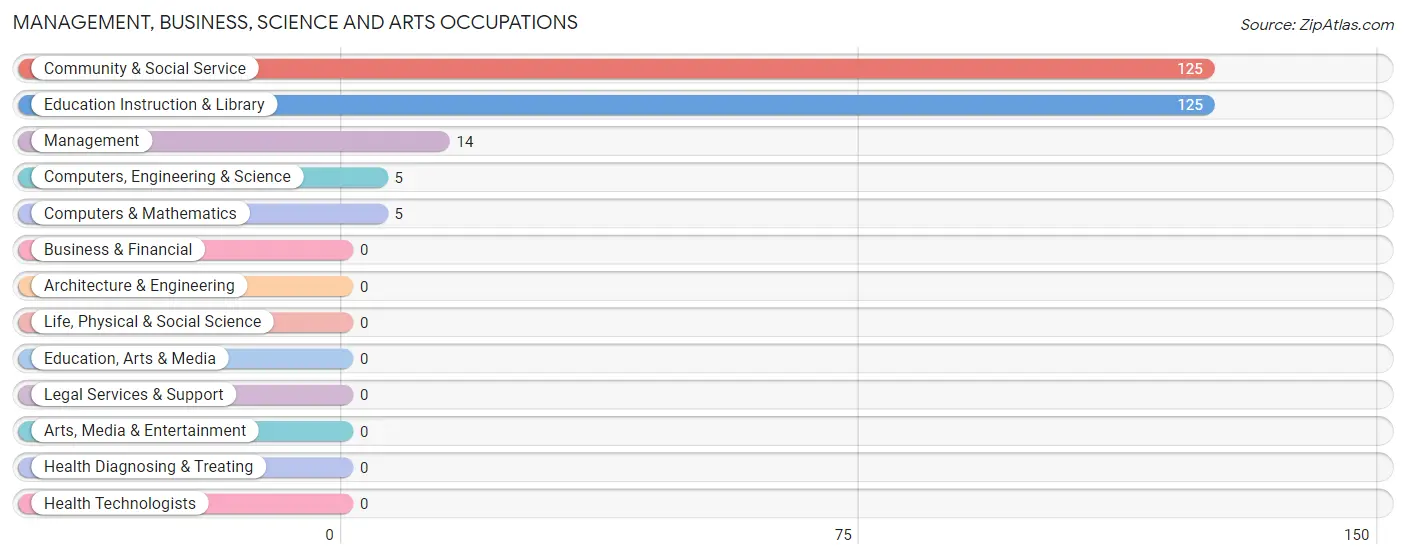
Management, Business, Science and Arts Occupations by Sex
Within the Management, Business, Science and Arts occupations in Chewsville, the most male-oriented occupations are Community & Social Service (55.2%), and Education Instruction & Library (55.2%), while the most female-oriented occupations are Management (100.0%), Computers, Engineering & Science (100.0%), and Computers & Mathematics (100.0%).
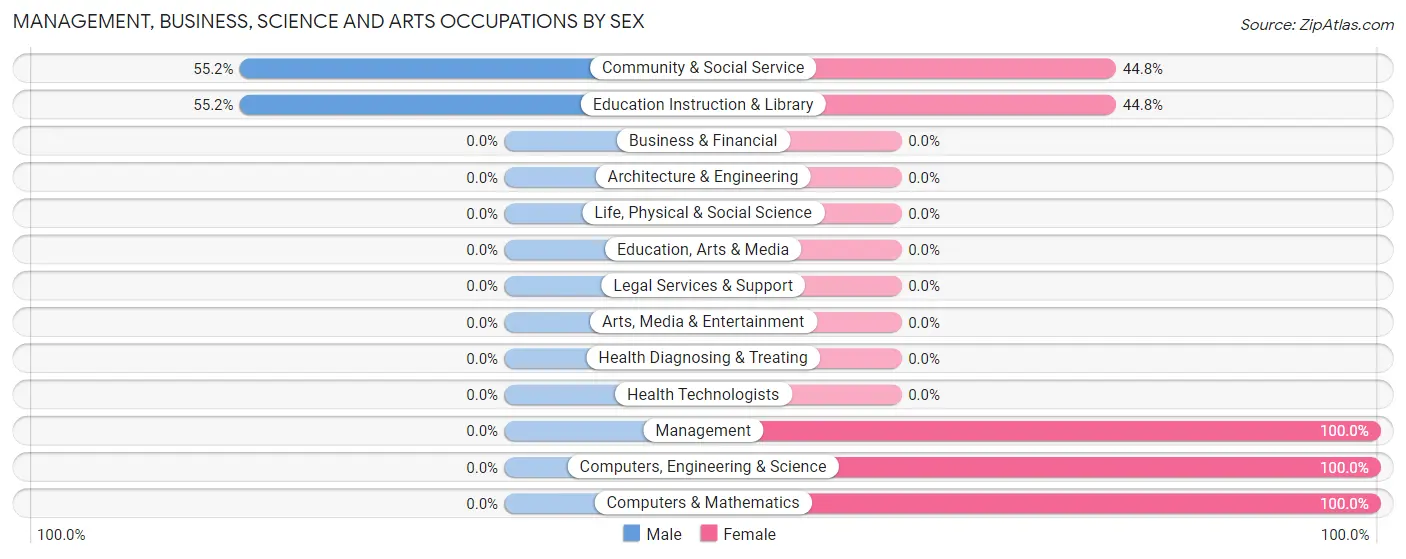
| Occupation | Male | Female |
| Management | 0 (0.0%) | 14 (100.0%) |
| Business & Financial | 0 (0.0%) | 0 (0.0%) |
| Computers, Engineering & Science | 0 (0.0%) | 5 (100.0%) |
| Computers & Mathematics | 0 (0.0%) | 5 (100.0%) |
| Architecture & Engineering | 0 (0.0%) | 0 (0.0%) |
| Life, Physical & Social Science | 0 (0.0%) | 0 (0.0%) |
| Community & Social Service | 69 (55.2%) | 56 (44.8%) |
| Education, Arts & Media | 0 (0.0%) | 0 (0.0%) |
| Legal Services & Support | 0 (0.0%) | 0 (0.0%) |
| Education Instruction & Library | 69 (55.2%) | 56 (44.8%) |
| Arts, Media & Entertainment | 0 (0.0%) | 0 (0.0%) |
| Health Diagnosing & Treating | 0 (0.0%) | 0 (0.0%) |
| Health Technologists | 0 (0.0%) | 0 (0.0%) |
| Total (Category) | 69 (47.9%) | 75 (52.1%) |
| Total (Overall) | 84 (50.9%) | 81 (49.1%) |
Services Occupations
Services Occupations by Sex
| Occupation | Male | Female |
| Healthcare Support | 0 (0.0%) | 0 (0.0%) |
| Security & Protection | 0 (0.0%) | 0 (0.0%) |
| Firefighting & Prevention | 0 (0.0%) | 0 (0.0%) |
| Law Enforcement | 0 (0.0%) | 0 (0.0%) |
| Food Preparation & Serving | 0 (0.0%) | 0 (0.0%) |
| Cleaning & Maintenance | 0 (0.0%) | 0 (0.0%) |
| Personal Care & Service | 0 (0.0%) | 0 (0.0%) |
| Total (Category) | 0 (0.0%) | 0 (0.0%) |
| Total (Overall) | 84 (50.9%) | 81 (49.1%) |
Sales and Office Occupations
The most common Sales and Office occupations in Chewsville are , and Office & Administration (6 | 3.6%).
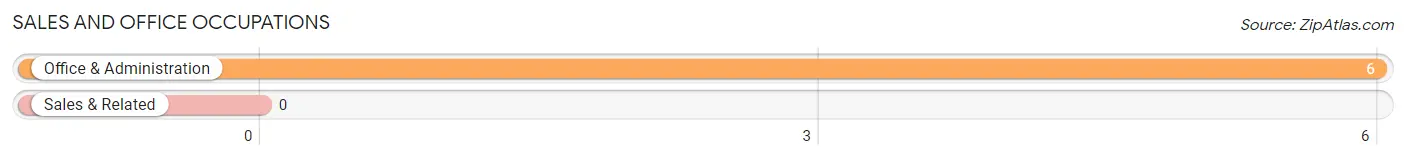
Sales and Office Occupations by Sex
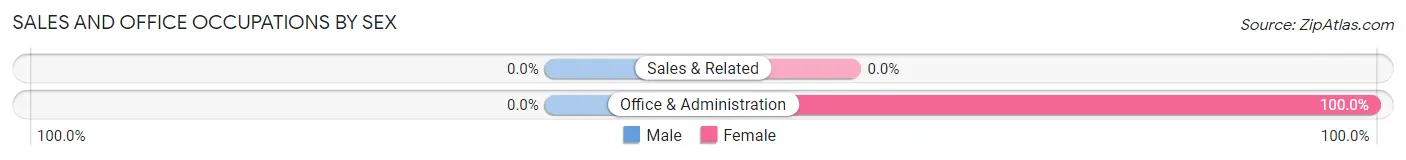
| Occupation | Male | Female |
| Sales & Related | 0 (0.0%) | 0 (0.0%) |
| Office & Administration | 0 (0.0%) | 6 (100.0%) |
| Total (Category) | 0 (0.0%) | 6 (100.0%) |
| Total (Overall) | 84 (50.9%) | 81 (49.1%) |
Natural Resources, Construction and Maintenance Occupations
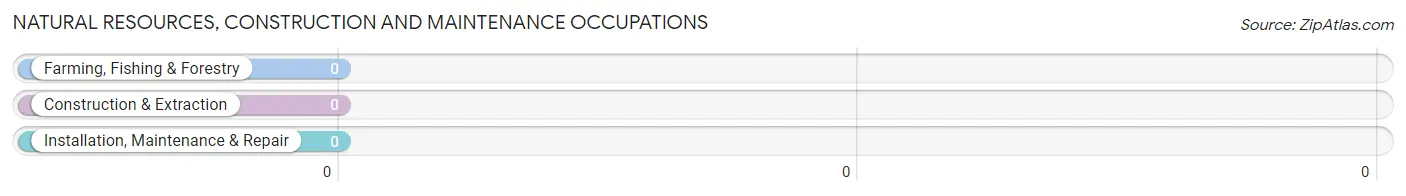
Natural Resources, Construction and Maintenance Occupations by Sex
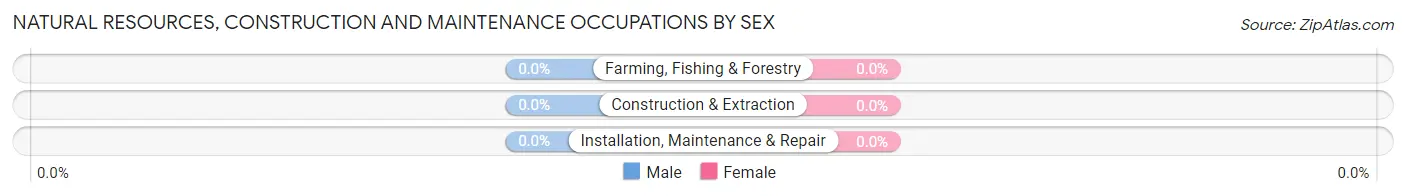
| Occupation | Male | Female |
| Farming, Fishing & Forestry | 0 (0.0%) | 0 (0.0%) |
| Construction & Extraction | 0 (0.0%) | 0 (0.0%) |
| Installation, Maintenance & Repair | 0 (0.0%) | 0 (0.0%) |
| Total (Category) | 0 (0.0%) | 0 (0.0%) |
| Total (Overall) | 84 (50.9%) | 81 (49.1%) |
Production, Transportation and Moving Occupations
The most common Production, Transportation and Moving occupations in Chewsville are , and Production (15 | 9.1%).
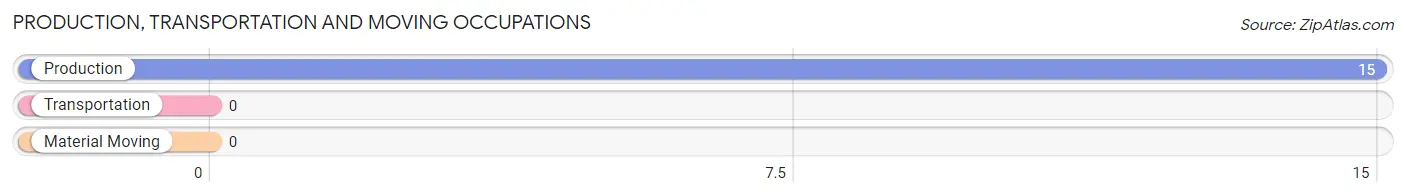
Production, Transportation and Moving Occupations by Sex
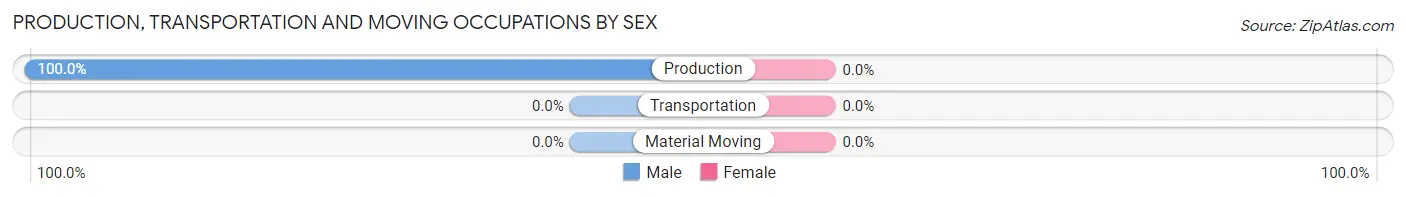
| Occupation | Male | Female |
| Production | 15 (100.0%) | 0 (0.0%) |
| Transportation | 0 (0.0%) | 0 (0.0%) |
| Material Moving | 0 (0.0%) | 0 (0.0%) |
| Total (Category) | 15 (100.0%) | 0 (0.0%) |
| Total (Overall) | 84 (50.9%) | 81 (49.1%) |
Employment Industries by Sex in Chewsville
Employment Industries in Chewsville
The major employment industries in Chewsville include Educational Services (125 | 75.8%), Manufacturing (15 | 9.1%), Retail Trade (14 | 8.5%), and Public Administration (11 | 6.7%).
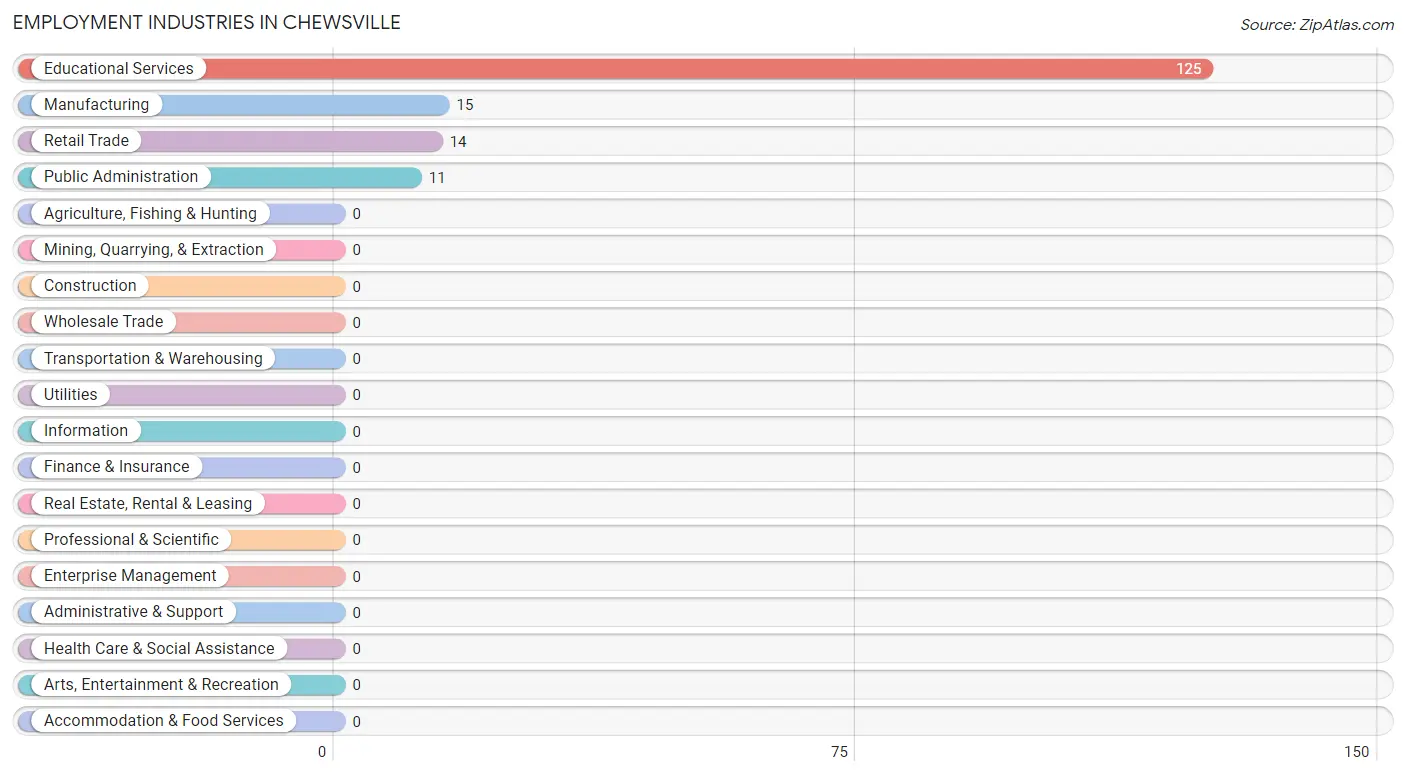
Employment Industries by Sex in Chewsville
The Chewsville industries that see more men than women are Manufacturing (100.0%), and Educational Services (55.2%), whereas the industries that tend to have a higher number of women are Retail Trade (100.0%), Public Administration (100.0%), and Educational Services (44.8%).
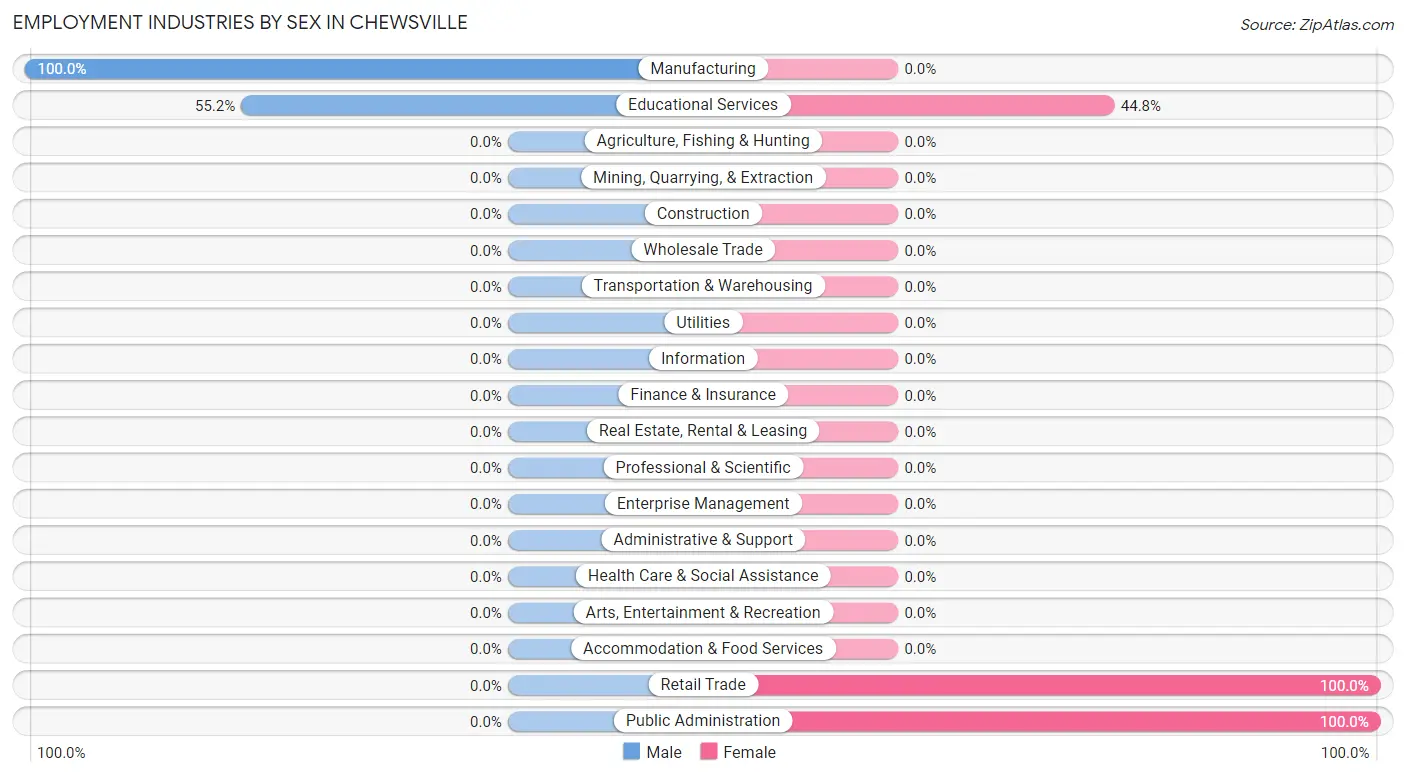
| Industry | Male | Female |
| Agriculture, Fishing & Hunting | 0 (0.0%) | 0 (0.0%) |
| Mining, Quarrying, & Extraction | 0 (0.0%) | 0 (0.0%) |
| Construction | 0 (0.0%) | 0 (0.0%) |
| Manufacturing | 15 (100.0%) | 0 (0.0%) |
| Wholesale Trade | 0 (0.0%) | 0 (0.0%) |
| Retail Trade | 0 (0.0%) | 14 (100.0%) |
| Transportation & Warehousing | 0 (0.0%) | 0 (0.0%) |
| Utilities | 0 (0.0%) | 0 (0.0%) |
| Information | 0 (0.0%) | 0 (0.0%) |
| Finance & Insurance | 0 (0.0%) | 0 (0.0%) |
| Real Estate, Rental & Leasing | 0 (0.0%) | 0 (0.0%) |
| Professional & Scientific | 0 (0.0%) | 0 (0.0%) |
| Enterprise Management | 0 (0.0%) | 0 (0.0%) |
| Administrative & Support | 0 (0.0%) | 0 (0.0%) |
| Educational Services | 69 (55.2%) | 56 (44.8%) |
| Health Care & Social Assistance | 0 (0.0%) | 0 (0.0%) |
| Arts, Entertainment & Recreation | 0 (0.0%) | 0 (0.0%) |
| Accommodation & Food Services | 0 (0.0%) | 0 (0.0%) |
| Public Administration | 0 (0.0%) | 11 (100.0%) |
| Total | 84 (50.9%) | 81 (49.1%) |
Education in Chewsville
School Enrollment in Chewsville
The most common levels of schooling among the 44 students in Chewsville are nursery / preschool (15 | 34.1%), elementary school (15 | 34.1%), and graduate / professional (14 | 31.8%).
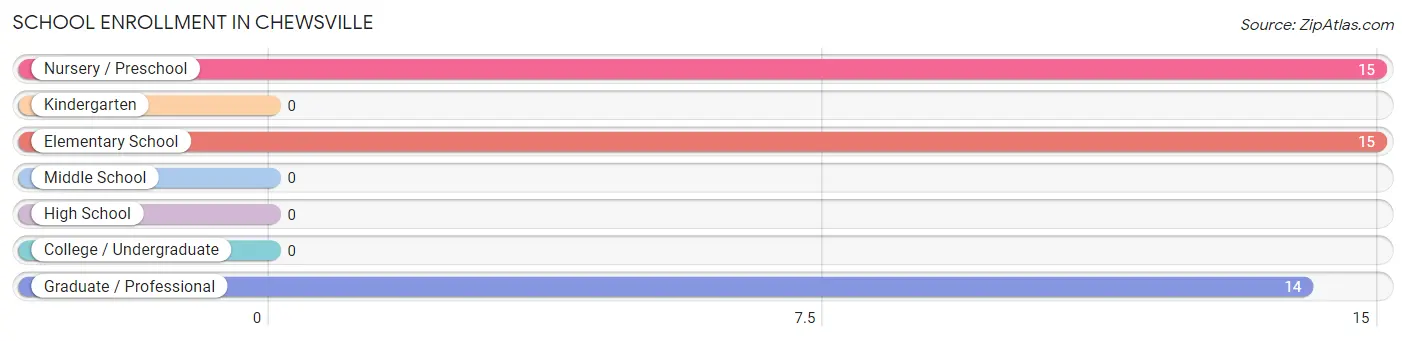
| School Level | # Students | % Students |
| Nursery / Preschool | 15 | 34.1% |
| Kindergarten | 0 | 0.0% |
| Elementary School | 15 | 34.1% |
| Middle School | 0 | 0.0% |
| High School | 0 | 0.0% |
| College / Undergraduate | 0 | 0.0% |
| Graduate / Professional | 14 | 31.8% |
| Total | 44 | 100.0% |
School Enrollment by Age by Funding Source in Chewsville
Out of a total of 44 students who are enrolled in schools in Chewsville, 14 (31.8%) attend a private institution, while the remaining 30 (68.2%) are enrolled in public schools. The age group of 35 years and over has the highest likelihood of being enrolled in private schools, with 14 (100.0% in the age bracket) enrolled. Conversely, the age group of 5 to 9 year old has the lowest likelihood of being enrolled in a private school, with 30 (100.0% in the age bracket) attending a public institution.
| Age Bracket | Public School | Private School |
| 3 to 4 Year Olds | 0 (0.0%) | 0 (0.0%) |
| 5 to 9 Year Old | 30 (100.0%) | 0 (0.0%) |
| 10 to 14 Year Olds | 0 (0.0%) | 0 (0.0%) |
| 15 to 17 Year Olds | 0 (0.0%) | 0 (0.0%) |
| 18 to 19 Year Olds | 0 (0.0%) | 0 (0.0%) |
| 20 to 24 Year Olds | 0 (0.0%) | 0 (0.0%) |
| 25 to 34 Year Olds | 0 (0.0%) | 0 (0.0%) |
| 35 Years and over | 0 (0.0%) | 14 (100.0%) |
| Total | 30 (68.2%) | 14 (31.8%) |
Educational Attainment by Field of Study in Chewsville
Science & technology (46 | 30.9%), psychology (44 | 29.5%), business (14 | 9.4%), computers & mathematics (12 | 8.1%), and bio, nature & agricultural (12 | 8.1%) are the most common fields of study among 149 individuals in Chewsville who have obtained a bachelor's degree or higher.
| Field of Study | # Graduates | % Graduates |
| Computers & Mathematics | 12 | 8.1% |
| Bio, Nature & Agricultural | 12 | 8.1% |
| Physical & Health Sciences | 0 | 0.0% |
| Psychology | 44 | 29.5% |
| Social Sciences | 0 | 0.0% |
| Engineering | 0 | 0.0% |
| Multidisciplinary Studies | 5 | 3.4% |
| Science & Technology | 46 | 30.9% |
| Business | 14 | 9.4% |
| Education | 11 | 7.4% |
| Literature & Languages | 0 | 0.0% |
| Liberal Arts & History | 0 | 0.0% |
| Visual & Performing Arts | 5 | 3.4% |
| Communications | 0 | 0.0% |
| Arts & Humanities | 0 | 0.0% |
| Total | 149 | 100.0% |
Transportation & Commute in Chewsville
Vehicle Availability by Sex in Chewsville
The most prevalent vehicle ownership categories in Chewsville are males with 2 vehicles (69, accounting for 82.1%) and females with 2 vehicles (67, making up 85.2%).
| Vehicles Available | Male | Female |
| No Vehicle | 0 (0.0%) | 0 (0.0%) |
| 1 Vehicle | 0 (0.0%) | 0 (0.0%) |
| 2 Vehicles | 69 (82.1%) | 67 (82.7%) |
| 3 Vehicles | 15 (17.9%) | 14 (17.3%) |
| 4 Vehicles | 0 (0.0%) | 0 (0.0%) |
| 5 or more Vehicles | 0 (0.0%) | 0 (0.0%) |
| Total | 84 (100.0%) | 81 (100.0%) |
Commute Time in Chewsville
The most frequently occuring commute durations in Chewsville are 30 to 34 minutes (90 commuters, 56.2%), 5 to 9 minutes (15 commuters, 9.4%), and 35 to 39 minutes (14 commuters, 8.7%).
| Commute Time | # Commuters | % Commuters |
| Less than 5 Minutes | 0 | 0.0% |
| 5 to 9 Minutes | 15 | 9.4% |
| 10 to 14 Minutes | 6 | 3.7% |
| 15 to 19 Minutes | 0 | 0.0% |
| 20 to 24 Minutes | 11 | 6.9% |
| 25 to 29 Minutes | 0 | 0.0% |
| 30 to 34 Minutes | 90 | 56.2% |
| 35 to 39 Minutes | 14 | 8.7% |
| 40 to 44 Minutes | 12 | 7.5% |
| 45 to 59 Minutes | 12 | 7.5% |
| 60 to 89 Minutes | 0 | 0.0% |
| 90 or more Minutes | 0 | 0.0% |
Commute Time by Sex in Chewsville
The most common commute times in Chewsville are 30 to 34 minutes (46 commuters, 54.8%) for males and 30 to 34 minutes (44 commuters, 57.9%) for females.
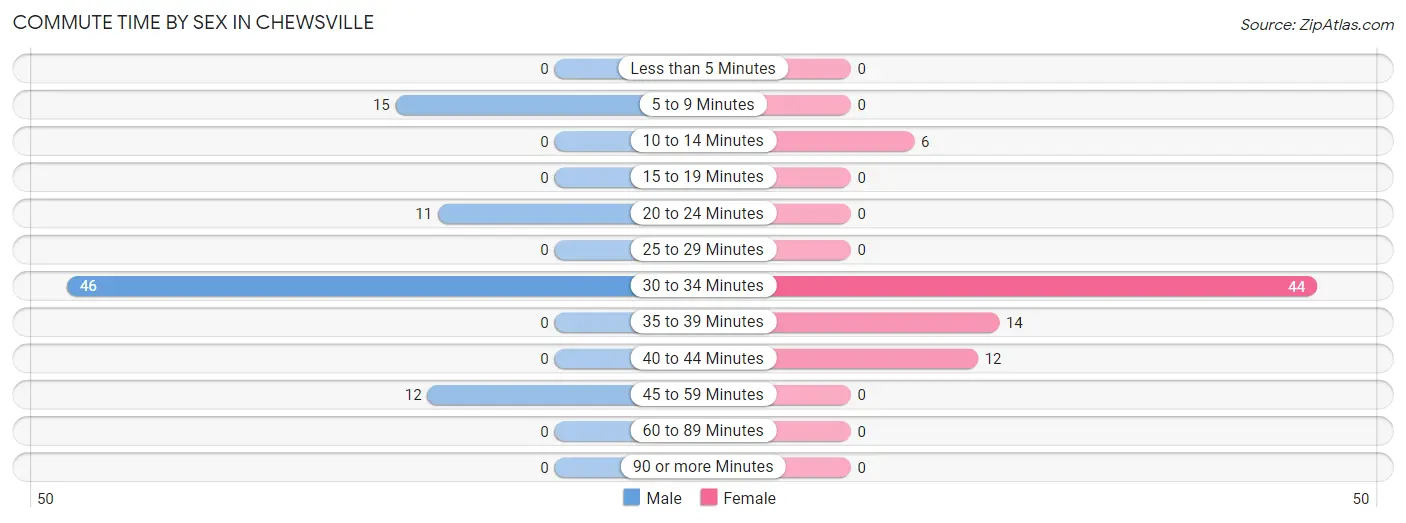
| Commute Time | Male | Female |
| Less than 5 Minutes | 0 (0.0%) | 0 (0.0%) |
| 5 to 9 Minutes | 15 (17.9%) | 0 (0.0%) |
| 10 to 14 Minutes | 0 (0.0%) | 6 (7.9%) |
| 15 to 19 Minutes | 0 (0.0%) | 0 (0.0%) |
| 20 to 24 Minutes | 11 (13.1%) | 0 (0.0%) |
| 25 to 29 Minutes | 0 (0.0%) | 0 (0.0%) |
| 30 to 34 Minutes | 46 (54.8%) | 44 (57.9%) |
| 35 to 39 Minutes | 0 (0.0%) | 14 (18.4%) |
| 40 to 44 Minutes | 0 (0.0%) | 12 (15.8%) |
| 45 to 59 Minutes | 12 (14.3%) | 0 (0.0%) |
| 60 to 89 Minutes | 0 (0.0%) | 0 (0.0%) |
| 90 or more Minutes | 0 (0.0%) | 0 (0.0%) |
Time of Departure to Work by Sex in Chewsville
The most frequent times of departure to work in Chewsville are 6:30 AM to 6:59 AM (46, 54.8%) for males and 6:30 AM to 6:59 AM (44, 57.9%) for females.
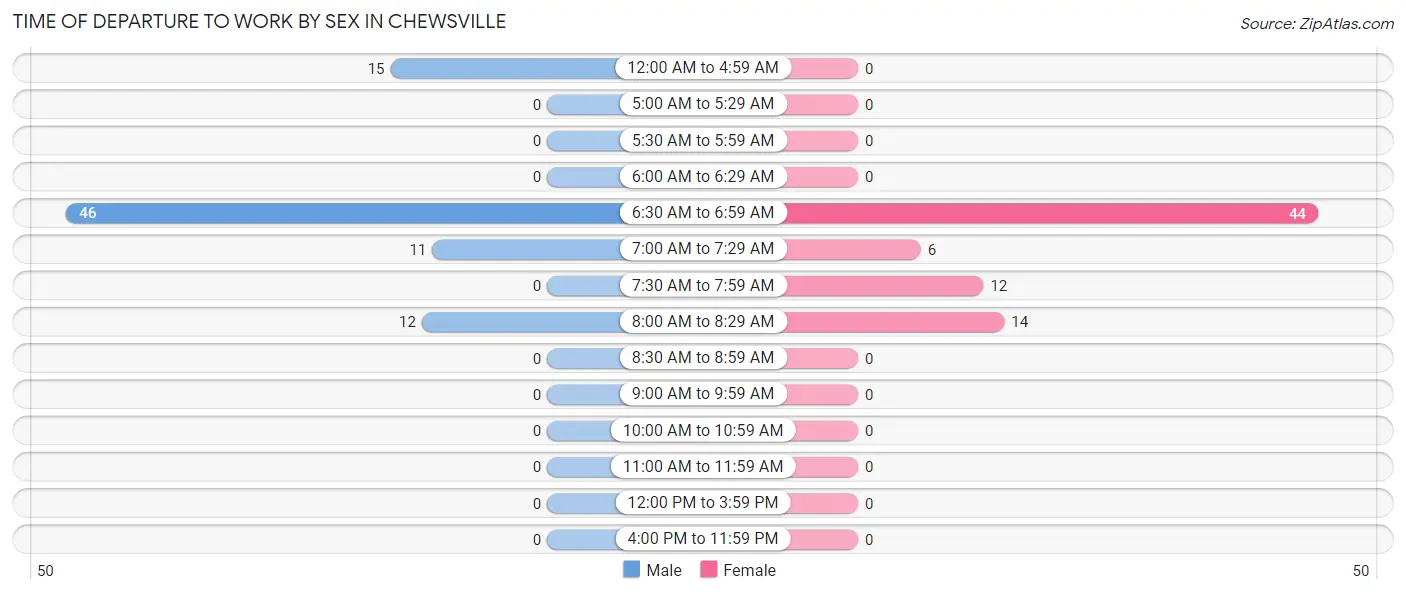
| Time of Departure | Male | Female |
| 12:00 AM to 4:59 AM | 15 (17.9%) | 0 (0.0%) |
| 5:00 AM to 5:29 AM | 0 (0.0%) | 0 (0.0%) |
| 5:30 AM to 5:59 AM | 0 (0.0%) | 0 (0.0%) |
| 6:00 AM to 6:29 AM | 0 (0.0%) | 0 (0.0%) |
| 6:30 AM to 6:59 AM | 46 (54.8%) | 44 (57.9%) |
| 7:00 AM to 7:29 AM | 11 (13.1%) | 6 (7.9%) |
| 7:30 AM to 7:59 AM | 0 (0.0%) | 12 (15.8%) |
| 8:00 AM to 8:29 AM | 12 (14.3%) | 14 (18.4%) |
| 8:30 AM to 8:59 AM | 0 (0.0%) | 0 (0.0%) |
| 9:00 AM to 9:59 AM | 0 (0.0%) | 0 (0.0%) |
| 10:00 AM to 10:59 AM | 0 (0.0%) | 0 (0.0%) |
| 11:00 AM to 11:59 AM | 0 (0.0%) | 0 (0.0%) |
| 12:00 PM to 3:59 PM | 0 (0.0%) | 0 (0.0%) |
| 4:00 PM to 11:59 PM | 0 (0.0%) | 0 (0.0%) |
| Total | 84 (100.0%) | 76 (100.0%) |
Housing Occupancy in Chewsville
Occupancy by Ownership in Chewsville
Of the total 103 dwellings in Chewsville, owner-occupied units account for 76 (73.8%), while renter-occupied units make up 27 (26.2%).
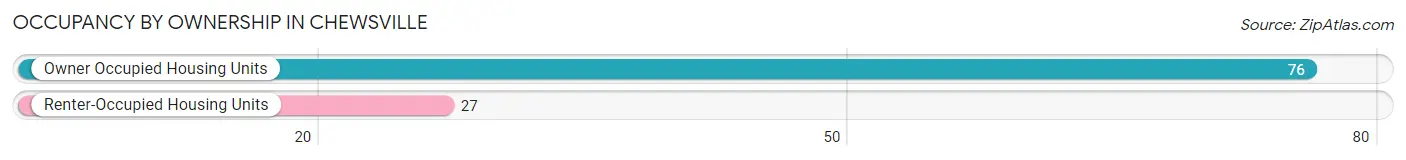
| Occupancy | # Housing Units | % Housing Units |
| Owner Occupied Housing Units | 76 | 73.8% |
| Renter-Occupied Housing Units | 27 | 26.2% |
| Total Occupied Housing Units | 103 | 100.0% |
Occupancy by Household Size in Chewsville
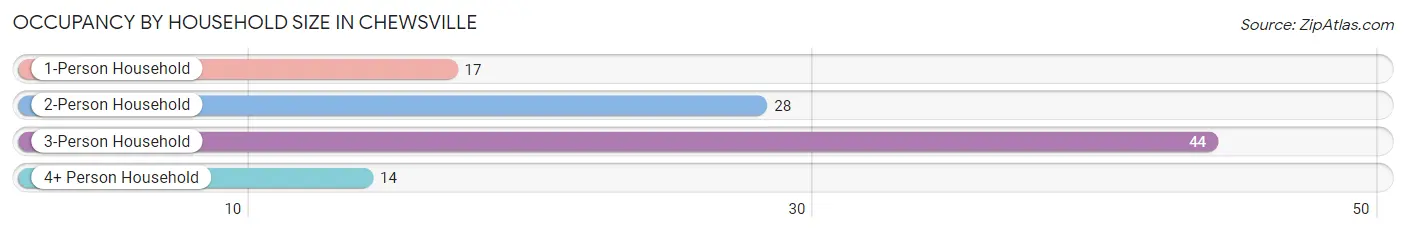
| Household Size | # Housing Units | % Housing Units |
| 1-Person Household | 17 | 16.5% |
| 2-Person Household | 28 | 27.2% |
| 3-Person Household | 44 | 42.7% |
| 4+ Person Household | 14 | 13.6% |
| Total Housing Units | 103 | 100.0% |
Occupancy by Ownership by Household Size in Chewsville
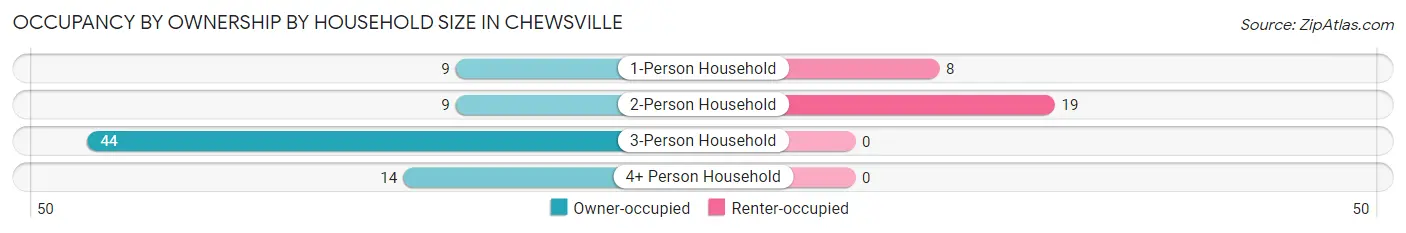
| Household Size | Owner-occupied | Renter-occupied |
| 1-Person Household | 9 (52.9%) | 8 (47.1%) |
| 2-Person Household | 9 (32.1%) | 19 (67.9%) |
| 3-Person Household | 44 (100.0%) | 0 (0.0%) |
| 4+ Person Household | 14 (100.0%) | 0 (0.0%) |
| Total Housing Units | 76 (73.8%) | 27 (26.2%) |
Occupancy by Educational Attainment in Chewsville
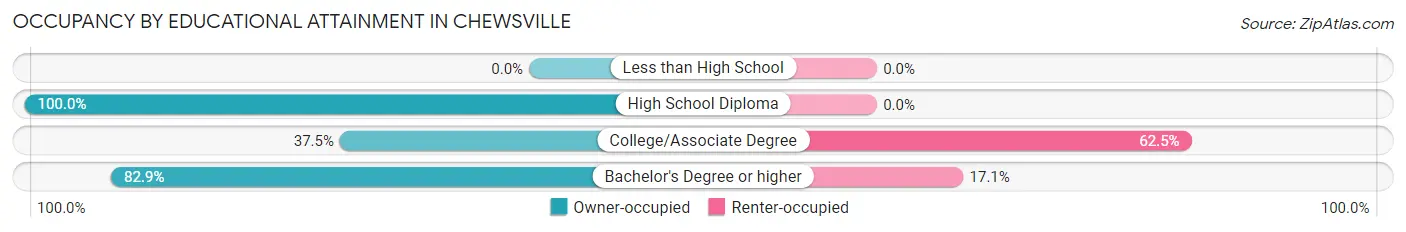
| Household Size | Owner-occupied | Renter-occupied |
| Less than High School | 0 (0.0%) | 0 (0.0%) |
| High School Diploma | 9 (100.0%) | 0 (0.0%) |
| College/Associate Degree | 9 (37.5%) | 15 (62.5%) |
| Bachelor's Degree or higher | 58 (82.9%) | 12 (17.1%) |
Occupancy by Age of Householder in Chewsville
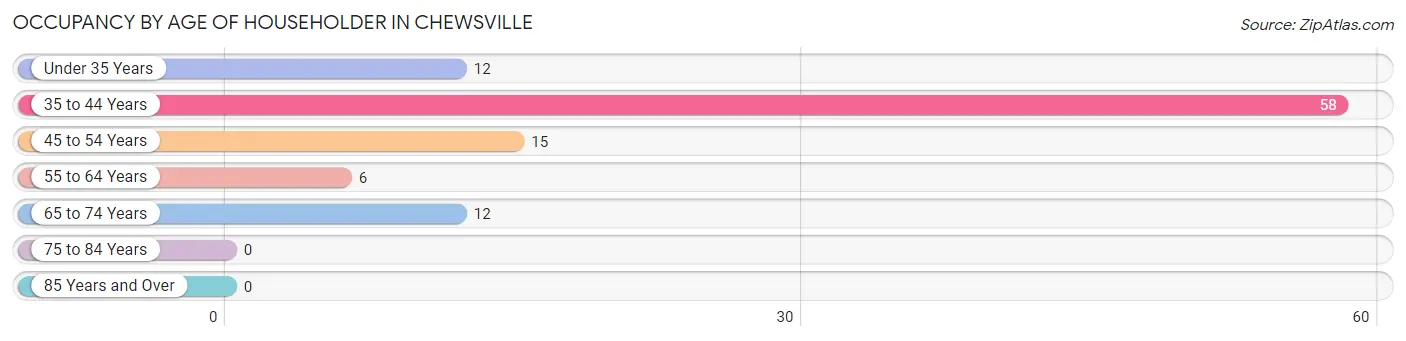
| Age Bracket | # Households | % Households |
| Under 35 Years | 12 | 11.7% |
| 35 to 44 Years | 58 | 56.3% |
| 45 to 54 Years | 15 | 14.6% |
| 55 to 64 Years | 6 | 5.8% |
| 65 to 74 Years | 12 | 11.7% |
| 75 to 84 Years | 0 | 0.0% |
| 85 Years and Over | 0 | 0.0% |
| Total | 103 | 100.0% |
Housing Finances in Chewsville
Median Income by Occupancy in Chewsville
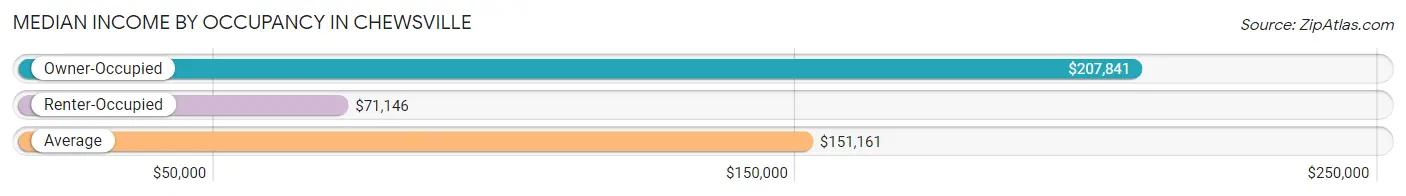
| Occupancy Type | # Households | Median Income |
| Owner-Occupied | 76 (73.8%) | $207,841 |
| Renter-Occupied | 27 (26.2%) | $71,146 |
| Average | 103 (100.0%) | $151,161 |
Occupancy by Householder Income Bracket in Chewsville
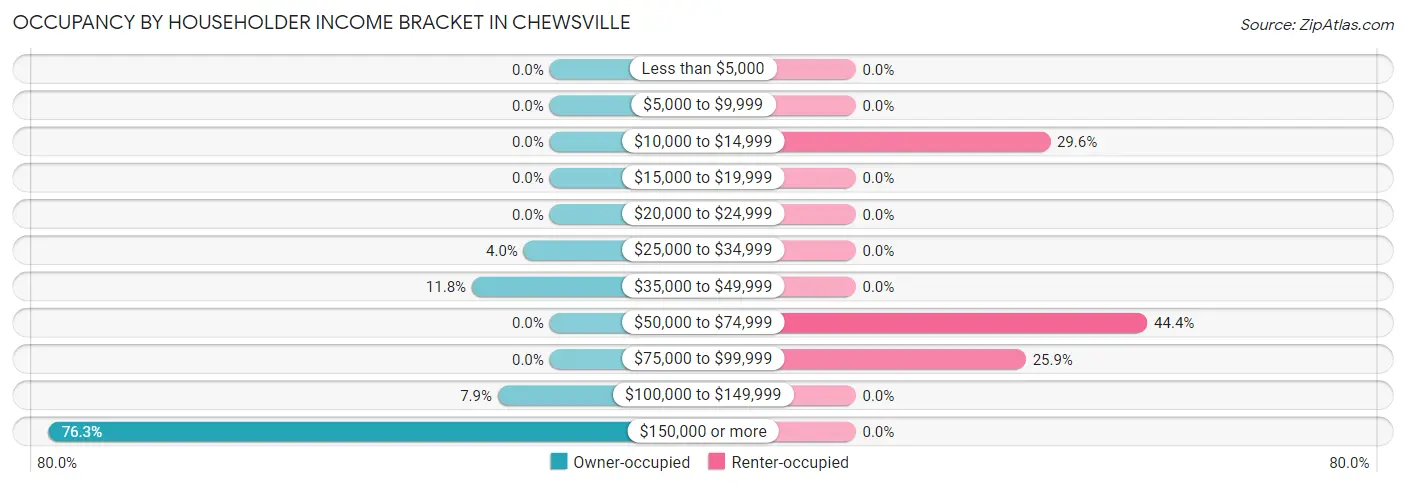
| Income Bracket | Owner-occupied | Renter-occupied |
| Less than $5,000 | 0 (0.0%) | 0 (0.0%) |
| $5,000 to $9,999 | 0 (0.0%) | 0 (0.0%) |
| $10,000 to $14,999 | 0 (0.0%) | 8 (29.6%) |
| $15,000 to $19,999 | 0 (0.0%) | 0 (0.0%) |
| $20,000 to $24,999 | 0 (0.0%) | 0 (0.0%) |
| $25,000 to $34,999 | 3 (4.0%) | 0 (0.0%) |
| $35,000 to $49,999 | 9 (11.8%) | 0 (0.0%) |
| $50,000 to $74,999 | 0 (0.0%) | 12 (44.4%) |
| $75,000 to $99,999 | 0 (0.0%) | 7 (25.9%) |
| $100,000 to $149,999 | 6 (7.9%) | 0 (0.0%) |
| $150,000 or more | 58 (76.3%) | 0 (0.0%) |
| Total | 76 (100.0%) | 27 (100.0%) |
Monthly Housing Cost Tiers in Chewsville
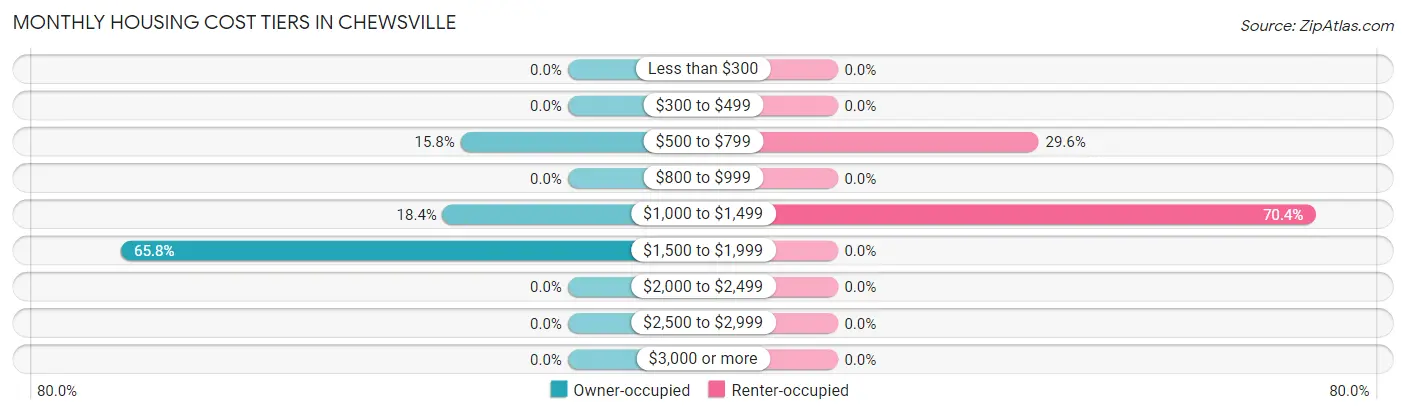
| Monthly Cost | Owner-occupied | Renter-occupied |
| Less than $300 | 0 (0.0%) | 0 (0.0%) |
| $300 to $499 | 0 (0.0%) | 0 (0.0%) |
| $500 to $799 | 12 (15.8%) | 8 (29.6%) |
| $800 to $999 | 0 (0.0%) | 0 (0.0%) |
| $1,000 to $1,499 | 14 (18.4%) | 19 (70.4%) |
| $1,500 to $1,999 | 50 (65.8%) | 0 (0.0%) |
| $2,000 to $2,499 | 0 (0.0%) | 0 (0.0%) |
| $2,500 to $2,999 | 0 (0.0%) | 0 (0.0%) |
| $3,000 or more | 0 (0.0%) | 0 (0.0%) |
| Total | 76 (100.0%) | 27 (100.0%) |
Physical Housing Characteristics in Chewsville
Housing Structures in Chewsville
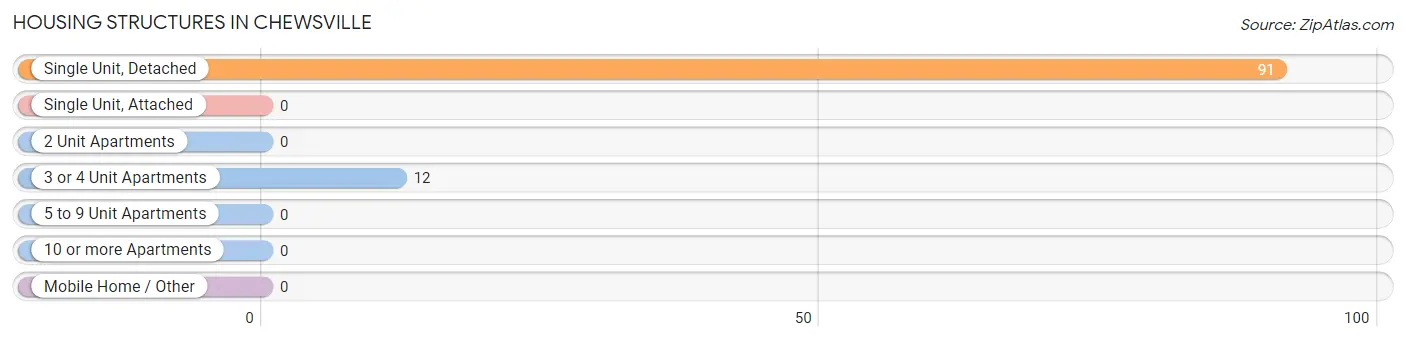
| Structure Type | # Housing Units | % Housing Units |
| Single Unit, Detached | 91 | 88.3% |
| Single Unit, Attached | 0 | 0.0% |
| 2 Unit Apartments | 0 | 0.0% |
| 3 or 4 Unit Apartments | 12 | 11.7% |
| 5 to 9 Unit Apartments | 0 | 0.0% |
| 10 or more Apartments | 0 | 0.0% |
| Mobile Home / Other | 0 | 0.0% |
| Total | 103 | 100.0% |
Housing Structures by Occupancy in Chewsville
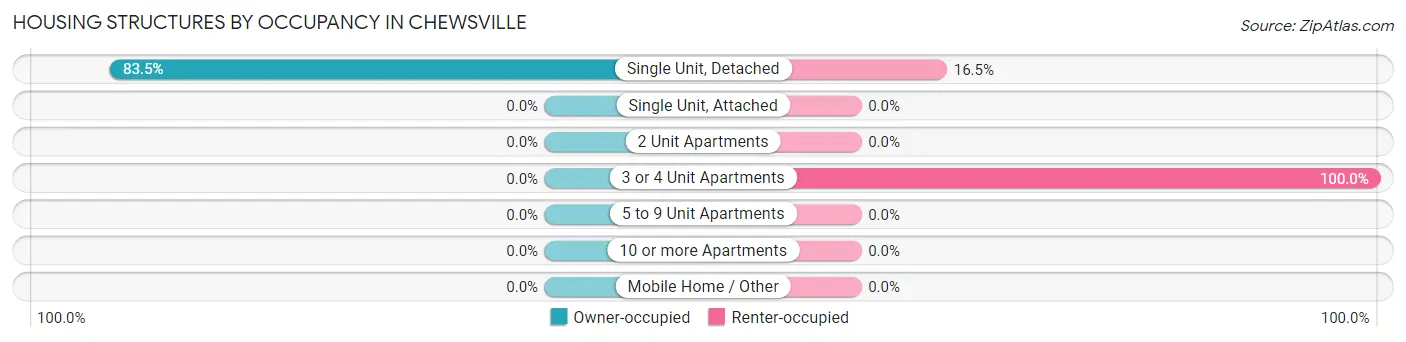
| Structure Type | Owner-occupied | Renter-occupied |
| Single Unit, Detached | 76 (83.5%) | 15 (16.5%) |
| Single Unit, Attached | 0 (0.0%) | 0 (0.0%) |
| 2 Unit Apartments | 0 (0.0%) | 0 (0.0%) |
| 3 or 4 Unit Apartments | 0 (0.0%) | 12 (100.0%) |
| 5 to 9 Unit Apartments | 0 (0.0%) | 0 (0.0%) |
| 10 or more Apartments | 0 (0.0%) | 0 (0.0%) |
| Mobile Home / Other | 0 (0.0%) | 0 (0.0%) |
| Total | 76 (73.8%) | 27 (26.2%) |
Housing Structures by Number of Rooms in Chewsville
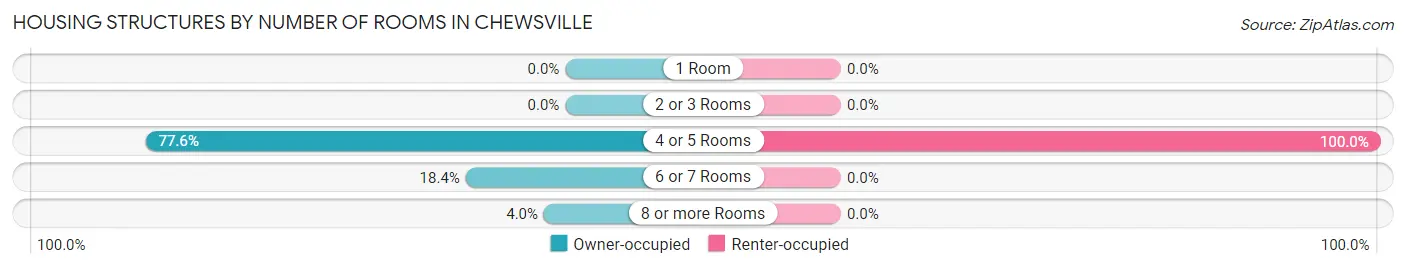
| Number of Rooms | Owner-occupied | Renter-occupied |
| 1 Room | 0 (0.0%) | 0 (0.0%) |
| 2 or 3 Rooms | 0 (0.0%) | 0 (0.0%) |
| 4 or 5 Rooms | 59 (77.6%) | 27 (100.0%) |
| 6 or 7 Rooms | 14 (18.4%) | 0 (0.0%) |
| 8 or more Rooms | 3 (4.0%) | 0 (0.0%) |
| Total | 76 (100.0%) | 27 (100.0%) |
Housing Structure by Heating Type in Chewsville
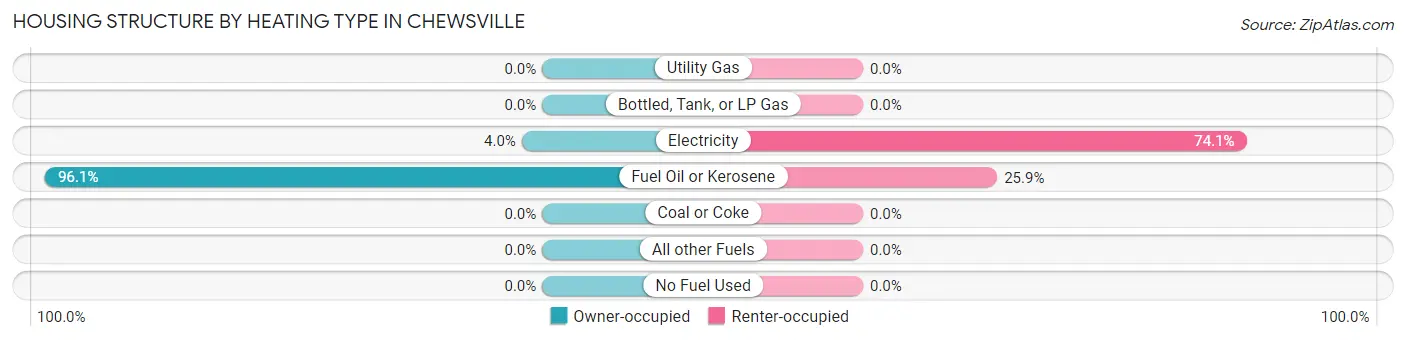
| Heating Type | Owner-occupied | Renter-occupied |
| Utility Gas | 0 (0.0%) | 0 (0.0%) |
| Bottled, Tank, or LP Gas | 0 (0.0%) | 0 (0.0%) |
| Electricity | 3 (4.0%) | 20 (74.1%) |
| Fuel Oil or Kerosene | 73 (96.1%) | 7 (25.9%) |
| Coal or Coke | 0 (0.0%) | 0 (0.0%) |
| All other Fuels | 0 (0.0%) | 0 (0.0%) |
| No Fuel Used | 0 (0.0%) | 0 (0.0%) |
| Total | 76 (100.0%) | 27 (100.0%) |
Household Vehicle Usage in Chewsville
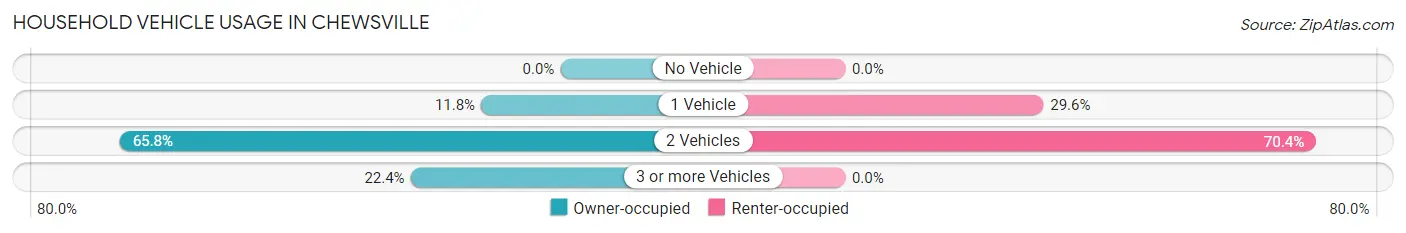
| Vehicles per Household | Owner-occupied | Renter-occupied |
| No Vehicle | 0 (0.0%) | 0 (0.0%) |
| 1 Vehicle | 9 (11.8%) | 8 (29.6%) |
| 2 Vehicles | 50 (65.8%) | 19 (70.4%) |
| 3 or more Vehicles | 17 (22.4%) | 0 (0.0%) |
| Total | 76 (100.0%) | 27 (100.0%) |
Real Estate & Mortgages in Chewsville
Real Estate and Mortgage Overview in Chewsville
| Characteristic | Without Mortgage | With Mortgage |
| Housing Units | 12 | 64 |
| Median Property Value | - | - |
| Median Household Income | - | - |
| Monthly Housing Costs | - | - |
| Real Estate Taxes | - | - |
Property Value by Mortgage Status in Chewsville
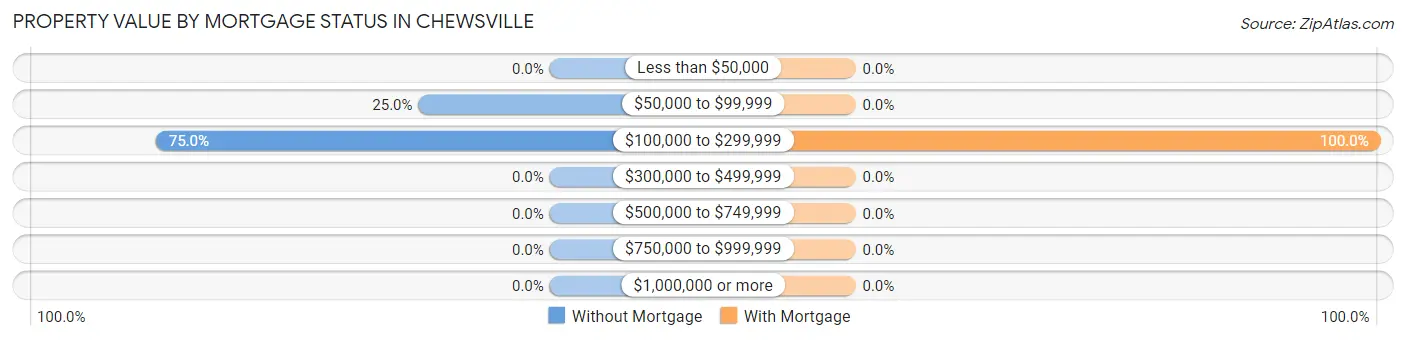
| Property Value | Without Mortgage | With Mortgage |
| Less than $50,000 | 0 (0.0%) | 0 (0.0%) |
| $50,000 to $99,999 | 3 (25.0%) | 0 (0.0%) |
| $100,000 to $299,999 | 9 (75.0%) | 64 (100.0%) |
| $300,000 to $499,999 | 0 (0.0%) | 0 (0.0%) |
| $500,000 to $749,999 | 0 (0.0%) | 0 (0.0%) |
| $750,000 to $999,999 | 0 (0.0%) | 0 (0.0%) |
| $1,000,000 or more | 0 (0.0%) | 0 (0.0%) |
| Total | 12 (100.0%) | 64 (100.0%) |
Household Income by Mortgage Status in Chewsville
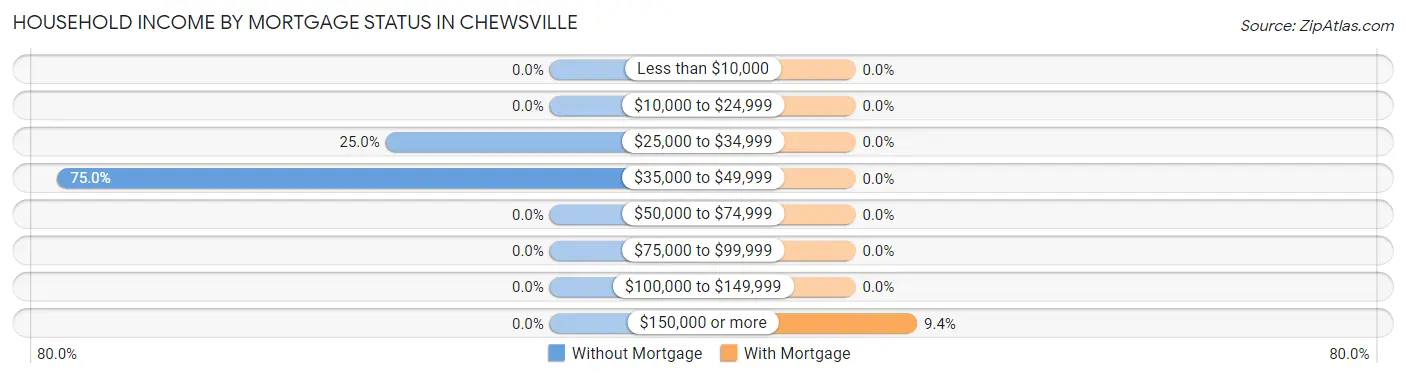
| Household Income | Without Mortgage | With Mortgage |
| Less than $10,000 | 0 (0.0%) | 0 (0.0%) |
| $10,000 to $24,999 | 0 (0.0%) | 0 (0.0%) |
| $25,000 to $34,999 | 3 (25.0%) | 0 (0.0%) |
| $35,000 to $49,999 | 9 (75.0%) | 0 (0.0%) |
| $50,000 to $74,999 | 0 (0.0%) | 0 (0.0%) |
| $75,000 to $99,999 | 0 (0.0%) | 0 (0.0%) |
| $100,000 to $149,999 | 0 (0.0%) | 0 (0.0%) |
| $150,000 or more | 0 (0.0%) | 6 (9.4%) |
| Total | 12 (100.0%) | 64 (100.0%) |
Property Value to Household Income Ratio in Chewsville
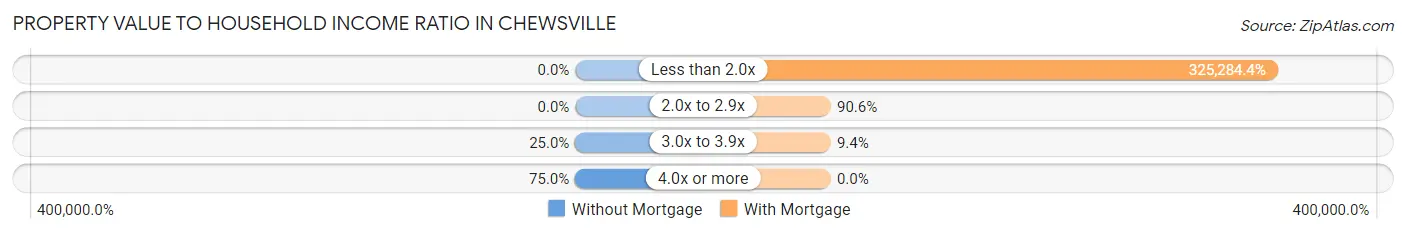
| Value-to-Income Ratio | Without Mortgage | With Mortgage |
| Less than 2.0x | 0 (0.0%) | 208,182 (325,284.4%) |
| 2.0x to 2.9x | 0 (0.0%) | 58 (90.6%) |
| 3.0x to 3.9x | 3 (25.0%) | 6 (9.4%) |
| 4.0x or more | 9 (75.0%) | 0 (0.0%) |
| Total | 12 (100.0%) | 64 (100.0%) |
Real Estate Taxes by Mortgage Status in Chewsville
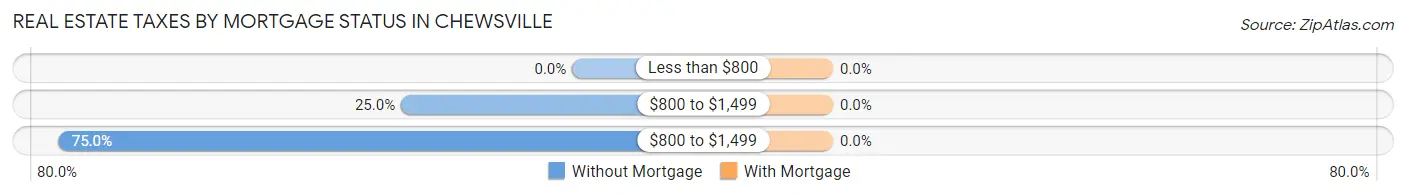
| Property Taxes | Without Mortgage | With Mortgage |
| Less than $800 | 0 (0.0%) | 0 (0.0%) |
| $800 to $1,499 | 3 (25.0%) | 0 (0.0%) |
| $800 to $1,499 | 9 (75.0%) | 0 (0.0%) |
| Total | 12 (100.0%) | 64 (100.0%) |
Health & Disability in Chewsville
Health Insurance Coverage by Age in Chewsville
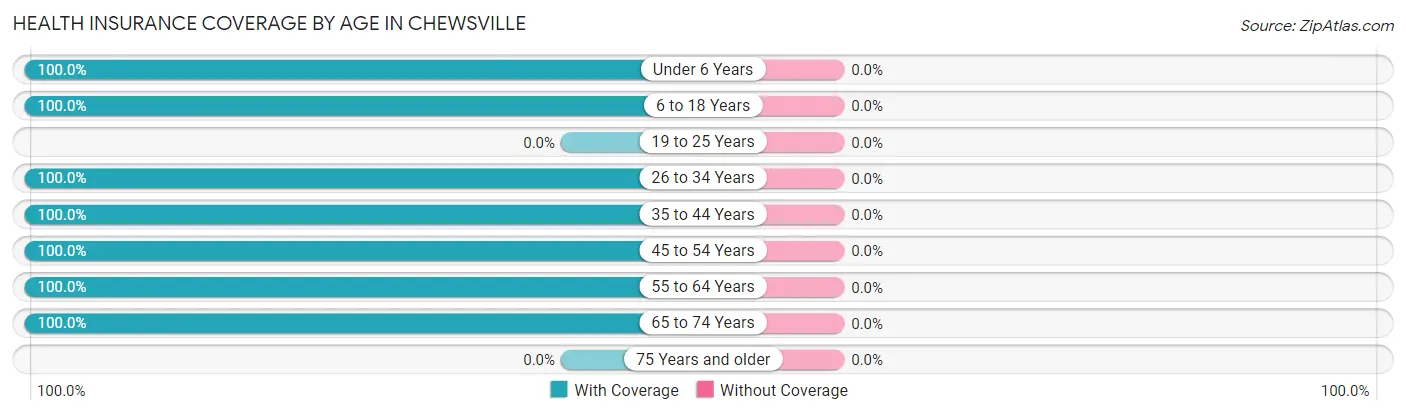
| Age Bracket | With Coverage | Without Coverage |
| Under 6 Years | 52 (100.0%) | 0 (0.0%) |
| 6 to 18 Years | 15 (100.0%) | 0 (0.0%) |
| 19 to 25 Years | 0 (0.0%) | 0 (0.0%) |
| 26 to 34 Years | 23 (100.0%) | 0 (0.0%) |
| 35 to 44 Years | 131 (100.0%) | 0 (0.0%) |
| 45 to 54 Years | 15 (100.0%) | 0 (0.0%) |
| 55 to 64 Years | 11 (100.0%) | 0 (0.0%) |
| 65 to 74 Years | 15 (100.0%) | 0 (0.0%) |
| 75 Years and older | 0 (0.0%) | 0 (0.0%) |
| Total | 262 (100.0%) | 0 (0.0%) |
Health Insurance Coverage by Citizenship Status in Chewsville
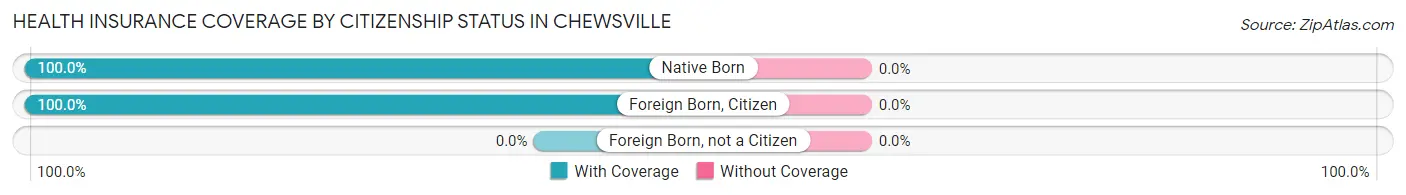
| Citizenship Status | With Coverage | Without Coverage |
| Native Born | 52 (100.0%) | 0 (0.0%) |
| Foreign Born, Citizen | 15 (100.0%) | 0 (0.0%) |
| Foreign Born, not a Citizen | 0 (0.0%) | 0 (0.0%) |
Health Insurance Coverage by Household Income in Chewsville
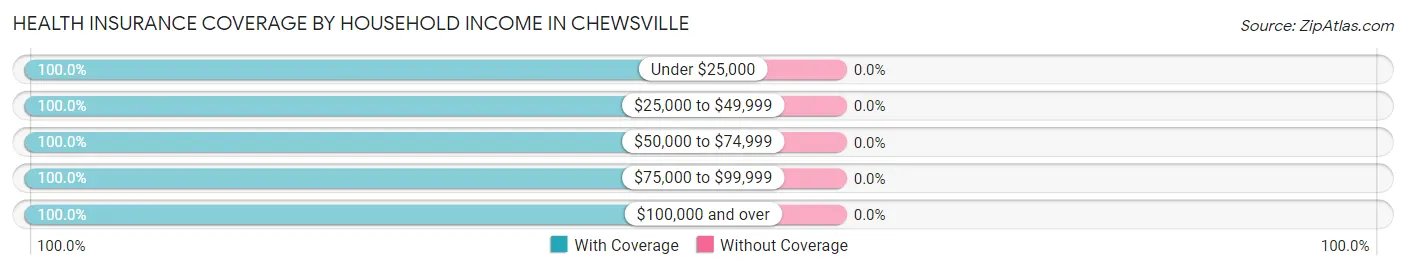
| Household Income | With Coverage | Without Coverage |
| Under $25,000 | 8 (100.0%) | 0 (0.0%) |
| $25,000 to $49,999 | 15 (100.0%) | 0 (0.0%) |
| $50,000 to $74,999 | 24 (100.0%) | 0 (0.0%) |
| $75,000 to $99,999 | 12 (100.0%) | 0 (0.0%) |
| $100,000 and over | 203 (100.0%) | 0 (0.0%) |
Public vs Private Health Insurance Coverage by Age in Chewsville
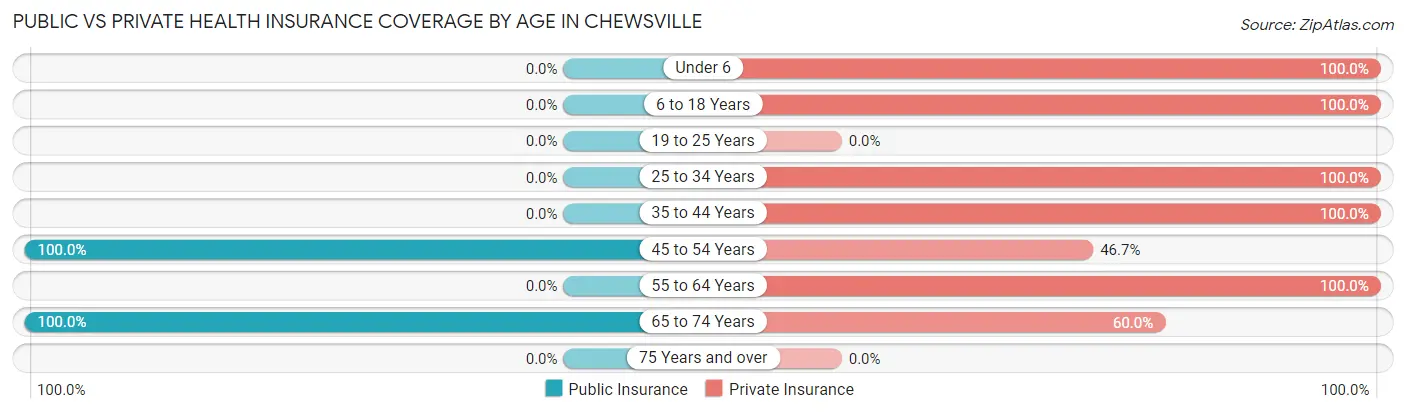
| Age Bracket | Public Insurance | Private Insurance |
| Under 6 | 0 (0.0%) | 52 (100.0%) |
| 6 to 18 Years | 0 (0.0%) | 15 (100.0%) |
| 19 to 25 Years | 0 (0.0%) | 0 (0.0%) |
| 25 to 34 Years | 0 (0.0%) | 23 (100.0%) |
| 35 to 44 Years | 0 (0.0%) | 131 (100.0%) |
| 45 to 54 Years | 15 (100.0%) | 7 (46.7%) |
| 55 to 64 Years | 0 (0.0%) | 11 (100.0%) |
| 65 to 74 Years | 15 (100.0%) | 9 (60.0%) |
| 75 Years and over | 0 (0.0%) | 0 (0.0%) |
| Total | 30 (11.5%) | 248 (94.7%) |
Disability Status by Sex by Age in Chewsville
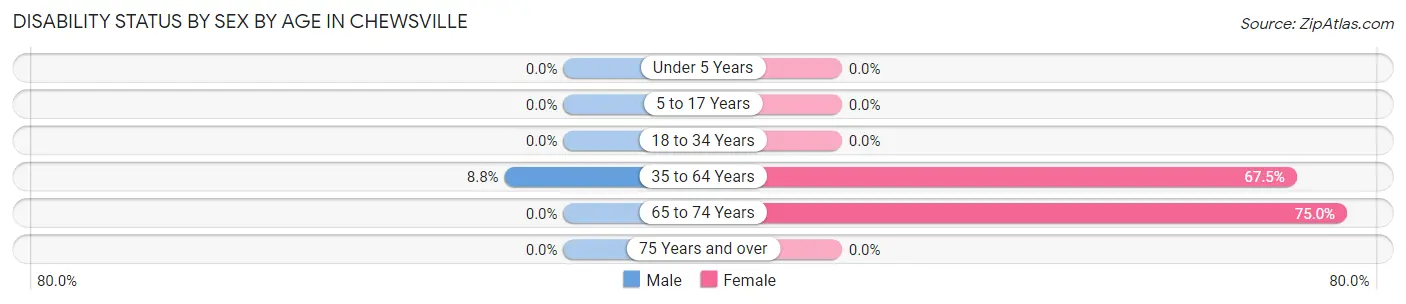
| Age Bracket | Male | Female |
| Under 5 Years | 0 (0.0%) | 0 (0.0%) |
| 5 to 17 Years | 0 (0.0%) | 0 (0.0%) |
| 18 to 34 Years | 0 (0.0%) | 0 (0.0%) |
| 35 to 64 Years | 7 (8.7%) | 52 (67.5%) |
| 65 to 74 Years | 0 (0.0%) | 9 (75.0%) |
| 75 Years and over | 0 (0.0%) | 0 (0.0%) |
Disability Class by Sex by Age in Chewsville
Disability Class: Hearing Difficulty
| Age Bracket | Male | Female |
| Under 5 Years | 0 (0.0%) | 0 (0.0%) |
| 5 to 17 Years | 0 (0.0%) | 0 (0.0%) |
| 18 to 34 Years | 0 (0.0%) | 0 (0.0%) |
| 35 to 64 Years | 0 (0.0%) | 0 (0.0%) |
| 65 to 74 Years | 0 (0.0%) | 0 (0.0%) |
| 75 Years and over | 0 (0.0%) | 0 (0.0%) |
Disability Class: Vision Difficulty
| Age Bracket | Male | Female |
| Under 5 Years | 0 (0.0%) | 0 (0.0%) |
| 5 to 17 Years | 0 (0.0%) | 0 (0.0%) |
| 18 to 34 Years | 0 (0.0%) | 0 (0.0%) |
| 35 to 64 Years | 0 (0.0%) | 0 (0.0%) |
| 65 to 74 Years | 0 (0.0%) | 0 (0.0%) |
| 75 Years and over | 0 (0.0%) | 0 (0.0%) |
Disability Class: Cognitive Difficulty
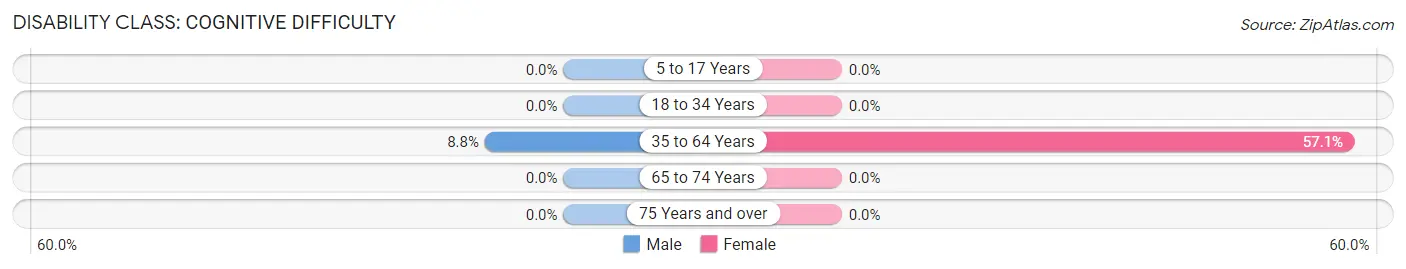
| Age Bracket | Male | Female |
| 5 to 17 Years | 0 (0.0%) | 0 (0.0%) |
| 18 to 34 Years | 0 (0.0%) | 0 (0.0%) |
| 35 to 64 Years | 7 (8.7%) | 44 (57.1%) |
| 65 to 74 Years | 0 (0.0%) | 0 (0.0%) |
| 75 Years and over | 0 (0.0%) | 0 (0.0%) |
Disability Class: Ambulatory Difficulty
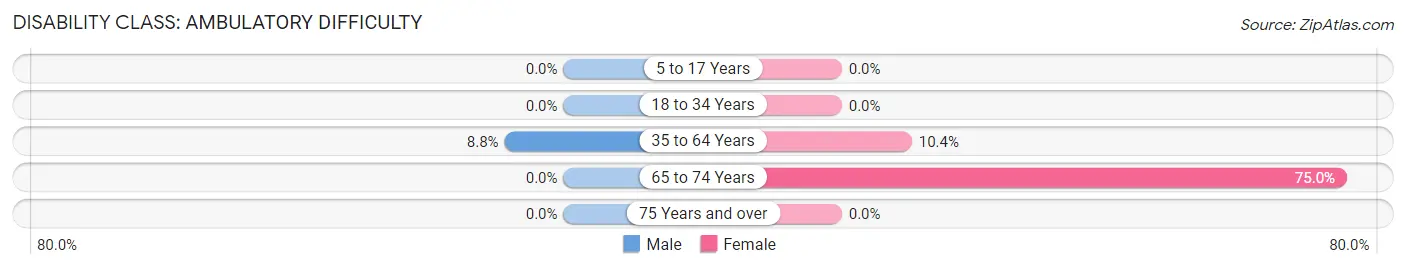
| Age Bracket | Male | Female |
| 5 to 17 Years | 0 (0.0%) | 0 (0.0%) |
| 18 to 34 Years | 0 (0.0%) | 0 (0.0%) |
| 35 to 64 Years | 7 (8.7%) | 8 (10.4%) |
| 65 to 74 Years | 0 (0.0%) | 9 (75.0%) |
| 75 Years and over | 0 (0.0%) | 0 (0.0%) |
Disability Class: Self-Care Difficulty
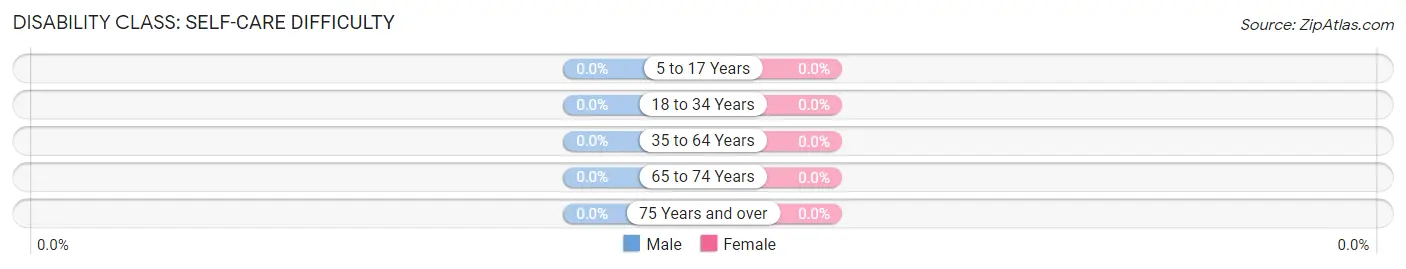
| Age Bracket | Male | Female |
| 5 to 17 Years | 0 (0.0%) | 0 (0.0%) |
| 18 to 34 Years | 0 (0.0%) | 0 (0.0%) |
| 35 to 64 Years | 0 (0.0%) | 0 (0.0%) |
| 65 to 74 Years | 0 (0.0%) | 0 (0.0%) |
| 75 Years and over | 0 (0.0%) | 0 (0.0%) |
Technology Access in Chewsville
Computing Device Access in Chewsville
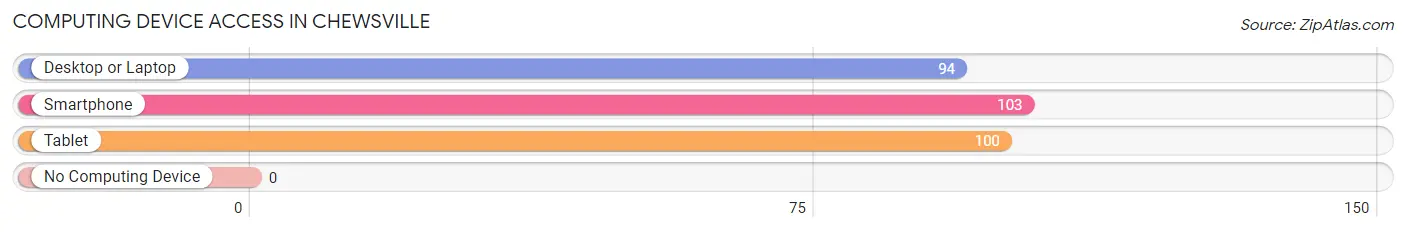
| Device Type | # Households | % Households |
| Desktop or Laptop | 94 | 91.3% |
| Smartphone | 103 | 100.0% |
| Tablet | 100 | 97.1% |
| No Computing Device | 0 | 0.0% |
| Total | 103 | 100.0% |
Internet Access in Chewsville
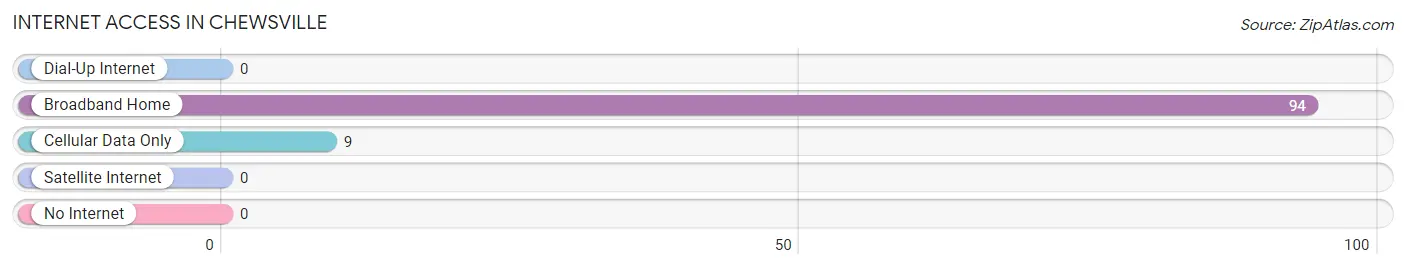
| Internet Type | # Households | % Households |
| Dial-Up Internet | 0 | 0.0% |
| Broadband Home | 94 | 91.3% |
| Cellular Data Only | 9 | 8.7% |
| Satellite Internet | 0 | 0.0% |
| No Internet | 0 | 0.0% |
| Total | 103 | 100.0% |
Chewsville Summary
Chewsville is an unincorporated community located in Washington County, Maryland, United States. It is situated in the northern part of the county, near the Pennsylvania border. The community is located along the Antietam Creek, a tributary of the Potomac River.
History
Chewsville was first settled in the late 1700s by the Chews, a family of German immigrants. The Chews were farmers and operated a mill along the Antietam Creek. The community was named after the family and was officially established in 1820.
In the mid-1800s, the Baltimore and Ohio Railroad (B&O) built a line through the area, connecting Chewsville to the larger cities of Hagerstown and Baltimore. This allowed the community to become a stop along the railroad and a hub for local commerce.
Geography
Chewsville is located in northern Washington County, Maryland, near the Pennsylvania border. It is situated along the Antietam Creek, a tributary of the Potomac River. The community is located at an elevation of 590 feet (180 m).
The climate in Chewsville is classified as humid subtropical, with hot, humid summers and cold, wet winters. The average annual temperature is 54°F (12°C), and the average annual precipitation is 41 inches (104 cm).
Economy
Chewsville’s economy is largely based on agriculture and tourism. The community is home to several farms, which produce a variety of crops, including corn, soybeans, wheat, and hay. The area is also popular with tourists, who come to enjoy the rural scenery and outdoor activities such as fishing, hunting, and camping.
Demographics
As of the 2010 census, the population of Chewsville was 1,093. The racial makeup of the community was 97.2% White, 0.7% African American, 0.3% Native American, 0.2% Asian, 0.1% Pacific Islander, 0.7% from other races, and 0.9% from two or more races. Hispanic or Latino of any race were 1.7% of the population.
The median household income in Chewsville was $50,938, and the median family income was $58,750. The per capita income was $22,845. About 8.2% of families and 10.2% of the population were below the poverty line, including 14.2% of those under age 18 and 6.2% of those age 65 or over.
Common Questions
What is Per Capita Income in Chewsville?
Per Capita income in Chewsville is $54,147.
What is the Median Family Income in Chewsville?
Median Family Income in Chewsville is $207,557.
What is the Median Household income in Chewsville?
Median Household Income in Chewsville is $151,161.
What is Income or Wage Gap in Chewsville?
Income or Wage Gap in Chewsville is 58.0%.
Women in Chewsville earn 42.0 cents for every dollar earned by a man.
What is Inequality or Gini Index in Chewsville?
Inequality or Gini Index in Chewsville is 0.30.
What is the Total Population of Chewsville?
Total Population of Chewsville is 262.
What is the Total Male Population of Chewsville?
Total Male Population of Chewsville is 161.
What is the Total Female Population of Chewsville?
Total Female Population of Chewsville is 101.
What is the Ratio of Males per 100 Females in Chewsville?
There are 159.41 Males per 100 Females in Chewsville.
What is the Ratio of Females per 100 Males in Chewsville?
There are 62.73 Females per 100 Males in Chewsville.
What is the Median Population Age in Chewsville?
Median Population Age in Chewsville is 37.2 Years.
What is the Average Family Size in Chewsville
Average Family Size in Chewsville is 2.9 People.
What is the Average Household Size in Chewsville
Average Household Size in Chewsville is 2.5 People.
How Large is the Labor Force in Chewsville?
There are 165 People in the Labor Forcein in Chewsville.
What is the Percentage of People in the Labor Force in Chewsville?
84.6% of People are in the Labor Force in Chewsville.