Mount Briar, MD Map & Demographics
Mount Briar Map
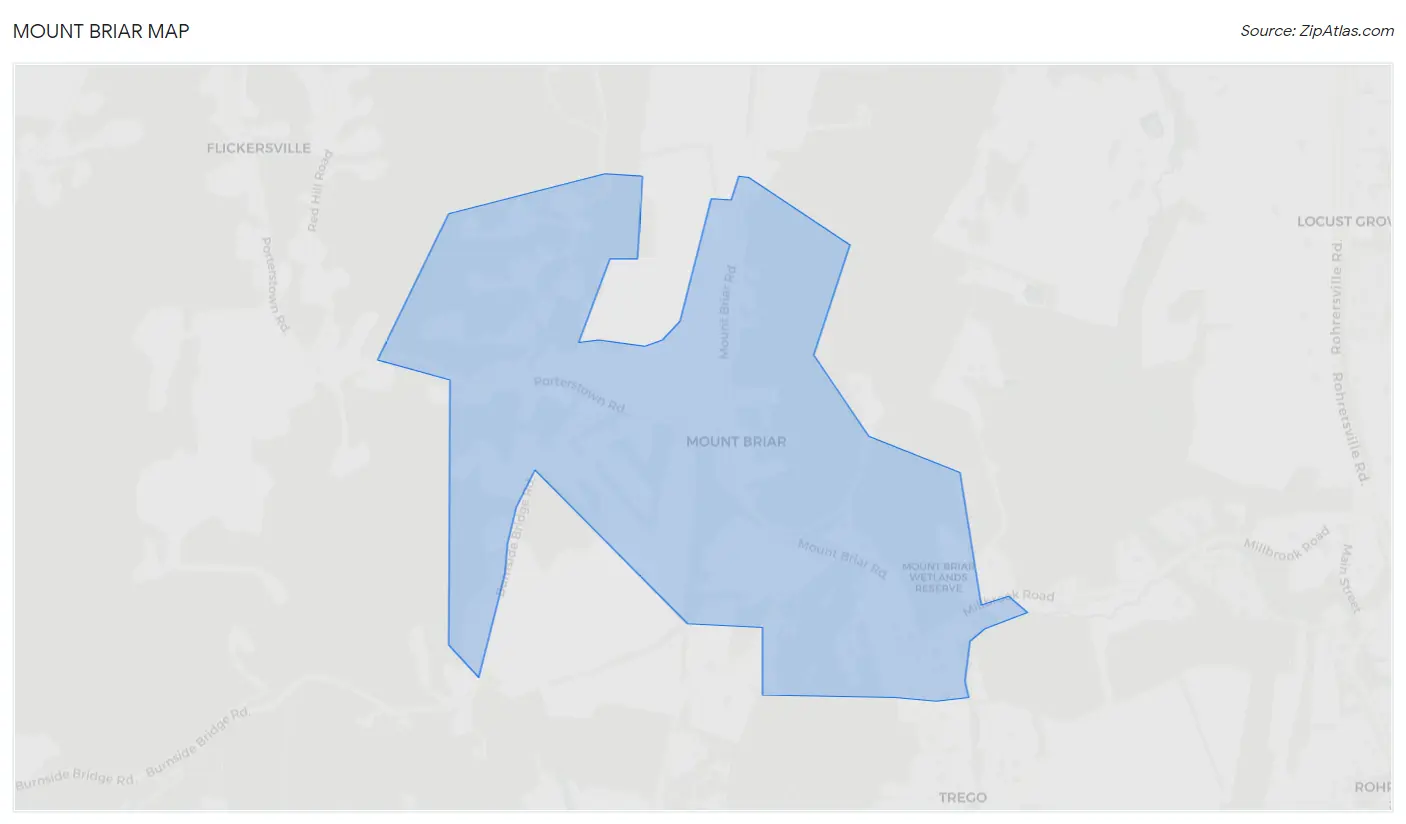
Mount Briar Overview
$55,156
PER CAPITA INCOME
$193,750
AVG FAMILY INCOME
$164,125
AVG HOUSEHOLD INCOME
0.30
INEQUALITY / GINI INDEX
175
TOTAL POPULATION
52
MALE POPULATION
123
FEMALE POPULATION
42.28
MALES / 100 FEMALES
236.54
FEMALES / 100 MALES
47.4
MEDIAN AGE
3.1
AVG FAMILY SIZE
2.6
AVG HOUSEHOLD SIZE
111
LABOR FORCE [ PEOPLE ]
81.0%
PERCENT IN LABOR FORCE
Income in Mount Briar
Income Overview in Mount Briar
Per Capita Income in Mount Briar is $55,156, while median incomes of families and households are $193,750 and $164,125 respectively.
| Characteristic | Number | Measure |
| Per Capita Income | 175 | $55,156 |
| Median Family Income | 52 | $193,750 |
| Mean Family Income | 52 | $177,021 |
| Median Household Income | 66 | $164,125 |
| Mean Household Income | 66 | $145,080 |
| Income Deficit | 52 | $0 |
| Wage / Income Gap (%) | 175 | 0.00% |
| Wage / Income Gap ($) | 175 | 100.00¢ per $1 |
| Gini / Inequality Index | 175 | 0.30 |
Earnings by Sex in Mount Briar
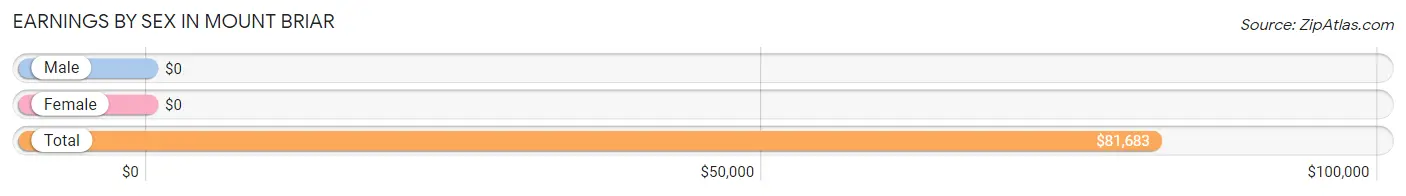
| Sex | Number | Average Earnings |
| Male | 46 (41.4%) | $0 |
| Female | 65 (58.6%) | $0 |
| Total | 111 (100.0%) | $81,683 |
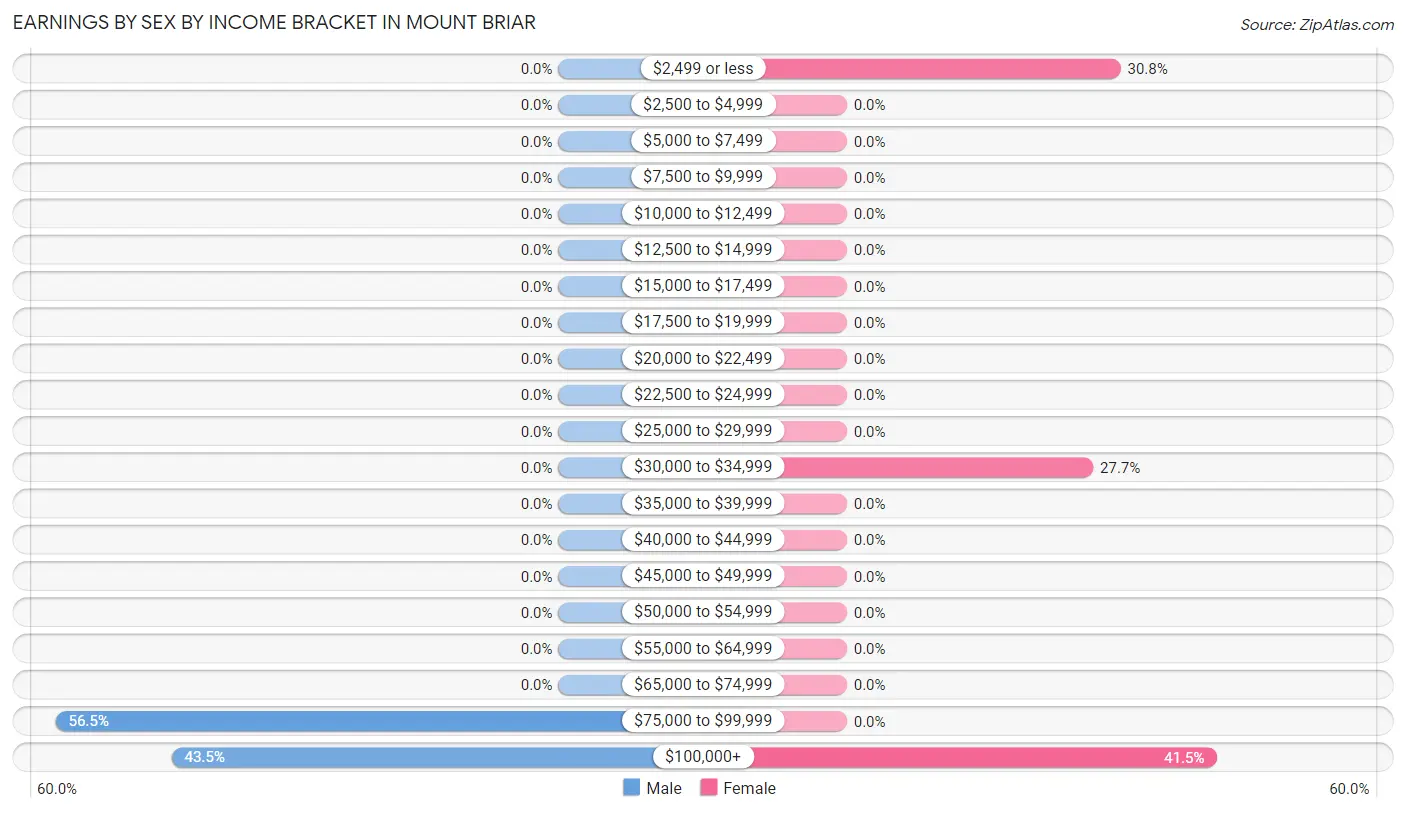
Earnings by Sex by Income Bracket in Mount Briar
The most common earnings brackets in Mount Briar are $75,000 to $99,999 for men (26 | 56.5%) and $100,000+ for women (27 | 41.5%).
| Income | Male | Female |
| $2,499 or less | 0 (0.0%) | 20 (30.8%) |
| $2,500 to $4,999 | 0 (0.0%) | 0 (0.0%) |
| $5,000 to $7,499 | 0 (0.0%) | 0 (0.0%) |
| $7,500 to $9,999 | 0 (0.0%) | 0 (0.0%) |
| $10,000 to $12,499 | 0 (0.0%) | 0 (0.0%) |
| $12,500 to $14,999 | 0 (0.0%) | 0 (0.0%) |
| $15,000 to $17,499 | 0 (0.0%) | 0 (0.0%) |
| $17,500 to $19,999 | 0 (0.0%) | 0 (0.0%) |
| $20,000 to $22,499 | 0 (0.0%) | 0 (0.0%) |
| $22,500 to $24,999 | 0 (0.0%) | 0 (0.0%) |
| $25,000 to $29,999 | 0 (0.0%) | 0 (0.0%) |
| $30,000 to $34,999 | 0 (0.0%) | 18 (27.7%) |
| $35,000 to $39,999 | 0 (0.0%) | 0 (0.0%) |
| $40,000 to $44,999 | 0 (0.0%) | 0 (0.0%) |
| $45,000 to $49,999 | 0 (0.0%) | 0 (0.0%) |
| $50,000 to $54,999 | 0 (0.0%) | 0 (0.0%) |
| $55,000 to $64,999 | 0 (0.0%) | 0 (0.0%) |
| $65,000 to $74,999 | 0 (0.0%) | 0 (0.0%) |
| $75,000 to $99,999 | 26 (56.5%) | 0 (0.0%) |
| $100,000+ | 20 (43.5%) | 27 (41.5%) |
| Total | 46 (100.0%) | 65 (100.0%) |
Earnings by Sex by Educational Attainment in Mount Briar
| Educational Attainment | Male Income | Female Income |
| Less than High School | - | - |
| High School Diploma | - | - |
| College or Associate's Degree | - | - |
| Bachelor's Degree | - | - |
| Graduate Degree | - | - |
| Total | - | - |
Family Income in Mount Briar
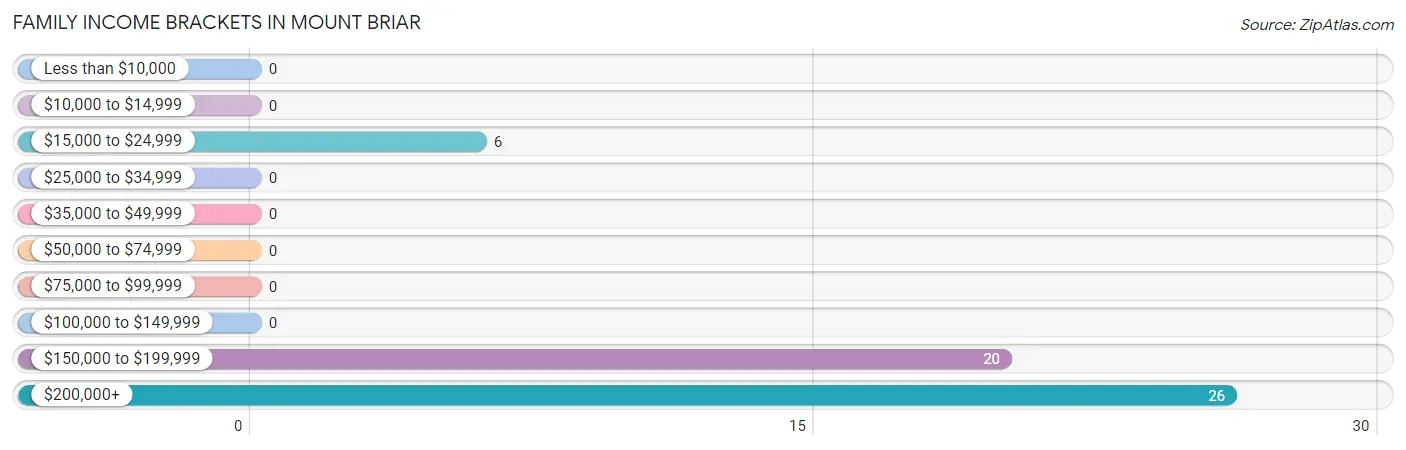
Family Income Brackets in Mount Briar
According to the Mount Briar family income data, there are 26 families falling into the $200,000+ income range, which is the most common income bracket and makes up 50.0% of all families.
| Income Bracket | # Families | % Families |
| Less than $10,000 | 0 | 0.0% |
| $10,000 to $14,999 | 0 | 0.0% |
| $15,000 to $24,999 | 6 | 11.5% |
| $25,000 to $34,999 | 0 | 0.0% |
| $35,000 to $49,999 | 0 | 0.0% |
| $50,000 to $74,999 | 0 | 0.0% |
| $75,000 to $99,999 | 0 | 0.0% |
| $100,000 to $149,999 | 0 | 0.0% |
| $150,000 to $199,999 | 20 | 38.5% |
| $200,000+ | 26 | 50.0% |
Family Income by Famaliy Size in Mount Briar
| Income Bracket | # Families | Median Income |
| 2-Person Families | 32 (61.5%) | $0 |
| 3-Person Families | 0 (0.0%) | $0 |
| 4-Person Families | 0 (0.0%) | $0 |
| 5-Person Families | 20 (38.5%) | $0 |
| 6-Person Families | 0 (0.0%) | $0 |
| 7+ Person Families | 0 (0.0%) | $0 |
| Total | 52 (100.0%) | $193,750 |
Family Income by Number of Earners in Mount Briar
| Number of Earners | # Families | Median Income |
| No Earners | 6 (11.5%) | $0 |
| 1 Earner | 0 (0.0%) | $0 |
| 2 Earners | 26 (50.0%) | $0 |
| 3+ Earners | 20 (38.5%) | $0 |
| Total | 52 (100.0%) | $193,750 |
Household Income in Mount Briar
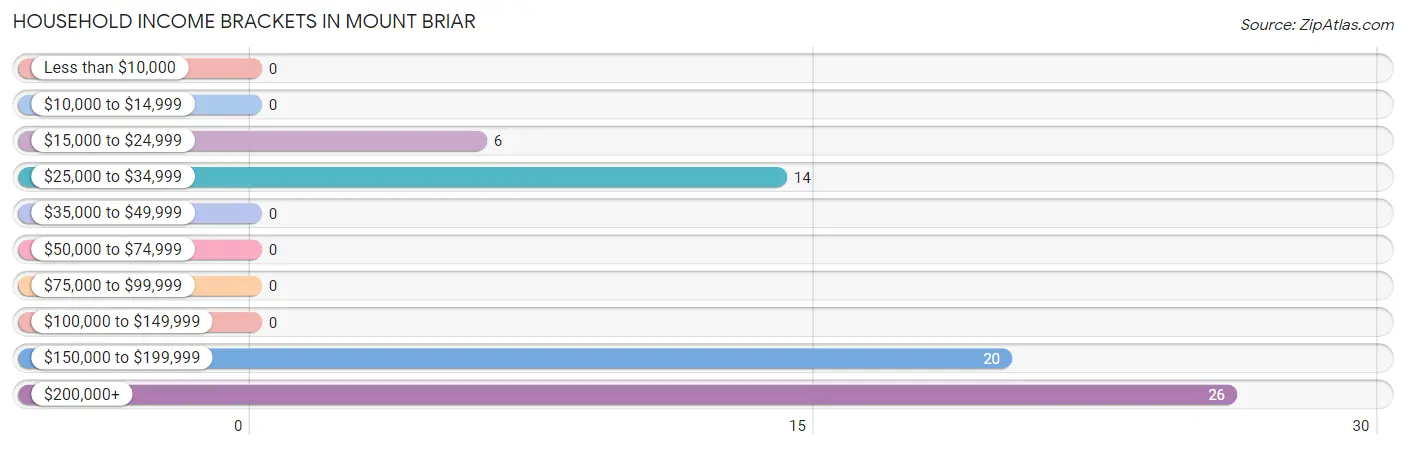
Household Income Brackets in Mount Briar
With 26 households falling in the category, the $200,000+ income range is the most frequent in Mount Briar, accounting for 39.4% of all households.
| Income Bracket | # Households | % Households |
| Less than $10,000 | 0 | 0.0% |
| $10,000 to $14,999 | 0 | 0.0% |
| $15,000 to $24,999 | 6 | 9.1% |
| $25,000 to $34,999 | 14 | 21.2% |
| $35,000 to $49,999 | 0 | 0.0% |
| $50,000 to $74,999 | 0 | 0.0% |
| $75,000 to $99,999 | 0 | 0.0% |
| $100,000 to $149,999 | 0 | 0.0% |
| $150,000 to $199,999 | 20 | 30.3% |
| $200,000+ | 26 | 39.4% |
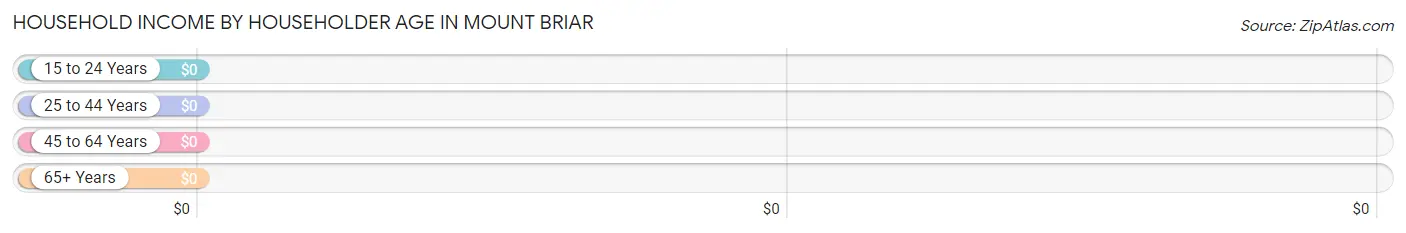
Household Income by Householder Age in Mount Briar
| Income Bracket | # Households | Median Income |
| 15 to 24 Years | 0 (0.0%) | $0 |
| 25 to 44 Years | 20 (30.3%) | $0 |
| 45 to 64 Years | 32 (48.5%) | $0 |
| 65+ Years | 14 (21.2%) | $0 |
| Total | 66 (100.0%) | $164,125 |
Poverty in Mount Briar
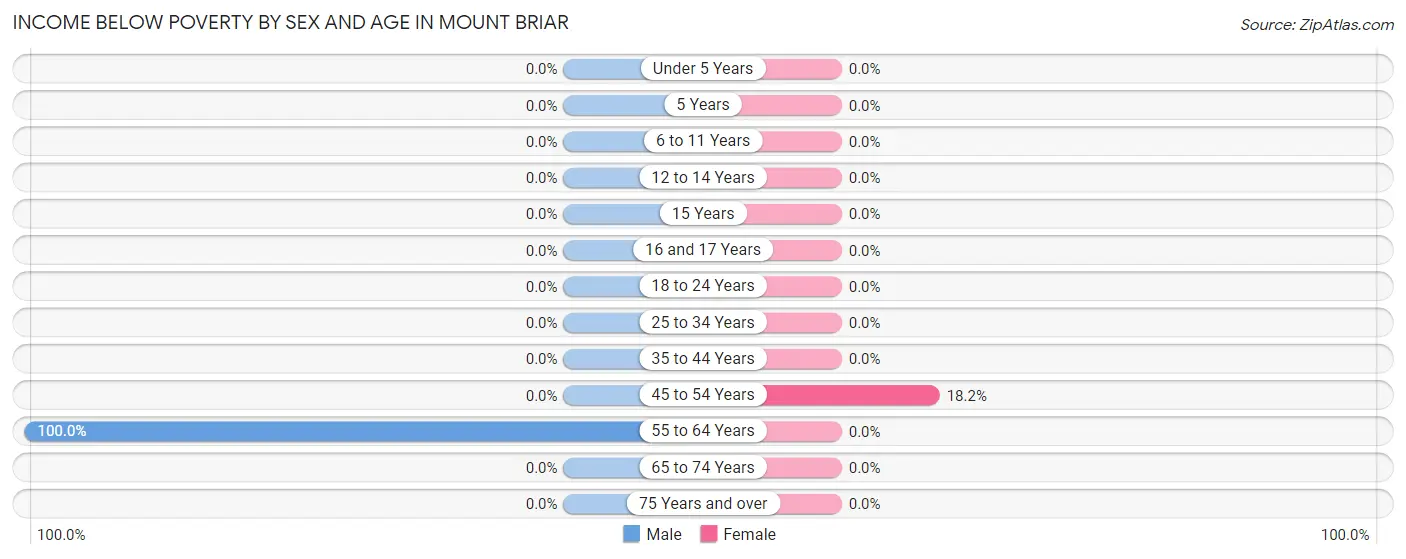
Income Below Poverty by Sex and Age in Mount Briar
With 11.5% poverty level for males and 4.9% for females among the residents of Mount Briar, 55 to 64 year old males and 45 to 54 year old females are the most vulnerable to poverty, with 6 males (100.0%) and 6 females (18.2%) in their respective age groups living below the poverty level.
| Age Bracket | Male | Female |
| Under 5 Years | 0 (0.0%) | 0 (0.0%) |
| 5 Years | 0 (0.0%) | 0 (0.0%) |
| 6 to 11 Years | 0 (0.0%) | 0 (0.0%) |
| 12 to 14 Years | 0 (0.0%) | 0 (0.0%) |
| 15 Years | 0 (0.0%) | 0 (0.0%) |
| 16 and 17 Years | 0 (0.0%) | 0 (0.0%) |
| 18 to 24 Years | 0 (0.0%) | 0 (0.0%) |
| 25 to 34 Years | 0 (0.0%) | 0 (0.0%) |
| 35 to 44 Years | 0 (0.0%) | 0 (0.0%) |
| 45 to 54 Years | 0 (0.0%) | 6 (18.2%) |
| 55 to 64 Years | 6 (100.0%) | 0 (0.0%) |
| 65 to 74 Years | 0 (0.0%) | 0 (0.0%) |
| 75 Years and over | 0 (0.0%) | 0 (0.0%) |
| Total | 6 (11.5%) | 6 (4.9%) |
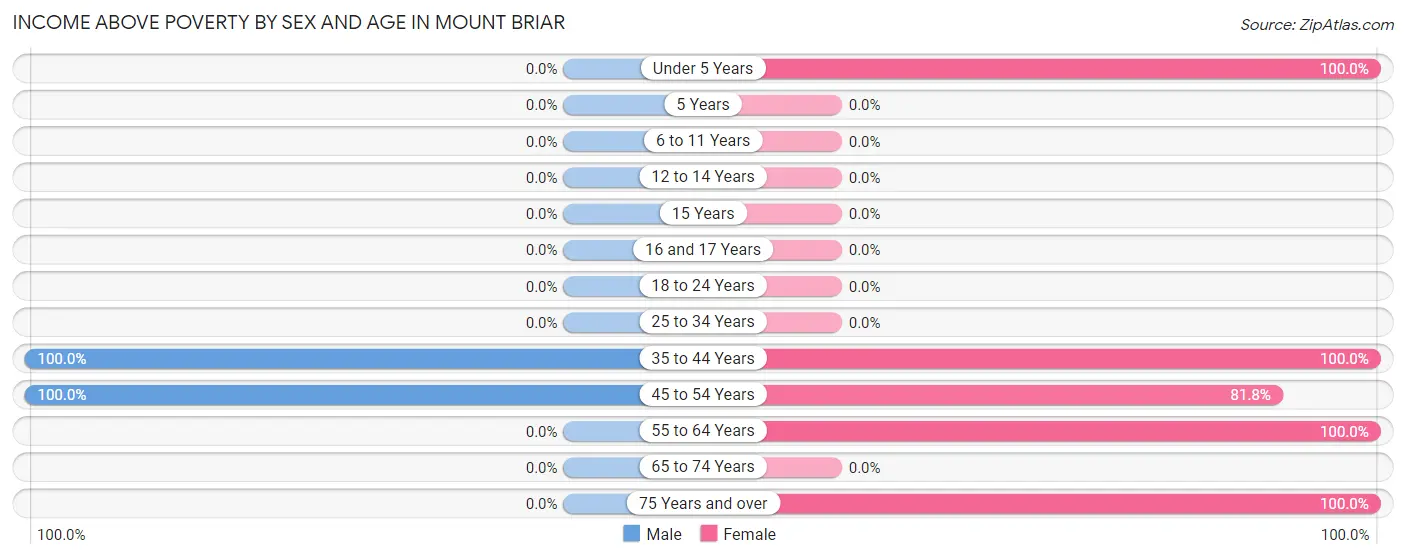
Income Above Poverty by Sex and Age in Mount Briar
According to the poverty statistics in Mount Briar, males aged 35 to 44 years and females aged under 5 years are the age groups that are most secure financially, with 100.0% of males and 100.0% of females in these age groups living above the poverty line.
| Age Bracket | Male | Female |
| Under 5 Years | 0 (0.0%) | 38 (100.0%) |
| 5 Years | 0 (0.0%) | 0 (0.0%) |
| 6 to 11 Years | 0 (0.0%) | 0 (0.0%) |
| 12 to 14 Years | 0 (0.0%) | 0 (0.0%) |
| 15 Years | 0 (0.0%) | 0 (0.0%) |
| 16 and 17 Years | 0 (0.0%) | 0 (0.0%) |
| 18 to 24 Years | 0 (0.0%) | 0 (0.0%) |
| 25 to 34 Years | 0 (0.0%) | 0 (0.0%) |
| 35 to 44 Years | 20 (100.0%) | 20 (100.0%) |
| 45 to 54 Years | 26 (100.0%) | 27 (81.8%) |
| 55 to 64 Years | 0 (0.0%) | 18 (100.0%) |
| 65 to 74 Years | 0 (0.0%) | 0 (0.0%) |
| 75 Years and over | 0 (0.0%) | 14 (100.0%) |
| Total | 46 (88.5%) | 117 (95.1%) |
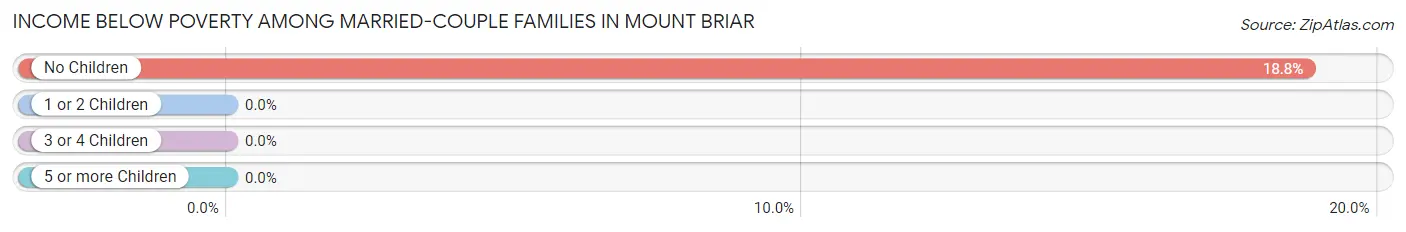
Income Below Poverty Among Married-Couple Families in Mount Briar
The poverty statistics for married-couple families in Mount Briar show that 11.5% or 6 of the total 52 families live below the poverty line. Families with no children have the highest poverty rate of 18.8%, comprising of 6 families. On the other hand, families with 1 or 2 children have the lowest poverty rate of 0.0%, which includes 0 families.
| Children | Above Poverty | Below Poverty |
| No Children | 26 (81.2%) | 6 (18.8%) |
| 1 or 2 Children | 20 (100.0%) | 0 (0.0%) |
| 3 or 4 Children | 0 (0.0%) | 0 (0.0%) |
| 5 or more Children | 0 (0.0%) | 0 (0.0%) |
| Total | 46 (88.5%) | 6 (11.5%) |
Income Below Poverty Among Single-Parent Households in Mount Briar
| Children | Single Father | Single Mother |
| No Children | 0 (0.0%) | 0 (0.0%) |
| 1 or 2 Children | 0 (0.0%) | 0 (0.0%) |
| 3 or 4 Children | 0 (0.0%) | 0 (0.0%) |
| 5 or more Children | 0 (0.0%) | 0 (0.0%) |
| Total | 0 (0.0%) | 0 (0.0%) |
Income Below Poverty Among Married-Couple vs Single-Parent Households in Mount Briar
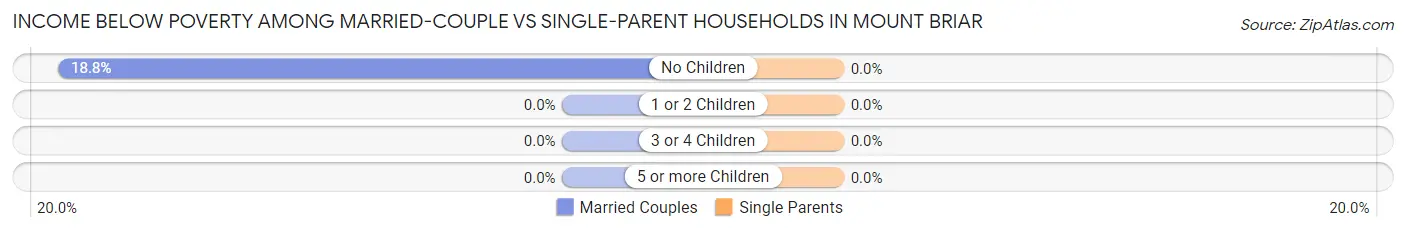
| Children | Married-Couple Families | Single-Parent Households |
| No Children | 6 (18.8%) | 0 (0.0%) |
| 1 or 2 Children | 0 (0.0%) | 0 (0.0%) |
| 3 or 4 Children | 0 (0.0%) | 0 (0.0%) |
| 5 or more Children | 0 (0.0%) | 0 (0.0%) |
| Total | 6 (11.5%) | 0 (0.0%) |
Race in Mount Briar
The most populous races in Mount Briar are , and White / Caucasian (175 | 100.0%).
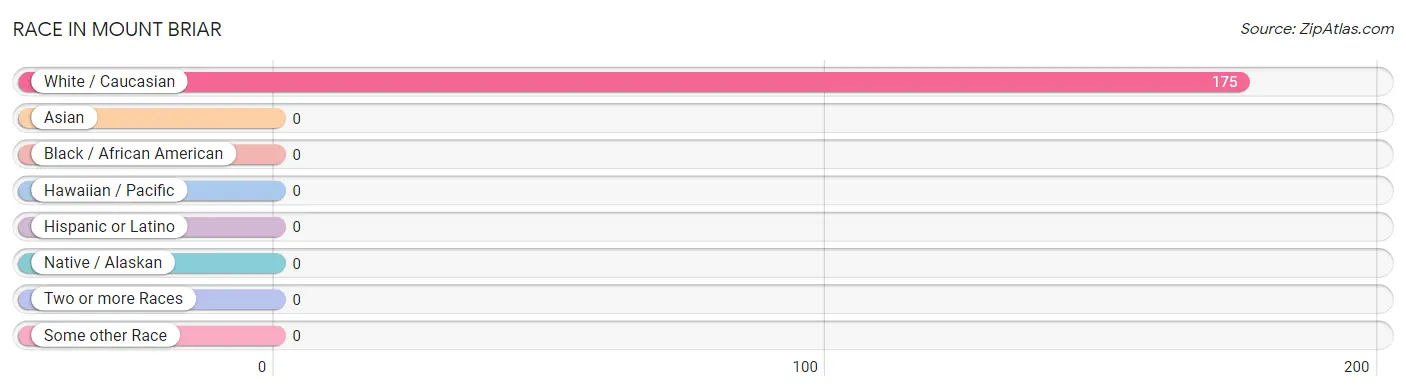
| Race | # Population | % Population |
| Asian | 0 | 0.0% |
| Black / African American | 0 | 0.0% |
| Hawaiian / Pacific | 0 | 0.0% |
| Hispanic or Latino | 0 | 0.0% |
| Native / Alaskan | 0 | 0.0% |
| White / Caucasian | 175 | 100.0% |
| Two or more Races | 0 | 0.0% |
| Some other Race | 0 | 0.0% |
| Total | 175 | 100.0% |
Ancestry in Mount Briar
The most populous ancestries reported in Mount Briar are English (73 | 41.7%), Irish (20 | 11.4%), German (14 | 8.0%), Scottish (14 | 8.0%), and American (12 | 6.9%), together accounting for 76.0% of all Mount Briar residents.
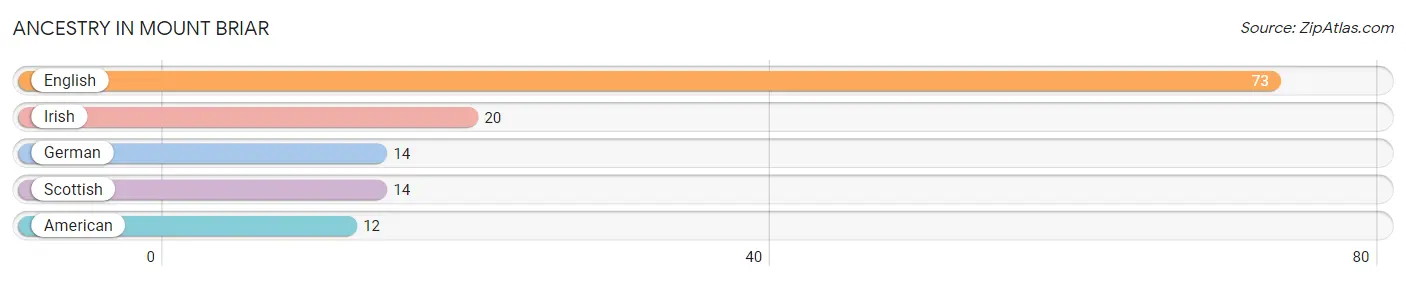
| Ancestry | # Population | % Population |
| American | 12 | 6.9% |
| English | 73 | 41.7% |
| German | 14 | 8.0% |
| Irish | 20 | 11.4% |
| Scottish | 14 | 8.0% | View All 5 Rows |
Immigrants in Mount Briar

| Immigration Origin | # Population | % Population | View All 0 Rows |
Sex and Age in Mount Briar
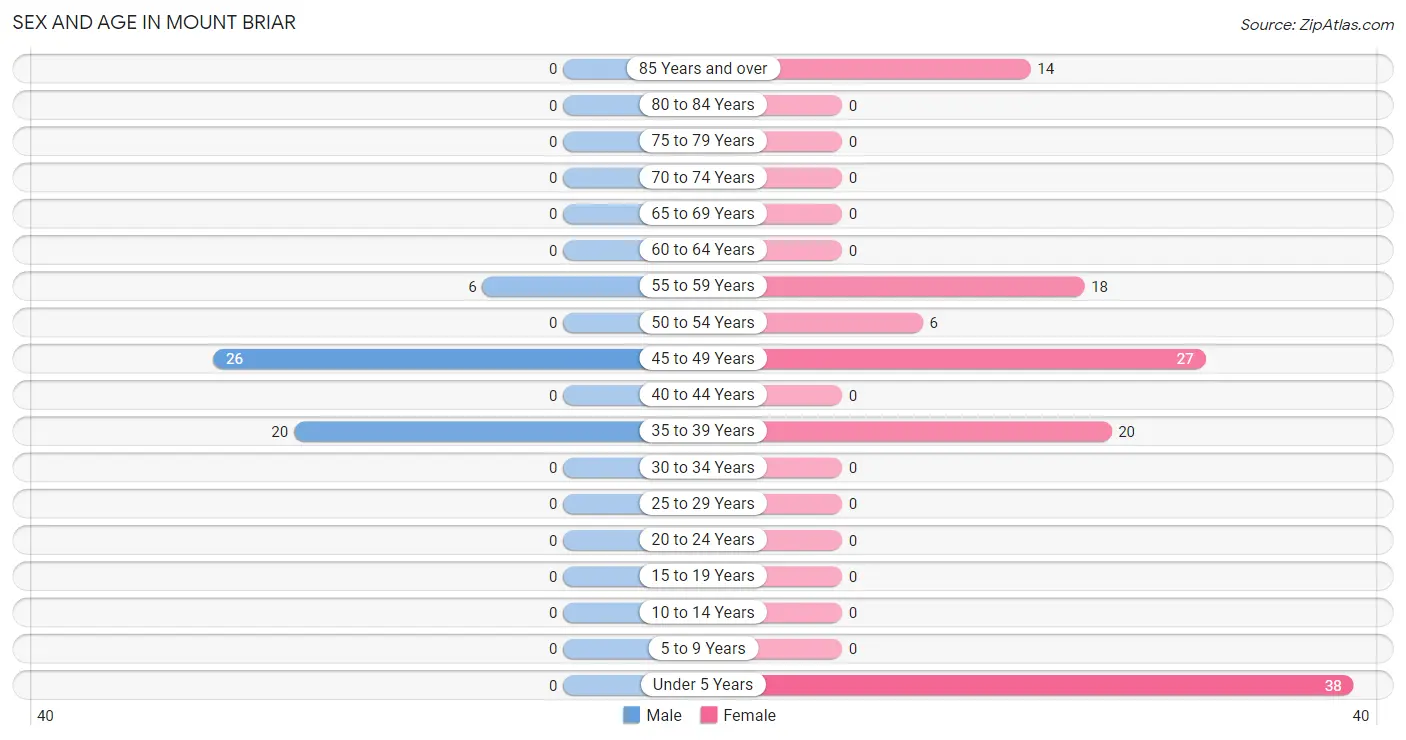
Sex and Age in Mount Briar
The most populous age groups in Mount Briar are 45 to 49 Years (26 | 50.0%) for men and Under 5 Years (38 | 30.9%) for women.
| Age Bracket | Male | Female |
| Under 5 Years | 0 (0.0%) | 38 (30.9%) |
| 5 to 9 Years | 0 (0.0%) | 0 (0.0%) |
| 10 to 14 Years | 0 (0.0%) | 0 (0.0%) |
| 15 to 19 Years | 0 (0.0%) | 0 (0.0%) |
| 20 to 24 Years | 0 (0.0%) | 0 (0.0%) |
| 25 to 29 Years | 0 (0.0%) | 0 (0.0%) |
| 30 to 34 Years | 0 (0.0%) | 0 (0.0%) |
| 35 to 39 Years | 20 (38.5%) | 20 (16.3%) |
| 40 to 44 Years | 0 (0.0%) | 0 (0.0%) |
| 45 to 49 Years | 26 (50.0%) | 27 (22.0%) |
| 50 to 54 Years | 0 (0.0%) | 6 (4.9%) |
| 55 to 59 Years | 6 (11.5%) | 18 (14.6%) |
| 60 to 64 Years | 0 (0.0%) | 0 (0.0%) |
| 65 to 69 Years | 0 (0.0%) | 0 (0.0%) |
| 70 to 74 Years | 0 (0.0%) | 0 (0.0%) |
| 75 to 79 Years | 0 (0.0%) | 0 (0.0%) |
| 80 to 84 Years | 0 (0.0%) | 0 (0.0%) |
| 85 Years and over | 0 (0.0%) | 14 (11.4%) |
| Total | 52 (100.0%) | 123 (100.0%) |
Families and Households in Mount Briar
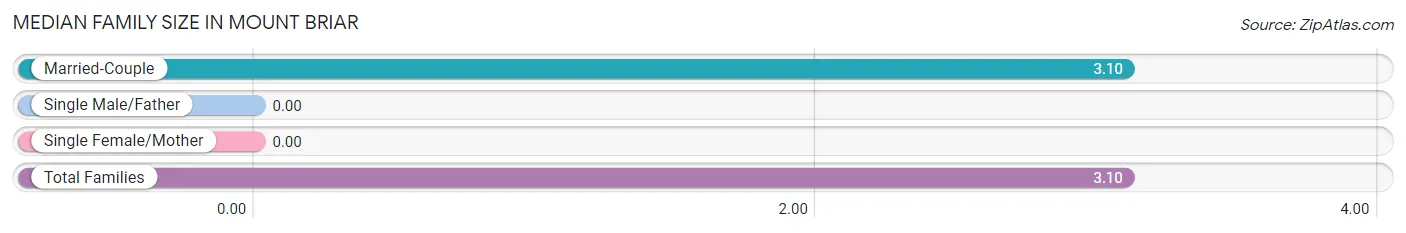
Median Family Size in Mount Briar
| Family Type | # Families | Family Size |
| Married-Couple | 52 (100.0%) | 3.10 |
| Single Male/Father | 0 (0.0%) | - |
| Single Female/Mother | 0 (0.0%) | - |
| Total Families | 52 (100.0%) | 3.10 |
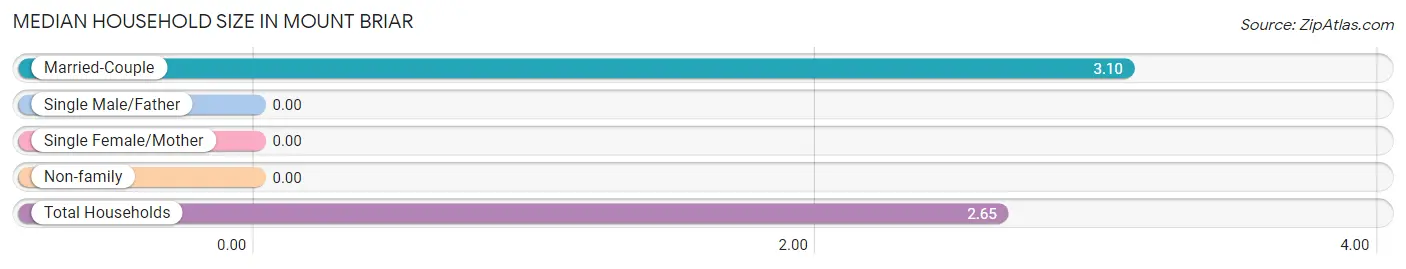
Median Household Size in Mount Briar
| Household Type | # Households | Household Size |
| Married-Couple | 52 (78.8%) | 3.10 |
| Single Male/Father | 0 (0.0%) | - |
| Single Female/Mother | 0 (0.0%) | - |
| Non-family | 14 (21.2%) | - |
| Total Households | 66 (100.0%) | 2.65 |
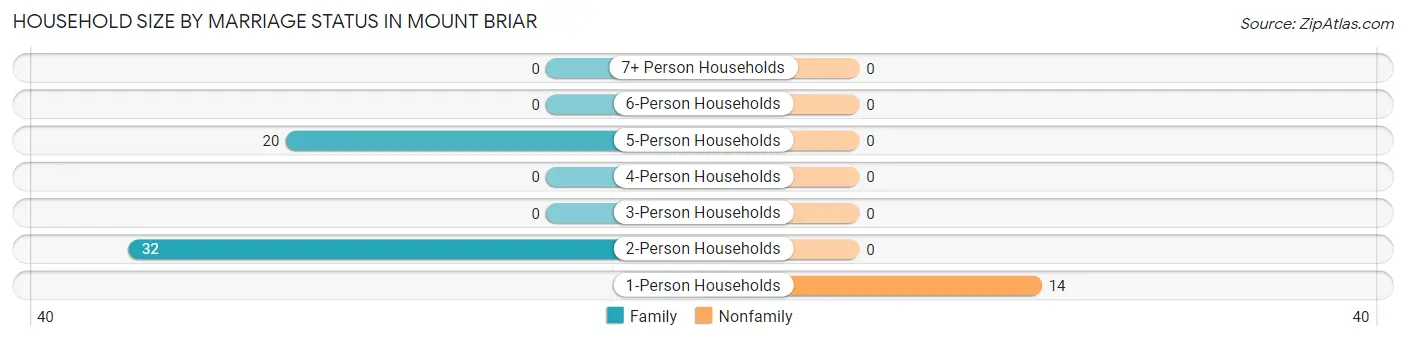
Household Size by Marriage Status in Mount Briar
Out of a total of 66 households in Mount Briar, 52 (78.8%) are family households, while 14 (21.2%) are nonfamily households. The most numerous type of family households are 2-person households, comprising 32, and the most common type of nonfamily households are 1-person households, comprising 14.
| Household Size | Family Households | Nonfamily Households |
| 1-Person Households | - | 14 (21.2%) |
| 2-Person Households | 32 (48.5%) | 0 (0.0%) |
| 3-Person Households | 0 (0.0%) | 0 (0.0%) |
| 4-Person Households | 0 (0.0%) | 0 (0.0%) |
| 5-Person Households | 20 (30.3%) | 0 (0.0%) |
| 6-Person Households | 0 (0.0%) | 0 (0.0%) |
| 7+ Person Households | 0 (0.0%) | 0 (0.0%) |
| Total | 52 (78.8%) | 14 (21.2%) |
Female Fertility in Mount Briar
Fertility by Age in Mount Briar
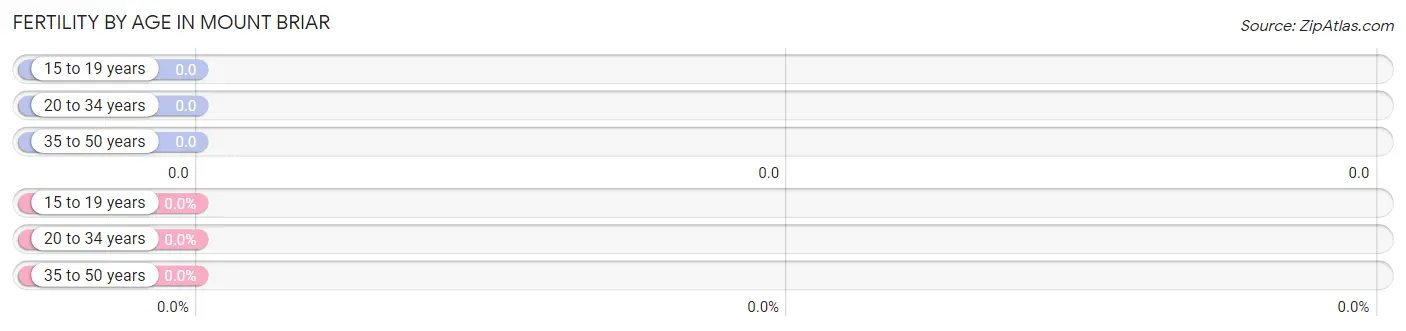
| Age Bracket | Women with Births | Births / 1,000 Women |
| 15 to 19 years | 0 (0.0%) | 0.0 |
| 20 to 34 years | 0 (0.0%) | 0.0 |
| 35 to 50 years | 0 (0.0%) | 0.0 |
| Total | 0 (0.0%) | 0.0 |
Fertility by Age by Marriage Status in Mount Briar
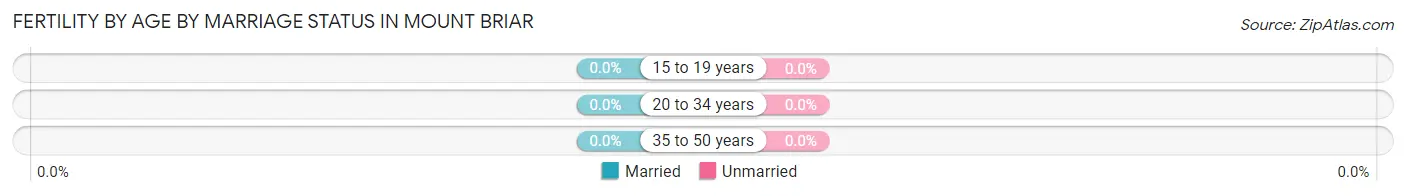
| Age Bracket | Married | Unmarried |
| 15 to 19 years | 0 (0.0%) | 0 (0.0%) |
| 20 to 34 years | 0 (0.0%) | 0 (0.0%) |
| 35 to 50 years | 0 (0.0%) | 0 (0.0%) |
| Total | 0 (0.0%) | 0 (0.0%) |
Fertility by Education in Mount Briar
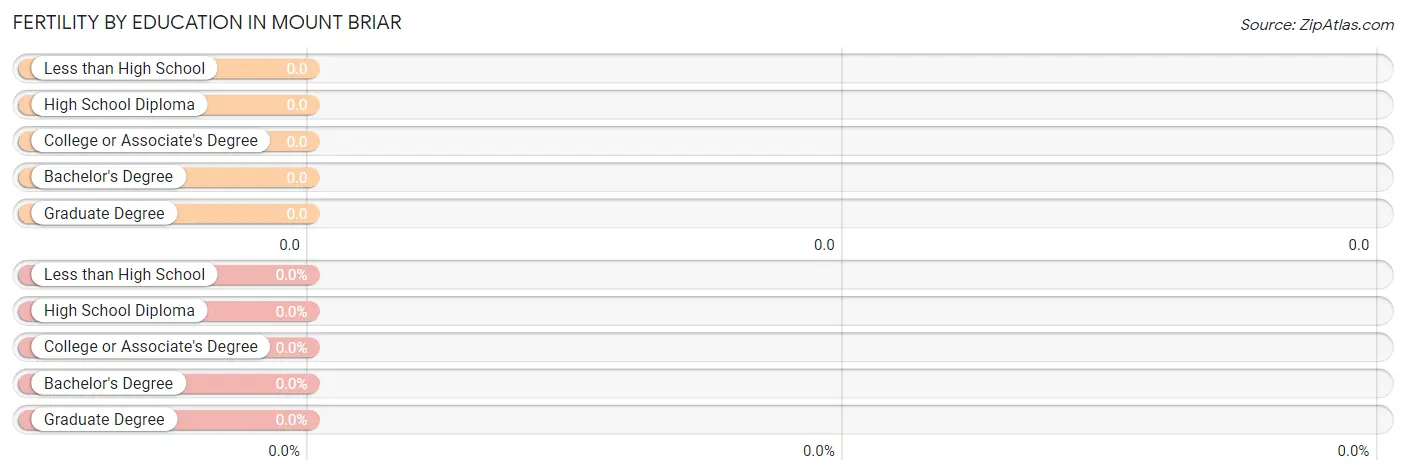
| Educational Attainment | Women with Births | Births / 1,000 Women |
| Less than High School | 0 (0.0%) | 0.0 |
| High School Diploma | 0 (0.0%) | 0.0 |
| College or Associate's Degree | 0 (0.0%) | 0.0 |
| Bachelor's Degree | 0 (0.0%) | 0.0 |
| Graduate Degree | 0 (0.0%) | 0.0 |
| Total | 0 (0.0%) | 0.0 |
Fertility by Education by Marriage Status in Mount Briar
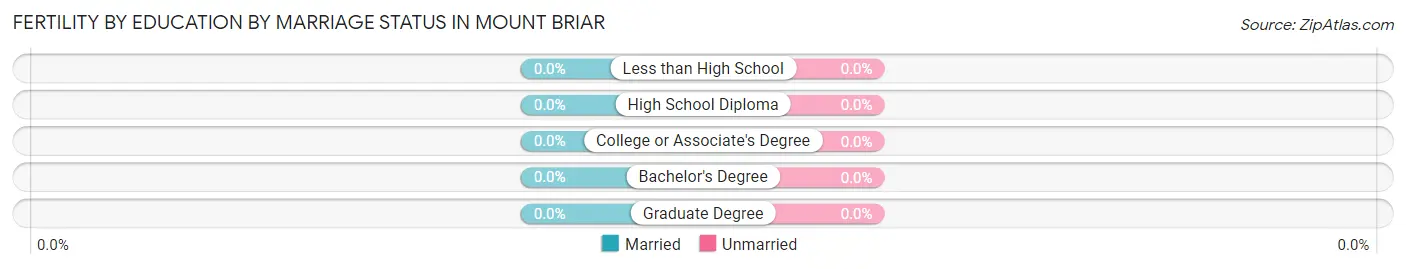
| Educational Attainment | Married | Unmarried |
| Less than High School | 0 (0.0%) | 0 (0.0%) |
| High School Diploma | 0 (0.0%) | 0 (0.0%) |
| College or Associate's Degree | 0 (0.0%) | 0 (0.0%) |
| Bachelor's Degree | 0 (0.0%) | 0 (0.0%) |
| Graduate Degree | 0 (0.0%) | 0 (0.0%) |
| Total | 0 (0.0%) | 0 (0.0%) |
Employment Characteristics in Mount Briar
Employment by Class of Employer in Mount Briar
Among the 111 employed individuals in Mount Briar, federal government employees (53 | 47.7%), private company employees (20 | 18.0%), and self-employed (not incorporated) (20 | 18.0%) make up the most common classes of employment.
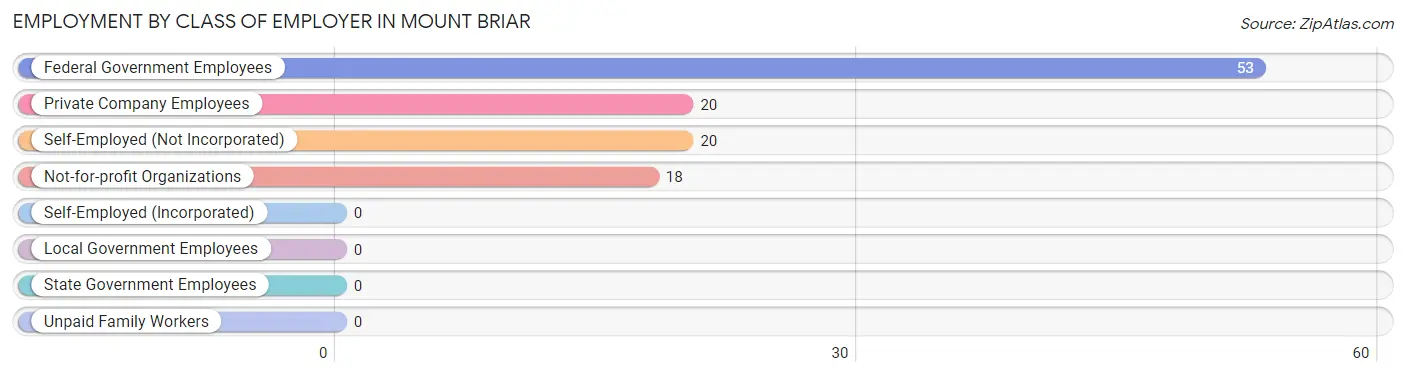
| Employer Class | # Employees | % Employees |
| Private Company Employees | 20 | 18.0% |
| Self-Employed (Incorporated) | 0 | 0.0% |
| Self-Employed (Not Incorporated) | 20 | 18.0% |
| Not-for-profit Organizations | 18 | 16.2% |
| Local Government Employees | 0 | 0.0% |
| State Government Employees | 0 | 0.0% |
| Federal Government Employees | 53 | 47.7% |
| Unpaid Family Workers | 0 | 0.0% |
| Total | 111 | 100.0% |
Employment Status by Age in Mount Briar
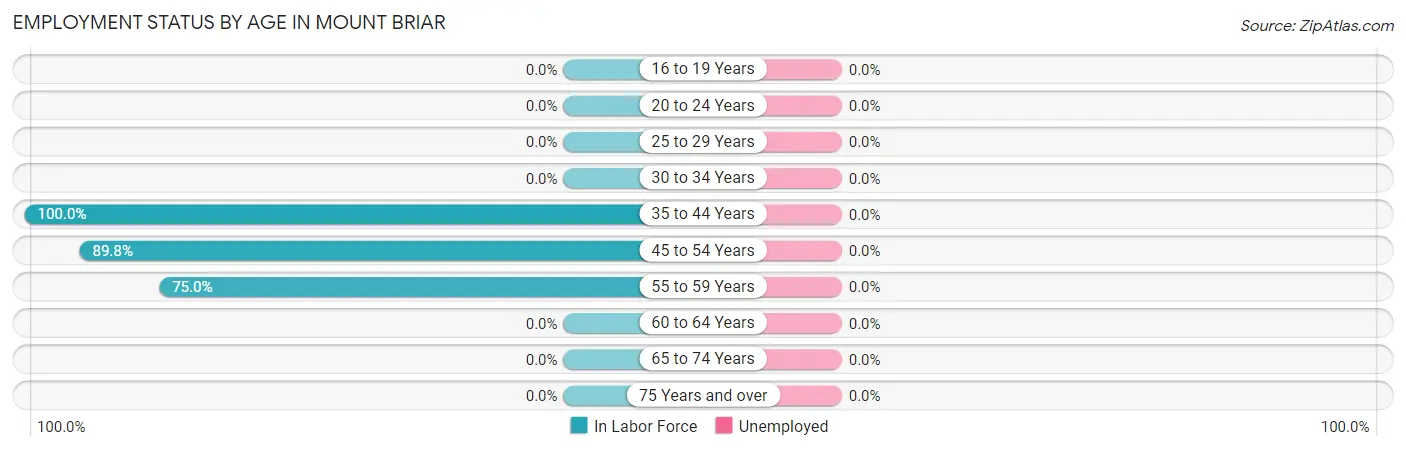
| Age Bracket | In Labor Force | Unemployed |
| 16 to 19 Years | 0 (0.0%) | 0 (0.0%) |
| 20 to 24 Years | 0 (0.0%) | 0 (0.0%) |
| 25 to 29 Years | 0 (0.0%) | 0 (0.0%) |
| 30 to 34 Years | 0 (0.0%) | 0 (0.0%) |
| 35 to 44 Years | 40 (100.0%) | 0 (0.0%) |
| 45 to 54 Years | 53 (89.8%) | 0 (0.0%) |
| 55 to 59 Years | 18 (75.0%) | 0 (0.0%) |
| 60 to 64 Years | 0 (0.0%) | 0 (0.0%) |
| 65 to 74 Years | 0 (0.0%) | 0 (0.0%) |
| 75 Years and over | 0 (0.0%) | 0 (0.0%) |
| Total | 111 (81.0%) | 0 (0.0%) |
Employment Status by Educational Attainment in Mount Briar
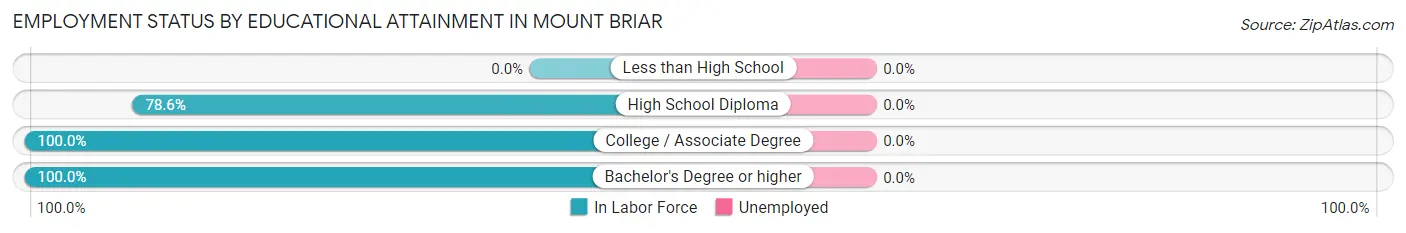
| Educational Attainment | In Labor Force | Unemployed |
| Less than High School | 0 (0.0%) | 0 (0.0%) |
| High School Diploma | 44 (78.6%) | 0 (0.0%) |
| College / Associate Degree | 40 (100.0%) | 0 (0.0%) |
| Bachelor's Degree or higher | 27 (100.0%) | 0 (0.0%) |
| Total | 111 (90.2%) | 0 (0.0%) |
Employment Occupations by Sex in Mount Briar
Management, Business, Science and Arts Occupations
The most common Management, Business, Science and Arts occupations in Mount Briar are Business & Financial (45 | 40.5%), and Management (40 | 36.0%).
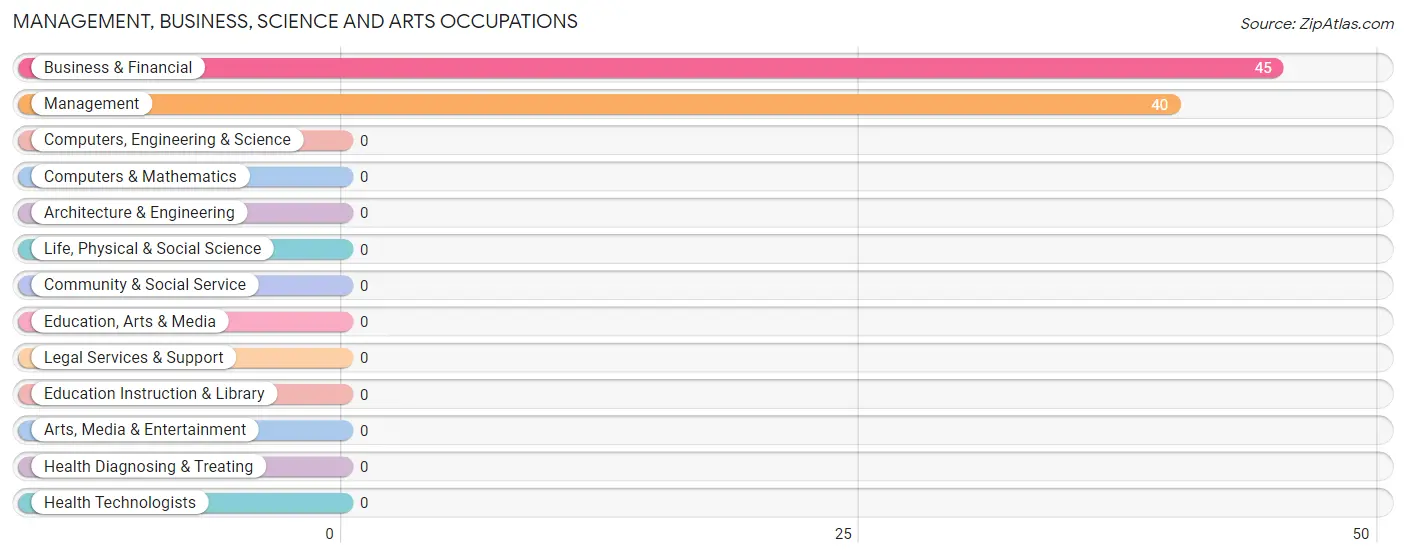
Management, Business, Science and Arts Occupations by Sex
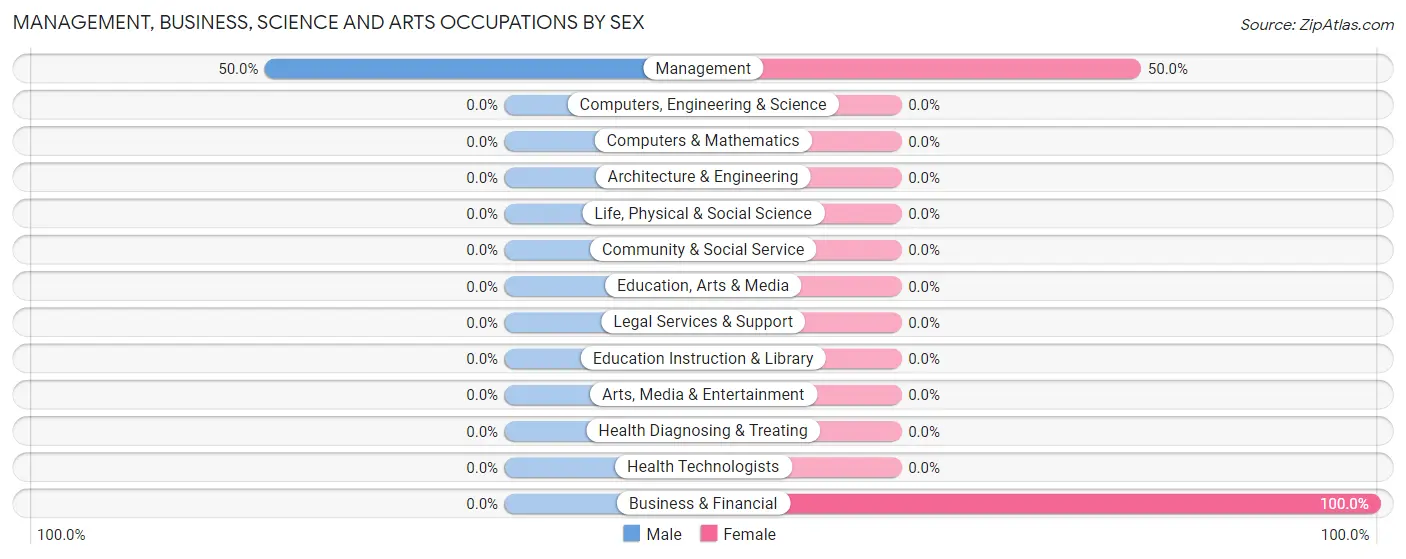
| Occupation | Male | Female |
| Management | 20 (50.0%) | 20 (50.0%) |
| Business & Financial | 0 (0.0%) | 45 (100.0%) |
| Computers, Engineering & Science | 0 (0.0%) | 0 (0.0%) |
| Computers & Mathematics | 0 (0.0%) | 0 (0.0%) |
| Architecture & Engineering | 0 (0.0%) | 0 (0.0%) |
| Life, Physical & Social Science | 0 (0.0%) | 0 (0.0%) |
| Community & Social Service | 0 (0.0%) | 0 (0.0%) |
| Education, Arts & Media | 0 (0.0%) | 0 (0.0%) |
| Legal Services & Support | 0 (0.0%) | 0 (0.0%) |
| Education Instruction & Library | 0 (0.0%) | 0 (0.0%) |
| Arts, Media & Entertainment | 0 (0.0%) | 0 (0.0%) |
| Health Diagnosing & Treating | 0 (0.0%) | 0 (0.0%) |
| Health Technologists | 0 (0.0%) | 0 (0.0%) |
| Total (Category) | 20 (23.5%) | 65 (76.5%) |
| Total (Overall) | 46 (41.4%) | 65 (58.6%) |
Services Occupations
Services Occupations by Sex
| Occupation | Male | Female |
| Healthcare Support | 0 (0.0%) | 0 (0.0%) |
| Security & Protection | 0 (0.0%) | 0 (0.0%) |
| Firefighting & Prevention | 0 (0.0%) | 0 (0.0%) |
| Law Enforcement | 0 (0.0%) | 0 (0.0%) |
| Food Preparation & Serving | 0 (0.0%) | 0 (0.0%) |
| Cleaning & Maintenance | 0 (0.0%) | 0 (0.0%) |
| Personal Care & Service | 0 (0.0%) | 0 (0.0%) |
| Total (Category) | 0 (0.0%) | 0 (0.0%) |
| Total (Overall) | 46 (41.4%) | 65 (58.6%) |
Sales and Office Occupations
Sales and Office Occupations by Sex
| Occupation | Male | Female |
| Sales & Related | 0 (0.0%) | 0 (0.0%) |
| Office & Administration | 0 (0.0%) | 0 (0.0%) |
| Total (Category) | 0 (0.0%) | 0 (0.0%) |
| Total (Overall) | 46 (41.4%) | 65 (58.6%) |
Natural Resources, Construction and Maintenance Occupations
Natural Resources, Construction and Maintenance Occupations by Sex
| Occupation | Male | Female |
| Farming, Fishing & Forestry | 0 (0.0%) | 0 (0.0%) |
| Construction & Extraction | 0 (0.0%) | 0 (0.0%) |
| Installation, Maintenance & Repair | 0 (0.0%) | 0 (0.0%) |
| Total (Category) | 0 (0.0%) | 0 (0.0%) |
| Total (Overall) | 46 (41.4%) | 65 (58.6%) |
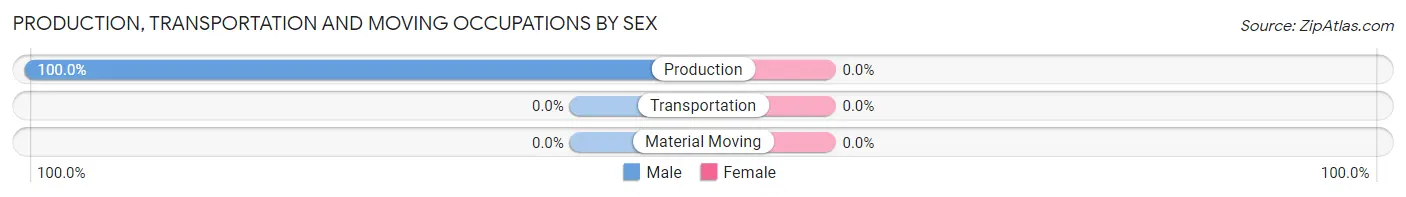
Production, Transportation and Moving Occupations
The most common Production, Transportation and Moving occupations in Mount Briar are , and Production (26 | 23.4%).
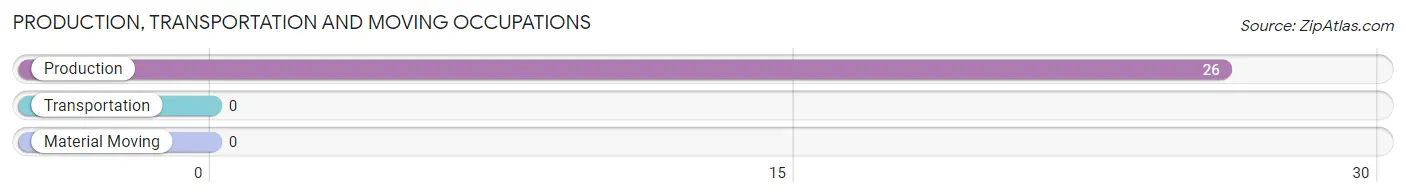
Production, Transportation and Moving Occupations by Sex
| Occupation | Male | Female |
| Production | 26 (100.0%) | 0 (0.0%) |
| Transportation | 0 (0.0%) | 0 (0.0%) |
| Material Moving | 0 (0.0%) | 0 (0.0%) |
| Total (Category) | 26 (100.0%) | 0 (0.0%) |
| Total (Overall) | 46 (41.4%) | 65 (58.6%) |
Employment Industries by Sex in Mount Briar
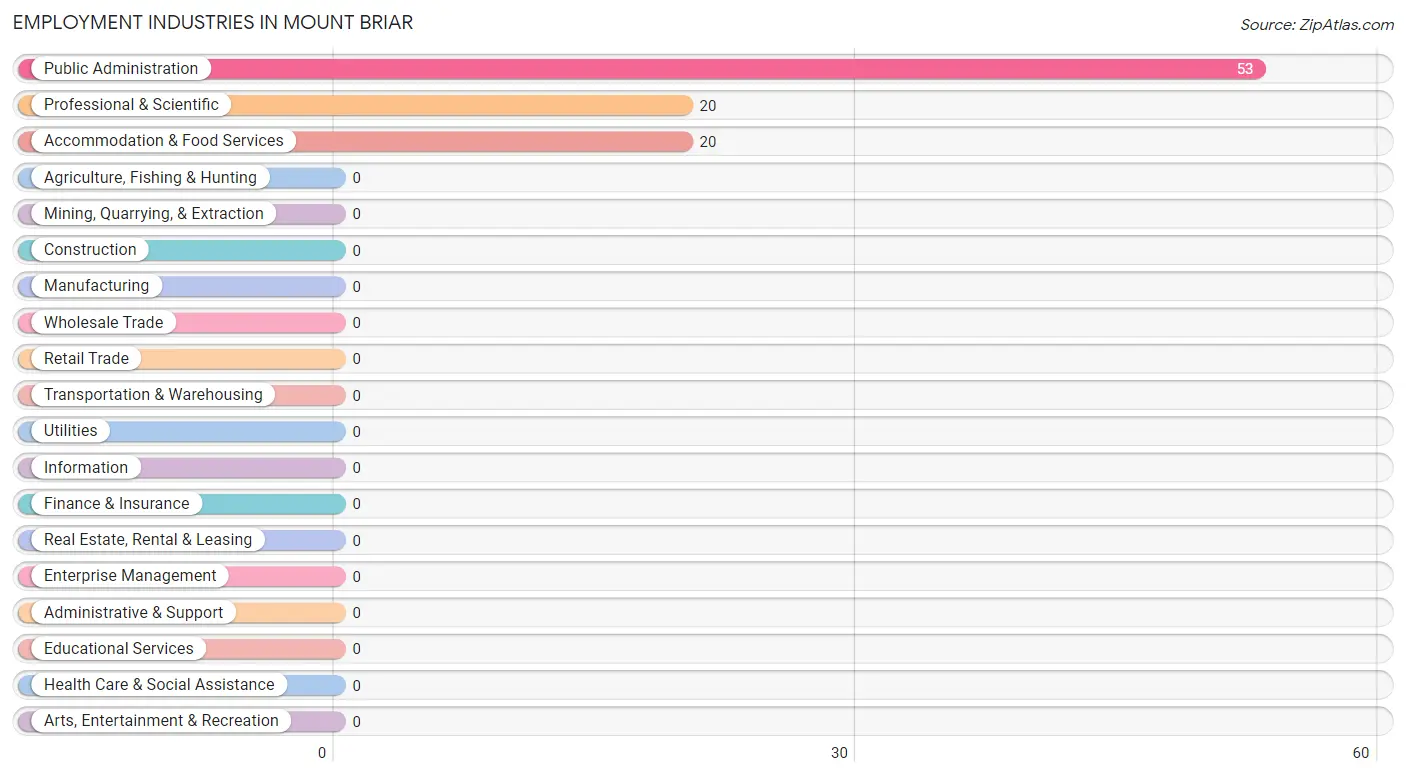
Employment Industries in Mount Briar
The major employment industries in Mount Briar include Public Administration (53 | 47.7%), Professional & Scientific (20 | 18.0%), and Accommodation & Food Services (20 | 18.0%).
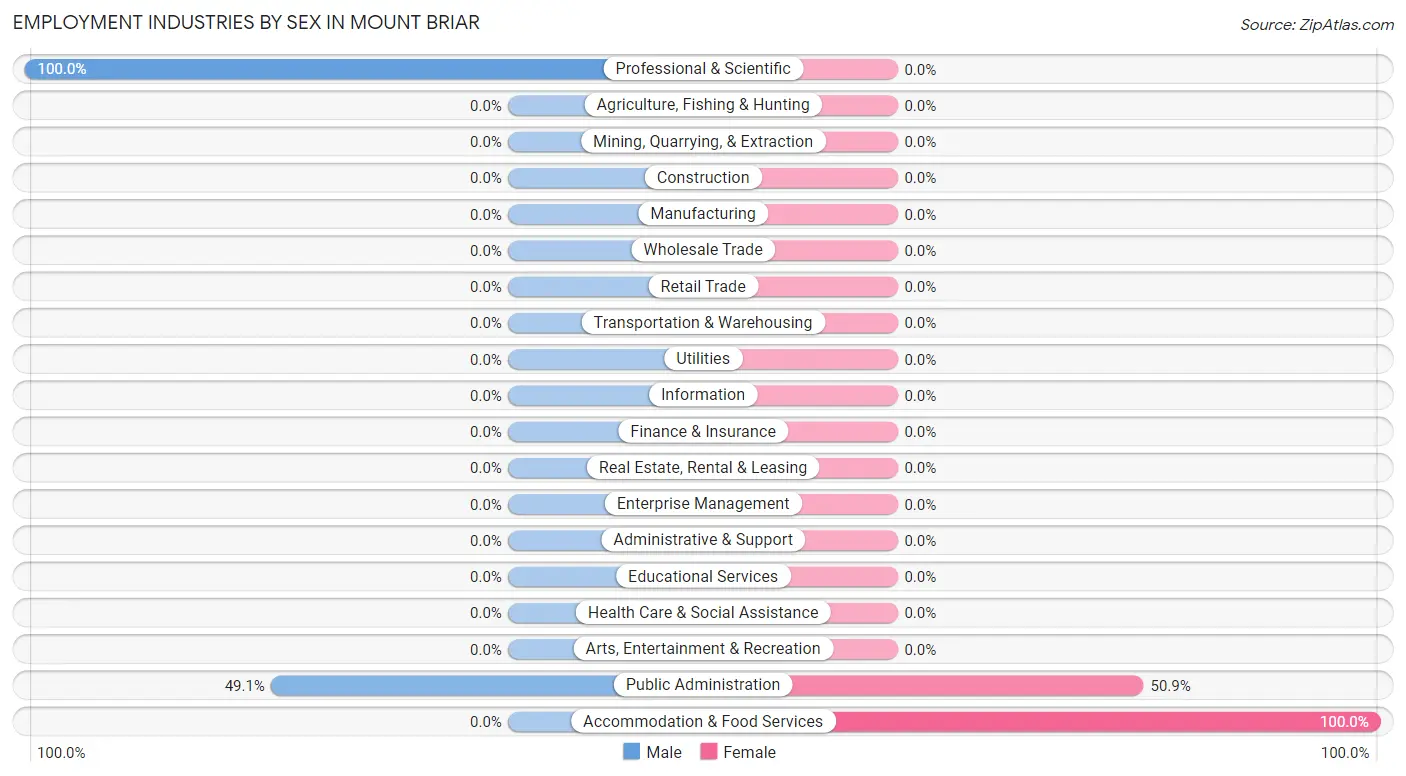
Employment Industries by Sex in Mount Briar
The Mount Briar industries that see more men than women are Professional & Scientific (100.0%), and Public Administration (49.1%), whereas the industries that tend to have a higher number of women are Accommodation & Food Services (100.0%), and Public Administration (50.9%).
| Industry | Male | Female |
| Agriculture, Fishing & Hunting | 0 (0.0%) | 0 (0.0%) |
| Mining, Quarrying, & Extraction | 0 (0.0%) | 0 (0.0%) |
| Construction | 0 (0.0%) | 0 (0.0%) |
| Manufacturing | 0 (0.0%) | 0 (0.0%) |
| Wholesale Trade | 0 (0.0%) | 0 (0.0%) |
| Retail Trade | 0 (0.0%) | 0 (0.0%) |
| Transportation & Warehousing | 0 (0.0%) | 0 (0.0%) |
| Utilities | 0 (0.0%) | 0 (0.0%) |
| Information | 0 (0.0%) | 0 (0.0%) |
| Finance & Insurance | 0 (0.0%) | 0 (0.0%) |
| Real Estate, Rental & Leasing | 0 (0.0%) | 0 (0.0%) |
| Professional & Scientific | 20 (100.0%) | 0 (0.0%) |
| Enterprise Management | 0 (0.0%) | 0 (0.0%) |
| Administrative & Support | 0 (0.0%) | 0 (0.0%) |
| Educational Services | 0 (0.0%) | 0 (0.0%) |
| Health Care & Social Assistance | 0 (0.0%) | 0 (0.0%) |
| Arts, Entertainment & Recreation | 0 (0.0%) | 0 (0.0%) |
| Accommodation & Food Services | 0 (0.0%) | 20 (100.0%) |
| Public Administration | 26 (49.1%) | 27 (50.9%) |
| Total | 46 (41.4%) | 65 (58.6%) |
Education in Mount Briar
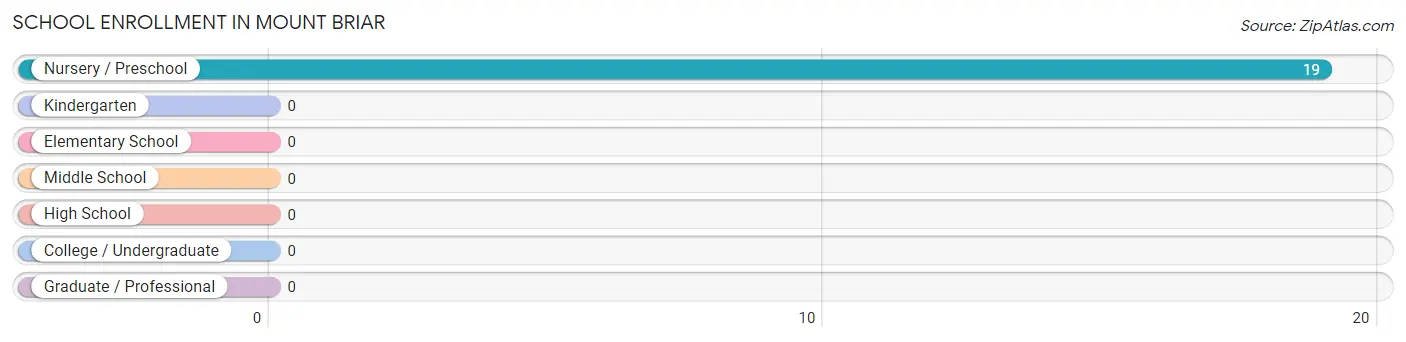
School Enrollment in Mount Briar
| School Level | # Students | % Students |
| Nursery / Preschool | 19 | 100.0% |
| Kindergarten | 0 | 0.0% |
| Elementary School | 0 | 0.0% |
| Middle School | 0 | 0.0% |
| High School | 0 | 0.0% |
| College / Undergraduate | 0 | 0.0% |
| Graduate / Professional | 0 | 0.0% |
| Total | 19 | 100.0% |
School Enrollment by Age by Funding Source in Mount Briar
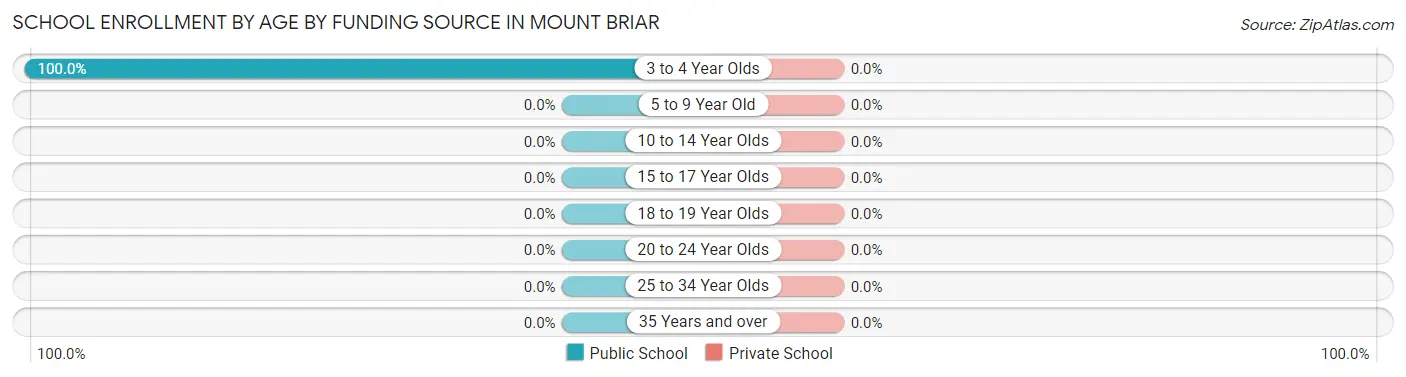
| Age Bracket | Public School | Private School |
| 3 to 4 Year Olds | 19 (100.0%) | 0 (0.0%) |
| 5 to 9 Year Old | 0 (0.0%) | 0 (0.0%) |
| 10 to 14 Year Olds | 0 (0.0%) | 0 (0.0%) |
| 15 to 17 Year Olds | 0 (0.0%) | 0 (0.0%) |
| 18 to 19 Year Olds | 0 (0.0%) | 0 (0.0%) |
| 20 to 24 Year Olds | 0 (0.0%) | 0 (0.0%) |
| 25 to 34 Year Olds | 0 (0.0%) | 0 (0.0%) |
| 35 Years and over | 0 (0.0%) | 0 (0.0%) |
| Total | 19 (100.0%) | 0 (0.0%) |
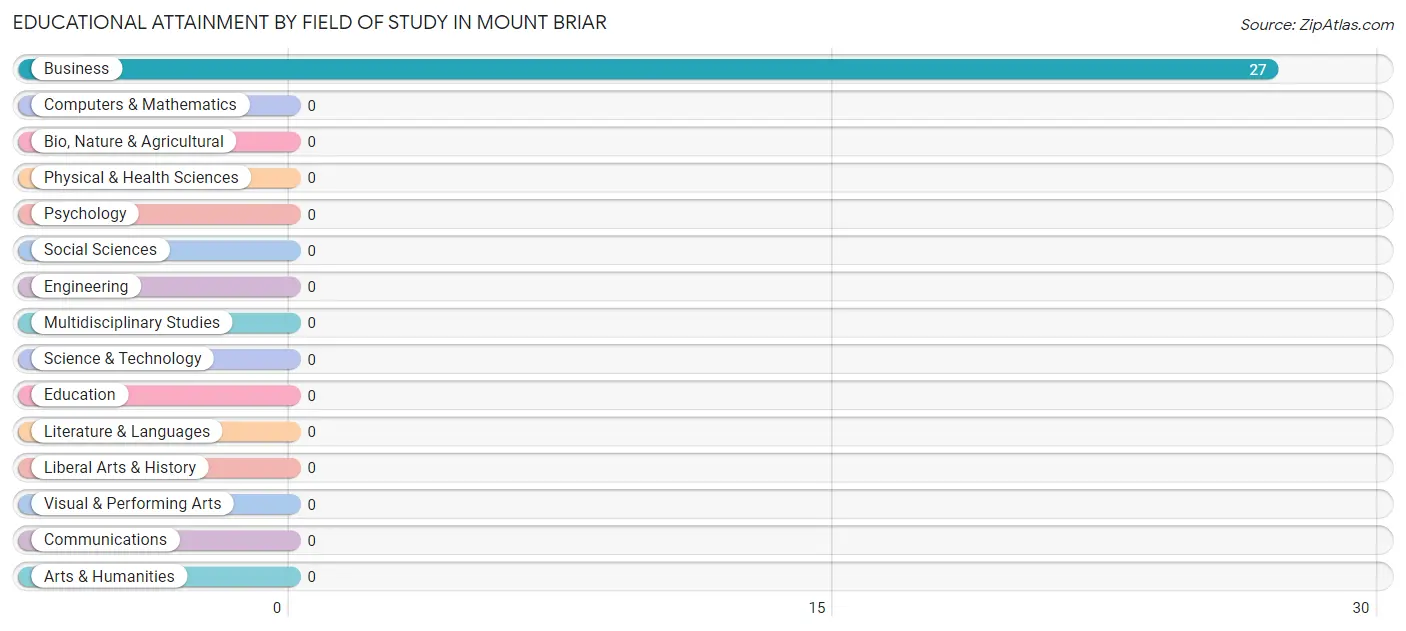
Educational Attainment by Field of Study in Mount Briar
, and business (27 | 100.0%) are the most common fields of study among 27 individuals in Mount Briar who have obtained a bachelor's degree or higher.
| Field of Study | # Graduates | % Graduates |
| Computers & Mathematics | 0 | 0.0% |
| Bio, Nature & Agricultural | 0 | 0.0% |
| Physical & Health Sciences | 0 | 0.0% |
| Psychology | 0 | 0.0% |
| Social Sciences | 0 | 0.0% |
| Engineering | 0 | 0.0% |
| Multidisciplinary Studies | 0 | 0.0% |
| Science & Technology | 0 | 0.0% |
| Business | 27 | 100.0% |
| Education | 0 | 0.0% |
| Literature & Languages | 0 | 0.0% |
| Liberal Arts & History | 0 | 0.0% |
| Visual & Performing Arts | 0 | 0.0% |
| Communications | 0 | 0.0% |
| Arts & Humanities | 0 | 0.0% |
| Total | 27 | 100.0% |
Transportation & Commute in Mount Briar
Vehicle Availability by Sex in Mount Briar
The most prevalent vehicle ownership categories in Mount Briar are males with 4 vehicles (26, accounting for 56.5%) and females with 4 vehicles (27, making up 40.0%).
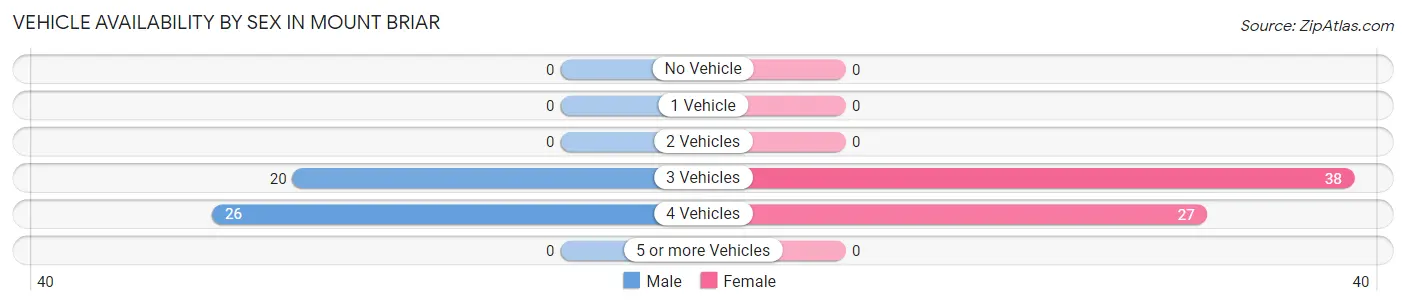
| Vehicles Available | Male | Female |
| No Vehicle | 0 (0.0%) | 0 (0.0%) |
| 1 Vehicle | 0 (0.0%) | 0 (0.0%) |
| 2 Vehicles | 0 (0.0%) | 0 (0.0%) |
| 3 Vehicles | 20 (43.5%) | 38 (58.5%) |
| 4 Vehicles | 26 (56.5%) | 27 (41.5%) |
| 5 or more Vehicles | 0 (0.0%) | 0 (0.0%) |
| Total | 46 (100.0%) | 65 (100.0%) |
Commute Time in Mount Briar
The most frequently occuring commute durations in Mount Briar are 45 to 59 minutes (46 commuters, 54.8%), 25 to 29 minutes (20 commuters, 23.8%), and 60 to 89 minutes (18 commuters, 21.4%).
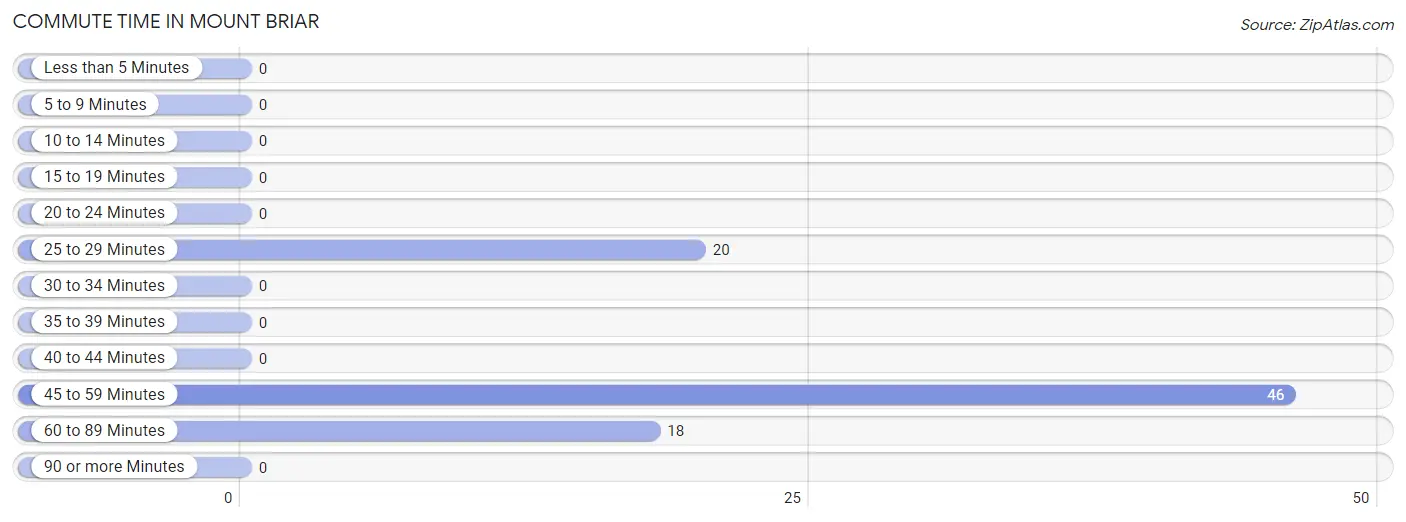
| Commute Time | # Commuters | % Commuters |
| Less than 5 Minutes | 0 | 0.0% |
| 5 to 9 Minutes | 0 | 0.0% |
| 10 to 14 Minutes | 0 | 0.0% |
| 15 to 19 Minutes | 0 | 0.0% |
| 20 to 24 Minutes | 0 | 0.0% |
| 25 to 29 Minutes | 20 | 23.8% |
| 30 to 34 Minutes | 0 | 0.0% |
| 35 to 39 Minutes | 0 | 0.0% |
| 40 to 44 Minutes | 0 | 0.0% |
| 45 to 59 Minutes | 46 | 54.8% |
| 60 to 89 Minutes | 18 | 21.4% |
| 90 or more Minutes | 0 | 0.0% |
Commute Time by Sex in Mount Briar
The most common commute times in Mount Briar are 45 to 59 minutes (46 commuters, 100.0%) for males and 25 to 29 minutes (20 commuters, 52.6%) for females.
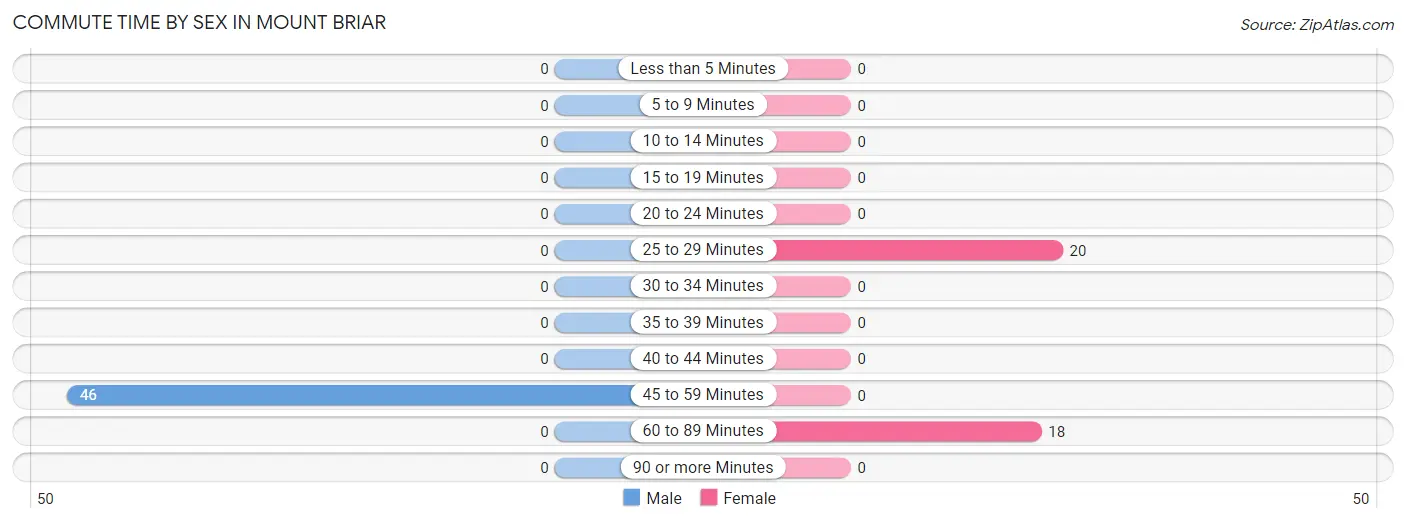
| Commute Time | Male | Female |
| Less than 5 Minutes | 0 (0.0%) | 0 (0.0%) |
| 5 to 9 Minutes | 0 (0.0%) | 0 (0.0%) |
| 10 to 14 Minutes | 0 (0.0%) | 0 (0.0%) |
| 15 to 19 Minutes | 0 (0.0%) | 0 (0.0%) |
| 20 to 24 Minutes | 0 (0.0%) | 0 (0.0%) |
| 25 to 29 Minutes | 0 (0.0%) | 20 (52.6%) |
| 30 to 34 Minutes | 0 (0.0%) | 0 (0.0%) |
| 35 to 39 Minutes | 0 (0.0%) | 0 (0.0%) |
| 40 to 44 Minutes | 0 (0.0%) | 0 (0.0%) |
| 45 to 59 Minutes | 46 (100.0%) | 0 (0.0%) |
| 60 to 89 Minutes | 0 (0.0%) | 18 (47.4%) |
| 90 or more Minutes | 0 (0.0%) | 0 (0.0%) |
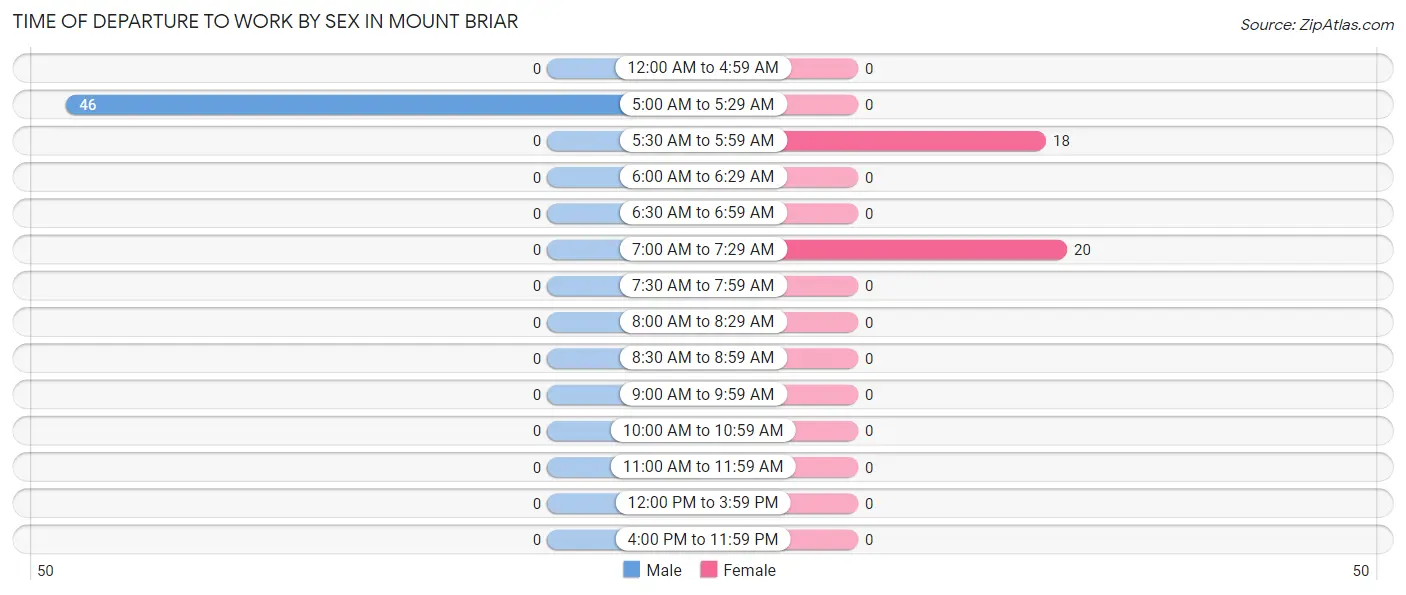
Time of Departure to Work by Sex in Mount Briar
The most frequent times of departure to work in Mount Briar are 5:00 AM to 5:29 AM (46, 100.0%) for males and 7:00 AM to 7:29 AM (20, 52.6%) for females.
| Time of Departure | Male | Female |
| 12:00 AM to 4:59 AM | 0 (0.0%) | 0 (0.0%) |
| 5:00 AM to 5:29 AM | 46 (100.0%) | 0 (0.0%) |
| 5:30 AM to 5:59 AM | 0 (0.0%) | 18 (47.4%) |
| 6:00 AM to 6:29 AM | 0 (0.0%) | 0 (0.0%) |
| 6:30 AM to 6:59 AM | 0 (0.0%) | 0 (0.0%) |
| 7:00 AM to 7:29 AM | 0 (0.0%) | 20 (52.6%) |
| 7:30 AM to 7:59 AM | 0 (0.0%) | 0 (0.0%) |
| 8:00 AM to 8:29 AM | 0 (0.0%) | 0 (0.0%) |
| 8:30 AM to 8:59 AM | 0 (0.0%) | 0 (0.0%) |
| 9:00 AM to 9:59 AM | 0 (0.0%) | 0 (0.0%) |
| 10:00 AM to 10:59 AM | 0 (0.0%) | 0 (0.0%) |
| 11:00 AM to 11:59 AM | 0 (0.0%) | 0 (0.0%) |
| 12:00 PM to 3:59 PM | 0 (0.0%) | 0 (0.0%) |
| 4:00 PM to 11:59 PM | 0 (0.0%) | 0 (0.0%) |
| Total | 46 (100.0%) | 38 (100.0%) |
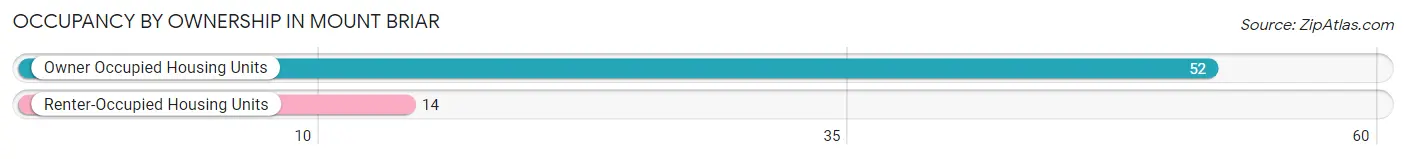
Housing Occupancy in Mount Briar
Occupancy by Ownership in Mount Briar
Of the total 66 dwellings in Mount Briar, owner-occupied units account for 52 (78.8%), while renter-occupied units make up 14 (21.2%).
| Occupancy | # Housing Units | % Housing Units |
| Owner Occupied Housing Units | 52 | 78.8% |
| Renter-Occupied Housing Units | 14 | 21.2% |
| Total Occupied Housing Units | 66 | 100.0% |
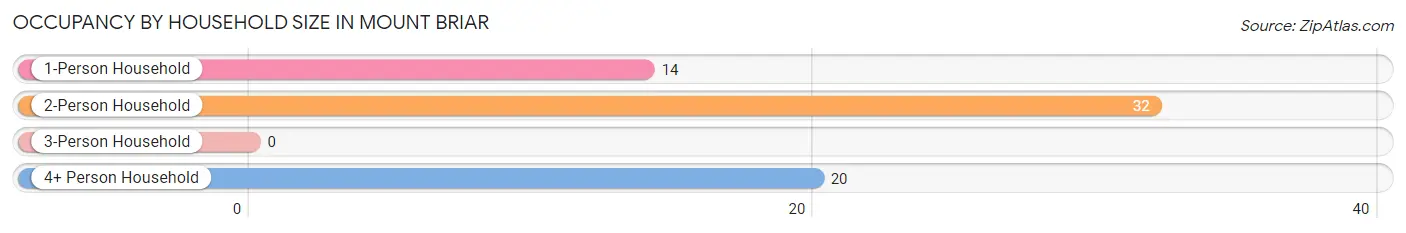
Occupancy by Household Size in Mount Briar
| Household Size | # Housing Units | % Housing Units |
| 1-Person Household | 14 | 21.2% |
| 2-Person Household | 32 | 48.5% |
| 3-Person Household | 0 | 0.0% |
| 4+ Person Household | 20 | 30.3% |
| Total Housing Units | 66 | 100.0% |
Occupancy by Ownership by Household Size in Mount Briar
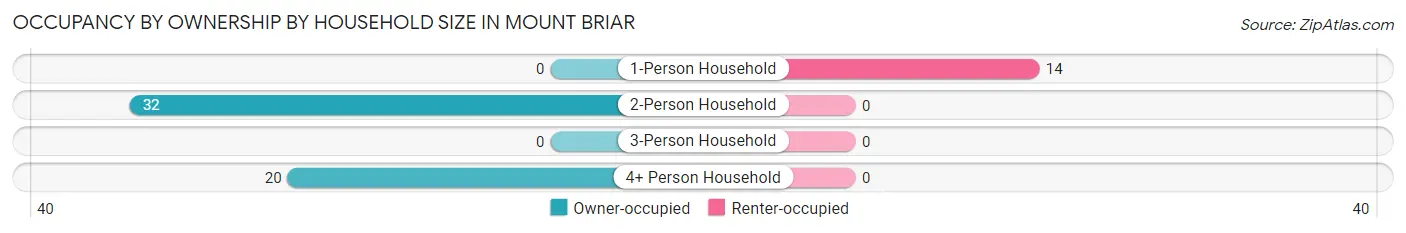
| Household Size | Owner-occupied | Renter-occupied |
| 1-Person Household | 0 (0.0%) | 14 (100.0%) |
| 2-Person Household | 32 (100.0%) | 0 (0.0%) |
| 3-Person Household | 0 (0.0%) | 0 (0.0%) |
| 4+ Person Household | 20 (100.0%) | 0 (0.0%) |
| Total Housing Units | 52 (78.8%) | 14 (21.2%) |
Occupancy by Educational Attainment in Mount Briar
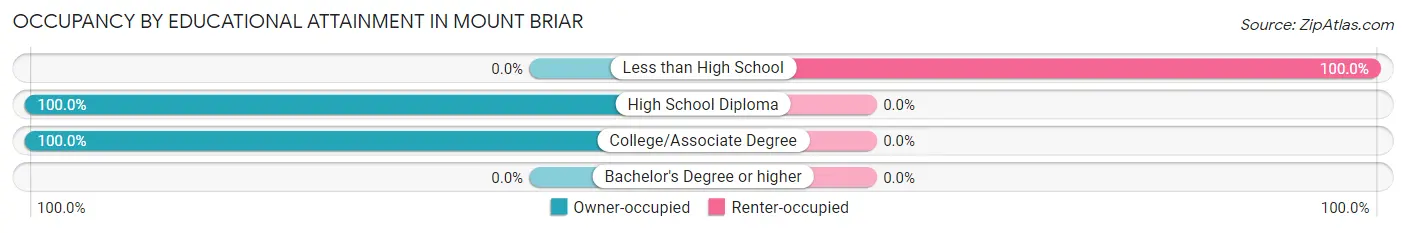
| Household Size | Owner-occupied | Renter-occupied |
| Less than High School | 0 (0.0%) | 14 (100.0%) |
| High School Diploma | 32 (100.0%) | 0 (0.0%) |
| College/Associate Degree | 20 (100.0%) | 0 (0.0%) |
| Bachelor's Degree or higher | 0 (0.0%) | 0 (0.0%) |
Occupancy by Age of Householder in Mount Briar
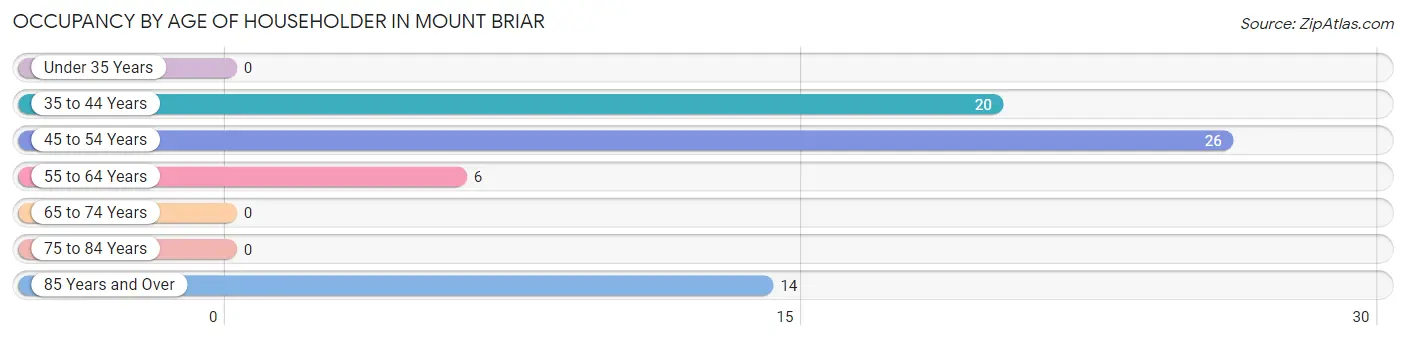
| Age Bracket | # Households | % Households |
| Under 35 Years | 0 | 0.0% |
| 35 to 44 Years | 20 | 30.3% |
| 45 to 54 Years | 26 | 39.4% |
| 55 to 64 Years | 6 | 9.1% |
| 65 to 74 Years | 0 | 0.0% |
| 75 to 84 Years | 0 | 0.0% |
| 85 Years and Over | 14 | 21.2% |
| Total | 66 | 100.0% |
Housing Finances in Mount Briar
Median Income by Occupancy in Mount Briar
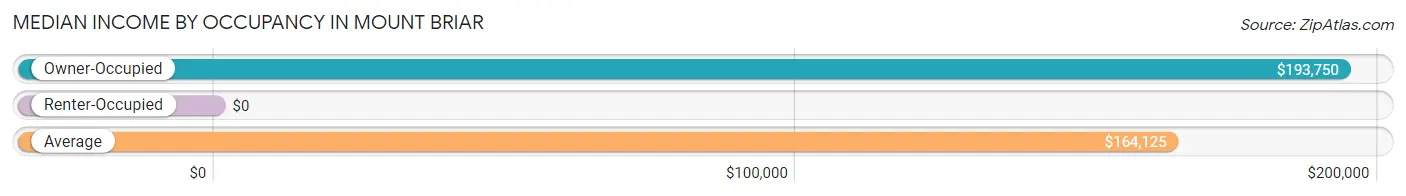
| Occupancy Type | # Households | Median Income |
| Owner-Occupied | 52 (78.8%) | $193,750 |
| Renter-Occupied | 14 (21.2%) | $0 |
| Average | 66 (100.0%) | $164,125 |
Occupancy by Householder Income Bracket in Mount Briar
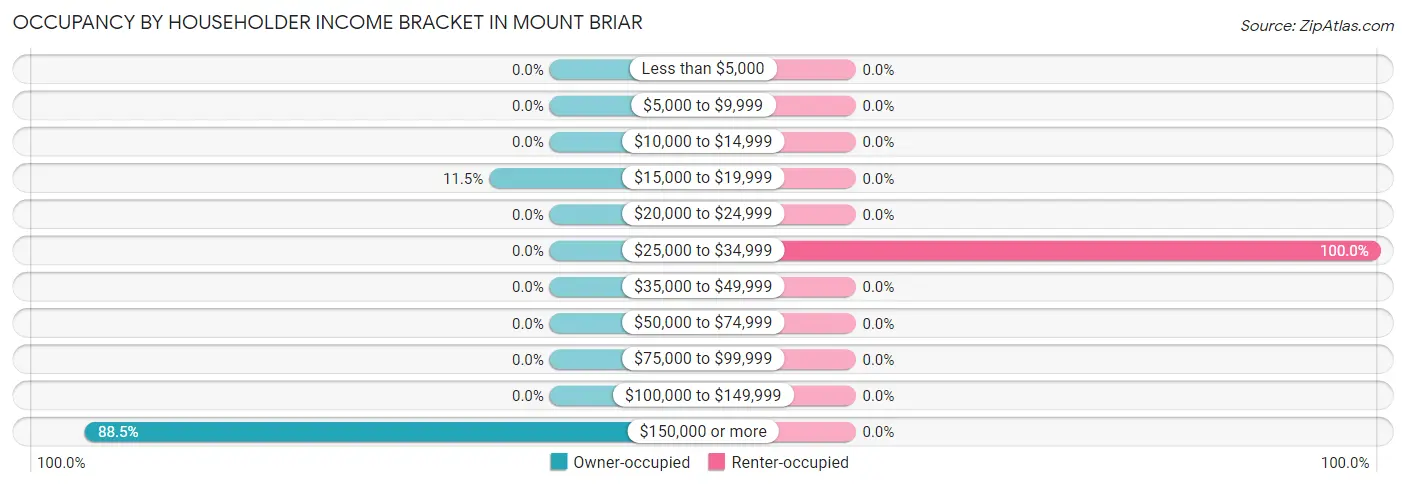
| Income Bracket | Owner-occupied | Renter-occupied |
| Less than $5,000 | 0 (0.0%) | 0 (0.0%) |
| $5,000 to $9,999 | 0 (0.0%) | 0 (0.0%) |
| $10,000 to $14,999 | 0 (0.0%) | 0 (0.0%) |
| $15,000 to $19,999 | 6 (11.5%) | 0 (0.0%) |
| $20,000 to $24,999 | 0 (0.0%) | 0 (0.0%) |
| $25,000 to $34,999 | 0 (0.0%) | 14 (100.0%) |
| $35,000 to $49,999 | 0 (0.0%) | 0 (0.0%) |
| $50,000 to $74,999 | 0 (0.0%) | 0 (0.0%) |
| $75,000 to $99,999 | 0 (0.0%) | 0 (0.0%) |
| $100,000 to $149,999 | 0 (0.0%) | 0 (0.0%) |
| $150,000 or more | 46 (88.5%) | 0 (0.0%) |
| Total | 52 (100.0%) | 14 (100.0%) |
Monthly Housing Cost Tiers in Mount Briar
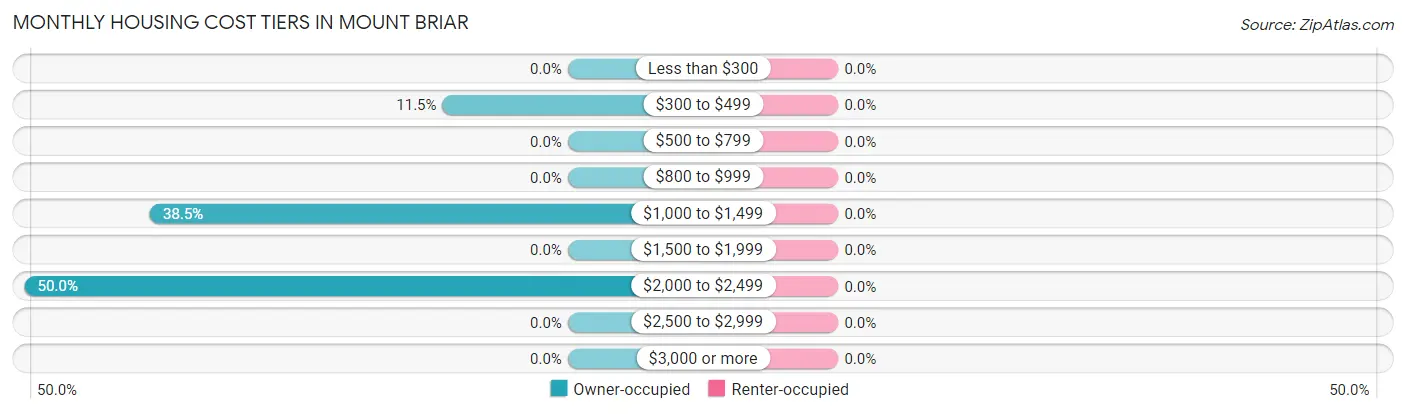
| Monthly Cost | Owner-occupied | Renter-occupied |
| Less than $300 | 0 (0.0%) | 0 (0.0%) |
| $300 to $499 | 6 (11.5%) | 0 (0.0%) |
| $500 to $799 | 0 (0.0%) | 0 (0.0%) |
| $800 to $999 | 0 (0.0%) | 0 (0.0%) |
| $1,000 to $1,499 | 20 (38.5%) | 0 (0.0%) |
| $1,500 to $1,999 | 0 (0.0%) | 0 (0.0%) |
| $2,000 to $2,499 | 26 (50.0%) | 0 (0.0%) |
| $2,500 to $2,999 | 0 (0.0%) | 0 (0.0%) |
| $3,000 or more | 0 (0.0%) | 0 (0.0%) |
| Total | 52 (100.0%) | 14 (100.0%) |
Physical Housing Characteristics in Mount Briar
Housing Structures in Mount Briar
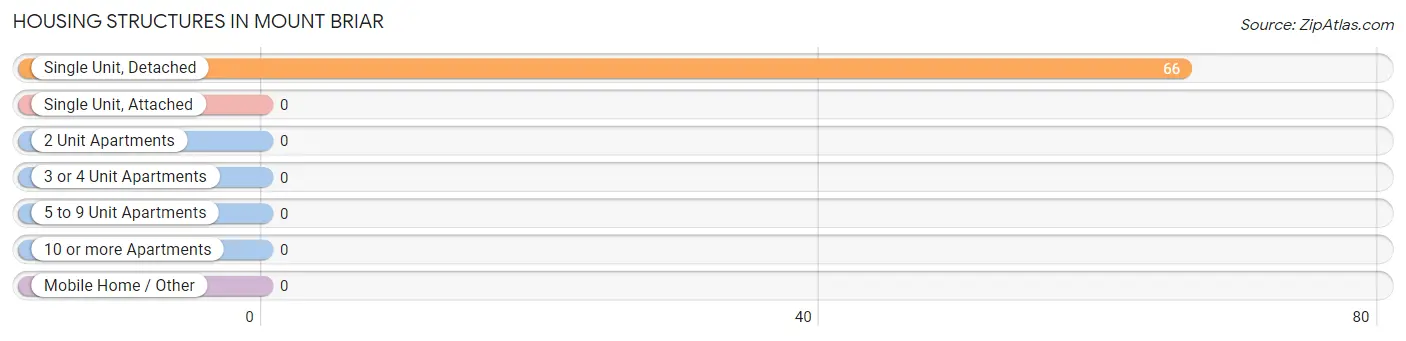
| Structure Type | # Housing Units | % Housing Units |
| Single Unit, Detached | 66 | 100.0% |
| Single Unit, Attached | 0 | 0.0% |
| 2 Unit Apartments | 0 | 0.0% |
| 3 or 4 Unit Apartments | 0 | 0.0% |
| 5 to 9 Unit Apartments | 0 | 0.0% |
| 10 or more Apartments | 0 | 0.0% |
| Mobile Home / Other | 0 | 0.0% |
| Total | 66 | 100.0% |
Housing Structures by Occupancy in Mount Briar
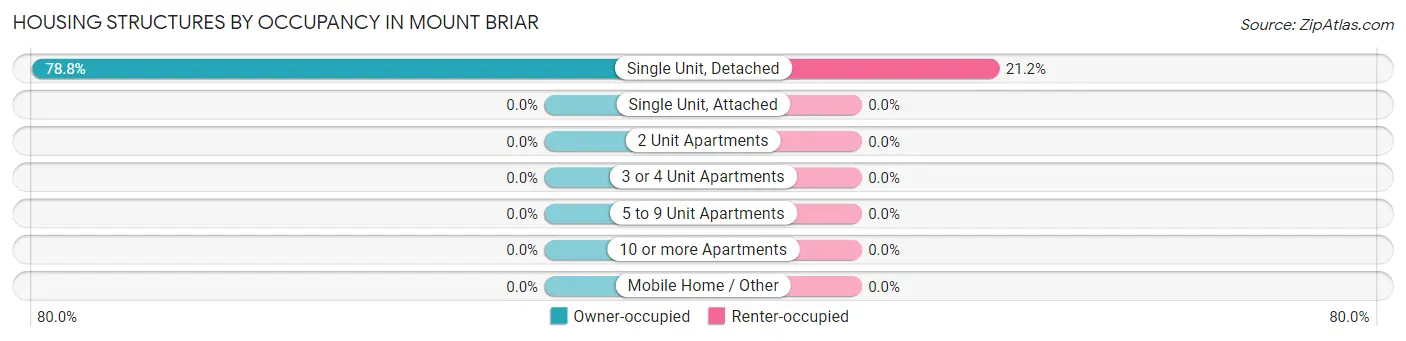
| Structure Type | Owner-occupied | Renter-occupied |
| Single Unit, Detached | 52 (78.8%) | 14 (21.2%) |
| Single Unit, Attached | 0 (0.0%) | 0 (0.0%) |
| 2 Unit Apartments | 0 (0.0%) | 0 (0.0%) |
| 3 or 4 Unit Apartments | 0 (0.0%) | 0 (0.0%) |
| 5 to 9 Unit Apartments | 0 (0.0%) | 0 (0.0%) |
| 10 or more Apartments | 0 (0.0%) | 0 (0.0%) |
| Mobile Home / Other | 0 (0.0%) | 0 (0.0%) |
| Total | 52 (78.8%) | 14 (21.2%) |
Housing Structures by Number of Rooms in Mount Briar
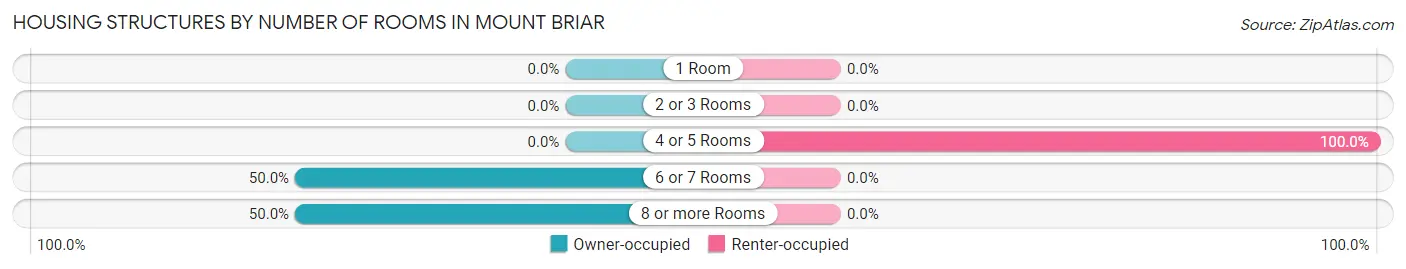
| Number of Rooms | Owner-occupied | Renter-occupied |
| 1 Room | 0 (0.0%) | 0 (0.0%) |
| 2 or 3 Rooms | 0 (0.0%) | 0 (0.0%) |
| 4 or 5 Rooms | 0 (0.0%) | 14 (100.0%) |
| 6 or 7 Rooms | 26 (50.0%) | 0 (0.0%) |
| 8 or more Rooms | 26 (50.0%) | 0 (0.0%) |
| Total | 52 (100.0%) | 14 (100.0%) |
Housing Structure by Heating Type in Mount Briar
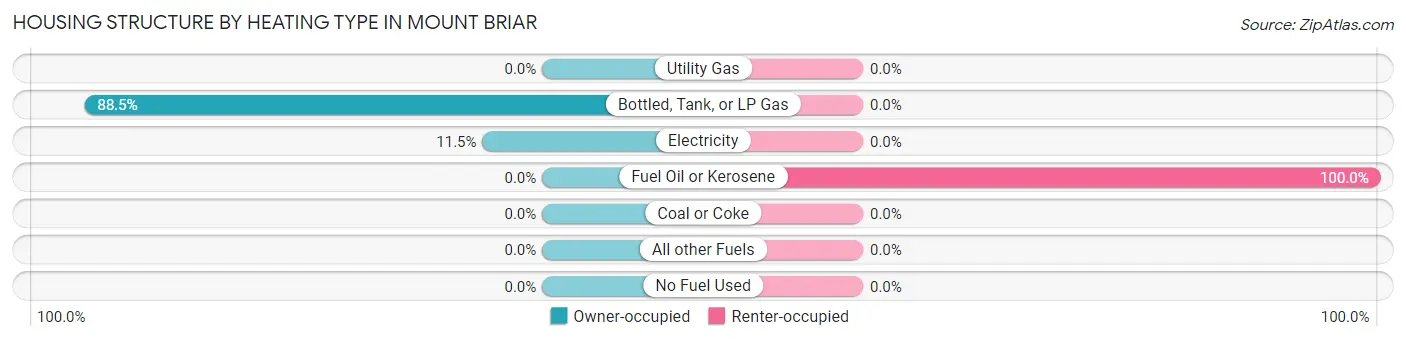
| Heating Type | Owner-occupied | Renter-occupied |
| Utility Gas | 0 (0.0%) | 0 (0.0%) |
| Bottled, Tank, or LP Gas | 46 (88.5%) | 0 (0.0%) |
| Electricity | 6 (11.5%) | 0 (0.0%) |
| Fuel Oil or Kerosene | 0 (0.0%) | 14 (100.0%) |
| Coal or Coke | 0 (0.0%) | 0 (0.0%) |
| All other Fuels | 0 (0.0%) | 0 (0.0%) |
| No Fuel Used | 0 (0.0%) | 0 (0.0%) |
| Total | 52 (100.0%) | 14 (100.0%) |
Household Vehicle Usage in Mount Briar
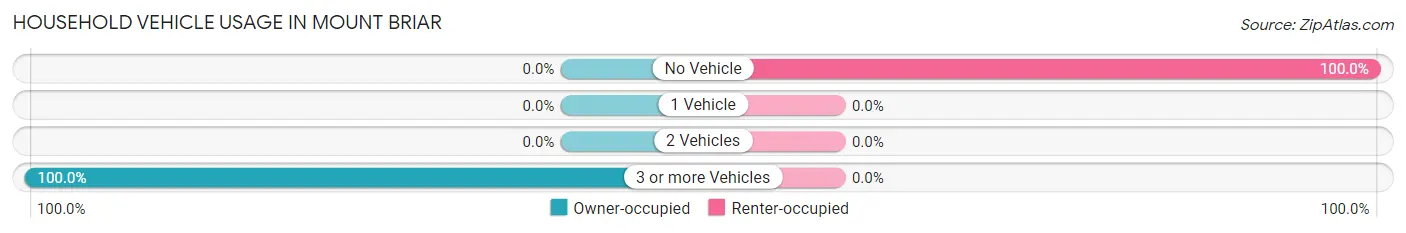
| Vehicles per Household | Owner-occupied | Renter-occupied |
| No Vehicle | 0 (0.0%) | 14 (100.0%) |
| 1 Vehicle | 0 (0.0%) | 0 (0.0%) |
| 2 Vehicles | 0 (0.0%) | 0 (0.0%) |
| 3 or more Vehicles | 52 (100.0%) | 0 (0.0%) |
| Total | 52 (100.0%) | 14 (100.0%) |
Real Estate & Mortgages in Mount Briar
Real Estate and Mortgage Overview in Mount Briar
| Characteristic | Without Mortgage | With Mortgage |
| Housing Units | 6 | 46 |
| Median Property Value | - | - |
| Median Household Income | - | - |
| Monthly Housing Costs | - | - |
| Real Estate Taxes | - | - |
Property Value by Mortgage Status in Mount Briar
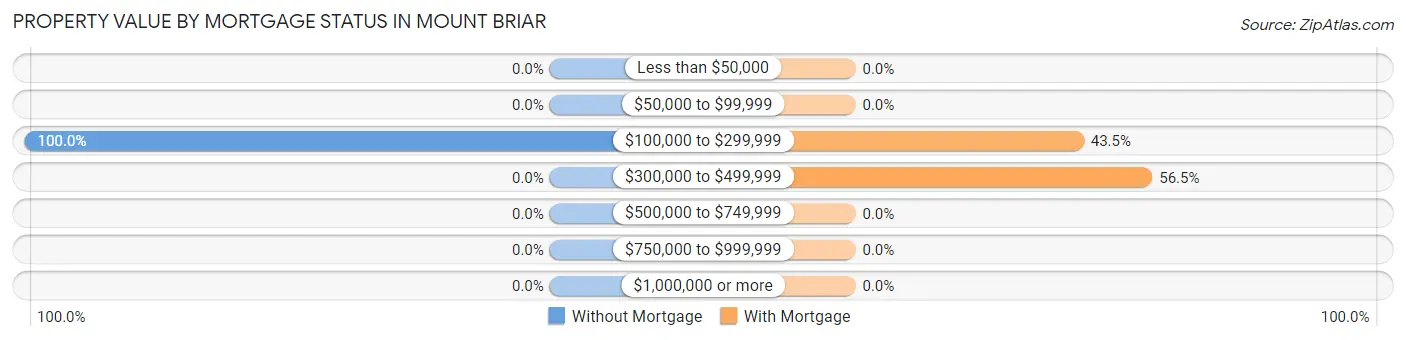
| Property Value | Without Mortgage | With Mortgage |
| Less than $50,000 | 0 (0.0%) | 0 (0.0%) |
| $50,000 to $99,999 | 0 (0.0%) | 0 (0.0%) |
| $100,000 to $299,999 | 6 (100.0%) | 20 (43.5%) |
| $300,000 to $499,999 | 0 (0.0%) | 26 (56.5%) |
| $500,000 to $749,999 | 0 (0.0%) | 0 (0.0%) |
| $750,000 to $999,999 | 0 (0.0%) | 0 (0.0%) |
| $1,000,000 or more | 0 (0.0%) | 0 (0.0%) |
| Total | 6 (100.0%) | 46 (100.0%) |
Household Income by Mortgage Status in Mount Briar
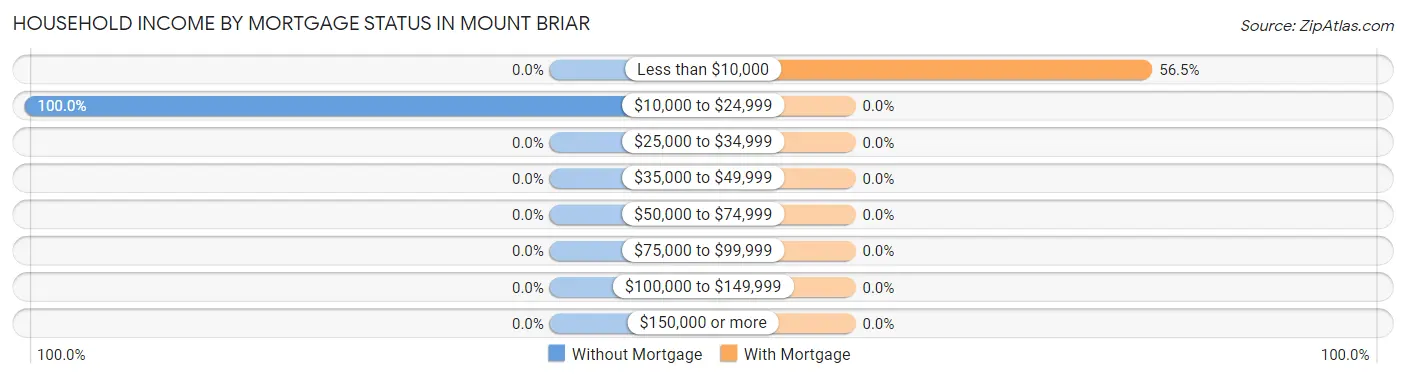
| Household Income | Without Mortgage | With Mortgage |
| Less than $10,000 | 0 (0.0%) | 26 (56.5%) |
| $10,000 to $24,999 | 6 (100.0%) | 0 (0.0%) |
| $25,000 to $34,999 | 0 (0.0%) | 0 (0.0%) |
| $35,000 to $49,999 | 0 (0.0%) | 0 (0.0%) |
| $50,000 to $74,999 | 0 (0.0%) | 0 (0.0%) |
| $75,000 to $99,999 | 0 (0.0%) | 0 (0.0%) |
| $100,000 to $149,999 | 0 (0.0%) | 0 (0.0%) |
| $150,000 or more | 0 (0.0%) | 0 (0.0%) |
| Total | 6 (100.0%) | 46 (100.0%) |
Property Value to Household Income Ratio in Mount Briar
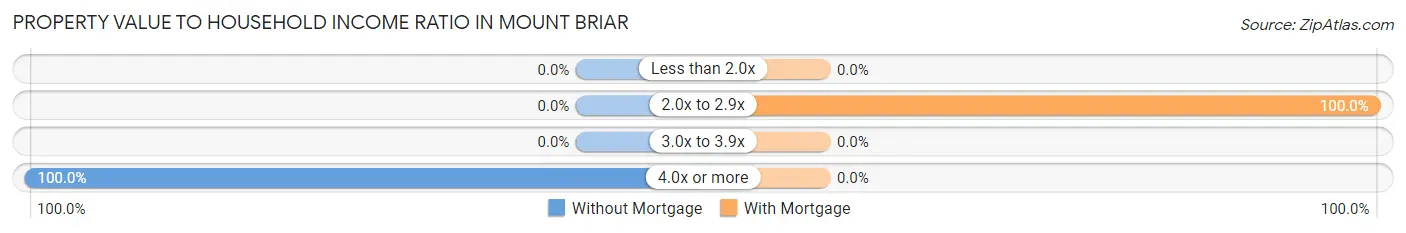
| Value-to-Income Ratio | Without Mortgage | With Mortgage |
| Less than 2.0x | 0 (0.0%) | 0 (0.0%) |
| 2.0x to 2.9x | 0 (0.0%) | 46 (100.0%) |
| 3.0x to 3.9x | 0 (0.0%) | 0 (0.0%) |
| 4.0x or more | 6 (100.0%) | 0 (0.0%) |
| Total | 6 (100.0%) | 46 (100.0%) |
Real Estate Taxes by Mortgage Status in Mount Briar
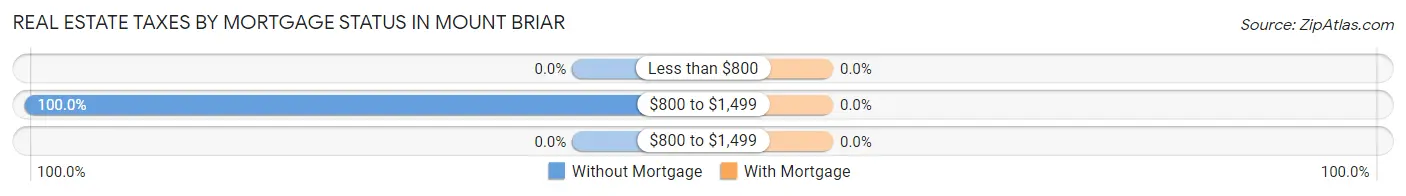
| Property Taxes | Without Mortgage | With Mortgage |
| Less than $800 | 0 (0.0%) | 0 (0.0%) |
| $800 to $1,499 | 6 (100.0%) | 0 (0.0%) |
| $800 to $1,499 | 0 (0.0%) | 0 (0.0%) |
| Total | 6 (100.0%) | 46 (100.0%) |
Health & Disability in Mount Briar
Health Insurance Coverage by Age in Mount Briar
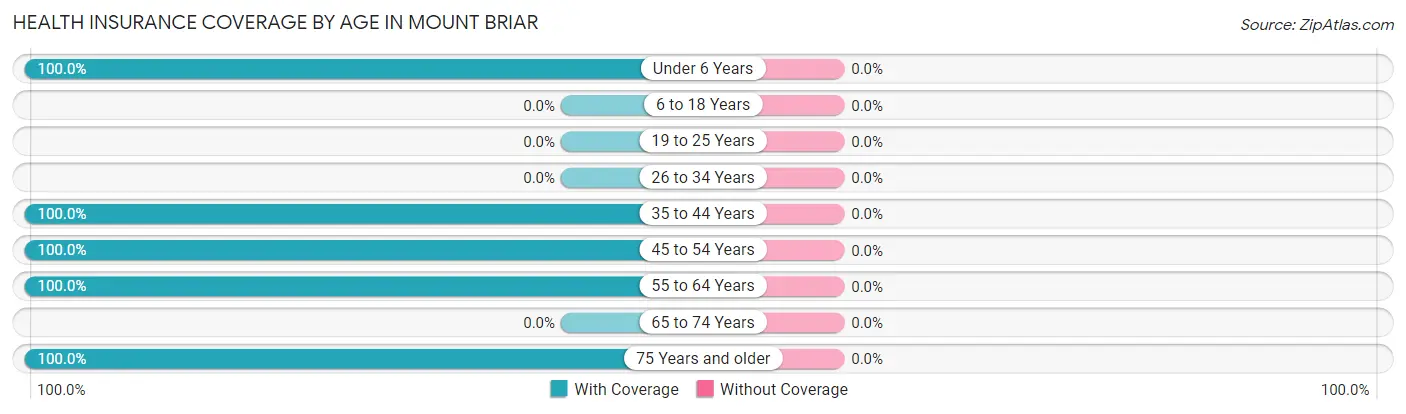
| Age Bracket | With Coverage | Without Coverage |
| Under 6 Years | 38 (100.0%) | 0 (0.0%) |
| 6 to 18 Years | 0 (0.0%) | 0 (0.0%) |
| 19 to 25 Years | 0 (0.0%) | 0 (0.0%) |
| 26 to 34 Years | 0 (0.0%) | 0 (0.0%) |
| 35 to 44 Years | 40 (100.0%) | 0 (0.0%) |
| 45 to 54 Years | 59 (100.0%) | 0 (0.0%) |
| 55 to 64 Years | 24 (100.0%) | 0 (0.0%) |
| 65 to 74 Years | 0 (0.0%) | 0 (0.0%) |
| 75 Years and older | 14 (100.0%) | 0 (0.0%) |
| Total | 175 (100.0%) | 0 (0.0%) |
Health Insurance Coverage by Citizenship Status in Mount Briar
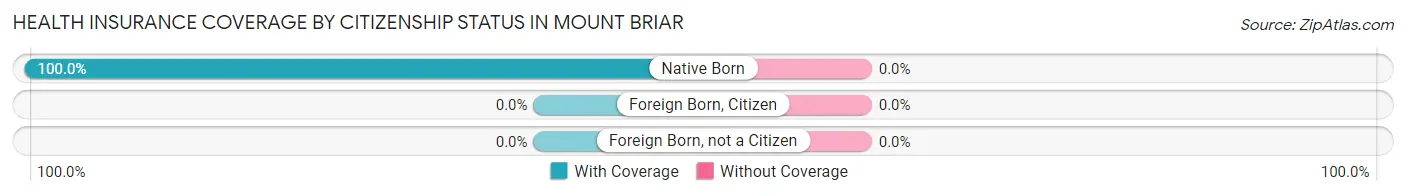
| Citizenship Status | With Coverage | Without Coverage |
| Native Born | 38 (100.0%) | 0 (0.0%) |
| Foreign Born, Citizen | 0 (0.0%) | 0 (0.0%) |
| Foreign Born, not a Citizen | 0 (0.0%) | 0 (0.0%) |
Health Insurance Coverage by Household Income in Mount Briar
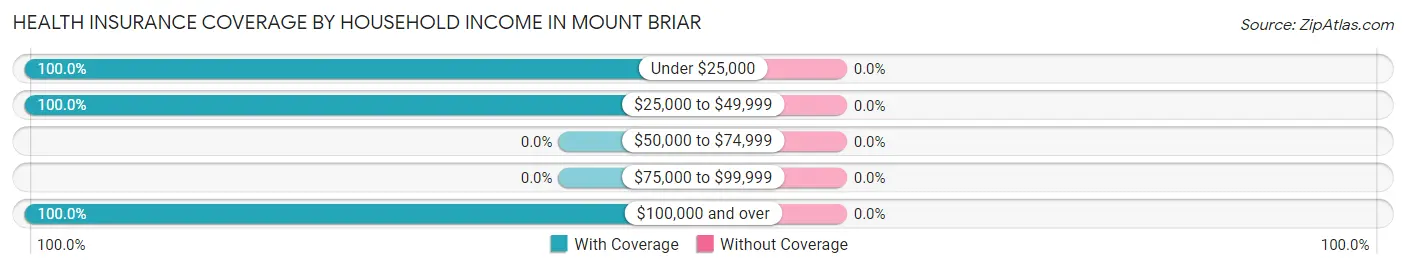
| Household Income | With Coverage | Without Coverage |
| Under $25,000 | 12 (100.0%) | 0 (0.0%) |
| $25,000 to $49,999 | 14 (100.0%) | 0 (0.0%) |
| $50,000 to $74,999 | 0 (0.0%) | 0 (0.0%) |
| $75,000 to $99,999 | 0 (0.0%) | 0 (0.0%) |
| $100,000 and over | 149 (100.0%) | 0 (0.0%) |
Public vs Private Health Insurance Coverage by Age in Mount Briar
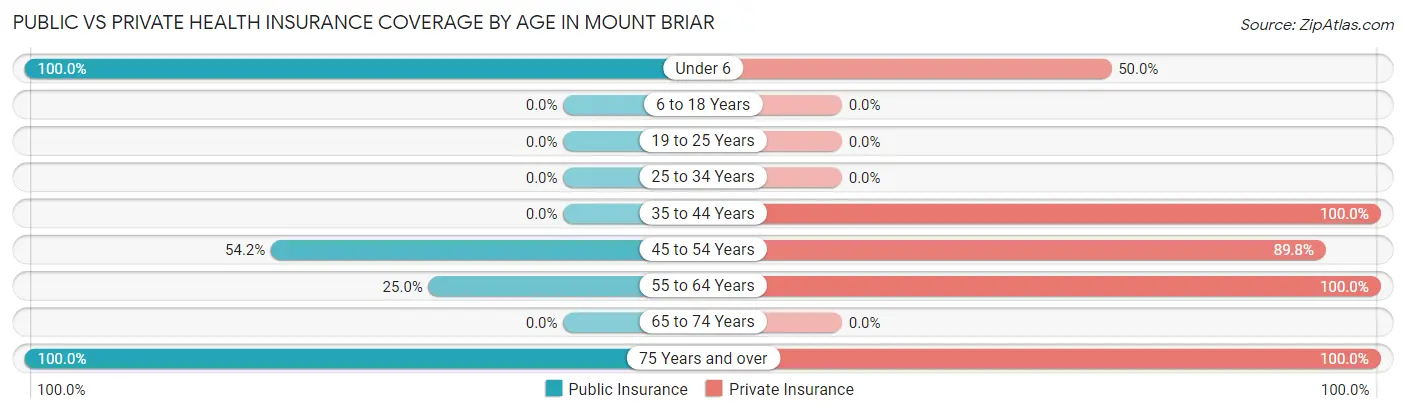
| Age Bracket | Public Insurance | Private Insurance |
| Under 6 | 38 (100.0%) | 19 (50.0%) |
| 6 to 18 Years | 0 (0.0%) | 0 (0.0%) |
| 19 to 25 Years | 0 (0.0%) | 0 (0.0%) |
| 25 to 34 Years | 0 (0.0%) | 0 (0.0%) |
| 35 to 44 Years | 0 (0.0%) | 40 (100.0%) |
| 45 to 54 Years | 32 (54.2%) | 53 (89.8%) |
| 55 to 64 Years | 6 (25.0%) | 24 (100.0%) |
| 65 to 74 Years | 0 (0.0%) | 0 (0.0%) |
| 75 Years and over | 14 (100.0%) | 14 (100.0%) |
| Total | 90 (51.4%) | 150 (85.7%) |
Disability Status by Sex by Age in Mount Briar
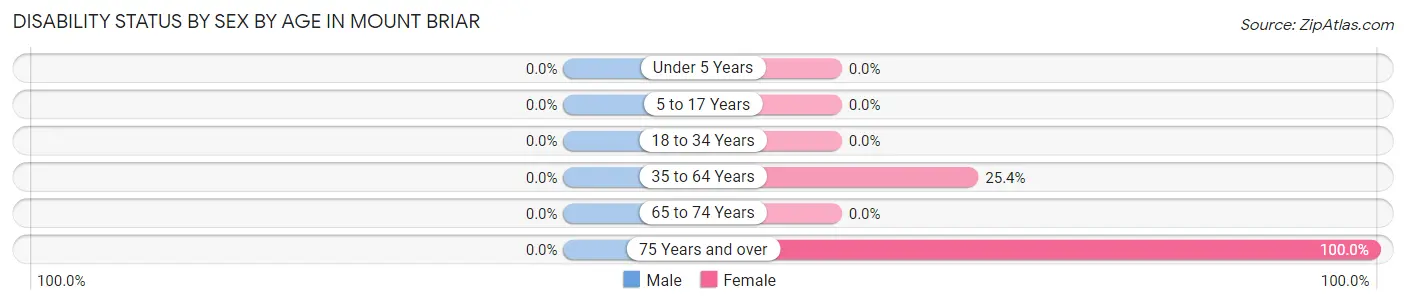
| Age Bracket | Male | Female |
| Under 5 Years | 0 (0.0%) | 0 (0.0%) |
| 5 to 17 Years | 0 (0.0%) | 0 (0.0%) |
| 18 to 34 Years | 0 (0.0%) | 0 (0.0%) |
| 35 to 64 Years | 0 (0.0%) | 18 (25.4%) |
| 65 to 74 Years | 0 (0.0%) | 0 (0.0%) |
| 75 Years and over | 0 (0.0%) | 14 (100.0%) |
Disability Class by Sex by Age in Mount Briar
Disability Class: Hearing Difficulty
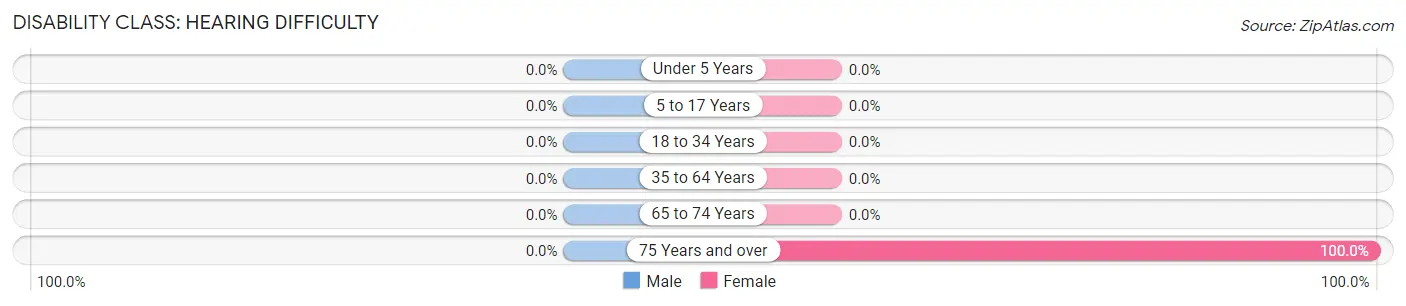
| Age Bracket | Male | Female |
| Under 5 Years | 0 (0.0%) | 0 (0.0%) |
| 5 to 17 Years | 0 (0.0%) | 0 (0.0%) |
| 18 to 34 Years | 0 (0.0%) | 0 (0.0%) |
| 35 to 64 Years | 0 (0.0%) | 0 (0.0%) |
| 65 to 74 Years | 0 (0.0%) | 0 (0.0%) |
| 75 Years and over | 0 (0.0%) | 14 (100.0%) |
Disability Class: Vision Difficulty
| Age Bracket | Male | Female |
| Under 5 Years | 0 (0.0%) | 0 (0.0%) |
| 5 to 17 Years | 0 (0.0%) | 0 (0.0%) |
| 18 to 34 Years | 0 (0.0%) | 0 (0.0%) |
| 35 to 64 Years | 0 (0.0%) | 0 (0.0%) |
| 65 to 74 Years | 0 (0.0%) | 0 (0.0%) |
| 75 Years and over | 0 (0.0%) | 0 (0.0%) |
Disability Class: Cognitive Difficulty
| Age Bracket | Male | Female |
| 5 to 17 Years | 0 (0.0%) | 0 (0.0%) |
| 18 to 34 Years | 0 (0.0%) | 0 (0.0%) |
| 35 to 64 Years | 0 (0.0%) | 0 (0.0%) |
| 65 to 74 Years | 0 (0.0%) | 0 (0.0%) |
| 75 Years and over | 0 (0.0%) | 0 (0.0%) |
Disability Class: Ambulatory Difficulty
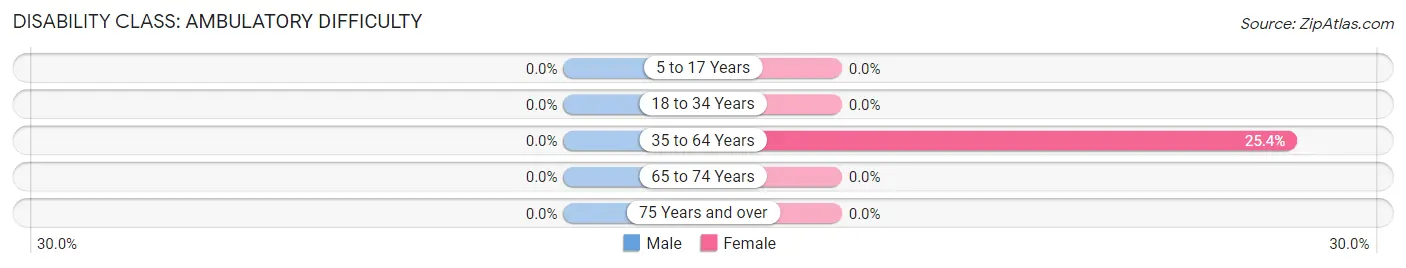
| Age Bracket | Male | Female |
| 5 to 17 Years | 0 (0.0%) | 0 (0.0%) |
| 18 to 34 Years | 0 (0.0%) | 0 (0.0%) |
| 35 to 64 Years | 0 (0.0%) | 18 (25.4%) |
| 65 to 74 Years | 0 (0.0%) | 0 (0.0%) |
| 75 Years and over | 0 (0.0%) | 0 (0.0%) |
Disability Class: Self-Care Difficulty
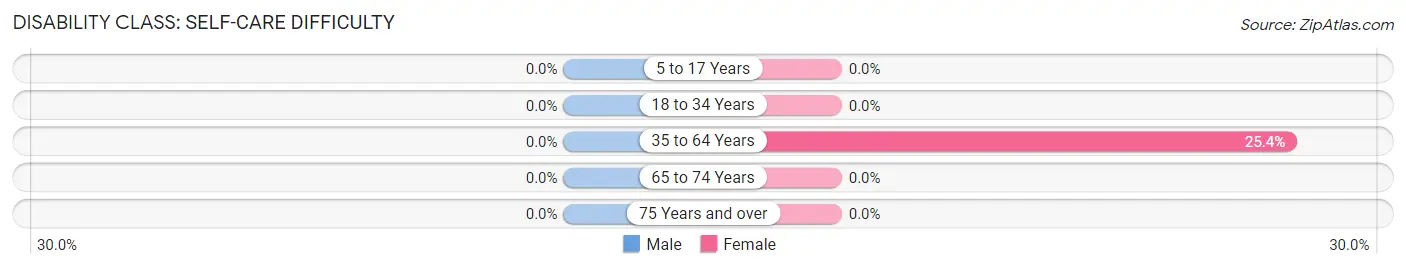
| Age Bracket | Male | Female |
| 5 to 17 Years | 0 (0.0%) | 0 (0.0%) |
| 18 to 34 Years | 0 (0.0%) | 0 (0.0%) |
| 35 to 64 Years | 0 (0.0%) | 18 (25.4%) |
| 65 to 74 Years | 0 (0.0%) | 0 (0.0%) |
| 75 Years and over | 0 (0.0%) | 0 (0.0%) |
Technology Access in Mount Briar
Computing Device Access in Mount Briar
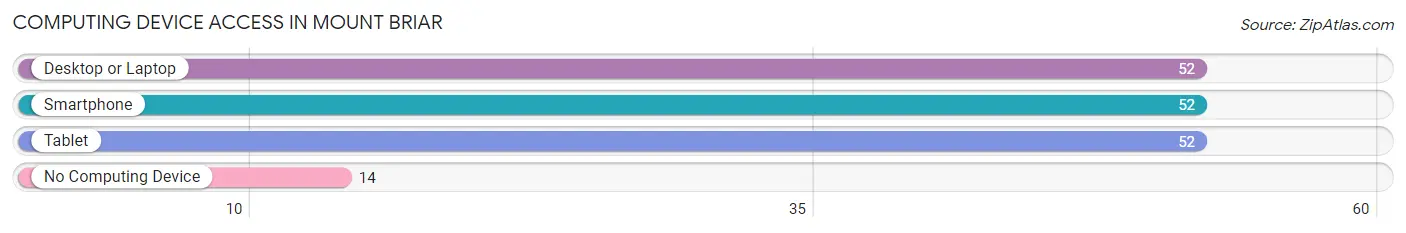
| Device Type | # Households | % Households |
| Desktop or Laptop | 52 | 78.8% |
| Smartphone | 52 | 78.8% |
| Tablet | 52 | 78.8% |
| No Computing Device | 14 | 21.2% |
| Total | 66 | 100.0% |
Internet Access in Mount Briar
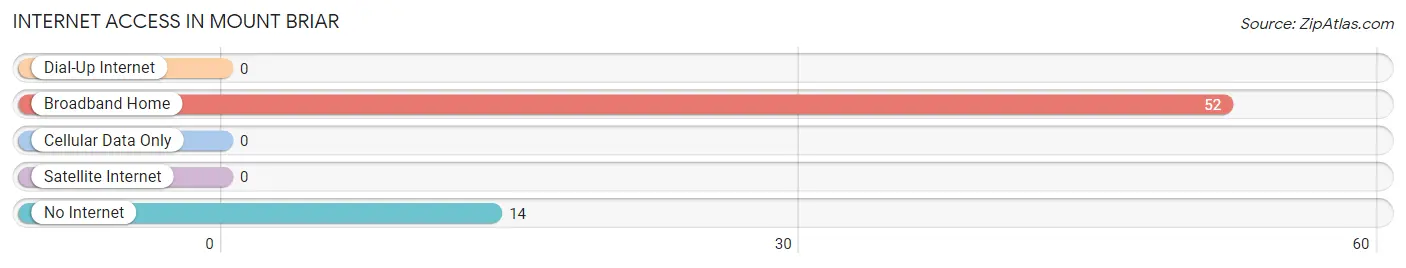
| Internet Type | # Households | % Households |
| Dial-Up Internet | 0 | 0.0% |
| Broadband Home | 52 | 78.8% |
| Cellular Data Only | 0 | 0.0% |
| Satellite Internet | 0 | 0.0% |
| No Internet | 14 | 21.2% |
| Total | 66 | 100.0% |
Mount Briar Summary
Briar, Maryland is a small town located in Montgomery County, Maryland. It is situated on the banks of the Potomac River, just north of Washington, D.C. The town is home to a population of approximately 2,000 people, and is known for its rural charm and small-town atmosphere.
History
The area that is now known as Mount Briar was first settled in the late 1700s by a group of German immigrants. The town was originally known as “Briar’s Hill”, and was named after the Briar family who owned the land. The town was officially incorporated in 1891, and was named after the nearby mountain, Mount Briar.
In the early 1900s, the town was a popular destination for tourists, who came to enjoy the scenic views of the Potomac River and the surrounding countryside. The town was also home to a number of small businesses, including a general store, a blacksmith, and a post office.
Geography
Mount Briar is located in Montgomery County, Maryland, just north of Washington, D.C. The town is situated on the banks of the Potomac River, and is surrounded by rolling hills and lush forests. The town is located at an elevation of approximately 500 feet above sea level.
The climate in Mount Briar is typical of the mid-Atlantic region, with hot, humid summers and cold, wet winters. The average annual temperature is around 55 degrees Fahrenheit, and the average annual precipitation is around 40 inches.
Economy
The economy of Mount Briar is largely based on tourism and small businesses. The town is home to a number of small businesses, including restaurants, shops, and galleries. The town is also home to a number of bed and breakfasts, which attract visitors from all over the country.
The town is also home to a number of small farms, which produce a variety of fruits and vegetables. The town is also home to a number of wineries, which produce a variety of wines.
Demographics
As of the 2010 census, the population of Mount Briar was 2,000 people. The racial makeup of the town was 94.2% White, 2.2% African American, 0.7% Asian, 0.3% Native American, and 2.6% from other races. The median household income was $60,000, and the median family income was $68,000.
The town is home to a number of churches, including the Mount Briar United Methodist Church, the Mount Briar Baptist Church, and the Mount Briar Presbyterian Church. The town is also home to a number of schools, including the Mount Briar Elementary School, the Mount Briar Middle School, and the Mount Briar High School.
Conclusion
Mount Briar, Maryland is a small town located in Montgomery County, Maryland. It is situated on the banks of the Potomac River, just north of Washington, D.C. The town is home to a population of approximately 2,000 people, and is known for its rural charm and small-town atmosphere. The town’s economy is largely based on tourism and small businesses, and the town is home to a number of churches, schools, and wineries. The town is also home to a number of small farms, which produce a variety of fruits and vegetables. The town’s population is largely white, with a small percentage of African Americans, Asians, and Native Americans.
Common Questions
What is Per Capita Income in Mount Briar?
Per Capita income in Mount Briar is $55,156.
What is the Median Family Income in Mount Briar?
Median Family Income in Mount Briar is $193,750.
What is the Median Household income in Mount Briar?
Median Household Income in Mount Briar is $164,125.
What is Inequality or Gini Index in Mount Briar?
Inequality or Gini Index in Mount Briar is 0.30.
What is the Total Population of Mount Briar?
Total Population of Mount Briar is 175.
What is the Total Male Population of Mount Briar?
Total Male Population of Mount Briar is 52.
What is the Total Female Population of Mount Briar?
Total Female Population of Mount Briar is 123.
What is the Ratio of Males per 100 Females in Mount Briar?
There are 42.28 Males per 100 Females in Mount Briar.
What is the Ratio of Females per 100 Males in Mount Briar?
There are 236.54 Females per 100 Males in Mount Briar.
What is the Median Population Age in Mount Briar?
Median Population Age in Mount Briar is 47.4 Years.
What is the Average Family Size in Mount Briar
Average Family Size in Mount Briar is 3.1 People.
What is the Average Household Size in Mount Briar
Average Household Size in Mount Briar is 2.6 People.
How Large is the Labor Force in Mount Briar?
There are 111 People in the Labor Forcein in Mount Briar.
What is the Percentage of People in the Labor Force in Mount Briar?
81.0% of People are in the Labor Force in Mount Briar.