Middle River, MD Map & Demographics
Middle River Map
Middle River Overview
$37,399
PER CAPITA INCOME
$75,385
AVG FAMILY INCOME
$72,970
AVG HOUSEHOLD INCOME
24.5%
WAGE / INCOME GAP [ % ]
75.5¢/ $1
WAGE / INCOME GAP [ $ ]
$16,679
FAMILY INCOME DEFICIT
0.46
INEQUALITY / GINI INDEX
31,155
TOTAL POPULATION
14,336
MALE POPULATION
16,819
FEMALE POPULATION
85.24
MALES / 100 FEMALES
117.32
FEMALES / 100 MALES
36.7
MEDIAN AGE
3.2
AVG FAMILY SIZE
2.6
AVG HOUSEHOLD SIZE
16,645
LABOR FORCE [ PEOPLE ]
66.9%
PERCENT IN LABOR FORCE
4.9%
UNEMPLOYMENT RATE
Middle River Zip Codes
Income in Middle River
Income Overview in Middle River
Per Capita Income in Middle River is $37,399, while median incomes of families and households are $75,385 and $72,970 respectively.
| Characteristic | Number | Measure |
| Per Capita Income | 31,155 | $37,399 |
| Median Family Income | 7,338 | $75,385 |
| Mean Family Income | 7,338 | $99,189 |
| Median Household Income | 12,082 | $72,970 |
| Mean Household Income | 12,082 | $95,296 |
| Income Deficit | 7,338 | $16,679 |
| Wage / Income Gap (%) | 31,155 | 24.52% |
| Wage / Income Gap ($) | 31,155 | 75.48¢ per $1 |
| Gini / Inequality Index | 31,155 | 0.46 |
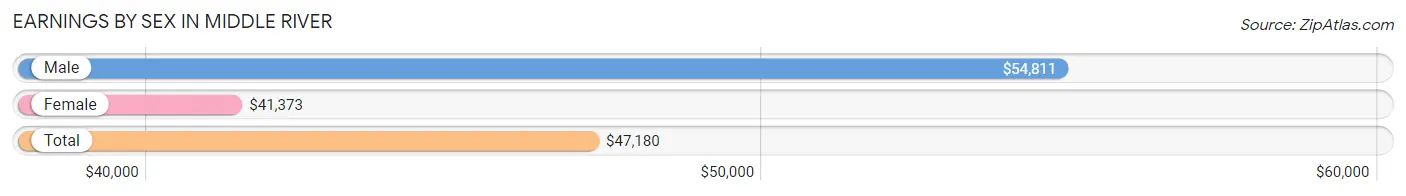
Earnings by Sex in Middle River
Average Earnings in Middle River are $47,180, $54,811 for men and $41,373 for women, a difference of 24.5%.
| Sex | Number | Average Earnings |
| Male | 7,764 (45.2%) | $54,811 |
| Female | 9,404 (54.8%) | $41,373 |
| Total | 17,168 (100.0%) | $47,180 |
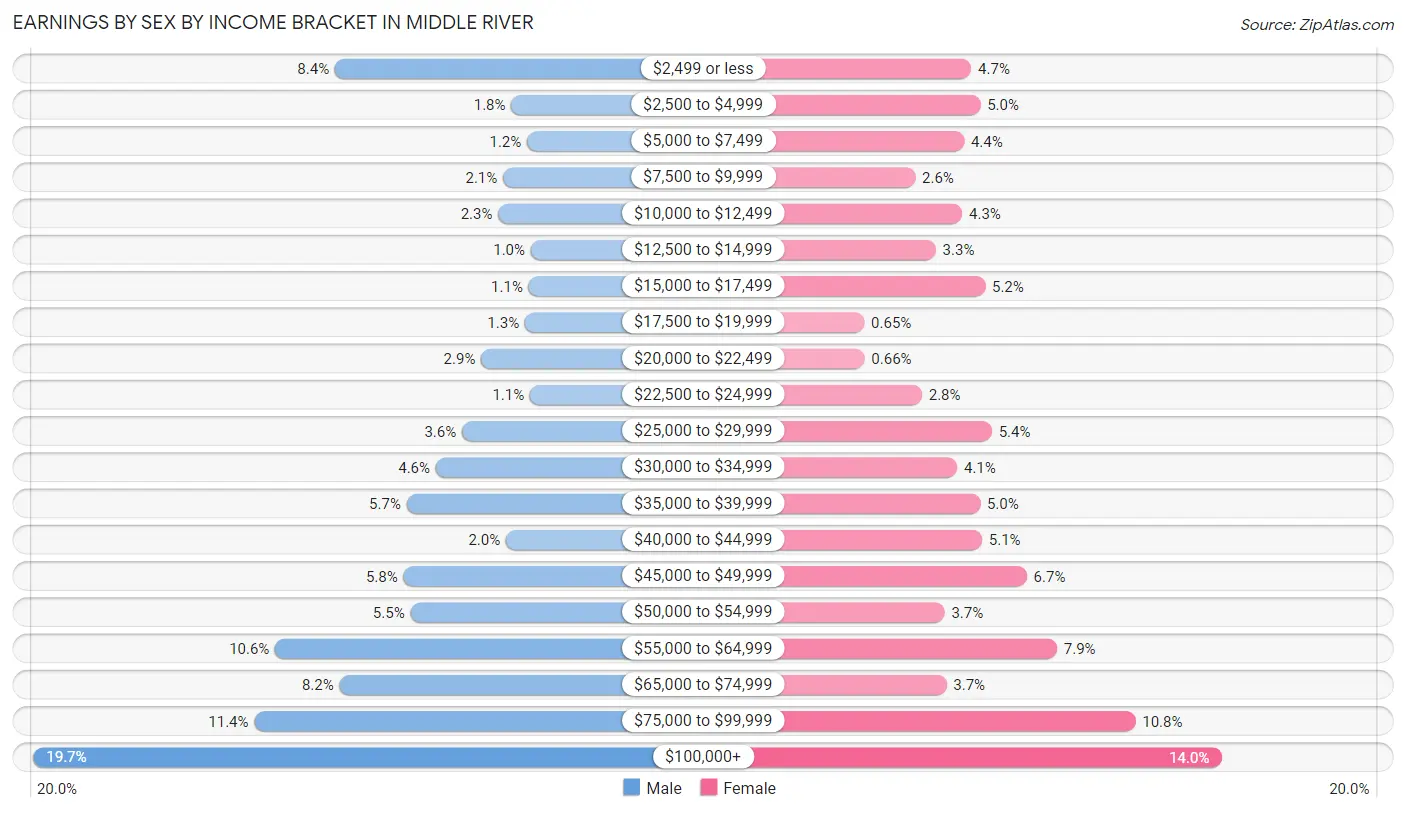
Earnings by Sex by Income Bracket in Middle River
The most common earnings brackets in Middle River are $100,000+ for men (1,527 | 19.7%) and $100,000+ for women (1,319 | 14.0%).
| Income | Male | Female |
| $2,499 or less | 650 (8.4%) | 438 (4.7%) |
| $2,500 to $4,999 | 137 (1.8%) | 470 (5.0%) |
| $5,000 to $7,499 | 91 (1.2%) | 413 (4.4%) |
| $7,500 to $9,999 | 161 (2.1%) | 241 (2.6%) |
| $10,000 to $12,499 | 175 (2.2%) | 406 (4.3%) |
| $12,500 to $14,999 | 80 (1.0%) | 313 (3.3%) |
| $15,000 to $17,499 | 86 (1.1%) | 487 (5.2%) |
| $17,500 to $19,999 | 97 (1.3%) | 61 (0.6%) |
| $20,000 to $22,499 | 224 (2.9%) | 62 (0.7%) |
| $22,500 to $24,999 | 82 (1.1%) | 264 (2.8%) |
| $25,000 to $29,999 | 280 (3.6%) | 511 (5.4%) |
| $30,000 to $34,999 | 356 (4.6%) | 388 (4.1%) |
| $35,000 to $39,999 | 441 (5.7%) | 469 (5.0%) |
| $40,000 to $44,999 | 152 (2.0%) | 476 (5.1%) |
| $45,000 to $49,999 | 450 (5.8%) | 634 (6.7%) |
| $50,000 to $54,999 | 430 (5.5%) | 344 (3.7%) |
| $55,000 to $64,999 | 824 (10.6%) | 740 (7.9%) |
| $65,000 to $74,999 | 637 (8.2%) | 351 (3.7%) |
| $75,000 to $99,999 | 884 (11.4%) | 1,017 (10.8%) |
| $100,000+ | 1,527 (19.7%) | 1,319 (14.0%) |
| Total | 7,764 (100.0%) | 9,404 (100.0%) |
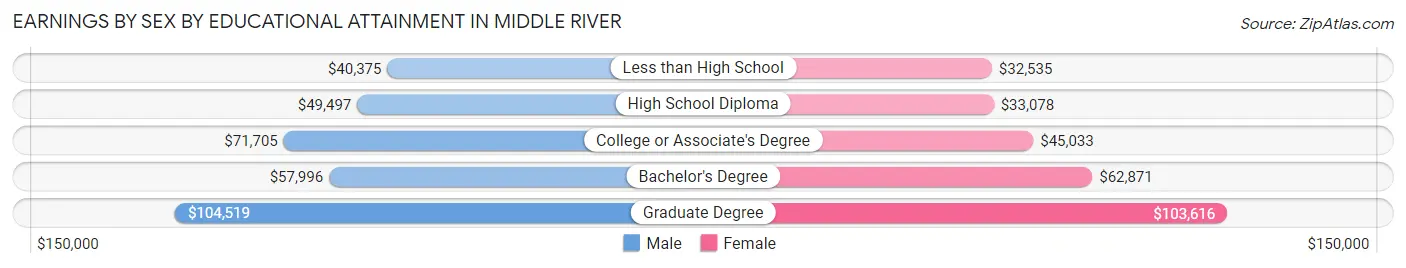
Earnings by Sex by Educational Attainment in Middle River
Average earnings in Middle River are $58,996 for men and $47,570 for women, a difference of 19.4%. Men with an educational attainment of graduate degree enjoy the highest average annual earnings of $104,519, while those with less than high school education earn the least with $40,375. Women with an educational attainment of graduate degree earn the most with the average annual earnings of $103,616, while those with less than high school education have the smallest earnings of $32,535.
| Educational Attainment | Male Income | Female Income |
| Less than High School | $40,375 | $32,535 |
| High School Diploma | $49,497 | $33,078 |
| College or Associate's Degree | $71,705 | $45,033 |
| Bachelor's Degree | $57,996 | $62,871 |
| Graduate Degree | $104,519 | $103,616 |
| Total | $58,996 | $47,570 |
Family Income in Middle River
Family Income Brackets in Middle River
According to the Middle River family income data, there are 1,431 families falling into the $50,000 to $74,999 income range, which is the most common income bracket and makes up 19.5% of all families. Conversely, the $10,000 to $14,999 income bracket is the least frequent group with only 88 families (1.2%) belonging to this category.
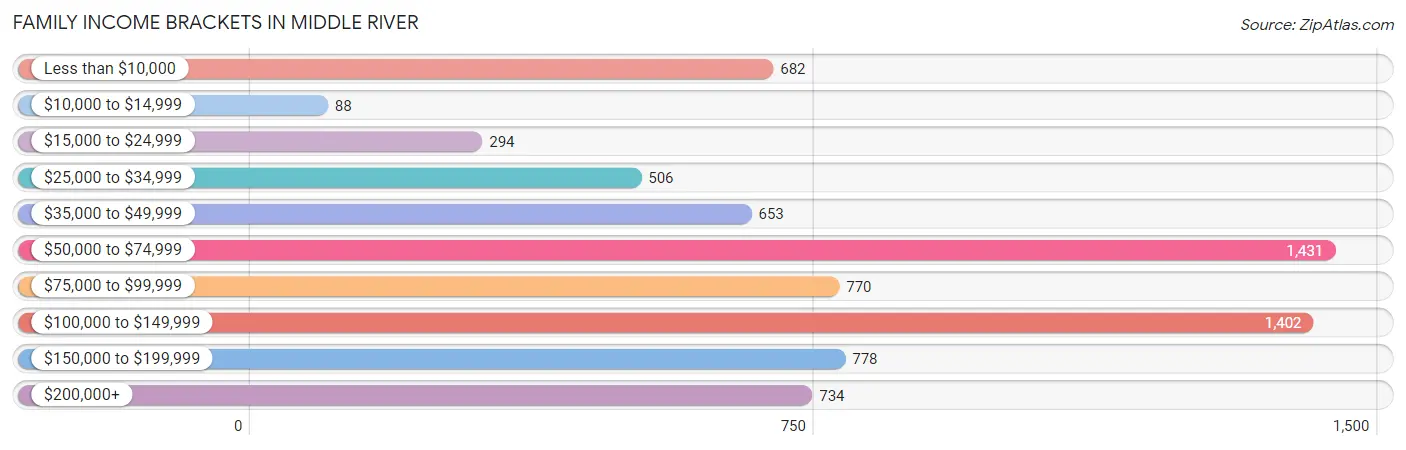
| Income Bracket | # Families | % Families |
| Less than $10,000 | 682 | 9.3% |
| $10,000 to $14,999 | 88 | 1.2% |
| $15,000 to $24,999 | 294 | 4.0% |
| $25,000 to $34,999 | 506 | 6.9% |
| $35,000 to $49,999 | 653 | 8.9% |
| $50,000 to $74,999 | 1,431 | 19.5% |
| $75,000 to $99,999 | 770 | 10.5% |
| $100,000 to $149,999 | 1,402 | 19.1% |
| $150,000 to $199,999 | 778 | 10.6% |
| $200,000+ | 734 | 10.0% |
Family Income by Famaliy Size in Middle River
4-person families (1,487 | 20.3%) account for the highest median family income in Middle River with $102,736 per family, while 2-person families (3,489 | 47.5%) have the highest median income of $35,532 per family member.
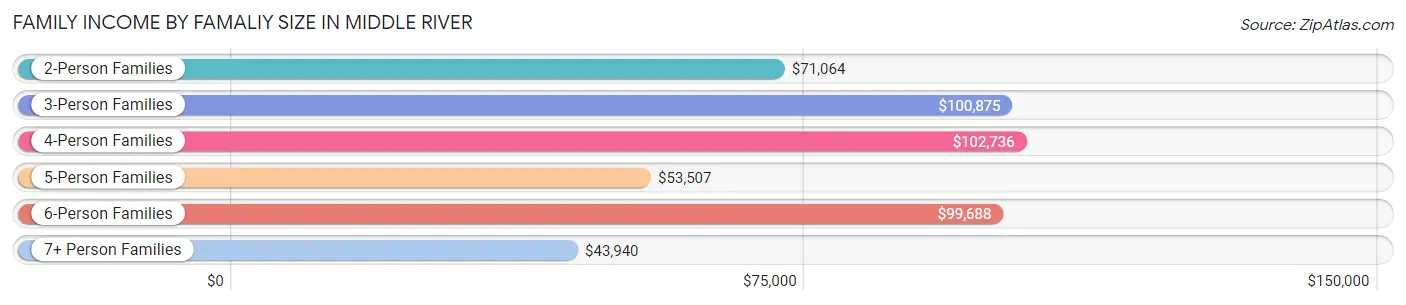
| Income Bracket | # Families | Median Income |
| 2-Person Families | 3,489 (47.5%) | $71,064 |
| 3-Person Families | 1,425 (19.4%) | $100,875 |
| 4-Person Families | 1,487 (20.3%) | $102,736 |
| 5-Person Families | 679 (9.2%) | $53,507 |
| 6-Person Families | 145 (2.0%) | $99,688 |
| 7+ Person Families | 113 (1.5%) | $43,940 |
| Total | 7,338 (100.0%) | $75,385 |
Family Income by Number of Earners in Middle River
The median family income in Middle River is $75,385, with families comprising 3+ earners (688) having the highest median family income of $147,813, while families with no earners (716) have the lowest median family income of $29,565, accounting for 9.4% and 9.8% of families, respectively.
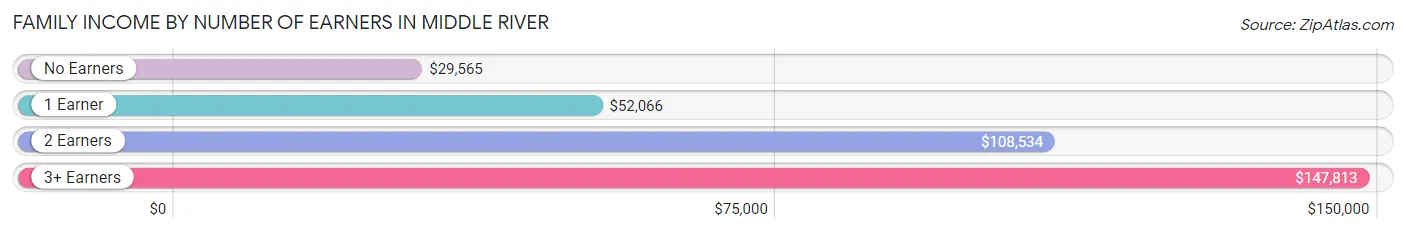
| Number of Earners | # Families | Median Income |
| No Earners | 716 (9.8%) | $29,565 |
| 1 Earner | 2,786 (38.0%) | $52,066 |
| 2 Earners | 3,148 (42.9%) | $108,534 |
| 3+ Earners | 688 (9.4%) | $147,813 |
| Total | 7,338 (100.0%) | $75,385 |
Household Income in Middle River
Household Income Brackets in Middle River
With 2,090 households falling in the category, the $50,000 to $74,999 income range is the most frequent in Middle River, accounting for 17.3% of all households. In contrast, only 193 households (1.6%) fall into the $10,000 to $14,999 income bracket, making it the least populous group.
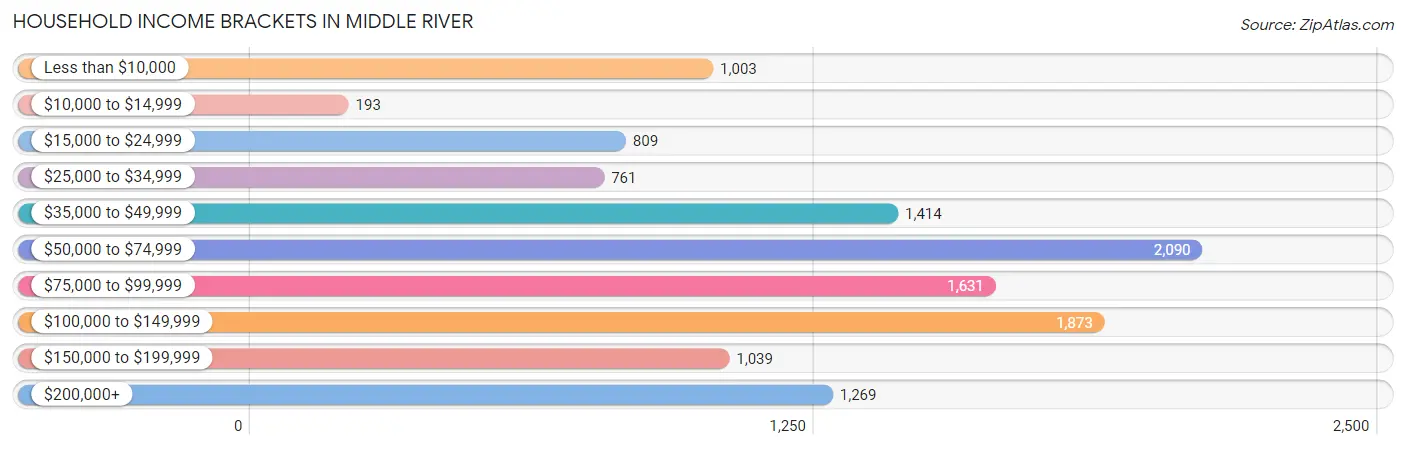
| Income Bracket | # Households | % Households |
| Less than $10,000 | 1,003 | 8.3% |
| $10,000 to $14,999 | 193 | 1.6% |
| $15,000 to $24,999 | 809 | 6.7% |
| $25,000 to $34,999 | 761 | 6.3% |
| $35,000 to $49,999 | 1,414 | 11.7% |
| $50,000 to $74,999 | 2,090 | 17.3% |
| $75,000 to $99,999 | 1,631 | 13.5% |
| $100,000 to $149,999 | 1,873 | 15.5% |
| $150,000 to $199,999 | 1,039 | 8.6% |
| $200,000+ | 1,269 | 10.5% |
Household Income by Householder Age in Middle River
The median household income in Middle River is $72,970, with the highest median household income of $84,991 found in the 45 to 64 years age bracket for the primary householder. A total of 4,629 households (38.3%) fall into this category. Meanwhile, the 15 to 24 years age bracket for the primary householder has the lowest median household income of $40,977, with 373 households (3.1%) in this group.
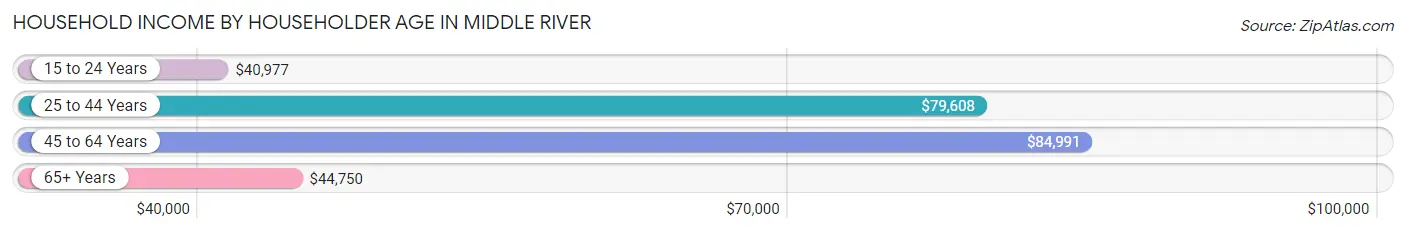
| Income Bracket | # Households | Median Income |
| 15 to 24 Years | 373 (3.1%) | $40,977 |
| 25 to 44 Years | 4,478 (37.1%) | $79,608 |
| 45 to 64 Years | 4,629 (38.3%) | $84,991 |
| 65+ Years | 2,602 (21.5%) | $44,750 |
| Total | 12,082 (100.0%) | $72,970 |
Poverty in Middle River
Income Below Poverty by Sex and Age in Middle River
With 16.7% poverty level for males and 20.5% for females among the residents of Middle River, 5 year old males and 6 to 11 year old females are the most vulnerable to poverty, with 73 males (77.7%) and 590 females (44.3%) in their respective age groups living below the poverty level.
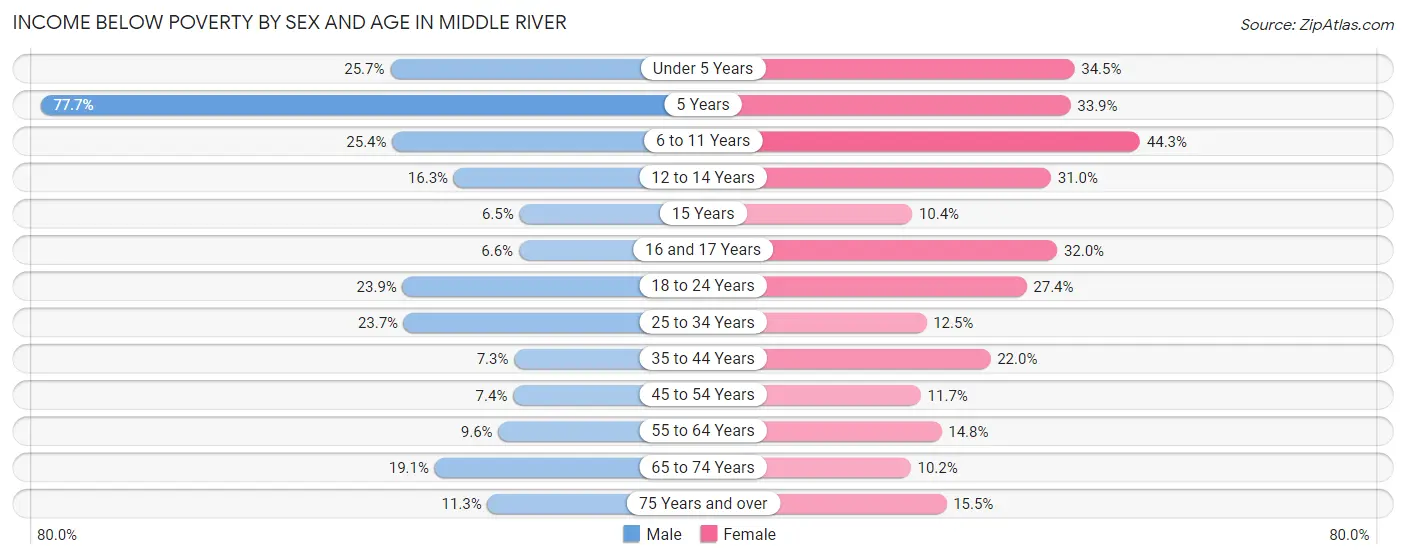
| Age Bracket | Male | Female |
| Under 5 Years | 395 (25.7%) | 350 (34.5%) |
| 5 Years | 73 (77.7%) | 74 (33.9%) |
| 6 to 11 Years | 197 (25.4%) | 590 (44.3%) |
| 12 to 14 Years | 84 (16.3%) | 121 (31.0%) |
| 15 Years | 11 (6.5%) | 15 (10.4%) |
| 16 and 17 Years | 12 (6.6%) | 85 (32.0%) |
| 18 to 24 Years | 294 (23.9%) | 458 (27.4%) |
| 25 to 34 Years | 563 (23.7%) | 327 (12.5%) |
| 35 to 44 Years | 117 (7.3%) | 536 (22.0%) |
| 45 to 54 Years | 150 (7.4%) | 242 (11.7%) |
| 55 to 64 Years | 185 (9.6%) | 336 (14.8%) |
| 65 to 74 Years | 210 (19.1%) | 136 (10.2%) |
| 75 Years and over | 79 (11.3%) | 142 (15.5%) |
| Total | 2,370 (16.7%) | 3,412 (20.5%) |
Income Above Poverty by Sex and Age in Middle River
According to the poverty statistics in Middle River, males aged 15 years and females aged 65 to 74 years are the age groups that are most secure financially, with 93.5% of males and 89.8% of females in these age groups living above the poverty line.
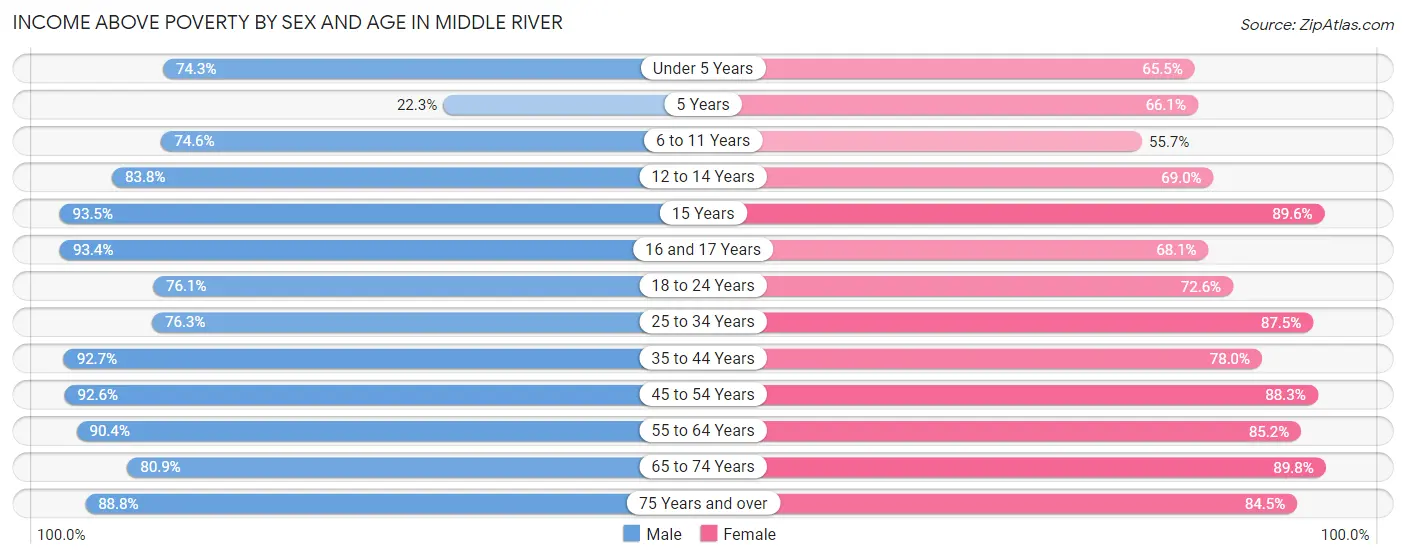
| Age Bracket | Male | Female |
| Under 5 Years | 1,142 (74.3%) | 664 (65.5%) |
| 5 Years | 21 (22.3%) | 144 (66.1%) |
| 6 to 11 Years | 579 (74.6%) | 743 (55.7%) |
| 12 to 14 Years | 433 (83.8%) | 269 (69.0%) |
| 15 Years | 158 (93.5%) | 129 (89.6%) |
| 16 and 17 Years | 170 (93.4%) | 181 (68.0%) |
| 18 to 24 Years | 938 (76.1%) | 1,213 (72.6%) |
| 25 to 34 Years | 1,816 (76.3%) | 2,283 (87.5%) |
| 35 to 44 Years | 1,490 (92.7%) | 1,896 (78.0%) |
| 45 to 54 Years | 1,867 (92.6%) | 1,824 (88.3%) |
| 55 to 64 Years | 1,735 (90.4%) | 1,939 (85.2%) |
| 65 to 74 Years | 890 (80.9%) | 1,196 (89.8%) |
| 75 Years and over | 623 (88.7%) | 774 (84.5%) |
| Total | 11,862 (83.4%) | 13,255 (79.5%) |
Income Below Poverty Among Married-Couple Families in Middle River
The poverty statistics for married-couple families in Middle River show that 12.8% or 609 of the total 4,747 families live below the poverty line. Families with 5 or more children have the highest poverty rate of 100.0%, comprising of 61 families. On the other hand, families with 1 or 2 children have the lowest poverty rate of 6.4%, which includes 67 families.
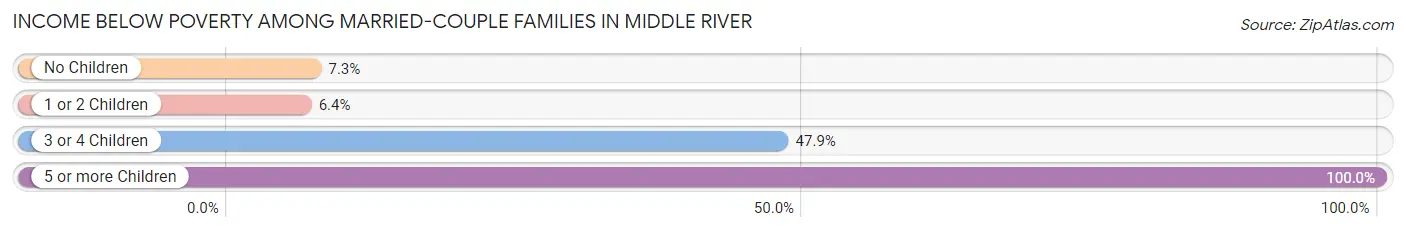
| Children | Above Poverty | Below Poverty |
| No Children | 2,882 (92.7%) | 226 (7.3%) |
| 1 or 2 Children | 979 (93.6%) | 67 (6.4%) |
| 3 or 4 Children | 277 (52.1%) | 255 (47.9%) |
| 5 or more Children | 0 (0.0%) | 61 (100.0%) |
| Total | 4,138 (87.2%) | 609 (12.8%) |
Income Below Poverty Among Single-Parent Households in Middle River
According to the poverty data in Middle River, 12.5% or 111 single-father households and 22.8% or 388 single-mother households are living below the poverty line. Among single-father households, those with 1 or 2 children have the highest poverty rate, with 93 households (16.3%) experiencing poverty. Likewise, among single-mother households, those with 5 or more children have the highest poverty rate, with 23 households (100.0%) falling below the poverty line.
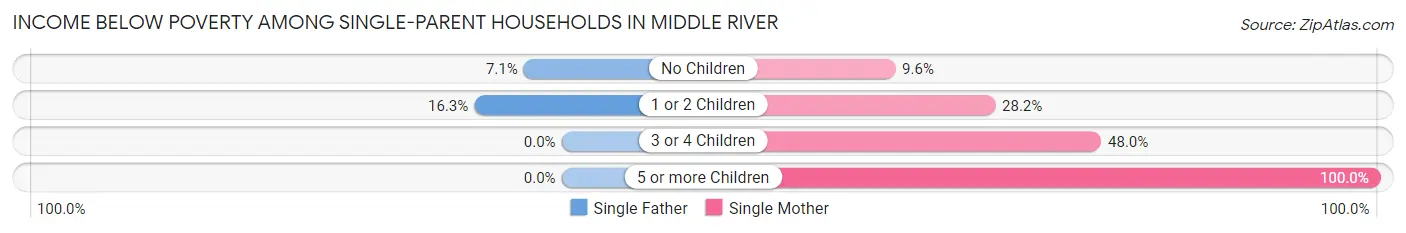
| Children | Single Father | Single Mother |
| No Children | 18 (7.1%) | 71 (9.6%) |
| 1 or 2 Children | 93 (16.3%) | 224 (28.2%) |
| 3 or 4 Children | 0 (0.0%) | 70 (47.9%) |
| 5 or more Children | 0 (0.0%) | 23 (100.0%) |
| Total | 111 (12.5%) | 388 (22.8%) |
Income Below Poverty Among Married-Couple vs Single-Parent Households in Middle River
The poverty data for Middle River shows that 609 of the married-couple family households (12.8%) and 499 of the single-parent households (19.3%) are living below the poverty level. Within the married-couple family households, those with 5 or more children have the highest poverty rate, with 61 households (100.0%) falling below the poverty line. Among the single-parent households, those with 5 or more children have the highest poverty rate, with 23 household (100.0%) living below poverty.
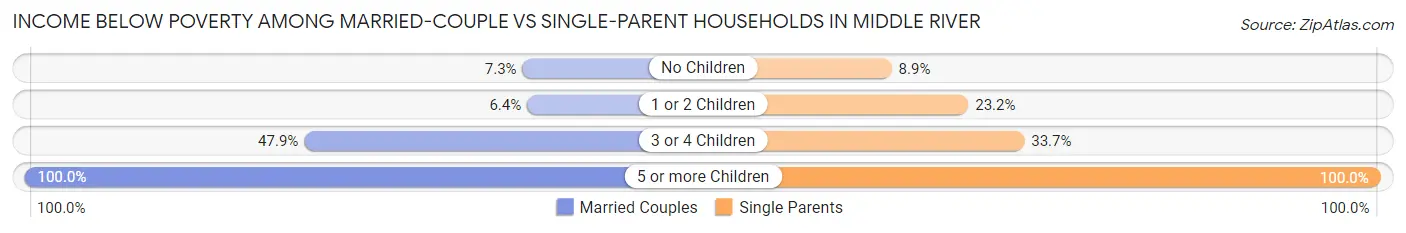
| Children | Married-Couple Families | Single-Parent Households |
| No Children | 226 (7.3%) | 89 (8.9%) |
| 1 or 2 Children | 67 (6.4%) | 317 (23.2%) |
| 3 or 4 Children | 255 (47.9%) | 70 (33.7%) |
| 5 or more Children | 61 (100.0%) | 23 (100.0%) |
| Total | 609 (12.8%) | 499 (19.3%) |
Race in Middle River
The most populous races in Middle River are White / Caucasian (16,875 | 54.2%), Black / African American (9,005 | 28.9%), and Hispanic or Latino (2,416 | 7.7%).
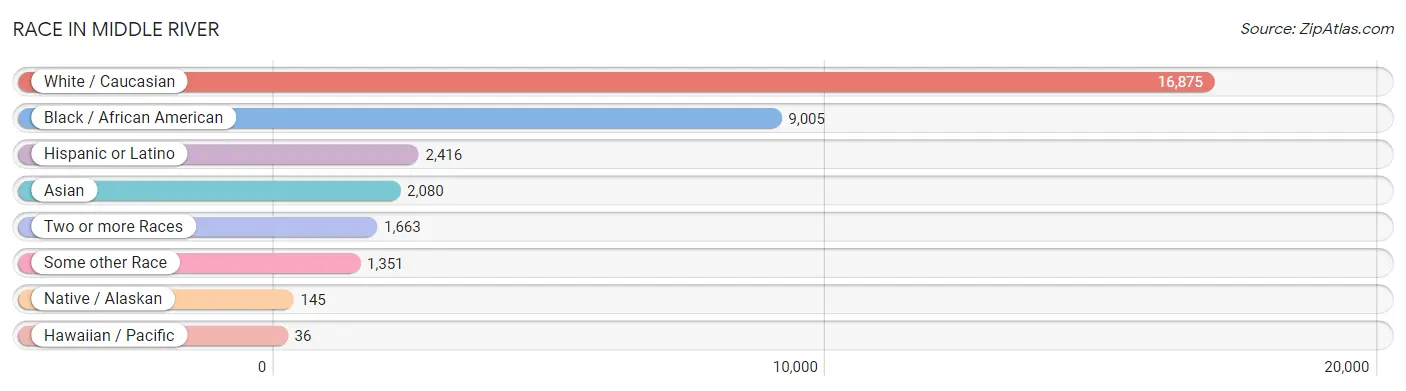
| Race | # Population | % Population |
| Asian | 2,080 | 6.7% |
| Black / African American | 9,005 | 28.9% |
| Hawaiian / Pacific | 36 | 0.1% |
| Hispanic or Latino | 2,416 | 7.7% |
| Native / Alaskan | 145 | 0.5% |
| White / Caucasian | 16,875 | 54.2% |
| Two or more Races | 1,663 | 5.3% |
| Some other Race | 1,351 | 4.3% |
| Total | 31,155 | 100.0% |
Ancestry in Middle River
The most populous ancestries reported in Middle River are German (4,941 | 15.9%), Irish (3,560 | 11.4%), Subsaharan African (1,738 | 5.6%), Italian (1,640 | 5.3%), and English (1,454 | 4.7%), together accounting for 42.8% of all Middle River residents.
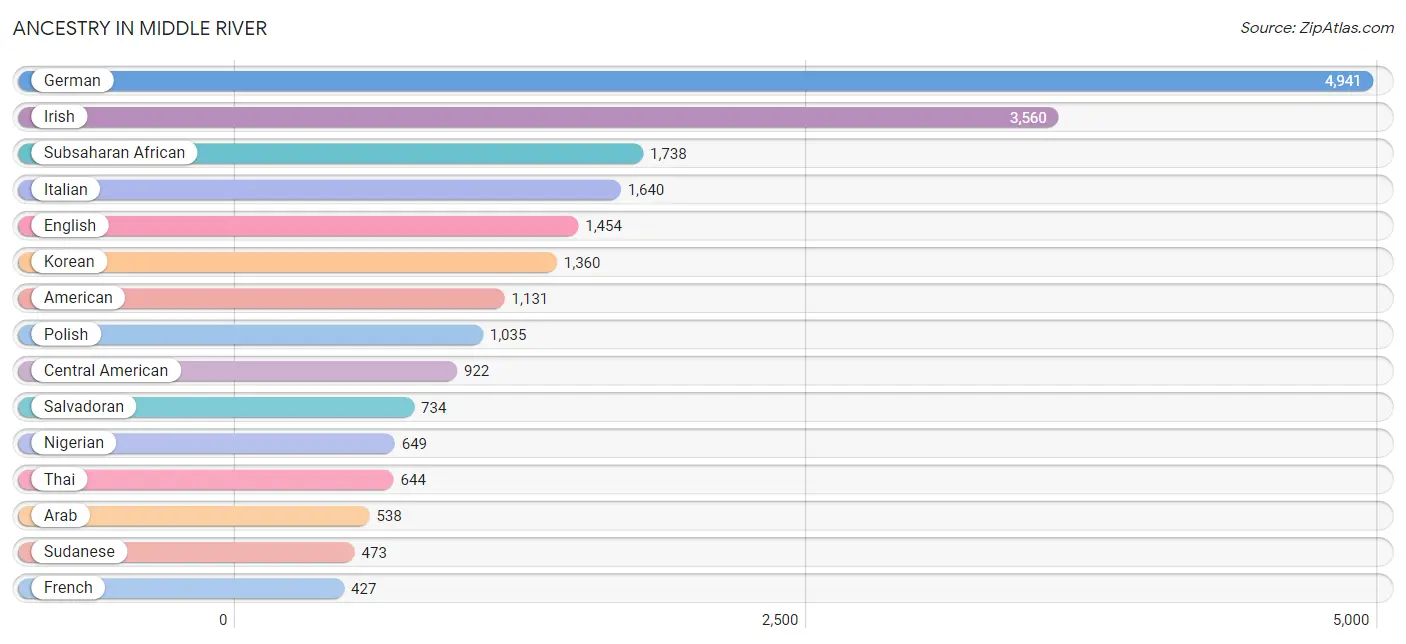
| Ancestry | # Population | % Population |
| African | 398 | 1.3% |
| American | 1,131 | 3.6% |
| Arab | 538 | 1.7% |
| Armenian | 43 | 0.1% |
| Australian | 20 | 0.1% |
| Bhutanese | 266 | 0.9% |
| Blackfeet | 12 | 0.0% |
| British | 70 | 0.2% |
| Burmese | 41 | 0.1% |
| Canadian | 47 | 0.2% |
| Central American | 922 | 3.0% |
| Central American Indian | 60 | 0.2% |
| Cherokee | 17 | 0.1% |
| Chilean | 58 | 0.2% |
| Croatian | 11 | 0.0% |
| Cuban | 49 | 0.2% |
| Czech | 201 | 0.6% |
| Danish | 9 | 0.0% |
| Dominican | 311 | 1.0% |
| Dutch | 194 | 0.6% |
| Eastern European | 33 | 0.1% |
| Ecuadorian | 28 | 0.1% |
| Egyptian | 220 | 0.7% |
| English | 1,454 | 4.7% |
| Ethiopian | 13 | 0.0% |
| European | 113 | 0.4% |
| Filipino | 21 | 0.1% |
| Finnish | 2 | 0.0% |
| French | 427 | 1.4% |
| German | 4,941 | 15.9% |
| Greek | 74 | 0.2% |
| Guamanian / Chamorro | 37 | 0.1% |
| Guatemalan | 94 | 0.3% |
| Guyanese | 23 | 0.1% |
| Honduran | 39 | 0.1% |
| Hungarian | 66 | 0.2% |
| Indian (Asian) | 50 | 0.2% |
| Irish | 3,560 | 11.4% |
| Italian | 1,640 | 5.3% |
| Kenyan | 152 | 0.5% |
| Korean | 1,360 | 4.4% |
| Lebanese | 60 | 0.2% |
| Liberian | 40 | 0.1% |
| Lithuanian | 23 | 0.1% |
| Lumbee | 54 | 0.2% |
| Malaysian | 24 | 0.1% |
| Mexican | 303 | 1.0% |
| Nicaraguan | 55 | 0.2% |
| Nigerian | 649 | 2.1% |
| Norwegian | 5 | 0.0% |
| Pennsylvania German | 41 | 0.1% |
| Polish | 1,035 | 3.3% |
| Portuguese | 28 | 0.1% |
| Puerto Rican | 122 | 0.4% |
| Russian | 41 | 0.1% |
| Salvadoran | 734 | 2.4% |
| Samoan | 10 | 0.0% |
| Scandinavian | 23 | 0.1% |
| Scotch-Irish | 119 | 0.4% |
| Scottish | 400 | 1.3% |
| Slovak | 68 | 0.2% |
| South American | 301 | 1.0% |
| South American Indian | 11 | 0.0% |
| Spaniard | 176 | 0.6% |
| Sri Lankan | 89 | 0.3% |
| Subsaharan African | 1,738 | 5.6% |
| Sudanese | 473 | 1.5% |
| Swedish | 64 | 0.2% |
| Swiss | 11 | 0.0% |
| Thai | 644 | 2.1% |
| Trinidadian and Tobagonian | 110 | 0.4% |
| Ukrainian | 110 | 0.4% |
| Welsh | 277 | 0.9% |
| West Indian | 13 | 0.0% | View All 74 Rows |
Immigrants in Middle River
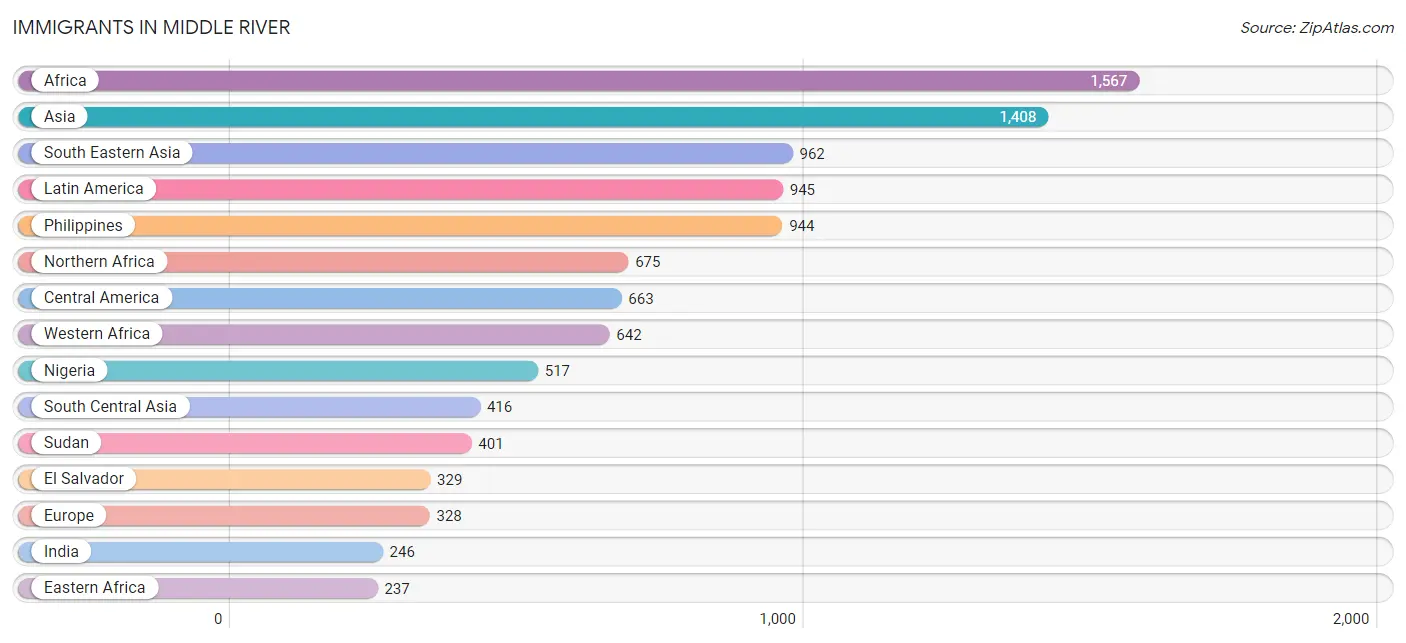
The most numerous immigrant groups reported in Middle River came from Africa (1,567 | 5.0%), Asia (1,408 | 4.5%), South Eastern Asia (962 | 3.1%), Latin America (945 | 3.0%), and Philippines (944 | 3.0%), together accounting for 18.7% of all Middle River residents.
| Immigration Origin | # Population | % Population |
| Africa | 1,567 | 5.0% |
| Asia | 1,408 | 4.5% |
| Bangladesh | 24 | 0.1% |
| Brazil | 59 | 0.2% |
| Canada | 88 | 0.3% |
| Caribbean | 176 | 0.6% |
| Central America | 663 | 2.1% |
| Cuba | 49 | 0.2% |
| Dominican Republic | 39 | 0.1% |
| Eastern Africa | 237 | 0.8% |
| Eastern Asia | 30 | 0.1% |
| Eastern Europe | 93 | 0.3% |
| Ecuador | 24 | 0.1% |
| Egypt | 105 | 0.3% |
| El Salvador | 329 | 1.1% |
| England | 10 | 0.0% |
| Ethiopia | 49 | 0.2% |
| Europe | 328 | 1.1% |
| Ghana | 85 | 0.3% |
| Guatemala | 97 | 0.3% |
| Guyana | 23 | 0.1% |
| Honduras | 39 | 0.1% |
| India | 246 | 0.8% |
| Iran | 64 | 0.2% |
| Italy | 85 | 0.3% |
| Jamaica | 4 | 0.0% |
| Kenya | 188 | 0.6% |
| Korea | 30 | 0.1% |
| Latin America | 945 | 3.0% |
| Liberia | 40 | 0.1% |
| Mexico | 143 | 0.5% |
| Morocco | 169 | 0.5% |
| Nepal | 3 | 0.0% |
| Nicaragua | 55 | 0.2% |
| Nigeria | 517 | 1.7% |
| Northern Africa | 675 | 2.2% |
| Northern Europe | 100 | 0.3% |
| Pakistan | 49 | 0.2% |
| Philippines | 944 | 3.0% |
| Poland | 59 | 0.2% |
| Portugal | 28 | 0.1% |
| Russia | 34 | 0.1% |
| South Africa | 13 | 0.0% |
| South America | 106 | 0.3% |
| South Central Asia | 416 | 1.3% |
| South Eastern Asia | 962 | 3.1% |
| Southern Europe | 135 | 0.4% |
| Spain | 22 | 0.1% |
| Sudan | 401 | 1.3% |
| Trinidad and Tobago | 66 | 0.2% |
| Vietnam | 18 | 0.1% |
| Western Africa | 642 | 2.1% | View All 52 Rows |
Sex and Age in Middle River
Sex and Age in Middle River
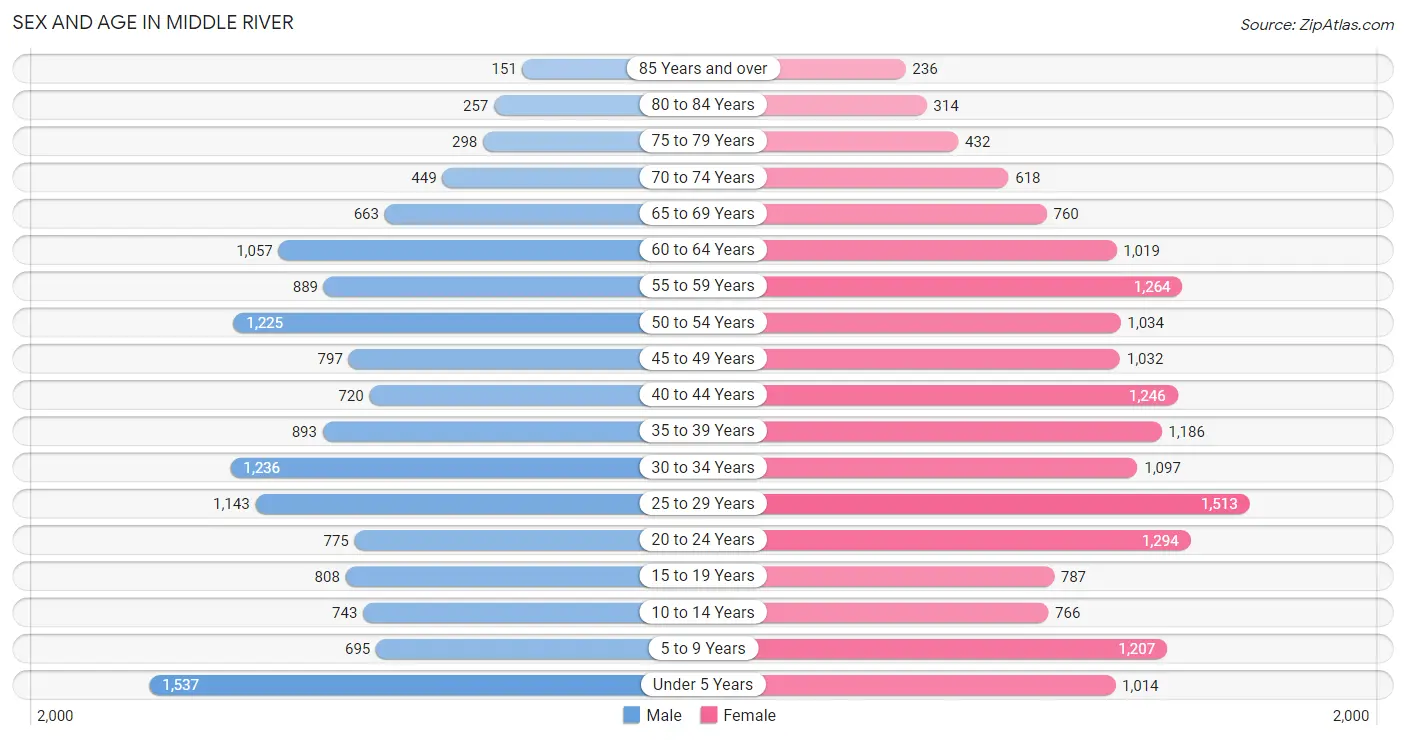
The most populous age groups in Middle River are Under 5 Years (1,537 | 10.7%) for men and 25 to 29 Years (1,513 | 9.0%) for women.
| Age Bracket | Male | Female |
| Under 5 Years | 1,537 (10.7%) | 1,014 (6.0%) |
| 5 to 9 Years | 695 (4.9%) | 1,207 (7.2%) |
| 10 to 14 Years | 743 (5.2%) | 766 (4.5%) |
| 15 to 19 Years | 808 (5.6%) | 787 (4.7%) |
| 20 to 24 Years | 775 (5.4%) | 1,294 (7.7%) |
| 25 to 29 Years | 1,143 (8.0%) | 1,513 (9.0%) |
| 30 to 34 Years | 1,236 (8.6%) | 1,097 (6.5%) |
| 35 to 39 Years | 893 (6.2%) | 1,186 (7.0%) |
| 40 to 44 Years | 720 (5.0%) | 1,246 (7.4%) |
| 45 to 49 Years | 797 (5.6%) | 1,032 (6.1%) |
| 50 to 54 Years | 1,225 (8.5%) | 1,034 (6.1%) |
| 55 to 59 Years | 889 (6.2%) | 1,264 (7.5%) |
| 60 to 64 Years | 1,057 (7.4%) | 1,019 (6.1%) |
| 65 to 69 Years | 663 (4.6%) | 760 (4.5%) |
| 70 to 74 Years | 449 (3.1%) | 618 (3.7%) |
| 75 to 79 Years | 298 (2.1%) | 432 (2.6%) |
| 80 to 84 Years | 257 (1.8%) | 314 (1.9%) |
| 85 Years and over | 151 (1.1%) | 236 (1.4%) |
| Total | 14,336 (100.0%) | 16,819 (100.0%) |
Families and Households in Middle River
Median Family Size in Middle River
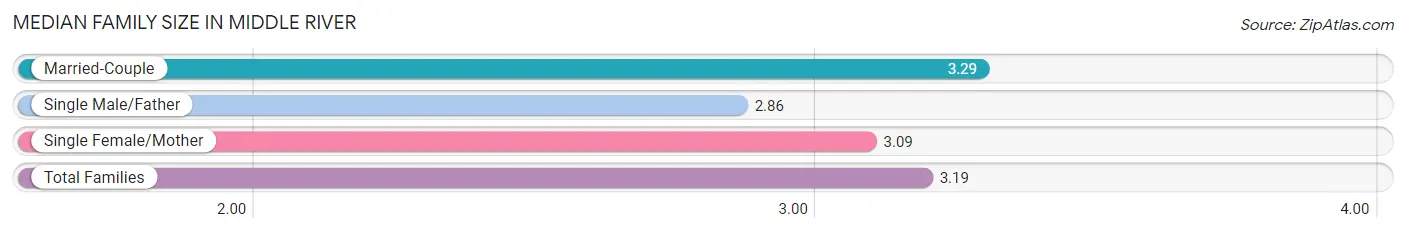
The median family size in Middle River is 3.19 persons per family, with married-couple families (4,747 | 64.7%) accounting for the largest median family size of 3.29 persons per family. On the other hand, single male/father families (888 | 12.1%) represent the smallest median family size with 2.86 persons per family.
| Family Type | # Families | Family Size |
| Married-Couple | 4,747 (64.7%) | 3.29 |
| Single Male/Father | 888 (12.1%) | 2.86 |
| Single Female/Mother | 1,703 (23.2%) | 3.09 |
| Total Families | 7,338 (100.0%) | 3.19 |
Median Household Size in Middle River
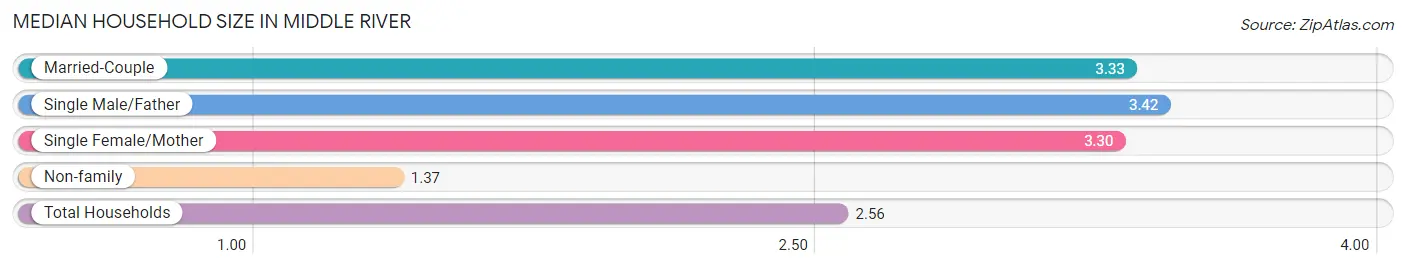
The median household size in Middle River is 2.56 persons per household, with single male/father households (888 | 7.3%) accounting for the largest median household size of 3.42 persons per household. non-family households (4,744 | 39.3%) represent the smallest median household size with 1.37 persons per household.
| Household Type | # Households | Household Size |
| Married-Couple | 4,747 (39.3%) | 3.33 |
| Single Male/Father | 888 (7.3%) | 3.42 |
| Single Female/Mother | 1,703 (14.1%) | 3.30 |
| Non-family | 4,744 (39.3%) | 1.37 |
| Total Households | 12,082 (100.0%) | 2.56 |
Household Size by Marriage Status in Middle River
Out of a total of 12,082 households in Middle River, 7,338 (60.7%) are family households, while 4,744 (39.3%) are nonfamily households. The most numerous type of family households are 2-person households, comprising 3,021, and the most common type of nonfamily households are 1-person households, comprising 3,570.
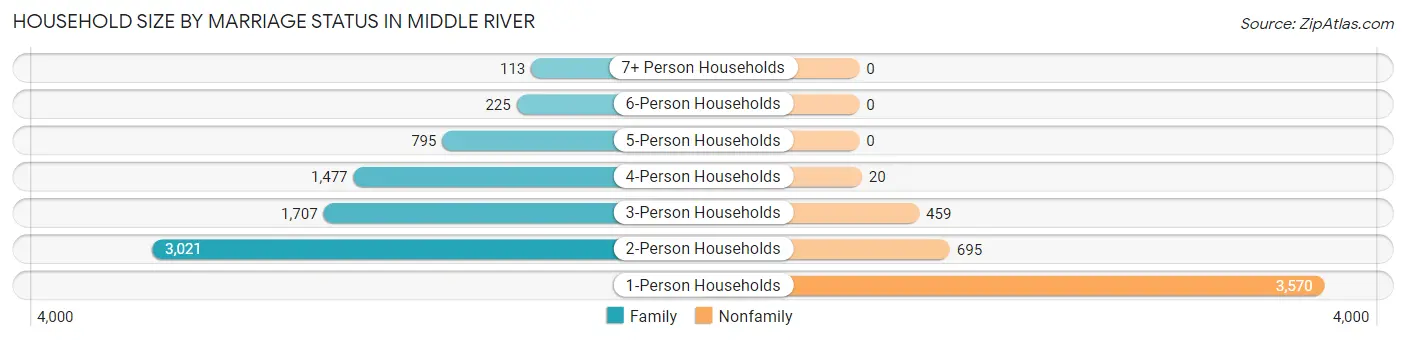
| Household Size | Family Households | Nonfamily Households |
| 1-Person Households | - | 3,570 (29.5%) |
| 2-Person Households | 3,021 (25.0%) | 695 (5.8%) |
| 3-Person Households | 1,707 (14.1%) | 459 (3.8%) |
| 4-Person Households | 1,477 (12.2%) | 20 (0.2%) |
| 5-Person Households | 795 (6.6%) | 0 (0.0%) |
| 6-Person Households | 225 (1.9%) | 0 (0.0%) |
| 7+ Person Households | 113 (0.9%) | 0 (0.0%) |
| Total | 7,338 (60.7%) | 4,744 (39.3%) |
Female Fertility in Middle River
Fertility by Age in Middle River
Average fertility rate in Middle River is 86.0 births per 1,000 women. Women in the age bracket of 35 to 50 years have the highest fertility rate with 97.0 births per 1,000 women. Women in the age bracket of 35 to 50 years acount for 49.3% of all women with births.
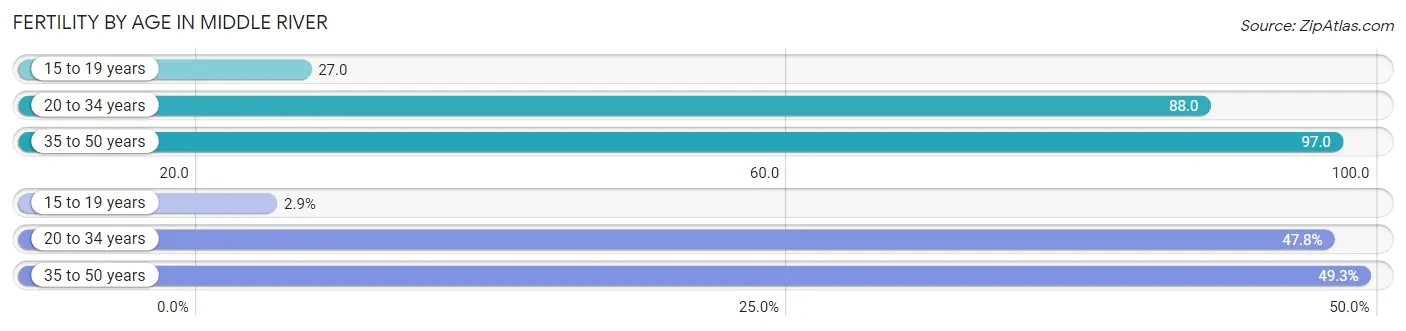
| Age Bracket | Women with Births | Births / 1,000 Women |
| 15 to 19 years | 21 (2.9%) | 27.0 |
| 20 to 34 years | 342 (47.8%) | 88.0 |
| 35 to 50 years | 353 (49.3%) | 97.0 |
| Total | 716 (100.0%) | 86.0 |
Fertility by Age by Marriage Status in Middle River
67.7% of women with births (716) in Middle River are married. The highest percentage of unmarried women with births falls into 15 to 19 years age bracket with 100.0% of them unmarried at the time of birth, while the lowest percentage of unmarried women with births belong to 35 to 50 years age bracket with 13.6% of them unmarried.
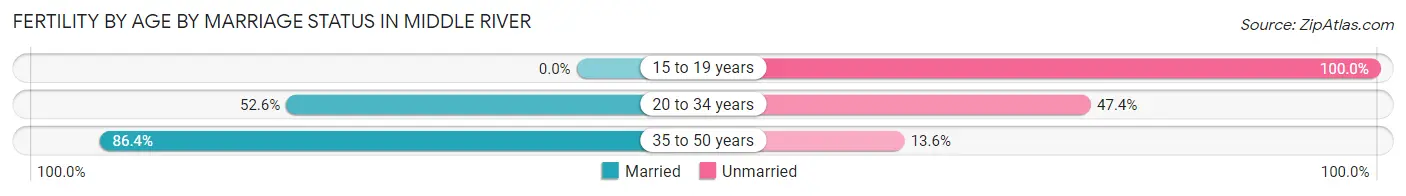
| Age Bracket | Married | Unmarried |
| 15 to 19 years | 0 (0.0%) | 21 (100.0%) |
| 20 to 34 years | 180 (52.6%) | 162 (47.4%) |
| 35 to 50 years | 305 (86.4%) | 48 (13.6%) |
| Total | 485 (67.7%) | 231 (32.3%) |
Fertility by Education in Middle River
Average fertility rate in Middle River is 86.0 births per 1,000 women. Women with the education attainment of high school diploma have the highest fertility rate of 140.0 births per 1,000 women, while women with the education attainment of bachelor's degree have the lowest fertility at 41.0 births per 1,000 women. Women with the education attainment of high school diploma represent 42.6% of all women with births.
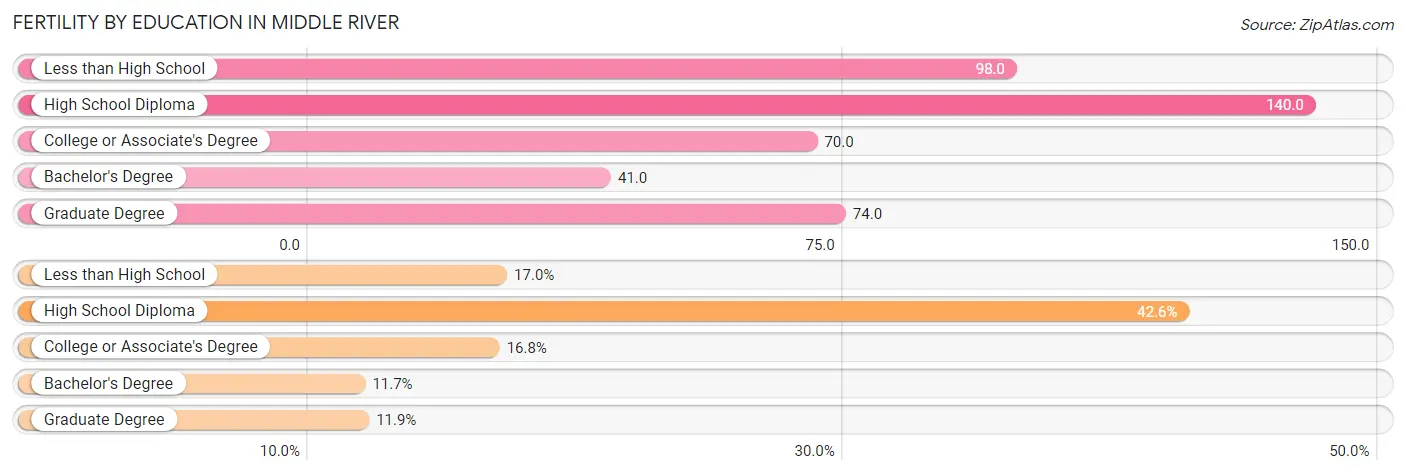
| Educational Attainment | Women with Births | Births / 1,000 Women |
| Less than High School | 122 (17.0%) | 98.0 |
| High School Diploma | 305 (42.6%) | 140.0 |
| College or Associate's Degree | 120 (16.8%) | 70.0 |
| Bachelor's Degree | 84 (11.7%) | 41.0 |
| Graduate Degree | 85 (11.9%) | 74.0 |
| Total | 716 (100.0%) | 86.0 |
Fertility by Education by Marriage Status in Middle River
32.3% of women with births in Middle River are unmarried. Women with the educational attainment of graduate degree are most likely to be married with 100.0% of them married at childbirth, while women with the educational attainment of college or associate's degree are least likely to be married with 65.0% of them unmarried at childbirth.
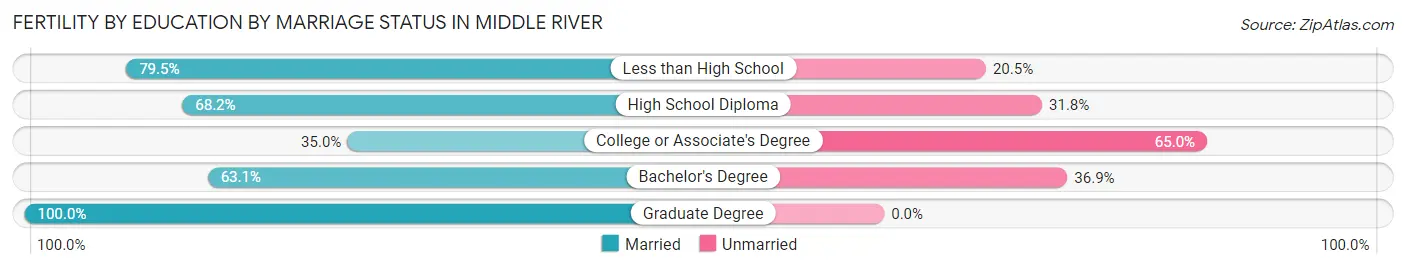
| Educational Attainment | Married | Unmarried |
| Less than High School | 97 (79.5%) | 25 (20.5%) |
| High School Diploma | 208 (68.2%) | 97 (31.8%) |
| College or Associate's Degree | 42 (35.0%) | 78 (65.0%) |
| Bachelor's Degree | 53 (63.1%) | 31 (36.9%) |
| Graduate Degree | 85 (100.0%) | 0 (0.0%) |
| Total | 485 (67.7%) | 231 (32.3%) |
Employment Characteristics in Middle River
Employment by Class of Employer in Middle River
Among the 15,528 employed individuals in Middle River, private company employees (9,531 | 61.4%), not-for-profit organizations (2,126 | 13.7%), and local government employees (1,206 | 7.8%) make up the most common classes of employment.
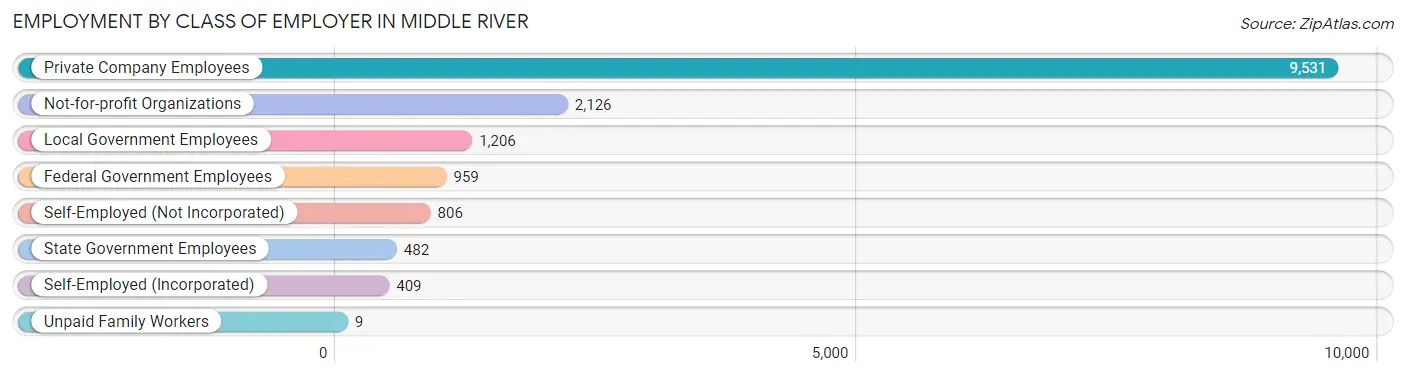
| Employer Class | # Employees | % Employees |
| Private Company Employees | 9,531 | 61.4% |
| Self-Employed (Incorporated) | 409 | 2.6% |
| Self-Employed (Not Incorporated) | 806 | 5.2% |
| Not-for-profit Organizations | 2,126 | 13.7% |
| Local Government Employees | 1,206 | 7.8% |
| State Government Employees | 482 | 3.1% |
| Federal Government Employees | 959 | 6.2% |
| Unpaid Family Workers | 9 | 0.1% |
| Total | 15,528 | 100.0% |
Employment Status by Age in Middle River
According to the labor force statistics for Middle River, out of the total population over 16 years of age (24,880), 66.9% or 16,645 individuals are in the labor force, with 4.9% or 816 of them unemployed. The age group with the highest labor force participation rate is 35 to 44 years, with 88.3% or 3,572 individuals in the labor force. Within the labor force, the 30 to 34 years age range has the highest percentage of unemployed individuals, with 8.2% or 161 of them being unemployed.
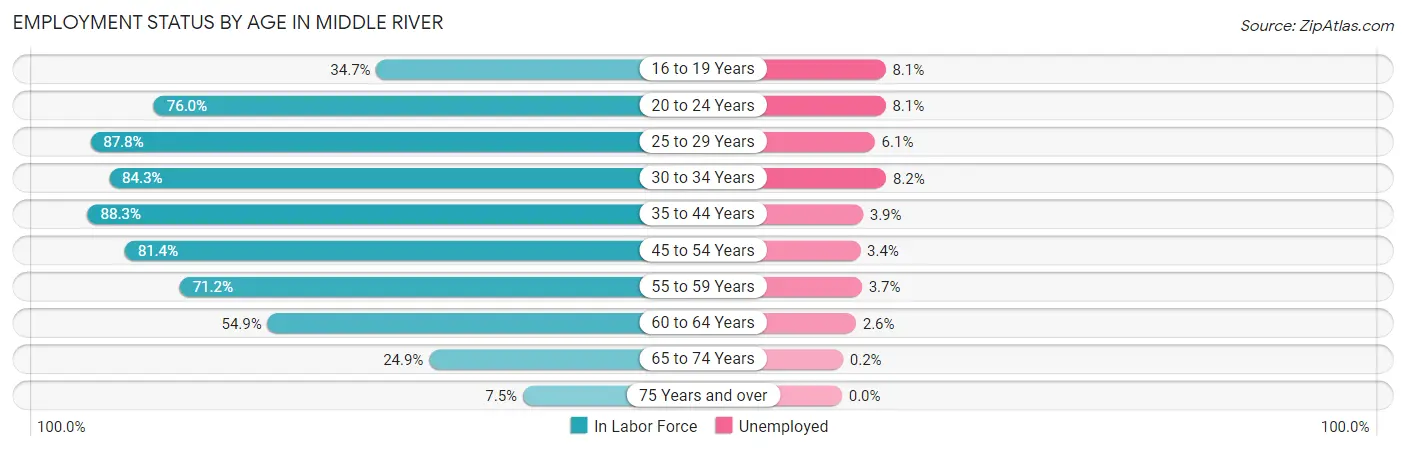
| Age Bracket | In Labor Force | Unemployed |
| 16 to 19 Years | 445 (34.7%) | 36 (8.1%) |
| 20 to 24 Years | 1,572 (76.0%) | 127 (8.1%) |
| 25 to 29 Years | 2,332 (87.8%) | 142 (6.1%) |
| 30 to 34 Years | 1,967 (84.3%) | 161 (8.2%) |
| 35 to 44 Years | 3,572 (88.3%) | 139 (3.9%) |
| 45 to 54 Years | 3,328 (81.4%) | 113 (3.4%) |
| 55 to 59 Years | 1,533 (71.2%) | 57 (3.7%) |
| 60 to 64 Years | 1,140 (54.9%) | 30 (2.6%) |
| 65 to 74 Years | 620 (24.9%) | 1 (0.2%) |
| 75 Years and over | 127 (7.5%) | 0 (0.0%) |
| Total | 16,645 (66.9%) | 816 (4.9%) |
Employment Status by Educational Attainment in Middle River
According to labor force statistics for Middle River, 79.9% of individuals (13,863) out of the total population between 25 and 64 years of age (17,351) are in the labor force, with 4.6% or 638 of them being unemployed. The group with the highest labor force participation rate are those with the educational attainment of bachelor's degree or higher, with 93.5% or 5,286 individuals in the labor force. Within the labor force, individuals with less than high school education have the highest percentage of unemployment, with 17.6% or 164 of them being unemployed.
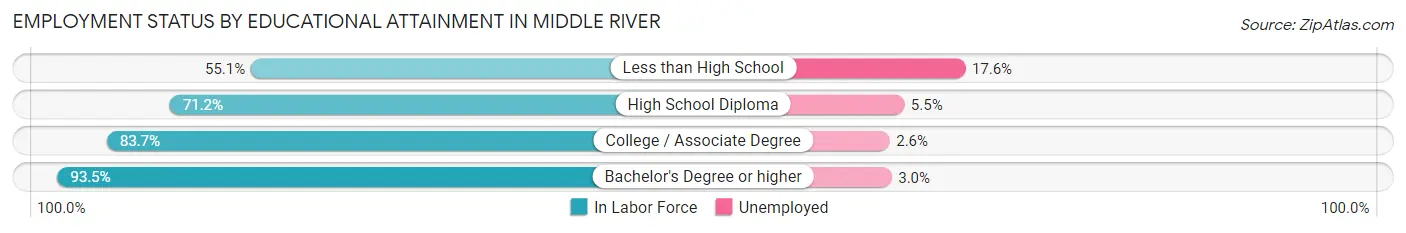
| Educational Attainment | In Labor Force | Unemployed |
| Less than High School | 932 (55.1%) | 298 (17.6%) |
| High School Diploma | 4,134 (71.2%) | 319 (5.5%) |
| College / Associate Degree | 3,515 (83.7%) | 109 (2.6%) |
| Bachelor's Degree or higher | 5,286 (93.5%) | 170 (3.0%) |
| Total | 13,863 (79.9%) | 798 (4.6%) |
Employment Occupations by Sex in Middle River
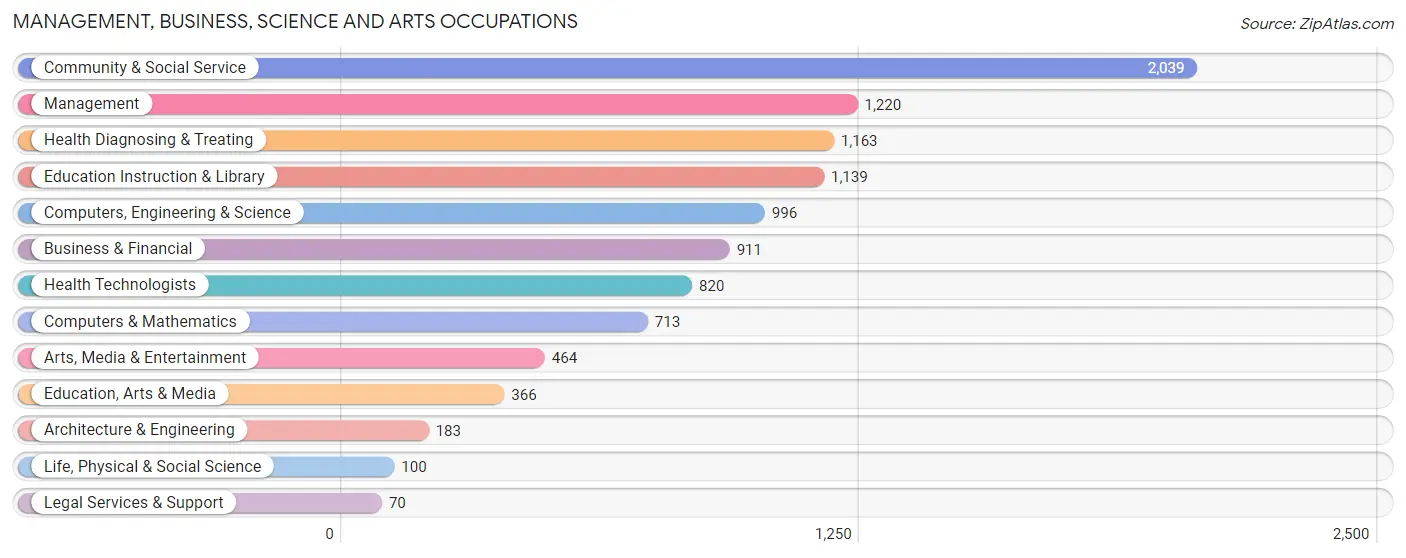
Management, Business, Science and Arts Occupations
The most common Management, Business, Science and Arts occupations in Middle River are Community & Social Service (2,039 | 12.9%), Management (1,220 | 7.7%), Health Diagnosing & Treating (1,163 | 7.4%), Education Instruction & Library (1,139 | 7.2%), and Computers, Engineering & Science (996 | 6.3%).
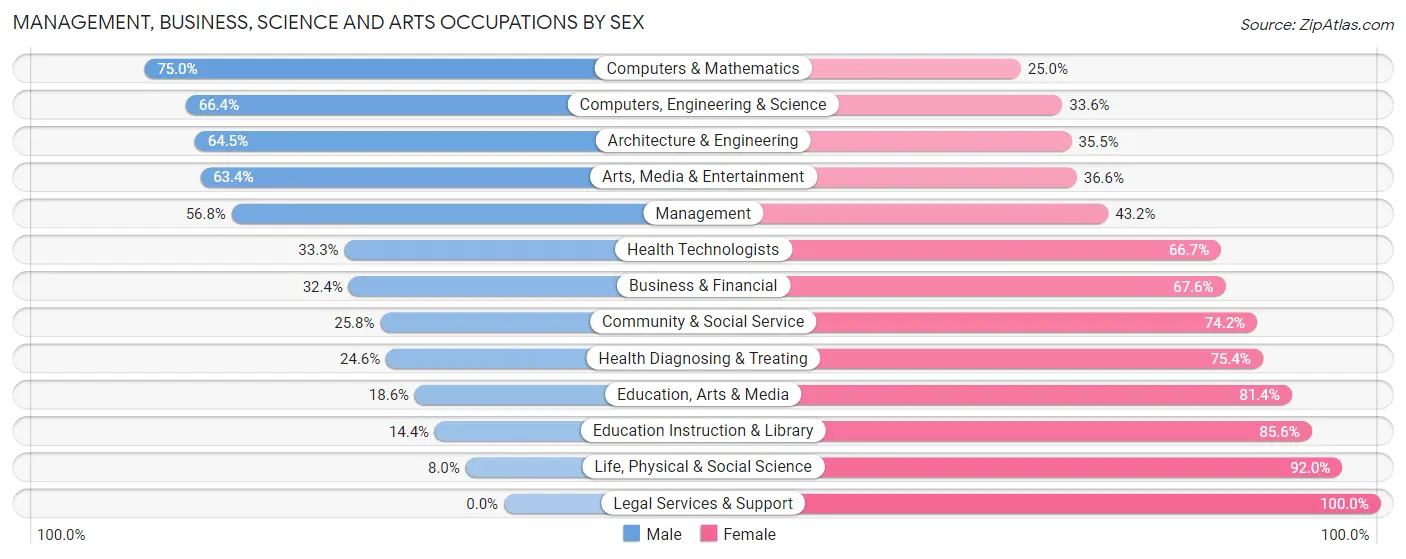
Management, Business, Science and Arts Occupations by Sex
Within the Management, Business, Science and Arts occupations in Middle River, the most male-oriented occupations are Computers & Mathematics (75.0%), Computers, Engineering & Science (66.4%), and Architecture & Engineering (64.5%), while the most female-oriented occupations are Legal Services & Support (100.0%), Life, Physical & Social Science (92.0%), and Education Instruction & Library (85.6%).
| Occupation | Male | Female |
| Management | 693 (56.8%) | 527 (43.2%) |
| Business & Financial | 295 (32.4%) | 616 (67.6%) |
| Computers, Engineering & Science | 661 (66.4%) | 335 (33.6%) |
| Computers & Mathematics | 535 (75.0%) | 178 (25.0%) |
| Architecture & Engineering | 118 (64.5%) | 65 (35.5%) |
| Life, Physical & Social Science | 8 (8.0%) | 92 (92.0%) |
| Community & Social Service | 526 (25.8%) | 1,513 (74.2%) |
| Education, Arts & Media | 68 (18.6%) | 298 (81.4%) |
| Legal Services & Support | 0 (0.0%) | 70 (100.0%) |
| Education Instruction & Library | 164 (14.4%) | 975 (85.6%) |
| Arts, Media & Entertainment | 294 (63.4%) | 170 (36.6%) |
| Health Diagnosing & Treating | 286 (24.6%) | 877 (75.4%) |
| Health Technologists | 273 (33.3%) | 547 (66.7%) |
| Total (Category) | 2,461 (38.9%) | 3,868 (61.1%) |
| Total (Overall) | 7,053 (44.7%) | 8,729 (55.3%) |
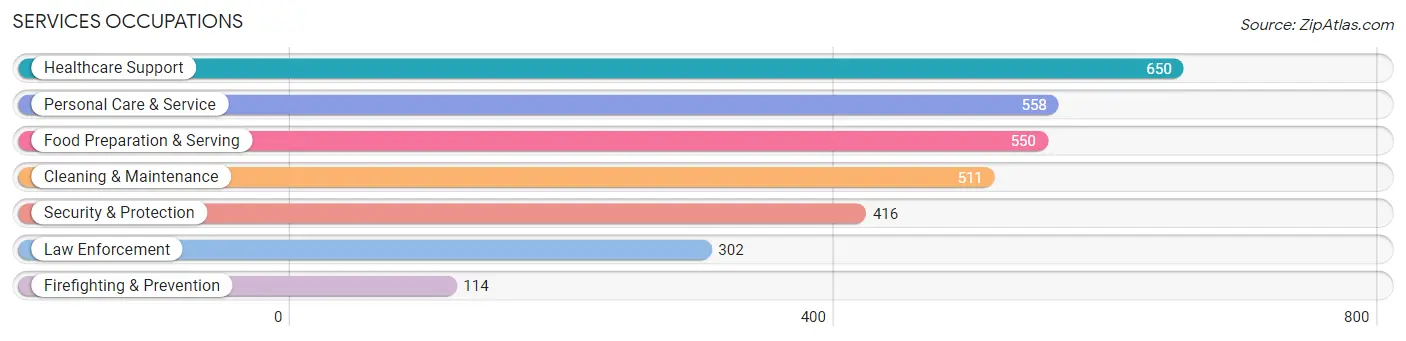
Services Occupations
The most common Services occupations in Middle River are Healthcare Support (650 | 4.1%), Personal Care & Service (558 | 3.5%), Food Preparation & Serving (550 | 3.5%), Cleaning & Maintenance (511 | 3.2%), and Security & Protection (416 | 2.6%).
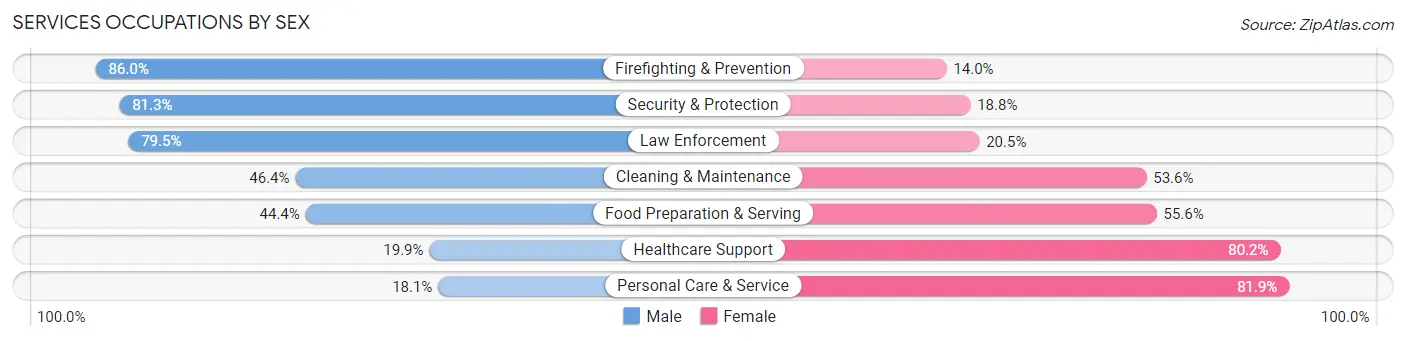
Services Occupations by Sex
Within the Services occupations in Middle River, the most male-oriented occupations are Firefighting & Prevention (86.0%), Security & Protection (81.2%), and Law Enforcement (79.5%), while the most female-oriented occupations are Personal Care & Service (81.9%), Healthcare Support (80.1%), and Food Preparation & Serving (55.6%).
| Occupation | Male | Female |
| Healthcare Support | 129 (19.9%) | 521 (80.1%) |
| Security & Protection | 338 (81.2%) | 78 (18.8%) |
| Firefighting & Prevention | 98 (86.0%) | 16 (14.0%) |
| Law Enforcement | 240 (79.5%) | 62 (20.5%) |
| Food Preparation & Serving | 244 (44.4%) | 306 (55.6%) |
| Cleaning & Maintenance | 237 (46.4%) | 274 (53.6%) |
| Personal Care & Service | 101 (18.1%) | 457 (81.9%) |
| Total (Category) | 1,049 (39.1%) | 1,636 (60.9%) |
| Total (Overall) | 7,053 (44.7%) | 8,729 (55.3%) |
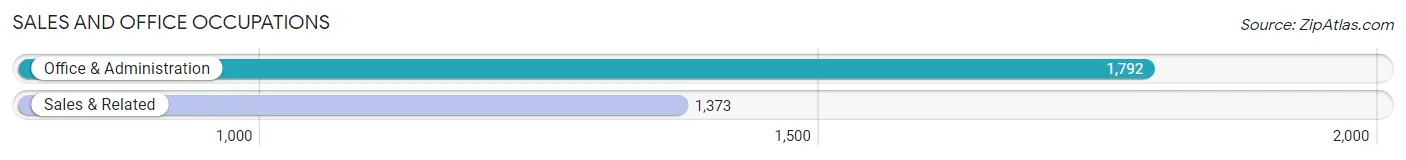
Sales and Office Occupations
The most common Sales and Office occupations in Middle River are Office & Administration (1,792 | 11.4%), and Sales & Related (1,373 | 8.7%).
Sales and Office Occupations by Sex
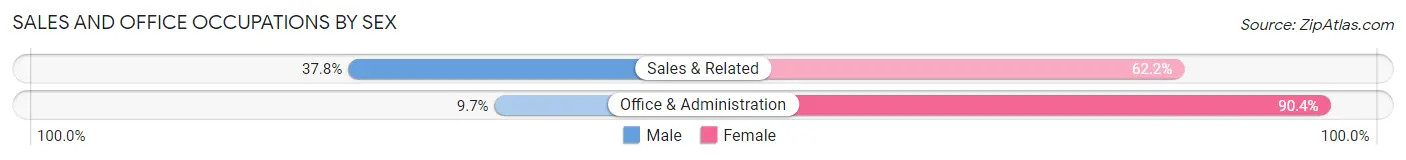
| Occupation | Male | Female |
| Sales & Related | 519 (37.8%) | 854 (62.2%) |
| Office & Administration | 173 (9.7%) | 1,619 (90.3%) |
| Total (Category) | 692 (21.9%) | 2,473 (78.1%) |
| Total (Overall) | 7,053 (44.7%) | 8,729 (55.3%) |
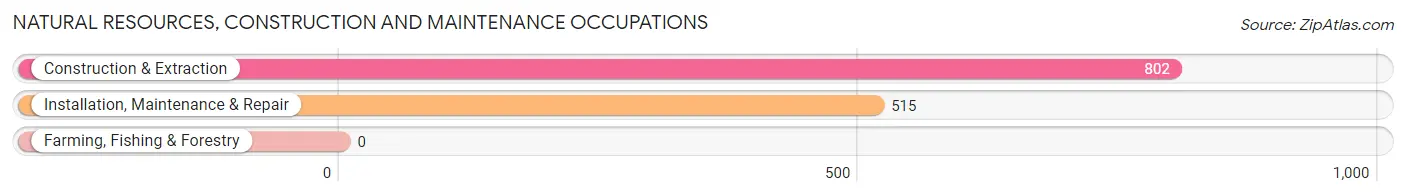
Natural Resources, Construction and Maintenance Occupations
The most common Natural Resources, Construction and Maintenance occupations in Middle River are Construction & Extraction (802 | 5.1%), and Installation, Maintenance & Repair (515 | 3.3%).
Natural Resources, Construction and Maintenance Occupations by Sex
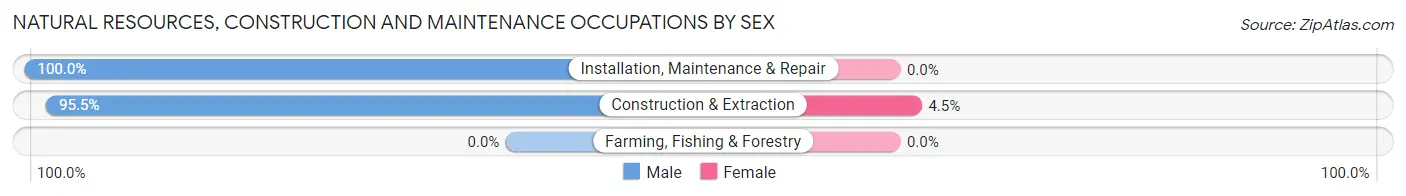
| Occupation | Male | Female |
| Farming, Fishing & Forestry | 0 (0.0%) | 0 (0.0%) |
| Construction & Extraction | 766 (95.5%) | 36 (4.5%) |
| Installation, Maintenance & Repair | 515 (100.0%) | 0 (0.0%) |
| Total (Category) | 1,281 (97.3%) | 36 (2.7%) |
| Total (Overall) | 7,053 (44.7%) | 8,729 (55.3%) |
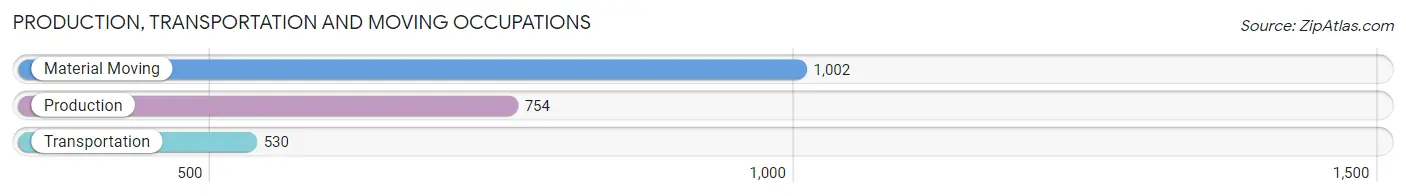
Production, Transportation and Moving Occupations
The most common Production, Transportation and Moving occupations in Middle River are Material Moving (1,002 | 6.4%), Production (754 | 4.8%), and Transportation (530 | 3.4%).
Production, Transportation and Moving Occupations by Sex
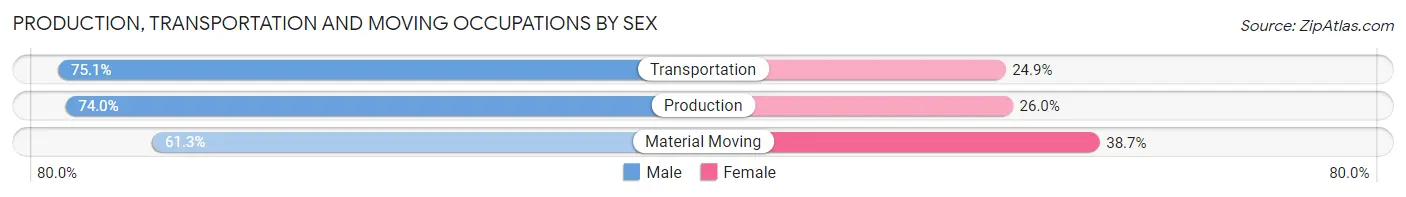
| Occupation | Male | Female |
| Production | 558 (74.0%) | 196 (26.0%) |
| Transportation | 398 (75.1%) | 132 (24.9%) |
| Material Moving | 614 (61.3%) | 388 (38.7%) |
| Total (Category) | 1,570 (68.7%) | 716 (31.3%) |
| Total (Overall) | 7,053 (44.7%) | 8,729 (55.3%) |
Employment Industries by Sex in Middle River
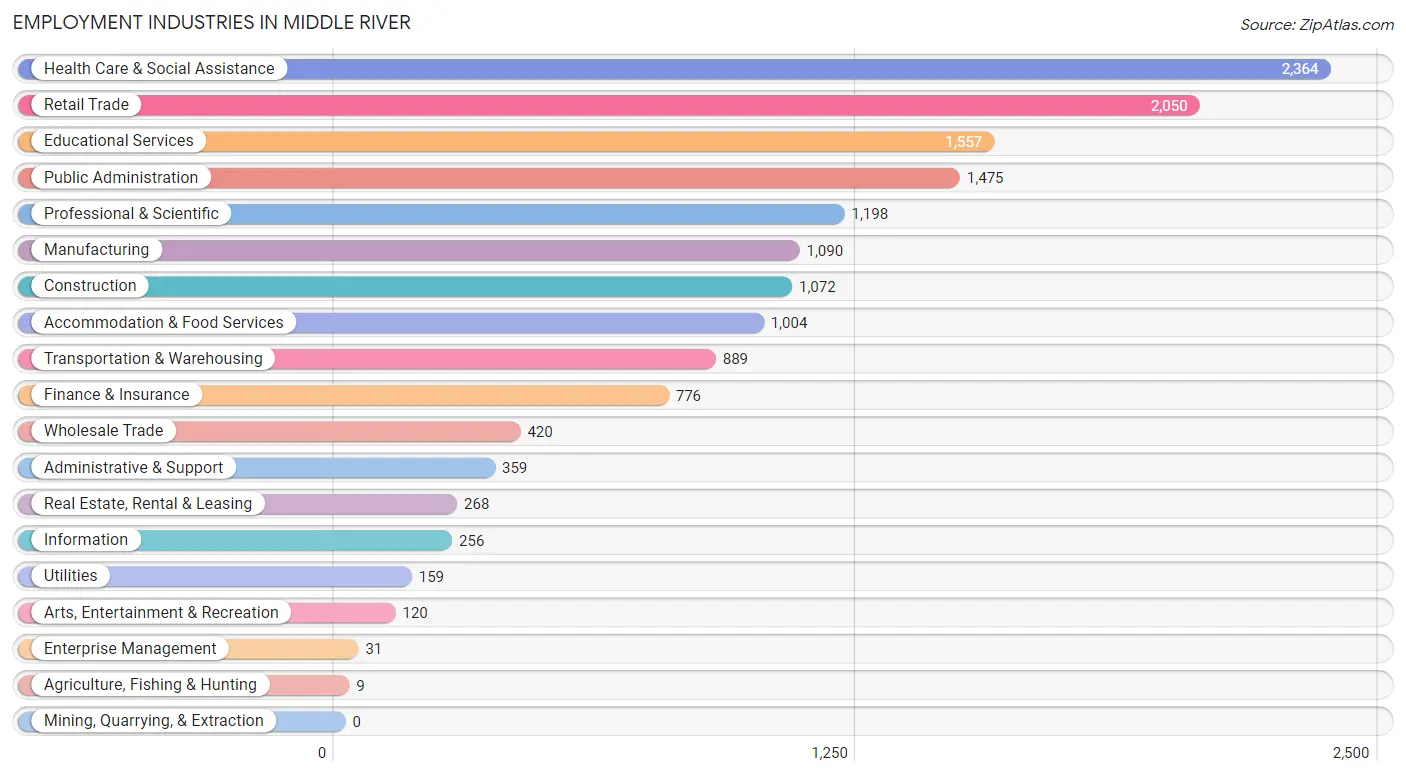
Employment Industries in Middle River
The major employment industries in Middle River include Health Care & Social Assistance (2,364 | 15.0%), Retail Trade (2,050 | 13.0%), Educational Services (1,557 | 9.9%), Public Administration (1,475 | 9.3%), and Professional & Scientific (1,198 | 7.6%).
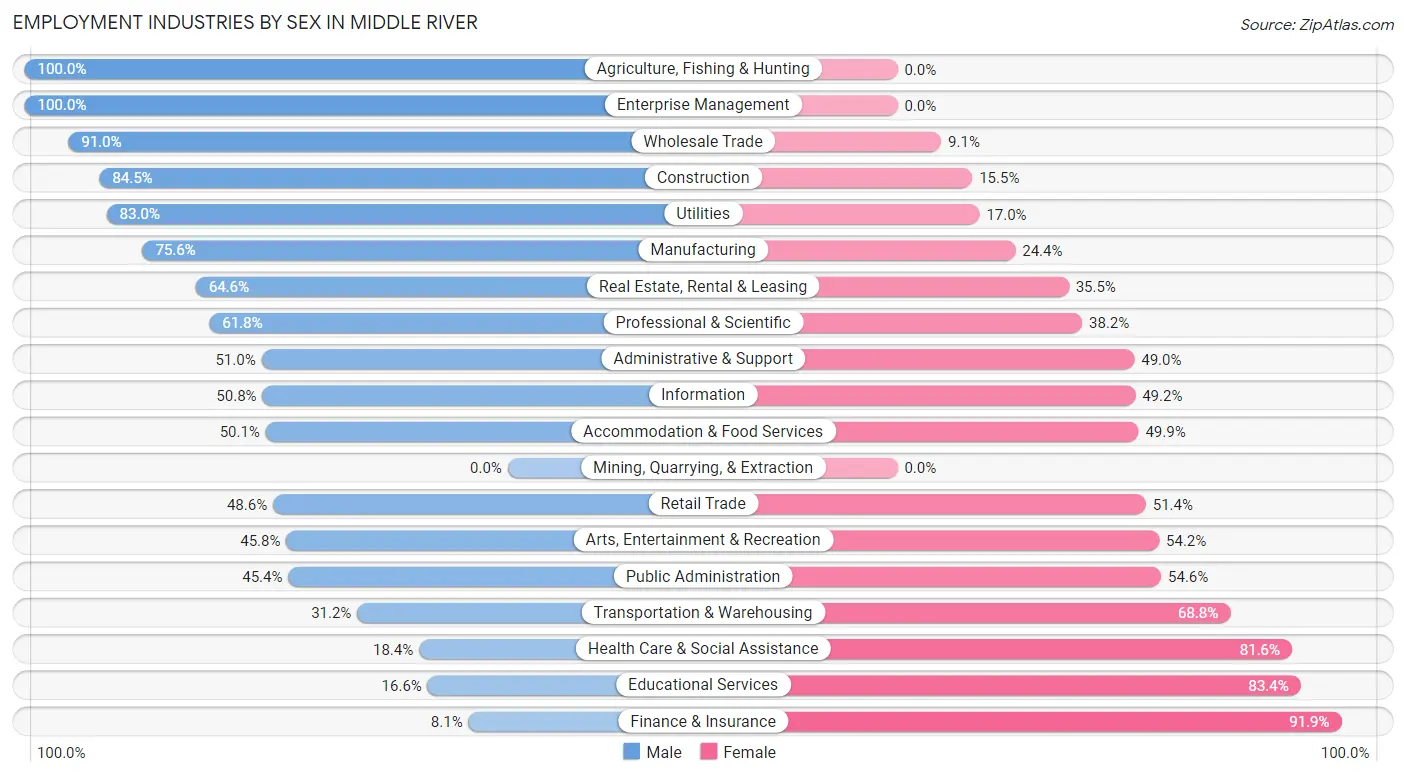
Employment Industries by Sex in Middle River
The Middle River industries that see more men than women are Agriculture, Fishing & Hunting (100.0%), Enterprise Management (100.0%), and Wholesale Trade (90.9%), whereas the industries that tend to have a higher number of women are Finance & Insurance (91.9%), Educational Services (83.4%), and Health Care & Social Assistance (81.6%).
| Industry | Male | Female |
| Agriculture, Fishing & Hunting | 9 (100.0%) | 0 (0.0%) |
| Mining, Quarrying, & Extraction | 0 (0.0%) | 0 (0.0%) |
| Construction | 906 (84.5%) | 166 (15.5%) |
| Manufacturing | 824 (75.6%) | 266 (24.4%) |
| Wholesale Trade | 382 (90.9%) | 38 (9.0%) |
| Retail Trade | 996 (48.6%) | 1,054 (51.4%) |
| Transportation & Warehousing | 277 (31.2%) | 612 (68.8%) |
| Utilities | 132 (83.0%) | 27 (17.0%) |
| Information | 130 (50.8%) | 126 (49.2%) |
| Finance & Insurance | 63 (8.1%) | 713 (91.9%) |
| Real Estate, Rental & Leasing | 173 (64.5%) | 95 (35.4%) |
| Professional & Scientific | 740 (61.8%) | 458 (38.2%) |
| Enterprise Management | 31 (100.0%) | 0 (0.0%) |
| Administrative & Support | 183 (51.0%) | 176 (49.0%) |
| Educational Services | 258 (16.6%) | 1,299 (83.4%) |
| Health Care & Social Assistance | 434 (18.4%) | 1,930 (81.6%) |
| Arts, Entertainment & Recreation | 55 (45.8%) | 65 (54.2%) |
| Accommodation & Food Services | 503 (50.1%) | 501 (49.9%) |
| Public Administration | 670 (45.4%) | 805 (54.6%) |
| Total | 7,053 (44.7%) | 8,729 (55.3%) |
Education in Middle River
School Enrollment in Middle River
The most common levels of schooling among the 6,397 students in Middle River are elementary school (1,456 | 22.8%), high school (1,330 | 20.8%), and middle school (1,163 | 18.2%).
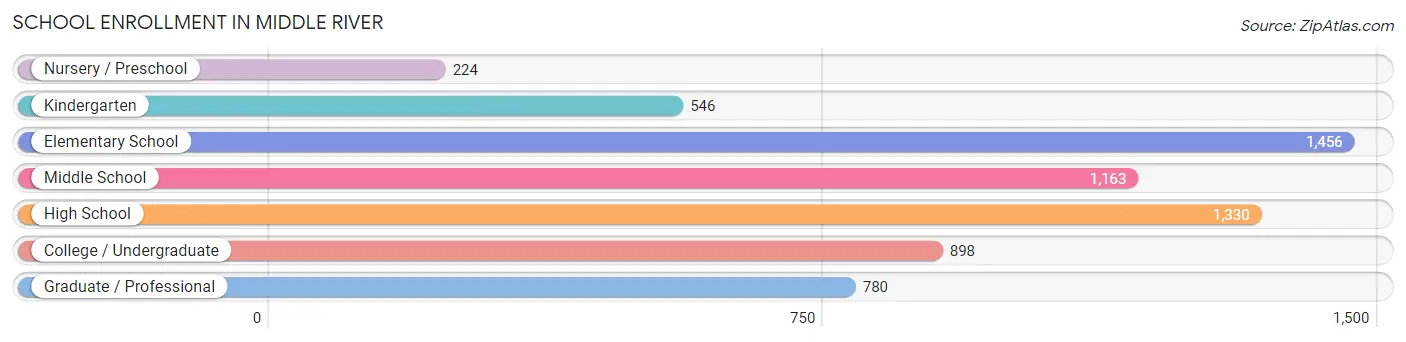
| School Level | # Students | % Students |
| Nursery / Preschool | 224 | 3.5% |
| Kindergarten | 546 | 8.5% |
| Elementary School | 1,456 | 22.8% |
| Middle School | 1,163 | 18.2% |
| High School | 1,330 | 20.8% |
| College / Undergraduate | 898 | 14.0% |
| Graduate / Professional | 780 | 12.2% |
| Total | 6,397 | 100.0% |
School Enrollment by Age by Funding Source in Middle River
Out of a total of 6,397 students who are enrolled in schools in Middle River, 864 (13.5%) attend a private institution, while the remaining 5,533 (86.5%) are enrolled in public schools. The age group of 35 years and over has the highest likelihood of being enrolled in private schools, with 177 (43.4% in the age bracket) enrolled. Conversely, the age group of 18 to 19 year olds has the lowest likelihood of being enrolled in a private school, with 527 (99.4% in the age bracket) attending a public institution.
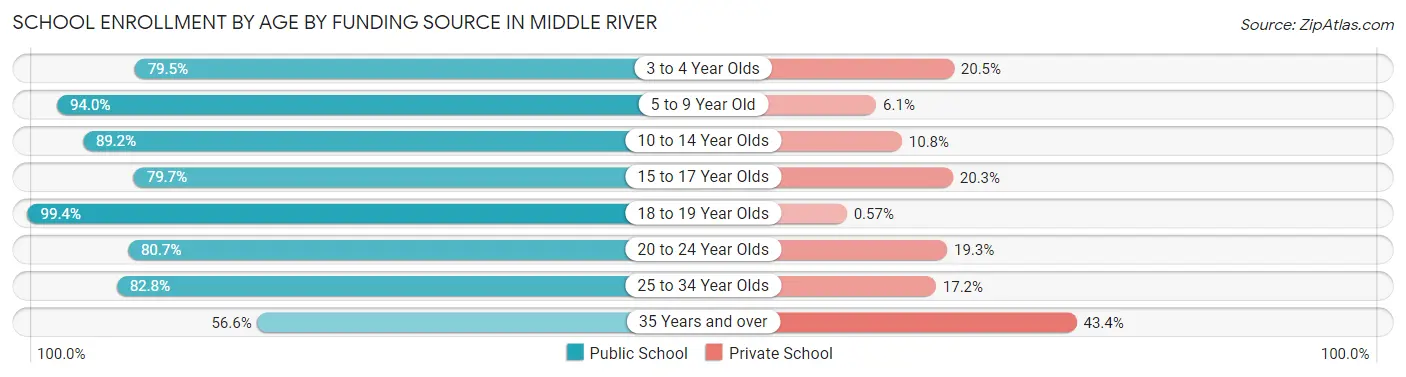
| Age Bracket | Public School | Private School |
| 3 to 4 Year Olds | 213 (79.5%) | 55 (20.5%) |
| 5 to 9 Year Old | 1,709 (94.0%) | 110 (6.0%) |
| 10 to 14 Year Olds | 1,300 (89.2%) | 158 (10.8%) |
| 15 to 17 Year Olds | 568 (79.7%) | 145 (20.3%) |
| 18 to 19 Year Olds | 527 (99.4%) | 3 (0.6%) |
| 20 to 24 Year Olds | 457 (80.7%) | 109 (19.3%) |
| 25 to 34 Year Olds | 526 (82.8%) | 109 (17.2%) |
| 35 Years and over | 231 (56.6%) | 177 (43.4%) |
| Total | 5,533 (86.5%) | 864 (13.5%) |
Educational Attainment by Field of Study in Middle River
Business (1,309 | 19.5%), education (888 | 13.2%), science & technology (861 | 12.8%), arts & humanities (660 | 9.8%), and engineering (585 | 8.7%) are the most common fields of study among 6,716 individuals in Middle River who have obtained a bachelor's degree or higher.
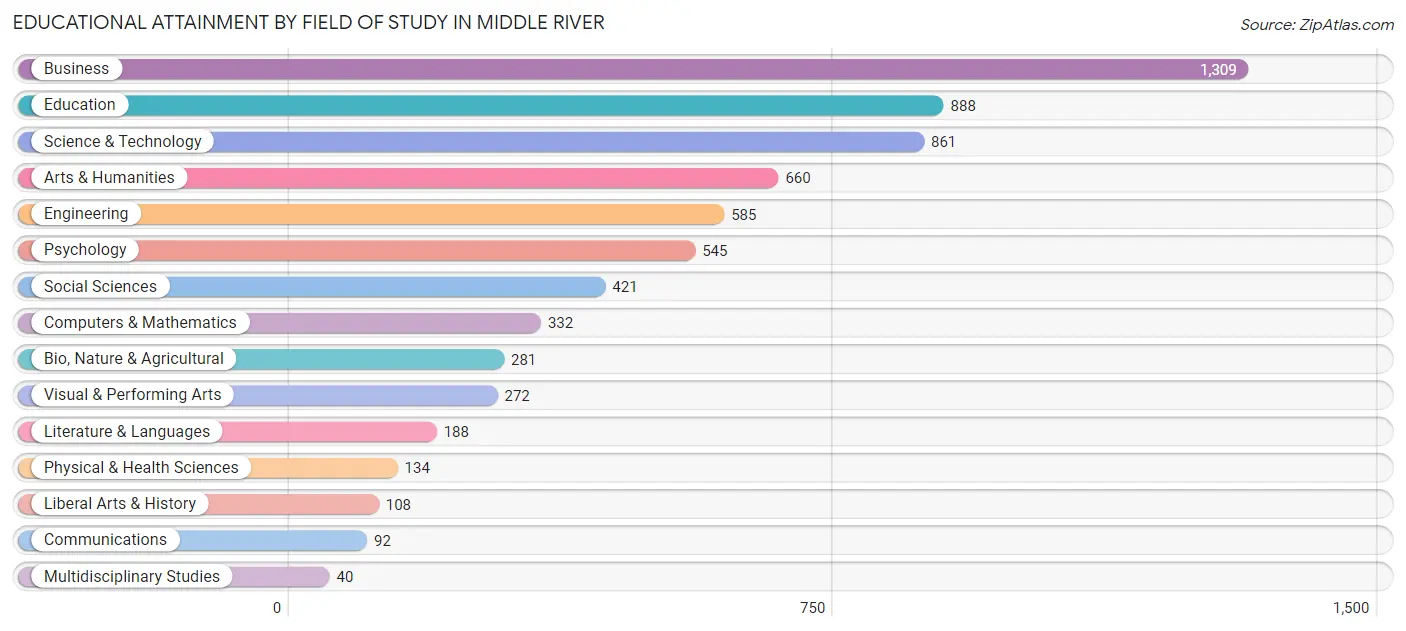
| Field of Study | # Graduates | % Graduates |
| Computers & Mathematics | 332 | 4.9% |
| Bio, Nature & Agricultural | 281 | 4.2% |
| Physical & Health Sciences | 134 | 2.0% |
| Psychology | 545 | 8.1% |
| Social Sciences | 421 | 6.3% |
| Engineering | 585 | 8.7% |
| Multidisciplinary Studies | 40 | 0.6% |
| Science & Technology | 861 | 12.8% |
| Business | 1,309 | 19.5% |
| Education | 888 | 13.2% |
| Literature & Languages | 188 | 2.8% |
| Liberal Arts & History | 108 | 1.6% |
| Visual & Performing Arts | 272 | 4.1% |
| Communications | 92 | 1.4% |
| Arts & Humanities | 660 | 9.8% |
| Total | 6,716 | 100.0% |
Transportation & Commute in Middle River
Vehicle Availability by Sex in Middle River
The most prevalent vehicle ownership categories in Middle River are males with 2 vehicles (2,973, accounting for 42.5%) and females with 2 vehicles (3,082, making up 34.8%).
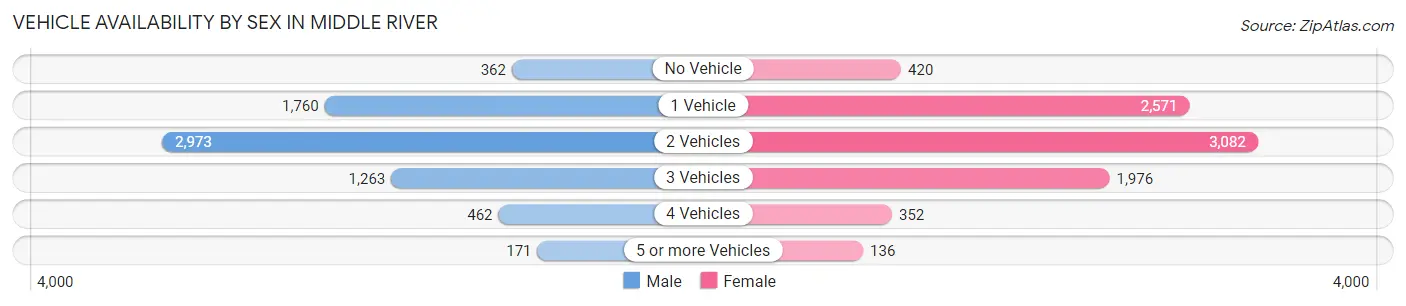
| Vehicles Available | Male | Female |
| No Vehicle | 362 (5.2%) | 420 (4.9%) |
| 1 Vehicle | 1,760 (25.2%) | 2,571 (30.1%) |
| 2 Vehicles | 2,973 (42.5%) | 3,082 (36.1%) |
| 3 Vehicles | 1,263 (18.1%) | 1,976 (23.2%) |
| 4 Vehicles | 462 (6.6%) | 352 (4.1%) |
| 5 or more Vehicles | 171 (2.5%) | 136 (1.6%) |
| Total | 6,991 (100.0%) | 8,537 (100.0%) |
Commute Time in Middle River
The most frequently occuring commute durations in Middle River are 20 to 24 minutes (2,087 commuters, 14.6%), 30 to 34 minutes (2,054 commuters, 14.3%), and 10 to 14 minutes (1,808 commuters, 12.6%).
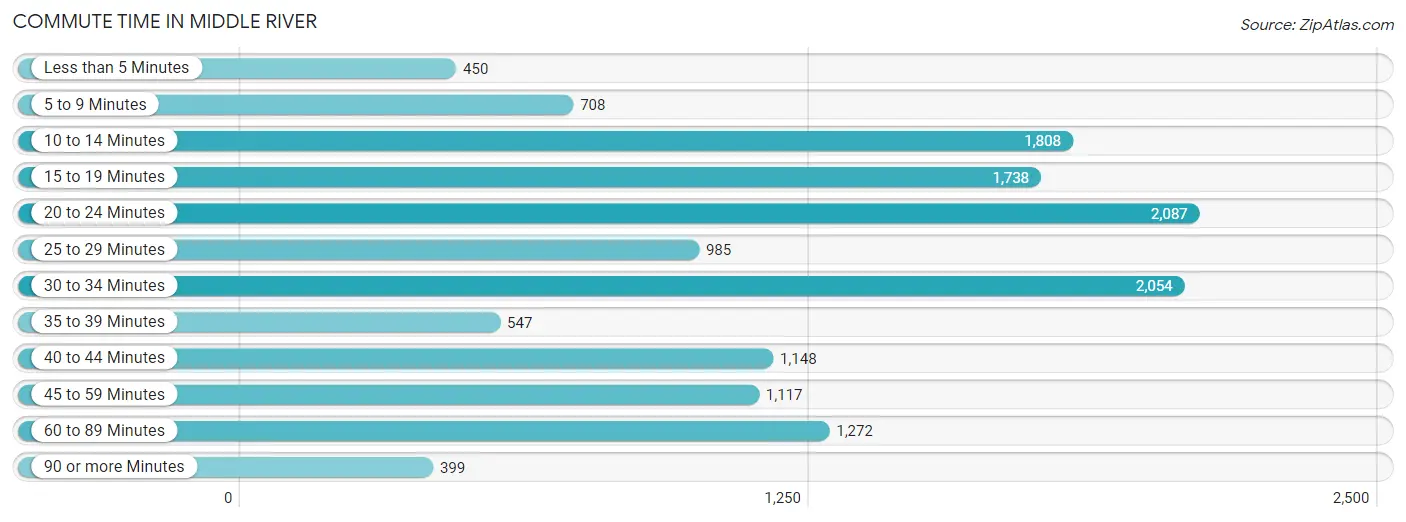
| Commute Time | # Commuters | % Commuters |
| Less than 5 Minutes | 450 | 3.1% |
| 5 to 9 Minutes | 708 | 5.0% |
| 10 to 14 Minutes | 1,808 | 12.6% |
| 15 to 19 Minutes | 1,738 | 12.1% |
| 20 to 24 Minutes | 2,087 | 14.6% |
| 25 to 29 Minutes | 985 | 6.9% |
| 30 to 34 Minutes | 2,054 | 14.3% |
| 35 to 39 Minutes | 547 | 3.8% |
| 40 to 44 Minutes | 1,148 | 8.0% |
| 45 to 59 Minutes | 1,117 | 7.8% |
| 60 to 89 Minutes | 1,272 | 8.9% |
| 90 or more Minutes | 399 | 2.8% |
Commute Time by Sex in Middle River
The most common commute times in Middle River are 30 to 34 minutes (1,074 commuters, 16.5%) for males and 20 to 24 minutes (1,214 commuters, 15.6%) for females.
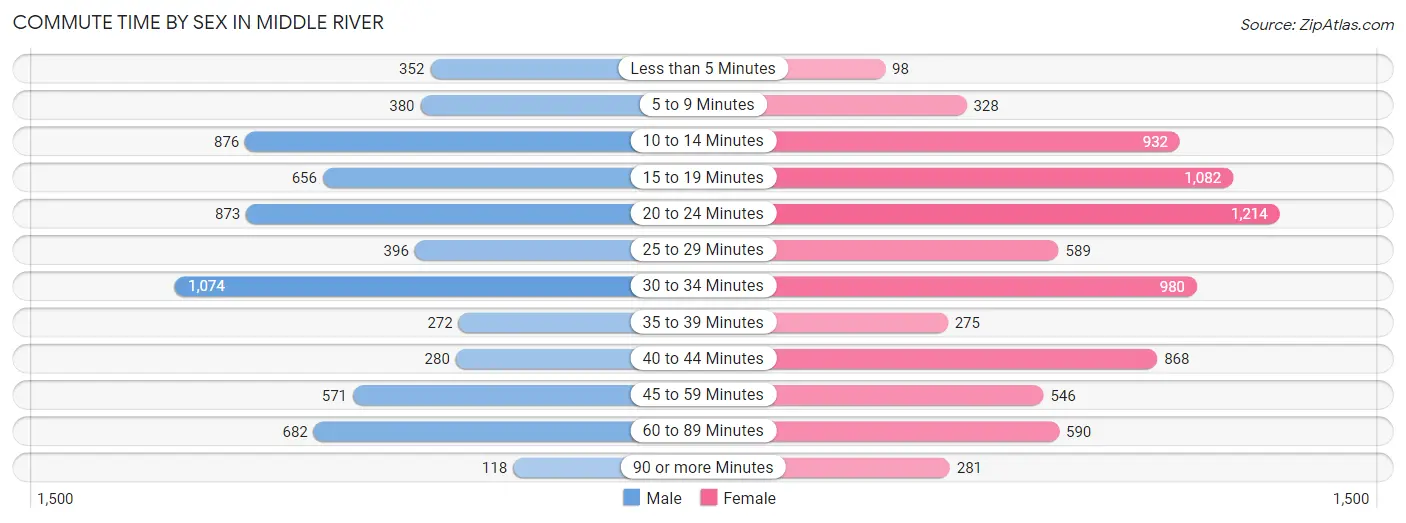
| Commute Time | Male | Female |
| Less than 5 Minutes | 352 (5.4%) | 98 (1.3%) |
| 5 to 9 Minutes | 380 (5.8%) | 328 (4.2%) |
| 10 to 14 Minutes | 876 (13.4%) | 932 (12.0%) |
| 15 to 19 Minutes | 656 (10.1%) | 1,082 (13.9%) |
| 20 to 24 Minutes | 873 (13.4%) | 1,214 (15.6%) |
| 25 to 29 Minutes | 396 (6.1%) | 589 (7.6%) |
| 30 to 34 Minutes | 1,074 (16.5%) | 980 (12.6%) |
| 35 to 39 Minutes | 272 (4.2%) | 275 (3.5%) |
| 40 to 44 Minutes | 280 (4.3%) | 868 (11.2%) |
| 45 to 59 Minutes | 571 (8.7%) | 546 (7.0%) |
| 60 to 89 Minutes | 682 (10.4%) | 590 (7.6%) |
| 90 or more Minutes | 118 (1.8%) | 281 (3.6%) |
Time of Departure to Work by Sex in Middle River
The most frequent times of departure to work in Middle River are 7:00 AM to 7:29 AM (1,020, 15.6%) for males and 7:00 AM to 7:29 AM (1,861, 23.9%) for females.
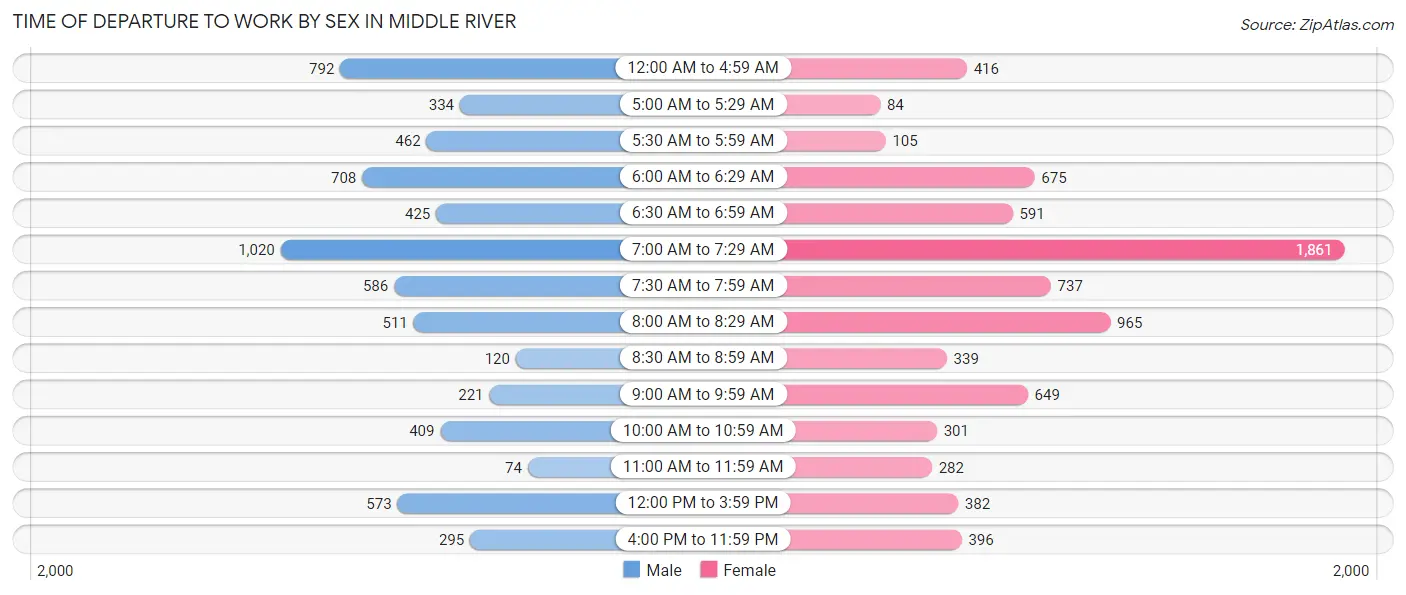
| Time of Departure | Male | Female |
| 12:00 AM to 4:59 AM | 792 (12.1%) | 416 (5.3%) |
| 5:00 AM to 5:29 AM | 334 (5.1%) | 84 (1.1%) |
| 5:30 AM to 5:59 AM | 462 (7.1%) | 105 (1.3%) |
| 6:00 AM to 6:29 AM | 708 (10.8%) | 675 (8.7%) |
| 6:30 AM to 6:59 AM | 425 (6.5%) | 591 (7.6%) |
| 7:00 AM to 7:29 AM | 1,020 (15.6%) | 1,861 (23.9%) |
| 7:30 AM to 7:59 AM | 586 (9.0%) | 737 (9.5%) |
| 8:00 AM to 8:29 AM | 511 (7.8%) | 965 (12.4%) |
| 8:30 AM to 8:59 AM | 120 (1.8%) | 339 (4.4%) |
| 9:00 AM to 9:59 AM | 221 (3.4%) | 649 (8.3%) |
| 10:00 AM to 10:59 AM | 409 (6.3%) | 301 (3.9%) |
| 11:00 AM to 11:59 AM | 74 (1.1%) | 282 (3.6%) |
| 12:00 PM to 3:59 PM | 573 (8.8%) | 382 (4.9%) |
| 4:00 PM to 11:59 PM | 295 (4.5%) | 396 (5.1%) |
| Total | 6,530 (100.0%) | 7,783 (100.0%) |
Housing Occupancy in Middle River
Occupancy by Ownership in Middle River
Of the total 12,082 dwellings in Middle River, owner-occupied units account for 7,552 (62.5%), while renter-occupied units make up 4,530 (37.5%).
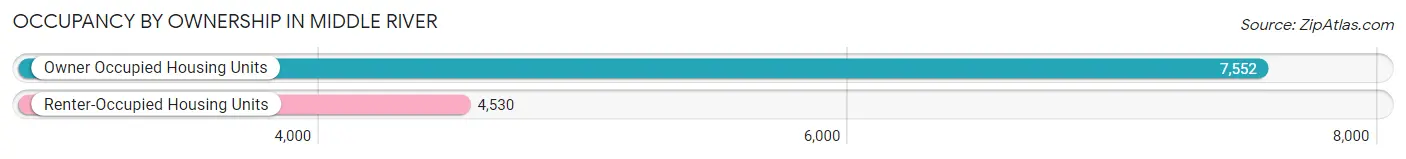
| Occupancy | # Housing Units | % Housing Units |
| Owner Occupied Housing Units | 7,552 | 62.5% |
| Renter-Occupied Housing Units | 4,530 | 37.5% |
| Total Occupied Housing Units | 12,082 | 100.0% |
Occupancy by Household Size in Middle River
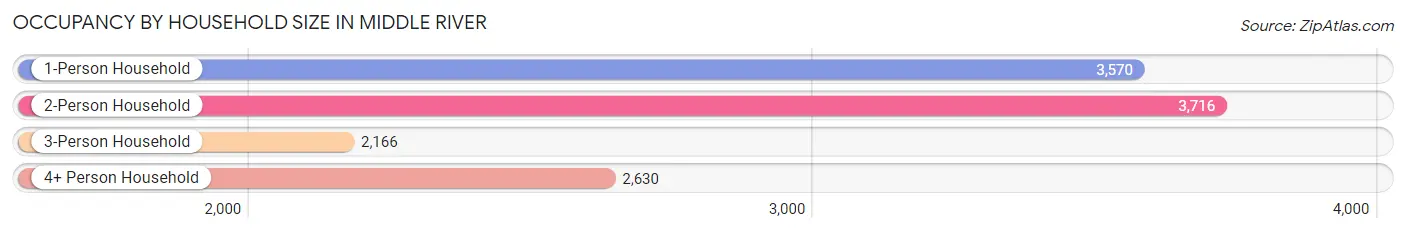
| Household Size | # Housing Units | % Housing Units |
| 1-Person Household | 3,570 | 29.5% |
| 2-Person Household | 3,716 | 30.8% |
| 3-Person Household | 2,166 | 17.9% |
| 4+ Person Household | 2,630 | 21.8% |
| Total Housing Units | 12,082 | 100.0% |
Occupancy by Ownership by Household Size in Middle River
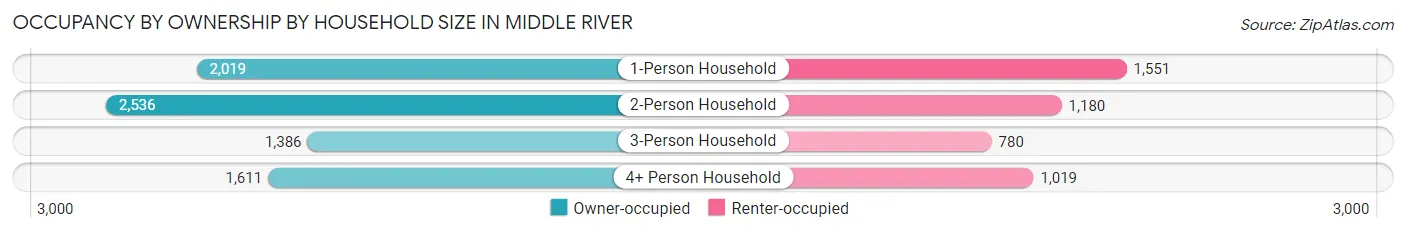
| Household Size | Owner-occupied | Renter-occupied |
| 1-Person Household | 2,019 (56.6%) | 1,551 (43.4%) |
| 2-Person Household | 2,536 (68.2%) | 1,180 (31.8%) |
| 3-Person Household | 1,386 (64.0%) | 780 (36.0%) |
| 4+ Person Household | 1,611 (61.3%) | 1,019 (38.8%) |
| Total Housing Units | 7,552 (62.5%) | 4,530 (37.5%) |
Occupancy by Educational Attainment in Middle River
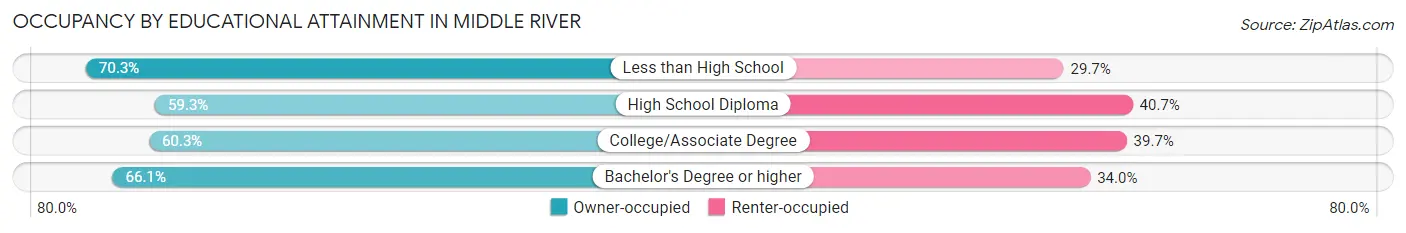
| Household Size | Owner-occupied | Renter-occupied |
| Less than High School | 780 (70.3%) | 330 (29.7%) |
| High School Diploma | 2,456 (59.3%) | 1,684 (40.7%) |
| College/Associate Degree | 2,048 (60.3%) | 1,350 (39.7%) |
| Bachelor's Degree or higher | 2,268 (66.0%) | 1,166 (34.0%) |
Occupancy by Age of Householder in Middle River
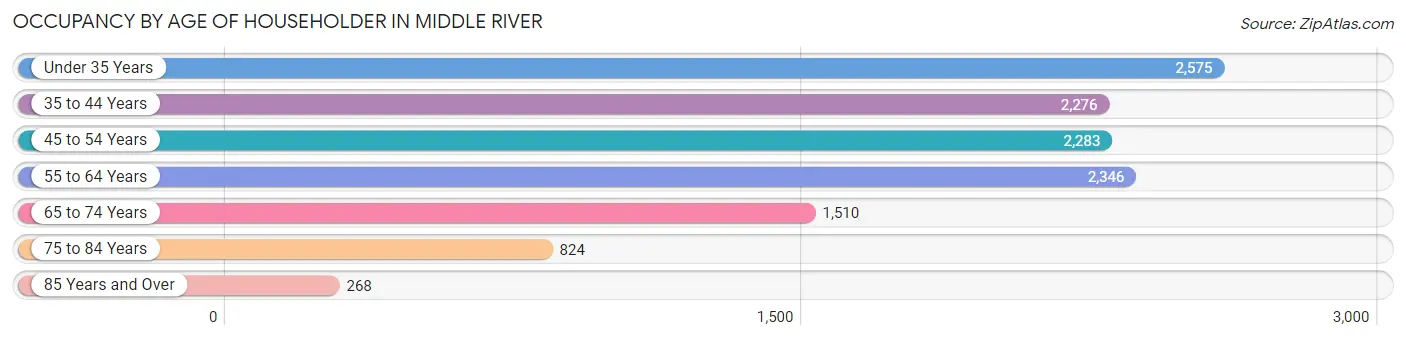
| Age Bracket | # Households | % Households |
| Under 35 Years | 2,575 | 21.3% |
| 35 to 44 Years | 2,276 | 18.8% |
| 45 to 54 Years | 2,283 | 18.9% |
| 55 to 64 Years | 2,346 | 19.4% |
| 65 to 74 Years | 1,510 | 12.5% |
| 75 to 84 Years | 824 | 6.8% |
| 85 Years and Over | 268 | 2.2% |
| Total | 12,082 | 100.0% |
Housing Finances in Middle River
Median Income by Occupancy in Middle River
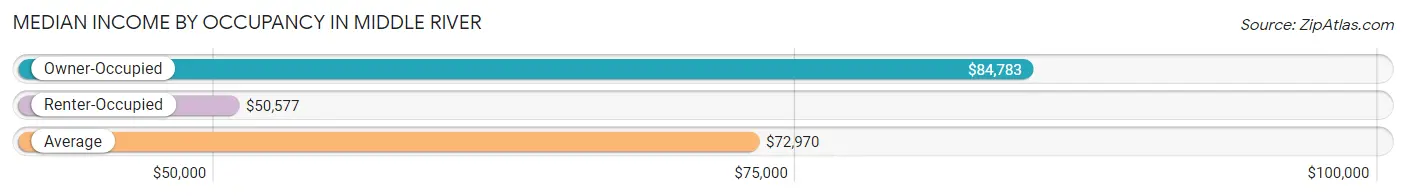
| Occupancy Type | # Households | Median Income |
| Owner-Occupied | 7,552 (62.5%) | $84,783 |
| Renter-Occupied | 4,530 (37.5%) | $50,577 |
| Average | 12,082 (100.0%) | $72,970 |
Occupancy by Householder Income Bracket in Middle River
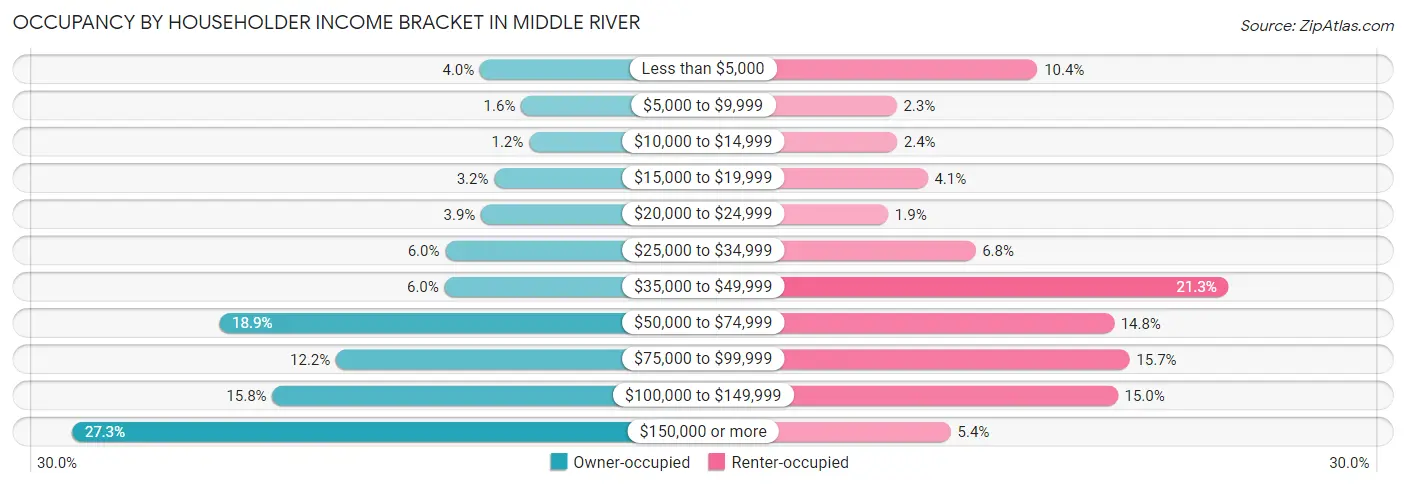
| Income Bracket | Owner-occupied | Renter-occupied |
| Less than $5,000 | 300 (4.0%) | 470 (10.4%) |
| $5,000 to $9,999 | 122 (1.6%) | 106 (2.3%) |
| $10,000 to $14,999 | 88 (1.2%) | 107 (2.4%) |
| $15,000 to $19,999 | 239 (3.2%) | 186 (4.1%) |
| $20,000 to $24,999 | 295 (3.9%) | 84 (1.8%) |
| $25,000 to $34,999 | 450 (6.0%) | 310 (6.8%) |
| $35,000 to $49,999 | 453 (6.0%) | 966 (21.3%) |
| $50,000 to $74,999 | 1,426 (18.9%) | 668 (14.7%) |
| $75,000 to $99,999 | 921 (12.2%) | 709 (15.7%) |
| $100,000 to $149,999 | 1,196 (15.8%) | 678 (15.0%) |
| $150,000 or more | 2,062 (27.3%) | 246 (5.4%) |
| Total | 7,552 (100.0%) | 4,530 (100.0%) |
Monthly Housing Cost Tiers in Middle River
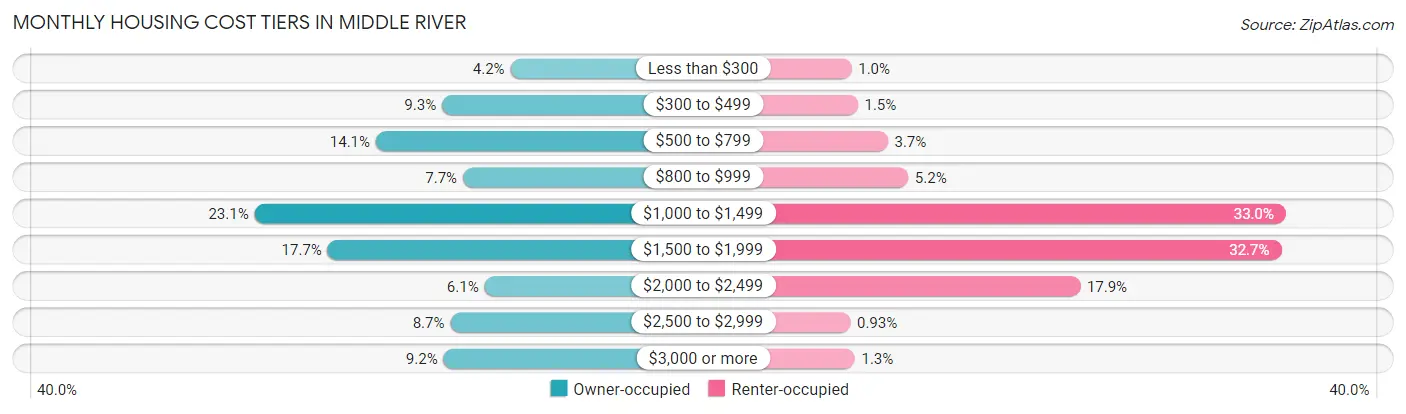
| Monthly Cost | Owner-occupied | Renter-occupied |
| Less than $300 | 319 (4.2%) | 46 (1.0%) |
| $300 to $499 | 699 (9.3%) | 67 (1.5%) |
| $500 to $799 | 1,067 (14.1%) | 167 (3.7%) |
| $800 to $999 | 583 (7.7%) | 235 (5.2%) |
| $1,000 to $1,499 | 1,742 (23.1%) | 1,496 (33.0%) |
| $1,500 to $1,999 | 1,335 (17.7%) | 1,481 (32.7%) |
| $2,000 to $2,499 | 463 (6.1%) | 809 (17.9%) |
| $2,500 to $2,999 | 653 (8.6%) | 42 (0.9%) |
| $3,000 or more | 691 (9.1%) | 57 (1.3%) |
| Total | 7,552 (100.0%) | 4,530 (100.0%) |
Physical Housing Characteristics in Middle River
Housing Structures in Middle River
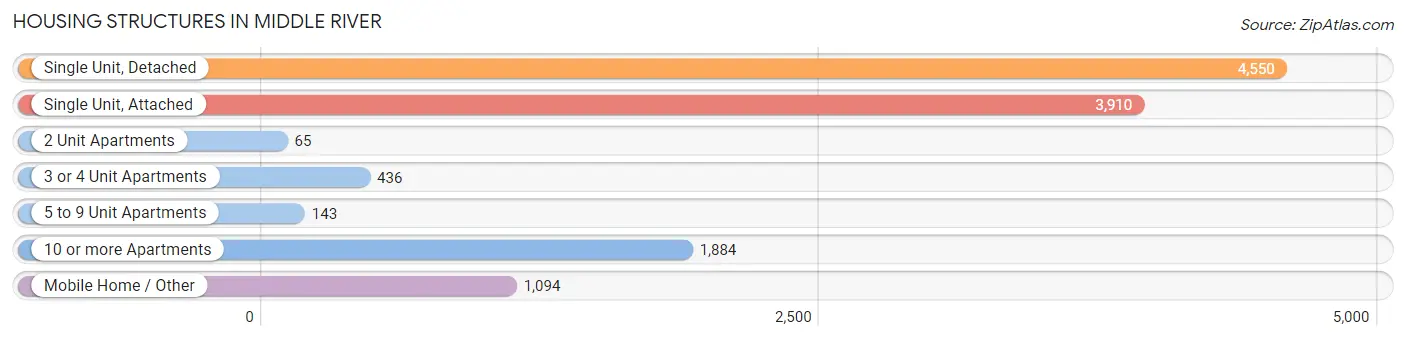
| Structure Type | # Housing Units | % Housing Units |
| Single Unit, Detached | 4,550 | 37.7% |
| Single Unit, Attached | 3,910 | 32.4% |
| 2 Unit Apartments | 65 | 0.5% |
| 3 or 4 Unit Apartments | 436 | 3.6% |
| 5 to 9 Unit Apartments | 143 | 1.2% |
| 10 or more Apartments | 1,884 | 15.6% |
| Mobile Home / Other | 1,094 | 9.0% |
| Total | 12,082 | 100.0% |
Housing Structures by Occupancy in Middle River
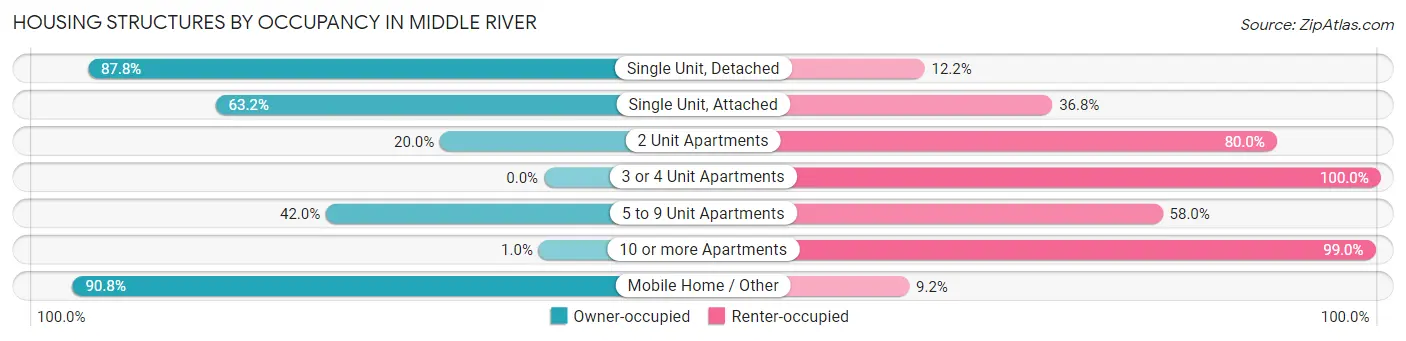
| Structure Type | Owner-occupied | Renter-occupied |
| Single Unit, Detached | 3,995 (87.8%) | 555 (12.2%) |
| Single Unit, Attached | 2,472 (63.2%) | 1,438 (36.8%) |
| 2 Unit Apartments | 13 (20.0%) | 52 (80.0%) |
| 3 or 4 Unit Apartments | 0 (0.0%) | 436 (100.0%) |
| 5 to 9 Unit Apartments | 60 (42.0%) | 83 (58.0%) |
| 10 or more Apartments | 19 (1.0%) | 1,865 (99.0%) |
| Mobile Home / Other | 993 (90.8%) | 101 (9.2%) |
| Total | 7,552 (62.5%) | 4,530 (37.5%) |
Housing Structures by Number of Rooms in Middle River
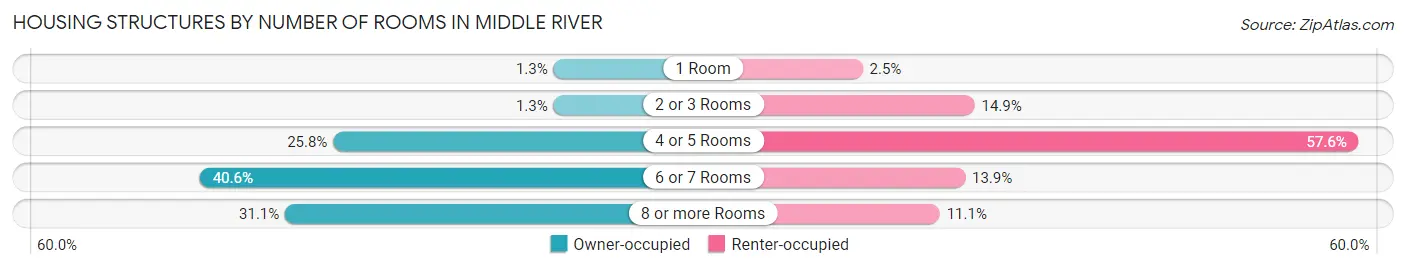
| Number of Rooms | Owner-occupied | Renter-occupied |
| 1 Room | 98 (1.3%) | 114 (2.5%) |
| 2 or 3 Rooms | 98 (1.3%) | 677 (14.9%) |
| 4 or 5 Rooms | 1,945 (25.8%) | 2,608 (57.6%) |
| 6 or 7 Rooms | 3,063 (40.6%) | 629 (13.9%) |
| 8 or more Rooms | 2,348 (31.1%) | 502 (11.1%) |
| Total | 7,552 (100.0%) | 4,530 (100.0%) |
Housing Structure by Heating Type in Middle River
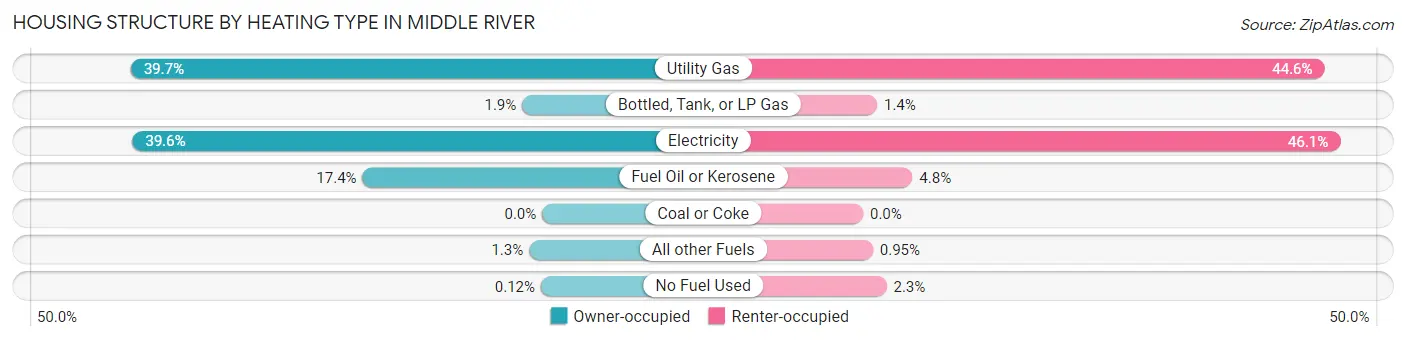
| Heating Type | Owner-occupied | Renter-occupied |
| Utility Gas | 3,001 (39.7%) | 2,019 (44.6%) |
| Bottled, Tank, or LP Gas | 146 (1.9%) | 61 (1.3%) |
| Electricity | 2,990 (39.6%) | 2,088 (46.1%) |
| Fuel Oil or Kerosene | 1,311 (17.4%) | 216 (4.8%) |
| Coal or Coke | 0 (0.0%) | 0 (0.0%) |
| All other Fuels | 95 (1.3%) | 43 (0.9%) |
| No Fuel Used | 9 (0.1%) | 103 (2.3%) |
| Total | 7,552 (100.0%) | 4,530 (100.0%) |
Household Vehicle Usage in Middle River
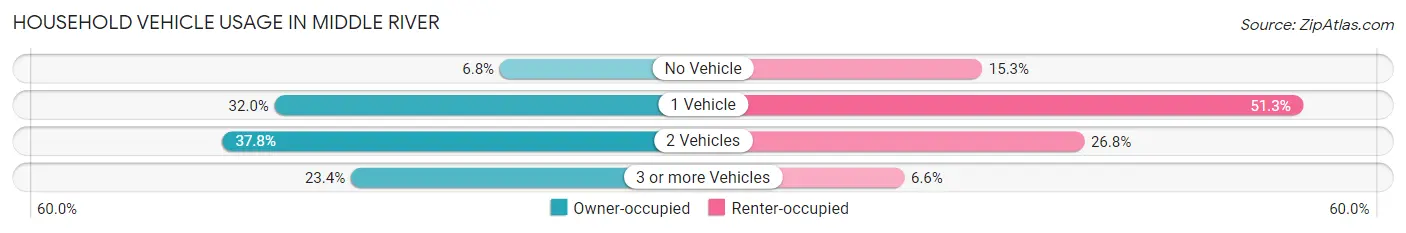
| Vehicles per Household | Owner-occupied | Renter-occupied |
| No Vehicle | 510 (6.8%) | 695 (15.3%) |
| 1 Vehicle | 2,416 (32.0%) | 2,322 (51.3%) |
| 2 Vehicles | 2,856 (37.8%) | 1,213 (26.8%) |
| 3 or more Vehicles | 1,770 (23.4%) | 300 (6.6%) |
| Total | 7,552 (100.0%) | 4,530 (100.0%) |
Real Estate & Mortgages in Middle River
Real Estate and Mortgage Overview in Middle River
| Characteristic | Without Mortgage | With Mortgage |
| Housing Units | 2,614 | 4,938 |
| Median Property Value | $190,200 | $265,800 |
| Median Household Income | $57,564 | $1,686 |
| Monthly Housing Costs | $615 | $684 |
| Real Estate Taxes | $2,722 | $302 |
Property Value by Mortgage Status in Middle River
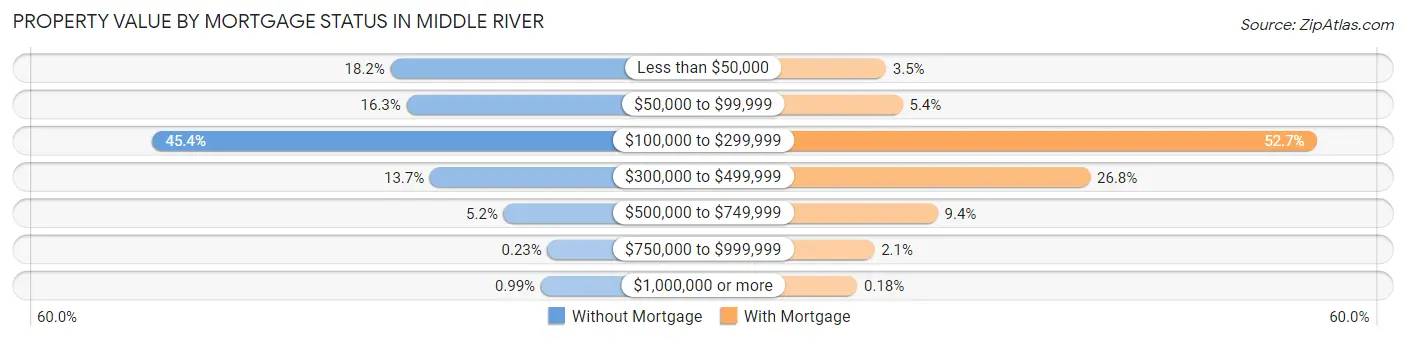
| Property Value | Without Mortgage | With Mortgage |
| Less than $50,000 | 475 (18.2%) | 171 (3.5%) |
| $50,000 to $99,999 | 427 (16.3%) | 265 (5.4%) |
| $100,000 to $299,999 | 1,186 (45.4%) | 2,601 (52.7%) |
| $300,000 to $499,999 | 357 (13.7%) | 1,324 (26.8%) |
| $500,000 to $749,999 | 137 (5.2%) | 463 (9.4%) |
| $750,000 to $999,999 | 6 (0.2%) | 105 (2.1%) |
| $1,000,000 or more | 26 (1.0%) | 9 (0.2%) |
| Total | 2,614 (100.0%) | 4,938 (100.0%) |
Household Income by Mortgage Status in Middle River
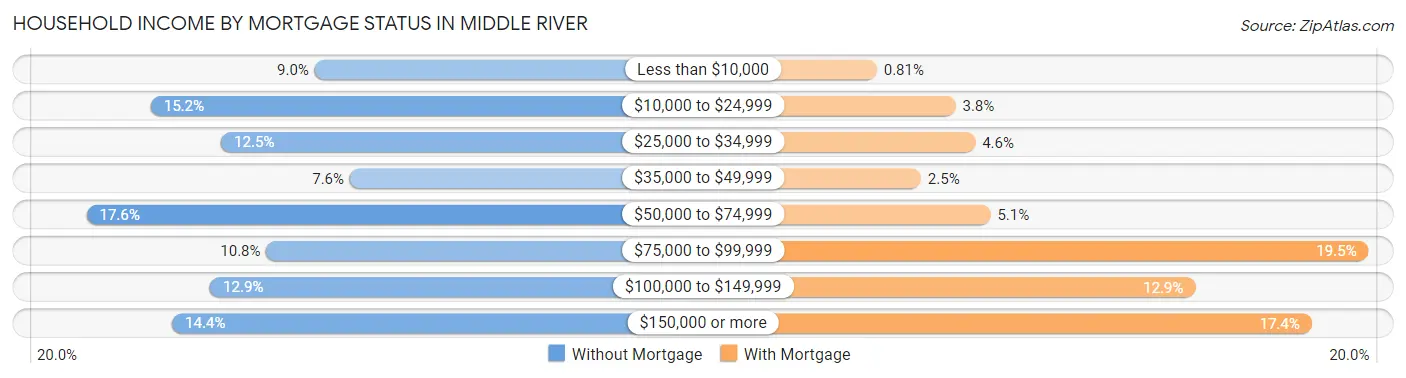
| Household Income | Without Mortgage | With Mortgage |
| Less than $10,000 | 234 (8.9%) | 40 (0.8%) |
| $10,000 to $24,999 | 397 (15.2%) | 188 (3.8%) |
| $25,000 to $34,999 | 327 (12.5%) | 225 (4.6%) |
| $35,000 to $49,999 | 199 (7.6%) | 123 (2.5%) |
| $50,000 to $74,999 | 461 (17.6%) | 254 (5.1%) |
| $75,000 to $99,999 | 282 (10.8%) | 965 (19.5%) |
| $100,000 to $149,999 | 338 (12.9%) | 639 (12.9%) |
| $150,000 or more | 376 (14.4%) | 858 (17.4%) |
| Total | 2,614 (100.0%) | 4,938 (100.0%) |
Property Value to Household Income Ratio in Middle River
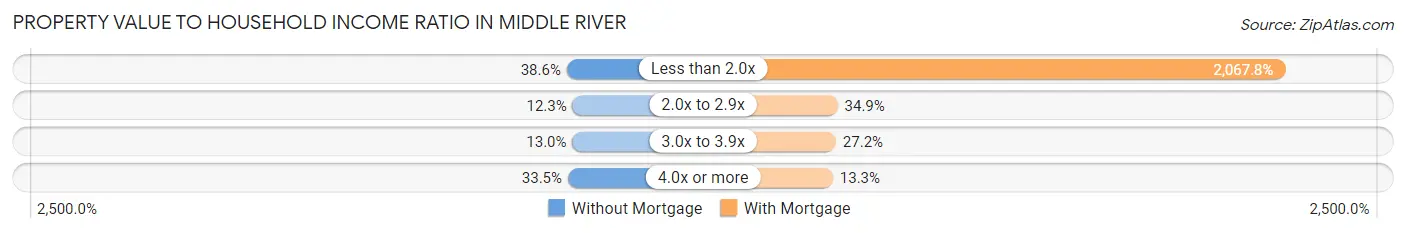
| Value-to-Income Ratio | Without Mortgage | With Mortgage |
| Less than 2.0x | 1,010 (38.6%) | 102,107 (2,067.8%) |
| 2.0x to 2.9x | 321 (12.3%) | 1,725 (34.9%) |
| 3.0x to 3.9x | 339 (13.0%) | 1,345 (27.2%) |
| 4.0x or more | 875 (33.5%) | 656 (13.3%) |
| Total | 2,614 (100.0%) | 4,938 (100.0%) |
Real Estate Taxes by Mortgage Status in Middle River
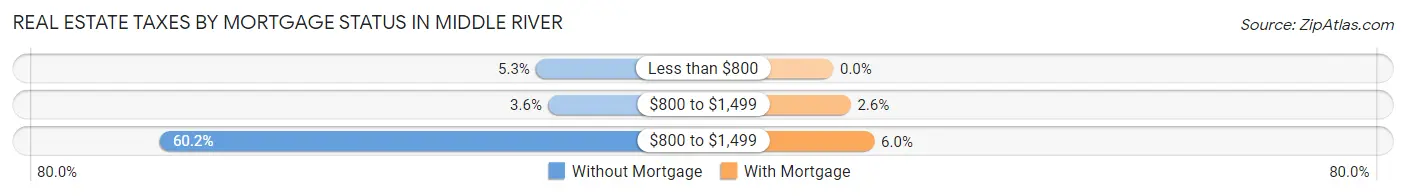
| Property Taxes | Without Mortgage | With Mortgage |
| Less than $800 | 139 (5.3%) | 0 (0.0%) |
| $800 to $1,499 | 93 (3.6%) | 126 (2.5%) |
| $800 to $1,499 | 1,574 (60.2%) | 297 (6.0%) |
| Total | 2,614 (100.0%) | 4,938 (100.0%) |
Health & Disability in Middle River
Health Insurance Coverage by Age in Middle River
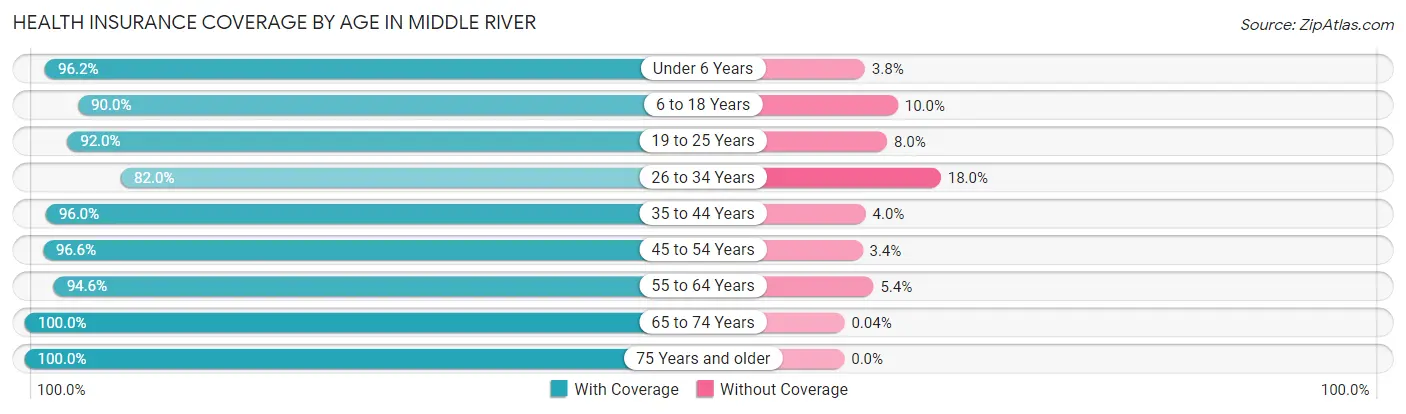
| Age Bracket | With Coverage | Without Coverage |
| Under 6 Years | 2,753 (96.2%) | 110 (3.8%) |
| 6 to 18 Years | 3,872 (90.0%) | 429 (10.0%) |
| 19 to 25 Years | 2,934 (92.0%) | 254 (8.0%) |
| 26 to 34 Years | 3,467 (82.0%) | 761 (18.0%) |
| 35 to 44 Years | 3,867 (96.0%) | 160 (4.0%) |
| 45 to 54 Years | 3,944 (96.6%) | 139 (3.4%) |
| 55 to 64 Years | 3,967 (94.6%) | 228 (5.4%) |
| 65 to 74 Years | 2,431 (100.0%) | 1 (0.0%) |
| 75 Years and older | 1,618 (100.0%) | 0 (0.0%) |
| Total | 28,853 (93.3%) | 2,082 (6.7%) |
Health Insurance Coverage by Citizenship Status in Middle River
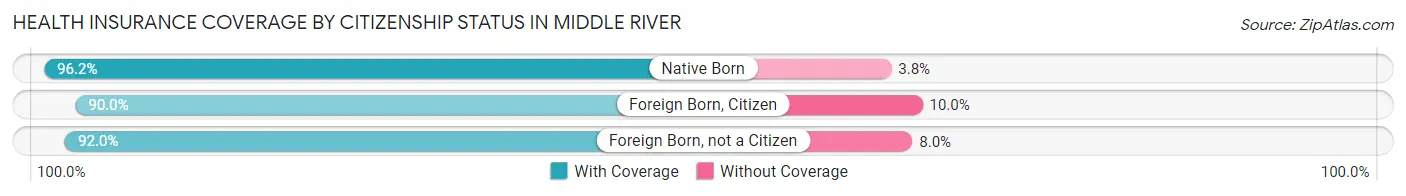
| Citizenship Status | With Coverage | Without Coverage |
| Native Born | 2,753 (96.2%) | 110 (3.8%) |
| Foreign Born, Citizen | 3,872 (90.0%) | 429 (10.0%) |
| Foreign Born, not a Citizen | 2,934 (92.0%) | 254 (8.0%) |
Health Insurance Coverage by Household Income in Middle River
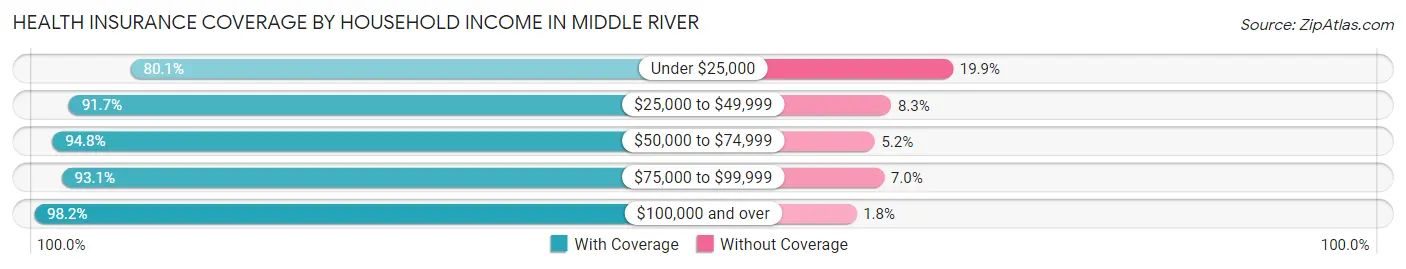
| Household Income | With Coverage | Without Coverage |
| Under $25,000 | 3,595 (80.1%) | 891 (19.9%) |
| $25,000 to $49,999 | 4,991 (91.7%) | 450 (8.3%) |
| $50,000 to $74,999 | 4,638 (94.8%) | 254 (5.2%) |
| $75,000 to $99,999 | 3,600 (93.0%) | 269 (7.0%) |
| $100,000 and over | 12,014 (98.2%) | 217 (1.8%) |
Public vs Private Health Insurance Coverage by Age in Middle River
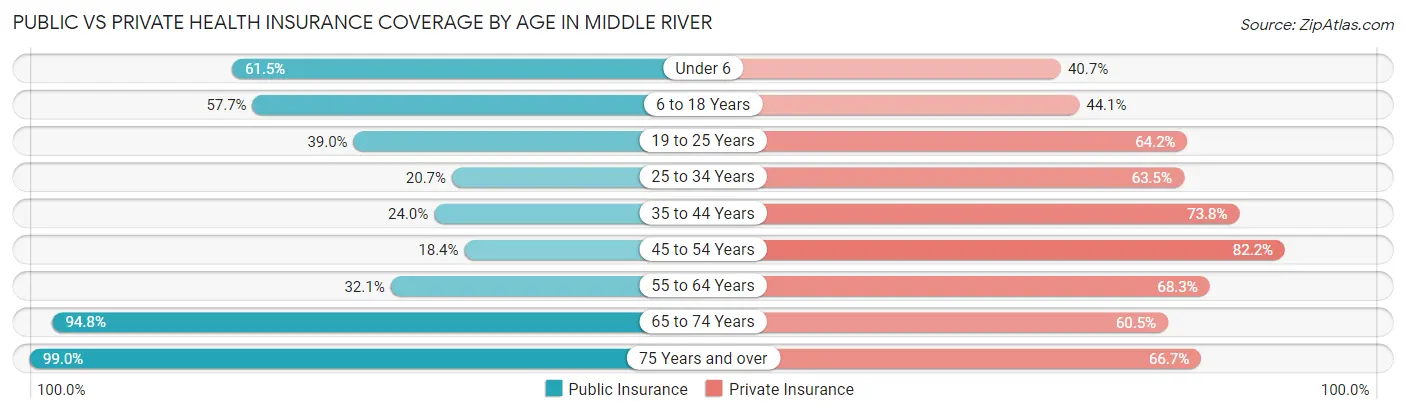
| Age Bracket | Public Insurance | Private Insurance |
| Under 6 | 1,761 (61.5%) | 1,165 (40.7%) |
| 6 to 18 Years | 2,482 (57.7%) | 1,896 (44.1%) |
| 19 to 25 Years | 1,242 (39.0%) | 2,045 (64.1%) |
| 25 to 34 Years | 875 (20.7%) | 2,684 (63.5%) |
| 35 to 44 Years | 966 (24.0%) | 2,971 (73.8%) |
| 45 to 54 Years | 750 (18.4%) | 3,358 (82.2%) |
| 55 to 64 Years | 1,346 (32.1%) | 2,863 (68.2%) |
| 65 to 74 Years | 2,306 (94.8%) | 1,472 (60.5%) |
| 75 Years and over | 1,602 (99.0%) | 1,079 (66.7%) |
| Total | 13,330 (43.1%) | 19,533 (63.1%) |
Disability Status by Sex by Age in Middle River
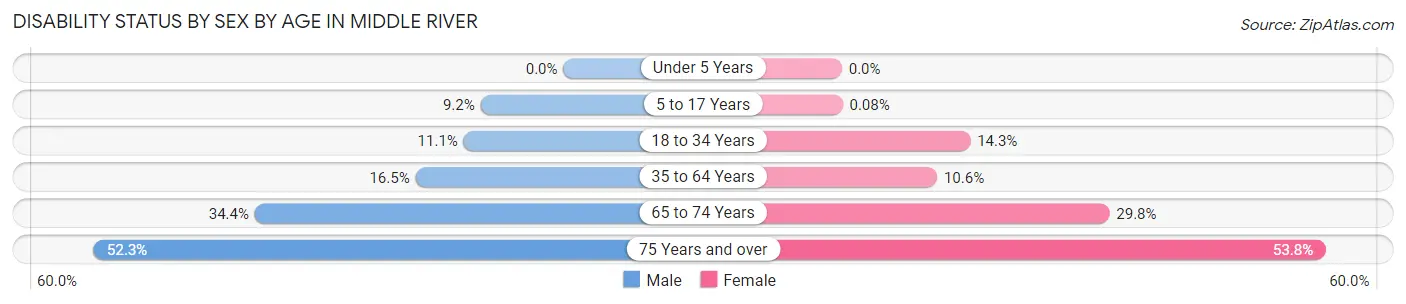
| Age Bracket | Male | Female |
| Under 5 Years | 0 (0.0%) | 0 (0.0%) |
| 5 to 17 Years | 165 (9.2%) | 2 (0.1%) |
| 18 to 34 Years | 397 (11.1%) | 612 (14.3%) |
| 35 to 64 Years | 911 (16.5%) | 718 (10.6%) |
| 65 to 74 Years | 378 (34.4%) | 397 (29.8%) |
| 75 Years and over | 367 (52.3%) | 493 (53.8%) |
Disability Class by Sex by Age in Middle River
Disability Class: Hearing Difficulty
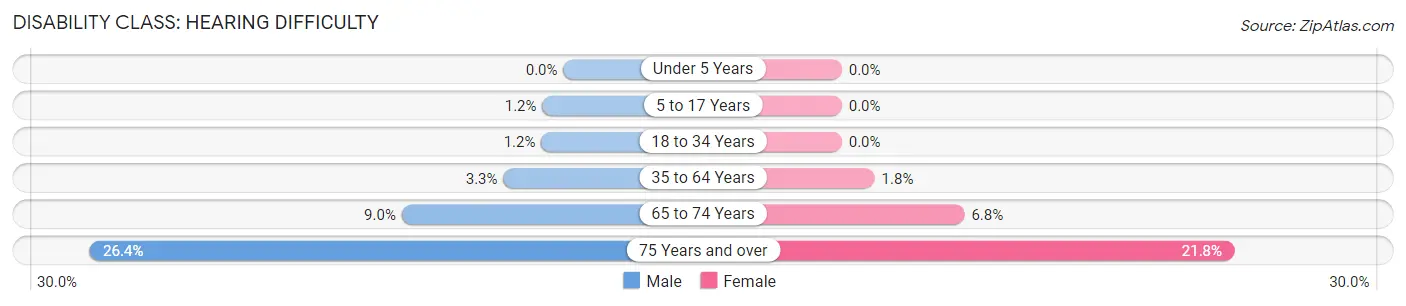
| Age Bracket | Male | Female |
| Under 5 Years | 0 (0.0%) | 0 (0.0%) |
| 5 to 17 Years | 21 (1.2%) | 0 (0.0%) |
| 18 to 34 Years | 44 (1.2%) | 0 (0.0%) |
| 35 to 64 Years | 185 (3.3%) | 124 (1.8%) |
| 65 to 74 Years | 99 (9.0%) | 91 (6.8%) |
| 75 Years and over | 185 (26.4%) | 200 (21.8%) |
Disability Class: Vision Difficulty
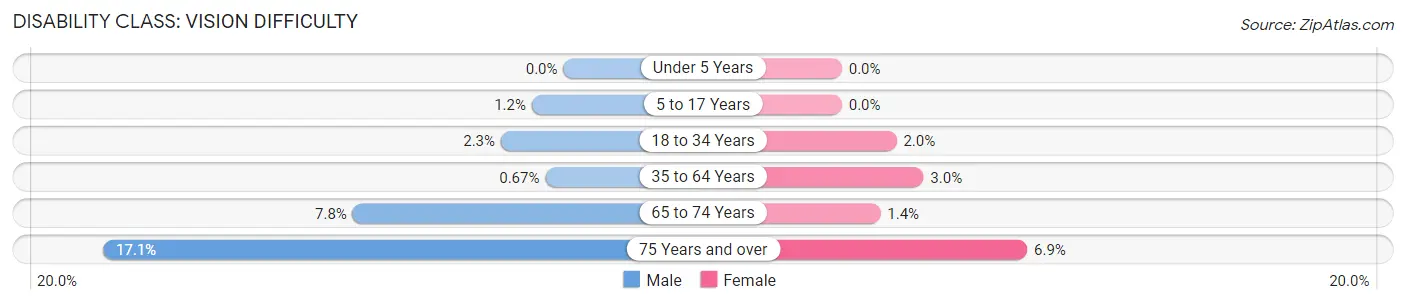
| Age Bracket | Male | Female |
| Under 5 Years | 0 (0.0%) | 0 (0.0%) |
| 5 to 17 Years | 21 (1.2%) | 0 (0.0%) |
| 18 to 34 Years | 83 (2.3%) | 87 (2.0%) |
| 35 to 64 Years | 37 (0.7%) | 205 (3.0%) |
| 65 to 74 Years | 86 (7.8%) | 19 (1.4%) |
| 75 Years and over | 120 (17.1%) | 63 (6.9%) |
Disability Class: Cognitive Difficulty
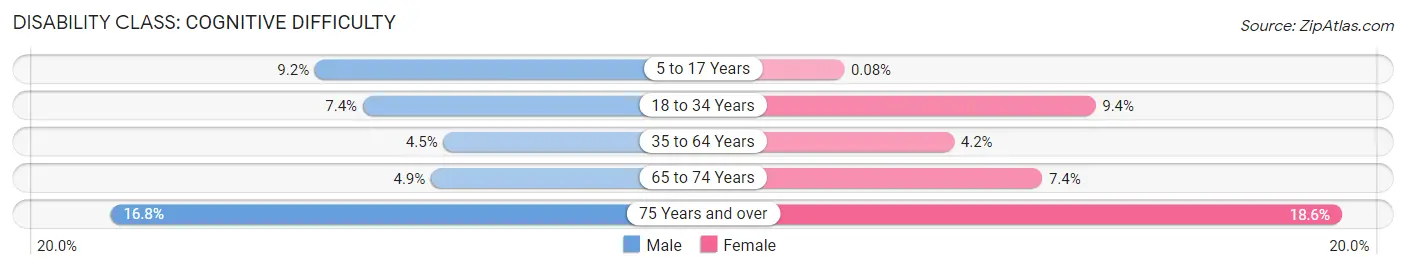
| Age Bracket | Male | Female |
| 5 to 17 Years | 165 (9.2%) | 2 (0.1%) |
| 18 to 34 Years | 266 (7.4%) | 403 (9.4%) |
| 35 to 64 Years | 246 (4.4%) | 282 (4.2%) |
| 65 to 74 Years | 54 (4.9%) | 99 (7.4%) |
| 75 Years and over | 118 (16.8%) | 170 (18.6%) |
Disability Class: Ambulatory Difficulty
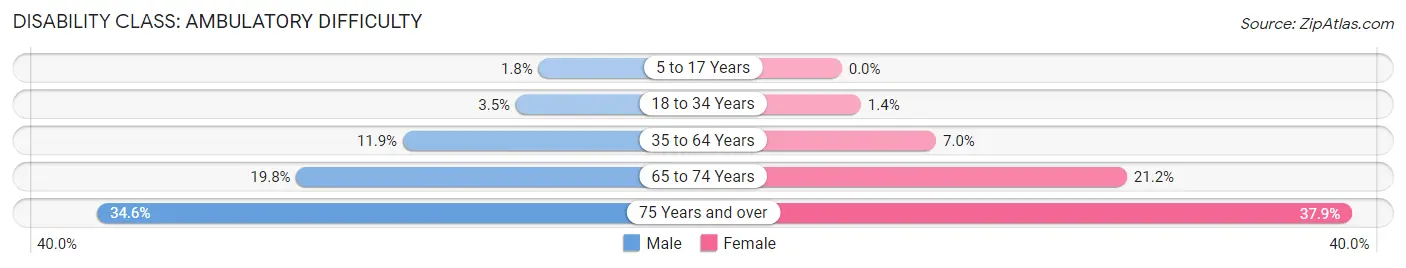
| Age Bracket | Male | Female |
| 5 to 17 Years | 33 (1.8%) | 0 (0.0%) |
| 18 to 34 Years | 126 (3.5%) | 61 (1.4%) |
| 35 to 64 Years | 659 (11.9%) | 474 (7.0%) |
| 65 to 74 Years | 218 (19.8%) | 282 (21.2%) |
| 75 Years and over | 243 (34.6%) | 347 (37.9%) |
Disability Class: Self-Care Difficulty
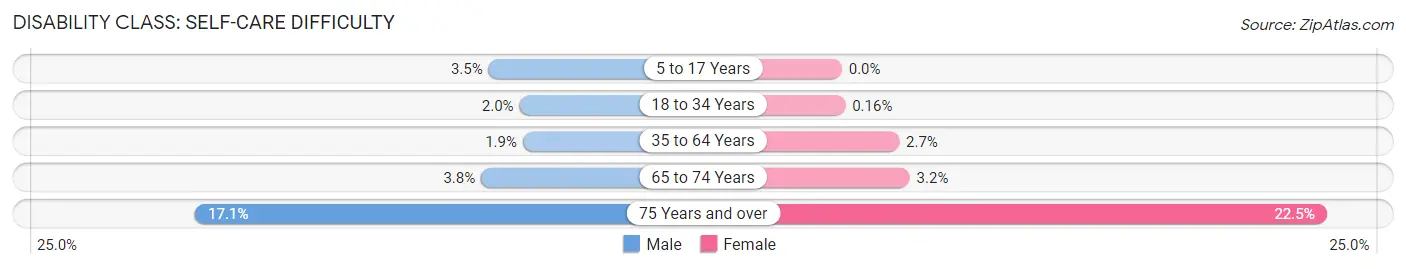
| Age Bracket | Male | Female |
| 5 to 17 Years | 62 (3.5%) | 0 (0.0%) |
| 18 to 34 Years | 73 (2.0%) | 7 (0.2%) |
| 35 to 64 Years | 104 (1.9%) | 180 (2.7%) |
| 65 to 74 Years | 42 (3.8%) | 42 (3.2%) |
| 75 Years and over | 120 (17.1%) | 206 (22.5%) |
Technology Access in Middle River
Computing Device Access in Middle River
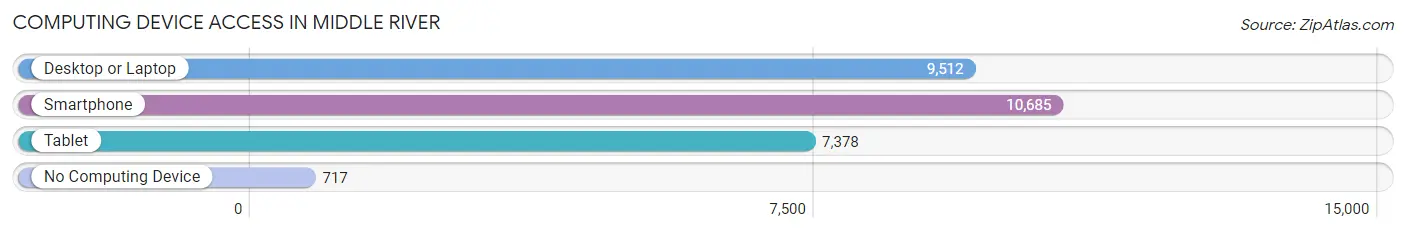
| Device Type | # Households | % Households |
| Desktop or Laptop | 9,512 | 78.7% |
| Smartphone | 10,685 | 88.4% |
| Tablet | 7,378 | 61.1% |
| No Computing Device | 717 | 5.9% |
| Total | 12,082 | 100.0% |
Internet Access in Middle River
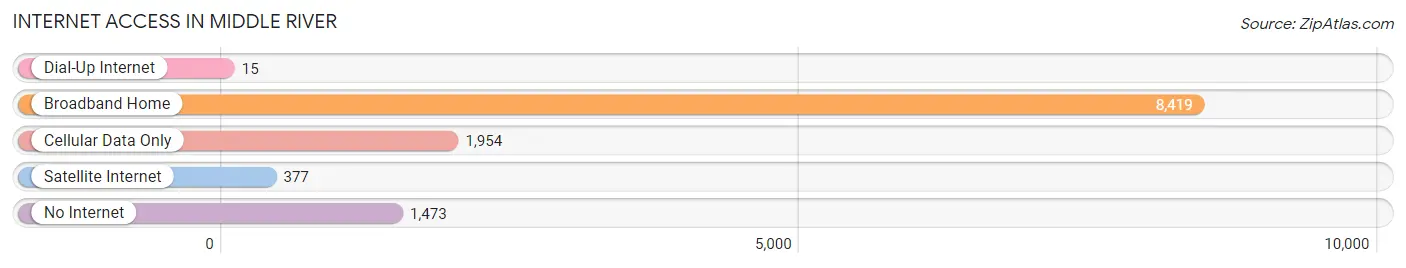
| Internet Type | # Households | % Households |
| Dial-Up Internet | 15 | 0.1% |
| Broadband Home | 8,419 | 69.7% |
| Cellular Data Only | 1,954 | 16.2% |
| Satellite Internet | 377 | 3.1% |
| No Internet | 1,473 | 12.2% |
| Total | 12,082 | 100.0% |
Middle River Summary
History
Middle River is a census-designated place (CDP) located in Baltimore County, Maryland. It is located on the Middle River, a tributary of the Chesapeake Bay. The area was first settled in the early 1700s by English and German immigrants. The area was originally known as “Middle River Crossroads” and was a small farming community. In the late 1800s, the area began to grow as a result of the industrialization of the area. The area was home to several factories, including the Middle River Shipyard, which was the largest employer in the area. The shipyard was responsible for the construction of many of the ships used in World War II.
In the 1950s, the area began to experience rapid growth as a result of the post-war housing boom. The area was annexed by Baltimore County in 1954 and was officially designated as a CDP in 1960. Since then, the area has continued to grow and develop. Today, Middle River is a vibrant community with a population of over 25,000 people.
Geography
Middle River is located in Baltimore County, Maryland. It is situated on the Middle River, a tributary of the Chesapeake Bay. The area is bordered by the city of Baltimore to the west, Essex to the north, and White Marsh to the east. The area is approximately 8.5 square miles in size and is home to over 25,000 people.
The area is mostly flat and is located at an elevation of approximately 20 feet above sea level. The climate in Middle River is classified as humid subtropical, with hot, humid summers and mild winters. The average annual temperature is around 60 degrees Fahrenheit.
Economy
Middle River’s economy is largely based on the service industry. The area is home to several large employers, including the Middle River Shipyard, which is the largest employer in the area. Other major employers include the Martin State Airport, the Baltimore County Public Schools, and the University of Maryland Medical Center.
The area is also home to several retail establishments, including the Middle River Shopping Center, which is the largest shopping center in the area. The area is also home to several restaurants, bars, and other entertainment venues.
Demographics
As of the 2010 census, the population of Middle River was 25,191. The racial makeup of the area was 79.3% White, 13.2% African American, 0.4% Native American, 2.2% Asian, 0.1% Pacific Islander, and 4.8% from other races. The median household income was $60,945, and the median family income was $68,945. The per capita income was $25,945.
The population of Middle River is largely composed of young professionals and families. The area is home to several schools, including the Middle River Middle School, the Middle River High School, and the University of Maryland Medical Center. The area is also home to several parks and recreational facilities, including the Middle River Park and the Middle River Recreation Center.
Common Questions
What is Per Capita Income in Middle River?
Per Capita income in Middle River is $37,399.
What is the Median Family Income in Middle River?
Median Family Income in Middle River is $75,385.
What is the Median Household income in Middle River?
Median Household Income in Middle River is $72,970.
What is Income or Wage Gap in Middle River?
Income or Wage Gap in Middle River is 24.5%.
Women in Middle River earn 75.5 cents for every dollar earned by a man.
What is Family Income Deficit in Middle River?
Family Income Deficit in Middle River is $16,679.
Families that are below poverty line in Middle River earn $16,679 less on average than the poverty threshold level.
What is Inequality or Gini Index in Middle River?
Inequality or Gini Index in Middle River is 0.46.
What is the Total Population of Middle River?
Total Population of Middle River is 31,155.
What is the Total Male Population of Middle River?
Total Male Population of Middle River is 14,336.
What is the Total Female Population of Middle River?
Total Female Population of Middle River is 16,819.
What is the Ratio of Males per 100 Females in Middle River?
There are 85.24 Males per 100 Females in Middle River.
What is the Ratio of Females per 100 Males in Middle River?
There are 117.32 Females per 100 Males in Middle River.
What is the Median Population Age in Middle River?
Median Population Age in Middle River is 36.7 Years.
What is the Average Family Size in Middle River
Average Family Size in Middle River is 3.2 People.
What is the Average Household Size in Middle River
Average Household Size in Middle River is 2.6 People.
How Large is the Labor Force in Middle River?
There are 16,645 People in the Labor Forcein in Middle River.
What is the Percentage of People in the Labor Force in Middle River?
66.9% of People are in the Labor Force in Middle River.
What is the Unemployment Rate in Middle River?
Unemployment Rate in Middle River is 4.9%.