Maugansville, MD Map & Demographics
Maugansville Map
Maugansville Overview
$39,916
PER CAPITA INCOME
$89,079
AVG FAMILY INCOME
$62,375
AVG HOUSEHOLD INCOME
70.7%
WAGE / INCOME GAP [ % ]
29.3¢/ $1
WAGE / INCOME GAP [ $ ]
0.45
INEQUALITY / GINI INDEX
2,770
TOTAL POPULATION
1,461
MALE POPULATION
1,309
FEMALE POPULATION
111.61
MALES / 100 FEMALES
89.60
FEMALES / 100 MALES
47.8
MEDIAN AGE
2.9
AVG FAMILY SIZE
2.2
AVG HOUSEHOLD SIZE
1,280
LABOR FORCE [ PEOPLE ]
56.0%
PERCENT IN LABOR FORCE
7.1%
UNEMPLOYMENT RATE
Maugansville Zip Codes
Maugansville Area Codes
Income in Maugansville
Income Overview in Maugansville
Per Capita Income in Maugansville is $39,916, while median incomes of families and households are $89,079 and $62,375 respectively.
| Characteristic | Number | Measure |
| Per Capita Income | 2,770 | $39,916 |
| Median Family Income | 740 | $89,079 |
| Mean Family Income | 740 | $118,679 |
| Median Household Income | 1,254 | $62,375 |
| Mean Household Income | 1,254 | $87,664 |
| Income Deficit | 740 | $0 |
| Wage / Income Gap (%) | 2,770 | 70.66% |
| Wage / Income Gap ($) | 2,770 | 29.34¢ per $1 |
| Gini / Inequality Index | 2,770 | 0.45 |
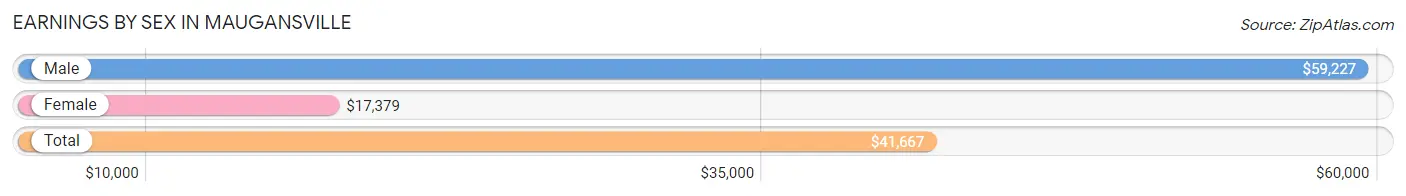
Earnings by Sex in Maugansville
Average Earnings in Maugansville are $41,667, $59,227 for men and $17,379 for women, a difference of 70.7%.
| Sex | Number | Average Earnings |
| Male | 831 (59.4%) | $59,227 |
| Female | 567 (40.6%) | $17,379 |
| Total | 1,398 (100.0%) | $41,667 |
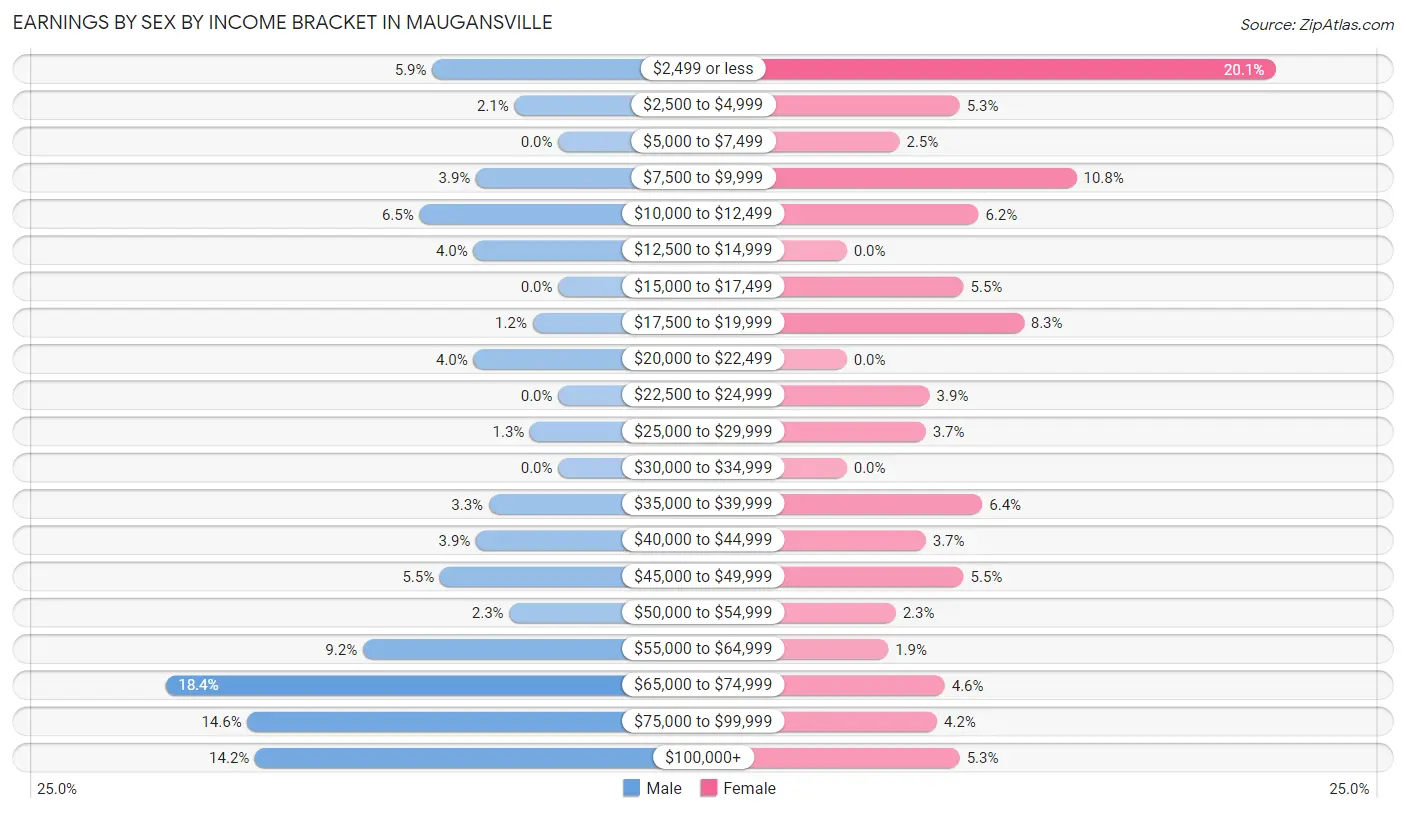
Earnings by Sex by Income Bracket in Maugansville
The most common earnings brackets in Maugansville are $65,000 to $74,999 for men (153 | 18.4%) and $2,499 or less for women (114 | 20.1%).
| Income | Male | Female |
| $2,499 or less | 49 (5.9%) | 114 (20.1%) |
| $2,500 to $4,999 | 17 (2.1%) | 30 (5.3%) |
| $5,000 to $7,499 | 0 (0.0%) | 14 (2.5%) |
| $7,500 to $9,999 | 32 (3.8%) | 61 (10.8%) |
| $10,000 to $12,499 | 54 (6.5%) | 35 (6.2%) |
| $12,500 to $14,999 | 33 (4.0%) | 0 (0.0%) |
| $15,000 to $17,499 | 0 (0.0%) | 31 (5.5%) |
| $17,500 to $19,999 | 10 (1.2%) | 47 (8.3%) |
| $20,000 to $22,499 | 33 (4.0%) | 0 (0.0%) |
| $22,500 to $24,999 | 0 (0.0%) | 22 (3.9%) |
| $25,000 to $29,999 | 11 (1.3%) | 21 (3.7%) |
| $30,000 to $34,999 | 0 (0.0%) | 0 (0.0%) |
| $35,000 to $39,999 | 27 (3.3%) | 36 (6.4%) |
| $40,000 to $44,999 | 32 (3.8%) | 21 (3.7%) |
| $45,000 to $49,999 | 46 (5.5%) | 31 (5.5%) |
| $50,000 to $54,999 | 19 (2.3%) | 13 (2.3%) |
| $55,000 to $64,999 | 76 (9.1%) | 11 (1.9%) |
| $65,000 to $74,999 | 153 (18.4%) | 26 (4.6%) |
| $75,000 to $99,999 | 121 (14.6%) | 24 (4.2%) |
| $100,000+ | 118 (14.2%) | 30 (5.3%) |
| Total | 831 (100.0%) | 567 (100.0%) |
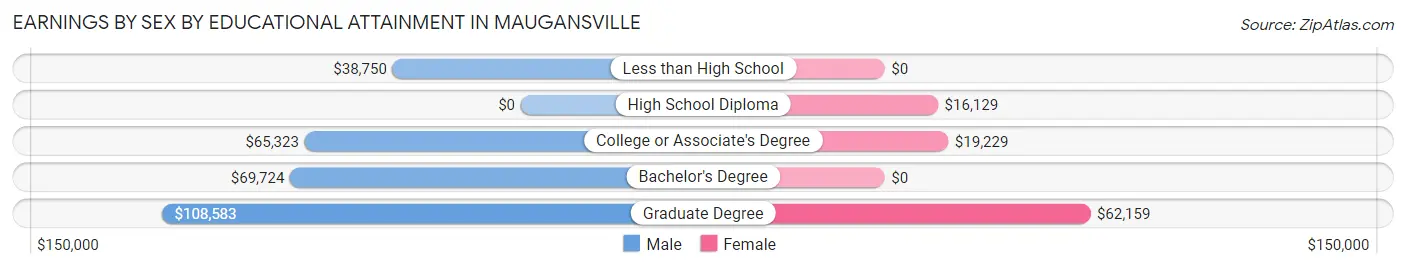
Earnings by Sex by Educational Attainment in Maugansville
Average earnings in Maugansville are $67,708 for men and $19,761 for women, a difference of 70.8%. Men with an educational attainment of graduate degree enjoy the highest average annual earnings of $108,583, while those with less than high school education earn the least with $38,750. Women with an educational attainment of graduate degree earn the most with the average annual earnings of $62,159, while those with high school diploma education have the smallest earnings of $16,129.
| Educational Attainment | Male Income | Female Income |
| Less than High School | $38,750 | $0 |
| High School Diploma | - | - |
| College or Associate's Degree | $65,323 | $19,229 |
| Bachelor's Degree | $69,724 | $0 |
| Graduate Degree | $108,583 | $62,159 |
| Total | $67,708 | $19,761 |
Family Income in Maugansville
Family Income Brackets in Maugansville
According to the Maugansville family income data, there are 237 families falling into the $50,000 to $74,999 income range, which is the most common income bracket and makes up 32.0% of all families.
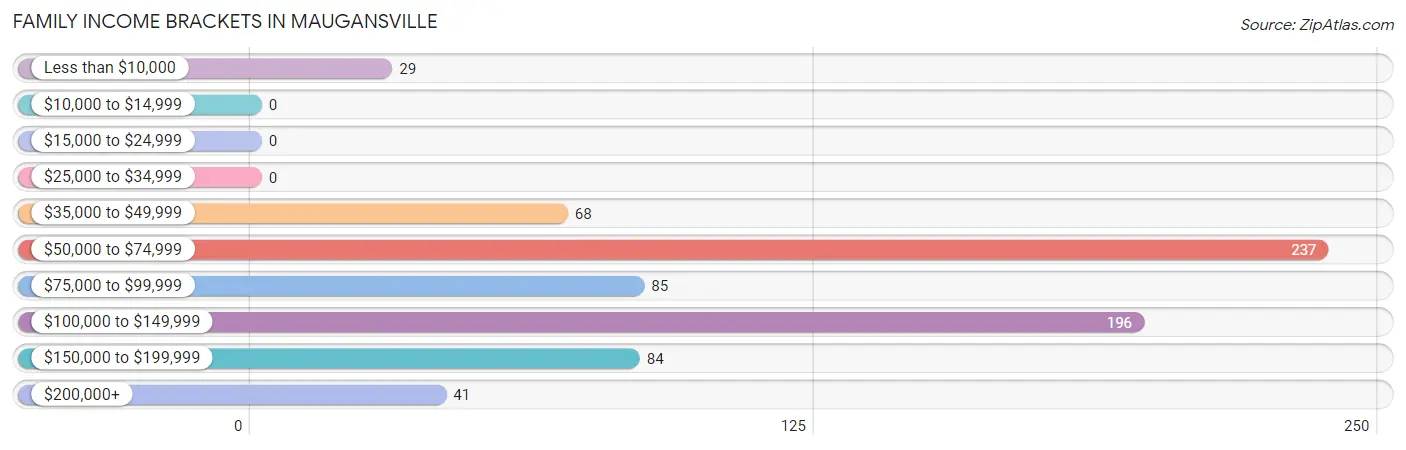
| Income Bracket | # Families | % Families |
| Less than $10,000 | 29 | 3.9% |
| $10,000 to $14,999 | 0 | 0.0% |
| $15,000 to $24,999 | 0 | 0.0% |
| $25,000 to $34,999 | 0 | 0.0% |
| $35,000 to $49,999 | 68 | 9.2% |
| $50,000 to $74,999 | 237 | 32.0% |
| $75,000 to $99,999 | 85 | 11.5% |
| $100,000 to $149,999 | 196 | 26.5% |
| $150,000 to $199,999 | 84 | 11.4% |
| $200,000+ | 41 | 5.5% |
Family Income by Famaliy Size in Maugansville
5-person families (50 | 6.8%) account for the highest median family income in Maugansville with $114,904 per family, while 2-person families (355 | 48.0%) have the highest median income of $35,990 per family member.
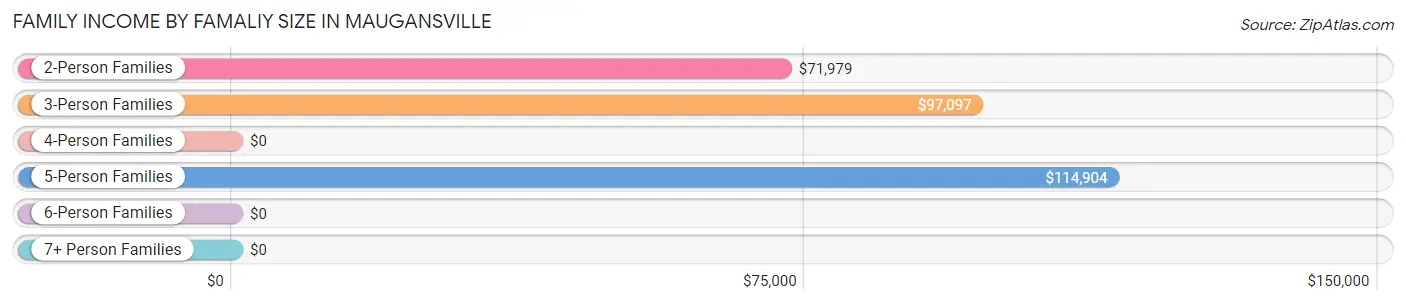
| Income Bracket | # Families | Median Income |
| 2-Person Families | 355 (48.0%) | $71,979 |
| 3-Person Families | 174 (23.5%) | $97,097 |
| 4-Person Families | 136 (18.4%) | $0 |
| 5-Person Families | 50 (6.8%) | $114,904 |
| 6-Person Families | 13 (1.8%) | $0 |
| 7+ Person Families | 12 (1.6%) | $0 |
| Total | 740 (100.0%) | $89,079 |
Family Income by Number of Earners in Maugansville
The median family income in Maugansville is $89,079, with families comprising 2 earners (177) having the highest median family income of $116,908, while families with no earners (127) have the lowest median family income of $58,845, accounting for 23.9% and 17.2% of families, respectively.
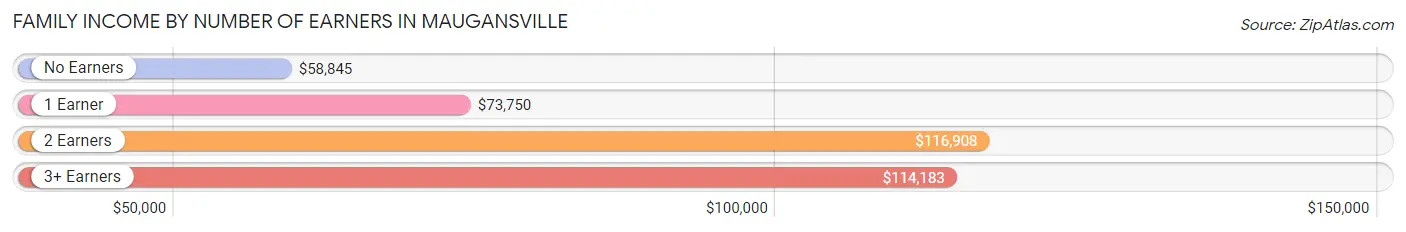
| Number of Earners | # Families | Median Income |
| No Earners | 127 (17.2%) | $58,845 |
| 1 Earner | 269 (36.3%) | $73,750 |
| 2 Earners | 177 (23.9%) | $116,908 |
| 3+ Earners | 167 (22.6%) | $114,183 |
| Total | 740 (100.0%) | $89,079 |
Household Income in Maugansville
Household Income Brackets in Maugansville
With 305 households falling in the category, the $50,000 to $74,999 income range is the most frequent in Maugansville, accounting for 24.3% of all households. In contrast, only 13 households (1.0%) fall into the $10,000 to $14,999 income bracket, making it the least populous group.
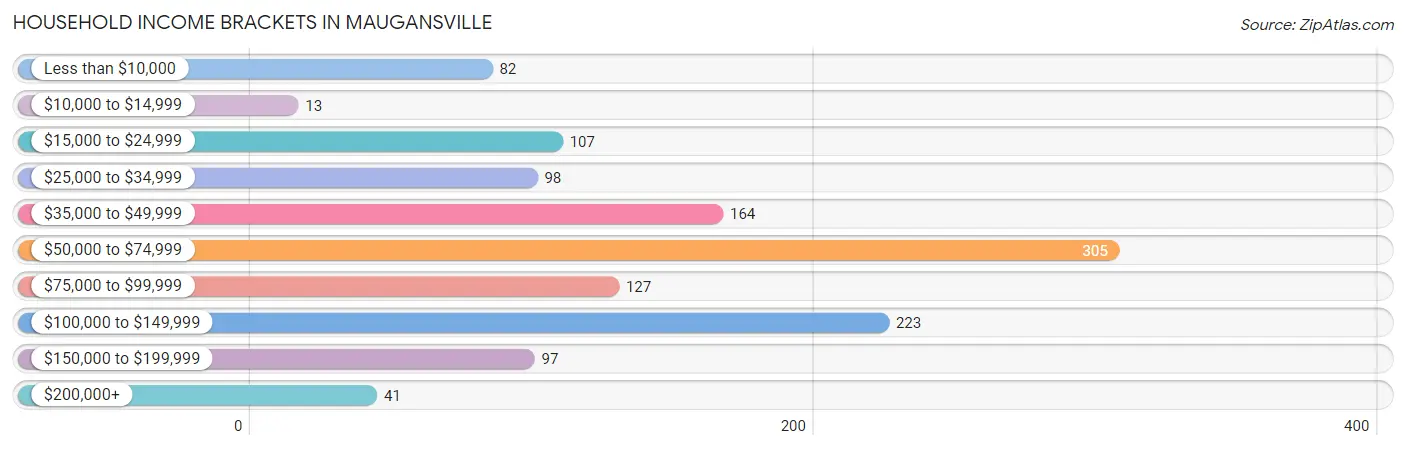
| Income Bracket | # Households | % Households |
| Less than $10,000 | 82 | 6.5% |
| $10,000 to $14,999 | 13 | 1.0% |
| $15,000 to $24,999 | 107 | 8.5% |
| $25,000 to $34,999 | 98 | 7.8% |
| $35,000 to $49,999 | 164 | 13.1% |
| $50,000 to $74,999 | 305 | 24.3% |
| $75,000 to $99,999 | 127 | 10.1% |
| $100,000 to $149,999 | 223 | 17.8% |
| $150,000 to $199,999 | 97 | 7.7% |
| $200,000+ | 41 | 3.3% |
Household Income by Householder Age in Maugansville
The median household income in Maugansville is $62,375, with the highest median household income of $87,344 found in the 45 to 64 years age bracket for the primary householder. A total of 425 households (33.9%) fall into this category.
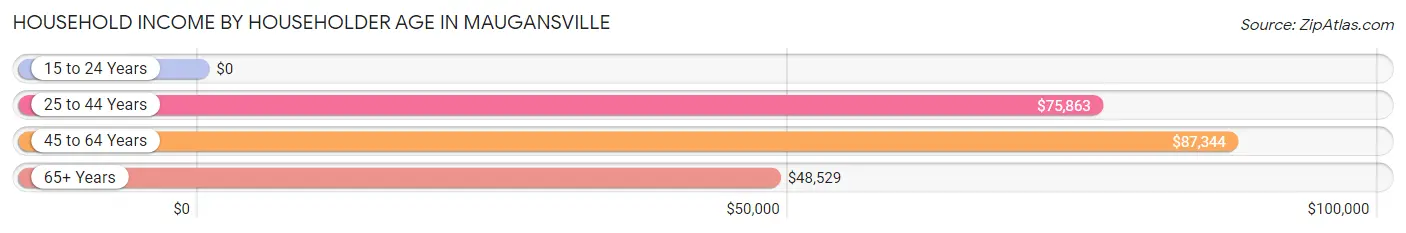
| Income Bracket | # Households | Median Income |
| 15 to 24 Years | 0 (0.0%) | $0 |
| 25 to 44 Years | 291 (23.2%) | $75,863 |
| 45 to 64 Years | 425 (33.9%) | $87,344 |
| 65+ Years | 538 (42.9%) | $48,529 |
| Total | 1,254 (100.0%) | $62,375 |
Poverty in Maugansville
Income Below Poverty by Sex and Age in Maugansville
With 10.9% poverty level for males and 8.1% for females among the residents of Maugansville, 6 to 11 year old males and 18 to 24 year old females are the most vulnerable to poverty, with 22 males (27.2%) and 18 females (47.4%) in their respective age groups living below the poverty level.
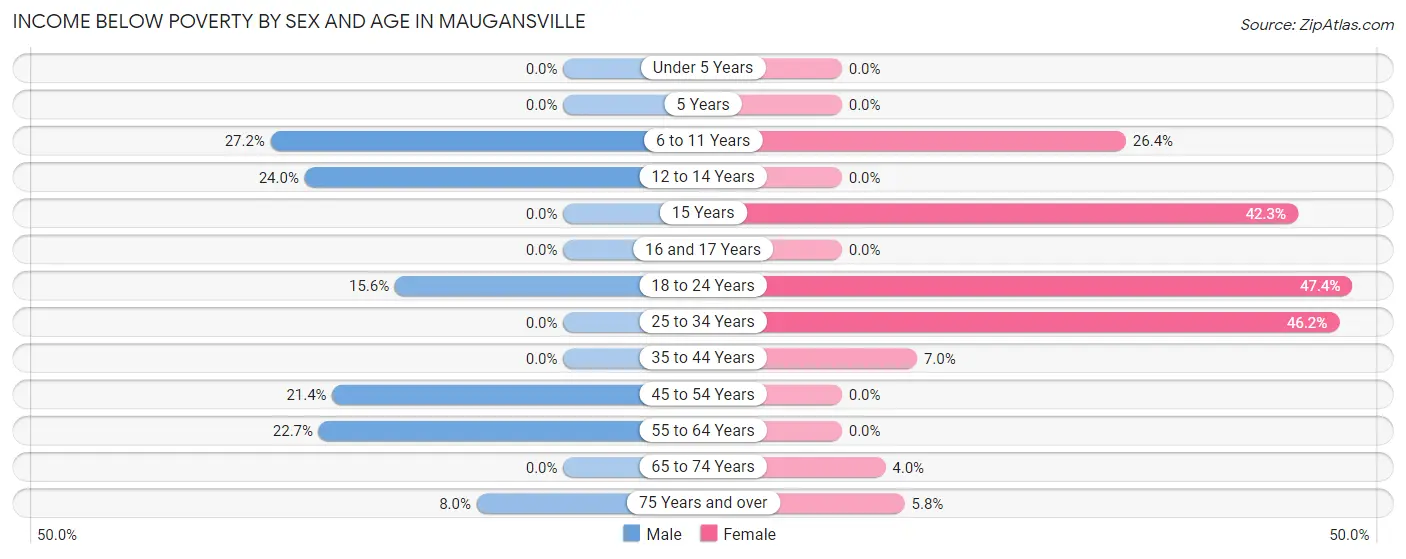
| Age Bracket | Male | Female |
| Under 5 Years | 0 (0.0%) | 0 (0.0%) |
| 5 Years | 0 (0.0%) | 0 (0.0%) |
| 6 to 11 Years | 22 (27.2%) | 24 (26.4%) |
| 12 to 14 Years | 12 (24.0%) | 0 (0.0%) |
| 15 Years | 0 (0.0%) | 11 (42.3%) |
| 16 and 17 Years | 0 (0.0%) | 0 (0.0%) |
| 18 to 24 Years | 15 (15.6%) | 18 (47.4%) |
| 25 to 34 Years | 0 (0.0%) | 18 (46.2%) |
| 35 to 44 Years | 0 (0.0%) | 12 (7.0%) |
| 45 to 54 Years | 45 (21.4%) | 0 (0.0%) |
| 55 to 64 Years | 54 (22.7%) | 0 (0.0%) |
| 65 to 74 Years | 0 (0.0%) | 11 (4.0%) |
| 75 Years and over | 11 (8.0%) | 12 (5.8%) |
| Total | 159 (10.9%) | 106 (8.1%) |
Income Above Poverty by Sex and Age in Maugansville
According to the poverty statistics in Maugansville, males aged 5 years and females aged under 5 years are the age groups that are most secure financially, with 100.0% of males and 100.0% of females in these age groups living above the poverty line.
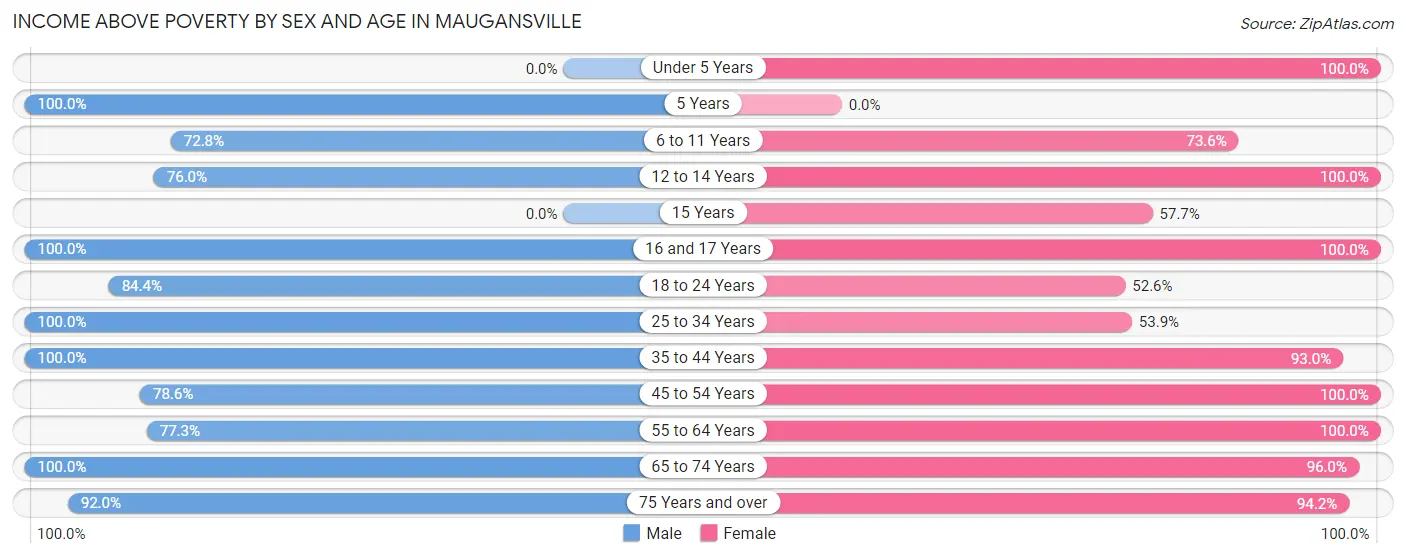
| Age Bracket | Male | Female |
| Under 5 Years | 0 (0.0%) | 87 (100.0%) |
| 5 Years | 87 (100.0%) | 0 (0.0%) |
| 6 to 11 Years | 59 (72.8%) | 67 (73.6%) |
| 12 to 14 Years | 38 (76.0%) | 62 (100.0%) |
| 15 Years | 0 (0.0%) | 15 (57.7%) |
| 16 and 17 Years | 60 (100.0%) | 50 (100.0%) |
| 18 to 24 Years | 81 (84.4%) | 20 (52.6%) |
| 25 to 34 Years | 103 (100.0%) | 21 (53.8%) |
| 35 to 44 Years | 208 (100.0%) | 160 (93.0%) |
| 45 to 54 Years | 165 (78.6%) | 142 (100.0%) |
| 55 to 64 Years | 184 (77.3%) | 120 (100.0%) |
| 65 to 74 Years | 191 (100.0%) | 261 (96.0%) |
| 75 Years and over | 126 (92.0%) | 194 (94.2%) |
| Total | 1,302 (89.1%) | 1,199 (91.9%) |
Income Below Poverty Among Married-Couple Families in Maugansville
The poverty statistics for married-couple families in Maugansville show that 3.7% or 23 of the total 624 families live below the poverty line. Families with 5 or more children have the highest poverty rate of 100.0%, comprising of 12 families. On the other hand, families with 1 or 2 children have the lowest poverty rate of 0.0%, which includes 0 families.
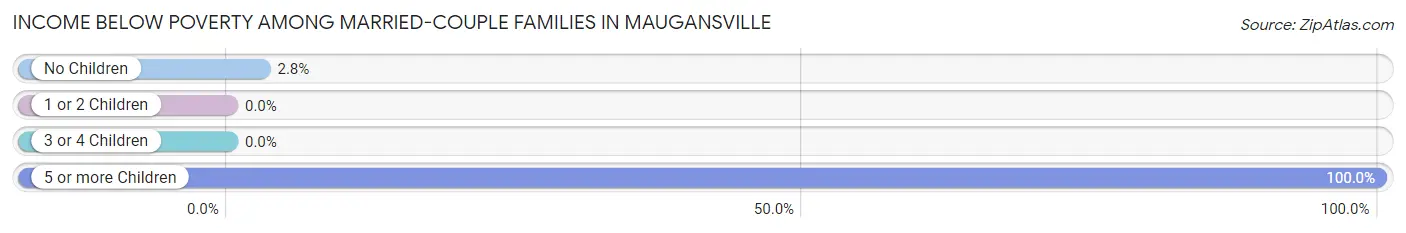
| Children | Above Poverty | Below Poverty |
| No Children | 378 (97.2%) | 11 (2.8%) |
| 1 or 2 Children | 184 (100.0%) | 0 (0.0%) |
| 3 or 4 Children | 39 (100.0%) | 0 (0.0%) |
| 5 or more Children | 0 (0.0%) | 12 (100.0%) |
| Total | 601 (96.3%) | 23 (3.7%) |
Income Below Poverty Among Single-Parent Households in Maugansville
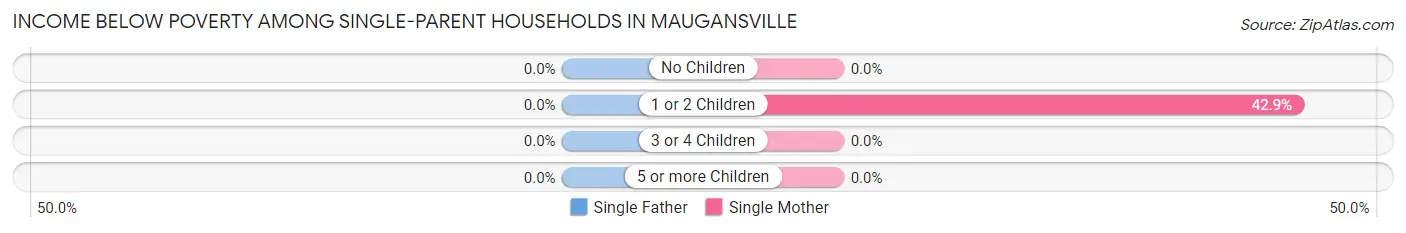
| Children | Single Father | Single Mother |
| No Children | 0 (0.0%) | 0 (0.0%) |
| 1 or 2 Children | 0 (0.0%) | 18 (42.9%) |
| 3 or 4 Children | 0 (0.0%) | 0 (0.0%) |
| 5 or more Children | 0 (0.0%) | 0 (0.0%) |
| Total | 0 (0.0%) | 18 (42.9%) |
Income Below Poverty Among Married-Couple vs Single-Parent Households in Maugansville
The poverty data for Maugansville shows that 23 of the married-couple family households (3.7%) and 18 of the single-parent households (15.5%) are living below the poverty level. Within the married-couple family households, those with 5 or more children have the highest poverty rate, with 12 households (100.0%) falling below the poverty line. Among the single-parent households, those with 1 or 2 children have the highest poverty rate, with 18 household (20.9%) living below poverty.
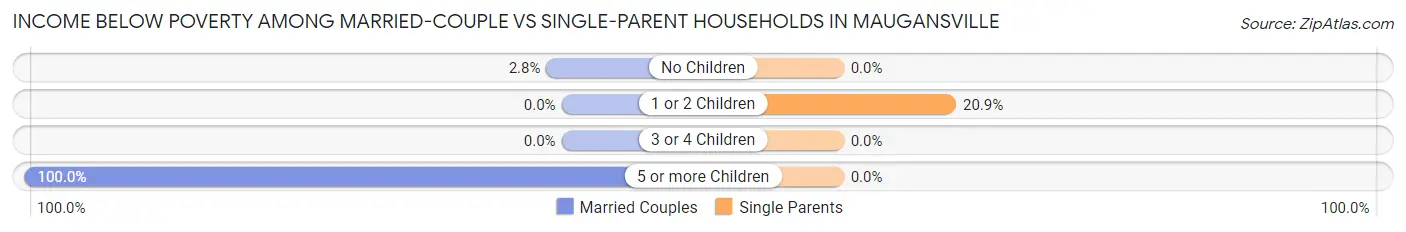
| Children | Married-Couple Families | Single-Parent Households |
| No Children | 11 (2.8%) | 0 (0.0%) |
| 1 or 2 Children | 0 (0.0%) | 18 (20.9%) |
| 3 or 4 Children | 0 (0.0%) | 0 (0.0%) |
| 5 or more Children | 12 (100.0%) | 0 (0.0%) |
| Total | 23 (3.7%) | 18 (15.5%) |
Race in Maugansville
The most populous races in Maugansville are White / Caucasian (2,280 | 82.3%), Asian (268 | 9.7%), and Black / African American (182 | 6.6%).
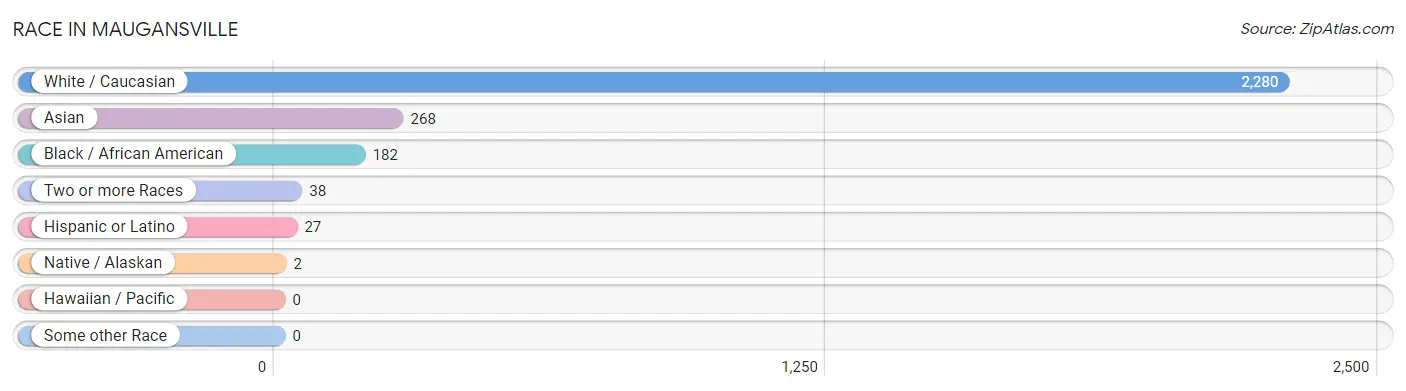
| Race | # Population | % Population |
| Asian | 268 | 9.7% |
| Black / African American | 182 | 6.6% |
| Hawaiian / Pacific | 0 | 0.0% |
| Hispanic or Latino | 27 | 1.0% |
| Native / Alaskan | 2 | 0.1% |
| White / Caucasian | 2,280 | 82.3% |
| Two or more Races | 38 | 1.4% |
| Some other Race | 0 | 0.0% |
| Total | 2,770 | 100.0% |
Ancestry in Maugansville
The most populous ancestries reported in Maugansville are German (614 | 22.2%), English (358 | 12.9%), Irish (301 | 10.9%), Indian (Asian) (268 | 9.7%), and Subsaharan African (135 | 4.9%), together accounting for 60.5% of all Maugansville residents.
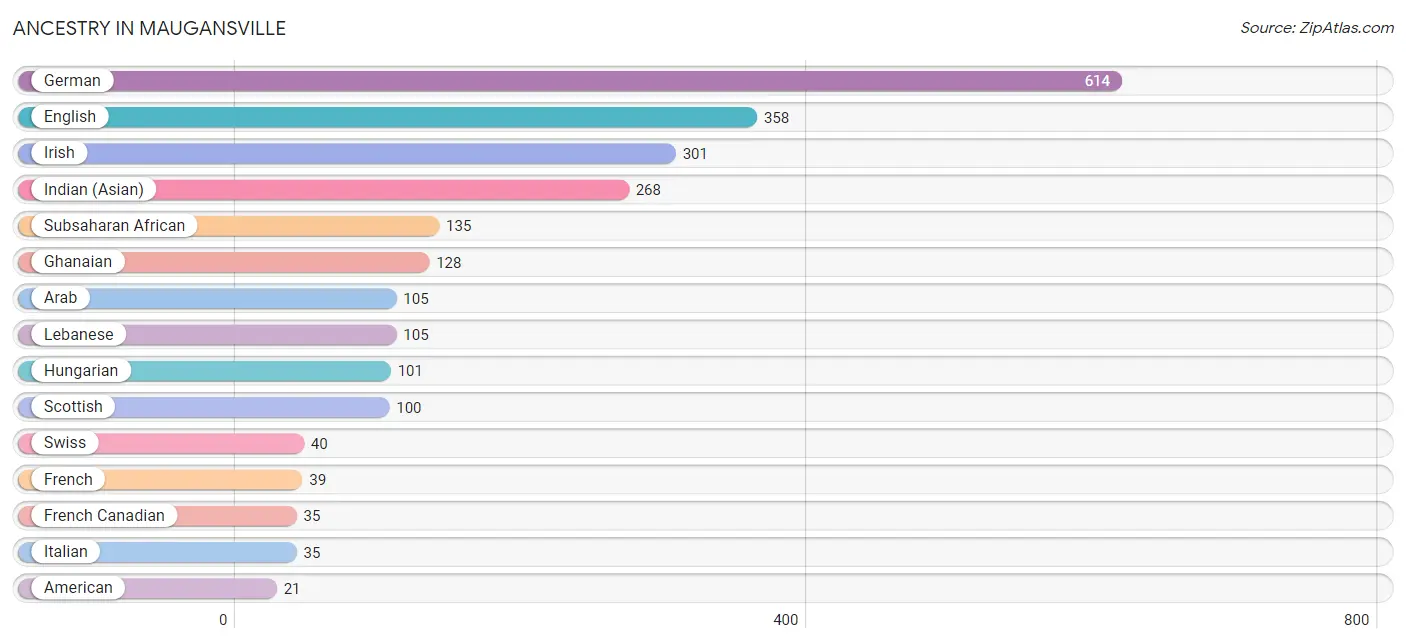
| Ancestry | # Population | % Population |
| African | 7 | 0.3% |
| American | 21 | 0.8% |
| Arab | 105 | 3.8% |
| Central American | 10 | 0.4% |
| Costa Rican | 10 | 0.4% |
| English | 358 | 12.9% |
| European | 11 | 0.4% |
| Finnish | 20 | 0.7% |
| French | 39 | 1.4% |
| French Canadian | 35 | 1.3% |
| German | 614 | 22.2% |
| Ghanaian | 128 | 4.6% |
| Greek | 14 | 0.5% |
| Hungarian | 101 | 3.6% |
| Indian (Asian) | 268 | 9.7% |
| Irish | 301 | 10.9% |
| Italian | 35 | 1.3% |
| Lebanese | 105 | 3.8% |
| Pennsylvania German | 12 | 0.4% |
| Polish | 19 | 0.7% |
| Scotch-Irish | 19 | 0.7% |
| Scottish | 100 | 3.6% |
| Spanish | 17 | 0.6% |
| Subsaharan African | 135 | 4.9% |
| Swiss | 40 | 1.4% |
| Ukrainian | 18 | 0.6% |
| Welsh | 20 | 0.7% | View All 27 Rows |
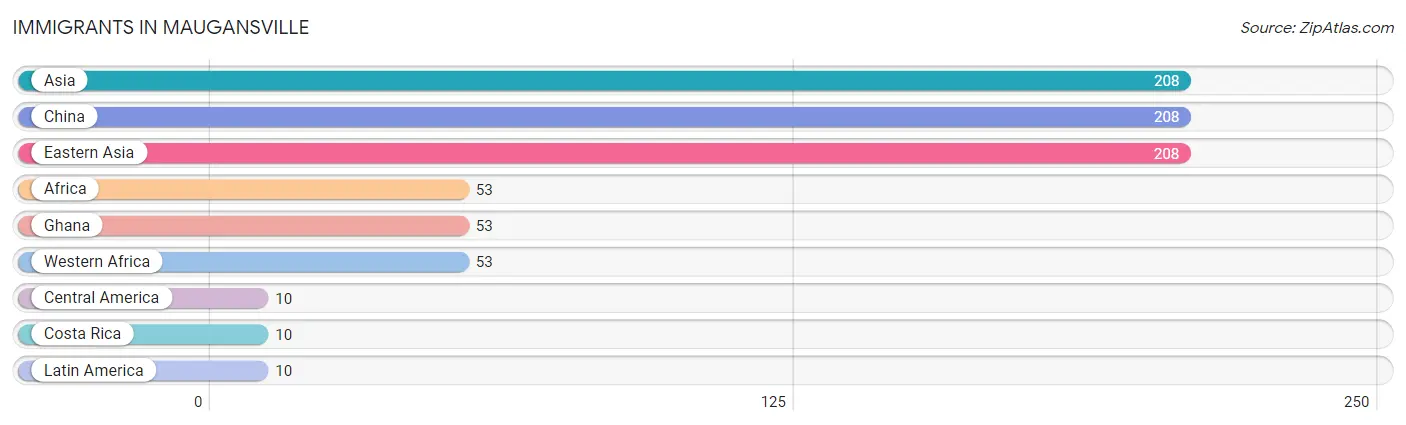
Immigrants in Maugansville
The most numerous immigrant groups reported in Maugansville came from Asia (208 | 7.5%), China (208 | 7.5%), Eastern Asia (208 | 7.5%), Africa (53 | 1.9%), and Ghana (53 | 1.9%), together accounting for 26.4% of all Maugansville residents.
| Immigration Origin | # Population | % Population |
| Africa | 53 | 1.9% |
| Asia | 208 | 7.5% |
| Central America | 10 | 0.4% |
| China | 208 | 7.5% |
| Costa Rica | 10 | 0.4% |
| Eastern Asia | 208 | 7.5% |
| Ghana | 53 | 1.9% |
| Latin America | 10 | 0.4% |
| Western Africa | 53 | 1.9% | View All 9 Rows |
Sex and Age in Maugansville
Sex and Age in Maugansville
The most populous age groups in Maugansville are 60 to 64 Years (157 | 10.7%) for men and 65 to 69 Years (159 | 12.1%) for women.
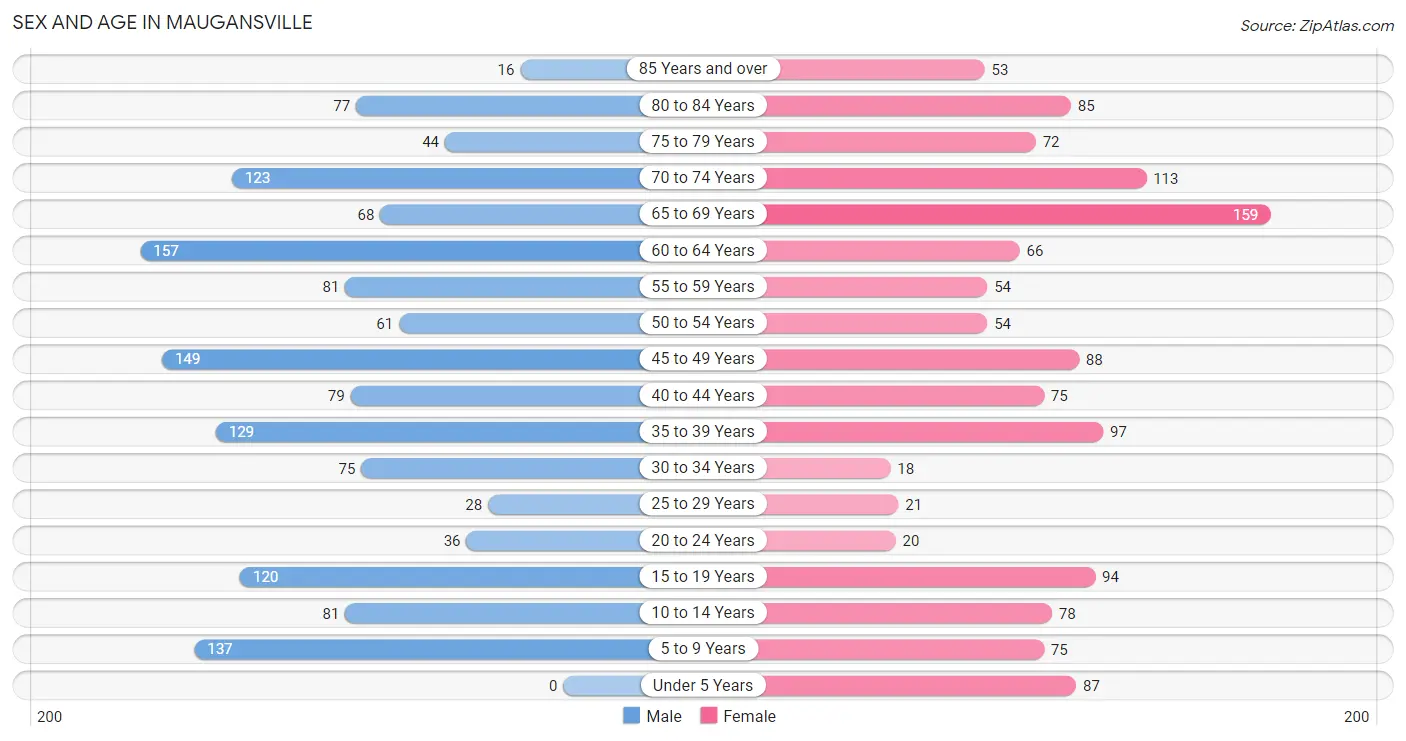
| Age Bracket | Male | Female |
| Under 5 Years | 0 (0.0%) | 87 (6.7%) |
| 5 to 9 Years | 137 (9.4%) | 75 (5.7%) |
| 10 to 14 Years | 81 (5.5%) | 78 (6.0%) |
| 15 to 19 Years | 120 (8.2%) | 94 (7.2%) |
| 20 to 24 Years | 36 (2.5%) | 20 (1.5%) |
| 25 to 29 Years | 28 (1.9%) | 21 (1.6%) |
| 30 to 34 Years | 75 (5.1%) | 18 (1.4%) |
| 35 to 39 Years | 129 (8.8%) | 97 (7.4%) |
| 40 to 44 Years | 79 (5.4%) | 75 (5.7%) |
| 45 to 49 Years | 149 (10.2%) | 88 (6.7%) |
| 50 to 54 Years | 61 (4.2%) | 54 (4.1%) |
| 55 to 59 Years | 81 (5.5%) | 54 (4.1%) |
| 60 to 64 Years | 157 (10.7%) | 66 (5.0%) |
| 65 to 69 Years | 68 (4.6%) | 159 (12.1%) |
| 70 to 74 Years | 123 (8.4%) | 113 (8.6%) |
| 75 to 79 Years | 44 (3.0%) | 72 (5.5%) |
| 80 to 84 Years | 77 (5.3%) | 85 (6.5%) |
| 85 Years and over | 16 (1.1%) | 53 (4.1%) |
| Total | 1,461 (100.0%) | 1,309 (100.0%) |
Families and Households in Maugansville
Median Family Size in Maugansville
The median family size in Maugansville is 2.93 persons per family, with married-couple families (624 | 84.3%) accounting for the largest median family size of 3.13 persons per family. On the other hand, single male/father families (74 | 10.0%) represent the smallest median family size with 1.65 persons per family.
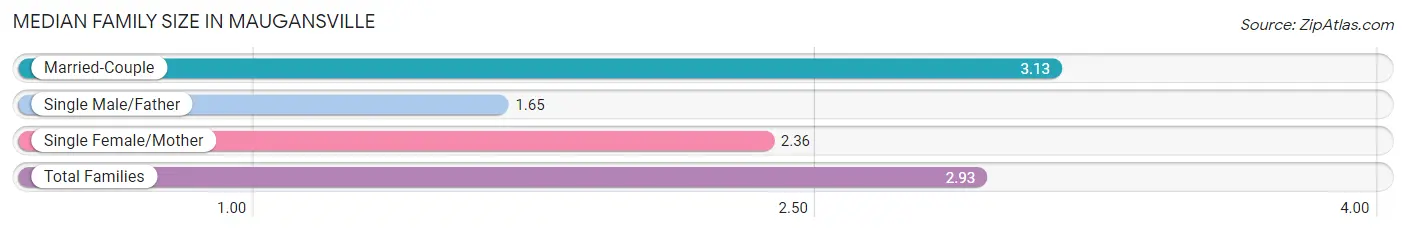
| Family Type | # Families | Family Size |
| Married-Couple | 624 (84.3%) | 3.13 |
| Single Male/Father | 74 (10.0%) | 1.65 |
| Single Female/Mother | 42 (5.7%) | 2.36 |
| Total Families | 740 (100.0%) | 2.93 |
Median Household Size in Maugansville
The median household size in Maugansville is 2.17 persons per household, with married-couple households (624 | 49.8%) accounting for the largest median household size of 3.14 persons per household. non-family households (514 | 41.0%) represent the smallest median household size with 1.06 persons per household.
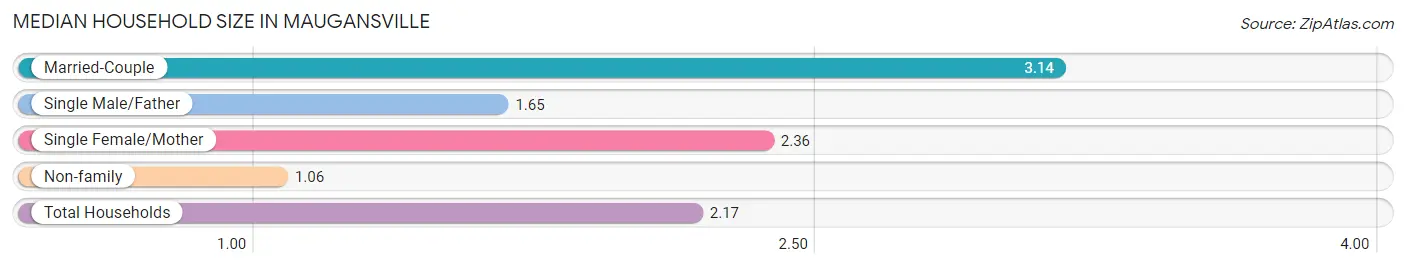
| Household Type | # Households | Household Size |
| Married-Couple | 624 (49.8%) | 3.14 |
| Single Male/Father | 74 (5.9%) | 1.65 |
| Single Female/Mother | 42 (3.4%) | 2.36 |
| Non-family | 514 (41.0%) | 1.06 |
| Total Households | 1,254 (100.0%) | 2.17 |
Household Size by Marriage Status in Maugansville
Out of a total of 1,254 households in Maugansville, 740 (59.0%) are family households, while 514 (41.0%) are nonfamily households. The most numerous type of family households are 2-person households, comprising 355, and the most common type of nonfamily households are 1-person households, comprising 484.
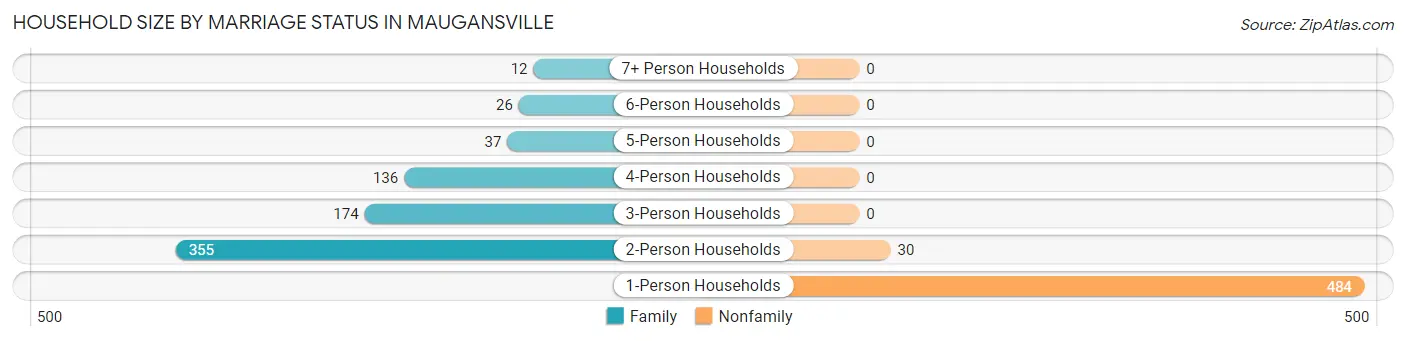
| Household Size | Family Households | Nonfamily Households |
| 1-Person Households | - | 484 (38.6%) |
| 2-Person Households | 355 (28.3%) | 30 (2.4%) |
| 3-Person Households | 174 (13.9%) | 0 (0.0%) |
| 4-Person Households | 136 (10.8%) | 0 (0.0%) |
| 5-Person Households | 37 (2.9%) | 0 (0.0%) |
| 6-Person Households | 26 (2.1%) | 0 (0.0%) |
| 7+ Person Households | 12 (1.0%) | 0 (0.0%) |
| Total | 740 (59.0%) | 514 (41.0%) |
Female Fertility in Maugansville
Fertility by Age in Maugansville
| Age Bracket | Women with Births | Births / 1,000 Women |
| 15 to 19 years | 0 (0.0%) | 0.0 |
| 20 to 34 years | 0 (0.0%) | 0.0 |
| 35 to 50 years | 0 (0.0%) | 0.0 |
| Total | 0 (0.0%) | 0.0 |
Fertility by Age by Marriage Status in Maugansville
| Age Bracket | Married | Unmarried |
| 15 to 19 years | 0 (0.0%) | 0 (0.0%) |
| 20 to 34 years | 0 (0.0%) | 0 (0.0%) |
| 35 to 50 years | 0 (0.0%) | 0 (0.0%) |
| Total | 0 (0.0%) | 0 (0.0%) |
Fertility by Education in Maugansville
| Educational Attainment | Women with Births | Births / 1,000 Women |
| Less than High School | 0 (0.0%) | 0.0 |
| High School Diploma | 0 (0.0%) | 0.0 |
| College or Associate's Degree | 0 (0.0%) | 0.0 |
| Bachelor's Degree | 0 (0.0%) | 0.0 |
| Graduate Degree | 0 (0.0%) | 0.0 |
| Total | 0 (0.0%) | 0.0 |
Fertility by Education by Marriage Status in Maugansville
| Educational Attainment | Married | Unmarried |
| Less than High School | 0 (0.0%) | 0 (0.0%) |
| High School Diploma | 0 (0.0%) | 0 (0.0%) |
| College or Associate's Degree | 0 (0.0%) | 0 (0.0%) |
| Bachelor's Degree | 0 (0.0%) | 0 (0.0%) |
| Graduate Degree | 0 (0.0%) | 0 (0.0%) |
| Total | 0 (0.0%) | 0 (0.0%) |
Employment Characteristics in Maugansville
Employment by Class of Employer in Maugansville
Among the 1,160 employed individuals in Maugansville, private company employees (686 | 59.1%), self-employed (not incorporated) (124 | 10.7%), and local government employees (110 | 9.5%) make up the most common classes of employment.
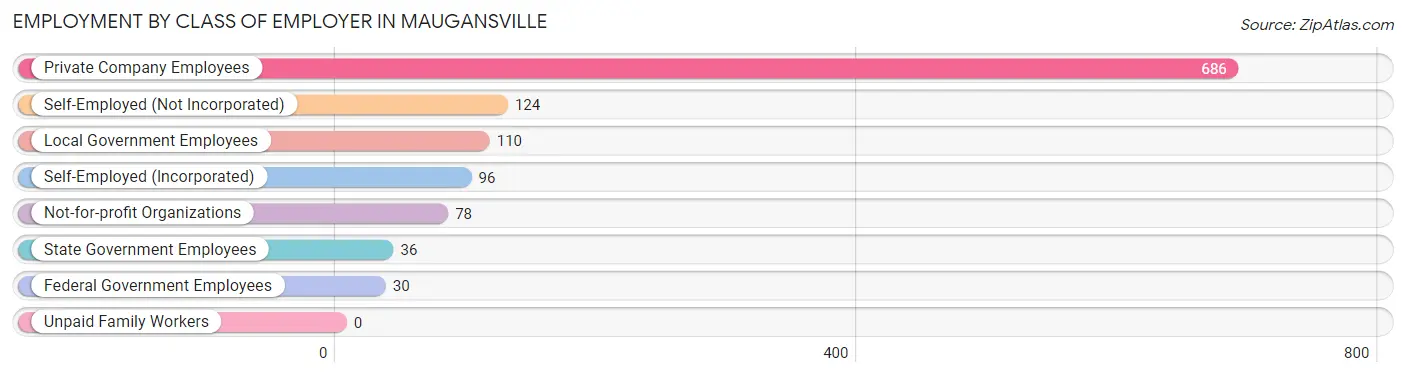
| Employer Class | # Employees | % Employees |
| Private Company Employees | 686 | 59.1% |
| Self-Employed (Incorporated) | 96 | 8.3% |
| Self-Employed (Not Incorporated) | 124 | 10.7% |
| Not-for-profit Organizations | 78 | 6.7% |
| Local Government Employees | 110 | 9.5% |
| State Government Employees | 36 | 3.1% |
| Federal Government Employees | 30 | 2.6% |
| Unpaid Family Workers | 0 | 0.0% |
| Total | 1,160 | 100.0% |
Employment Status by Age in Maugansville
According to the labor force statistics for Maugansville, out of the total population over 16 years of age (2,286), 56.0% or 1,280 individuals are in the labor force, with 7.1% or 91 of them unemployed. The age group with the highest labor force participation rate is 25 to 29 years, with 100.0% or 49 individuals in the labor force. Within the labor force, the 25 to 29 years age range has the highest percentage of unemployed individuals, with 57.1% or 28 of them being unemployed.
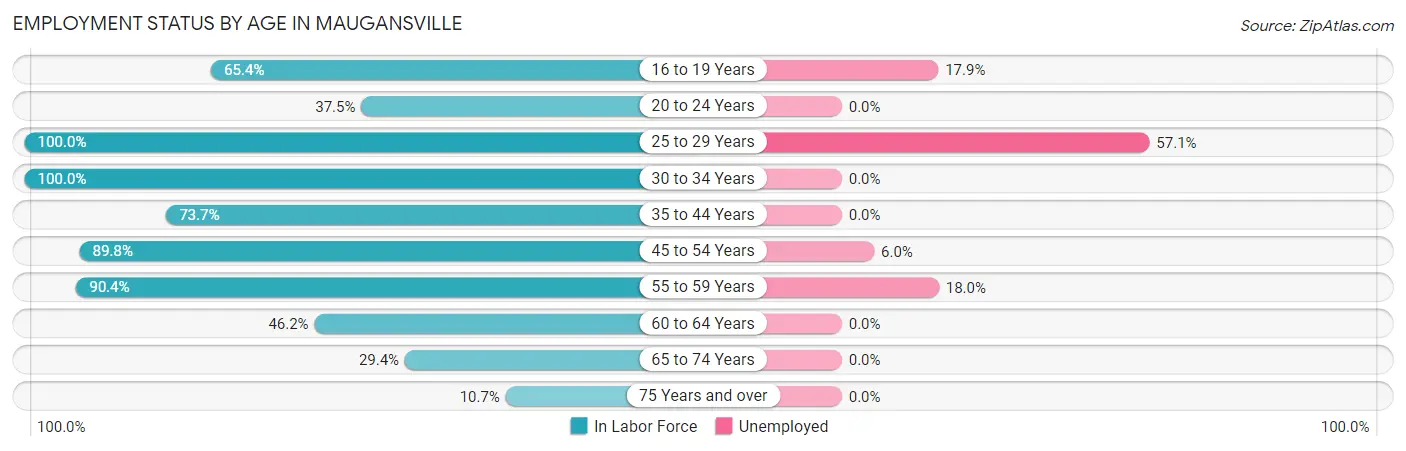
| Age Bracket | In Labor Force | Unemployed |
| 16 to 19 Years | 123 (65.4%) | 22 (17.9%) |
| 20 to 24 Years | 21 (37.5%) | 0 (0.0%) |
| 25 to 29 Years | 49 (100.0%) | 28 (57.1%) |
| 30 to 34 Years | 93 (100.0%) | 0 (0.0%) |
| 35 to 44 Years | 280 (73.7%) | 0 (0.0%) |
| 45 to 54 Years | 316 (89.8%) | 19 (6.0%) |
| 55 to 59 Years | 122 (90.4%) | 22 (18.0%) |
| 60 to 64 Years | 103 (46.2%) | 0 (0.0%) |
| 65 to 74 Years | 136 (29.4%) | 0 (0.0%) |
| 75 Years and over | 37 (10.7%) | 0 (0.0%) |
| Total | 1,280 (56.0%) | 91 (7.1%) |
Employment Status by Educational Attainment in Maugansville
According to labor force statistics for Maugansville, 78.2% of individuals (963) out of the total population between 25 and 64 years of age (1,232) are in the labor force, with 7.2% or 69 of them being unemployed. The group with the highest labor force participation rate are those with the educational attainment of college / associate degree, with 89.6% or 414 individuals in the labor force. Within the labor force, individuals with high school diploma education have the highest percentage of unemployment, with 10.7% or 19 of them being unemployed.
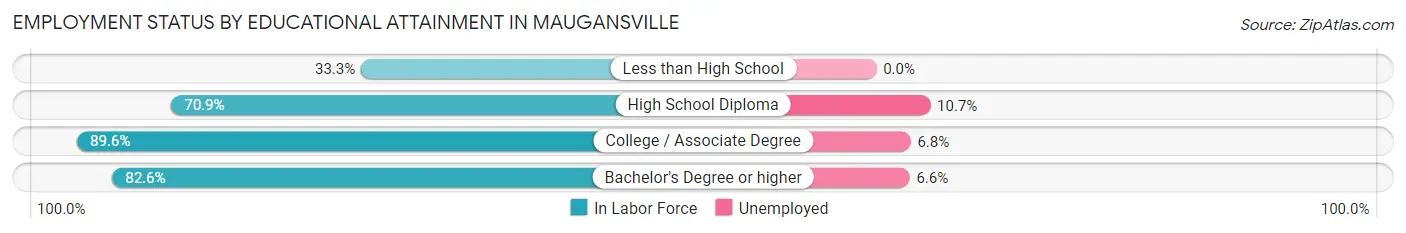
| Educational Attainment | In Labor Force | Unemployed |
| Less than High School | 39 (33.3%) | 0 (0.0%) |
| High School Diploma | 178 (70.9%) | 27 (10.7%) |
| College / Associate Degree | 414 (89.6%) | 31 (6.8%) |
| Bachelor's Degree or higher | 332 (82.6%) | 27 (6.6%) |
| Total | 963 (78.2%) | 89 (7.2%) |
Employment Occupations by Sex in Maugansville
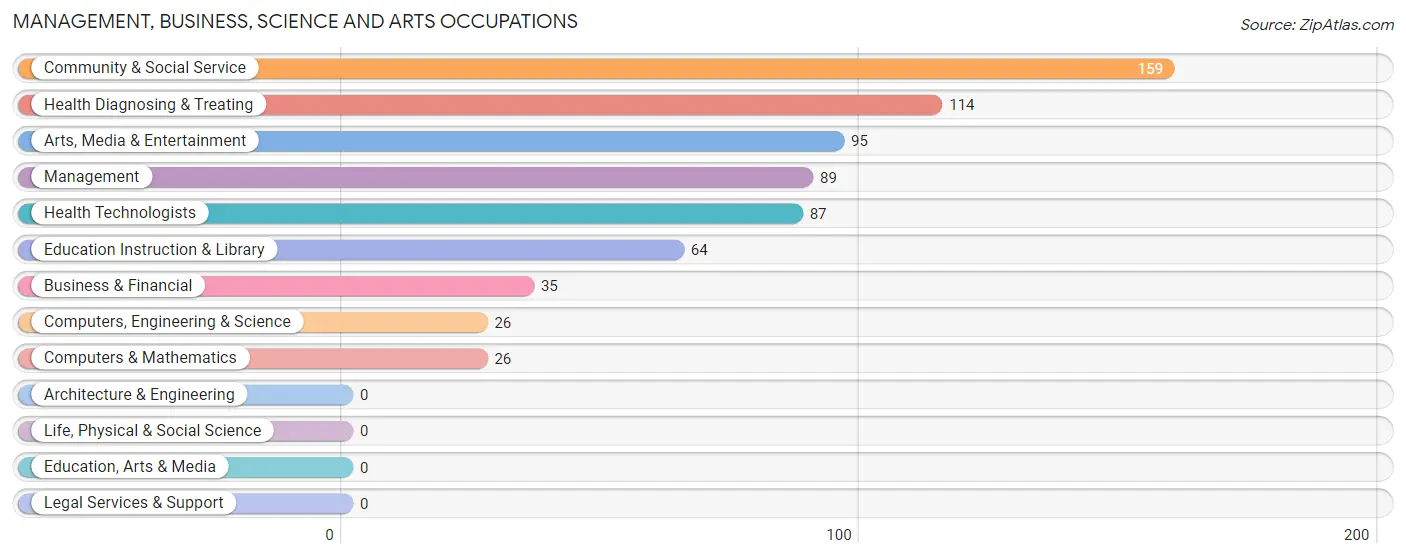
Management, Business, Science and Arts Occupations
The most common Management, Business, Science and Arts occupations in Maugansville are Community & Social Service (159 | 13.4%), Health Diagnosing & Treating (114 | 9.6%), Arts, Media & Entertainment (95 | 8.0%), Management (89 | 7.5%), and Health Technologists (87 | 7.3%).
Management, Business, Science and Arts Occupations by Sex
Within the Management, Business, Science and Arts occupations in Maugansville, the most male-oriented occupations are Computers, Engineering & Science (100.0%), Computers & Mathematics (100.0%), and Arts, Media & Entertainment (100.0%), while the most female-oriented occupations are Health Technologists (77.0%), Health Diagnosing & Treating (58.8%), and Management (55.1%).
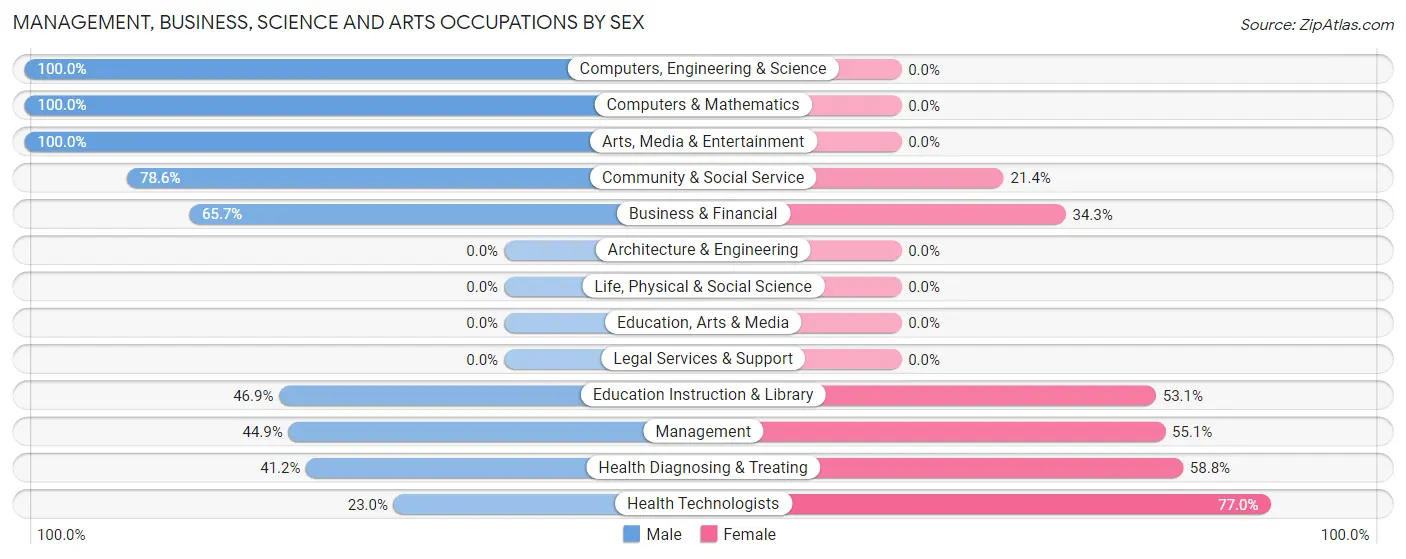
| Occupation | Male | Female |
| Management | 40 (44.9%) | 49 (55.1%) |
| Business & Financial | 23 (65.7%) | 12 (34.3%) |
| Computers, Engineering & Science | 26 (100.0%) | 0 (0.0%) |
| Computers & Mathematics | 26 (100.0%) | 0 (0.0%) |
| Architecture & Engineering | 0 (0.0%) | 0 (0.0%) |
| Life, Physical & Social Science | 0 (0.0%) | 0 (0.0%) |
| Community & Social Service | 125 (78.6%) | 34 (21.4%) |
| Education, Arts & Media | 0 (0.0%) | 0 (0.0%) |
| Legal Services & Support | 0 (0.0%) | 0 (0.0%) |
| Education Instruction & Library | 30 (46.9%) | 34 (53.1%) |
| Arts, Media & Entertainment | 95 (100.0%) | 0 (0.0%) |
| Health Diagnosing & Treating | 47 (41.2%) | 67 (58.8%) |
| Health Technologists | 20 (23.0%) | 67 (77.0%) |
| Total (Category) | 261 (61.7%) | 162 (38.3%) |
| Total (Overall) | 721 (60.6%) | 468 (39.4%) |
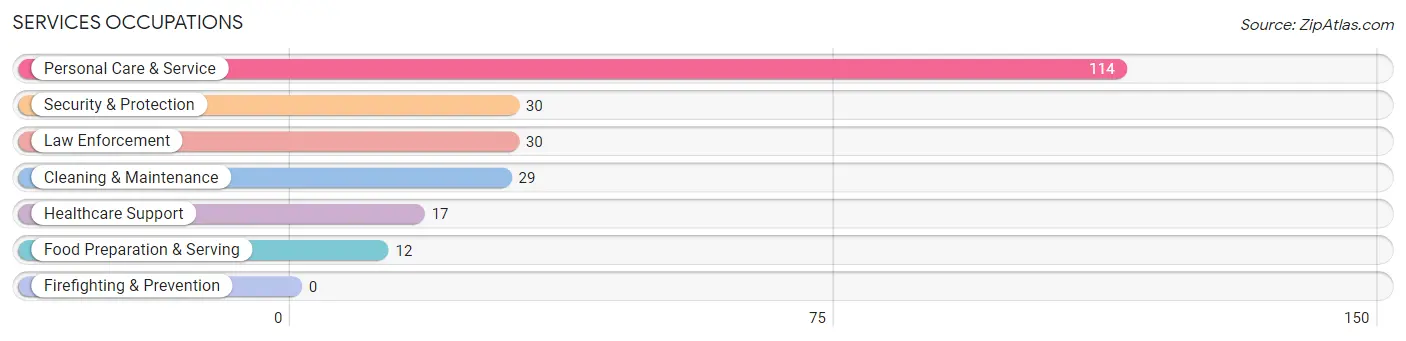
Services Occupations
The most common Services occupations in Maugansville are Personal Care & Service (114 | 9.6%), Security & Protection (30 | 2.5%), Law Enforcement (30 | 2.5%), Cleaning & Maintenance (29 | 2.4%), and Healthcare Support (17 | 1.4%).
Services Occupations by Sex
Within the Services occupations in Maugansville, the most male-oriented occupations are Security & Protection (100.0%), Law Enforcement (100.0%), and Food Preparation & Serving (100.0%), while the most female-oriented occupations are Healthcare Support (100.0%), Personal Care & Service (100.0%), and Cleaning & Maintenance (27.6%).
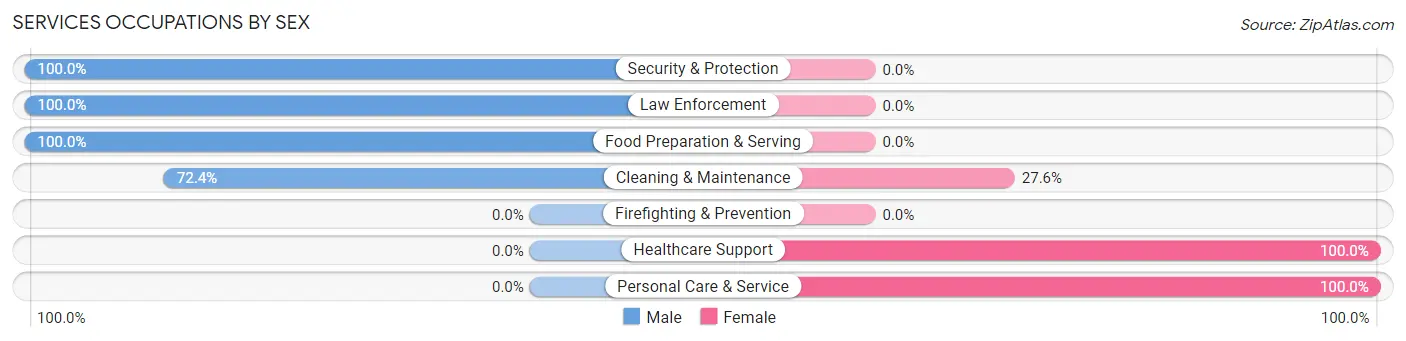
| Occupation | Male | Female |
| Healthcare Support | 0 (0.0%) | 17 (100.0%) |
| Security & Protection | 30 (100.0%) | 0 (0.0%) |
| Firefighting & Prevention | 0 (0.0%) | 0 (0.0%) |
| Law Enforcement | 30 (100.0%) | 0 (0.0%) |
| Food Preparation & Serving | 12 (100.0%) | 0 (0.0%) |
| Cleaning & Maintenance | 21 (72.4%) | 8 (27.6%) |
| Personal Care & Service | 0 (0.0%) | 114 (100.0%) |
| Total (Category) | 63 (31.2%) | 139 (68.8%) |
| Total (Overall) | 721 (60.6%) | 468 (39.4%) |
Sales and Office Occupations
The most common Sales and Office occupations in Maugansville are Office & Administration (186 | 15.6%), and Sales & Related (92 | 7.7%).
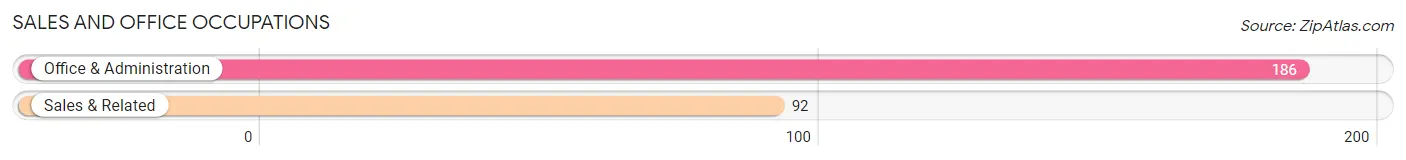
Sales and Office Occupations by Sex

| Occupation | Male | Female |
| Sales & Related | 92 (100.0%) | 0 (0.0%) |
| Office & Administration | 44 (23.7%) | 142 (76.3%) |
| Total (Category) | 136 (48.9%) | 142 (51.1%) |
| Total (Overall) | 721 (60.6%) | 468 (39.4%) |
Natural Resources, Construction and Maintenance Occupations
The most common Natural Resources, Construction and Maintenance occupations in Maugansville are Installation, Maintenance & Repair (79 | 6.6%), and Farming, Fishing & Forestry (15 | 1.3%).
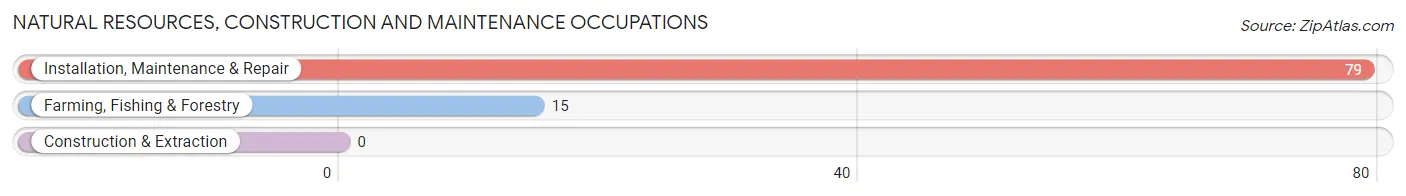
Natural Resources, Construction and Maintenance Occupations by Sex
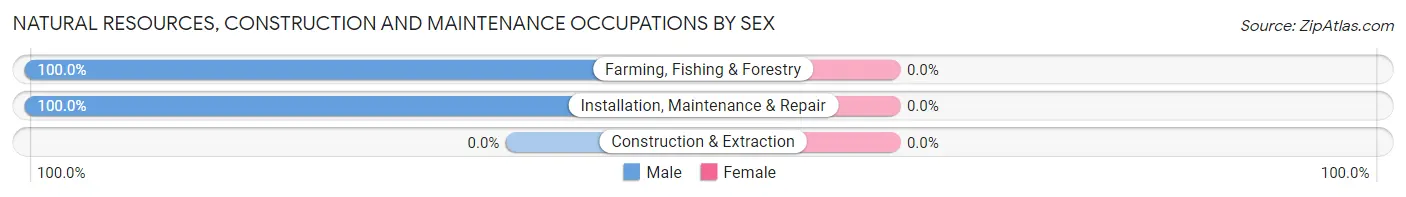
| Occupation | Male | Female |
| Farming, Fishing & Forestry | 15 (100.0%) | 0 (0.0%) |
| Construction & Extraction | 0 (0.0%) | 0 (0.0%) |
| Installation, Maintenance & Repair | 79 (100.0%) | 0 (0.0%) |
| Total (Category) | 94 (100.0%) | 0 (0.0%) |
| Total (Overall) | 721 (60.6%) | 468 (39.4%) |
Production, Transportation and Moving Occupations
The most common Production, Transportation and Moving occupations in Maugansville are Material Moving (84 | 7.1%), Production (58 | 4.9%), and Transportation (50 | 4.2%).
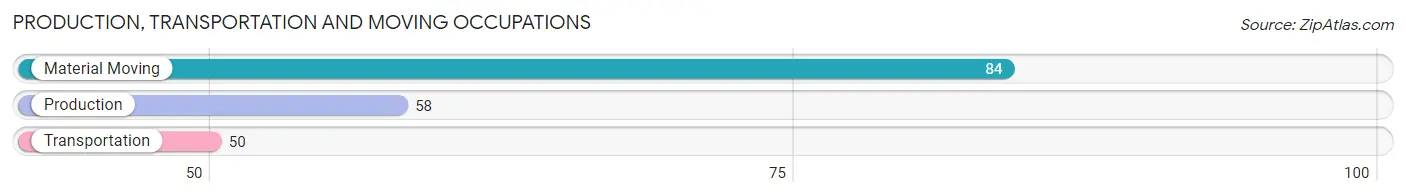
Production, Transportation and Moving Occupations by Sex
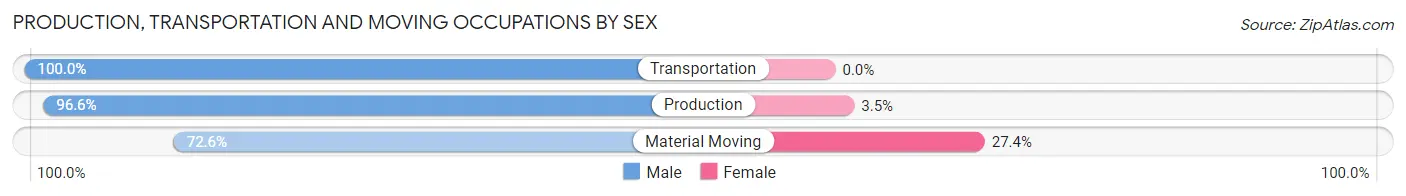
| Occupation | Male | Female |
| Production | 56 (96.6%) | 2 (3.5%) |
| Transportation | 50 (100.0%) | 0 (0.0%) |
| Material Moving | 61 (72.6%) | 23 (27.4%) |
| Total (Category) | 167 (87.0%) | 25 (13.0%) |
| Total (Overall) | 721 (60.6%) | 468 (39.4%) |
Employment Industries by Sex in Maugansville
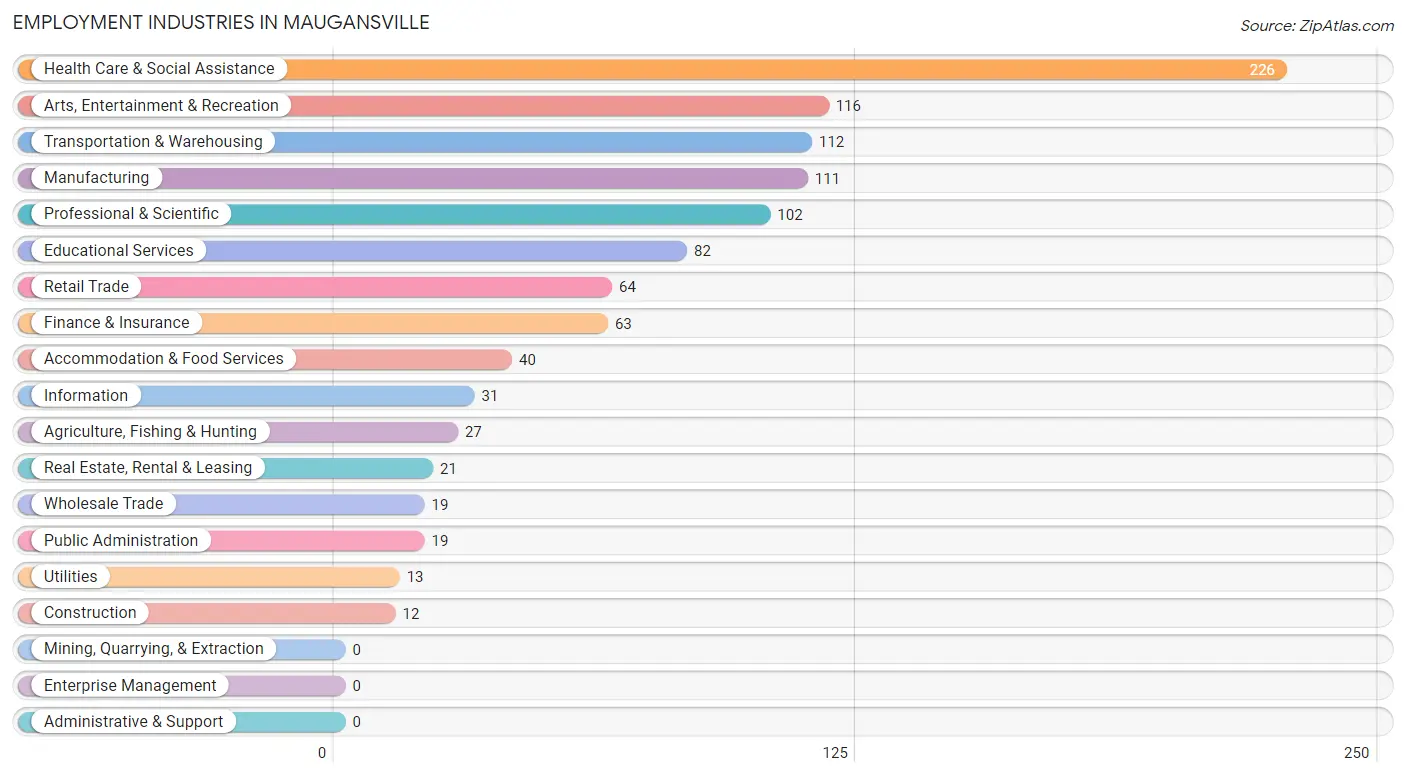
Employment Industries in Maugansville
The major employment industries in Maugansville include Health Care & Social Assistance (226 | 19.0%), Arts, Entertainment & Recreation (116 | 9.8%), Transportation & Warehousing (112 | 9.4%), Manufacturing (111 | 9.3%), and Professional & Scientific (102 | 8.6%).
Employment Industries by Sex in Maugansville
The Maugansville industries that see more men than women are Agriculture, Fishing & Hunting (100.0%), Construction (100.0%), and Wholesale Trade (100.0%), whereas the industries that tend to have a higher number of women are Health Care & Social Assistance (79.2%), Educational Services (63.4%), and Professional & Scientific (57.8%).
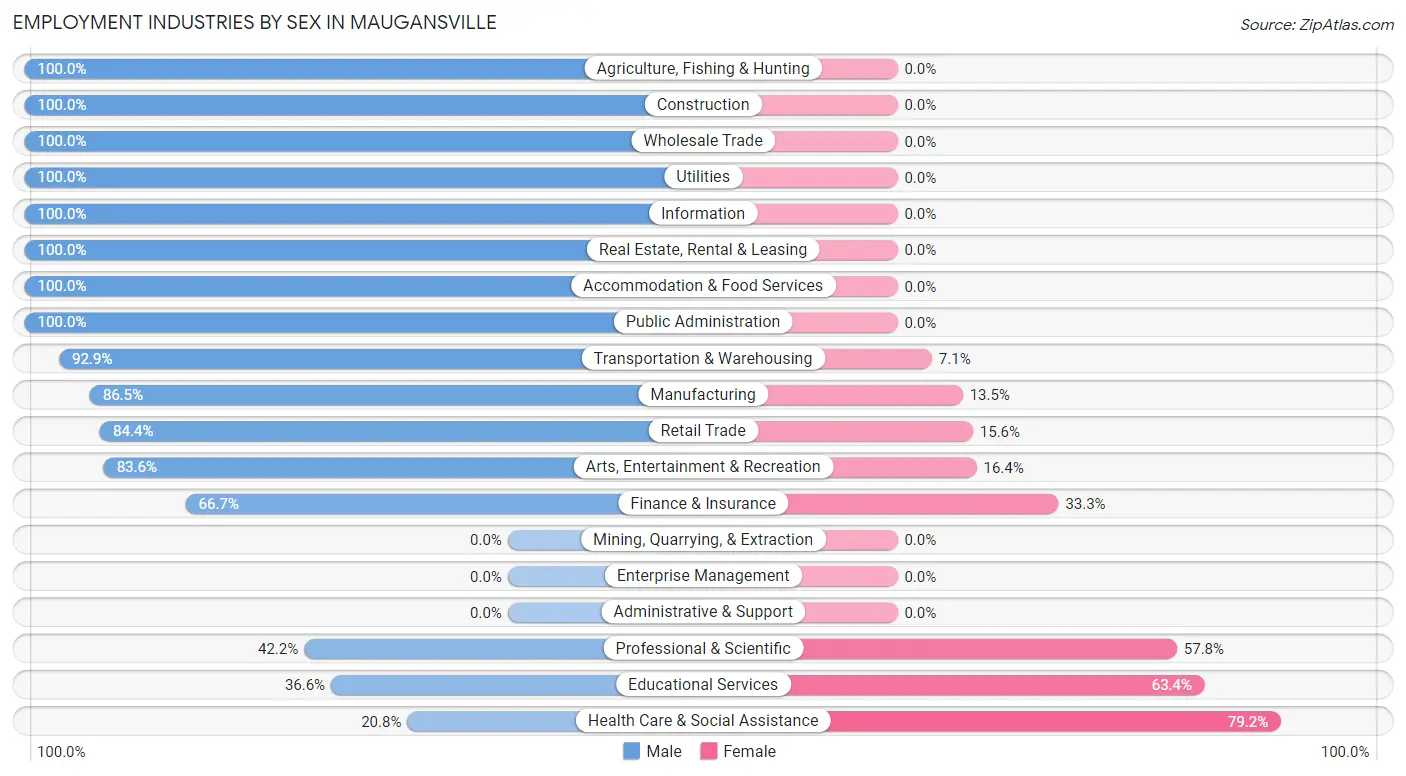
| Industry | Male | Female |
| Agriculture, Fishing & Hunting | 27 (100.0%) | 0 (0.0%) |
| Mining, Quarrying, & Extraction | 0 (0.0%) | 0 (0.0%) |
| Construction | 12 (100.0%) | 0 (0.0%) |
| Manufacturing | 96 (86.5%) | 15 (13.5%) |
| Wholesale Trade | 19 (100.0%) | 0 (0.0%) |
| Retail Trade | 54 (84.4%) | 10 (15.6%) |
| Transportation & Warehousing | 104 (92.9%) | 8 (7.1%) |
| Utilities | 13 (100.0%) | 0 (0.0%) |
| Information | 31 (100.0%) | 0 (0.0%) |
| Finance & Insurance | 42 (66.7%) | 21 (33.3%) |
| Real Estate, Rental & Leasing | 21 (100.0%) | 0 (0.0%) |
| Professional & Scientific | 43 (42.2%) | 59 (57.8%) |
| Enterprise Management | 0 (0.0%) | 0 (0.0%) |
| Administrative & Support | 0 (0.0%) | 0 (0.0%) |
| Educational Services | 30 (36.6%) | 52 (63.4%) |
| Health Care & Social Assistance | 47 (20.8%) | 179 (79.2%) |
| Arts, Entertainment & Recreation | 97 (83.6%) | 19 (16.4%) |
| Accommodation & Food Services | 40 (100.0%) | 0 (0.0%) |
| Public Administration | 19 (100.0%) | 0 (0.0%) |
| Total | 721 (60.6%) | 468 (39.4%) |
Education in Maugansville
School Enrollment in Maugansville
The most common levels of schooling among the 578 students in Maugansville are high school (157 | 27.2%), middle school (155 | 26.8%), and elementary school (113 | 19.6%).
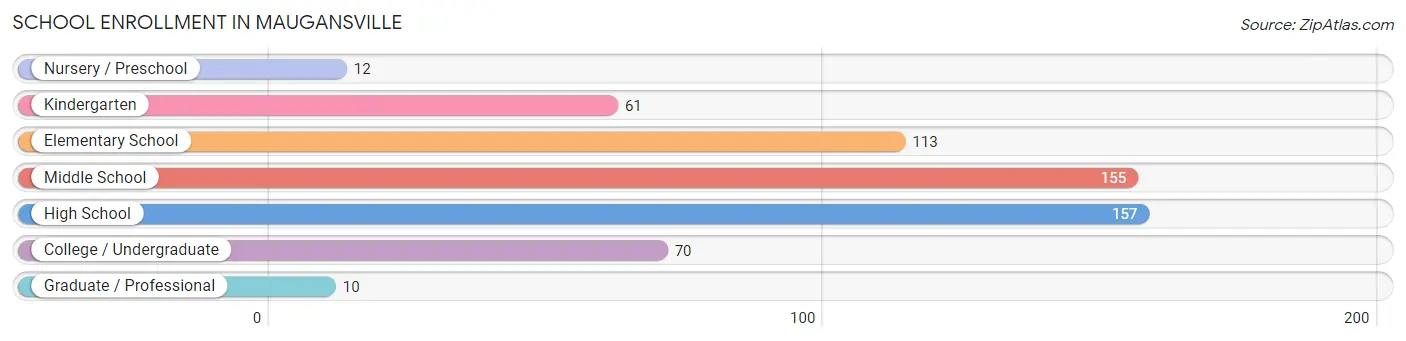
| School Level | # Students | % Students |
| Nursery / Preschool | 12 | 2.1% |
| Kindergarten | 61 | 10.5% |
| Elementary School | 113 | 19.6% |
| Middle School | 155 | 26.8% |
| High School | 157 | 27.2% |
| College / Undergraduate | 70 | 12.1% |
| Graduate / Professional | 10 | 1.7% |
| Total | 578 | 100.0% |
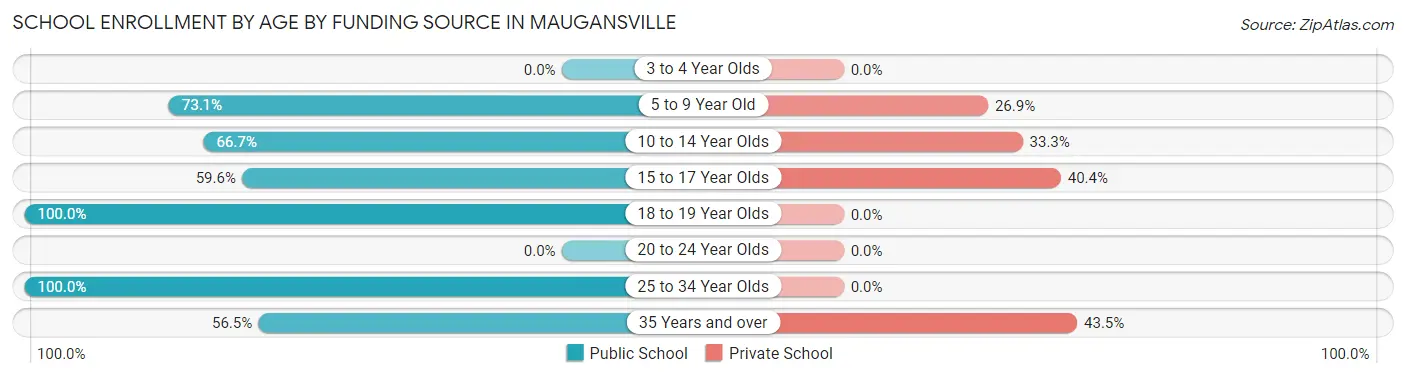
School Enrollment by Age by Funding Source in Maugansville
Out of a total of 578 students who are enrolled in schools in Maugansville, 168 (29.1%) attend a private institution, while the remaining 410 (70.9%) are enrolled in public schools. The age group of 35 years and over has the highest likelihood of being enrolled in private schools, with 10 (43.5% in the age bracket) enrolled. Conversely, the age group of 18 to 19 year olds has the lowest likelihood of being enrolled in a private school, with 28 (100.0% in the age bracket) attending a public institution.
| Age Bracket | Public School | Private School |
| 3 to 4 Year Olds | 0 (0.0%) | 0 (0.0%) |
| 5 to 9 Year Old | 136 (73.1%) | 50 (26.9%) |
| 10 to 14 Year Olds | 106 (66.7%) | 53 (33.3%) |
| 15 to 17 Year Olds | 81 (59.6%) | 55 (40.4%) |
| 18 to 19 Year Olds | 28 (100.0%) | 0 (0.0%) |
| 20 to 24 Year Olds | 0 (0.0%) | 0 (0.0%) |
| 25 to 34 Year Olds | 46 (100.0%) | 0 (0.0%) |
| 35 Years and over | 13 (56.5%) | 10 (43.5%) |
| Total | 410 (70.9%) | 168 (29.1%) |
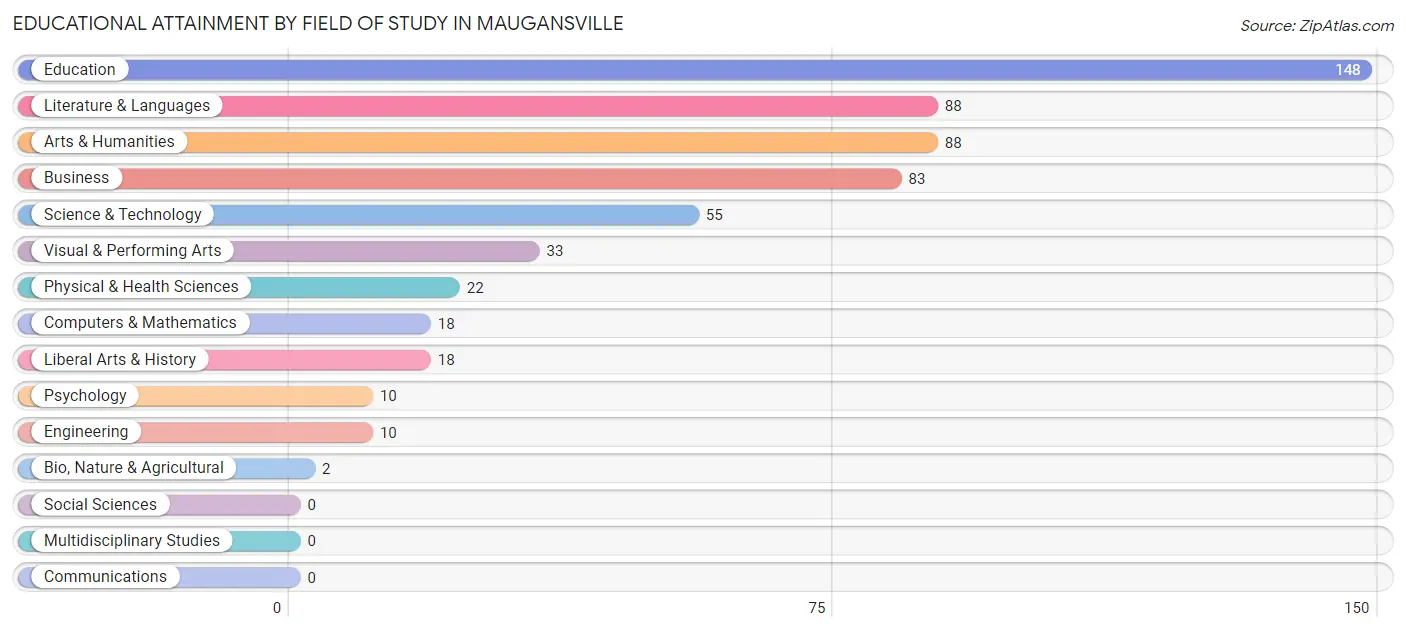
Educational Attainment by Field of Study in Maugansville
Education (148 | 25.7%), literature & languages (88 | 15.3%), arts & humanities (88 | 15.3%), business (83 | 14.4%), and science & technology (55 | 9.6%) are the most common fields of study among 575 individuals in Maugansville who have obtained a bachelor's degree or higher.
| Field of Study | # Graduates | % Graduates |
| Computers & Mathematics | 18 | 3.1% |
| Bio, Nature & Agricultural | 2 | 0.4% |
| Physical & Health Sciences | 22 | 3.8% |
| Psychology | 10 | 1.7% |
| Social Sciences | 0 | 0.0% |
| Engineering | 10 | 1.7% |
| Multidisciplinary Studies | 0 | 0.0% |
| Science & Technology | 55 | 9.6% |
| Business | 83 | 14.4% |
| Education | 148 | 25.7% |
| Literature & Languages | 88 | 15.3% |
| Liberal Arts & History | 18 | 3.1% |
| Visual & Performing Arts | 33 | 5.7% |
| Communications | 0 | 0.0% |
| Arts & Humanities | 88 | 15.3% |
| Total | 575 | 100.0% |
Transportation & Commute in Maugansville
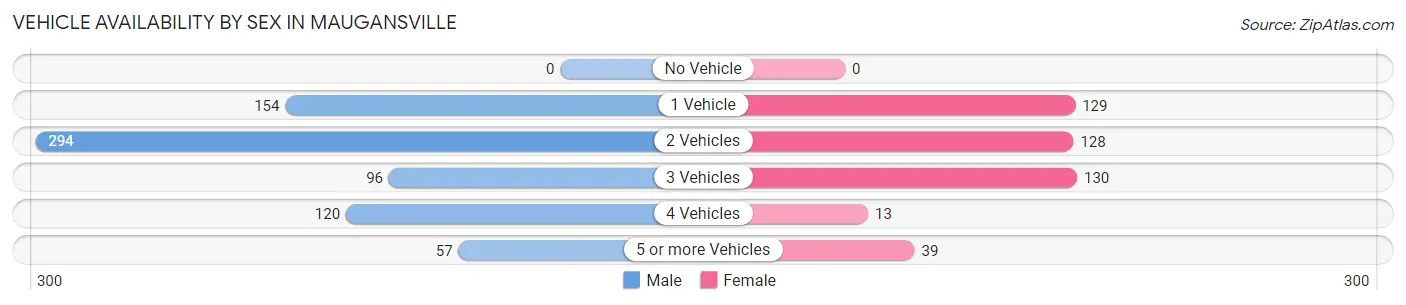
Vehicle Availability by Sex in Maugansville
The most prevalent vehicle ownership categories in Maugansville are males with 2 vehicles (294, accounting for 40.8%) and females with 2 vehicles (128, making up 67.0%).
| Vehicles Available | Male | Female |
| No Vehicle | 0 (0.0%) | 0 (0.0%) |
| 1 Vehicle | 154 (21.4%) | 129 (29.4%) |
| 2 Vehicles | 294 (40.8%) | 128 (29.2%) |
| 3 Vehicles | 96 (13.3%) | 130 (29.6%) |
| 4 Vehicles | 120 (16.6%) | 13 (3.0%) |
| 5 or more Vehicles | 57 (7.9%) | 39 (8.9%) |
| Total | 721 (100.0%) | 439 (100.0%) |
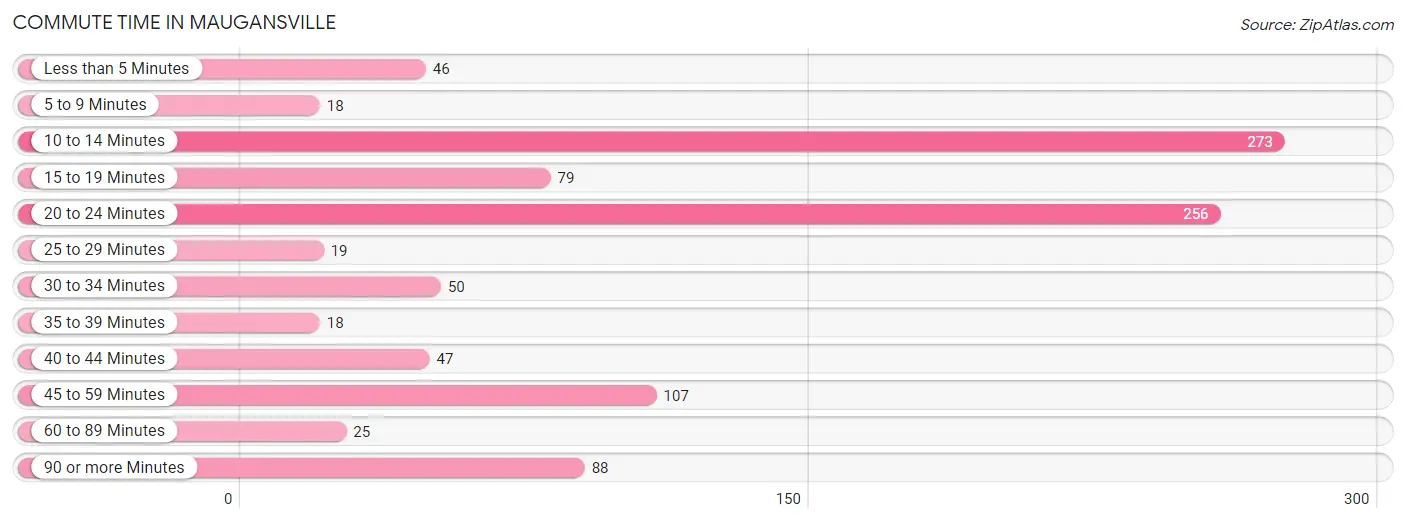
Commute Time in Maugansville
The most frequently occuring commute durations in Maugansville are 10 to 14 minutes (273 commuters, 26.6%), 20 to 24 minutes (256 commuters, 24.9%), and 45 to 59 minutes (107 commuters, 10.4%).
| Commute Time | # Commuters | % Commuters |
| Less than 5 Minutes | 46 | 4.5% |
| 5 to 9 Minutes | 18 | 1.8% |
| 10 to 14 Minutes | 273 | 26.6% |
| 15 to 19 Minutes | 79 | 7.7% |
| 20 to 24 Minutes | 256 | 24.9% |
| 25 to 29 Minutes | 19 | 1.8% |
| 30 to 34 Minutes | 50 | 4.9% |
| 35 to 39 Minutes | 18 | 1.8% |
| 40 to 44 Minutes | 47 | 4.6% |
| 45 to 59 Minutes | 107 | 10.4% |
| 60 to 89 Minutes | 25 | 2.4% |
| 90 or more Minutes | 88 | 8.6% |
Commute Time by Sex in Maugansville
The most common commute times in Maugansville are 10 to 14 minutes (230 commuters, 34.0%) for males and 20 to 24 minutes (90 commuters, 25.8%) for females.
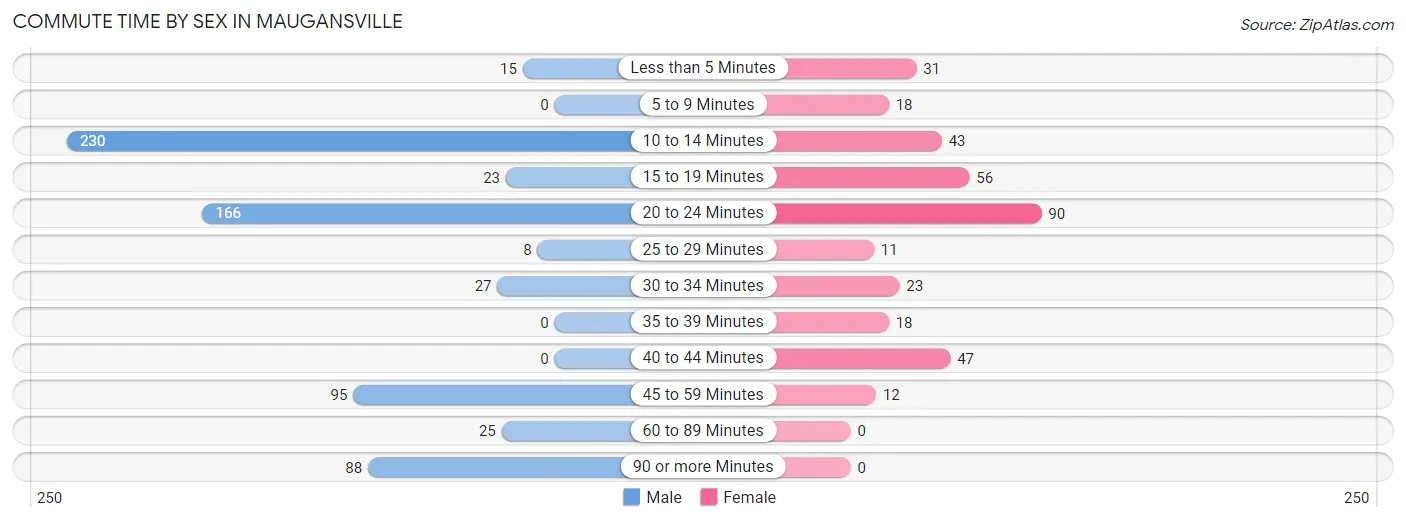
| Commute Time | Male | Female |
| Less than 5 Minutes | 15 (2.2%) | 31 (8.9%) |
| 5 to 9 Minutes | 0 (0.0%) | 18 (5.2%) |
| 10 to 14 Minutes | 230 (34.0%) | 43 (12.3%) |
| 15 to 19 Minutes | 23 (3.4%) | 56 (16.1%) |
| 20 to 24 Minutes | 166 (24.5%) | 90 (25.8%) |
| 25 to 29 Minutes | 8 (1.2%) | 11 (3.2%) |
| 30 to 34 Minutes | 27 (4.0%) | 23 (6.6%) |
| 35 to 39 Minutes | 0 (0.0%) | 18 (5.2%) |
| 40 to 44 Minutes | 0 (0.0%) | 47 (13.5%) |
| 45 to 59 Minutes | 95 (14.0%) | 12 (3.4%) |
| 60 to 89 Minutes | 25 (3.7%) | 0 (0.0%) |
| 90 or more Minutes | 88 (13.0%) | 0 (0.0%) |
Time of Departure to Work by Sex in Maugansville
The most frequent times of departure to work in Maugansville are 8:00 AM to 8:29 AM (115, 17.0%) for males and 7:00 AM to 7:29 AM (89, 25.5%) for females.
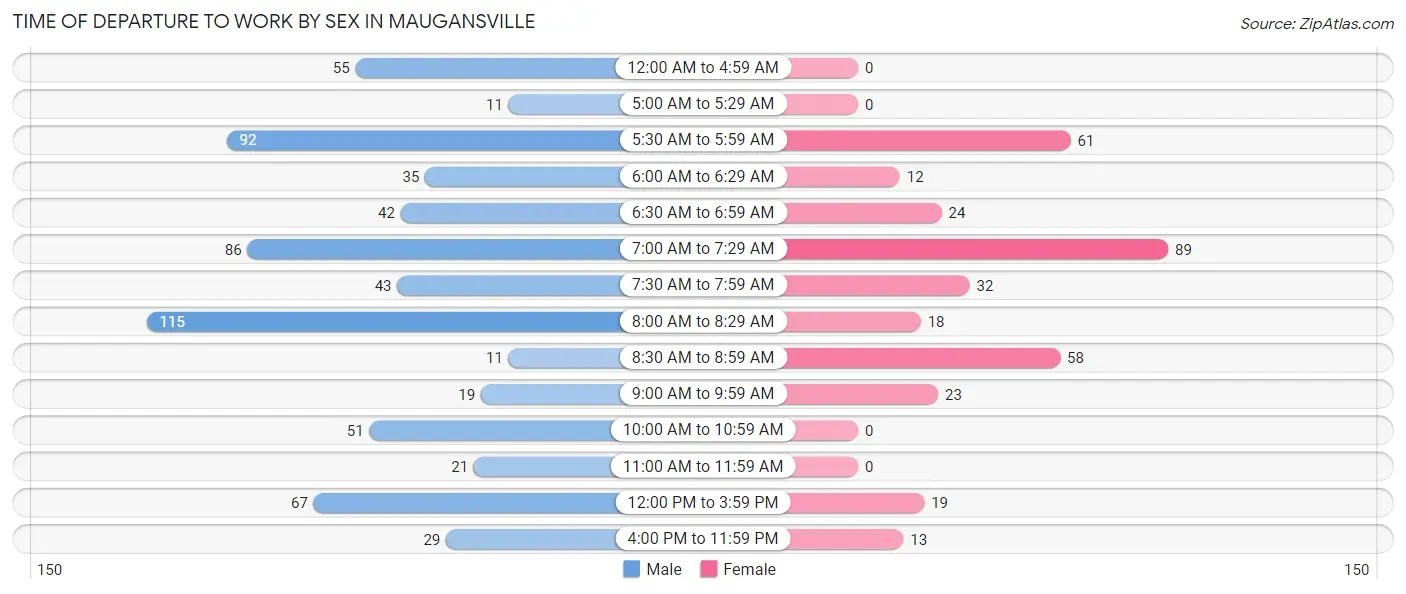
| Time of Departure | Male | Female |
| 12:00 AM to 4:59 AM | 55 (8.1%) | 0 (0.0%) |
| 5:00 AM to 5:29 AM | 11 (1.6%) | 0 (0.0%) |
| 5:30 AM to 5:59 AM | 92 (13.6%) | 61 (17.5%) |
| 6:00 AM to 6:29 AM | 35 (5.2%) | 12 (3.4%) |
| 6:30 AM to 6:59 AM | 42 (6.2%) | 24 (6.9%) |
| 7:00 AM to 7:29 AM | 86 (12.7%) | 89 (25.5%) |
| 7:30 AM to 7:59 AM | 43 (6.4%) | 32 (9.2%) |
| 8:00 AM to 8:29 AM | 115 (17.0%) | 18 (5.2%) |
| 8:30 AM to 8:59 AM | 11 (1.6%) | 58 (16.6%) |
| 9:00 AM to 9:59 AM | 19 (2.8%) | 23 (6.6%) |
| 10:00 AM to 10:59 AM | 51 (7.5%) | 0 (0.0%) |
| 11:00 AM to 11:59 AM | 21 (3.1%) | 0 (0.0%) |
| 12:00 PM to 3:59 PM | 67 (9.9%) | 19 (5.4%) |
| 4:00 PM to 11:59 PM | 29 (4.3%) | 13 (3.7%) |
| Total | 677 (100.0%) | 349 (100.0%) |
Housing Occupancy in Maugansville
Occupancy by Ownership in Maugansville
Of the total 1,254 dwellings in Maugansville, owner-occupied units account for 870 (69.4%), while renter-occupied units make up 384 (30.6%).
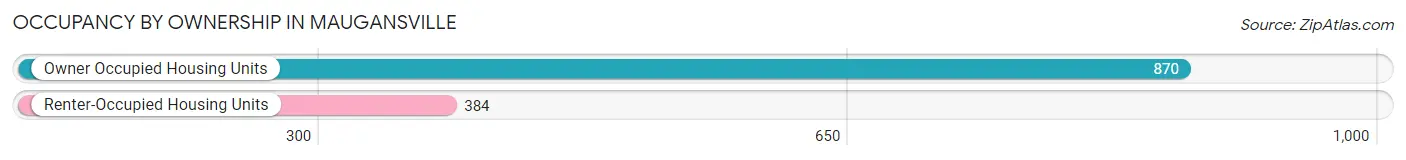
| Occupancy | # Housing Units | % Housing Units |
| Owner Occupied Housing Units | 870 | 69.4% |
| Renter-Occupied Housing Units | 384 | 30.6% |
| Total Occupied Housing Units | 1,254 | 100.0% |
Occupancy by Household Size in Maugansville
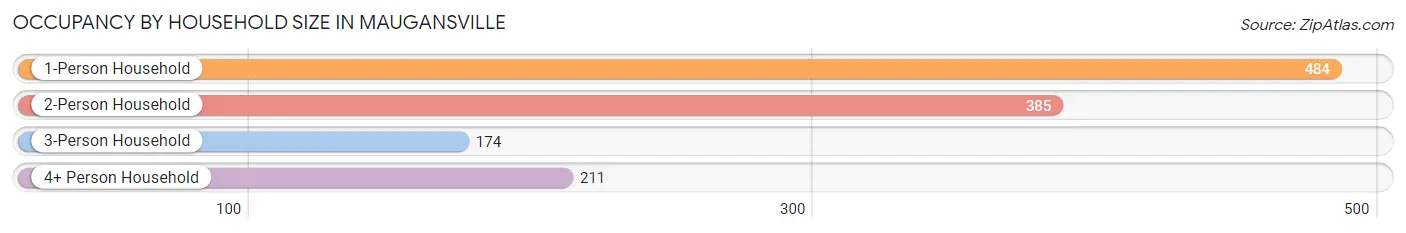
| Household Size | # Housing Units | % Housing Units |
| 1-Person Household | 484 | 38.6% |
| 2-Person Household | 385 | 30.7% |
| 3-Person Household | 174 | 13.9% |
| 4+ Person Household | 211 | 16.8% |
| Total Housing Units | 1,254 | 100.0% |
Occupancy by Ownership by Household Size in Maugansville
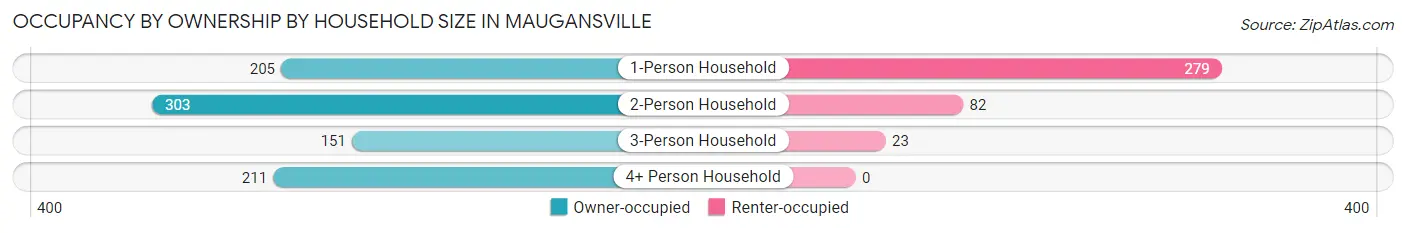
| Household Size | Owner-occupied | Renter-occupied |
| 1-Person Household | 205 (42.4%) | 279 (57.6%) |
| 2-Person Household | 303 (78.7%) | 82 (21.3%) |
| 3-Person Household | 151 (86.8%) | 23 (13.2%) |
| 4+ Person Household | 211 (100.0%) | 0 (0.0%) |
| Total Housing Units | 870 (69.4%) | 384 (30.6%) |
Occupancy by Educational Attainment in Maugansville
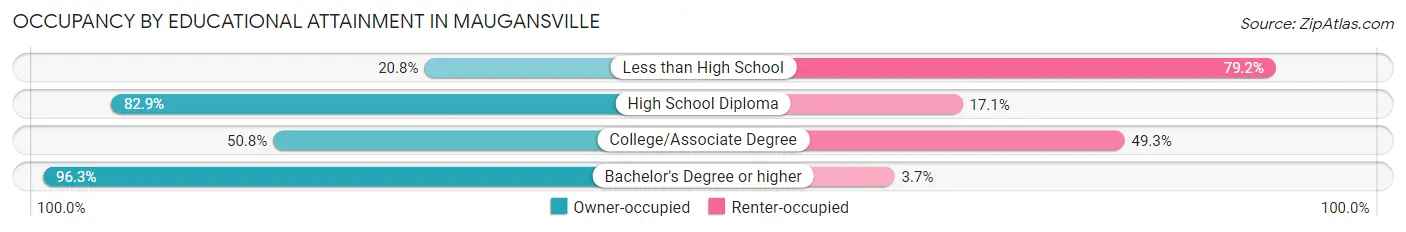
| Household Size | Owner-occupied | Renter-occupied |
| Less than High School | 38 (20.8%) | 145 (79.2%) |
| High School Diploma | 295 (82.9%) | 61 (17.1%) |
| College/Associate Degree | 169 (50.7%) | 164 (49.2%) |
| Bachelor's Degree or higher | 368 (96.3%) | 14 (3.7%) |
Occupancy by Age of Householder in Maugansville
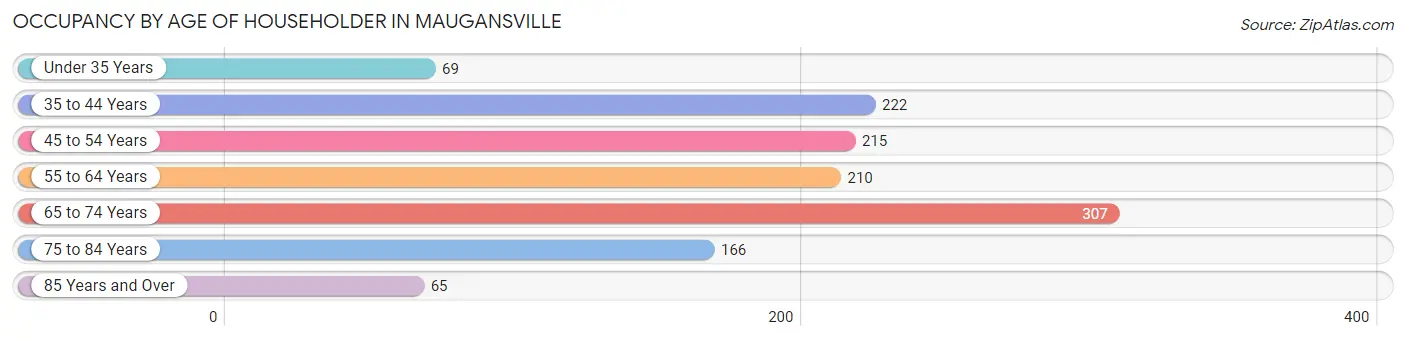
| Age Bracket | # Households | % Households |
| Under 35 Years | 69 | 5.5% |
| 35 to 44 Years | 222 | 17.7% |
| 45 to 54 Years | 215 | 17.2% |
| 55 to 64 Years | 210 | 16.8% |
| 65 to 74 Years | 307 | 24.5% |
| 75 to 84 Years | 166 | 13.2% |
| 85 Years and Over | 65 | 5.2% |
| Total | 1,254 | 100.0% |
Housing Finances in Maugansville
Median Income by Occupancy in Maugansville
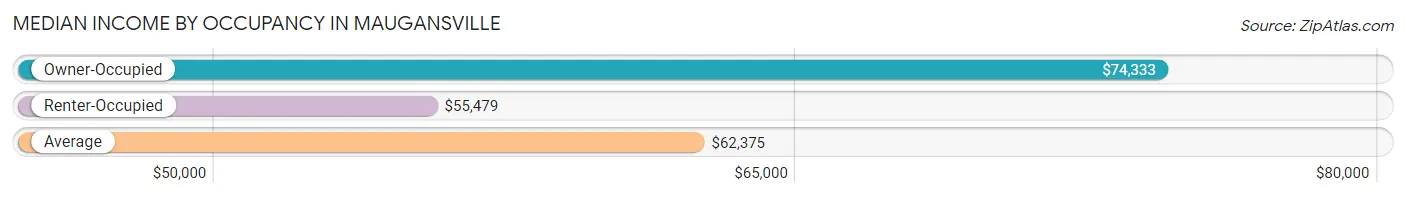
| Occupancy Type | # Households | Median Income |
| Owner-Occupied | 870 (69.4%) | $74,333 |
| Renter-Occupied | 384 (30.6%) | $55,479 |
| Average | 1,254 (100.0%) | $62,375 |
Occupancy by Householder Income Bracket in Maugansville
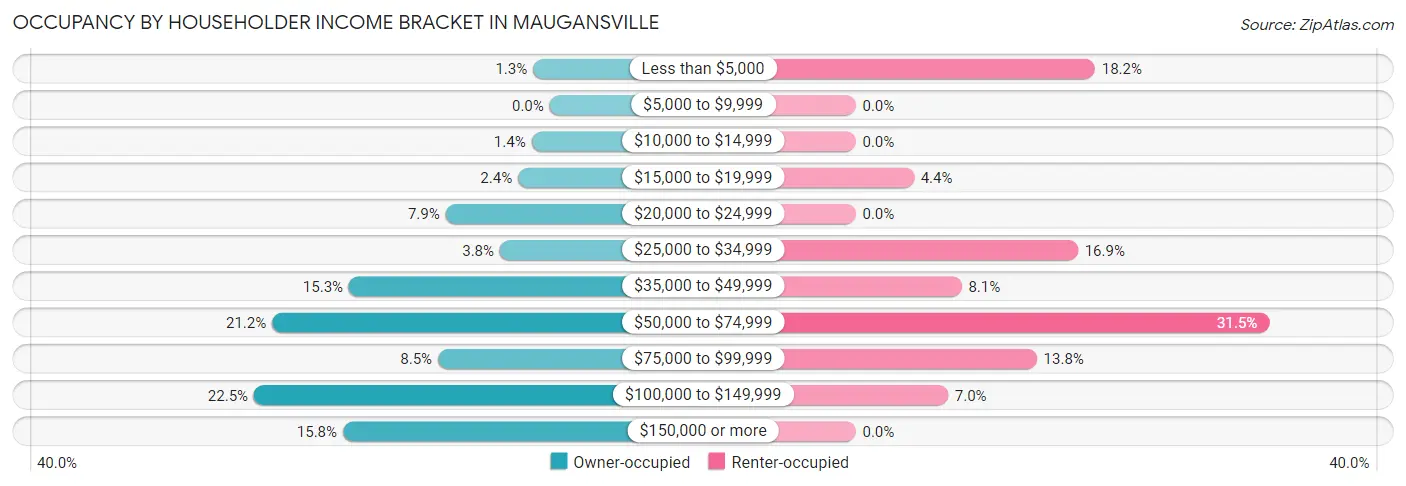
| Income Bracket | Owner-occupied | Renter-occupied |
| Less than $5,000 | 11 (1.3%) | 70 (18.2%) |
| $5,000 to $9,999 | 0 (0.0%) | 0 (0.0%) |
| $10,000 to $14,999 | 12 (1.4%) | 0 (0.0%) |
| $15,000 to $19,999 | 21 (2.4%) | 17 (4.4%) |
| $20,000 to $24,999 | 69 (7.9%) | 0 (0.0%) |
| $25,000 to $34,999 | 33 (3.8%) | 65 (16.9%) |
| $35,000 to $49,999 | 133 (15.3%) | 31 (8.1%) |
| $50,000 to $74,999 | 184 (21.1%) | 121 (31.5%) |
| $75,000 to $99,999 | 74 (8.5%) | 53 (13.8%) |
| $100,000 to $149,999 | 196 (22.5%) | 27 (7.0%) |
| $150,000 or more | 137 (15.8%) | 0 (0.0%) |
| Total | 870 (100.0%) | 384 (100.0%) |
Monthly Housing Cost Tiers in Maugansville
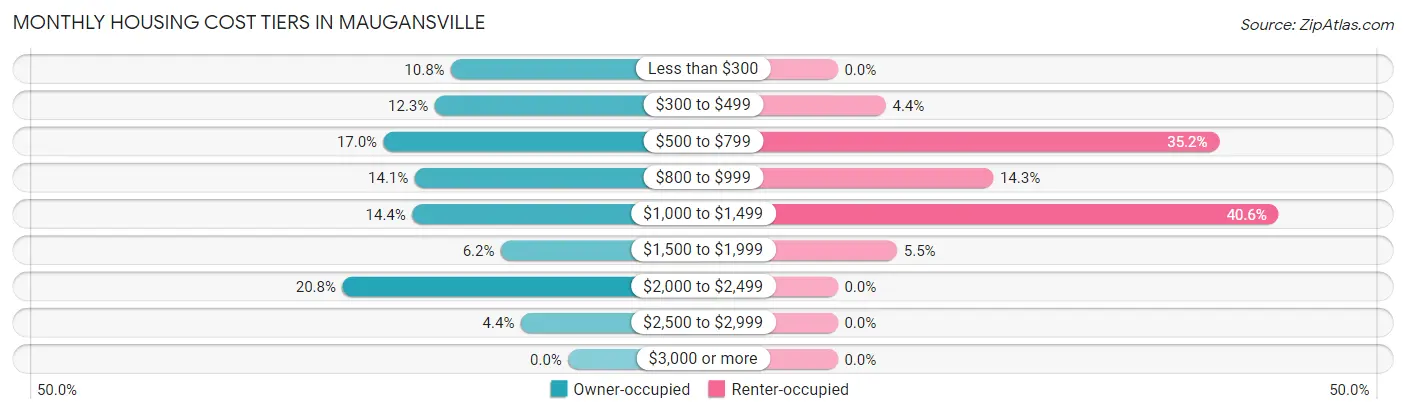
| Monthly Cost | Owner-occupied | Renter-occupied |
| Less than $300 | 94 (10.8%) | 0 (0.0%) |
| $300 to $499 | 107 (12.3%) | 17 (4.4%) |
| $500 to $799 | 148 (17.0%) | 135 (35.2%) |
| $800 to $999 | 123 (14.1%) | 55 (14.3%) |
| $1,000 to $1,499 | 125 (14.4%) | 156 (40.6%) |
| $1,500 to $1,999 | 54 (6.2%) | 21 (5.5%) |
| $2,000 to $2,499 | 181 (20.8%) | 0 (0.0%) |
| $2,500 to $2,999 | 38 (4.4%) | 0 (0.0%) |
| $3,000 or more | 0 (0.0%) | 0 (0.0%) |
| Total | 870 (100.0%) | 384 (100.0%) |
Physical Housing Characteristics in Maugansville
Housing Structures in Maugansville
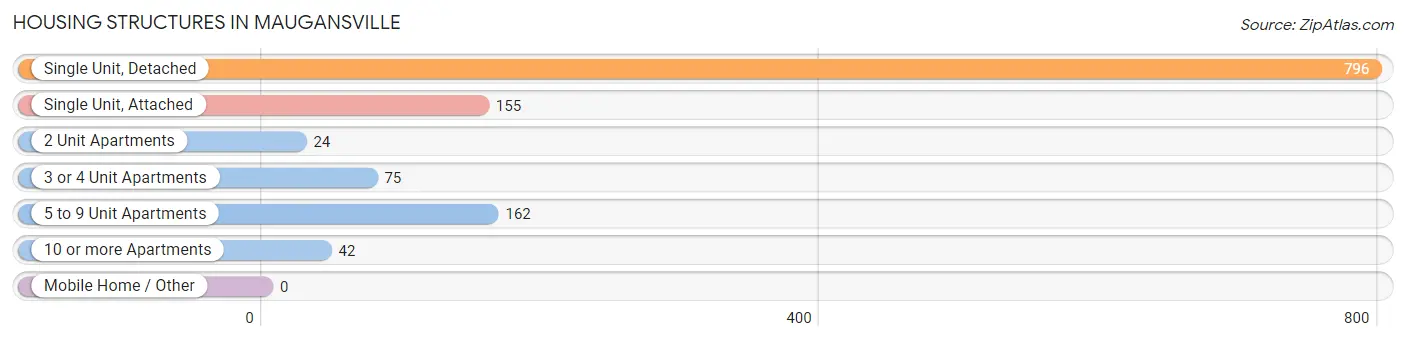
| Structure Type | # Housing Units | % Housing Units |
| Single Unit, Detached | 796 | 63.5% |
| Single Unit, Attached | 155 | 12.4% |
| 2 Unit Apartments | 24 | 1.9% |
| 3 or 4 Unit Apartments | 75 | 6.0% |
| 5 to 9 Unit Apartments | 162 | 12.9% |
| 10 or more Apartments | 42 | 3.4% |
| Mobile Home / Other | 0 | 0.0% |
| Total | 1,254 | 100.0% |
Housing Structures by Occupancy in Maugansville
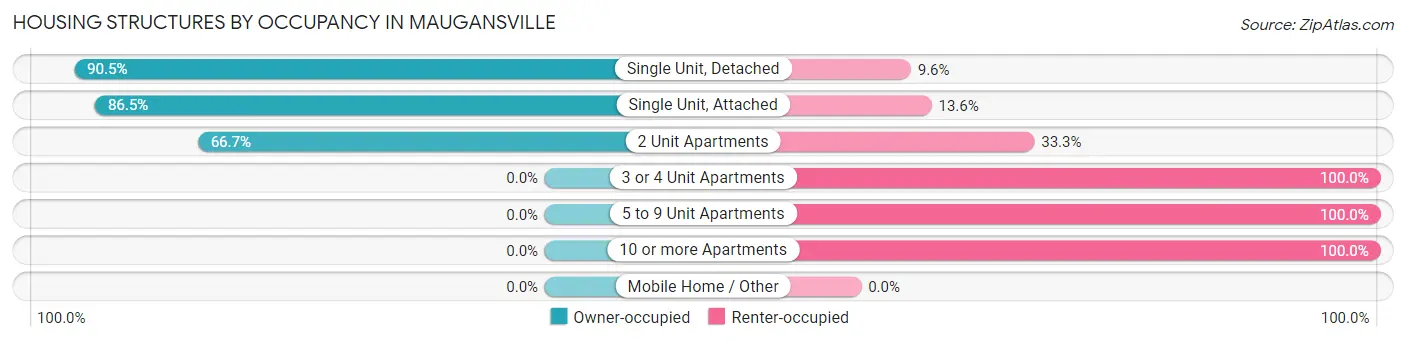
| Structure Type | Owner-occupied | Renter-occupied |
| Single Unit, Detached | 720 (90.4%) | 76 (9.6%) |
| Single Unit, Attached | 134 (86.5%) | 21 (13.6%) |
| 2 Unit Apartments | 16 (66.7%) | 8 (33.3%) |
| 3 or 4 Unit Apartments | 0 (0.0%) | 75 (100.0%) |
| 5 to 9 Unit Apartments | 0 (0.0%) | 162 (100.0%) |
| 10 or more Apartments | 0 (0.0%) | 42 (100.0%) |
| Mobile Home / Other | 0 (0.0%) | 0 (0.0%) |
| Total | 870 (69.4%) | 384 (30.6%) |
Housing Structures by Number of Rooms in Maugansville
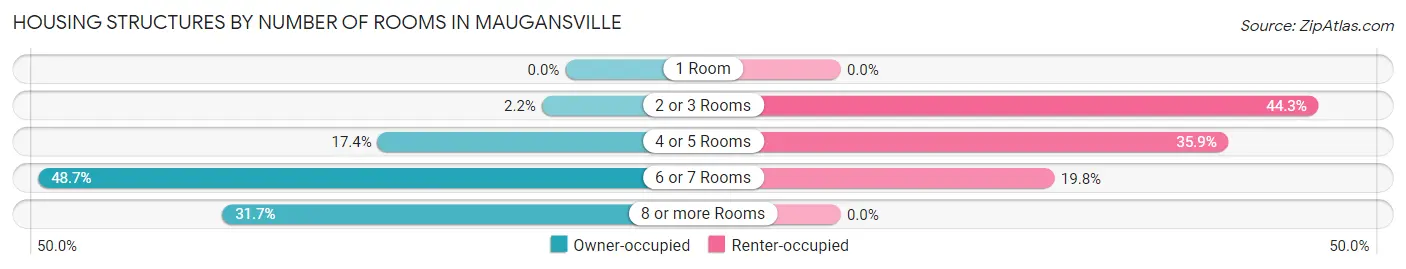
| Number of Rooms | Owner-occupied | Renter-occupied |
| 1 Room | 0 (0.0%) | 0 (0.0%) |
| 2 or 3 Rooms | 19 (2.2%) | 170 (44.3%) |
| 4 or 5 Rooms | 151 (17.4%) | 138 (35.9%) |
| 6 or 7 Rooms | 424 (48.7%) | 76 (19.8%) |
| 8 or more Rooms | 276 (31.7%) | 0 (0.0%) |
| Total | 870 (100.0%) | 384 (100.0%) |
Housing Structure by Heating Type in Maugansville
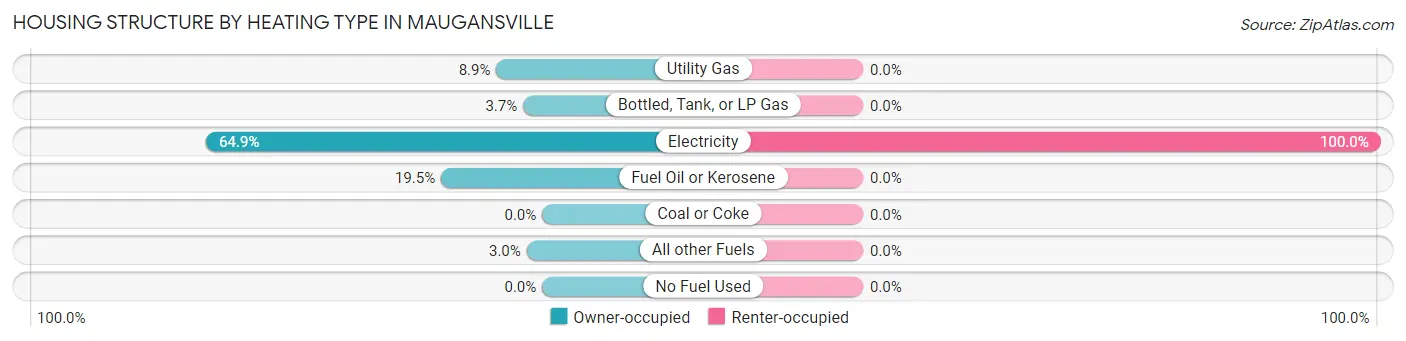
| Heating Type | Owner-occupied | Renter-occupied |
| Utility Gas | 77 (8.8%) | 0 (0.0%) |
| Bottled, Tank, or LP Gas | 32 (3.7%) | 0 (0.0%) |
| Electricity | 565 (64.9%) | 384 (100.0%) |
| Fuel Oil or Kerosene | 170 (19.5%) | 0 (0.0%) |
| Coal or Coke | 0 (0.0%) | 0 (0.0%) |
| All other Fuels | 26 (3.0%) | 0 (0.0%) |
| No Fuel Used | 0 (0.0%) | 0 (0.0%) |
| Total | 870 (100.0%) | 384 (100.0%) |
Household Vehicle Usage in Maugansville
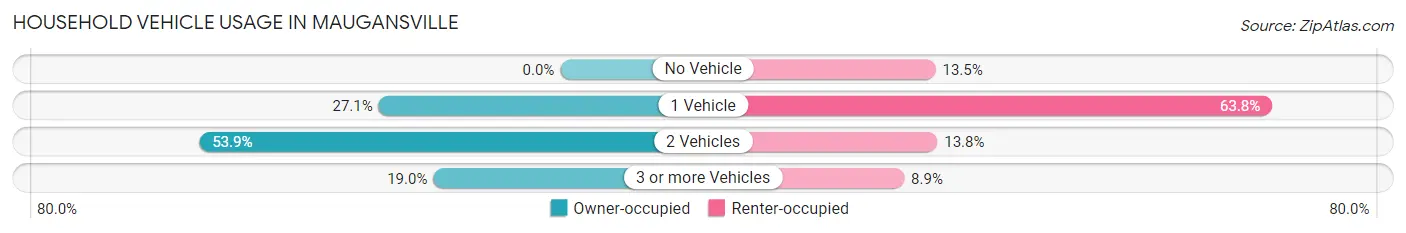
| Vehicles per Household | Owner-occupied | Renter-occupied |
| No Vehicle | 0 (0.0%) | 52 (13.5%) |
| 1 Vehicle | 236 (27.1%) | 245 (63.8%) |
| 2 Vehicles | 469 (53.9%) | 53 (13.8%) |
| 3 or more Vehicles | 165 (19.0%) | 34 (8.8%) |
| Total | 870 (100.0%) | 384 (100.0%) |
Real Estate & Mortgages in Maugansville
Real Estate and Mortgage Overview in Maugansville
| Characteristic | Without Mortgage | With Mortgage |
| Housing Units | 354 | 516 |
| Median Property Value | $224,600 | $306,800 |
| Median Household Income | $60,625 | $85 |
| Monthly Housing Costs | $391 | $0 |
| Real Estate Taxes | $2,256 | $0 |
Property Value by Mortgage Status in Maugansville
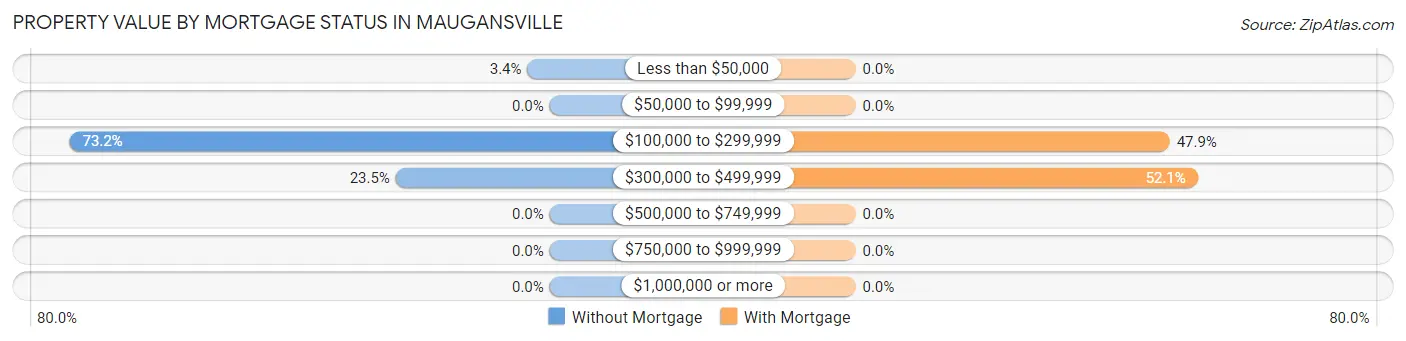
| Property Value | Without Mortgage | With Mortgage |
| Less than $50,000 | 12 (3.4%) | 0 (0.0%) |
| $50,000 to $99,999 | 0 (0.0%) | 0 (0.0%) |
| $100,000 to $299,999 | 259 (73.2%) | 247 (47.9%) |
| $300,000 to $499,999 | 83 (23.4%) | 269 (52.1%) |
| $500,000 to $749,999 | 0 (0.0%) | 0 (0.0%) |
| $750,000 to $999,999 | 0 (0.0%) | 0 (0.0%) |
| $1,000,000 or more | 0 (0.0%) | 0 (0.0%) |
| Total | 354 (100.0%) | 516 (100.0%) |
Household Income by Mortgage Status in Maugansville
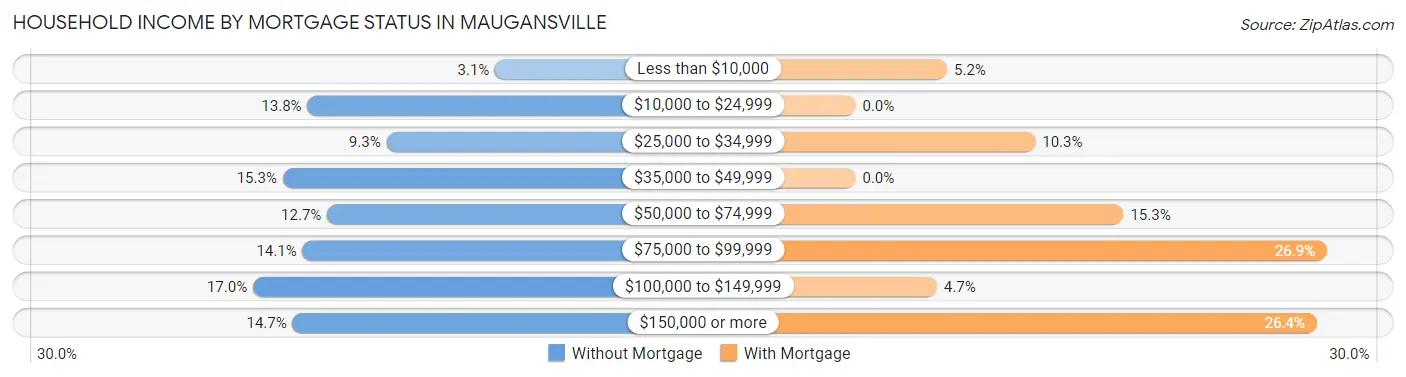
| Household Income | Without Mortgage | With Mortgage |
| Less than $10,000 | 11 (3.1%) | 27 (5.2%) |
| $10,000 to $24,999 | 49 (13.8%) | 0 (0.0%) |
| $25,000 to $34,999 | 33 (9.3%) | 53 (10.3%) |
| $35,000 to $49,999 | 54 (15.2%) | 0 (0.0%) |
| $50,000 to $74,999 | 45 (12.7%) | 79 (15.3%) |
| $75,000 to $99,999 | 50 (14.1%) | 139 (26.9%) |
| $100,000 to $149,999 | 60 (17.0%) | 24 (4.6%) |
| $150,000 or more | 52 (14.7%) | 136 (26.4%) |
| Total | 354 (100.0%) | 516 (100.0%) |
Property Value to Household Income Ratio in Maugansville
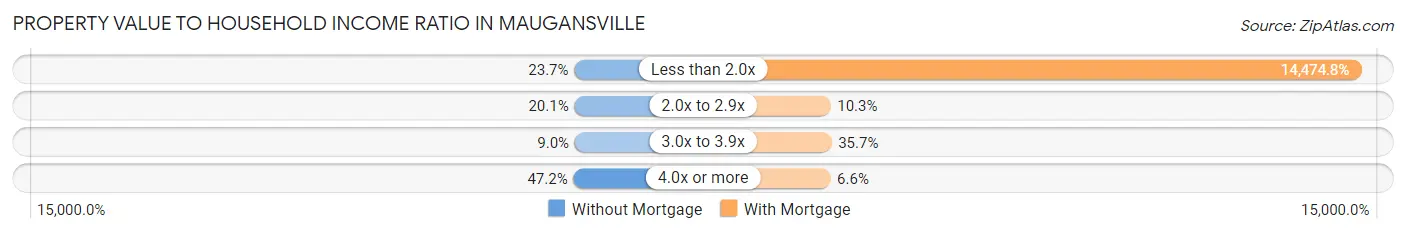
| Value-to-Income Ratio | Without Mortgage | With Mortgage |
| Less than 2.0x | 84 (23.7%) | 74,690 (14,474.8%) |
| 2.0x to 2.9x | 71 (20.1%) | 53 (10.3%) |
| 3.0x to 3.9x | 32 (9.0%) | 184 (35.7%) |
| 4.0x or more | 167 (47.2%) | 34 (6.6%) |
| Total | 354 (100.0%) | 516 (100.0%) |
Real Estate Taxes by Mortgage Status in Maugansville
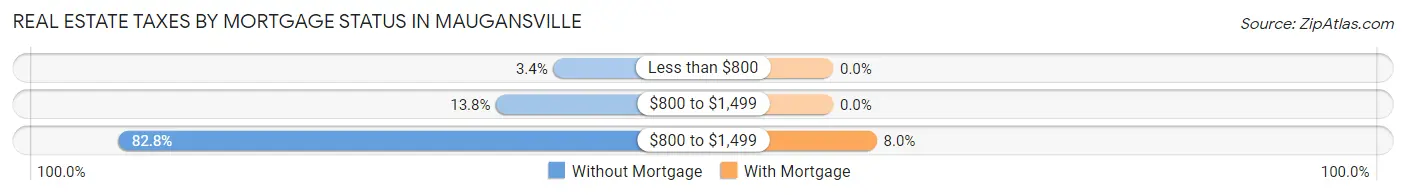
| Property Taxes | Without Mortgage | With Mortgage |
| Less than $800 | 12 (3.4%) | 0 (0.0%) |
| $800 to $1,499 | 49 (13.8%) | 0 (0.0%) |
| $800 to $1,499 | 293 (82.8%) | 41 (8.0%) |
| Total | 354 (100.0%) | 516 (100.0%) |
Health & Disability in Maugansville
Health Insurance Coverage by Age in Maugansville
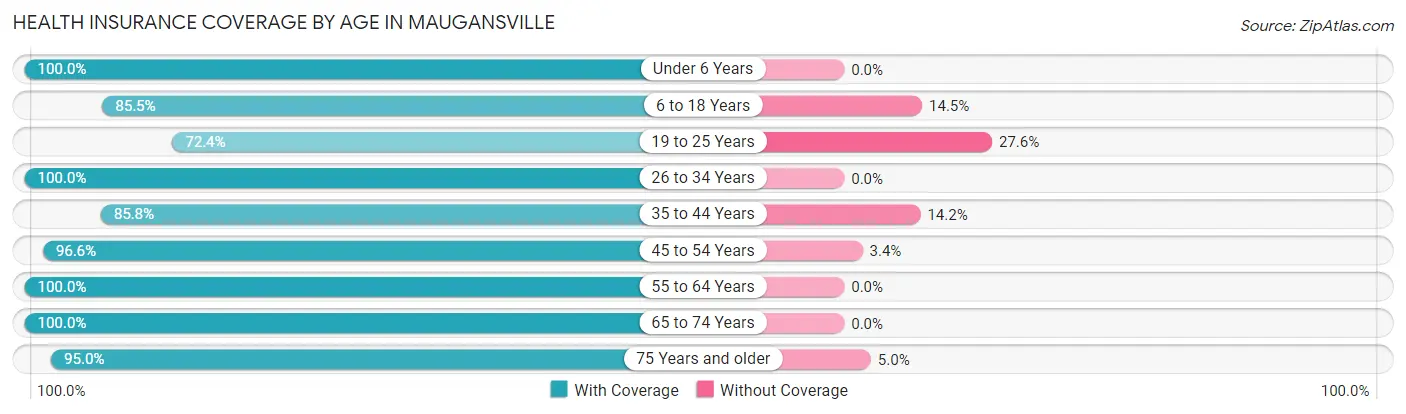
| Age Bracket | With Coverage | Without Coverage |
| Under 6 Years | 174 (100.0%) | 0 (0.0%) |
| 6 to 18 Years | 389 (85.5%) | 66 (14.5%) |
| 19 to 25 Years | 92 (72.4%) | 35 (27.6%) |
| 26 to 34 Years | 114 (100.0%) | 0 (0.0%) |
| 35 to 44 Years | 326 (85.8%) | 54 (14.2%) |
| 45 to 54 Years | 340 (96.6%) | 12 (3.4%) |
| 55 to 64 Years | 358 (100.0%) | 0 (0.0%) |
| 65 to 74 Years | 463 (100.0%) | 0 (0.0%) |
| 75 Years and older | 326 (95.0%) | 17 (5.0%) |
| Total | 2,582 (93.3%) | 184 (6.7%) |
Health Insurance Coverage by Citizenship Status in Maugansville
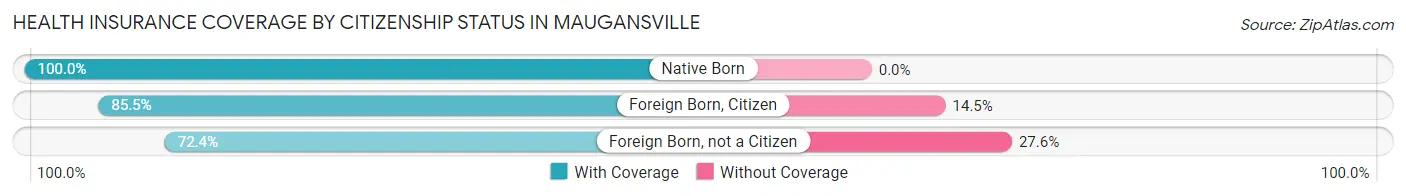
| Citizenship Status | With Coverage | Without Coverage |
| Native Born | 174 (100.0%) | 0 (0.0%) |
| Foreign Born, Citizen | 389 (85.5%) | 66 (14.5%) |
| Foreign Born, not a Citizen | 92 (72.4%) | 35 (27.6%) |
Health Insurance Coverage by Household Income in Maugansville
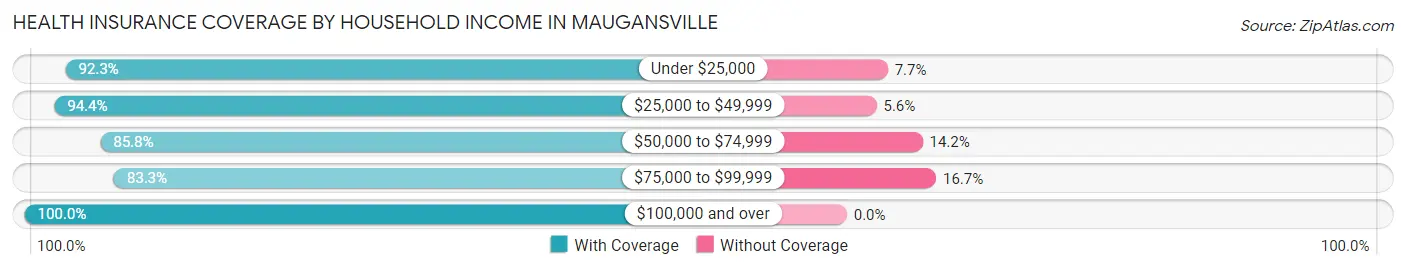
| Household Income | With Coverage | Without Coverage |
| Under $25,000 | 205 (92.3%) | 17 (7.7%) |
| $25,000 to $49,999 | 339 (94.4%) | 20 (5.6%) |
| $50,000 to $74,999 | 635 (85.8%) | 105 (14.2%) |
| $75,000 to $99,999 | 209 (83.3%) | 42 (16.7%) |
| $100,000 and over | 1,154 (100.0%) | 0 (0.0%) |
Public vs Private Health Insurance Coverage by Age in Maugansville
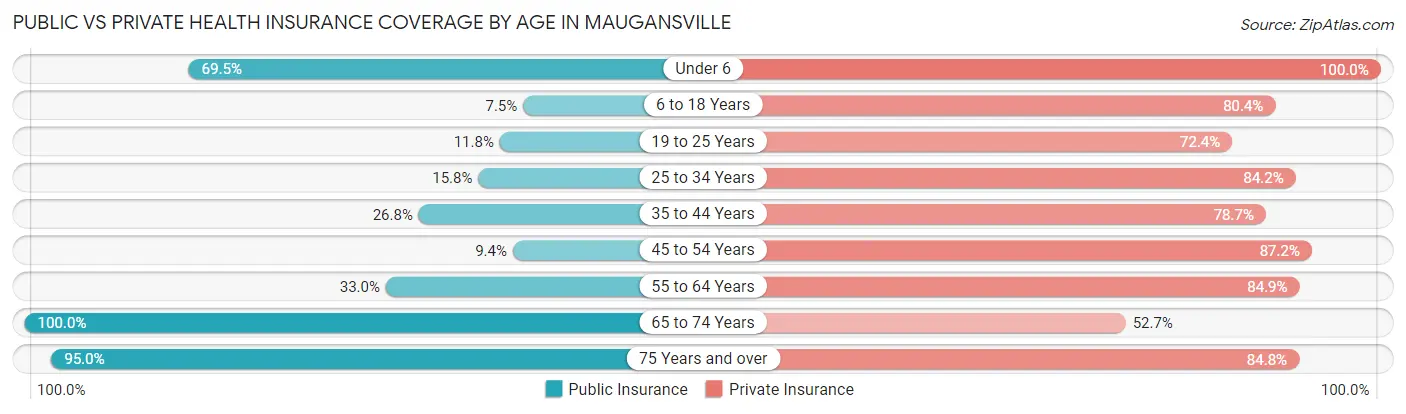
| Age Bracket | Public Insurance | Private Insurance |
| Under 6 | 121 (69.5%) | 174 (100.0%) |
| 6 to 18 Years | 34 (7.5%) | 366 (80.4%) |
| 19 to 25 Years | 15 (11.8%) | 92 (72.4%) |
| 25 to 34 Years | 18 (15.8%) | 96 (84.2%) |
| 35 to 44 Years | 102 (26.8%) | 299 (78.7%) |
| 45 to 54 Years | 33 (9.4%) | 307 (87.2%) |
| 55 to 64 Years | 118 (33.0%) | 304 (84.9%) |
| 65 to 74 Years | 463 (100.0%) | 244 (52.7%) |
| 75 Years and over | 326 (95.0%) | 291 (84.8%) |
| Total | 1,230 (44.5%) | 2,173 (78.6%) |
Disability Status by Sex by Age in Maugansville
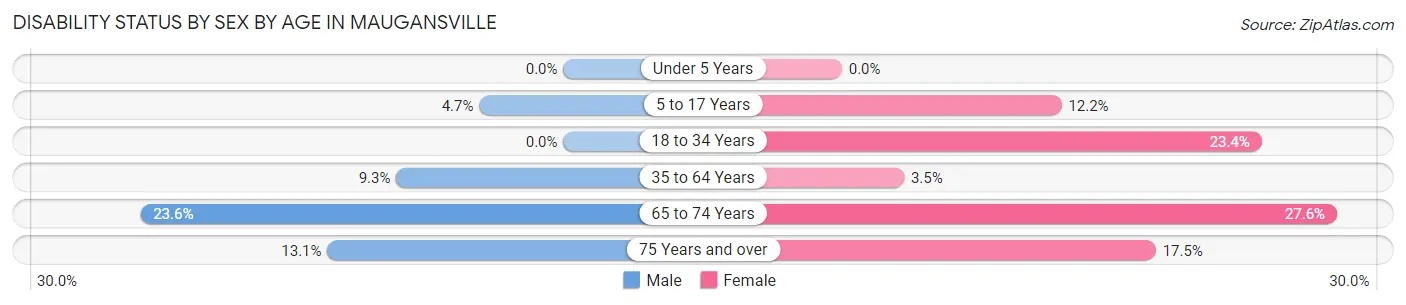
| Age Bracket | Male | Female |
| Under 5 Years | 0 (0.0%) | 0 (0.0%) |
| 5 to 17 Years | 13 (4.7%) | 28 (12.2%) |
| 18 to 34 Years | 0 (0.0%) | 18 (23.4%) |
| 35 to 64 Years | 61 (9.3%) | 15 (3.5%) |
| 65 to 74 Years | 45 (23.6%) | 75 (27.6%) |
| 75 Years and over | 18 (13.1%) | 36 (17.5%) |
Disability Class by Sex by Age in Maugansville
Disability Class: Hearing Difficulty
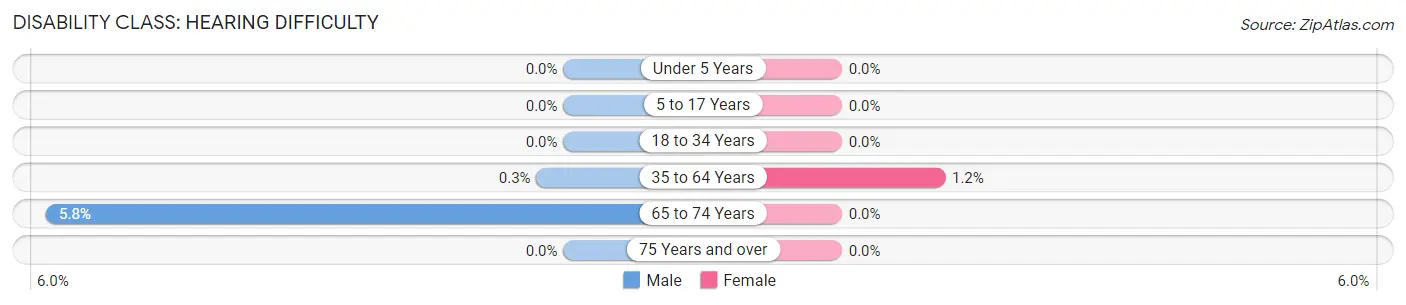
| Age Bracket | Male | Female |
| Under 5 Years | 0 (0.0%) | 0 (0.0%) |
| 5 to 17 Years | 0 (0.0%) | 0 (0.0%) |
| 18 to 34 Years | 0 (0.0%) | 0 (0.0%) |
| 35 to 64 Years | 2 (0.3%) | 5 (1.1%) |
| 65 to 74 Years | 11 (5.8%) | 0 (0.0%) |
| 75 Years and over | 0 (0.0%) | 0 (0.0%) |
Disability Class: Vision Difficulty
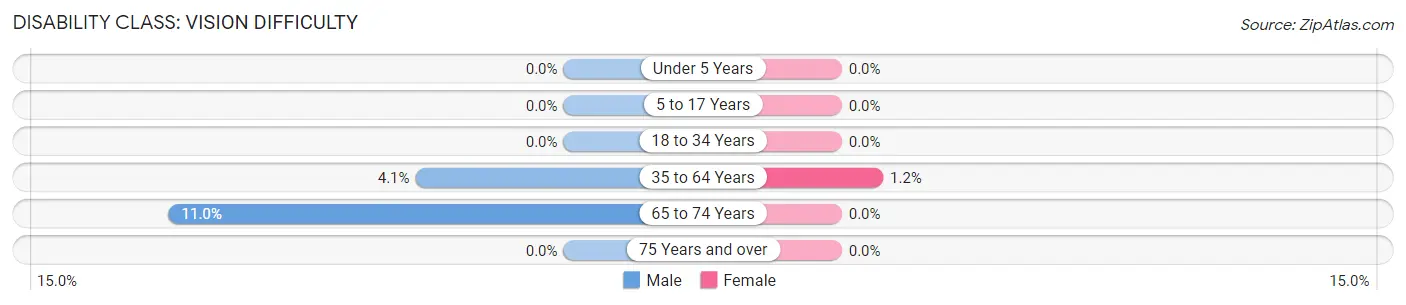
| Age Bracket | Male | Female |
| Under 5 Years | 0 (0.0%) | 0 (0.0%) |
| 5 to 17 Years | 0 (0.0%) | 0 (0.0%) |
| 18 to 34 Years | 0 (0.0%) | 0 (0.0%) |
| 35 to 64 Years | 27 (4.1%) | 5 (1.1%) |
| 65 to 74 Years | 21 (11.0%) | 0 (0.0%) |
| 75 Years and over | 0 (0.0%) | 0 (0.0%) |
Disability Class: Cognitive Difficulty
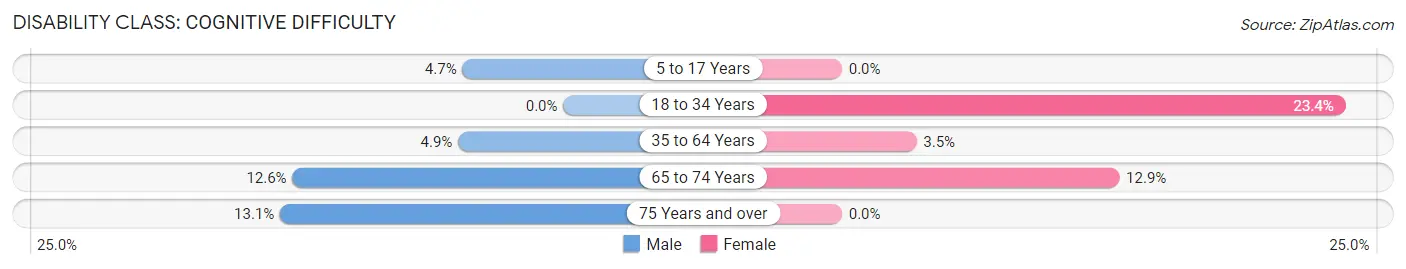
| Age Bracket | Male | Female |
| 5 to 17 Years | 13 (4.7%) | 0 (0.0%) |
| 18 to 34 Years | 0 (0.0%) | 18 (23.4%) |
| 35 to 64 Years | 32 (4.9%) | 15 (3.5%) |
| 65 to 74 Years | 24 (12.6%) | 35 (12.9%) |
| 75 Years and over | 18 (13.1%) | 0 (0.0%) |
Disability Class: Ambulatory Difficulty
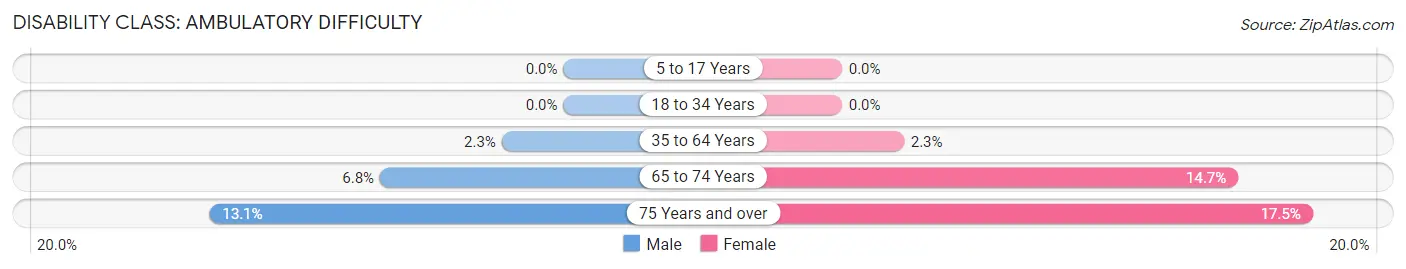
| Age Bracket | Male | Female |
| 5 to 17 Years | 0 (0.0%) | 0 (0.0%) |
| 18 to 34 Years | 0 (0.0%) | 0 (0.0%) |
| 35 to 64 Years | 15 (2.3%) | 10 (2.3%) |
| 65 to 74 Years | 13 (6.8%) | 40 (14.7%) |
| 75 Years and over | 18 (13.1%) | 36 (17.5%) |
Disability Class: Self-Care Difficulty
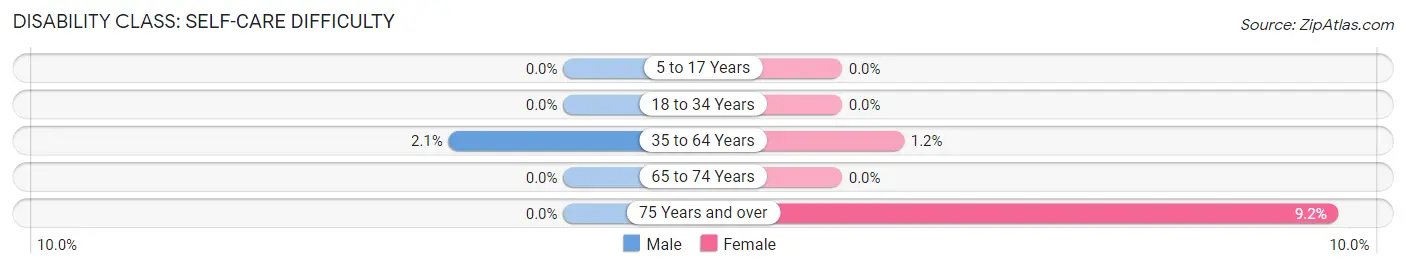
| Age Bracket | Male | Female |
| 5 to 17 Years | 0 (0.0%) | 0 (0.0%) |
| 18 to 34 Years | 0 (0.0%) | 0 (0.0%) |
| 35 to 64 Years | 14 (2.1%) | 5 (1.1%) |
| 65 to 74 Years | 0 (0.0%) | 0 (0.0%) |
| 75 Years and over | 0 (0.0%) | 19 (9.2%) |
Technology Access in Maugansville
Computing Device Access in Maugansville
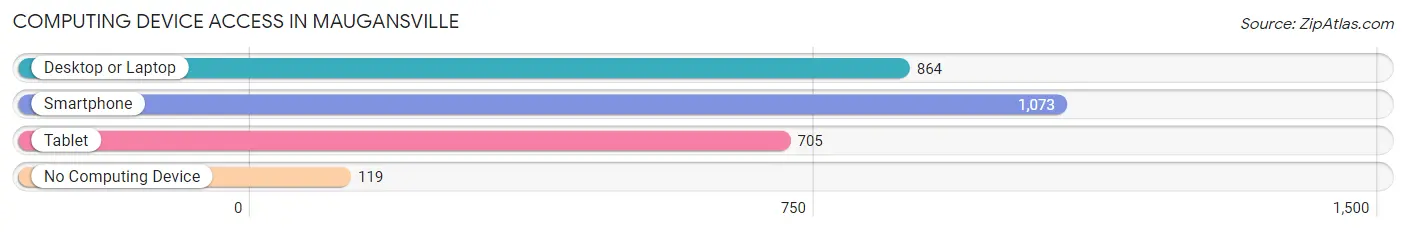
| Device Type | # Households | % Households |
| Desktop or Laptop | 864 | 68.9% |
| Smartphone | 1,073 | 85.6% |
| Tablet | 705 | 56.2% |
| No Computing Device | 119 | 9.5% |
| Total | 1,254 | 100.0% |
Internet Access in Maugansville
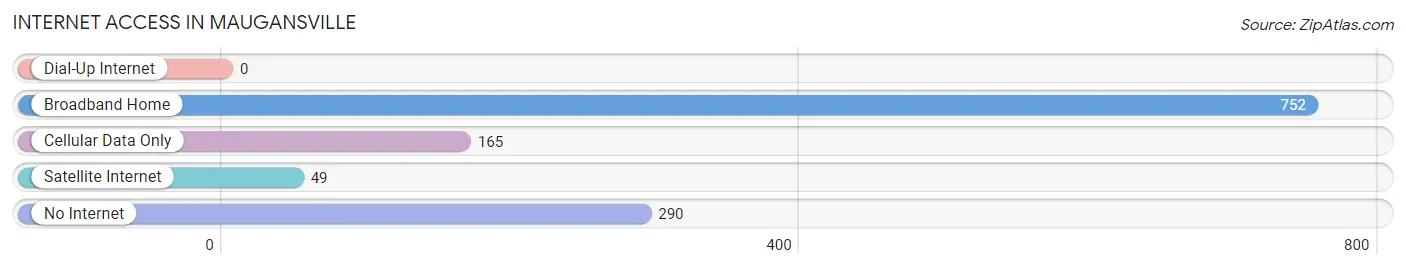
| Internet Type | # Households | % Households |
| Dial-Up Internet | 0 | 0.0% |
| Broadband Home | 752 | 60.0% |
| Cellular Data Only | 165 | 13.2% |
| Satellite Internet | 49 | 3.9% |
| No Internet | 290 | 23.1% |
| Total | 1,254 | 100.0% |
Maugansville Summary
Maugansville is a small unincorporated community located in Washington County, Maryland. It is situated in the northern part of the county, just south of Hagerstown. The population of Maugansville was 1,845 at the 2010 census.
History
Maugansville was founded in 1820 by John Maugans, a Revolutionary War veteran. He purchased the land from the heirs of Lord Baltimore and named it after himself. The town was originally known as Maugansville Crossroads, as it was located at the intersection of two major roads.
In 1832, the first post office was established in Maugansville. The town was officially incorporated in 1867.
Geography
Maugansville is located at 39°37′N 77°45′W (39.619, -77.749). It is situated in the northern part of Washington County, just south of Hagerstown. The town is bordered by the towns of Smithsburg to the north, Williamsport to the east, and Funkstown to the south.
The terrain of Maugansville is mostly flat, with some rolling hills. The town is located in the Appalachian Mountains, and is surrounded by forests and farmland.
Economy
Maugansville is primarily a residential community, with most of its residents commuting to nearby towns and cities for work. The town does have some small businesses, including a few restaurants, a grocery store, and a few shops.
The town is also home to several industrial and manufacturing businesses, including a plastics factory, a printing company, and a metal fabrication shop.
Demographics
As of the 2010 census, the population of Maugansville was 1,845. The racial makeup of the town was 94.3% White, 2.2% African American, 0.3% Native American, 0.7% Asian, 0.1% Pacific Islander, 0.7% from other races, and 1.7% from two or more races. Hispanic or Latino of any race were 2.2% of the population.
The median household income in Maugansville was $50,938, and the median family income was $58,906. The per capita income was $22,945. About 8.3% of families and 10.2% of the population were below the poverty line, including 14.2% of those under age 18 and 5.2% of those age 65 or over.
Conclusion
Maugansville is a small unincorporated community located in Washington County, Maryland. It was founded in 1820 by John Maugans, a Revolutionary War veteran, and was officially incorporated in 1867. The town is primarily a residential community, with most of its residents commuting to nearby towns and cities for work. The population of Maugansville was 1,845 at the 2010 census, and the median household income was $50,938. Maugansville is a peaceful and quiet community, with a rich history and a bright future.
Common Questions
What is Per Capita Income in Maugansville?
Per Capita income in Maugansville is $39,916.
What is the Median Family Income in Maugansville?
Median Family Income in Maugansville is $89,079.
What is the Median Household income in Maugansville?
Median Household Income in Maugansville is $62,375.
What is Income or Wage Gap in Maugansville?
Income or Wage Gap in Maugansville is 70.7%.
Women in Maugansville earn 29.3 cents for every dollar earned by a man.
What is Inequality or Gini Index in Maugansville?
Inequality or Gini Index in Maugansville is 0.45.
What is the Total Population of Maugansville?
Total Population of Maugansville is 2,770.
What is the Total Male Population of Maugansville?
Total Male Population of Maugansville is 1,461.
What is the Total Female Population of Maugansville?
Total Female Population of Maugansville is 1,309.
What is the Ratio of Males per 100 Females in Maugansville?
There are 111.61 Males per 100 Females in Maugansville.
What is the Ratio of Females per 100 Males in Maugansville?
There are 89.60 Females per 100 Males in Maugansville.
What is the Median Population Age in Maugansville?
Median Population Age in Maugansville is 47.8 Years.
What is the Average Family Size in Maugansville
Average Family Size in Maugansville is 2.9 People.
What is the Average Household Size in Maugansville
Average Household Size in Maugansville is 2.2 People.
How Large is the Labor Force in Maugansville?
There are 1,280 People in the Labor Forcein in Maugansville.
What is the Percentage of People in the Labor Force in Maugansville?
56.0% of People are in the Labor Force in Maugansville.
What is the Unemployment Rate in Maugansville?
Unemployment Rate in Maugansville is 7.1%.