Zip Codes with the Highest Percentage of Self-Employed / Not Incorporated in Massachusetts
RELATED REPORTS & OPTIONS
Self-Employed / Not Incorporated
Massachusetts
Compare Zip Codes
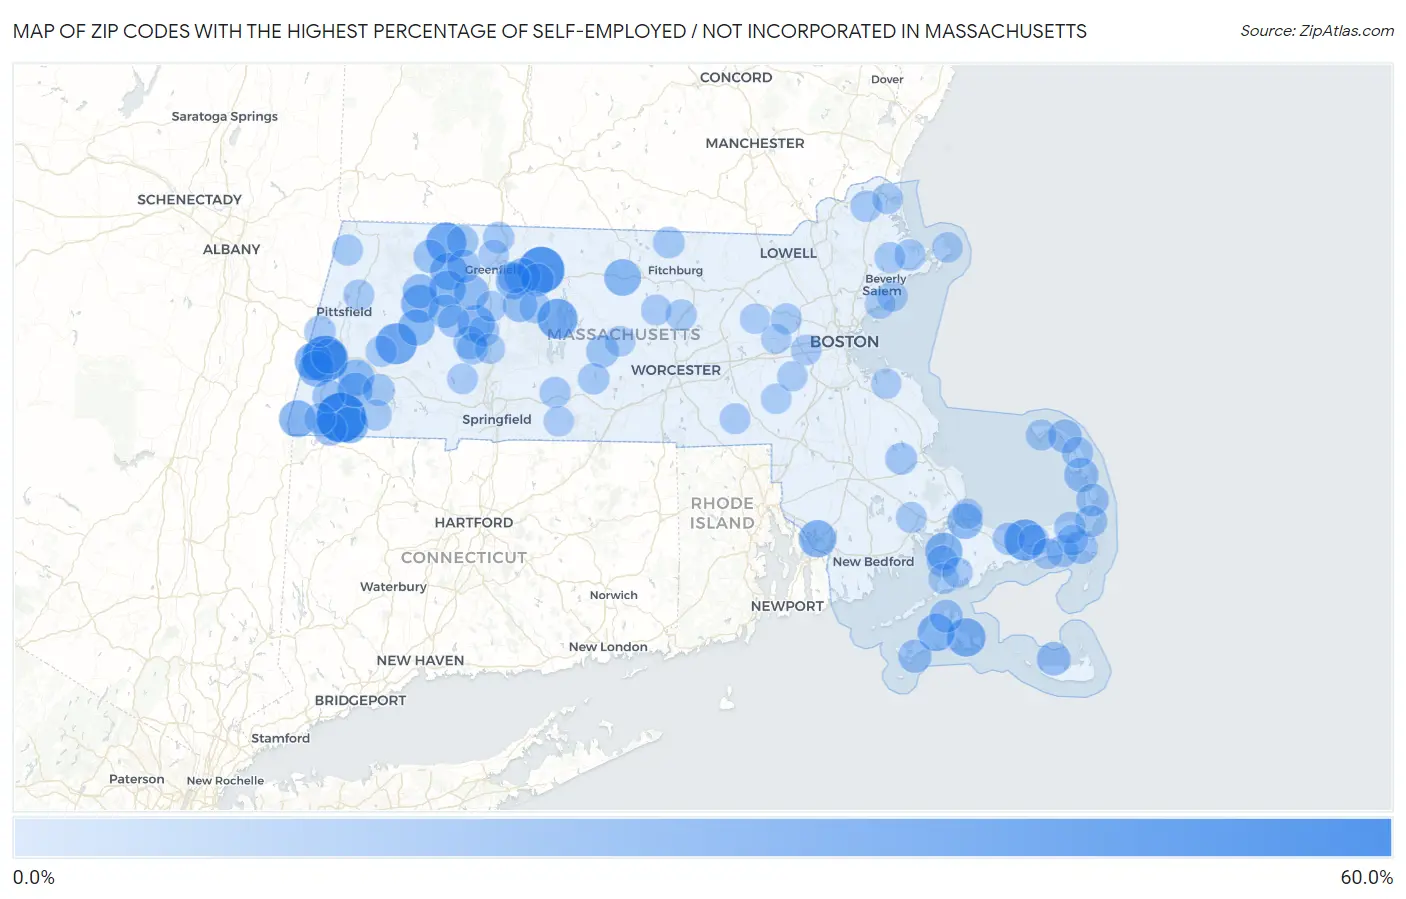
Map of Zip Codes with the Highest Percentage of Self-Employed / Not Incorporated in Massachusetts
0.0%
60.0%
Zip Codes with the Highest Percentage of Self-Employed / Not Incorporated in Massachusetts
| Zip Code | % Self-Employed / Not Incorporated | vs State | vs National | |
| 1. | 01244 | 50.8% | 5.5%(+45.3)#1 | 5.8%(+45.0)#211 |
| 2. | 01380 | 43.8% | 5.5%(+38.3)#2 | 5.8%(+37.9)#321 |
| 3. | 01229 | 42.9% | 5.5%(+37.4)#3 | 5.8%(+37.0)#339 |
| 4. | 02637 | 32.8% | 5.5%(+27.4)#4 | 5.8%(+27.0)#637 |
| 5. | 01243 | 32.3% | 5.5%(+26.8)#5 | 5.8%(+26.5)#660 |
| 6. | 01346 | 30.5% | 5.5%(+25.1)#6 | 5.8%(+24.7)#744 |
| 7. | 01355 | 30.2% | 5.5%(+24.8)#7 | 5.8%(+24.4)#758 |
| 8. | 02539 | 27.0% | 5.5%(+21.5)#8 | 5.8%(+21.2)#956 |
| 9. | 01266 | 25.2% | 5.5%(+19.7)#9 | 5.8%(+19.3)#1,133 |
| 10. | 01026 | 25.0% | 5.5%(+19.6)#10 | 5.8%(+19.2)#1,138 |
| 11. | 02575 | 24.4% | 5.5%(+18.9)#11 | 5.8%(+18.6)#1,219 |
| 12. | 02725 | 24.1% | 5.5%(+18.6)#12 | 5.8%(+18.3)#1,243 |
| 13. | 02534 | 24.0% | 5.5%(+18.5)#13 | 5.8%(+18.2)#1,252 |
| 14. | 01338 | 23.8% | 5.5%(+18.3)#14 | 5.8%(+18.0)#1,275 |
| 15. | 01039 | 23.7% | 5.5%(+18.3)#15 | 5.8%(+17.9)#1,282 |
| 16. | 01258 | 23.2% | 5.5%(+17.8)#16 | 5.8%(+17.4)#1,329 |
| 17. | 01438 | 22.6% | 5.5%(+17.1)#17 | 5.8%(+16.8)#1,404 |
| 18. | 01259 | 22.5% | 5.5%(+17.1)#18 | 5.8%(+16.7)#1,413 |
| 19. | 01330 | 22.3% | 5.5%(+16.9)#19 | 5.8%(+16.5)#1,434 |
| 20. | 01098 | 22.1% | 5.5%(+16.6)#20 | 5.8%(+16.3)#1,461 |
| 21. | 01264 | 21.9% | 5.5%(+16.4)#21 | 5.8%(+16.1)#1,492 |
| 22. | 01349 | 21.9% | 5.5%(+16.4)#22 | 5.8%(+16.0)#1,501 |
| 23. | 01351 | 21.8% | 5.5%(+16.3)#23 | 5.8%(+16.0)#1,508 |
| 24. | 01236 | 21.1% | 5.5%(+15.7)#24 | 5.8%(+15.3)#1,619 |
| 25. | 02561 | 20.4% | 5.5%(+14.9)#25 | 5.8%(+14.6)#1,744 |
| 26. | 01341 | 19.6% | 5.5%(+14.1)#26 | 5.8%(+13.8)#1,905 |
| 27. | 01262 | 19.1% | 5.5%(+13.6)#27 | 5.8%(+13.3)#2,013 |
| 28. | 01245 | 19.0% | 5.5%(+13.5)#28 | 5.8%(+13.2)#2,036 |
| 29. | 01070 | 17.9% | 5.5%(+12.5)#29 | 5.8%(+12.1)#2,321 |
| 30. | 01054 | 17.9% | 5.5%(+12.4)#30 | 5.8%(+12.1)#2,330 |
| 31. | 02667 | 17.9% | 5.5%(+12.4)#31 | 5.8%(+12.1)#2,345 |
| 32. | 01222 | 16.6% | 5.5%(+11.1)#32 | 5.8%(+10.8)#2,773 |
| 33. | 02554 | 16.5% | 5.5%(+11.1)#33 | 5.8%(+10.7)#2,797 |
| 34. | 02652 | 16.4% | 5.5%(+11.0)#34 | 5.8%(+10.6)#2,832 |
| 35. | 01032 | 16.0% | 5.5%(+10.5)#35 | 5.8%(+10.1)#2,989 |
| 36. | 02535 | 15.9% | 5.5%(+10.4)#36 | 5.8%(+10.1)#3,030 |
| 37. | 01053 | 15.8% | 5.5%(+10.3)#37 | 5.8%(+9.94)#3,093 |
| 38. | 01370 | 15.6% | 5.5%(+10.1)#38 | 5.8%(+9.75)#3,174 |
| 39. | 02659 | 15.4% | 5.5%(+9.89)#39 | 5.8%(+9.55)#3,253 |
| 40. | 01339 | 15.4% | 5.5%(+9.89)#40 | 5.8%(+9.55)#3,254 |
| 41. | 01379 | 15.2% | 5.5%(+9.73)#41 | 5.8%(+9.39)#3,322 |
| 42. | 02568 | 15.1% | 5.5%(+9.59)#42 | 5.8%(+9.25)#3,391 |
| 43. | 01230 | 14.8% | 5.5%(+9.28)#43 | 5.8%(+8.94)#3,539 |
| 44. | 01531 | 14.7% | 5.5%(+9.18)#44 | 5.8%(+8.84)#3,589 |
| 45. | 02642 | 14.2% | 5.5%(+8.75)#45 | 5.8%(+8.41)#3,790 |
| 46. | 02668 | 13.6% | 5.5%(+8.12)#46 | 5.8%(+7.78)#4,135 |
| 47. | 01096 | 13.4% | 5.5%(+7.97)#47 | 5.8%(+7.62)#4,224 |
| 48. | 02653 | 13.1% | 5.5%(+7.67)#48 | 5.8%(+7.33)#4,432 |
| 49. | 02671 | 13.1% | 5.5%(+7.62)#49 | 5.8%(+7.28)#4,462 |
| 50. | 01347 | 13.0% | 5.5%(+7.55)#50 | 5.8%(+7.20)#4,517 |
| 51. | 02367 | 13.0% | 5.5%(+7.49)#51 | 5.8%(+7.15)#4,552 |
| 52. | 01253 | 12.9% | 5.5%(+7.41)#52 | 5.8%(+7.07)#4,598 |
| 53. | 01340 | 12.6% | 5.5%(+7.08)#53 | 5.8%(+6.74)#4,852 |
| 54. | 02631 | 12.4% | 5.5%(+6.92)#54 | 5.8%(+6.58)#4,976 |
| 55. | 01072 | 12.2% | 5.5%(+6.76)#55 | 5.8%(+6.41)#5,087 |
| 56. | 01431 | 12.1% | 5.5%(+6.61)#56 | 5.8%(+6.27)#5,221 |
| 57. | 01062 | 12.1% | 5.5%(+6.59)#57 | 5.8%(+6.25)#5,238 |
| 58. | 01257 | 12.0% | 5.5%(+6.55)#58 | 5.8%(+6.20)#5,276 |
| 59. | 02556 | 12.0% | 5.5%(+6.52)#59 | 5.8%(+6.18)#5,299 |
| 60. | 01929 | 12.0% | 5.5%(+6.49)#60 | 5.8%(+6.14)#5,315 |
| 61. | 01985 | 11.9% | 5.5%(+6.41)#61 | 5.8%(+6.07)#5,367 |
| 62. | 02666 | 11.9% | 5.5%(+6.38)#62 | 5.8%(+6.04)#5,396 |
| 63. | 01585 | 11.8% | 5.5%(+6.32)#63 | 5.8%(+5.97)#5,462 |
| 64. | 01337 | 11.7% | 5.5%(+6.23)#64 | 5.8%(+5.89)#5,538 |
| 65. | 01254 | 11.5% | 5.5%(+6.06)#65 | 5.8%(+5.71)#5,673 |
| 66. | 01079 | 11.5% | 5.5%(+5.99)#66 | 5.8%(+5.64)#5,746 |
| 67. | 01564 | 11.4% | 5.5%(+5.94)#67 | 5.8%(+5.60)#5,803 |
| 68. | 01223 | 11.2% | 5.5%(+5.77)#68 | 5.8%(+5.42)#5,959 |
| 69. | 01255 | 11.2% | 5.5%(+5.71)#69 | 5.8%(+5.37)#6,015 |
| 70. | 01088 | 11.1% | 5.5%(+5.64)#70 | 5.8%(+5.30)#6,090 |
| 71. | 02657 | 10.9% | 5.5%(+5.39)#71 | 5.8%(+5.05)#6,342 |
| 72. | 01267 | 10.8% | 5.5%(+5.37)#72 | 5.8%(+5.03)#6,362 |
| 73. | 01224 | 10.8% | 5.5%(+5.31)#73 | 5.8%(+4.97)#6,443 |
| 74. | 01982 | 10.8% | 5.5%(+5.30)#74 | 5.8%(+4.95)#6,458 |
| 75. | 01773 | 10.8% | 5.5%(+5.28)#75 | 5.8%(+4.94)#6,481 |
| 76. | 01950 | 10.7% | 5.5%(+5.26)#76 | 5.8%(+4.91)#6,504 |
| 77. | 02645 | 10.7% | 5.5%(+5.25)#77 | 5.8%(+4.90)#6,513 |
| 78. | 02576 | 10.7% | 5.5%(+5.21)#78 | 5.8%(+4.87)#6,563 |
| 79. | 02675 | 10.5% | 5.5%(+5.00)#79 | 5.8%(+4.66)#6,799 |
| 80. | 01541 | 10.4% | 5.5%(+4.94)#80 | 5.8%(+4.59)#6,884 |
| 81. | 01373 | 10.4% | 5.5%(+4.92)#81 | 5.8%(+4.58)#6,897 |
| 82. | 01756 | 10.4% | 5.5%(+4.91)#82 | 5.8%(+4.56)#6,910 |
| 83. | 01073 | 10.3% | 5.5%(+4.88)#83 | 5.8%(+4.53)#6,939 |
| 84. | 01068 | 10.3% | 5.5%(+4.85)#84 | 5.8%(+4.51)#6,974 |
| 85. | 02468 | 10.3% | 5.5%(+4.83)#85 | 5.8%(+4.48)#7,004 |
| 86. | 02540 | 10.3% | 5.5%(+4.79)#86 | 5.8%(+4.45)#7,046 |
| 87. | 02670 | 10.2% | 5.5%(+4.71)#87 | 5.8%(+4.37)#7,136 |
| 88. | 01945 | 10.2% | 5.5%(+4.71)#88 | 5.8%(+4.36)#7,145 |
| 89. | 01301 | 10.1% | 5.5%(+4.62)#89 | 5.8%(+4.27)#7,250 |
| 90. | 02536 | 9.9% | 5.5%(+4.43)#90 | 5.8%(+4.08)#7,484 |
| 91. | 01966 | 9.9% | 5.5%(+4.41)#91 | 5.8%(+4.07)#7,502 |
| 92. | 02054 | 9.9% | 5.5%(+4.38)#92 | 5.8%(+4.04)#7,537 |
| 93. | 01057 | 9.7% | 5.5%(+4.26)#93 | 5.8%(+3.91)#7,724 |
| 94. | 02562 | 9.7% | 5.5%(+4.19)#94 | 5.8%(+3.85)#7,806 |
| 95. | 01907 | 9.6% | 5.5%(+4.12)#95 | 5.8%(+3.77)#7,900 |
| 96. | 01060 | 9.6% | 5.5%(+4.10)#96 | 5.8%(+3.76)#7,921 |
| 97. | 01778 | 9.5% | 5.5%(+3.99)#97 | 5.8%(+3.65)#8,061 |
| 98. | 01754 | 9.4% | 5.5%(+3.96)#98 | 5.8%(+3.62)#8,096 |
| 99. | 02043 | 9.4% | 5.5%(+3.95)#99 | 5.8%(+3.61)#8,119 |
| 100. | 02030 | 9.4% | 5.5%(+3.89)#100 | 5.8%(+3.54)#8,229 |
Common Questions
What are the Top 10 Zip Codes with the Highest Percentage of Self-Employed / Not Incorporated in Massachusetts?
Top 10 Zip Codes with the Highest Percentage of Self-Employed / Not Incorporated in Massachusetts are:
What zip code has the Highest Percentage of Self-Employed / Not Incorporated in Massachusetts?
01244 has the Highest Percentage of Self-Employed / Not Incorporated in Massachusetts with 50.8%.
What is the Percentage of Self-Employed / Not Incorporated in the State of Massachusetts?
Percentage of Self-Employed / Not Incorporated in Massachusetts is 5.5%.
What is the Percentage of Self-Employed / Not Incorporated in the United States?
Percentage of Self-Employed / Not Incorporated in the United States is 5.8%.