Zip Codes with the Highest Percentage of Self-Employed / Not Incorporated in Northampton, MA
RELATED REPORTS & OPTIONS
Self-Employed / Not Incorporated
Northampton
Compare Zip Codes
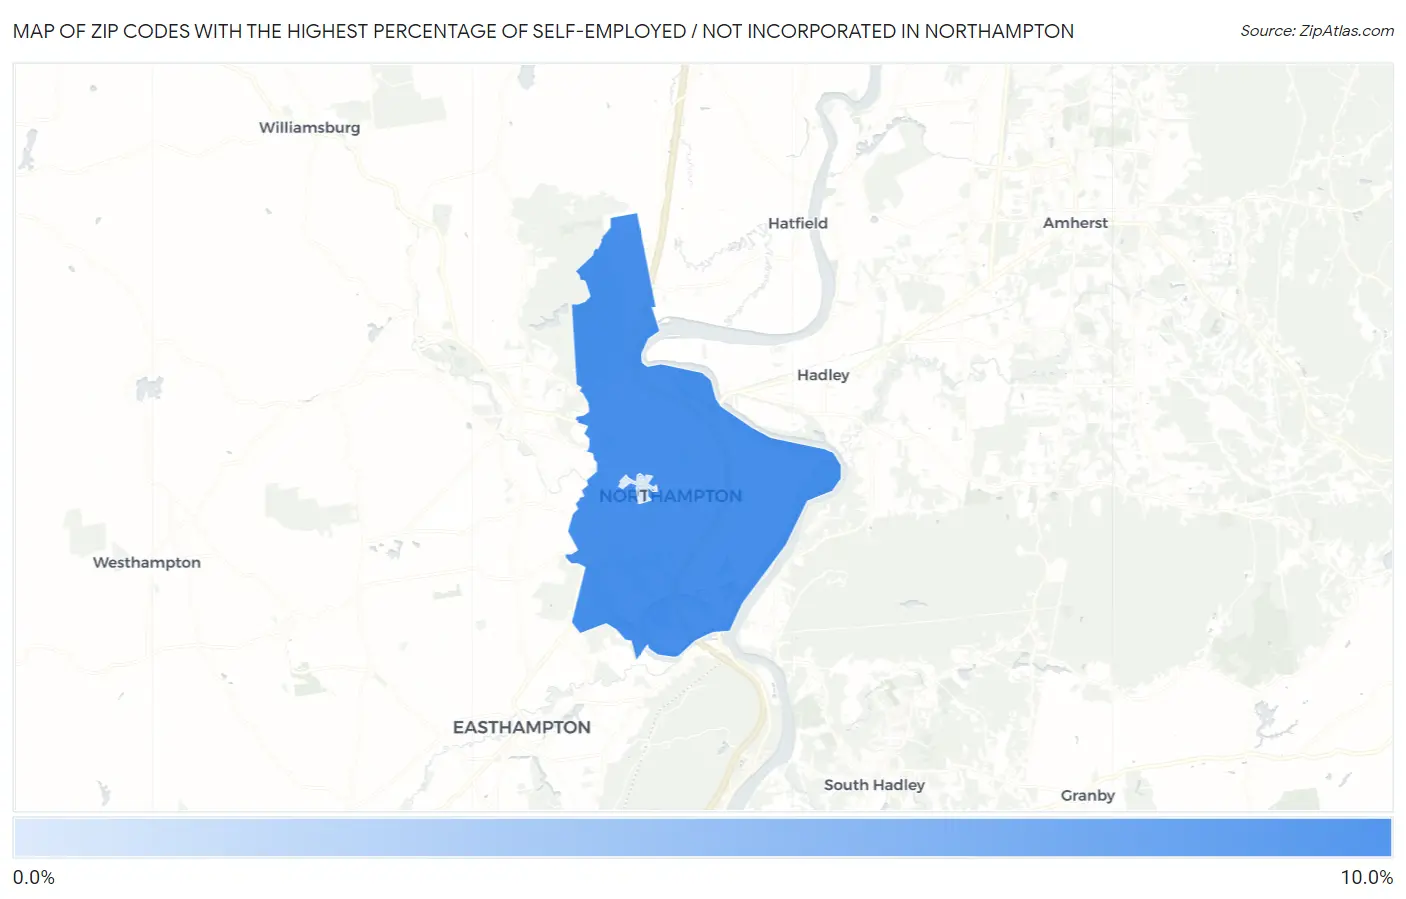
Map of Zip Codes with the Highest Percentage of Self-Employed / Not Incorporated in Northampton
0.0%
10.0%
Zip Codes with the Highest Percentage of Self-Employed / Not Incorporated in Northampton, MA
| Zip Code | % Self-Employed / Not Incorporated | vs State | vs National | |
| 1. | 01060 | 9.6% | 5.5%(+4.10)#96 | 5.8%(+3.76)#7,921 |
| 2. | 01063 | 0.50% | 5.5%(-4.97)#503 | 5.8%(-5.31)#29,399 |
1
Common Questions
What are the Top Zip Codes with the Highest Percentage of Self-Employed / Not Incorporated in Northampton, MA?
Top Zip Codes with the Highest Percentage of Self-Employed / Not Incorporated in Northampton, MA are:
What zip code has the Highest Percentage of Self-Employed / Not Incorporated in Northampton, MA?
01060 has the Highest Percentage of Self-Employed / Not Incorporated in Northampton, MA with 9.6%.
What is the Percentage of Self-Employed / Not Incorporated in Northampton, MA?
Percentage of Self-Employed / Not Incorporated in Northampton is 10.1%.
What is the Percentage of Self-Employed / Not Incorporated in Massachusetts?
Percentage of Self-Employed / Not Incorporated in Massachusetts is 5.5%.
What is the Percentage of Self-Employed / Not Incorporated in the United States?
Percentage of Self-Employed / Not Incorporated in the United States is 5.8%.