Cities with the Highest Percentage of Population Enrolled in Elementary School in Vermont
RELATED REPORTS & OPTIONS
Elementary School
Vermont
Compare Cities
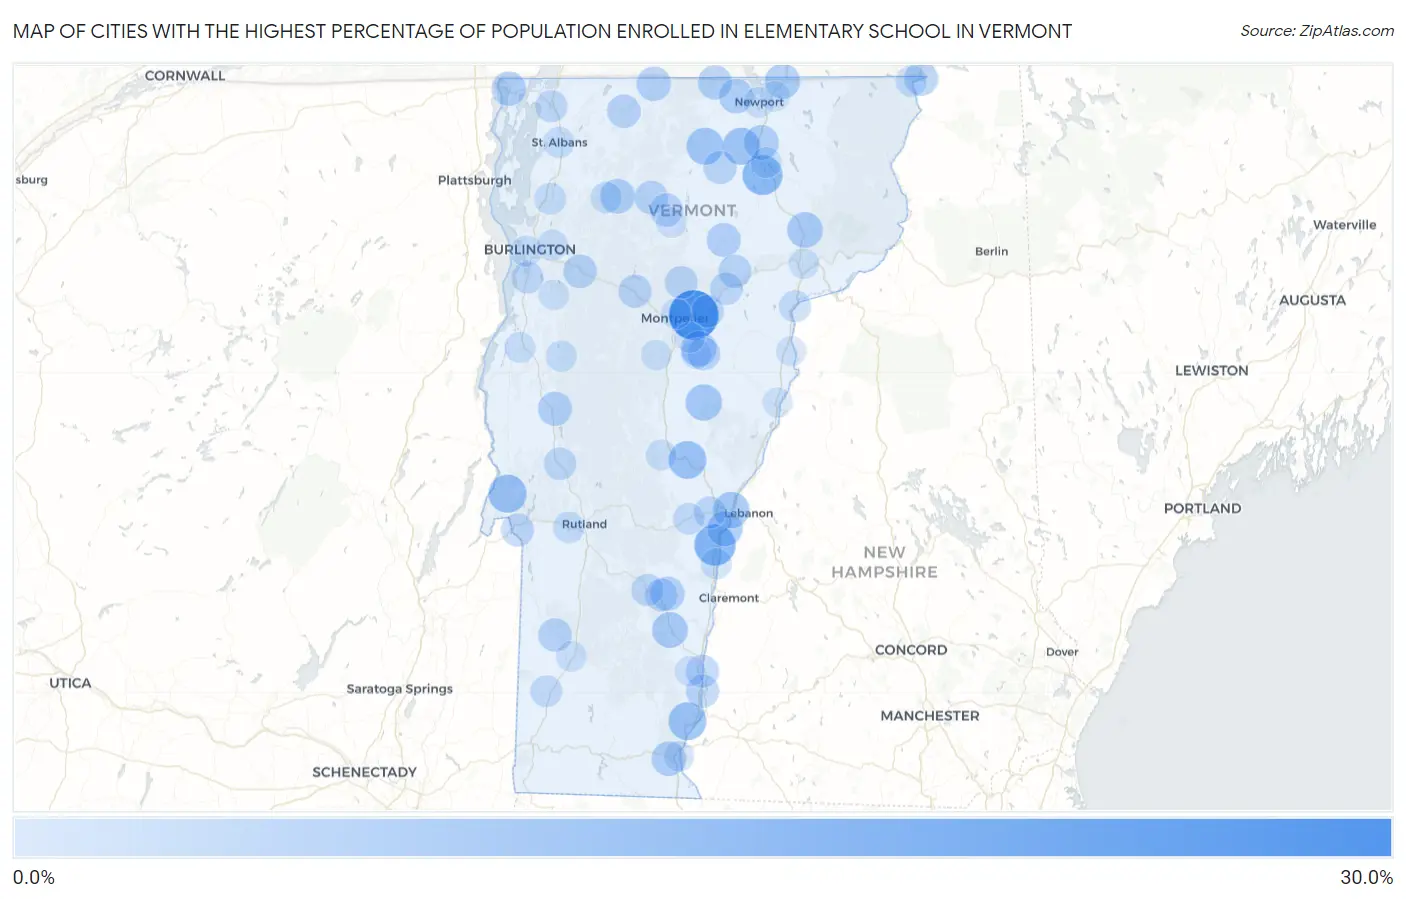
Map of Cities with the Highest Percentage of Population Enrolled in Elementary School in Vermont
0.0%
30.0%
Cities with the Highest Percentage of Population Enrolled in Elementary School in Vermont
| City | % in Elementary | vs State | vs National | |
| 1. | East Montpelier | 25.4% | 3.9%(+21.5)#1 | 4.9%(+20.5)#101 |
| 2. | Pawlet | 21.8% | 3.9%(+17.9)#2 | 4.9%(+16.9)#174 |
| 3. | Algiers | 19.6% | 3.9%(+15.7)#3 | 4.9%(+14.7)#255 |
| 4. | Hartland | 15.5% | 3.9%(+11.6)#4 | 4.9%(+10.6)#529 |
| 5. | Glover | 13.9% | 3.9%(+9.97)#5 | 4.9%(+8.97)#730 |
| 6. | Highgate Center | 13.7% | 3.9%(+9.76)#6 | 4.9%(+8.76)#765 |
| 7. | South Hero | 12.3% | 3.9%(+8.41)#7 | 4.9%(+7.41)#1,063 |
| 8. | Benson | 11.7% | 3.9%(+7.76)#8 | 4.9%(+6.76)#1,261 |
| 9. | Putney | 11.4% | 3.9%(+7.46)#9 | 4.9%(+6.46)#1,383 |
| 10. | South Royalton | 11.3% | 3.9%(+7.35)#10 | 4.9%(+6.35)#1,421 |
| 11. | Irasburg | 10.6% | 3.9%(+6.65)#11 | 4.9%(+5.65)#1,756 |
| 12. | Lowell | 10.5% | 3.9%(+6.55)#12 | 4.9%(+5.55)#1,808 |
| 13. | East Charlotte | 9.9% | 3.9%(+6.01)#13 | 4.9%(+5.01)#2,113 |
| 14. | Chelsea | 9.7% | 3.9%(+5.77)#14 | 4.9%(+4.78)#2,265 |
| 15. | White River Junction | 9.5% | 3.9%(+5.54)#15 | 4.9%(+4.54)#2,444 |
| 16. | Waterbury Center | 9.2% | 3.9%(+5.27)#16 | 4.9%(+4.27)#2,648 |
| 17. | Whitingham | 9.2% | 3.9%(+5.24)#17 | 4.9%(+4.24)#2,672 |
| 18. | Chester | 8.9% | 3.9%(+4.98)#18 | 4.9%(+3.98)#2,915 |
| 19. | Lyndonville | 8.9% | 3.9%(+4.96)#19 | 4.9%(+3.96)#2,934 |
| 20. | Websterville | 8.8% | 3.9%(+4.91)#20 | 4.9%(+3.91)#2,998 |
| 21. | Killington | 8.8% | 3.9%(+4.86)#21 | 4.9%(+3.86)#3,046 |
| 22. | North Hartland | 8.7% | 3.9%(+4.72)#22 | 4.9%(+3.72)#3,208 |
| 23. | Derby Line | 8.3% | 3.9%(+4.38)#23 | 4.9%(+3.38)#3,638 |
| 24. | Orleans | 8.1% | 3.9%(+4.13)#24 | 4.9%(+3.13)#4,018 |
| 25. | Sheffield | 7.9% | 3.9%(+4.01)#25 | 4.9%(+3.01)#4,191 |
| 26. | Jeffersonville | 7.9% | 3.9%(+3.92)#26 | 4.9%(+2.92)#4,304 |
| 27. | West Brattleboro | 7.7% | 3.9%(+3.76)#27 | 4.9%(+2.76)#4,586 |
| 28. | Alburgh | 7.6% | 3.9%(+3.65)#28 | 4.9%(+2.65)#4,807 |
| 29. | Newport Center | 7.5% | 3.9%(+3.61)#29 | 4.9%(+2.61)#4,887 |
| 30. | Sutton | 7.3% | 3.9%(+3.40)#30 | 4.9%(+2.40)#5,302 |
| 31. | Richford | 7.3% | 3.9%(+3.39)#31 | 4.9%(+2.39)#5,324 |
| 32. | North Troy | 7.3% | 3.9%(+3.37)#32 | 4.9%(+2.37)#5,381 |
| 33. | Cavendish | 7.2% | 3.9%(+3.28)#33 | 4.9%(+2.28)#5,553 |
| 34. | East Middlebury | 7.1% | 3.9%(+3.20)#34 | 4.9%(+2.20)#5,711 |
| 35. | Hardwick | 7.1% | 3.9%(+3.18)#35 | 4.9%(+2.18)#5,746 |
| 36. | East Poultney | 7.1% | 3.9%(+3.13)#36 | 4.9%(+2.13)#5,840 |
| 37. | Proctor | 7.0% | 3.9%(+3.09)#37 | 4.9%(+2.09)#5,916 |
| 38. | Beecher Falls | 6.9% | 3.9%(+3.00)#38 | 4.9%(+2.00)#6,129 |
| 39. | Richmond | 6.5% | 3.9%(+2.60)#39 | 4.9%(+1.60)#7,166 |
| 40. | Johnson | 6.4% | 3.9%(+2.49)#40 | 4.9%(+1.49)#7,490 |
| 41. | Dorset | 6.4% | 3.9%(+2.49)#41 | 4.9%(+1.49)#7,516 |
| 42. | Pownal | 6.4% | 3.9%(+2.44)#42 | 4.9%(+1.44)#7,663 |
| 43. | Enosburg Falls | 6.3% | 3.9%(+2.42)#43 | 4.9%(+1.42)#7,721 |
| 44. | Hyde Park | 6.3% | 3.9%(+2.36)#44 | 4.9%(+1.36)#7,897 |
| 45. | Westminster | 6.2% | 3.9%(+2.28)#45 | 4.9%(+1.28)#8,191 |
| 46. | Waterbury | 6.2% | 3.9%(+2.24)#46 | 4.9%(+1.24)#8,309 |
| 47. | Cabot | 6.1% | 3.9%(+2.18)#47 | 4.9%(+1.18)#8,531 |
| 48. | Albany | 6.1% | 3.9%(+2.16)#48 | 4.9%(+1.16)#8,579 |
| 49. | East Barre | 6.0% | 3.9%(+2.11)#49 | 4.9%(+1.11)#8,757 |
| 50. | Fair Haven | 5.9% | 3.9%(+1.99)#50 | 4.9%(+0.989)#9,224 |
| 51. | Bellows Falls | 5.9% | 3.9%(+1.97)#51 | 4.9%(+0.970)#9,274 |
| 52. | Worcester | 5.7% | 3.9%(+1.78)#52 | 4.9%(+0.785)#9,946 |
| 53. | Proctorsville | 5.6% | 3.9%(+1.71)#53 | 4.9%(+0.713)#10,211 |
| 54. | Huntington | 5.6% | 3.9%(+1.65)#54 | 4.9%(+0.655)#10,446 |
| 55. | Plainfield | 5.5% | 3.9%(+1.60)#55 | 4.9%(+0.599)#10,675 |
| 56. | Marshfield | 5.5% | 3.9%(+1.60)#56 | 4.9%(+0.599)#10,676 |
| 57. | Brandon | 5.4% | 3.9%(+1.47)#57 | 4.9%(+0.475)#11,234 |
| 58. | Gilman | 5.3% | 3.9%(+1.41)#58 | 4.9%(+0.410)#11,495 |
| 59. | Swanton | 5.0% | 3.9%(+1.12)#59 | 4.9%(+0.117)#12,766 |
| 60. | Ludlow | 5.0% | 3.9%(+1.08)#60 | 4.9%(+0.078)#12,931 |
| 61. | Quechee | 5.0% | 3.9%(+1.07)#61 | 4.9%(+0.071)#12,961 |
| 62. | Shelburne | 4.9% | 3.9%(+0.947)#62 | 4.9%(-0.052)#13,553 |
| 63. | Lunenburg | 4.8% | 3.9%(+0.846)#63 | 4.9%(-0.153)#14,022 |
| 64. | Barnet | 4.7% | 3.9%(+0.795)#64 | 4.9%(-0.205)#14,252 |
| 65. | Arlington | 4.7% | 3.9%(+0.771)#65 | 4.9%(-0.229)#14,350 |
| 66. | North Clarendon | 4.6% | 3.9%(+0.660)#66 | 4.9%(-0.340)#14,867 |
| 67. | North Hyde Park | 4.6% | 3.9%(+0.627)#67 | 4.9%(-0.372)#15,005 |
| 68. | Woodstock | 4.5% | 3.9%(+0.552)#68 | 4.9%(-0.447)#15,361 |
| 69. | Milton | 4.4% | 3.9%(+0.501)#69 | 4.9%(-0.498)#15,582 |
| 70. | Canaan | 4.2% | 3.9%(+0.266)#70 | 4.9%(-0.734)#16,735 |
| 71. | Cambridge | 4.2% | 3.9%(+0.259)#71 | 4.9%(-0.741)#16,780 |
| 72. | West Rutland | 4.2% | 3.9%(+0.246)#72 | 4.9%(-0.753)#16,831 |
| 73. | South Burlington | 3.9% | 3.9%(-0.014)#73 | 4.9%(-1.01)#17,991 |
| 74. | Windsor | 3.9% | 3.9%(-0.053)#74 | 4.9%(-1.05)#18,153 |
| 75. | St Albans | 3.9% | 3.9%(-0.062)#75 | 4.9%(-1.06)#18,187 |
| 76. | Barton | 3.8% | 3.9%(-0.123)#76 | 4.9%(-1.12)#18,443 |
| 77. | Bristol | 3.8% | 3.9%(-0.163)#77 | 4.9%(-1.16)#18,617 |
| 78. | East Dorset | 3.6% | 3.9%(-0.372)#78 | 4.9%(-1.37)#19,480 |
| 79. | Vergennes | 3.5% | 3.9%(-0.429)#79 | 4.9%(-1.43)#19,684 |
| 80. | West Woodstock | 3.5% | 3.9%(-0.441)#80 | 4.9%(-1.44)#19,733 |
| 81. | Essex Junction | 3.5% | 3.9%(-0.468)#81 | 4.9%(-1.47)#19,839 |
| 82. | St. George | 3.4% | 3.9%(-0.528)#82 | 4.9%(-1.53)#20,078 |
| 83. | Bethel | 3.4% | 3.9%(-0.550)#83 | 4.9%(-1.55)#20,166 |
| 84. | Manchester Center | 3.3% | 3.9%(-0.618)#84 | 4.9%(-1.62)#20,432 |
| 85. | Newport | 3.3% | 3.9%(-0.640)#85 | 4.9%(-1.64)#20,499 |
| 86. | Brattleboro | 3.3% | 3.9%(-0.642)#86 | 4.9%(-1.64)#20,508 |
| 87. | Graniteville | 3.3% | 3.9%(-0.644)#87 | 4.9%(-1.64)#20,515 |
| 88. | Northfield | 3.2% | 3.9%(-0.701)#88 | 4.9%(-1.70)#20,691 |
| 89. | Morrisville | 3.2% | 3.9%(-0.713)#89 | 4.9%(-1.71)#20,746 |
| 90. | Saxtons River | 3.2% | 3.9%(-0.731)#90 | 4.9%(-1.73)#20,807 |
| 91. | Barre | 3.2% | 3.9%(-0.732)#91 | 4.9%(-1.73)#20,810 |
| 92. | Montpelier | 3.2% | 3.9%(-0.743)#92 | 4.9%(-1.74)#20,848 |
| 93. | Middletown Springs | 3.2% | 3.9%(-0.755)#93 | 4.9%(-1.75)#20,895 |
| 94. | Lincoln | 3.1% | 3.9%(-0.841)#94 | 4.9%(-1.84)#21,199 |
| 95. | Hinesburg | 3.1% | 3.9%(-0.871)#95 | 4.9%(-1.87)#21,306 |
| 96. | Wolcott | 3.0% | 3.9%(-0.918)#96 | 4.9%(-1.92)#21,456 |
| 97. | St Johnsbury | 3.0% | 3.9%(-0.925)#97 | 4.9%(-1.93)#21,487 |
| 98. | Derby Center | 2.9% | 3.9%(-0.996)#98 | 4.9%(-2.00)#21,724 |
| 99. | Bradford | 2.8% | 3.9%(-1.16)#99 | 4.9%(-2.16)#22,217 |
| 100. | Wells River | 2.8% | 3.9%(-1.17)#100 | 4.9%(-2.17)#22,234 |
1
2Common Questions
What are the Top 10 Cities with the Highest Percentage of Population Enrolled in Elementary School in Vermont?
Top 10 Cities with the Highest Percentage of Population Enrolled in Elementary School in Vermont are:
#1
25.4%
#2
15.5%
#3
13.9%
#4
11.7%
#5
11.4%
#6
11.3%
#7
10.6%
#8
10.5%
#9
9.7%
#10
9.5%
What city has the Highest Percentage of Population Enrolled in Elementary School in Vermont?
East Montpelier has the Highest Percentage of Population Enrolled in Elementary School in Vermont with 25.4%.
What is the Percentage of Population Enrolled in Elementary School in the State of Vermont?
Percentage of Population Enrolled in Elementary School in Vermont is 3.9%.
What is the Percentage of Population Enrolled in Elementary School in the United States?
Percentage of Population Enrolled in Elementary School in the United States is 4.9%.