Fort Pierre, SD Map & Demographics
Fort Pierre Map
Fort Pierre Overview
$45,811
PER CAPITA INCOME
$109,167
AVG FAMILY INCOME
$81,150
AVG HOUSEHOLD INCOME
32.5%
WAGE / INCOME GAP [ % ]
67.5¢/ $1
WAGE / INCOME GAP [ $ ]
0.42
INEQUALITY / GINI INDEX
2,522
TOTAL POPULATION
1,492
MALE POPULATION
1,030
FEMALE POPULATION
144.85
MALES / 100 FEMALES
69.03
FEMALES / 100 MALES
42.4
MEDIAN AGE
3.3
AVG FAMILY SIZE
2.3
AVG HOUSEHOLD SIZE
1,491
LABOR FORCE [ PEOPLE ]
74.6%
PERCENT IN LABOR FORCE
0.2%
UNEMPLOYMENT RATE
Fort Pierre Zip Codes
Fort Pierre Area Codes
Income in Fort Pierre
Income Overview in Fort Pierre
Per Capita Income in Fort Pierre is $45,811, while median incomes of families and households are $109,167 and $81,150 respectively.
| Characteristic | Number | Measure |
| Per Capita Income | 2,522 | $45,811 |
| Median Family Income | 590 | $109,167 |
| Mean Family Income | 590 | $139,661 |
| Median Household Income | 1,081 | $81,150 |
| Mean Household Income | 1,081 | $101,568 |
| Income Deficit | 590 | $0 |
| Wage / Income Gap (%) | 2,522 | 32.52% |
| Wage / Income Gap ($) | 2,522 | 67.48¢ per $1 |
| Gini / Inequality Index | 2,522 | 0.42 |
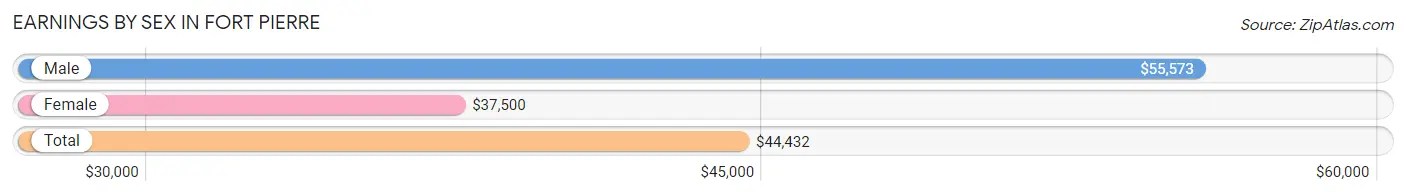
Earnings by Sex in Fort Pierre
Average Earnings in Fort Pierre are $44,432, $55,573 for men and $37,500 for women, a difference of 32.5%.
| Sex | Number | Average Earnings |
| Male | 909 (58.9%) | $55,573 |
| Female | 634 (41.1%) | $37,500 |
| Total | 1,543 (100.0%) | $44,432 |
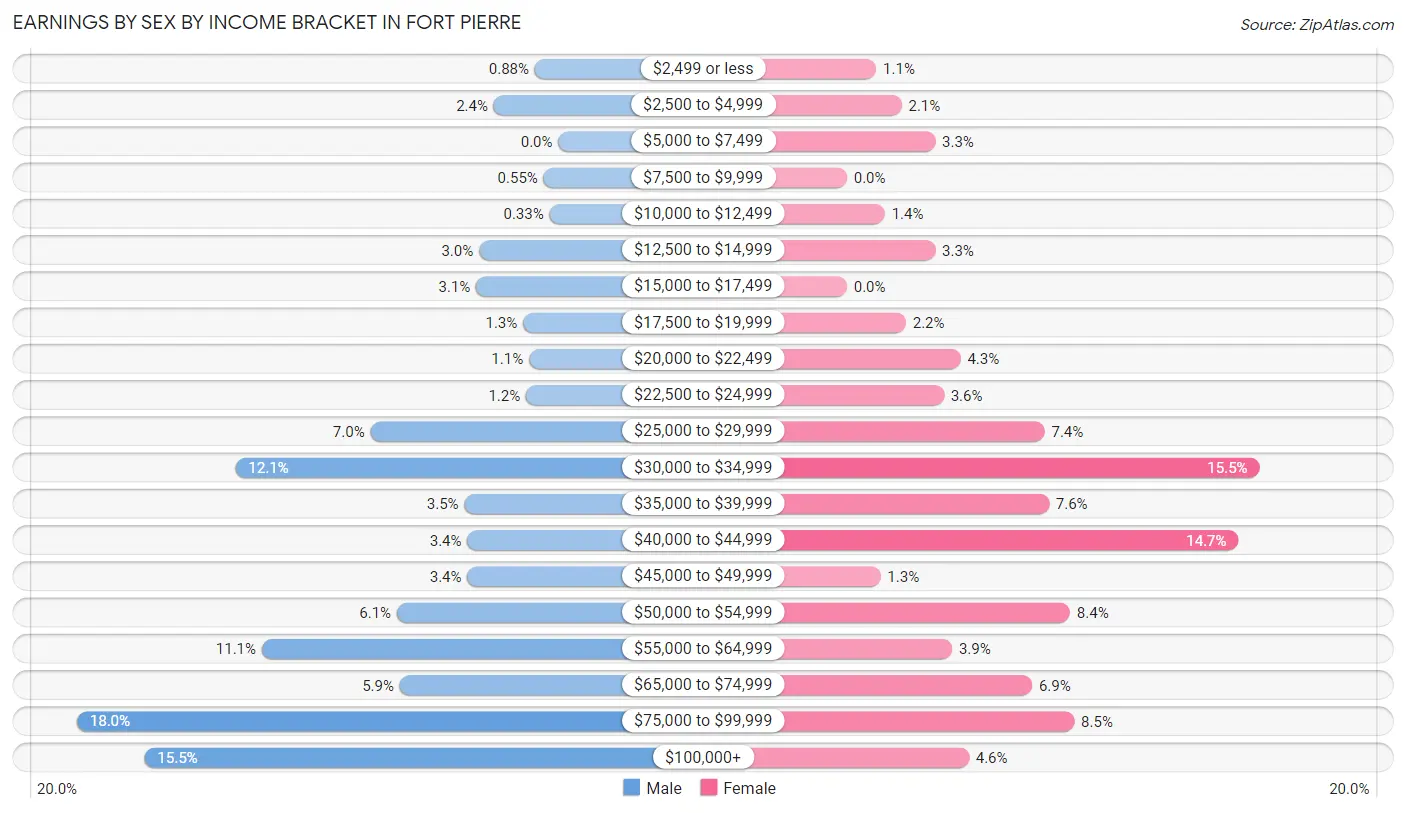
Earnings by Sex by Income Bracket in Fort Pierre
The most common earnings brackets in Fort Pierre are $75,000 to $99,999 for men (164 | 18.0%) and $30,000 to $34,999 for women (98 | 15.5%).
| Income | Male | Female |
| $2,499 or less | 8 (0.9%) | 7 (1.1%) |
| $2,500 to $4,999 | 22 (2.4%) | 13 (2.1%) |
| $5,000 to $7,499 | 0 (0.0%) | 21 (3.3%) |
| $7,500 to $9,999 | 5 (0.5%) | 0 (0.0%) |
| $10,000 to $12,499 | 3 (0.3%) | 9 (1.4%) |
| $12,500 to $14,999 | 27 (3.0%) | 21 (3.3%) |
| $15,000 to $17,499 | 28 (3.1%) | 0 (0.0%) |
| $17,500 to $19,999 | 12 (1.3%) | 14 (2.2%) |
| $20,000 to $22,499 | 10 (1.1%) | 27 (4.3%) |
| $22,500 to $24,999 | 11 (1.2%) | 23 (3.6%) |
| $25,000 to $29,999 | 64 (7.0%) | 47 (7.4%) |
| $30,000 to $34,999 | 110 (12.1%) | 98 (15.5%) |
| $35,000 to $39,999 | 32 (3.5%) | 48 (7.6%) |
| $40,000 to $44,999 | 31 (3.4%) | 93 (14.7%) |
| $45,000 to $49,999 | 31 (3.4%) | 8 (1.3%) |
| $50,000 to $54,999 | 55 (6.0%) | 53 (8.4%) |
| $55,000 to $64,999 | 101 (11.1%) | 25 (3.9%) |
| $65,000 to $74,999 | 54 (5.9%) | 44 (6.9%) |
| $75,000 to $99,999 | 164 (18.0%) | 54 (8.5%) |
| $100,000+ | 141 (15.5%) | 29 (4.6%) |
| Total | 909 (100.0%) | 634 (100.0%) |
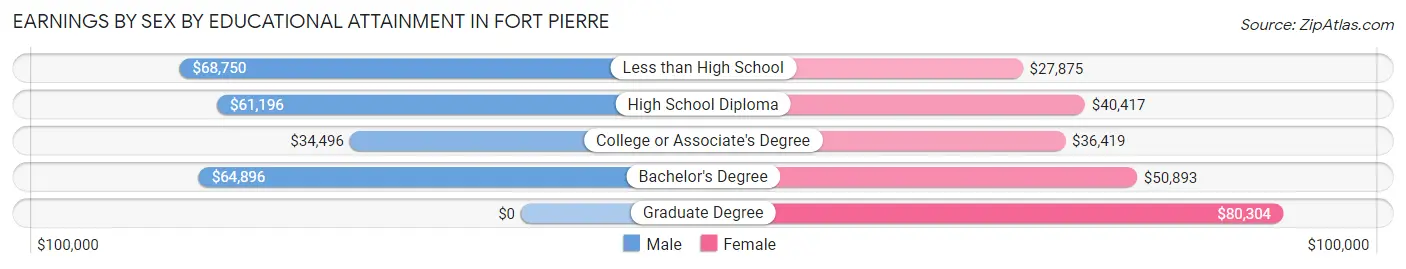
Earnings by Sex by Educational Attainment in Fort Pierre
Average earnings in Fort Pierre are $60,652 for men and $40,902 for women, a difference of 32.6%. Men with an educational attainment of less than high school enjoy the highest average annual earnings of $68,750, while those with college or associate's degree education earn the least with $34,496. Women with an educational attainment of graduate degree earn the most with the average annual earnings of $80,304, while those with less than high school education have the smallest earnings of $27,875.
| Educational Attainment | Male Income | Female Income |
| Less than High School | $68,750 | $27,875 |
| High School Diploma | $61,196 | $40,417 |
| College or Associate's Degree | $34,496 | $36,419 |
| Bachelor's Degree | $64,896 | $50,893 |
| Graduate Degree | - | - |
| Total | $60,652 | $40,902 |
Family Income in Fort Pierre
Family Income Brackets in Fort Pierre
According to the Fort Pierre family income data, there are 141 families falling into the $150,000 to $199,999 income range, which is the most common income bracket and makes up 23.9% of all families.
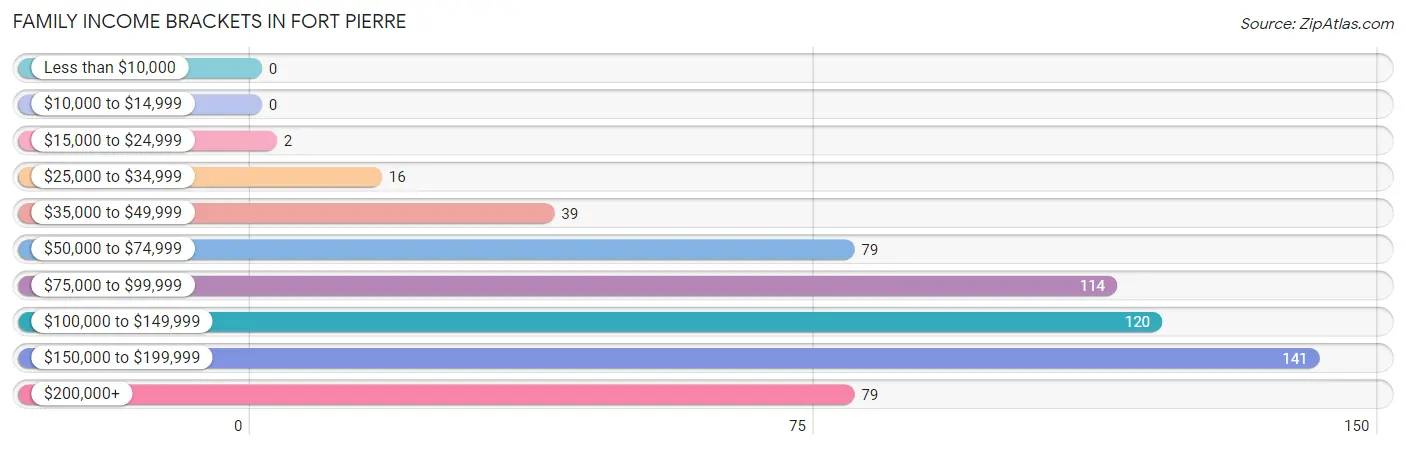
| Income Bracket | # Families | % Families |
| Less than $10,000 | 0 | 0.0% |
| $10,000 to $14,999 | 0 | 0.0% |
| $15,000 to $24,999 | 2 | 0.3% |
| $25,000 to $34,999 | 16 | 2.7% |
| $35,000 to $49,999 | 39 | 6.6% |
| $50,000 to $74,999 | 79 | 13.4% |
| $75,000 to $99,999 | 114 | 19.3% |
| $100,000 to $149,999 | 120 | 20.3% |
| $150,000 to $199,999 | 141 | 23.9% |
| $200,000+ | 79 | 13.4% |
Family Income by Famaliy Size in Fort Pierre
5-person families (67 | 11.4%) account for the highest median family income in Fort Pierre with $239,671 per family, while 3-person families (60 | 10.2%) have the highest median income of $50,340 per family member.
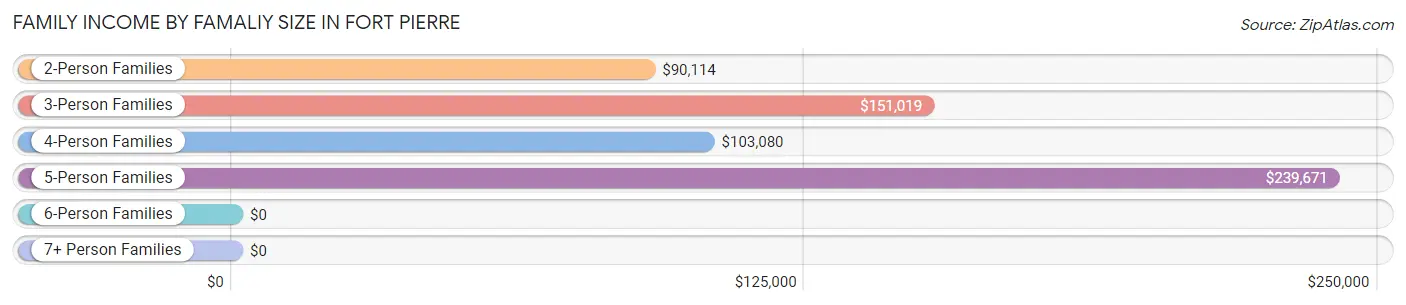
| Income Bracket | # Families | Median Income |
| 2-Person Families | 327 (55.4%) | $90,114 |
| 3-Person Families | 60 (10.2%) | $151,019 |
| 4-Person Families | 119 (20.2%) | $103,080 |
| 5-Person Families | 67 (11.4%) | $239,671 |
| 6-Person Families | 4 (0.7%) | $0 |
| 7+ Person Families | 13 (2.2%) | $0 |
| Total | 590 (100.0%) | $109,167 |
Family Income by Number of Earners in Fort Pierre
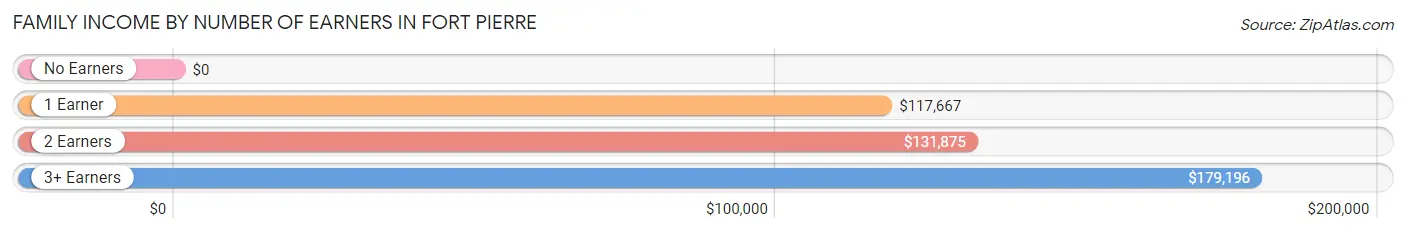
| Number of Earners | # Families | Median Income |
| No Earners | 105 (17.8%) | $0 |
| 1 Earner | 134 (22.7%) | $117,667 |
| 2 Earners | 298 (50.5%) | $131,875 |
| 3+ Earners | 53 (9.0%) | $179,196 |
| Total | 590 (100.0%) | $109,167 |
Household Income in Fort Pierre
Household Income Brackets in Fort Pierre
With 191 households falling in the category, the $50,000 to $74,999 income range is the most frequent in Fort Pierre, accounting for 17.7% of all households. In contrast, only 3 households (0.3%) fall into the less than $10,000 income bracket, making it the least populous group.
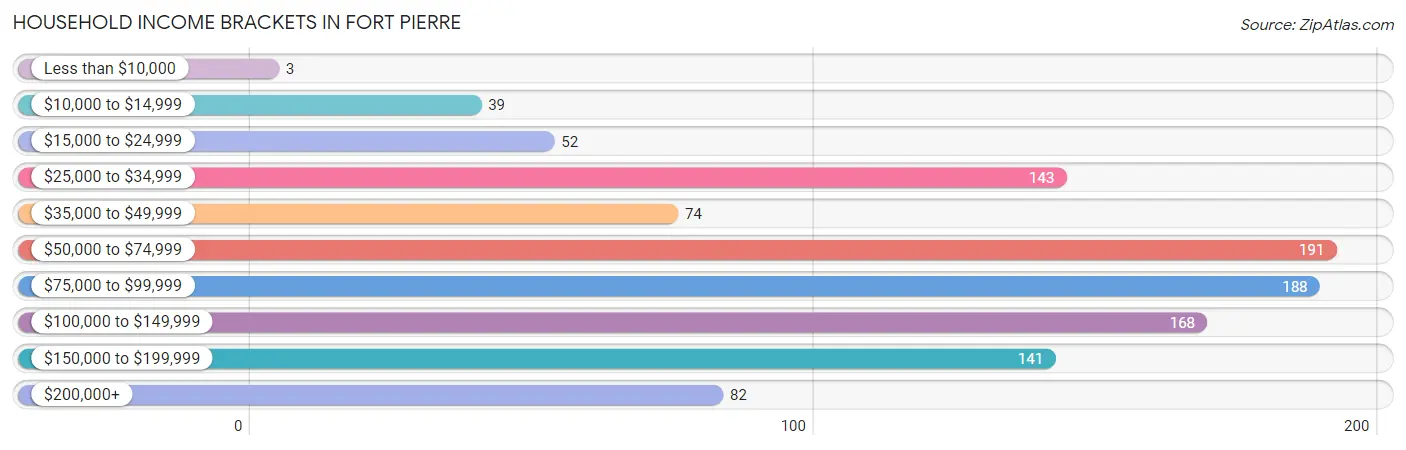
| Income Bracket | # Households | % Households |
| Less than $10,000 | 3 | 0.3% |
| $10,000 to $14,999 | 39 | 3.6% |
| $15,000 to $24,999 | 52 | 4.8% |
| $25,000 to $34,999 | 143 | 13.2% |
| $35,000 to $49,999 | 74 | 6.8% |
| $50,000 to $74,999 | 191 | 17.7% |
| $75,000 to $99,999 | 188 | 17.4% |
| $100,000 to $149,999 | 168 | 15.5% |
| $150,000 to $199,999 | 141 | 13.0% |
| $200,000+ | 82 | 7.6% |
Household Income by Householder Age in Fort Pierre
The median household income in Fort Pierre is $81,150, with the highest median household income of $99,545 found in the 45 to 64 years age bracket for the primary householder. A total of 322 households (29.8%) fall into this category. Meanwhile, the 15 to 24 years age bracket for the primary householder has the lowest median household income of $0, with 75 households (6.9%) in this group.
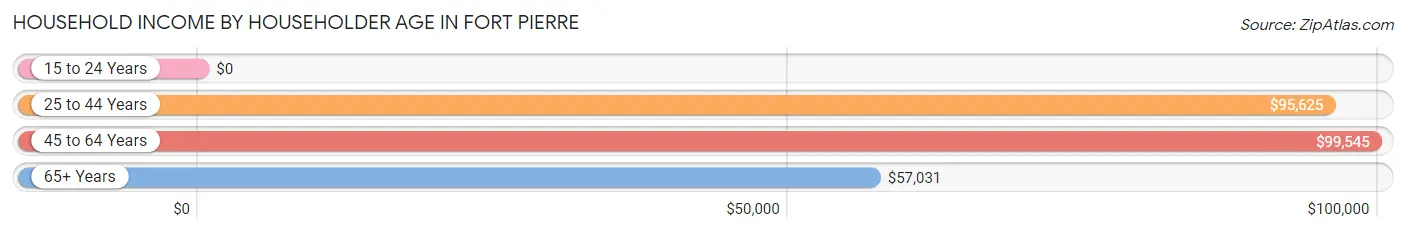
| Income Bracket | # Households | Median Income |
| 15 to 24 Years | 75 (6.9%) | $0 |
| 25 to 44 Years | 349 (32.3%) | $95,625 |
| 45 to 64 Years | 322 (29.8%) | $99,545 |
| 65+ Years | 335 (31.0%) | $57,031 |
| Total | 1,081 (100.0%) | $81,150 |
Poverty in Fort Pierre
Income Below Poverty by Sex and Age in Fort Pierre
With 4.1% poverty level for males and 1.8% for females among the residents of Fort Pierre, 75 year old and over males and 18 to 24 year old females are the most vulnerable to poverty, with 26 males (24.3%) and 13 females (27.1%) in their respective age groups living below the poverty level.
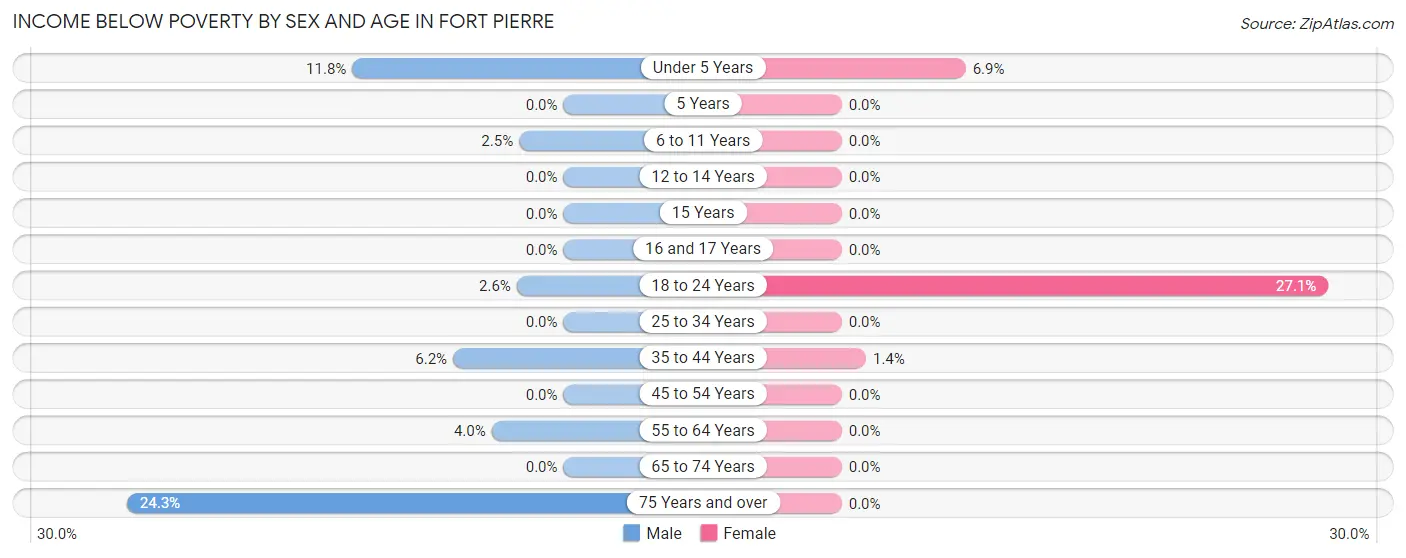
| Age Bracket | Male | Female |
| Under 5 Years | 6 (11.8%) | 4 (6.9%) |
| 5 Years | 0 (0.0%) | 0 (0.0%) |
| 6 to 11 Years | 4 (2.5%) | 0 (0.0%) |
| 12 to 14 Years | 0 (0.0%) | 0 (0.0%) |
| 15 Years | 0 (0.0%) | 0 (0.0%) |
| 16 and 17 Years | 0 (0.0%) | 0 (0.0%) |
| 18 to 24 Years | 2 (2.6%) | 13 (27.1%) |
| 25 to 34 Years | 0 (0.0%) | 0 (0.0%) |
| 35 to 44 Years | 15 (6.1%) | 2 (1.3%) |
| 45 to 54 Years | 0 (0.0%) | 0 (0.0%) |
| 55 to 64 Years | 8 (4.0%) | 0 (0.0%) |
| 65 to 74 Years | 0 (0.0%) | 0 (0.0%) |
| 75 Years and over | 26 (24.3%) | 0 (0.0%) |
| Total | 61 (4.1%) | 19 (1.8%) |
Income Above Poverty by Sex and Age in Fort Pierre
According to the poverty statistics in Fort Pierre, males aged 5 years and females aged 5 years are the age groups that are most secure financially, with 100.0% of males and 100.0% of females in these age groups living above the poverty line.
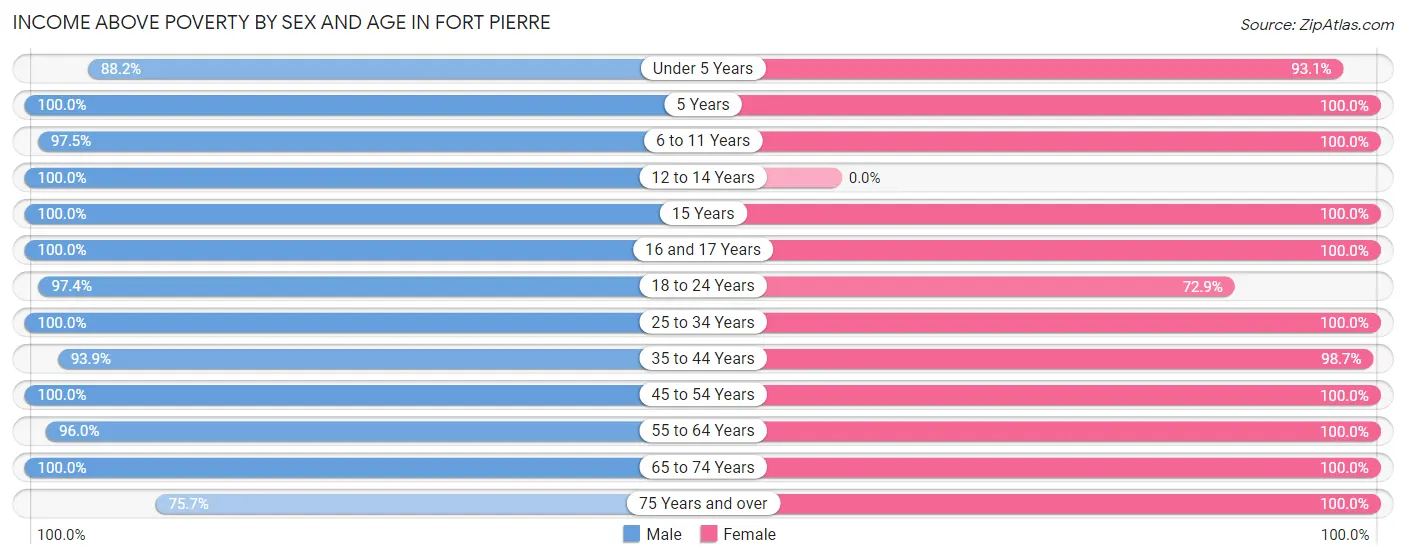
| Age Bracket | Male | Female |
| Under 5 Years | 45 (88.2%) | 54 (93.1%) |
| 5 Years | 34 (100.0%) | 26 (100.0%) |
| 6 to 11 Years | 158 (97.5%) | 90 (100.0%) |
| 12 to 14 Years | 28 (100.0%) | 0 (0.0%) |
| 15 Years | 63 (100.0%) | 11 (100.0%) |
| 16 and 17 Years | 14 (100.0%) | 43 (100.0%) |
| 18 to 24 Years | 75 (97.4%) | 35 (72.9%) |
| 25 to 34 Years | 154 (100.0%) | 104 (100.0%) |
| 35 to 44 Years | 229 (93.9%) | 146 (98.7%) |
| 45 to 54 Years | 183 (100.0%) | 137 (100.0%) |
| 55 to 64 Years | 192 (96.0%) | 138 (100.0%) |
| 65 to 74 Years | 175 (100.0%) | 139 (100.0%) |
| 75 Years and over | 81 (75.7%) | 88 (100.0%) |
| Total | 1,431 (95.9%) | 1,011 (98.2%) |
Income Below Poverty Among Married-Couple Families in Fort Pierre
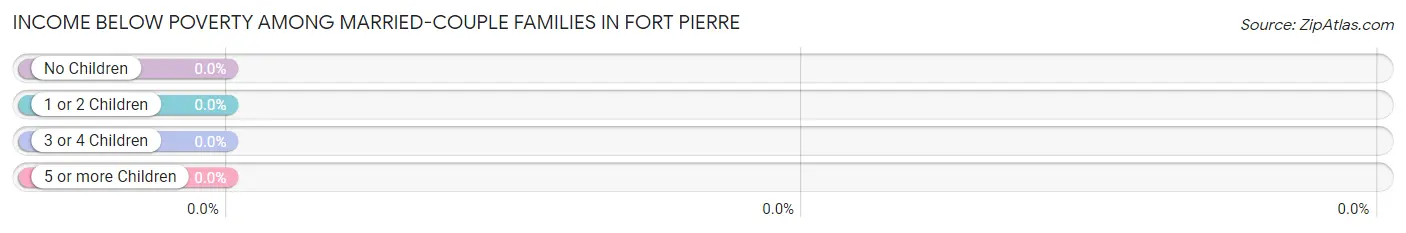
| Children | Above Poverty | Below Poverty |
| No Children | 274 (100.0%) | 0 (0.0%) |
| 1 or 2 Children | 156 (100.0%) | 0 (0.0%) |
| 3 or 4 Children | 61 (100.0%) | 0 (0.0%) |
| 5 or more Children | 0 (0.0%) | 0 (0.0%) |
| Total | 491 (100.0%) | 0 (0.0%) |
Income Below Poverty Among Single-Parent Households in Fort Pierre
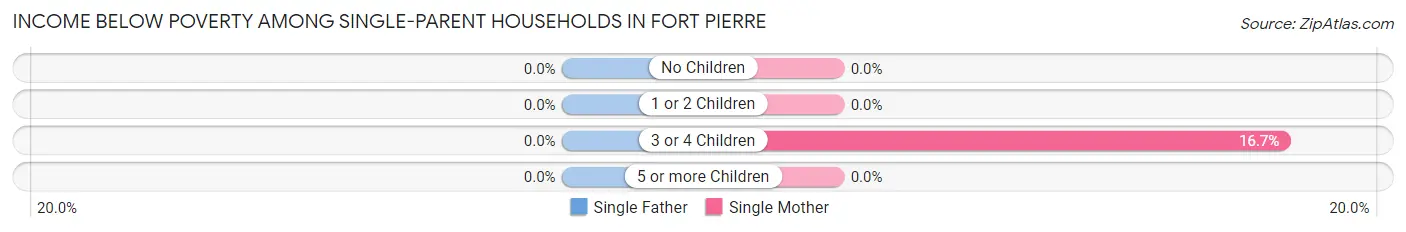
| Children | Single Father | Single Mother |
| No Children | 0 (0.0%) | 0 (0.0%) |
| 1 or 2 Children | 0 (0.0%) | 0 (0.0%) |
| 3 or 4 Children | 0 (0.0%) | 2 (16.7%) |
| 5 or more Children | 0 (0.0%) | 0 (0.0%) |
| Total | 0 (0.0%) | 2 (2.7%) |
Income Below Poverty Among Married-Couple vs Single-Parent Households in Fort Pierre
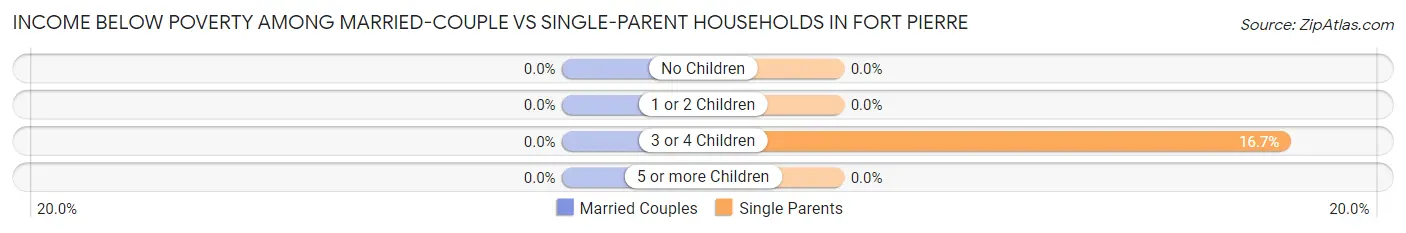
| Children | Married-Couple Families | Single-Parent Households |
| No Children | 0 (0.0%) | 0 (0.0%) |
| 1 or 2 Children | 0 (0.0%) | 0 (0.0%) |
| 3 or 4 Children | 0 (0.0%) | 2 (16.7%) |
| 5 or more Children | 0 (0.0%) | 0 (0.0%) |
| Total | 0 (0.0%) | 2 (2.0%) |
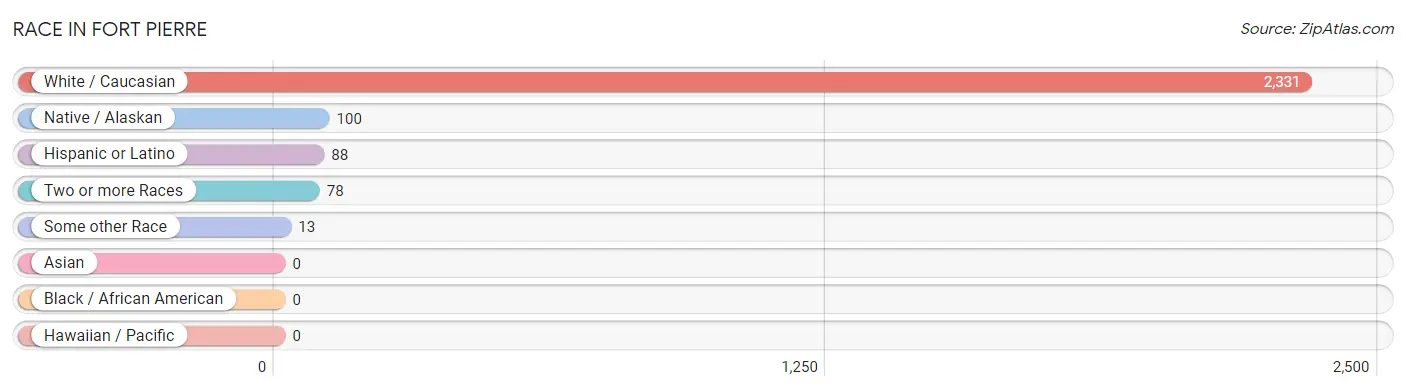
Race in Fort Pierre
The most populous races in Fort Pierre are White / Caucasian (2,331 | 92.4%), Native / Alaskan (100 | 4.0%), and Hispanic or Latino (88 | 3.5%).
| Race | # Population | % Population |
| Asian | 0 | 0.0% |
| Black / African American | 0 | 0.0% |
| Hawaiian / Pacific | 0 | 0.0% |
| Hispanic or Latino | 88 | 3.5% |
| Native / Alaskan | 100 | 4.0% |
| White / Caucasian | 2,331 | 92.4% |
| Two or more Races | 78 | 3.1% |
| Some other Race | 13 | 0.5% |
| Total | 2,522 | 100.0% |
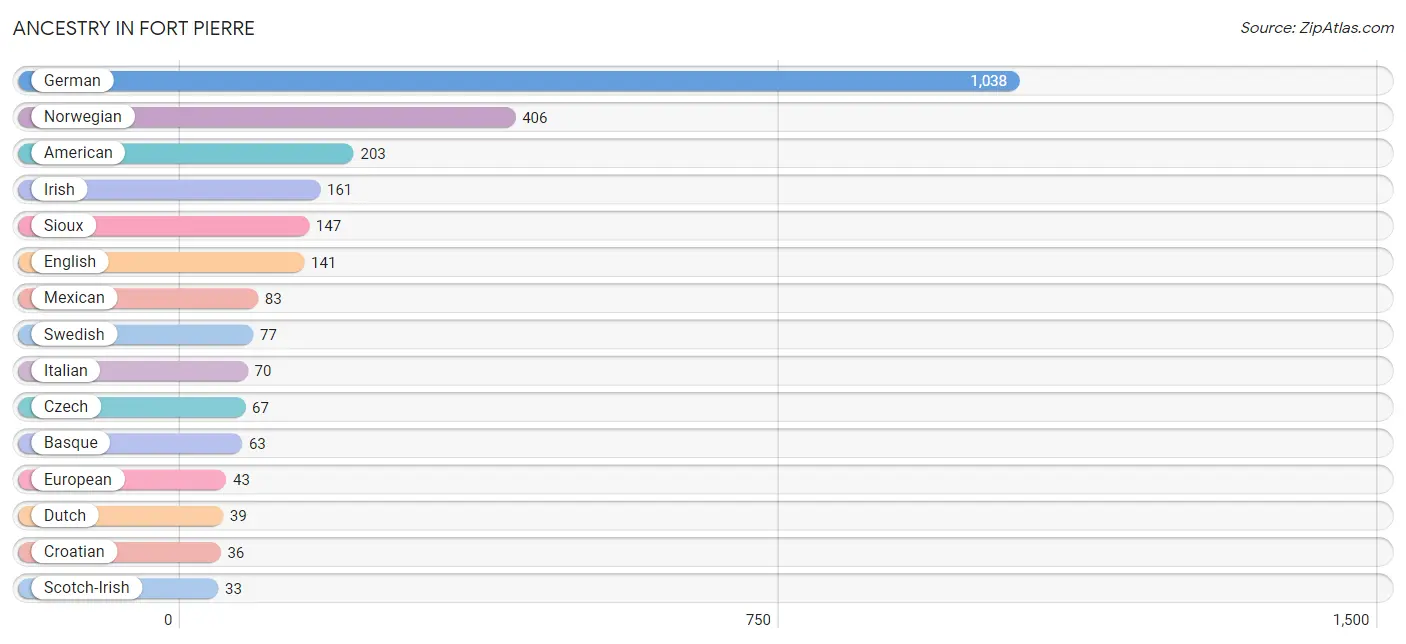
Ancestry in Fort Pierre
The most populous ancestries reported in Fort Pierre are German (1,038 | 41.2%), Norwegian (406 | 16.1%), American (203 | 8.1%), Irish (161 | 6.4%), and Sioux (147 | 5.8%), together accounting for 77.5% of all Fort Pierre residents.
| Ancestry | # Population | % Population |
| American | 203 | 8.1% |
| Basque | 63 | 2.5% |
| Belgian | 2 | 0.1% |
| British | 9 | 0.4% |
| Canadian | 17 | 0.7% |
| Croatian | 36 | 1.4% |
| Czech | 67 | 2.7% |
| Czechoslovakian | 4 | 0.2% |
| Danish | 6 | 0.2% |
| Dutch | 39 | 1.5% |
| English | 141 | 5.6% |
| European | 43 | 1.7% |
| French | 31 | 1.2% |
| French Canadian | 29 | 1.1% |
| German | 1,038 | 41.2% |
| Irish | 161 | 6.4% |
| Italian | 70 | 2.8% |
| Mexican | 83 | 3.3% |
| Norwegian | 406 | 16.1% |
| Polish | 25 | 1.0% |
| Russian | 24 | 0.9% |
| Scotch-Irish | 33 | 1.3% |
| Scottish | 32 | 1.3% |
| Sioux | 147 | 5.8% |
| Spanish | 5 | 0.2% |
| Swedish | 77 | 3.0% |
| Welsh | 24 | 0.9% | View All 27 Rows |
Immigrants in Fort Pierre
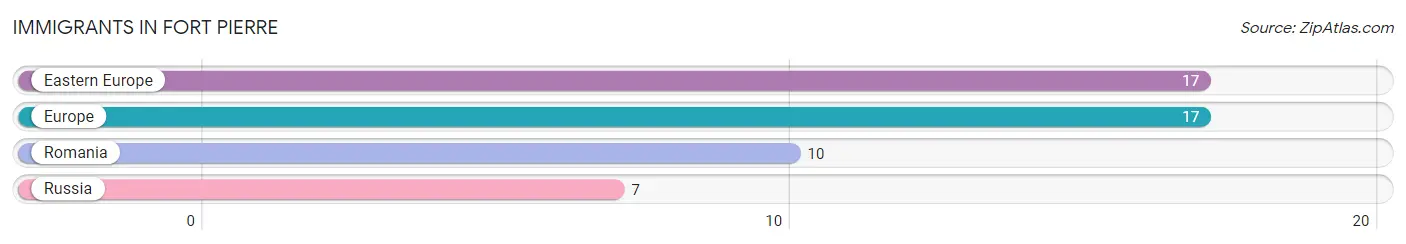
The most numerous immigrant groups reported in Fort Pierre came from Eastern Europe (17 | 0.7%), Europe (17 | 0.7%), Romania (10 | 0.4%), and Russia (7 | 0.3%), together accounting for 2.0% of all Fort Pierre residents.
| Immigration Origin | # Population | % Population |
| Eastern Europe | 17 | 0.7% |
| Europe | 17 | 0.7% |
| Romania | 10 | 0.4% |
| Russia | 7 | 0.3% | View All 4 Rows |
Sex and Age in Fort Pierre
Sex and Age in Fort Pierre
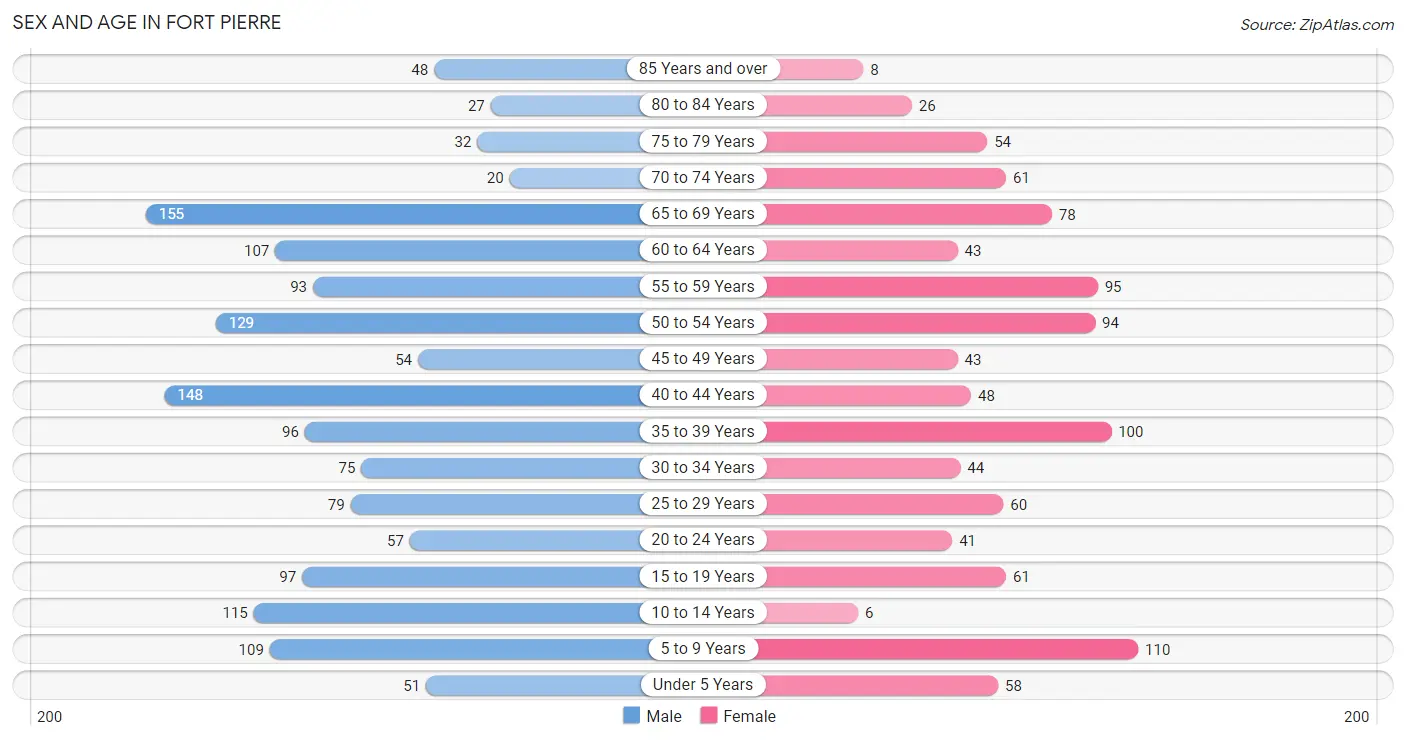
The most populous age groups in Fort Pierre are 65 to 69 Years (155 | 10.4%) for men and 5 to 9 Years (110 | 10.7%) for women.
| Age Bracket | Male | Female |
| Under 5 Years | 51 (3.4%) | 58 (5.6%) |
| 5 to 9 Years | 109 (7.3%) | 110 (10.7%) |
| 10 to 14 Years | 115 (7.7%) | 6 (0.6%) |
| 15 to 19 Years | 97 (6.5%) | 61 (5.9%) |
| 20 to 24 Years | 57 (3.8%) | 41 (4.0%) |
| 25 to 29 Years | 79 (5.3%) | 60 (5.8%) |
| 30 to 34 Years | 75 (5.0%) | 44 (4.3%) |
| 35 to 39 Years | 96 (6.4%) | 100 (9.7%) |
| 40 to 44 Years | 148 (9.9%) | 48 (4.7%) |
| 45 to 49 Years | 54 (3.6%) | 43 (4.2%) |
| 50 to 54 Years | 129 (8.6%) | 94 (9.1%) |
| 55 to 59 Years | 93 (6.2%) | 95 (9.2%) |
| 60 to 64 Years | 107 (7.2%) | 43 (4.2%) |
| 65 to 69 Years | 155 (10.4%) | 78 (7.6%) |
| 70 to 74 Years | 20 (1.3%) | 61 (5.9%) |
| 75 to 79 Years | 32 (2.1%) | 54 (5.2%) |
| 80 to 84 Years | 27 (1.8%) | 26 (2.5%) |
| 85 Years and over | 48 (3.2%) | 8 (0.8%) |
| Total | 1,492 (100.0%) | 1,030 (100.0%) |
Families and Households in Fort Pierre
Median Family Size in Fort Pierre
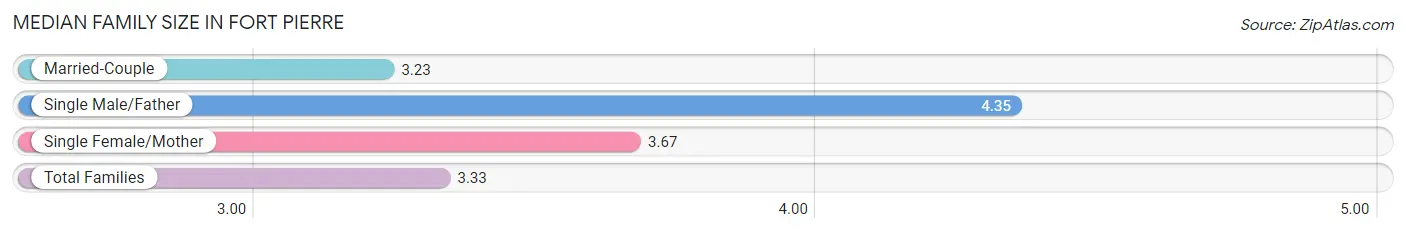
The median family size in Fort Pierre is 3.33 persons per family, with single male/father families (26 | 4.4%) accounting for the largest median family size of 4.35 persons per family. On the other hand, married-couple families (491 | 83.2%) represent the smallest median family size with 3.23 persons per family.
| Family Type | # Families | Family Size |
| Married-Couple | 491 (83.2%) | 3.23 |
| Single Male/Father | 26 (4.4%) | 4.35 |
| Single Female/Mother | 73 (12.4%) | 3.67 |
| Total Families | 590 (100.0%) | 3.33 |
Median Household Size in Fort Pierre
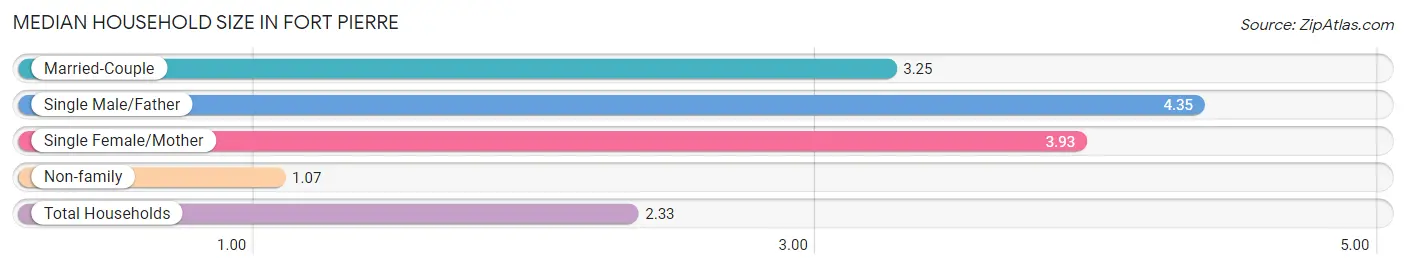
The median household size in Fort Pierre is 2.33 persons per household, with single male/father households (26 | 2.4%) accounting for the largest median household size of 4.35 persons per household. non-family households (491 | 45.4%) represent the smallest median household size with 1.07 persons per household.
| Household Type | # Households | Household Size |
| Married-Couple | 491 (45.4%) | 3.25 |
| Single Male/Father | 26 (2.4%) | 4.35 |
| Single Female/Mother | 73 (6.8%) | 3.93 |
| Non-family | 491 (45.4%) | 1.07 |
| Total Households | 1,081 (100.0%) | 2.33 |
Household Size by Marriage Status in Fort Pierre
Out of a total of 1,081 households in Fort Pierre, 590 (54.6%) are family households, while 491 (45.4%) are nonfamily households. The most numerous type of family households are 2-person households, comprising 314, and the most common type of nonfamily households are 1-person households, comprising 453.
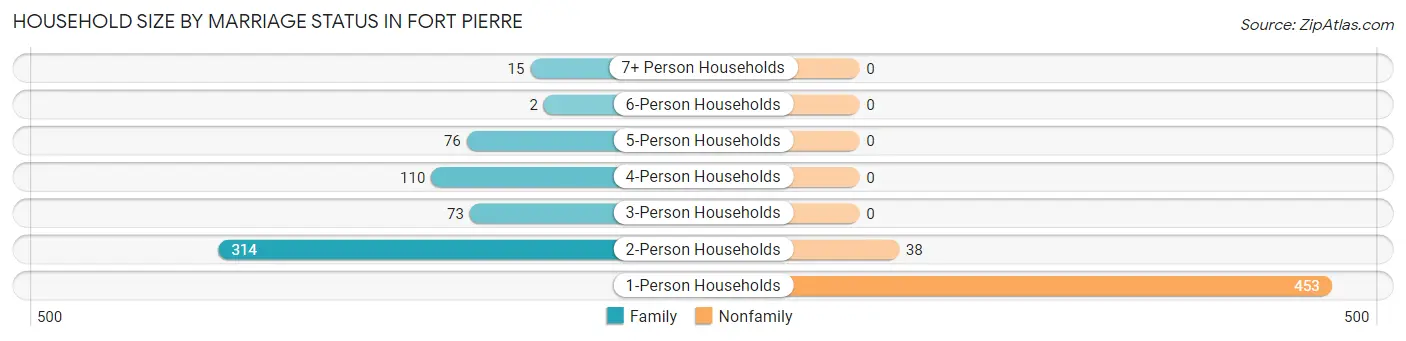
| Household Size | Family Households | Nonfamily Households |
| 1-Person Households | - | 453 (41.9%) |
| 2-Person Households | 314 (29.0%) | 38 (3.5%) |
| 3-Person Households | 73 (6.8%) | 0 (0.0%) |
| 4-Person Households | 110 (10.2%) | 0 (0.0%) |
| 5-Person Households | 76 (7.0%) | 0 (0.0%) |
| 6-Person Households | 2 (0.2%) | 0 (0.0%) |
| 7+ Person Households | 15 (1.4%) | 0 (0.0%) |
| Total | 590 (54.6%) | 491 (45.4%) |
Female Fertility in Fort Pierre
Fertility by Age in Fort Pierre
| Age Bracket | Women with Births | Births / 1,000 Women |
| 15 to 19 years | 0 (0.0%) | 0.0 |
| 20 to 34 years | 0 (0.0%) | 0.0 |
| 35 to 50 years | 0 (0.0%) | 0.0 |
| Total | 0 (0.0%) | 0.0 |
Fertility by Age by Marriage Status in Fort Pierre
| Age Bracket | Married | Unmarried |
| 15 to 19 years | 0 (0.0%) | 0 (0.0%) |
| 20 to 34 years | 0 (0.0%) | 0 (0.0%) |
| 35 to 50 years | 0 (0.0%) | 0 (0.0%) |
| Total | 0 (0.0%) | 0 (0.0%) |
Fertility by Education in Fort Pierre
| Educational Attainment | Women with Births | Births / 1,000 Women |
| Less than High School | 0 (0.0%) | 0.0 |
| High School Diploma | 0 (0.0%) | 0.0 |
| College or Associate's Degree | 0 (0.0%) | 0.0 |
| Bachelor's Degree | 0 (0.0%) | 0.0 |
| Graduate Degree | 0 (0.0%) | 0.0 |
| Total | 0 (0.0%) | 0.0 |
Fertility by Education by Marriage Status in Fort Pierre
| Educational Attainment | Married | Unmarried |
| Less than High School | 0 (0.0%) | 0 (0.0%) |
| High School Diploma | 0 (0.0%) | 0 (0.0%) |
| College or Associate's Degree | 0 (0.0%) | 0 (0.0%) |
| Bachelor's Degree | 0 (0.0%) | 0 (0.0%) |
| Graduate Degree | 0 (0.0%) | 0 (0.0%) |
| Total | 0 (0.0%) | 0 (0.0%) |
Employment Characteristics in Fort Pierre
Employment by Class of Employer in Fort Pierre
Among the 1,472 employed individuals in Fort Pierre, private company employees (686 | 46.6%), state government employees (303 | 20.6%), and local government employees (219 | 14.9%) make up the most common classes of employment.
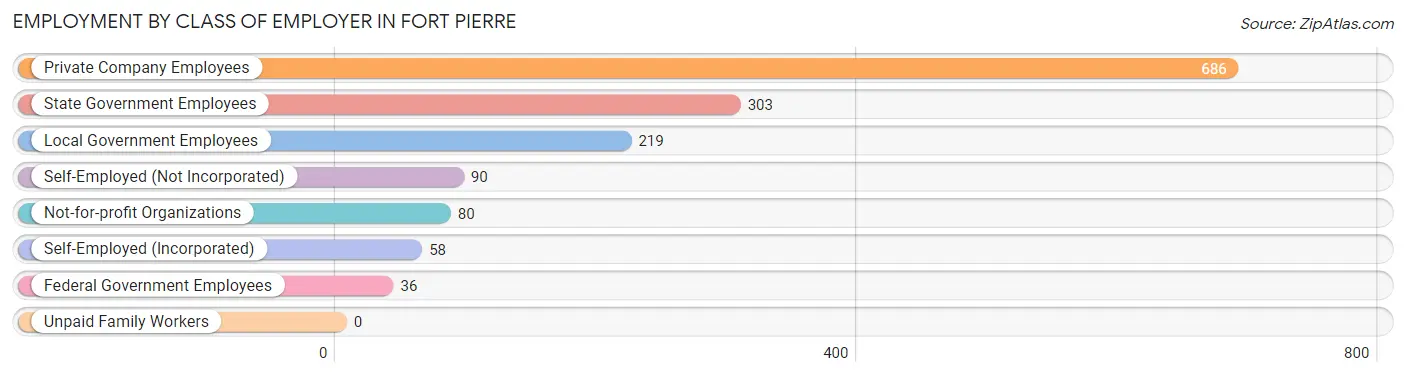
| Employer Class | # Employees | % Employees |
| Private Company Employees | 686 | 46.6% |
| Self-Employed (Incorporated) | 58 | 3.9% |
| Self-Employed (Not Incorporated) | 90 | 6.1% |
| Not-for-profit Organizations | 80 | 5.4% |
| Local Government Employees | 219 | 14.9% |
| State Government Employees | 303 | 20.6% |
| Federal Government Employees | 36 | 2.5% |
| Unpaid Family Workers | 0 | 0.0% |
| Total | 1,472 | 100.0% |
Employment Status by Age in Fort Pierre
According to the labor force statistics for Fort Pierre, out of the total population over 16 years of age (1,999), 74.6% or 1,491 individuals are in the labor force, with 0.2% or 3 of them unemployed. The age group with the highest labor force participation rate is 30 to 34 years, with 100.0% or 119 individuals in the labor force. Within the labor force, the 20 to 24 years age range has the highest percentage of unemployed individuals, with 3.9% or 3 of them being unemployed.
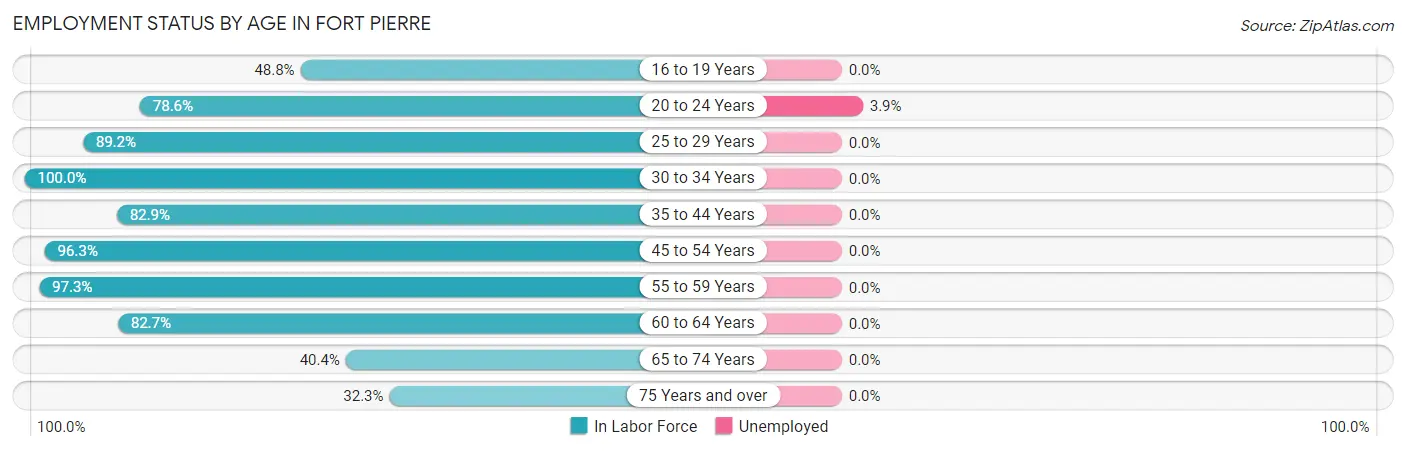
| Age Bracket | In Labor Force | Unemployed |
| 16 to 19 Years | 41 (48.8%) | 0 (0.0%) |
| 20 to 24 Years | 77 (78.6%) | 3 (3.9%) |
| 25 to 29 Years | 124 (89.2%) | 0 (0.0%) |
| 30 to 34 Years | 119 (100.0%) | 0 (0.0%) |
| 35 to 44 Years | 325 (82.9%) | 0 (0.0%) |
| 45 to 54 Years | 308 (96.3%) | 0 (0.0%) |
| 55 to 59 Years | 183 (97.3%) | 0 (0.0%) |
| 60 to 64 Years | 124 (82.7%) | 0 (0.0%) |
| 65 to 74 Years | 127 (40.4%) | 0 (0.0%) |
| 75 Years and over | 63 (32.3%) | 0 (0.0%) |
| Total | 1,491 (74.6%) | 3 (0.2%) |
Employment Status by Educational Attainment in Fort Pierre
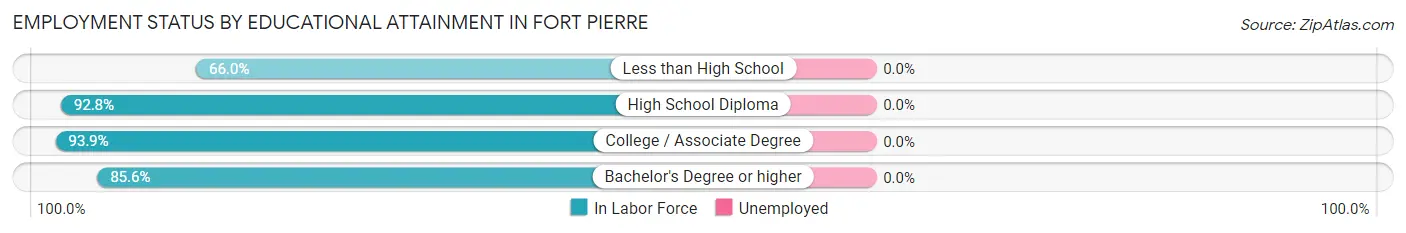
| Educational Attainment | In Labor Force | Unemployed |
| Less than High School | 35 (66.0%) | 0 (0.0%) |
| High School Diploma | 479 (92.8%) | 0 (0.0%) |
| College / Associate Degree | 414 (93.9%) | 0 (0.0%) |
| Bachelor's Degree or higher | 255 (85.6%) | 0 (0.0%) |
| Total | 1,182 (90.4%) | 0 (0.0%) |
Employment Occupations by Sex in Fort Pierre
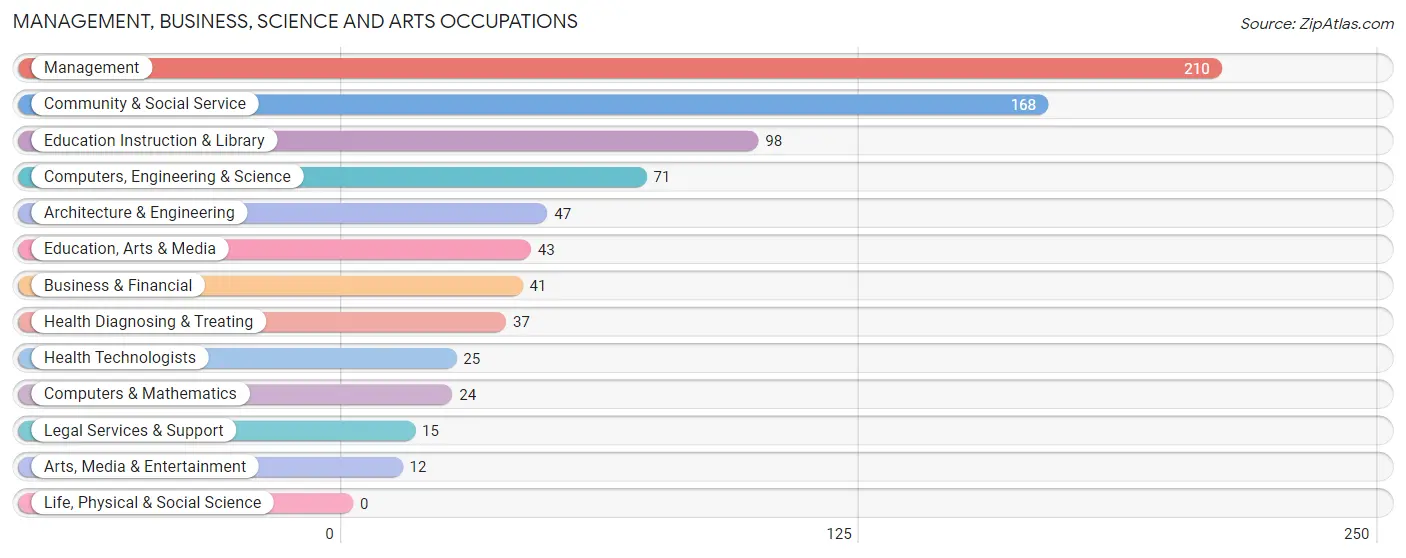
Management, Business, Science and Arts Occupations
The most common Management, Business, Science and Arts occupations in Fort Pierre are Management (210 | 14.1%), Community & Social Service (168 | 11.3%), Education Instruction & Library (98 | 6.6%), Computers, Engineering & Science (71 | 4.8%), and Architecture & Engineering (47 | 3.2%).
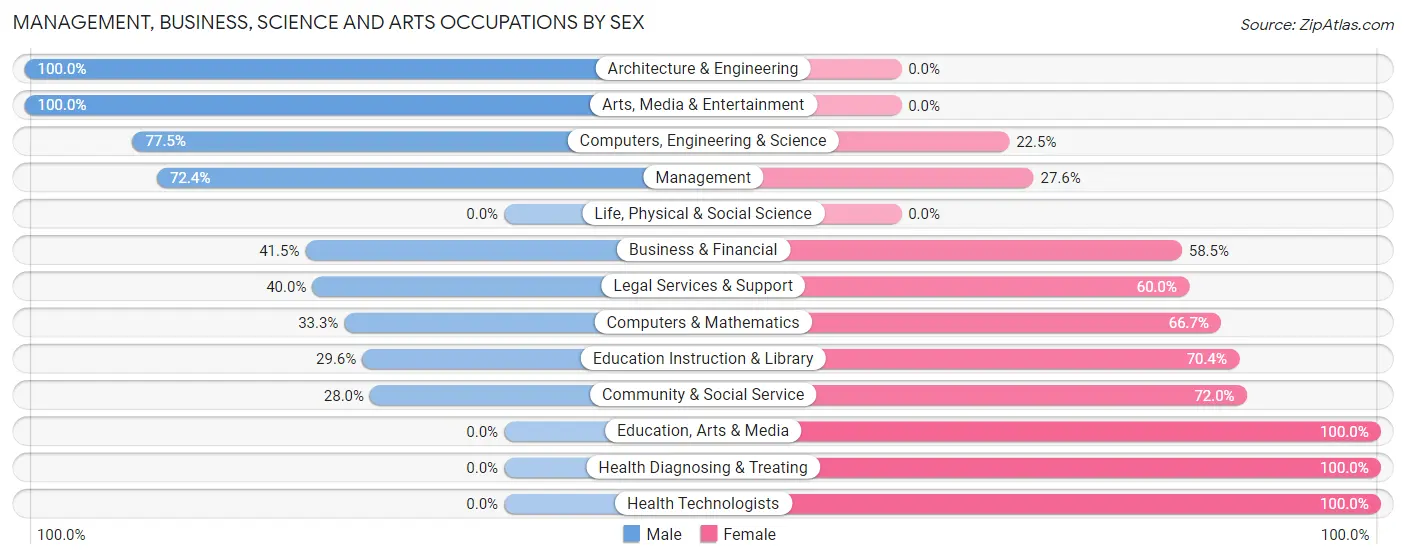
Management, Business, Science and Arts Occupations by Sex
Within the Management, Business, Science and Arts occupations in Fort Pierre, the most male-oriented occupations are Architecture & Engineering (100.0%), Arts, Media & Entertainment (100.0%), and Computers, Engineering & Science (77.5%), while the most female-oriented occupations are Education, Arts & Media (100.0%), Health Diagnosing & Treating (100.0%), and Health Technologists (100.0%).
| Occupation | Male | Female |
| Management | 152 (72.4%) | 58 (27.6%) |
| Business & Financial | 17 (41.5%) | 24 (58.5%) |
| Computers, Engineering & Science | 55 (77.5%) | 16 (22.5%) |
| Computers & Mathematics | 8 (33.3%) | 16 (66.7%) |
| Architecture & Engineering | 47 (100.0%) | 0 (0.0%) |
| Life, Physical & Social Science | 0 (0.0%) | 0 (0.0%) |
| Community & Social Service | 47 (28.0%) | 121 (72.0%) |
| Education, Arts & Media | 0 (0.0%) | 43 (100.0%) |
| Legal Services & Support | 6 (40.0%) | 9 (60.0%) |
| Education Instruction & Library | 29 (29.6%) | 69 (70.4%) |
| Arts, Media & Entertainment | 12 (100.0%) | 0 (0.0%) |
| Health Diagnosing & Treating | 0 (0.0%) | 37 (100.0%) |
| Health Technologists | 0 (0.0%) | 25 (100.0%) |
| Total (Category) | 271 (51.4%) | 256 (48.6%) |
| Total (Overall) | 865 (58.1%) | 623 (41.9%) |
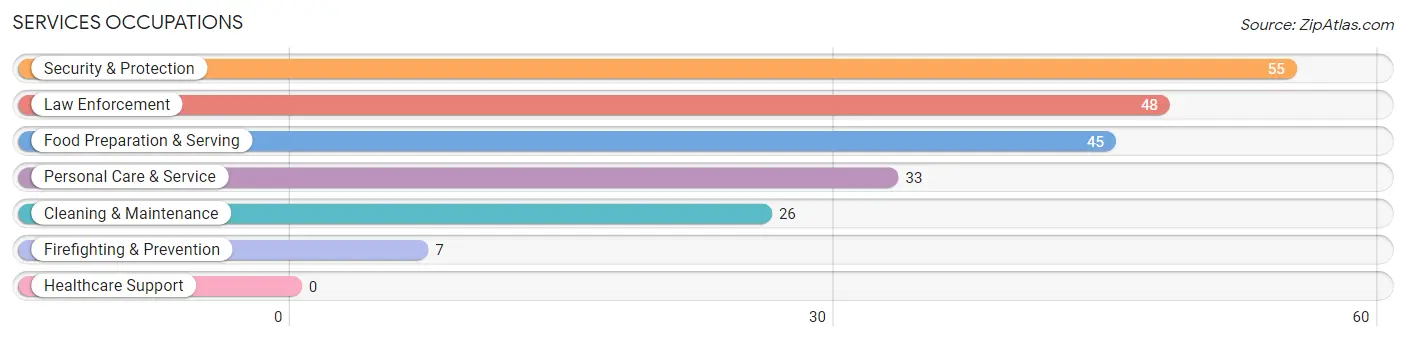
Services Occupations
The most common Services occupations in Fort Pierre are Security & Protection (55 | 3.7%), Law Enforcement (48 | 3.2%), Food Preparation & Serving (45 | 3.0%), Personal Care & Service (33 | 2.2%), and Cleaning & Maintenance (26 | 1.8%).
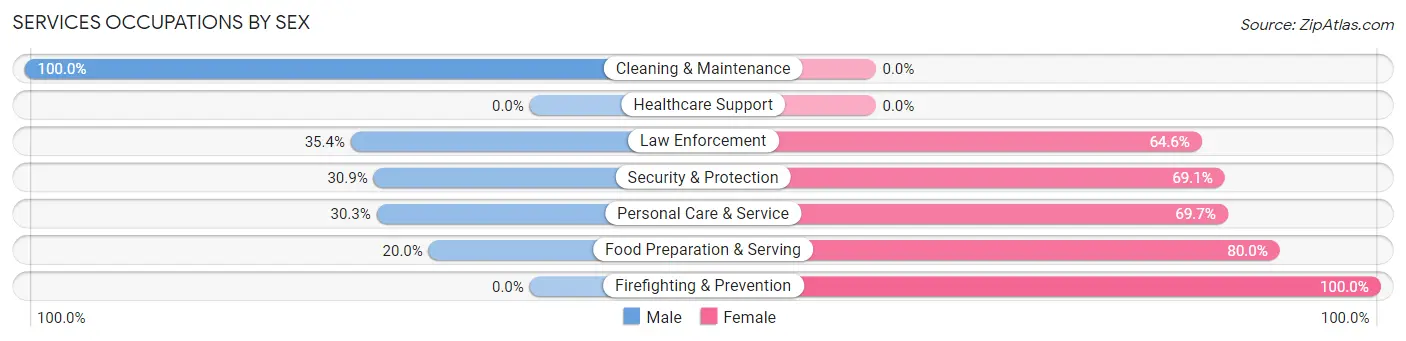
Services Occupations by Sex
Within the Services occupations in Fort Pierre, the most male-oriented occupations are Cleaning & Maintenance (100.0%), Law Enforcement (35.4%), and Security & Protection (30.9%), while the most female-oriented occupations are Firefighting & Prevention (100.0%), Food Preparation & Serving (80.0%), and Personal Care & Service (69.7%).
| Occupation | Male | Female |
| Healthcare Support | 0 (0.0%) | 0 (0.0%) |
| Security & Protection | 17 (30.9%) | 38 (69.1%) |
| Firefighting & Prevention | 0 (0.0%) | 7 (100.0%) |
| Law Enforcement | 17 (35.4%) | 31 (64.6%) |
| Food Preparation & Serving | 9 (20.0%) | 36 (80.0%) |
| Cleaning & Maintenance | 26 (100.0%) | 0 (0.0%) |
| Personal Care & Service | 10 (30.3%) | 23 (69.7%) |
| Total (Category) | 62 (39.0%) | 97 (61.0%) |
| Total (Overall) | 865 (58.1%) | 623 (41.9%) |
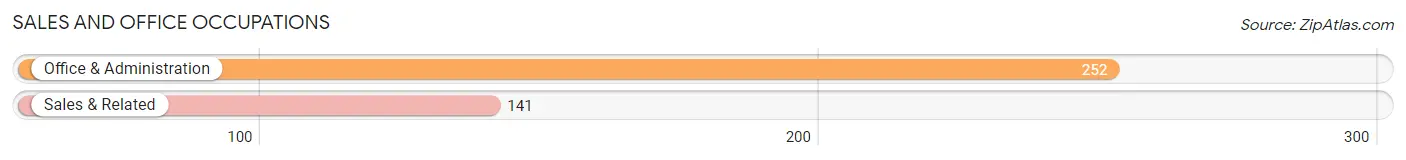
Sales and Office Occupations
The most common Sales and Office occupations in Fort Pierre are Office & Administration (252 | 16.9%), and Sales & Related (141 | 9.5%).
Sales and Office Occupations by Sex
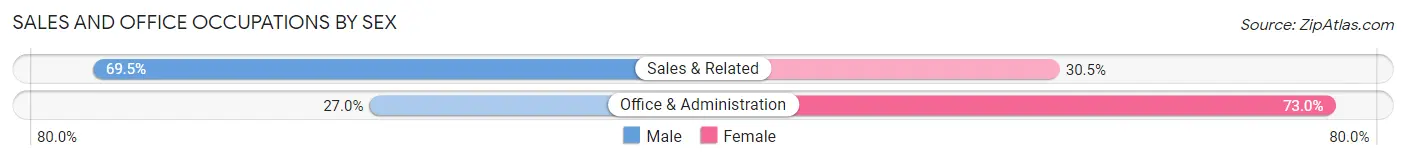
| Occupation | Male | Female |
| Sales & Related | 98 (69.5%) | 43 (30.5%) |
| Office & Administration | 68 (27.0%) | 184 (73.0%) |
| Total (Category) | 166 (42.2%) | 227 (57.8%) |
| Total (Overall) | 865 (58.1%) | 623 (41.9%) |
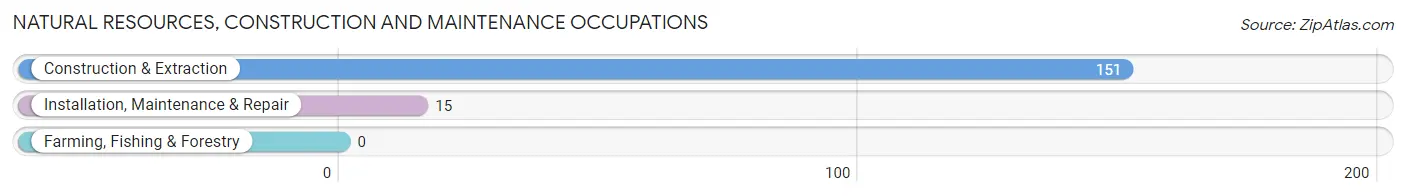
Natural Resources, Construction and Maintenance Occupations
The most common Natural Resources, Construction and Maintenance occupations in Fort Pierre are Construction & Extraction (151 | 10.2%), and Installation, Maintenance & Repair (15 | 1.0%).
Natural Resources, Construction and Maintenance Occupations by Sex
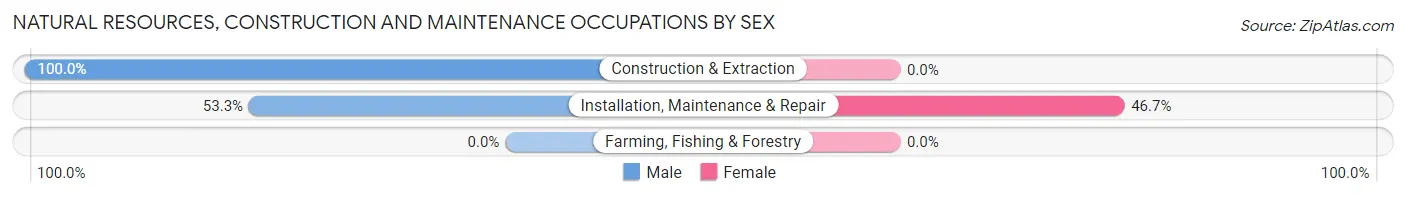
| Occupation | Male | Female |
| Farming, Fishing & Forestry | 0 (0.0%) | 0 (0.0%) |
| Construction & Extraction | 151 (100.0%) | 0 (0.0%) |
| Installation, Maintenance & Repair | 8 (53.3%) | 7 (46.7%) |
| Total (Category) | 159 (95.8%) | 7 (4.2%) |
| Total (Overall) | 865 (58.1%) | 623 (41.9%) |
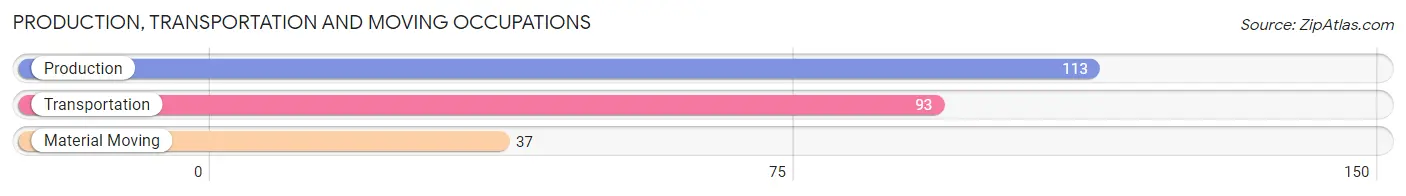
Production, Transportation and Moving Occupations
The most common Production, Transportation and Moving occupations in Fort Pierre are Production (113 | 7.6%), Transportation (93 | 6.2%), and Material Moving (37 | 2.5%).
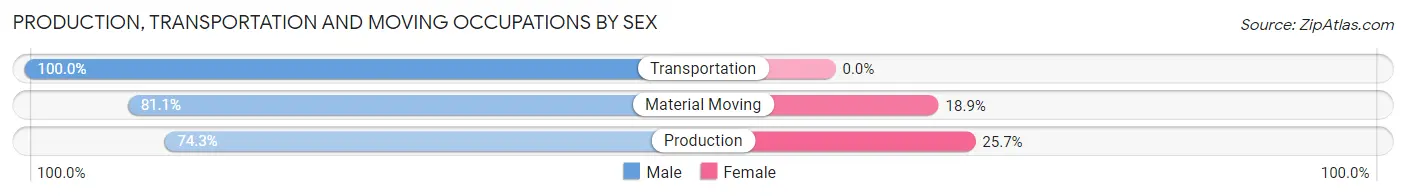
Production, Transportation and Moving Occupations by Sex
| Occupation | Male | Female |
| Production | 84 (74.3%) | 29 (25.7%) |
| Transportation | 93 (100.0%) | 0 (0.0%) |
| Material Moving | 30 (81.1%) | 7 (18.9%) |
| Total (Category) | 207 (85.2%) | 36 (14.8%) |
| Total (Overall) | 865 (58.1%) | 623 (41.9%) |
Employment Industries by Sex in Fort Pierre
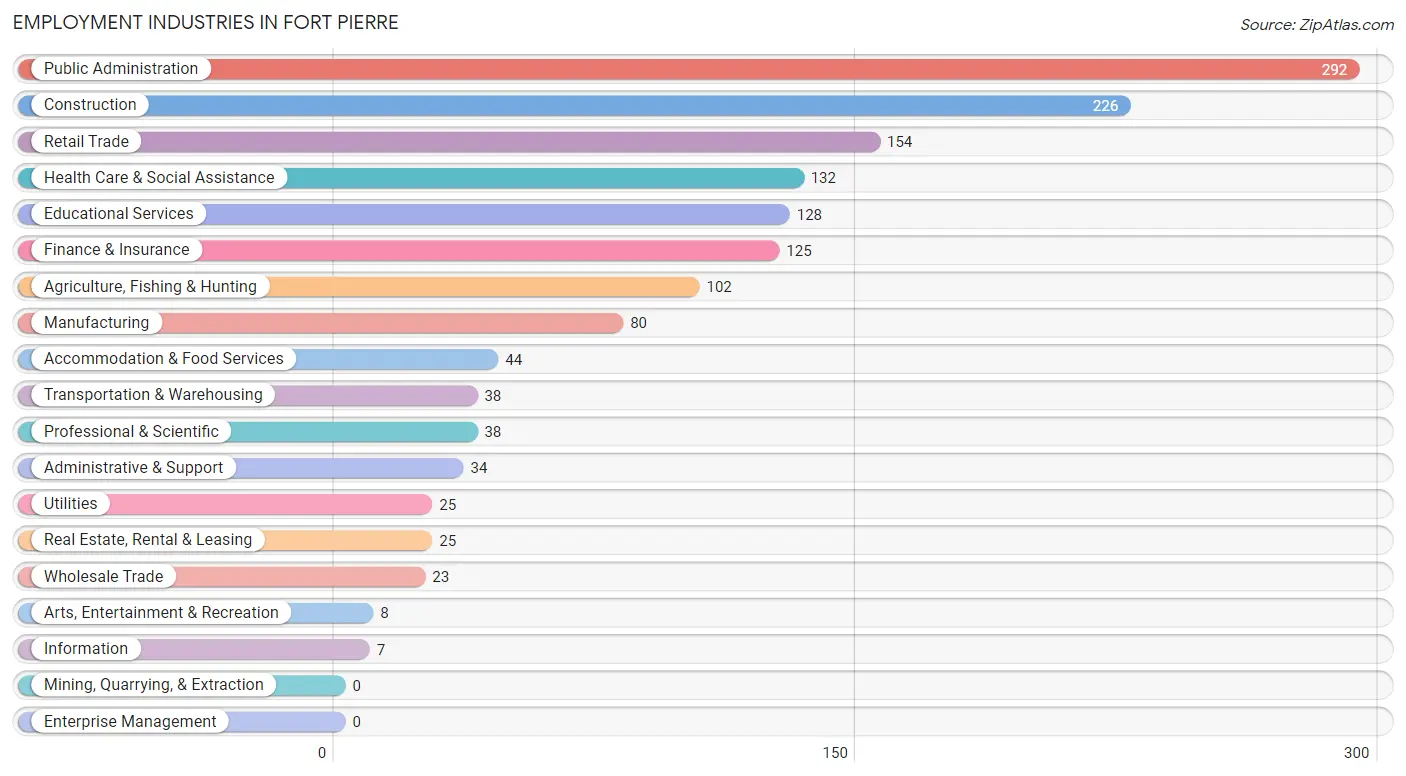
Employment Industries in Fort Pierre
The major employment industries in Fort Pierre include Public Administration (292 | 19.6%), Construction (226 | 15.2%), Retail Trade (154 | 10.3%), Health Care & Social Assistance (132 | 8.9%), and Educational Services (128 | 8.6%).
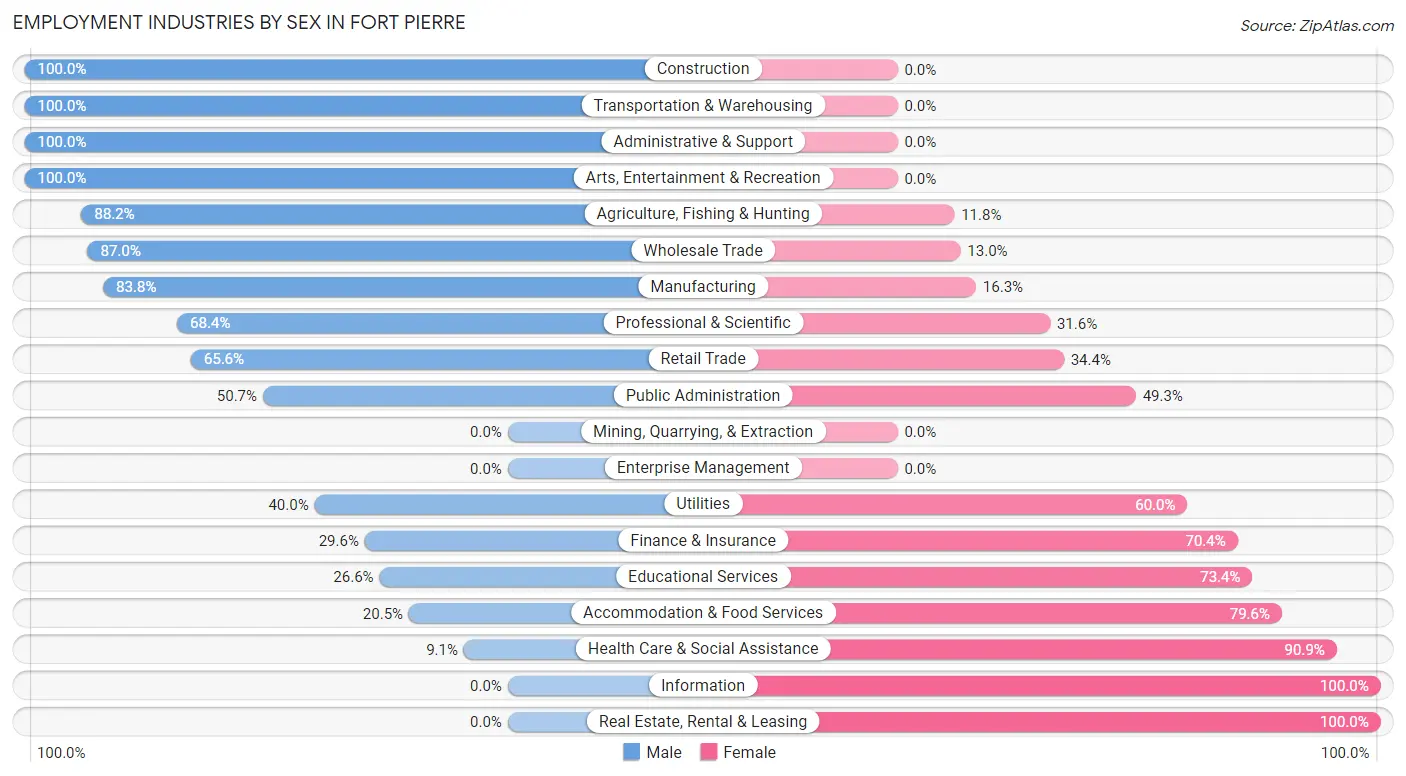
Employment Industries by Sex in Fort Pierre
The Fort Pierre industries that see more men than women are Construction (100.0%), Transportation & Warehousing (100.0%), and Administrative & Support (100.0%), whereas the industries that tend to have a higher number of women are Information (100.0%), Real Estate, Rental & Leasing (100.0%), and Health Care & Social Assistance (90.9%).
| Industry | Male | Female |
| Agriculture, Fishing & Hunting | 90 (88.2%) | 12 (11.8%) |
| Mining, Quarrying, & Extraction | 0 (0.0%) | 0 (0.0%) |
| Construction | 226 (100.0%) | 0 (0.0%) |
| Manufacturing | 67 (83.8%) | 13 (16.3%) |
| Wholesale Trade | 20 (87.0%) | 3 (13.0%) |
| Retail Trade | 101 (65.6%) | 53 (34.4%) |
| Transportation & Warehousing | 38 (100.0%) | 0 (0.0%) |
| Utilities | 10 (40.0%) | 15 (60.0%) |
| Information | 0 (0.0%) | 7 (100.0%) |
| Finance & Insurance | 37 (29.6%) | 88 (70.4%) |
| Real Estate, Rental & Leasing | 0 (0.0%) | 25 (100.0%) |
| Professional & Scientific | 26 (68.4%) | 12 (31.6%) |
| Enterprise Management | 0 (0.0%) | 0 (0.0%) |
| Administrative & Support | 34 (100.0%) | 0 (0.0%) |
| Educational Services | 34 (26.6%) | 94 (73.4%) |
| Health Care & Social Assistance | 12 (9.1%) | 120 (90.9%) |
| Arts, Entertainment & Recreation | 8 (100.0%) | 0 (0.0%) |
| Accommodation & Food Services | 9 (20.4%) | 35 (79.5%) |
| Public Administration | 148 (50.7%) | 144 (49.3%) |
| Total | 865 (58.1%) | 623 (41.9%) |
Education in Fort Pierre
School Enrollment in Fort Pierre
The most common levels of schooling among the 567 students in Fort Pierre are elementary school (171 | 30.2%), high school (155 | 27.3%), and nursery / preschool (94 | 16.6%).
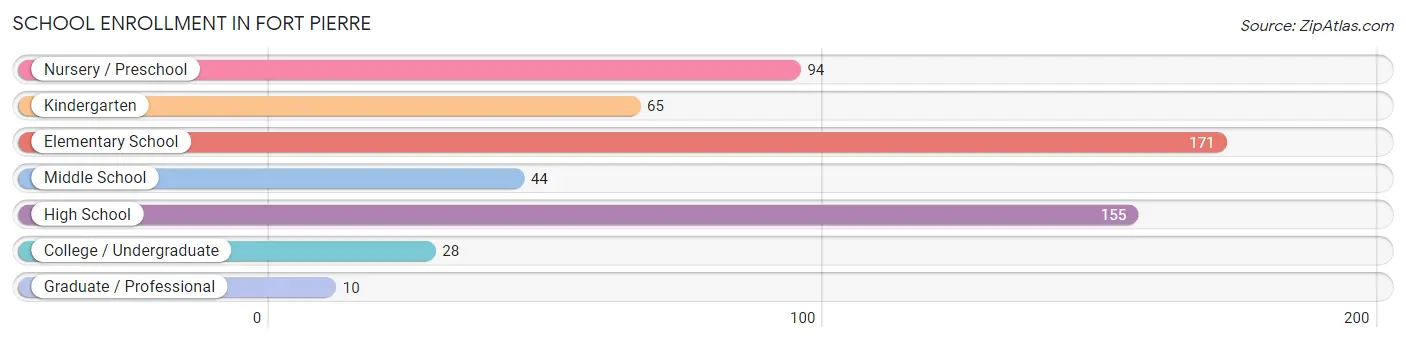
| School Level | # Students | % Students |
| Nursery / Preschool | 94 | 16.6% |
| Kindergarten | 65 | 11.5% |
| Elementary School | 171 | 30.2% |
| Middle School | 44 | 7.8% |
| High School | 155 | 27.3% |
| College / Undergraduate | 28 | 4.9% |
| Graduate / Professional | 10 | 1.8% |
| Total | 567 | 100.0% |
School Enrollment by Age by Funding Source in Fort Pierre
Out of a total of 567 students who are enrolled in schools in Fort Pierre, 79 (13.9%) attend a private institution, while the remaining 488 (86.1%) are enrolled in public schools. The age group of 3 to 4 year olds has the highest likelihood of being enrolled in private schools, with 45 (72.6% in the age bracket) enrolled. Conversely, the age group of 15 to 17 year olds has the lowest likelihood of being enrolled in a private school, with 131 (100.0% in the age bracket) attending a public institution.
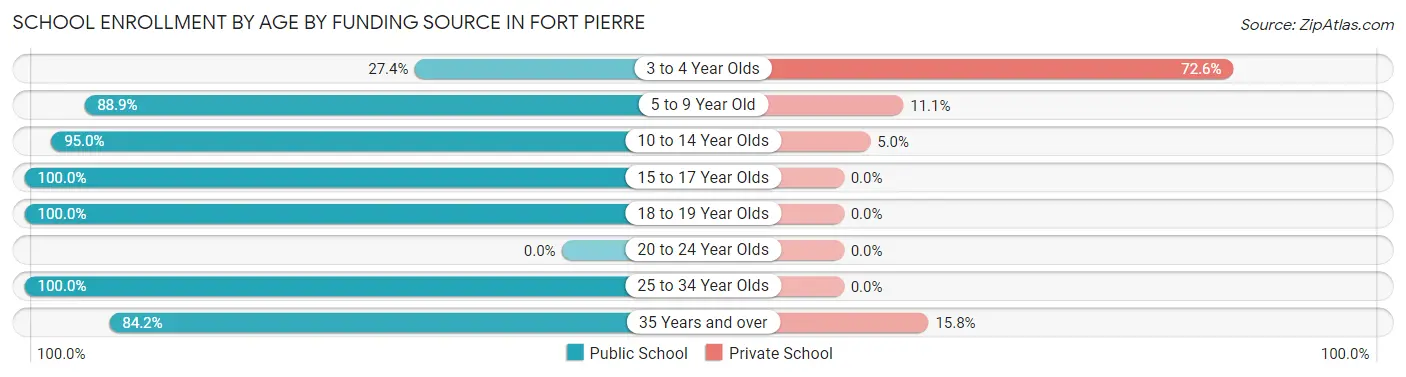
| Age Bracket | Public School | Private School |
| 3 to 4 Year Olds | 17 (27.4%) | 45 (72.6%) |
| 5 to 9 Year Old | 176 (88.9%) | 22 (11.1%) |
| 10 to 14 Year Olds | 115 (95.0%) | 6 (5.0%) |
| 15 to 17 Year Olds | 131 (100.0%) | 0 (0.0%) |
| 18 to 19 Year Olds | 12 (100.0%) | 0 (0.0%) |
| 20 to 24 Year Olds | 0 (0.0%) | 0 (0.0%) |
| 25 to 34 Year Olds | 5 (100.0%) | 0 (0.0%) |
| 35 Years and over | 32 (84.2%) | 6 (15.8%) |
| Total | 488 (86.1%) | 79 (13.9%) |
Educational Attainment by Field of Study in Fort Pierre
Education (149 | 26.9%), business (104 | 18.7%), arts & humanities (47 | 8.5%), psychology (43 | 7.7%), and engineering (38 | 6.9%) are the most common fields of study among 555 individuals in Fort Pierre who have obtained a bachelor's degree or higher.
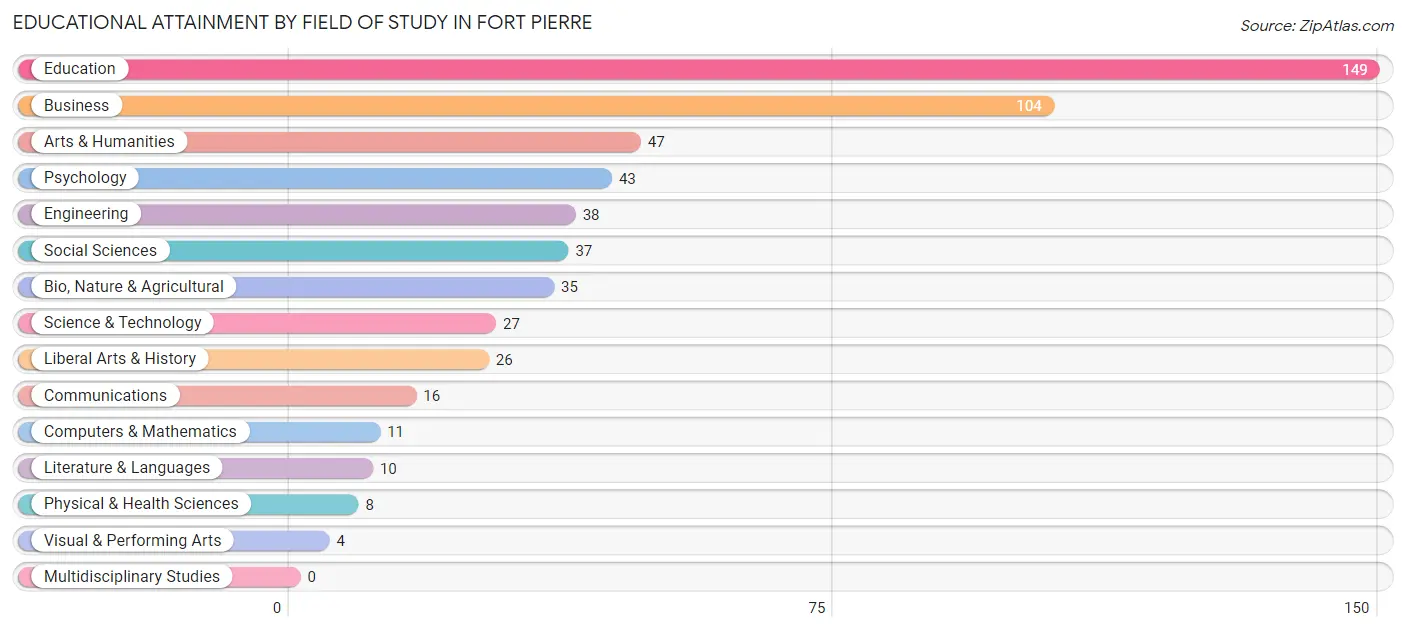
| Field of Study | # Graduates | % Graduates |
| Computers & Mathematics | 11 | 2.0% |
| Bio, Nature & Agricultural | 35 | 6.3% |
| Physical & Health Sciences | 8 | 1.4% |
| Psychology | 43 | 7.7% |
| Social Sciences | 37 | 6.7% |
| Engineering | 38 | 6.9% |
| Multidisciplinary Studies | 0 | 0.0% |
| Science & Technology | 27 | 4.9% |
| Business | 104 | 18.7% |
| Education | 149 | 26.9% |
| Literature & Languages | 10 | 1.8% |
| Liberal Arts & History | 26 | 4.7% |
| Visual & Performing Arts | 4 | 0.7% |
| Communications | 16 | 2.9% |
| Arts & Humanities | 47 | 8.5% |
| Total | 555 | 100.0% |
Transportation & Commute in Fort Pierre
Vehicle Availability by Sex in Fort Pierre
The most prevalent vehicle ownership categories in Fort Pierre are males with 2 vehicles (474, accounting for 55.0%) and females with 2 vehicles (284, making up 77.7%).
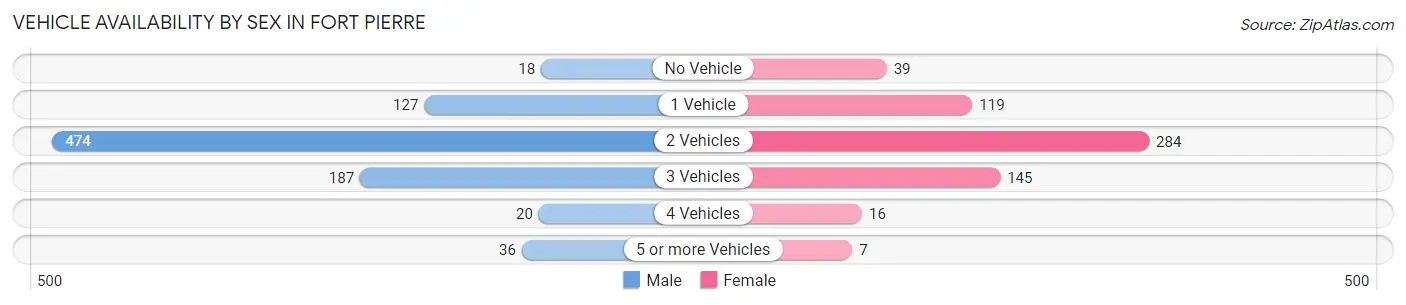
| Vehicles Available | Male | Female |
| No Vehicle | 18 (2.1%) | 39 (6.4%) |
| 1 Vehicle | 127 (14.7%) | 119 (19.5%) |
| 2 Vehicles | 474 (55.0%) | 284 (46.6%) |
| 3 Vehicles | 187 (21.7%) | 145 (23.8%) |
| 4 Vehicles | 20 (2.3%) | 16 (2.6%) |
| 5 or more Vehicles | 36 (4.2%) | 7 (1.1%) |
| Total | 862 (100.0%) | 610 (100.0%) |
Commute Time in Fort Pierre
The most frequently occuring commute durations in Fort Pierre are 15 to 19 minutes (380 commuters, 27.1%), 5 to 9 minutes (358 commuters, 25.5%), and 10 to 14 minutes (357 commuters, 25.5%).
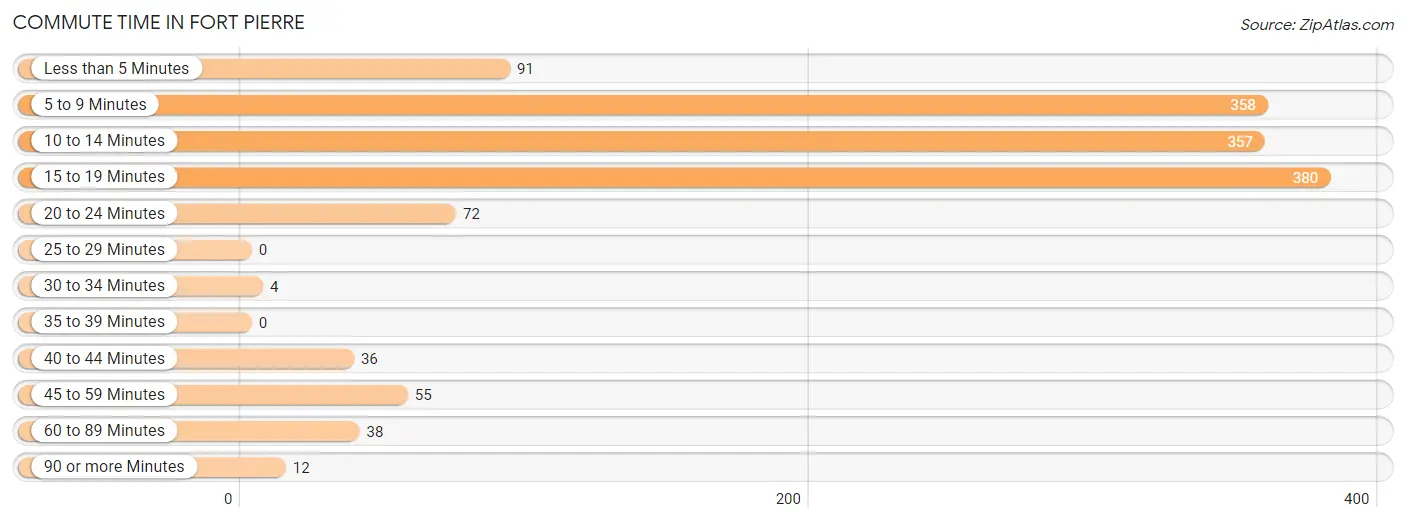
| Commute Time | # Commuters | % Commuters |
| Less than 5 Minutes | 91 | 6.5% |
| 5 to 9 Minutes | 358 | 25.5% |
| 10 to 14 Minutes | 357 | 25.5% |
| 15 to 19 Minutes | 380 | 27.1% |
| 20 to 24 Minutes | 72 | 5.1% |
| 25 to 29 Minutes | 0 | 0.0% |
| 30 to 34 Minutes | 4 | 0.3% |
| 35 to 39 Minutes | 0 | 0.0% |
| 40 to 44 Minutes | 36 | 2.6% |
| 45 to 59 Minutes | 55 | 3.9% |
| 60 to 89 Minutes | 38 | 2.7% |
| 90 or more Minutes | 12 | 0.9% |
Commute Time by Sex in Fort Pierre
The most common commute times in Fort Pierre are 15 to 19 minutes (221 commuters, 27.5%) for males and 10 to 14 minutes (166 commuters, 27.8%) for females.
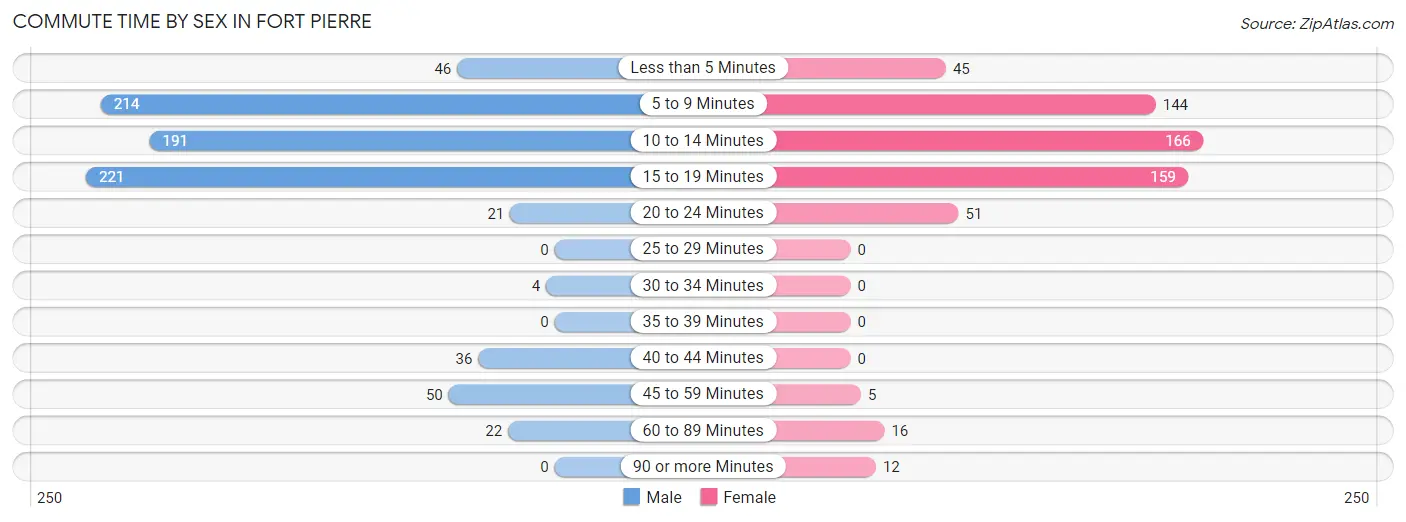
| Commute Time | Male | Female |
| Less than 5 Minutes | 46 (5.7%) | 45 (7.5%) |
| 5 to 9 Minutes | 214 (26.6%) | 144 (24.1%) |
| 10 to 14 Minutes | 191 (23.7%) | 166 (27.8%) |
| 15 to 19 Minutes | 221 (27.5%) | 159 (26.6%) |
| 20 to 24 Minutes | 21 (2.6%) | 51 (8.5%) |
| 25 to 29 Minutes | 0 (0.0%) | 0 (0.0%) |
| 30 to 34 Minutes | 4 (0.5%) | 0 (0.0%) |
| 35 to 39 Minutes | 0 (0.0%) | 0 (0.0%) |
| 40 to 44 Minutes | 36 (4.5%) | 0 (0.0%) |
| 45 to 59 Minutes | 50 (6.2%) | 5 (0.8%) |
| 60 to 89 Minutes | 22 (2.7%) | 16 (2.7%) |
| 90 or more Minutes | 0 (0.0%) | 12 (2.0%) |
Time of Departure to Work by Sex in Fort Pierre
The most frequent times of departure to work in Fort Pierre are 7:30 AM to 7:59 AM (267, 33.2%) for males and 7:30 AM to 7:59 AM (344, 57.5%) for females.
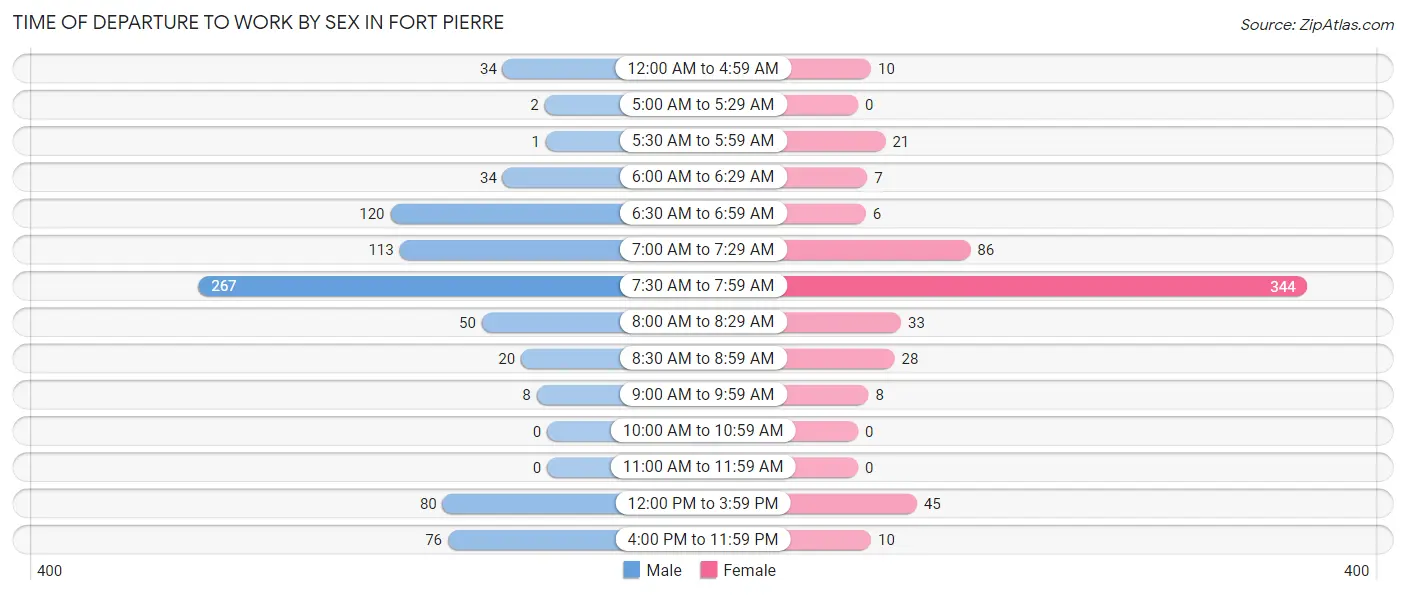
| Time of Departure | Male | Female |
| 12:00 AM to 4:59 AM | 34 (4.2%) | 10 (1.7%) |
| 5:00 AM to 5:29 AM | 2 (0.3%) | 0 (0.0%) |
| 5:30 AM to 5:59 AM | 1 (0.1%) | 21 (3.5%) |
| 6:00 AM to 6:29 AM | 34 (4.2%) | 7 (1.2%) |
| 6:30 AM to 6:59 AM | 120 (14.9%) | 6 (1.0%) |
| 7:00 AM to 7:29 AM | 113 (14.0%) | 86 (14.4%) |
| 7:30 AM to 7:59 AM | 267 (33.2%) | 344 (57.5%) |
| 8:00 AM to 8:29 AM | 50 (6.2%) | 33 (5.5%) |
| 8:30 AM to 8:59 AM | 20 (2.5%) | 28 (4.7%) |
| 9:00 AM to 9:59 AM | 8 (1.0%) | 8 (1.3%) |
| 10:00 AM to 10:59 AM | 0 (0.0%) | 0 (0.0%) |
| 11:00 AM to 11:59 AM | 0 (0.0%) | 0 (0.0%) |
| 12:00 PM to 3:59 PM | 80 (9.9%) | 45 (7.5%) |
| 4:00 PM to 11:59 PM | 76 (9.4%) | 10 (1.7%) |
| Total | 805 (100.0%) | 598 (100.0%) |
Housing Occupancy in Fort Pierre
Occupancy by Ownership in Fort Pierre
Of the total 1,081 dwellings in Fort Pierre, owner-occupied units account for 888 (82.2%), while renter-occupied units make up 193 (17.8%).
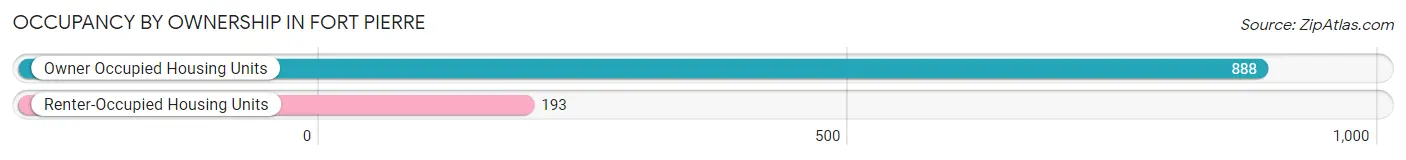
| Occupancy | # Housing Units | % Housing Units |
| Owner Occupied Housing Units | 888 | 82.2% |
| Renter-Occupied Housing Units | 193 | 17.8% |
| Total Occupied Housing Units | 1,081 | 100.0% |
Occupancy by Household Size in Fort Pierre
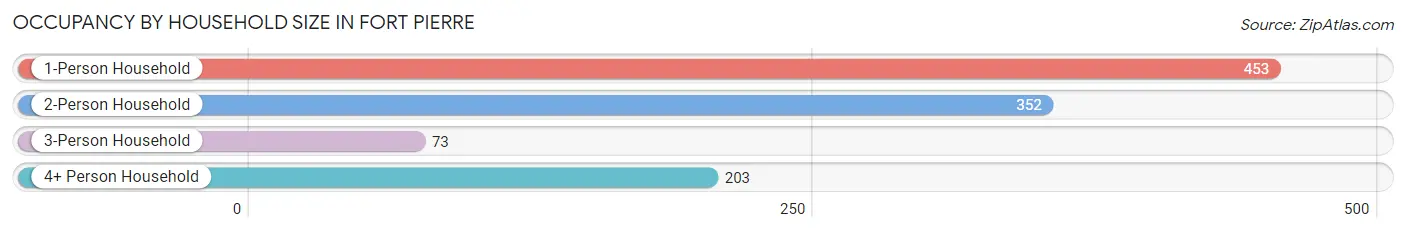
| Household Size | # Housing Units | % Housing Units |
| 1-Person Household | 453 | 41.9% |
| 2-Person Household | 352 | 32.6% |
| 3-Person Household | 73 | 6.8% |
| 4+ Person Household | 203 | 18.8% |
| Total Housing Units | 1,081 | 100.0% |
Occupancy by Ownership by Household Size in Fort Pierre
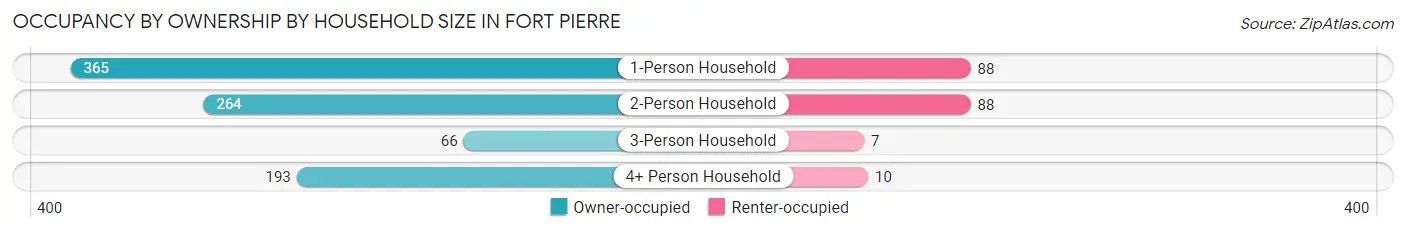
| Household Size | Owner-occupied | Renter-occupied |
| 1-Person Household | 365 (80.6%) | 88 (19.4%) |
| 2-Person Household | 264 (75.0%) | 88 (25.0%) |
| 3-Person Household | 66 (90.4%) | 7 (9.6%) |
| 4+ Person Household | 193 (95.1%) | 10 (4.9%) |
| Total Housing Units | 888 (82.2%) | 193 (17.8%) |
Occupancy by Educational Attainment in Fort Pierre
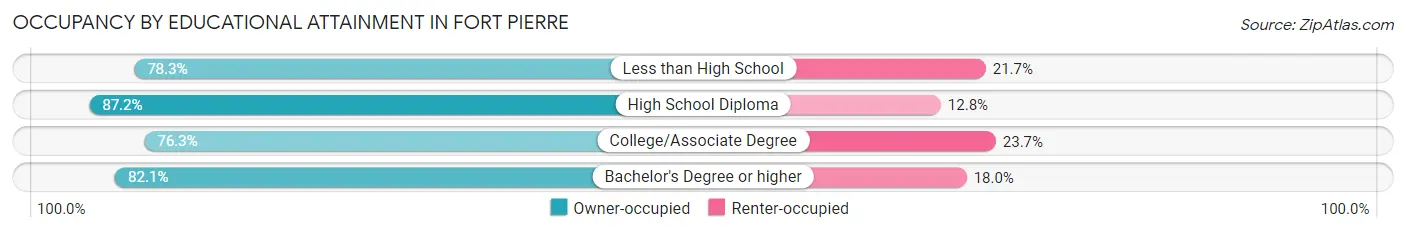
| Household Size | Owner-occupied | Renter-occupied |
| Less than High School | 54 (78.3%) | 15 (21.7%) |
| High School Diploma | 353 (87.2%) | 52 (12.8%) |
| College/Associate Degree | 225 (76.3%) | 70 (23.7%) |
| Bachelor's Degree or higher | 256 (82.1%) | 56 (17.9%) |
Occupancy by Age of Householder in Fort Pierre
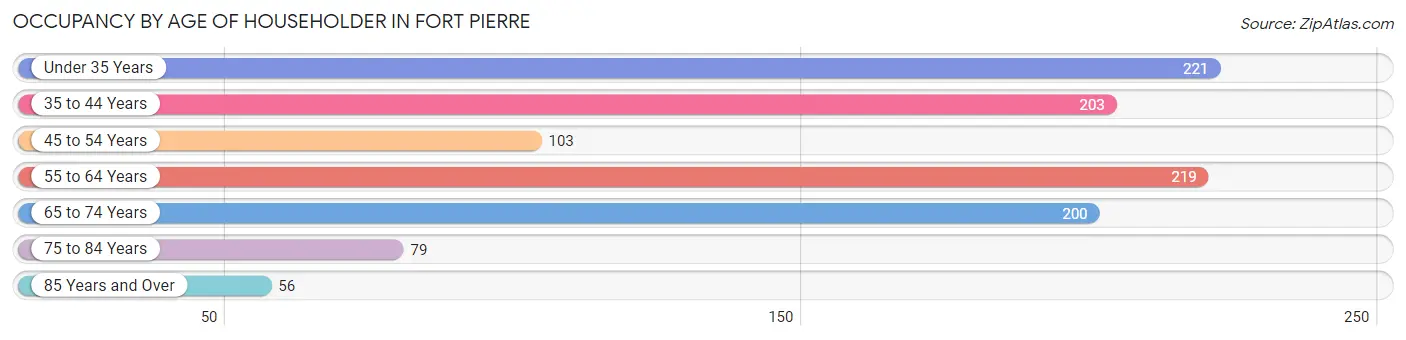
| Age Bracket | # Households | % Households |
| Under 35 Years | 221 | 20.4% |
| 35 to 44 Years | 203 | 18.8% |
| 45 to 54 Years | 103 | 9.5% |
| 55 to 64 Years | 219 | 20.3% |
| 65 to 74 Years | 200 | 18.5% |
| 75 to 84 Years | 79 | 7.3% |
| 85 Years and Over | 56 | 5.2% |
| Total | 1,081 | 100.0% |
Housing Finances in Fort Pierre
Median Income by Occupancy in Fort Pierre
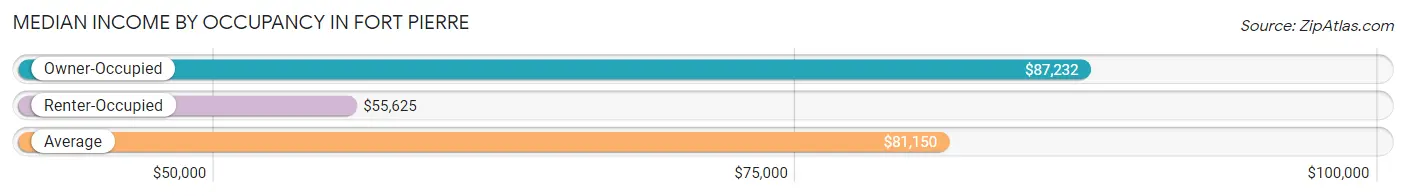
| Occupancy Type | # Households | Median Income |
| Owner-Occupied | 888 (82.2%) | $87,232 |
| Renter-Occupied | 193 (17.8%) | $55,625 |
| Average | 1,081 (100.0%) | $81,150 |
Occupancy by Householder Income Bracket in Fort Pierre
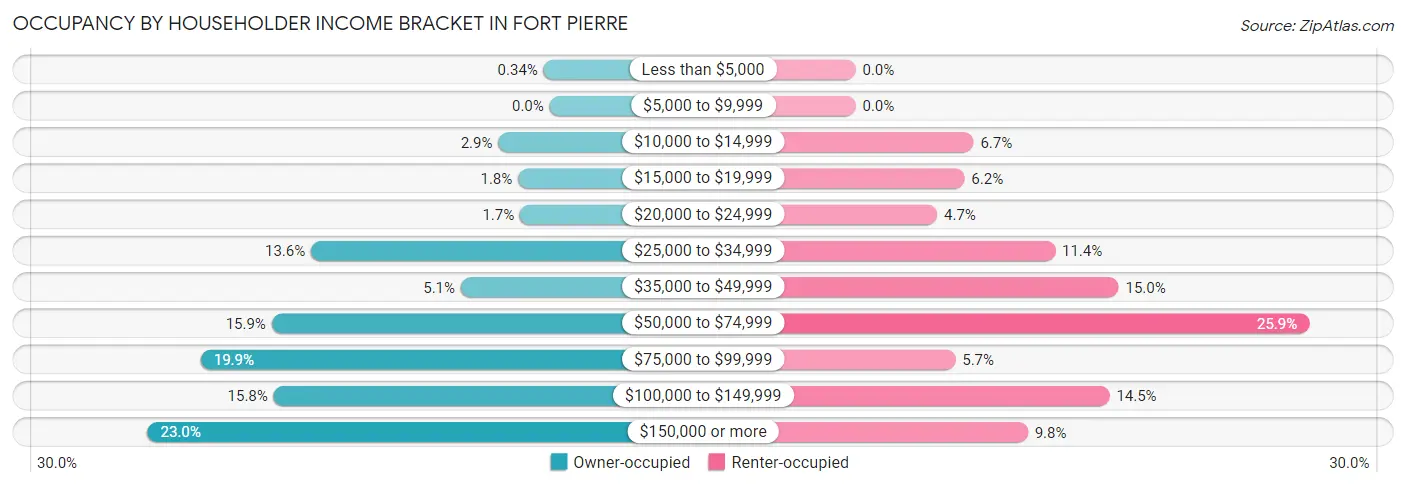
| Income Bracket | Owner-occupied | Renter-occupied |
| Less than $5,000 | 3 (0.3%) | 0 (0.0%) |
| $5,000 to $9,999 | 0 (0.0%) | 0 (0.0%) |
| $10,000 to $14,999 | 26 (2.9%) | 13 (6.7%) |
| $15,000 to $19,999 | 16 (1.8%) | 12 (6.2%) |
| $20,000 to $24,999 | 15 (1.7%) | 9 (4.7%) |
| $25,000 to $34,999 | 121 (13.6%) | 22 (11.4%) |
| $35,000 to $49,999 | 45 (5.1%) | 29 (15.0%) |
| $50,000 to $74,999 | 141 (15.9%) | 50 (25.9%) |
| $75,000 to $99,999 | 177 (19.9%) | 11 (5.7%) |
| $100,000 to $149,999 | 140 (15.8%) | 28 (14.5%) |
| $150,000 or more | 204 (23.0%) | 19 (9.8%) |
| Total | 888 (100.0%) | 193 (100.0%) |
Monthly Housing Cost Tiers in Fort Pierre
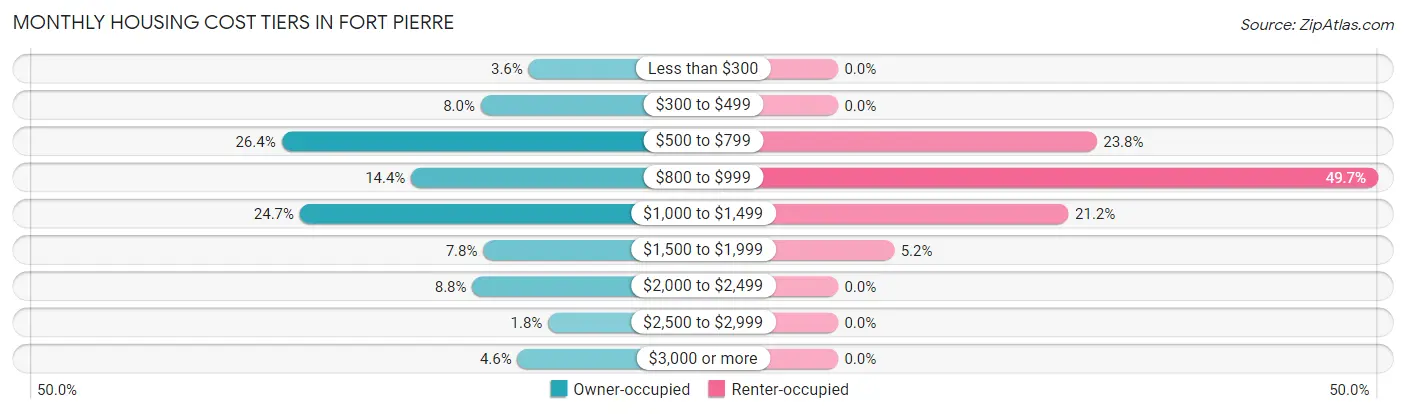
| Monthly Cost | Owner-occupied | Renter-occupied |
| Less than $300 | 32 (3.6%) | 0 (0.0%) |
| $300 to $499 | 71 (8.0%) | 0 (0.0%) |
| $500 to $799 | 234 (26.4%) | 46 (23.8%) |
| $800 to $999 | 128 (14.4%) | 96 (49.7%) |
| $1,000 to $1,499 | 219 (24.7%) | 41 (21.2%) |
| $1,500 to $1,999 | 69 (7.8%) | 10 (5.2%) |
| $2,000 to $2,499 | 78 (8.8%) | 0 (0.0%) |
| $2,500 to $2,999 | 16 (1.8%) | 0 (0.0%) |
| $3,000 or more | 41 (4.6%) | 0 (0.0%) |
| Total | 888 (100.0%) | 193 (100.0%) |
Physical Housing Characteristics in Fort Pierre
Housing Structures in Fort Pierre
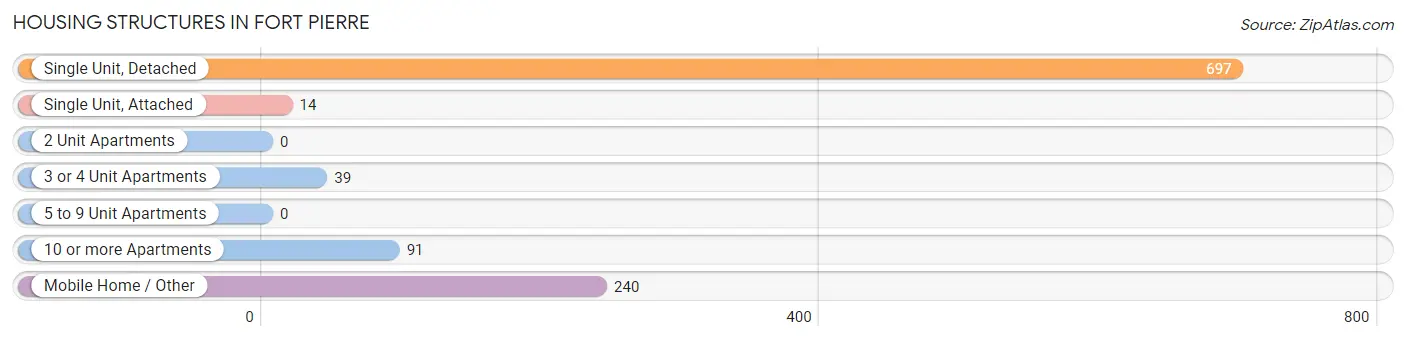
| Structure Type | # Housing Units | % Housing Units |
| Single Unit, Detached | 697 | 64.5% |
| Single Unit, Attached | 14 | 1.3% |
| 2 Unit Apartments | 0 | 0.0% |
| 3 or 4 Unit Apartments | 39 | 3.6% |
| 5 to 9 Unit Apartments | 0 | 0.0% |
| 10 or more Apartments | 91 | 8.4% |
| Mobile Home / Other | 240 | 22.2% |
| Total | 1,081 | 100.0% |
Housing Structures by Occupancy in Fort Pierre
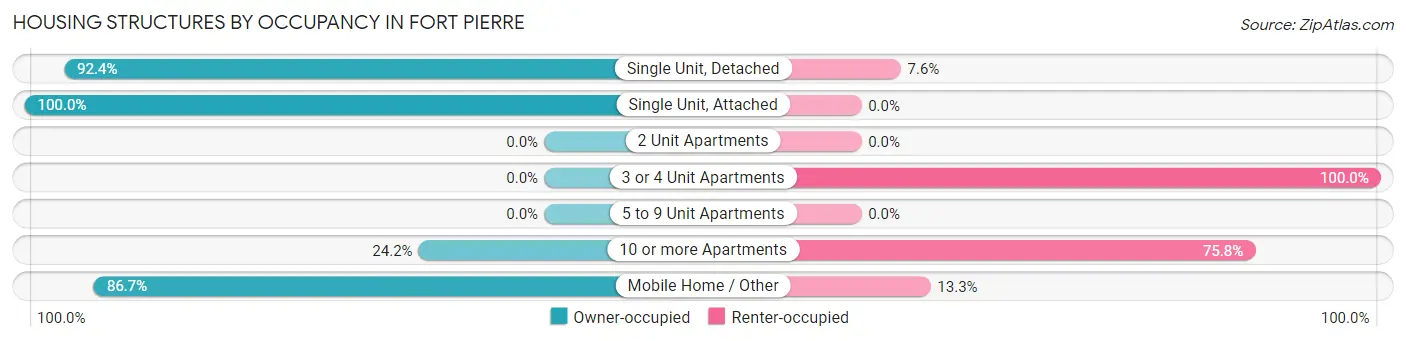
| Structure Type | Owner-occupied | Renter-occupied |
| Single Unit, Detached | 644 (92.4%) | 53 (7.6%) |
| Single Unit, Attached | 14 (100.0%) | 0 (0.0%) |
| 2 Unit Apartments | 0 (0.0%) | 0 (0.0%) |
| 3 or 4 Unit Apartments | 0 (0.0%) | 39 (100.0%) |
| 5 to 9 Unit Apartments | 0 (0.0%) | 0 (0.0%) |
| 10 or more Apartments | 22 (24.2%) | 69 (75.8%) |
| Mobile Home / Other | 208 (86.7%) | 32 (13.3%) |
| Total | 888 (82.2%) | 193 (17.8%) |
Housing Structures by Number of Rooms in Fort Pierre
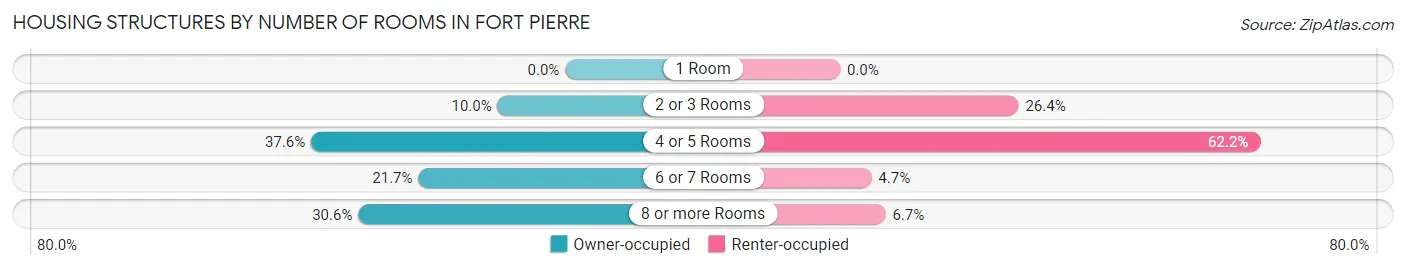
| Number of Rooms | Owner-occupied | Renter-occupied |
| 1 Room | 0 (0.0%) | 0 (0.0%) |
| 2 or 3 Rooms | 89 (10.0%) | 51 (26.4%) |
| 4 or 5 Rooms | 334 (37.6%) | 120 (62.2%) |
| 6 or 7 Rooms | 193 (21.7%) | 9 (4.7%) |
| 8 or more Rooms | 272 (30.6%) | 13 (6.7%) |
| Total | 888 (100.0%) | 193 (100.0%) |
Housing Structure by Heating Type in Fort Pierre
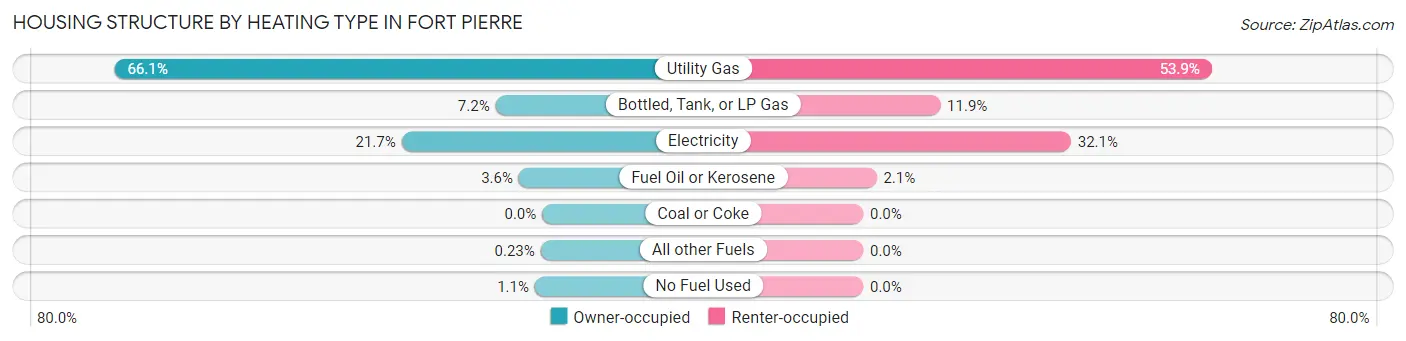
| Heating Type | Owner-occupied | Renter-occupied |
| Utility Gas | 587 (66.1%) | 104 (53.9%) |
| Bottled, Tank, or LP Gas | 64 (7.2%) | 23 (11.9%) |
| Electricity | 193 (21.7%) | 62 (32.1%) |
| Fuel Oil or Kerosene | 32 (3.6%) | 4 (2.1%) |
| Coal or Coke | 0 (0.0%) | 0 (0.0%) |
| All other Fuels | 2 (0.2%) | 0 (0.0%) |
| No Fuel Used | 10 (1.1%) | 0 (0.0%) |
| Total | 888 (100.0%) | 193 (100.0%) |
Household Vehicle Usage in Fort Pierre
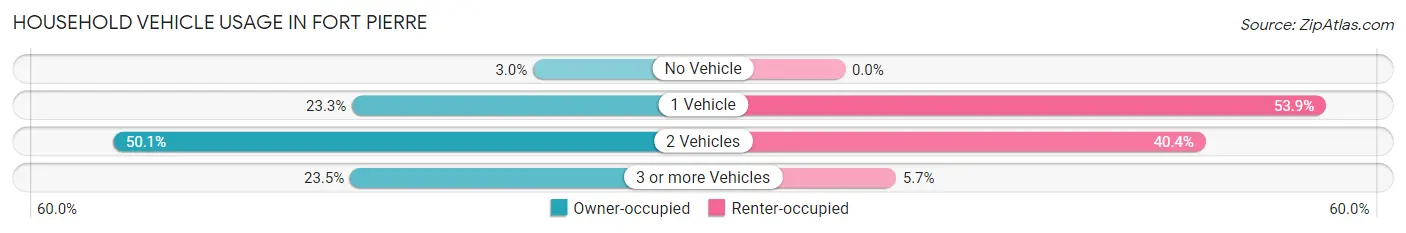
| Vehicles per Household | Owner-occupied | Renter-occupied |
| No Vehicle | 27 (3.0%) | 0 (0.0%) |
| 1 Vehicle | 207 (23.3%) | 104 (53.9%) |
| 2 Vehicles | 445 (50.1%) | 78 (40.4%) |
| 3 or more Vehicles | 209 (23.5%) | 11 (5.7%) |
| Total | 888 (100.0%) | 193 (100.0%) |
Real Estate & Mortgages in Fort Pierre
Real Estate and Mortgage Overview in Fort Pierre
| Characteristic | Without Mortgage | With Mortgage |
| Housing Units | 386 | 502 |
| Median Property Value | $152,800 | $175,000 |
| Median Household Income | $54,432 | $125 |
| Monthly Housing Costs | $606 | $41 |
| Real Estate Taxes | $2,247 | $37 |
Property Value by Mortgage Status in Fort Pierre
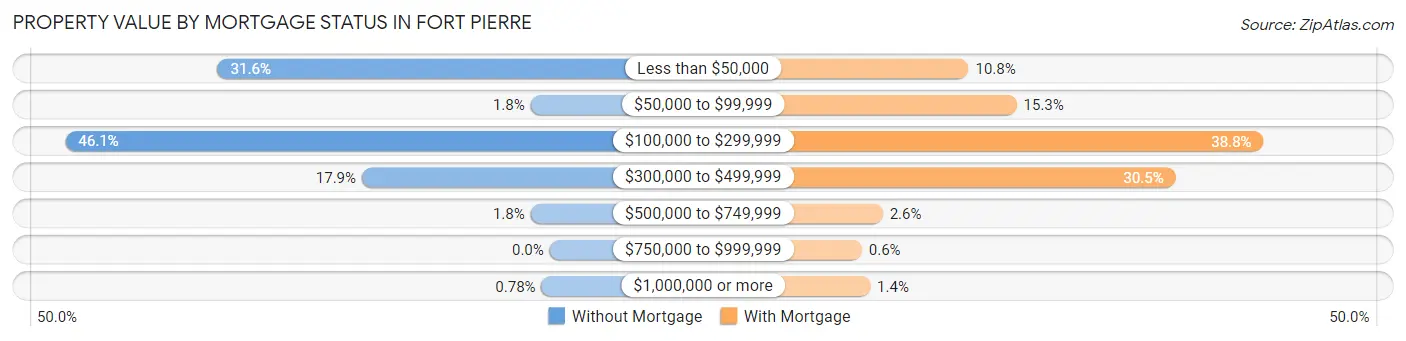
| Property Value | Without Mortgage | With Mortgage |
| Less than $50,000 | 122 (31.6%) | 54 (10.8%) |
| $50,000 to $99,999 | 7 (1.8%) | 77 (15.3%) |
| $100,000 to $299,999 | 178 (46.1%) | 195 (38.8%) |
| $300,000 to $499,999 | 69 (17.9%) | 153 (30.5%) |
| $500,000 to $749,999 | 7 (1.8%) | 13 (2.6%) |
| $750,000 to $999,999 | 0 (0.0%) | 3 (0.6%) |
| $1,000,000 or more | 3 (0.8%) | 7 (1.4%) |
| Total | 386 (100.0%) | 502 (100.0%) |
Household Income by Mortgage Status in Fort Pierre
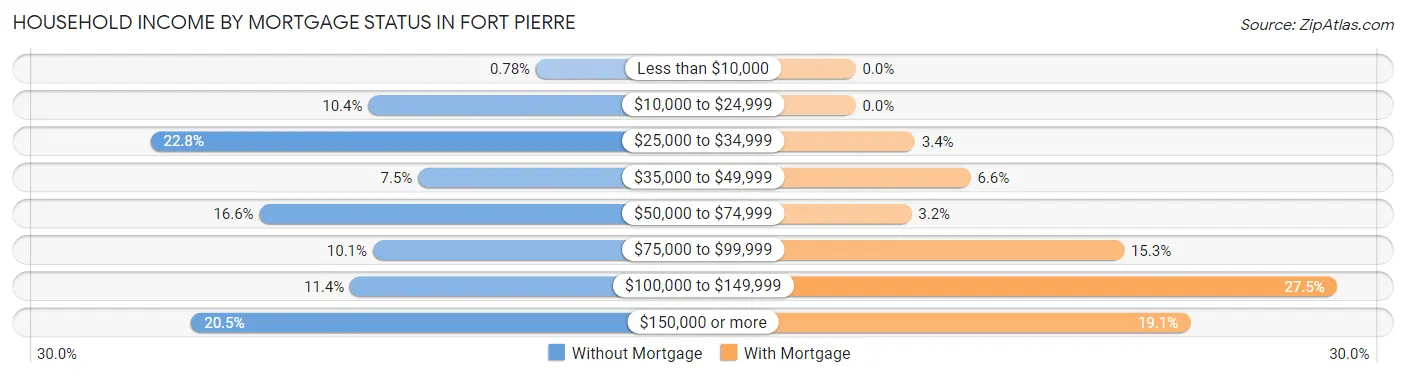
| Household Income | Without Mortgage | With Mortgage |
| Less than $10,000 | 3 (0.8%) | 0 (0.0%) |
| $10,000 to $24,999 | 40 (10.4%) | 0 (0.0%) |
| $25,000 to $34,999 | 88 (22.8%) | 17 (3.4%) |
| $35,000 to $49,999 | 29 (7.5%) | 33 (6.6%) |
| $50,000 to $74,999 | 64 (16.6%) | 16 (3.2%) |
| $75,000 to $99,999 | 39 (10.1%) | 77 (15.3%) |
| $100,000 to $149,999 | 44 (11.4%) | 138 (27.5%) |
| $150,000 or more | 79 (20.5%) | 96 (19.1%) |
| Total | 386 (100.0%) | 502 (100.0%) |
Property Value to Household Income Ratio in Fort Pierre
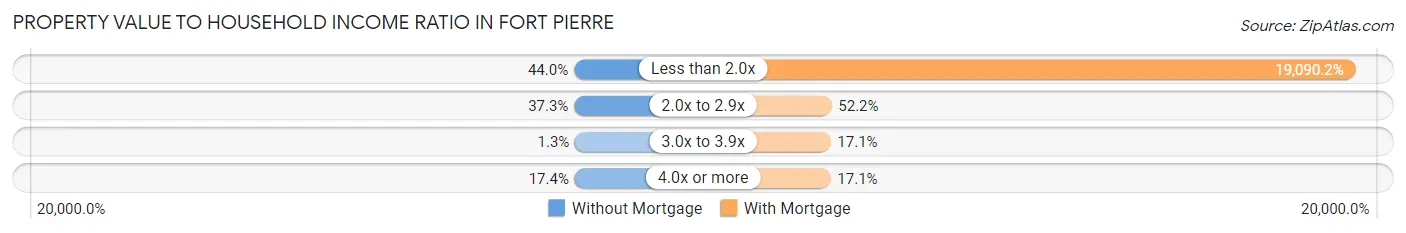
| Value-to-Income Ratio | Without Mortgage | With Mortgage |
| Less than 2.0x | 170 (44.0%) | 95,833 (19,090.2%) |
| 2.0x to 2.9x | 144 (37.3%) | 262 (52.2%) |
| 3.0x to 3.9x | 5 (1.3%) | 86 (17.1%) |
| 4.0x or more | 67 (17.4%) | 86 (17.1%) |
| Total | 386 (100.0%) | 502 (100.0%) |
Real Estate Taxes by Mortgage Status in Fort Pierre
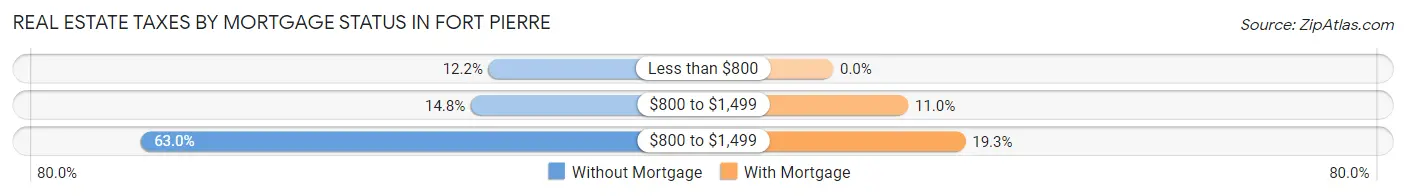
| Property Taxes | Without Mortgage | With Mortgage |
| Less than $800 | 47 (12.2%) | 0 (0.0%) |
| $800 to $1,499 | 57 (14.8%) | 55 (11.0%) |
| $800 to $1,499 | 243 (62.9%) | 97 (19.3%) |
| Total | 386 (100.0%) | 502 (100.0%) |
Health & Disability in Fort Pierre
Health Insurance Coverage by Age in Fort Pierre
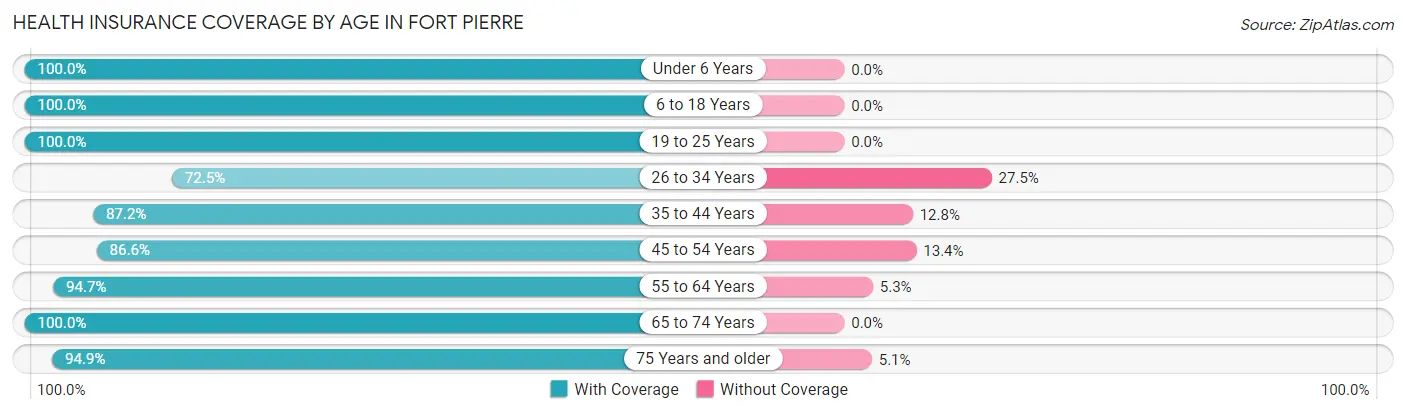
| Age Bracket | With Coverage | Without Coverage |
| Under 6 Years | 169 (100.0%) | 0 (0.0%) |
| 6 to 18 Years | 423 (100.0%) | 0 (0.0%) |
| 19 to 25 Years | 149 (100.0%) | 0 (0.0%) |
| 26 to 34 Years | 161 (72.5%) | 61 (27.5%) |
| 35 to 44 Years | 342 (87.2%) | 50 (12.8%) |
| 45 to 54 Years | 277 (86.6%) | 43 (13.4%) |
| 55 to 64 Years | 320 (94.7%) | 18 (5.3%) |
| 65 to 74 Years | 314 (100.0%) | 0 (0.0%) |
| 75 Years and older | 185 (94.9%) | 10 (5.1%) |
| Total | 2,340 (92.8%) | 182 (7.2%) |
Health Insurance Coverage by Citizenship Status in Fort Pierre
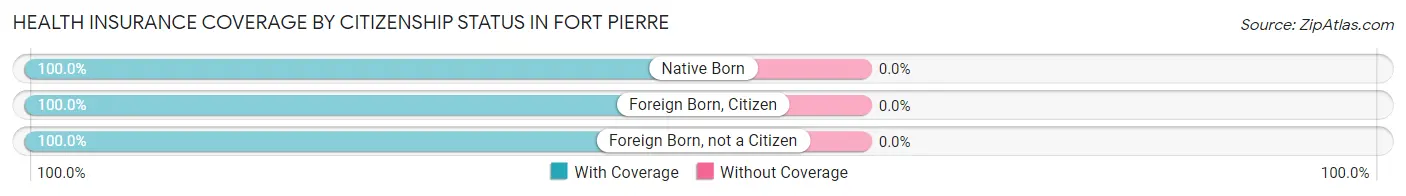
| Citizenship Status | With Coverage | Without Coverage |
| Native Born | 169 (100.0%) | 0 (0.0%) |
| Foreign Born, Citizen | 423 (100.0%) | 0 (0.0%) |
| Foreign Born, not a Citizen | 149 (100.0%) | 0 (0.0%) |
Health Insurance Coverage by Household Income in Fort Pierre
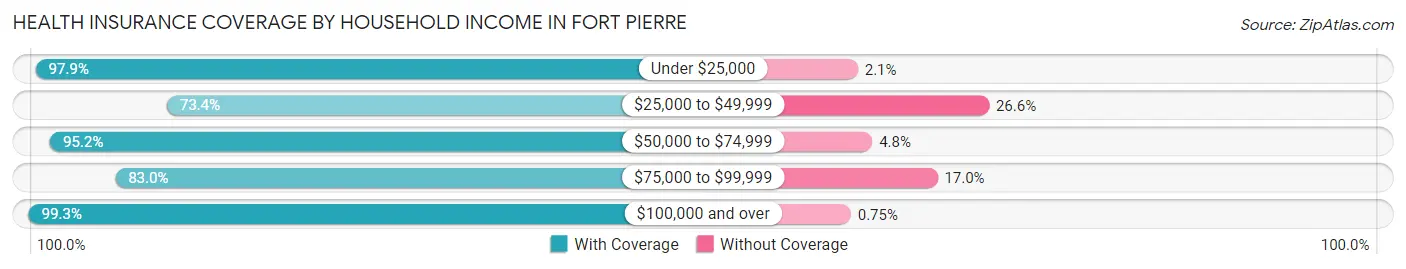
| Household Income | With Coverage | Without Coverage |
| Under $25,000 | 95 (97.9%) | 2 (2.1%) |
| $25,000 to $49,999 | 223 (73.4%) | 81 (26.6%) |
| $50,000 to $74,999 | 340 (95.2%) | 17 (4.8%) |
| $75,000 to $99,999 | 352 (83.0%) | 72 (17.0%) |
| $100,000 and over | 1,330 (99.3%) | 10 (0.7%) |
Public vs Private Health Insurance Coverage by Age in Fort Pierre
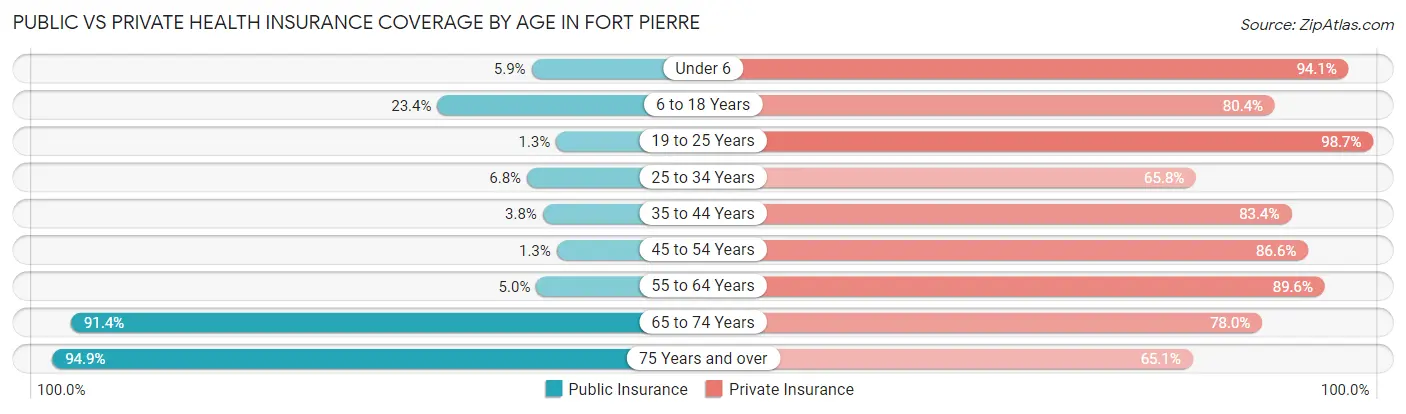
| Age Bracket | Public Insurance | Private Insurance |
| Under 6 | 10 (5.9%) | 159 (94.1%) |
| 6 to 18 Years | 99 (23.4%) | 340 (80.4%) |
| 19 to 25 Years | 2 (1.3%) | 147 (98.7%) |
| 25 to 34 Years | 15 (6.8%) | 146 (65.8%) |
| 35 to 44 Years | 15 (3.8%) | 327 (83.4%) |
| 45 to 54 Years | 4 (1.3%) | 277 (86.6%) |
| 55 to 64 Years | 17 (5.0%) | 303 (89.6%) |
| 65 to 74 Years | 287 (91.4%) | 245 (78.0%) |
| 75 Years and over | 185 (94.9%) | 127 (65.1%) |
| Total | 634 (25.1%) | 2,071 (82.1%) |
Disability Status by Sex by Age in Fort Pierre
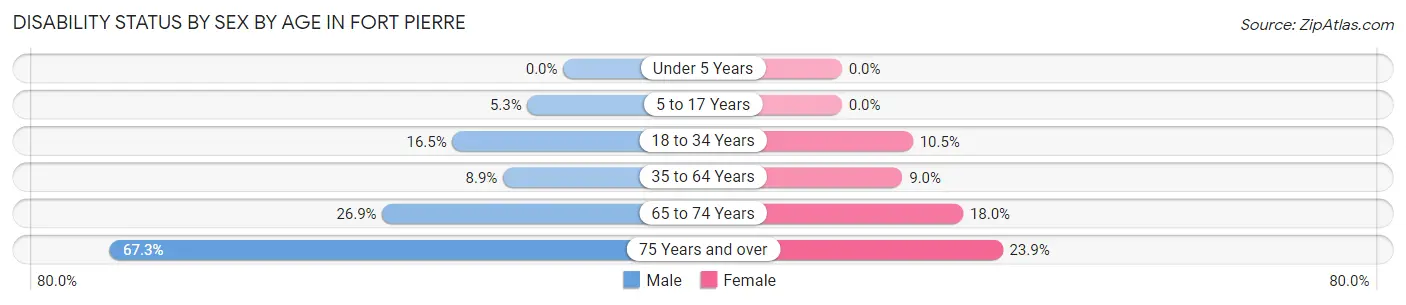
| Age Bracket | Male | Female |
| Under 5 Years | 0 (0.0%) | 0 (0.0%) |
| 5 to 17 Years | 16 (5.3%) | 0 (0.0%) |
| 18 to 34 Years | 38 (16.5%) | 16 (10.5%) |
| 35 to 64 Years | 56 (8.9%) | 38 (9.0%) |
| 65 to 74 Years | 47 (26.9%) | 25 (18.0%) |
| 75 Years and over | 72 (67.3%) | 21 (23.9%) |
Disability Class by Sex by Age in Fort Pierre
Disability Class: Hearing Difficulty
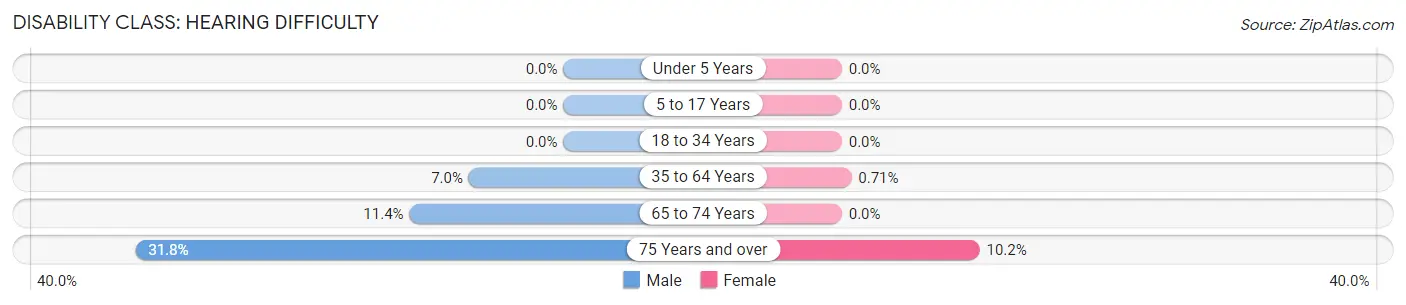
| Age Bracket | Male | Female |
| Under 5 Years | 0 (0.0%) | 0 (0.0%) |
| 5 to 17 Years | 0 (0.0%) | 0 (0.0%) |
| 18 to 34 Years | 0 (0.0%) | 0 (0.0%) |
| 35 to 64 Years | 44 (7.0%) | 3 (0.7%) |
| 65 to 74 Years | 20 (11.4%) | 0 (0.0%) |
| 75 Years and over | 34 (31.8%) | 9 (10.2%) |
Disability Class: Vision Difficulty
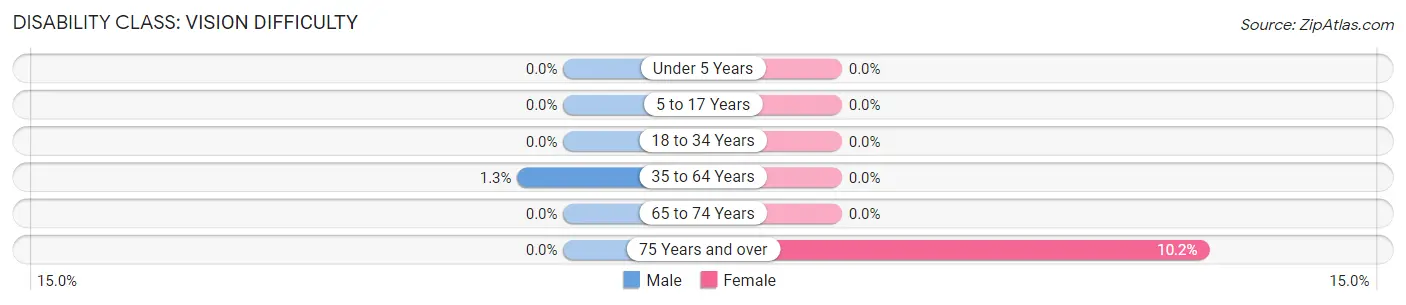
| Age Bracket | Male | Female |
| Under 5 Years | 0 (0.0%) | 0 (0.0%) |
| 5 to 17 Years | 0 (0.0%) | 0 (0.0%) |
| 18 to 34 Years | 0 (0.0%) | 0 (0.0%) |
| 35 to 64 Years | 8 (1.3%) | 0 (0.0%) |
| 65 to 74 Years | 0 (0.0%) | 0 (0.0%) |
| 75 Years and over | 0 (0.0%) | 9 (10.2%) |
Disability Class: Cognitive Difficulty
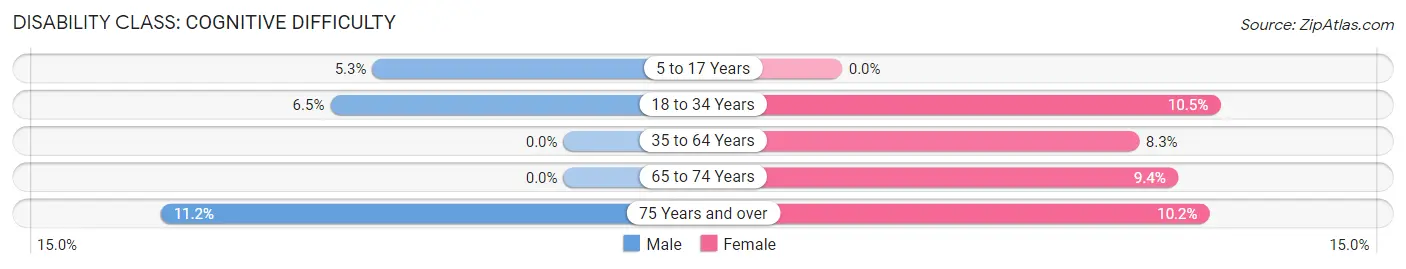
| Age Bracket | Male | Female |
| 5 to 17 Years | 16 (5.3%) | 0 (0.0%) |
| 18 to 34 Years | 15 (6.5%) | 16 (10.5%) |
| 35 to 64 Years | 0 (0.0%) | 35 (8.3%) |
| 65 to 74 Years | 0 (0.0%) | 13 (9.3%) |
| 75 Years and over | 12 (11.2%) | 9 (10.2%) |
Disability Class: Ambulatory Difficulty
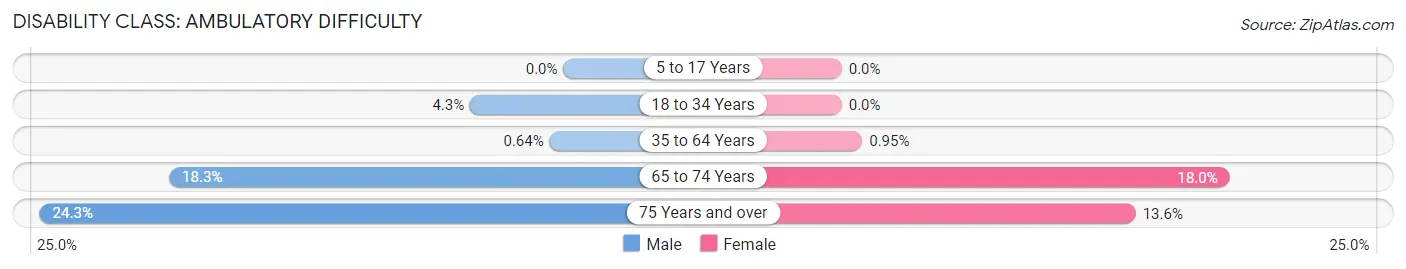
| Age Bracket | Male | Female |
| 5 to 17 Years | 0 (0.0%) | 0 (0.0%) |
| 18 to 34 Years | 10 (4.3%) | 0 (0.0%) |
| 35 to 64 Years | 4 (0.6%) | 4 (0.9%) |
| 65 to 74 Years | 32 (18.3%) | 25 (18.0%) |
| 75 Years and over | 26 (24.3%) | 12 (13.6%) |
Disability Class: Self-Care Difficulty
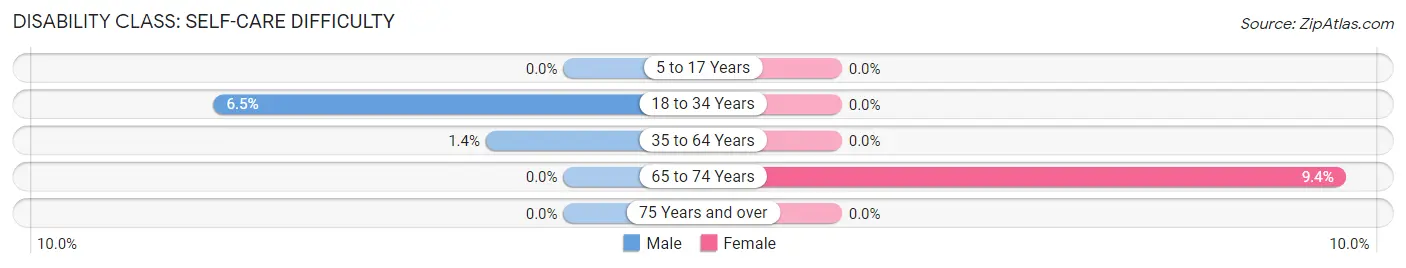
| Age Bracket | Male | Female |
| 5 to 17 Years | 0 (0.0%) | 0 (0.0%) |
| 18 to 34 Years | 15 (6.5%) | 0 (0.0%) |
| 35 to 64 Years | 9 (1.4%) | 0 (0.0%) |
| 65 to 74 Years | 0 (0.0%) | 13 (9.3%) |
| 75 Years and over | 0 (0.0%) | 0 (0.0%) |
Technology Access in Fort Pierre
Computing Device Access in Fort Pierre
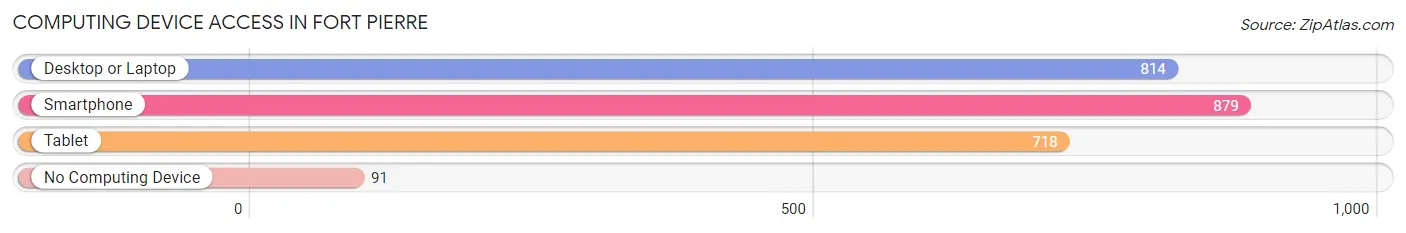
| Device Type | # Households | % Households |
| Desktop or Laptop | 814 | 75.3% |
| Smartphone | 879 | 81.3% |
| Tablet | 718 | 66.4% |
| No Computing Device | 91 | 8.4% |
| Total | 1,081 | 100.0% |
Internet Access in Fort Pierre
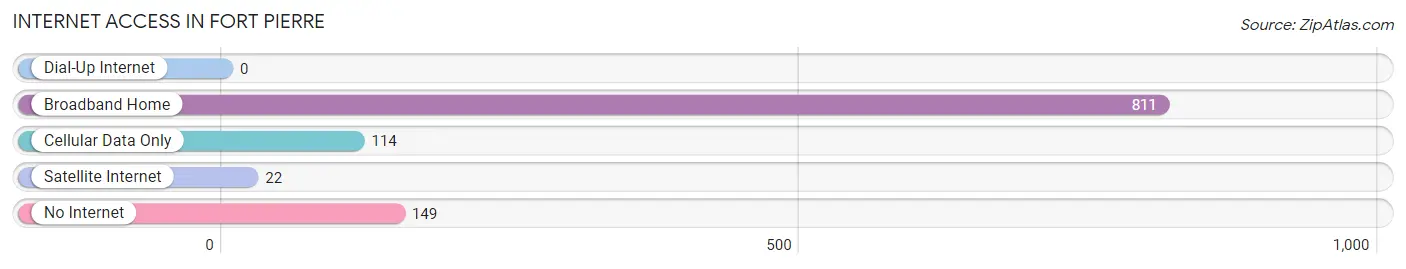
| Internet Type | # Households | % Households |
| Dial-Up Internet | 0 | 0.0% |
| Broadband Home | 811 | 75.0% |
| Cellular Data Only | 114 | 10.5% |
| Satellite Internet | 22 | 2.0% |
| No Internet | 149 | 13.8% |
| Total | 1,081 | 100.0% |
Fort Pierre Summary
Pierre, South Dakota is a city located in the central part of the state, along the Missouri River. It is the state capital and the county seat of Hughes County. The city has a population of 13,876, according to the 2010 census.
History
Pierre was founded in 1880 by fur traders and settlers. The city was named after Pierre Chouteau, Jr., a prominent fur trader in the area. The city was incorporated in 1883 and became the state capital in 1889.
Geography
Pierre is located in the central part of South Dakota, along the Missouri River. It is the state capital and the county seat of Hughes County. The city has a total area of 8.3 square miles, of which 8.2 square miles is land and 0.1 square miles is water.
Economy
Pierre’s economy is largely based on government and tourism. The state government is the largest employer in the city, with over 2,000 employees. Other major employers include the Oahe Dam, the South Dakota State Penitentiary, and the South Dakota School of Mines and Technology. Tourism is also an important part of the economy, with visitors coming to the city to visit the state capitol, the Oahe Dam, and the nearby Fort Pierre National Grassland.
Demographics
According to the 2010 census, Pierre has a population of 13,876. The racial makeup of the city is 90.2% White, 4.2% Native American, 1.2% Asian, 0.7% African American, 0.2% Pacific Islander, and 3.5% from other races. The median household income is $45,945, and the median family income is $54,945. The per capita income is $22,945.
Conclusion
Pierre, South Dakota is a city located in the central part of the state, along the Missouri River. It is the state capital and the county seat of Hughes County. The city has a population of 13,876, according to the 2010 census. The economy of Pierre is largely based on government and tourism, with the state government being the largest employer in the city. The racial makeup of the city is 90.2% White, 4.2% Native American, 1.2% Asian, 0.7% African American, 0.2% Pacific Islander, and 3.5% from other races. The median household income is $45,945, and the median family income is $54,945. The per capita income is $22,945.
Common Questions
What is Per Capita Income in Fort Pierre?
Per Capita income in Fort Pierre is $45,811.
What is the Median Family Income in Fort Pierre?
Median Family Income in Fort Pierre is $109,167.
What is the Median Household income in Fort Pierre?
Median Household Income in Fort Pierre is $81,150.
What is Income or Wage Gap in Fort Pierre?
Income or Wage Gap in Fort Pierre is 32.5%.
Women in Fort Pierre earn 67.5 cents for every dollar earned by a man.
What is Inequality or Gini Index in Fort Pierre?
Inequality or Gini Index in Fort Pierre is 0.42.
What is the Total Population of Fort Pierre?
Total Population of Fort Pierre is 2,522.
What is the Total Male Population of Fort Pierre?
Total Male Population of Fort Pierre is 1,492.
What is the Total Female Population of Fort Pierre?
Total Female Population of Fort Pierre is 1,030.
What is the Ratio of Males per 100 Females in Fort Pierre?
There are 144.85 Males per 100 Females in Fort Pierre.
What is the Ratio of Females per 100 Males in Fort Pierre?
There are 69.03 Females per 100 Males in Fort Pierre.
What is the Median Population Age in Fort Pierre?
Median Population Age in Fort Pierre is 42.4 Years.
What is the Average Family Size in Fort Pierre
Average Family Size in Fort Pierre is 3.3 People.
What is the Average Household Size in Fort Pierre
Average Household Size in Fort Pierre is 2.3 People.
How Large is the Labor Force in Fort Pierre?
There are 1,491 People in the Labor Forcein in Fort Pierre.
What is the Percentage of People in the Labor Force in Fort Pierre?
74.6% of People are in the Labor Force in Fort Pierre.
What is the Unemployment Rate in Fort Pierre?
Unemployment Rate in Fort Pierre is 0.2%.