Creswell, OR Map & Demographics
Creswell Map
Creswell Overview
$35,761
PER CAPITA INCOME
$94,239
AVG FAMILY INCOME
$85,126
AVG HOUSEHOLD INCOME
21.8%
WAGE / INCOME GAP [ % ]
78.2¢/ $1
WAGE / INCOME GAP [ $ ]
0.34
INEQUALITY / GINI INDEX
5,607
TOTAL POPULATION
2,957
MALE POPULATION
2,650
FEMALE POPULATION
111.58
MALES / 100 FEMALES
89.62
FEMALES / 100 MALES
36.9
MEDIAN AGE
3.0
AVG FAMILY SIZE
2.7
AVG HOUSEHOLD SIZE
3,009
LABOR FORCE [ PEOPLE ]
67.6%
PERCENT IN LABOR FORCE
1.0%
UNEMPLOYMENT RATE
Creswell Zip Codes
Creswell Area Codes
Income in Creswell
Income Overview in Creswell
Per Capita Income in Creswell is $35,761, while median incomes of families and households are $94,239 and $85,126 respectively.
| Characteristic | Number | Measure |
| Per Capita Income | 5,607 | $35,761 |
| Median Family Income | 1,590 | $94,239 |
| Mean Family Income | 1,590 | $102,189 |
| Median Household Income | 2,037 | $85,126 |
| Mean Household Income | 2,037 | $95,083 |
| Income Deficit | 1,590 | $0 |
| Wage / Income Gap (%) | 5,607 | 21.83% |
| Wage / Income Gap ($) | 5,607 | 78.17¢ per $1 |
| Gini / Inequality Index | 5,607 | 0.34 |
Earnings by Sex in Creswell
Average Earnings in Creswell are $46,219, $47,184 for men and $36,884 for women, a difference of 21.8%.
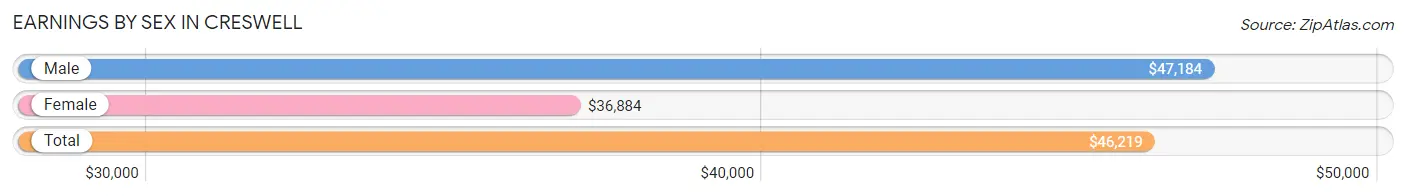
| Sex | Number | Average Earnings |
| Male | 1,820 (59.4%) | $47,184 |
| Female | 1,245 (40.6%) | $36,884 |
| Total | 3,065 (100.0%) | $46,219 |
Earnings by Sex by Income Bracket in Creswell
The most common earnings brackets in Creswell are $45,000 to $49,999 for men (316 | 17.4%) and $75,000 to $99,999 for women (137 | 11.0%).
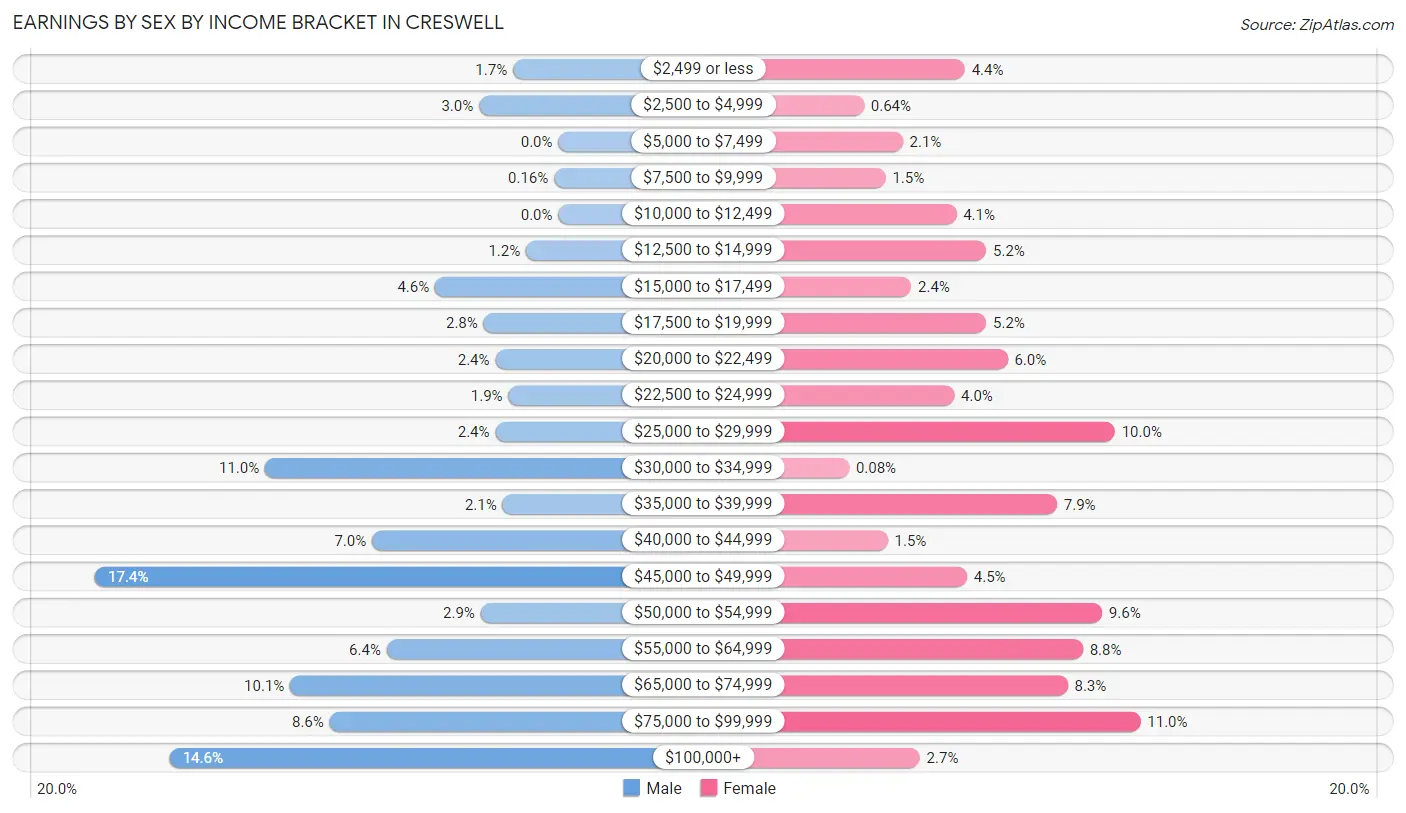
| Income | Male | Female |
| $2,499 or less | 31 (1.7%) | 55 (4.4%) |
| $2,500 to $4,999 | 54 (3.0%) | 8 (0.6%) |
| $5,000 to $7,499 | 0 (0.0%) | 26 (2.1%) |
| $7,500 to $9,999 | 3 (0.2%) | 18 (1.5%) |
| $10,000 to $12,499 | 0 (0.0%) | 51 (4.1%) |
| $12,500 to $14,999 | 22 (1.2%) | 65 (5.2%) |
| $15,000 to $17,499 | 84 (4.6%) | 30 (2.4%) |
| $17,500 to $19,999 | 51 (2.8%) | 65 (5.2%) |
| $20,000 to $22,499 | 43 (2.4%) | 75 (6.0%) |
| $22,500 to $24,999 | 34 (1.9%) | 50 (4.0%) |
| $25,000 to $29,999 | 43 (2.4%) | 125 (10.0%) |
| $30,000 to $34,999 | 200 (11.0%) | 1 (0.1%) |
| $35,000 to $39,999 | 38 (2.1%) | 98 (7.9%) |
| $40,000 to $44,999 | 127 (7.0%) | 19 (1.5%) |
| $45,000 to $49,999 | 316 (17.4%) | 56 (4.5%) |
| $50,000 to $54,999 | 53 (2.9%) | 119 (9.6%) |
| $55,000 to $64,999 | 117 (6.4%) | 110 (8.8%) |
| $65,000 to $74,999 | 183 (10.1%) | 103 (8.3%) |
| $75,000 to $99,999 | 156 (8.6%) | 137 (11.0%) |
| $100,000+ | 265 (14.6%) | 34 (2.7%) |
| Total | 1,820 (100.0%) | 1,245 (100.0%) |
Earnings by Sex by Educational Attainment in Creswell
Average earnings in Creswell are $47,470 for men and $39,491 for women, a difference of 16.8%. Men with an educational attainment of college or associate's degree enjoy the highest average annual earnings of $73,707, while those with high school diploma education earn the least with $45,170. Women with an educational attainment of graduate degree earn the most with the average annual earnings of $80,676, while those with college or associate's degree education have the smallest earnings of $28,125.
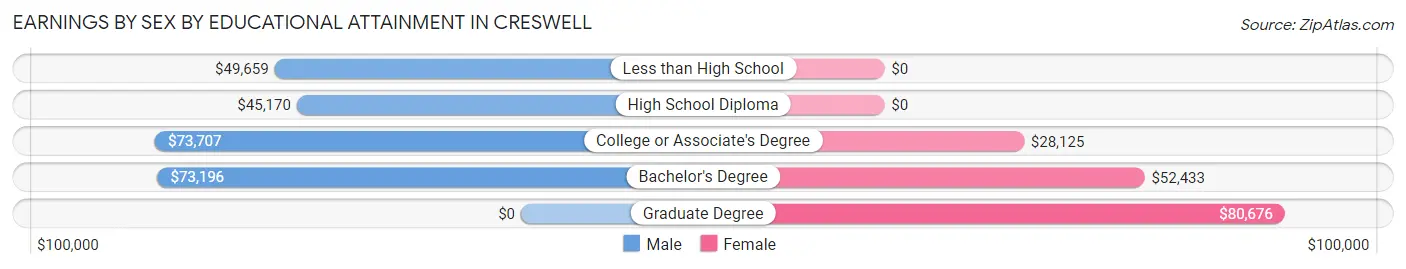
| Educational Attainment | Male Income | Female Income |
| Less than High School | $49,659 | $0 |
| High School Diploma | $45,170 | $0 |
| College or Associate's Degree | $73,707 | $28,125 |
| Bachelor's Degree | $73,196 | $52,433 |
| Graduate Degree | - | - |
| Total | $47,470 | $39,491 |
Family Income in Creswell
Family Income Brackets in Creswell
According to the Creswell family income data, there are 374 families falling into the $50,000 to $74,999 income range, which is the most common income bracket and makes up 23.5% of all families.
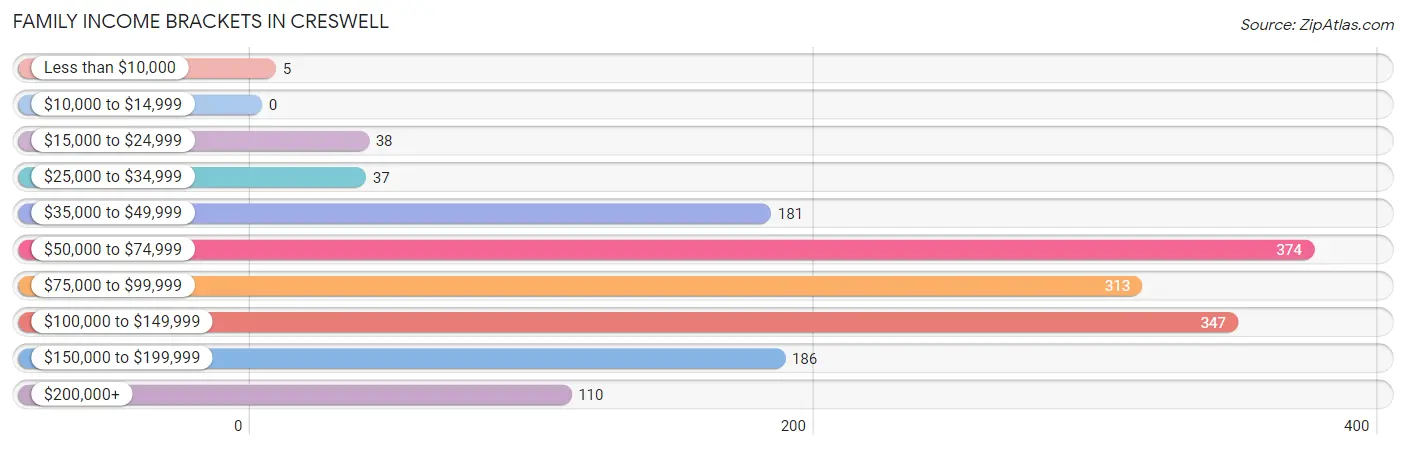
| Income Bracket | # Families | % Families |
| Less than $10,000 | 5 | 0.3% |
| $10,000 to $14,999 | 0 | 0.0% |
| $15,000 to $24,999 | 38 | 2.4% |
| $25,000 to $34,999 | 37 | 2.3% |
| $35,000 to $49,999 | 181 | 11.4% |
| $50,000 to $74,999 | 374 | 23.5% |
| $75,000 to $99,999 | 313 | 19.7% |
| $100,000 to $149,999 | 347 | 21.8% |
| $150,000 to $199,999 | 186 | 11.7% |
| $200,000+ | 110 | 6.9% |
Family Income by Famaliy Size in Creswell
3-person families (520 | 32.7%) account for the highest median family income in Creswell with $99,528 per family, while 2-person families (624 | 39.3%) have the highest median income of $46,277 per family member.
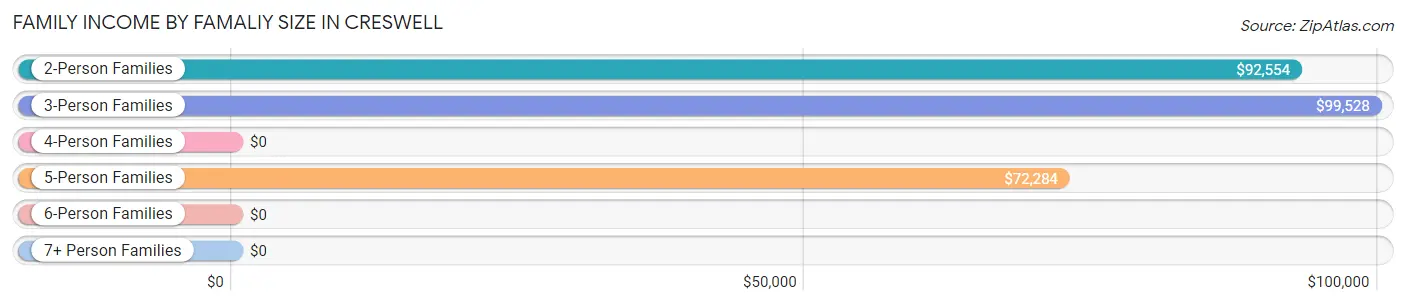
| Income Bracket | # Families | Median Income |
| 2-Person Families | 624 (39.3%) | $92,554 |
| 3-Person Families | 520 (32.7%) | $99,528 |
| 4-Person Families | 321 (20.2%) | $0 |
| 5-Person Families | 109 (6.9%) | $72,284 |
| 6-Person Families | 16 (1.0%) | $0 |
| 7+ Person Families | 0 (0.0%) | $0 |
| Total | 1,590 (100.0%) | $94,239 |
Family Income by Number of Earners in Creswell
The median family income in Creswell is $94,239, with families comprising 3+ earners (210) having the highest median family income of $161,303, while families with no earners (220) have the lowest median family income of $67,321, accounting for 13.2% and 13.8% of families, respectively.
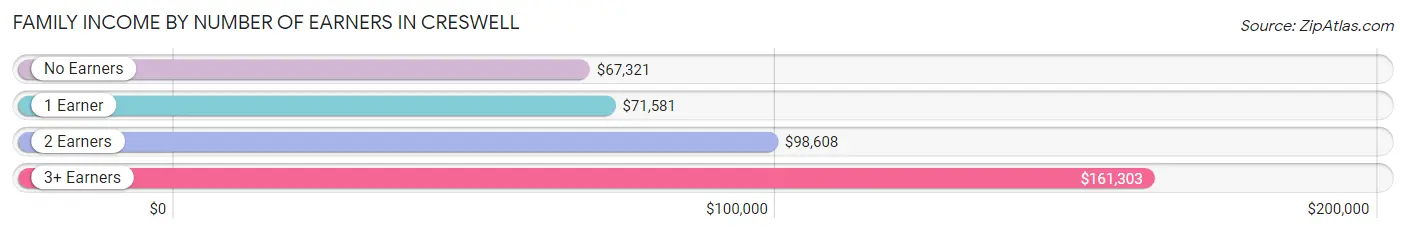
| Number of Earners | # Families | Median Income |
| No Earners | 220 (13.8%) | $67,321 |
| 1 Earner | 493 (31.0%) | $71,581 |
| 2 Earners | 667 (41.9%) | $98,608 |
| 3+ Earners | 210 (13.2%) | $161,303 |
| Total | 1,590 (100.0%) | $94,239 |
Household Income in Creswell
Household Income Brackets in Creswell
With 446 households falling in the category, the $50,000 to $74,999 income range is the most frequent in Creswell, accounting for 21.9% of all households. In contrast, only 20 households (1.0%) fall into the $10,000 to $14,999 income bracket, making it the least populous group.
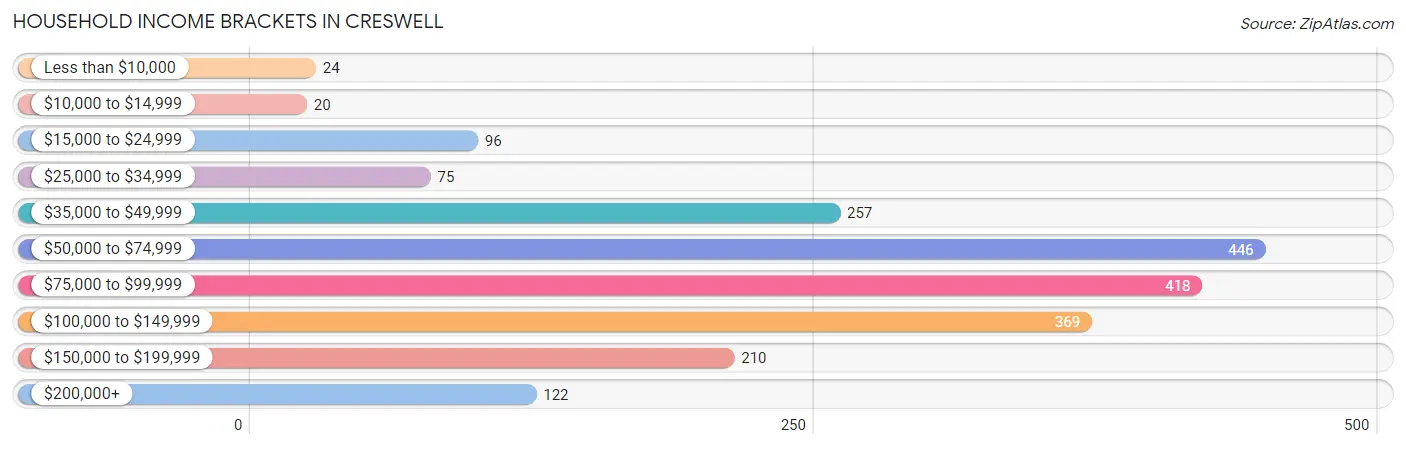
| Income Bracket | # Households | % Households |
| Less than $10,000 | 24 | 1.2% |
| $10,000 to $14,999 | 20 | 1.0% |
| $15,000 to $24,999 | 96 | 4.7% |
| $25,000 to $34,999 | 75 | 3.7% |
| $35,000 to $49,999 | 257 | 12.6% |
| $50,000 to $74,999 | 446 | 21.9% |
| $75,000 to $99,999 | 418 | 20.5% |
| $100,000 to $149,999 | 369 | 18.1% |
| $150,000 to $199,999 | 210 | 10.3% |
| $200,000+ | 122 | 6.0% |
Household Income by Householder Age in Creswell
The median household income in Creswell is $85,126, with the highest median household income of $103,917 found in the 45 to 64 years age bracket for the primary householder. A total of 625 households (30.7%) fall into this category. Meanwhile, the 15 to 24 years age bracket for the primary householder has the lowest median household income of $39,571, with 58 households (2.9%) in this group.
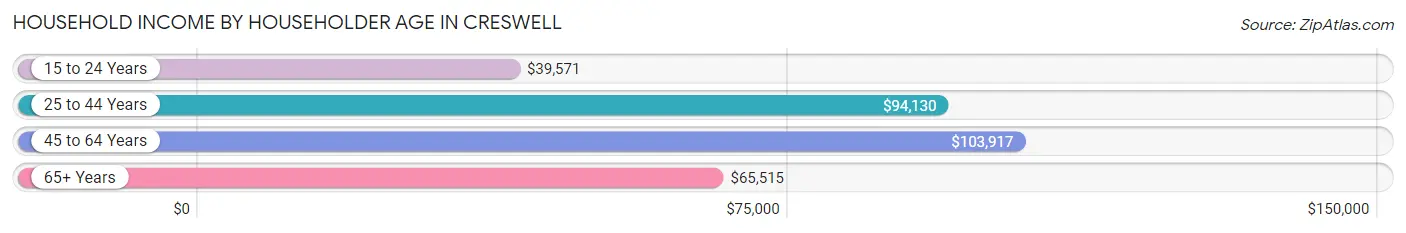
| Income Bracket | # Households | Median Income |
| 15 to 24 Years | 58 (2.9%) | $39,571 |
| 25 to 44 Years | 862 (42.3%) | $94,130 |
| 45 to 64 Years | 625 (30.7%) | $103,917 |
| 65+ Years | 492 (24.1%) | $65,515 |
| Total | 2,037 (100.0%) | $85,126 |
Poverty in Creswell
Income Below Poverty by Sex and Age in Creswell
With 1.0% poverty level for males and 4.8% for females among the residents of Creswell, 16 and 17 year old males and 35 to 44 year old females are the most vulnerable to poverty, with 3 males (6.0%) and 69 females (18.4%) in their respective age groups living below the poverty level.
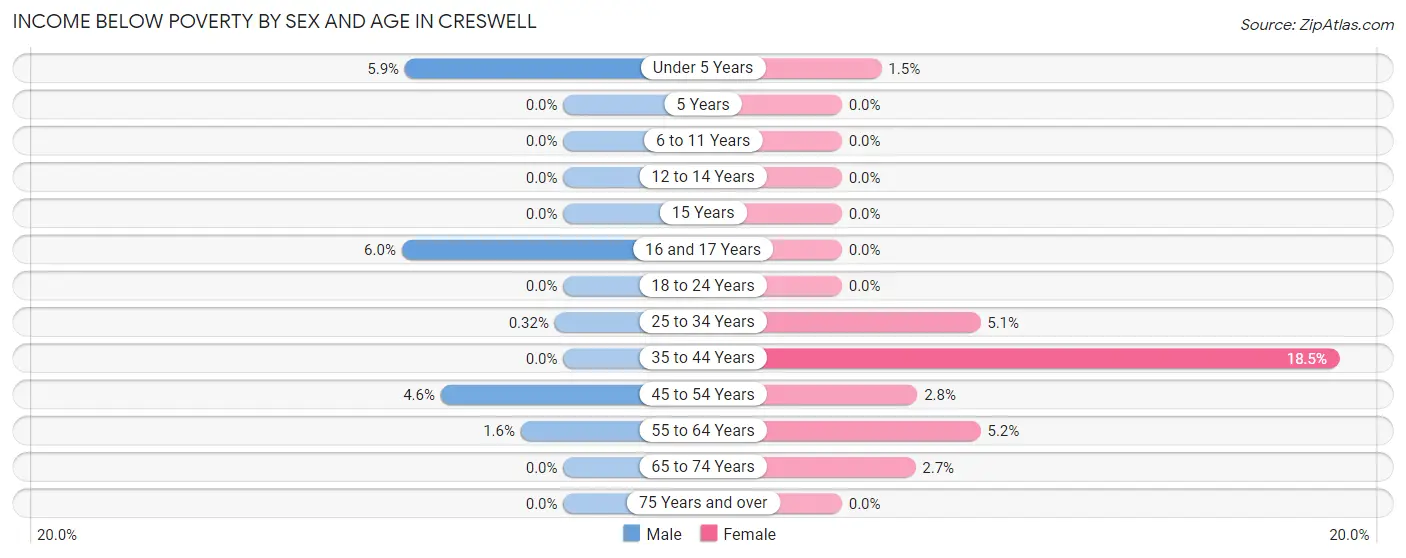
| Age Bracket | Male | Female |
| Under 5 Years | 10 (5.9%) | 5 (1.5%) |
| 5 Years | 0 (0.0%) | 0 (0.0%) |
| 6 to 11 Years | 0 (0.0%) | 0 (0.0%) |
| 12 to 14 Years | 0 (0.0%) | 0 (0.0%) |
| 15 Years | 0 (0.0%) | 0 (0.0%) |
| 16 and 17 Years | 3 (6.0%) | 0 (0.0%) |
| 18 to 24 Years | 0 (0.0%) | 0 (0.0%) |
| 25 to 34 Years | 2 (0.3%) | 19 (5.1%) |
| 35 to 44 Years | 0 (0.0%) | 69 (18.4%) |
| 45 to 54 Years | 11 (4.5%) | 10 (2.8%) |
| 55 to 64 Years | 4 (1.6%) | 15 (5.1%) |
| 65 to 74 Years | 0 (0.0%) | 8 (2.7%) |
| 75 Years and over | 0 (0.0%) | 0 (0.0%) |
| Total | 30 (1.0%) | 126 (4.8%) |
Income Above Poverty by Sex and Age in Creswell
According to the poverty statistics in Creswell, males aged 5 years and females aged 5 years are the age groups that are most secure financially, with 100.0% of males and 100.0% of females in these age groups living above the poverty line.
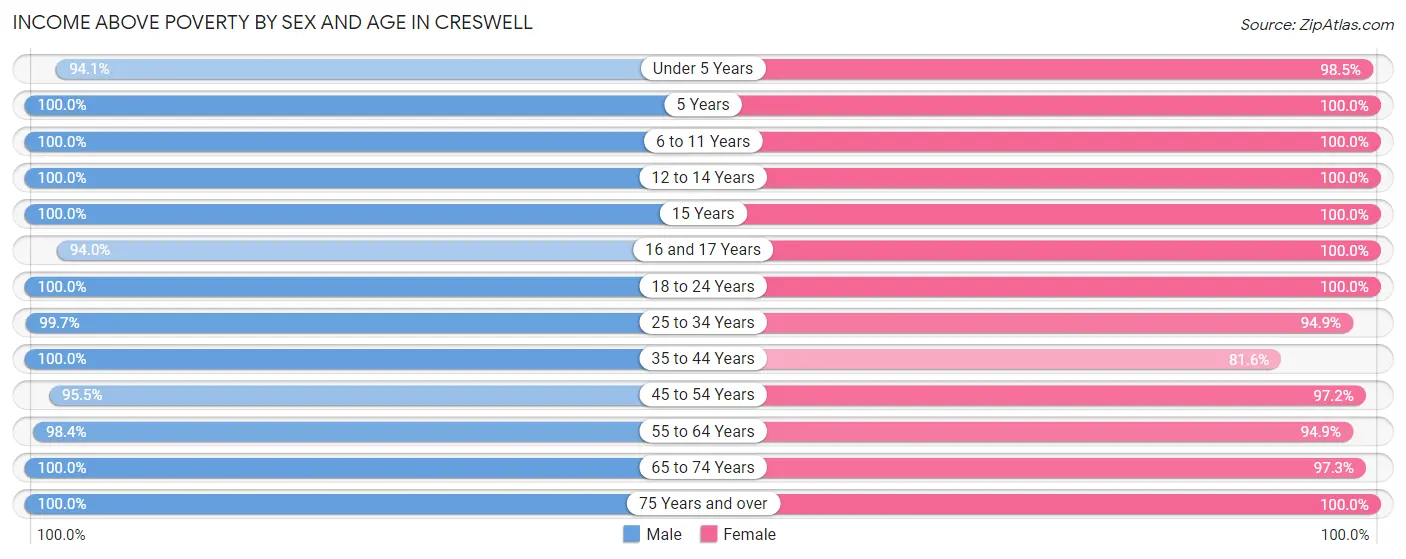
| Age Bracket | Male | Female |
| Under 5 Years | 160 (94.1%) | 335 (98.5%) |
| 5 Years | 21 (100.0%) | 11 (100.0%) |
| 6 to 11 Years | 234 (100.0%) | 188 (100.0%) |
| 12 to 14 Years | 123 (100.0%) | 6 (100.0%) |
| 15 Years | 26 (100.0%) | 35 (100.0%) |
| 16 and 17 Years | 47 (94.0%) | 35 (100.0%) |
| 18 to 24 Years | 182 (100.0%) | 202 (100.0%) |
| 25 to 34 Years | 616 (99.7%) | 351 (94.9%) |
| 35 to 44 Years | 579 (100.0%) | 305 (81.6%) |
| 45 to 54 Years | 231 (95.5%) | 347 (97.2%) |
| 55 to 64 Years | 249 (98.4%) | 276 (94.9%) |
| 65 to 74 Years | 250 (100.0%) | 285 (97.3%) |
| 75 Years and over | 200 (100.0%) | 115 (100.0%) |
| Total | 2,918 (99.0%) | 2,491 (95.2%) |
Income Below Poverty Among Married-Couple Families in Creswell
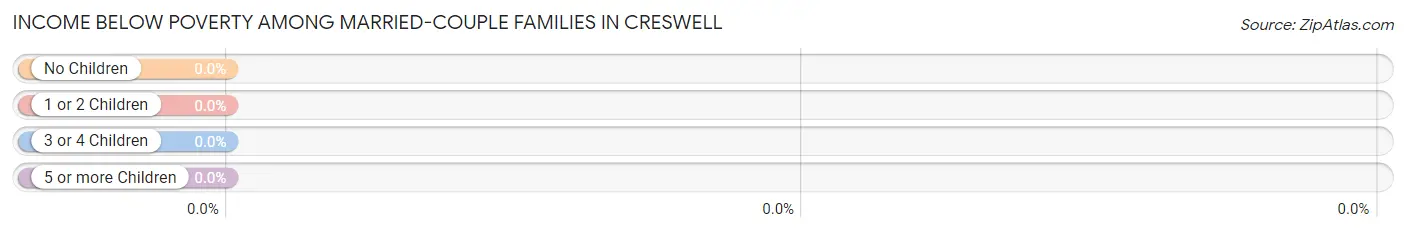
| Children | Above Poverty | Below Poverty |
| No Children | 562 (100.0%) | 0 (0.0%) |
| 1 or 2 Children | 726 (100.0%) | 0 (0.0%) |
| 3 or 4 Children | 54 (100.0%) | 0 (0.0%) |
| 5 or more Children | 0 (0.0%) | 0 (0.0%) |
| Total | 1,342 (100.0%) | 0 (0.0%) |
Income Below Poverty Among Single-Parent Households in Creswell
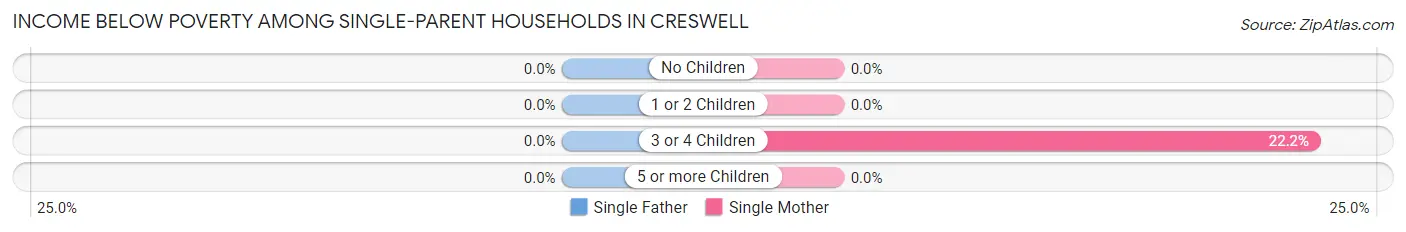
| Children | Single Father | Single Mother |
| No Children | 0 (0.0%) | 0 (0.0%) |
| 1 or 2 Children | 0 (0.0%) | 0 (0.0%) |
| 3 or 4 Children | 0 (0.0%) | 4 (22.2%) |
| 5 or more Children | 0 (0.0%) | 0 (0.0%) |
| Total | 0 (0.0%) | 4 (4.2%) |
Income Below Poverty Among Married-Couple vs Single-Parent Households in Creswell
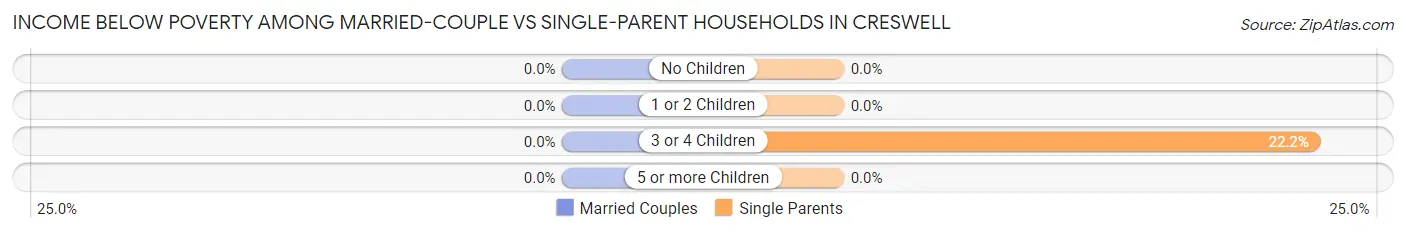
| Children | Married-Couple Families | Single-Parent Households |
| No Children | 0 (0.0%) | 0 (0.0%) |
| 1 or 2 Children | 0 (0.0%) | 0 (0.0%) |
| 3 or 4 Children | 0 (0.0%) | 4 (22.2%) |
| 5 or more Children | 0 (0.0%) | 0 (0.0%) |
| Total | 0 (0.0%) | 4 (1.6%) |
Race in Creswell
The most populous races in Creswell are White / Caucasian (5,023 | 89.6%), Two or more Races (377 | 6.7%), and Hispanic or Latino (237 | 4.2%).
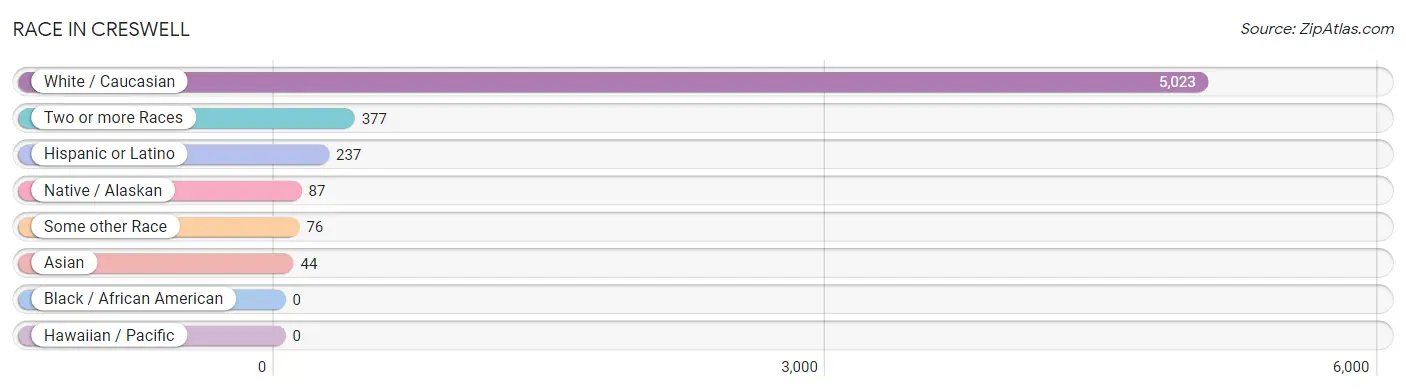
| Race | # Population | % Population |
| Asian | 44 | 0.8% |
| Black / African American | 0 | 0.0% |
| Hawaiian / Pacific | 0 | 0.0% |
| Hispanic or Latino | 237 | 4.2% |
| Native / Alaskan | 87 | 1.5% |
| White / Caucasian | 5,023 | 89.6% |
| Two or more Races | 377 | 6.7% |
| Some other Race | 76 | 1.4% |
| Total | 5,607 | 100.0% |
Ancestry in Creswell
The most populous ancestries reported in Creswell are German (1,527 | 27.2%), English (853 | 15.2%), Irish (697 | 12.4%), American (581 | 10.4%), and French (258 | 4.6%), together accounting for 69.8% of all Creswell residents.
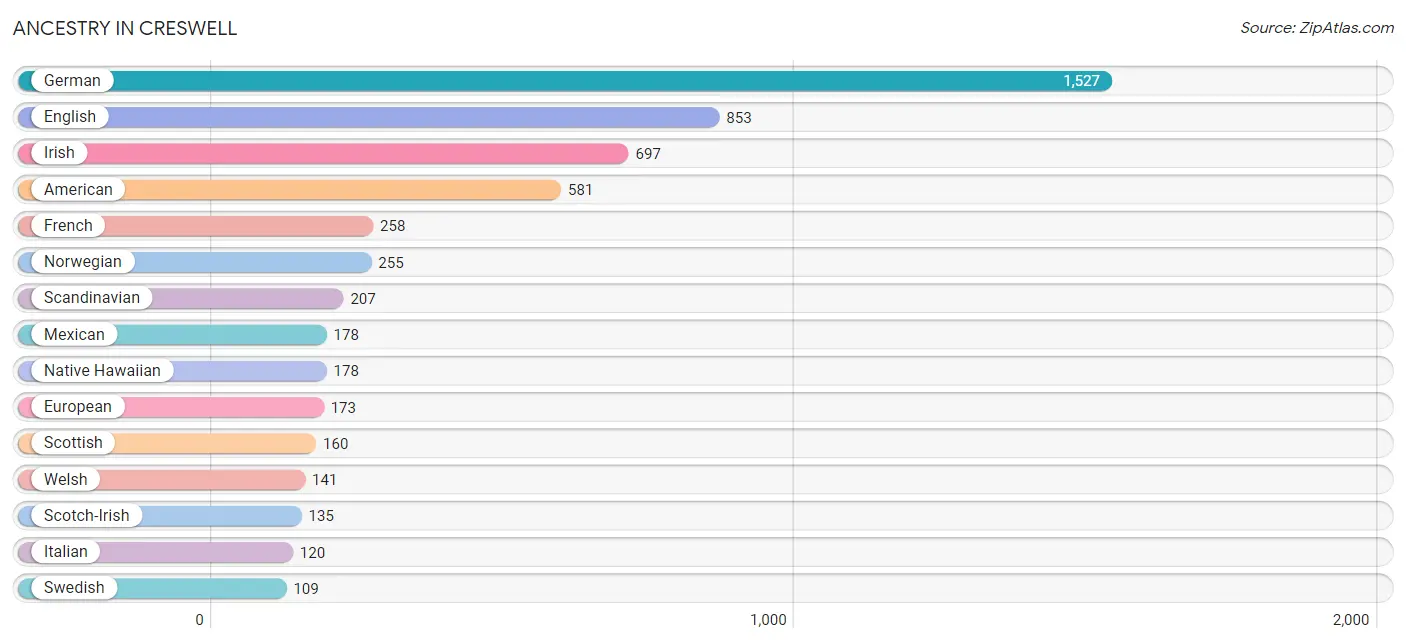
| Ancestry | # Population | % Population |
| Alaskan Athabascan | 9 | 0.2% |
| American | 581 | 10.4% |
| Bhutanese | 59 | 1.1% |
| British | 80 | 1.4% |
| Cherokee | 84 | 1.5% |
| Danish | 50 | 0.9% |
| Dutch | 28 | 0.5% |
| English | 853 | 15.2% |
| European | 173 | 3.1% |
| French | 258 | 4.6% |
| French Canadian | 9 | 0.2% |
| German | 1,527 | 27.2% |
| Inupiat | 38 | 0.7% |
| Irish | 697 | 12.4% |
| Italian | 120 | 2.1% |
| Korean | 106 | 1.9% |
| Lithuanian | 9 | 0.2% |
| Mexican | 178 | 3.2% |
| Native Hawaiian | 178 | 3.2% |
| Norwegian | 255 | 4.5% |
| Peruvian | 10 | 0.2% |
| Polish | 47 | 0.8% |
| Portuguese | 43 | 0.8% |
| Puerto Rican | 33 | 0.6% |
| Romanian | 1 | 0.0% |
| Russian | 22 | 0.4% |
| Samoan | 10 | 0.2% |
| Scandinavian | 207 | 3.7% |
| Scotch-Irish | 135 | 2.4% |
| Scottish | 160 | 2.9% |
| South American | 10 | 0.2% |
| Spaniard | 13 | 0.2% |
| Swedish | 109 | 1.9% |
| Welsh | 141 | 2.5% | View All 34 Rows |
Immigrants in Creswell
The most numerous immigrant groups reported in Creswell came from Latin America (88 | 1.6%), Central America (78 | 1.4%), Mexico (78 | 1.4%), Europe (31 | 0.5%), and Asia (29 | 0.5%), together accounting for 5.4% of all Creswell residents.
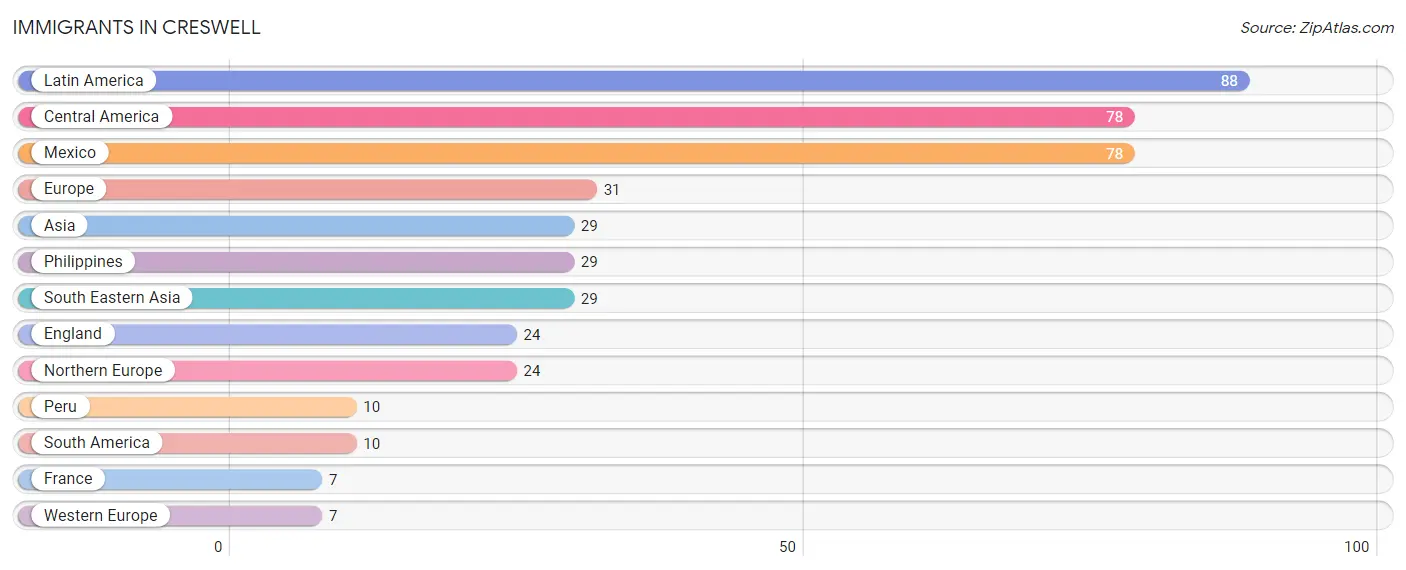
| Immigration Origin | # Population | % Population |
| Asia | 29 | 0.5% |
| Central America | 78 | 1.4% |
| England | 24 | 0.4% |
| Europe | 31 | 0.5% |
| France | 7 | 0.1% |
| Latin America | 88 | 1.6% |
| Mexico | 78 | 1.4% |
| Northern Europe | 24 | 0.4% |
| Peru | 10 | 0.2% |
| Philippines | 29 | 0.5% |
| South America | 10 | 0.2% |
| South Eastern Asia | 29 | 0.5% |
| Western Europe | 7 | 0.1% | View All 13 Rows |
Sex and Age in Creswell
Sex and Age in Creswell
The most populous age groups in Creswell are 25 to 29 Years (426 | 14.4%) for men and Under 5 Years (340 | 12.8%) for women.
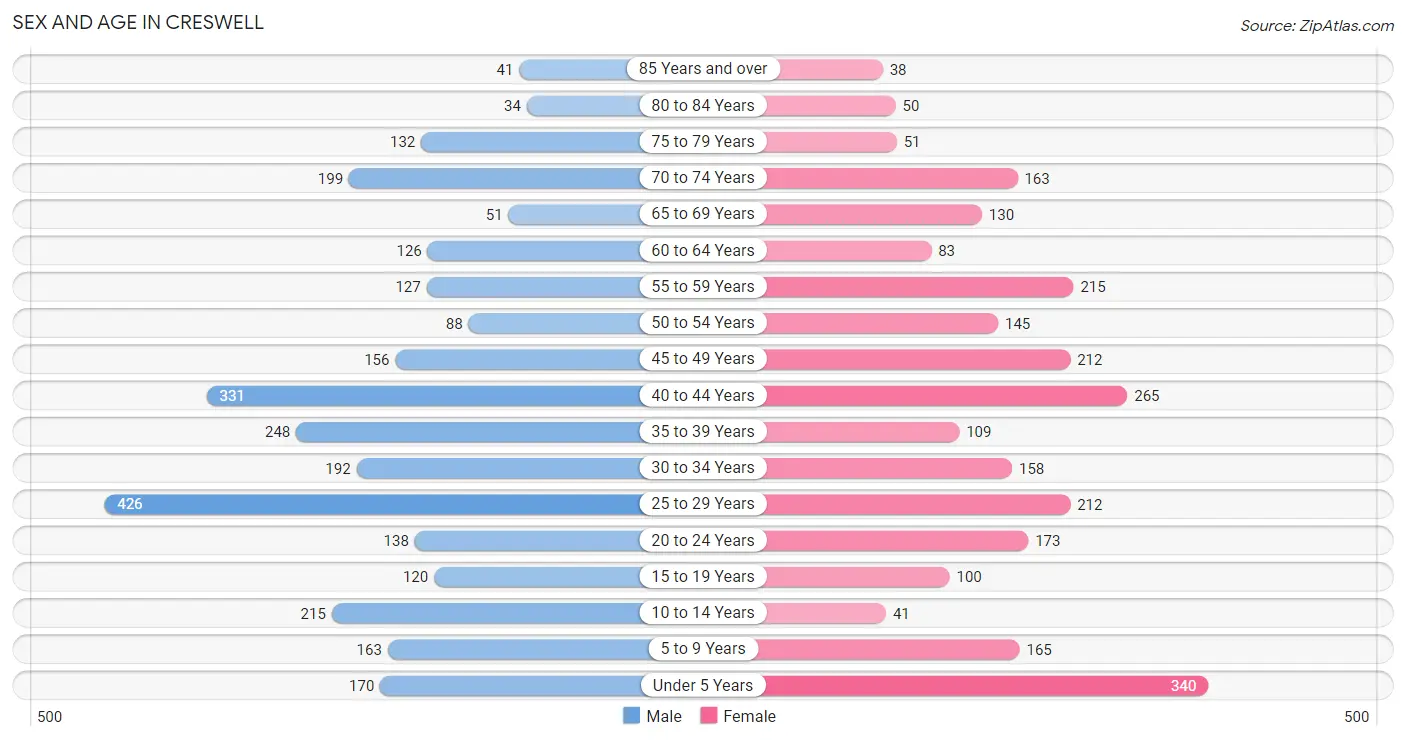
| Age Bracket | Male | Female |
| Under 5 Years | 170 (5.8%) | 340 (12.8%) |
| 5 to 9 Years | 163 (5.5%) | 165 (6.2%) |
| 10 to 14 Years | 215 (7.3%) | 41 (1.5%) |
| 15 to 19 Years | 120 (4.1%) | 100 (3.8%) |
| 20 to 24 Years | 138 (4.7%) | 173 (6.5%) |
| 25 to 29 Years | 426 (14.4%) | 212 (8.0%) |
| 30 to 34 Years | 192 (6.5%) | 158 (6.0%) |
| 35 to 39 Years | 248 (8.4%) | 109 (4.1%) |
| 40 to 44 Years | 331 (11.2%) | 265 (10.0%) |
| 45 to 49 Years | 156 (5.3%) | 212 (8.0%) |
| 50 to 54 Years | 88 (3.0%) | 145 (5.5%) |
| 55 to 59 Years | 127 (4.3%) | 215 (8.1%) |
| 60 to 64 Years | 126 (4.3%) | 83 (3.1%) |
| 65 to 69 Years | 51 (1.7%) | 130 (4.9%) |
| 70 to 74 Years | 199 (6.7%) | 163 (6.1%) |
| 75 to 79 Years | 132 (4.5%) | 51 (1.9%) |
| 80 to 84 Years | 34 (1.1%) | 50 (1.9%) |
| 85 Years and over | 41 (1.4%) | 38 (1.4%) |
| Total | 2,957 (100.0%) | 2,650 (100.0%) |
Families and Households in Creswell
Median Family Size in Creswell
The median family size in Creswell is 3.02 persons per family, with married-couple families (1,342 | 84.4%) accounting for the largest median family size of 3.14 persons per family. On the other hand, single male/father families (153 | 9.6%) represent the smallest median family size with 2.07 persons per family.
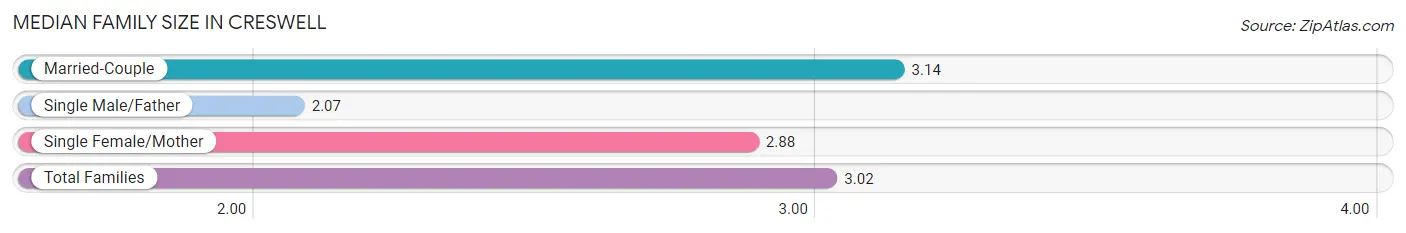
| Family Type | # Families | Family Size |
| Married-Couple | 1,342 (84.4%) | 3.14 |
| Single Male/Father | 153 (9.6%) | 2.07 |
| Single Female/Mother | 95 (6.0%) | 2.88 |
| Total Families | 1,590 (100.0%) | 3.02 |
Median Household Size in Creswell
The median household size in Creswell is 2.72 persons per household, with married-couple households (1,342 | 65.9%) accounting for the largest median household size of 3.14 persons per household. non-family households (447 | 21.9%) represent the smallest median household size with 1.36 persons per household.
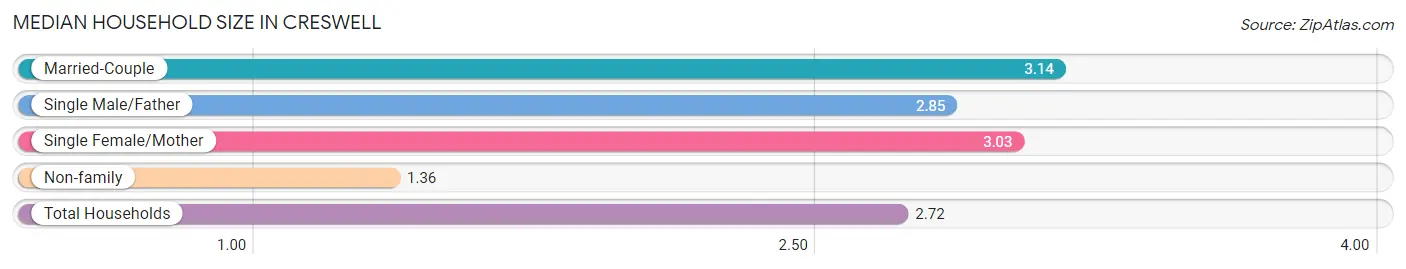
| Household Type | # Households | Household Size |
| Married-Couple | 1,342 (65.9%) | 3.14 |
| Single Male/Father | 153 (7.5%) | 2.85 |
| Single Female/Mother | 95 (4.7%) | 3.03 |
| Non-family | 447 (21.9%) | 1.36 |
| Total Households | 2,037 (100.0%) | 2.72 |
Household Size by Marriage Status in Creswell
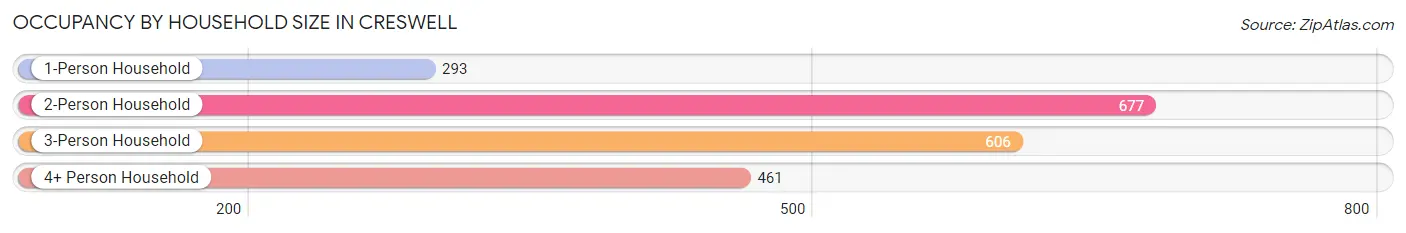
Out of a total of 2,037 households in Creswell, 1,590 (78.1%) are family households, while 447 (21.9%) are nonfamily households. The most numerous type of family households are 3-person households, comprising 606, and the most common type of nonfamily households are 1-person households, comprising 293.
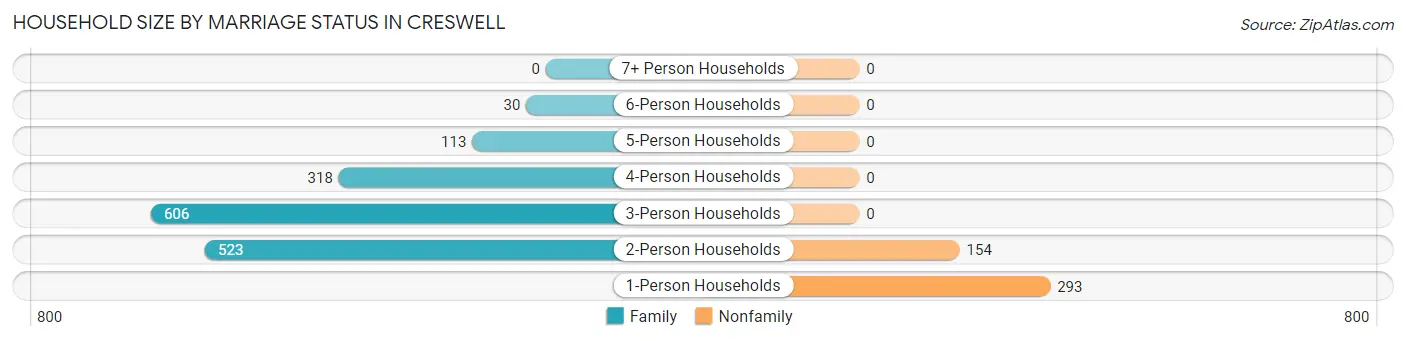
| Household Size | Family Households | Nonfamily Households |
| 1-Person Households | - | 293 (14.4%) |
| 2-Person Households | 523 (25.7%) | 154 (7.6%) |
| 3-Person Households | 606 (29.7%) | 0 (0.0%) |
| 4-Person Households | 318 (15.6%) | 0 (0.0%) |
| 5-Person Households | 113 (5.6%) | 0 (0.0%) |
| 6-Person Households | 30 (1.5%) | 0 (0.0%) |
| 7+ Person Households | 0 (0.0%) | 0 (0.0%) |
| Total | 1,590 (78.1%) | 447 (21.9%) |
Female Fertility in Creswell
Fertility by Age in Creswell
Average fertility rate in Creswell is 110.0 births per 1,000 women. Women in the age bracket of 20 to 34 years have the highest fertility rate with 206.0 births per 1,000 women. Women in the age bracket of 20 to 34 years acount for 81.8% of all women with births.
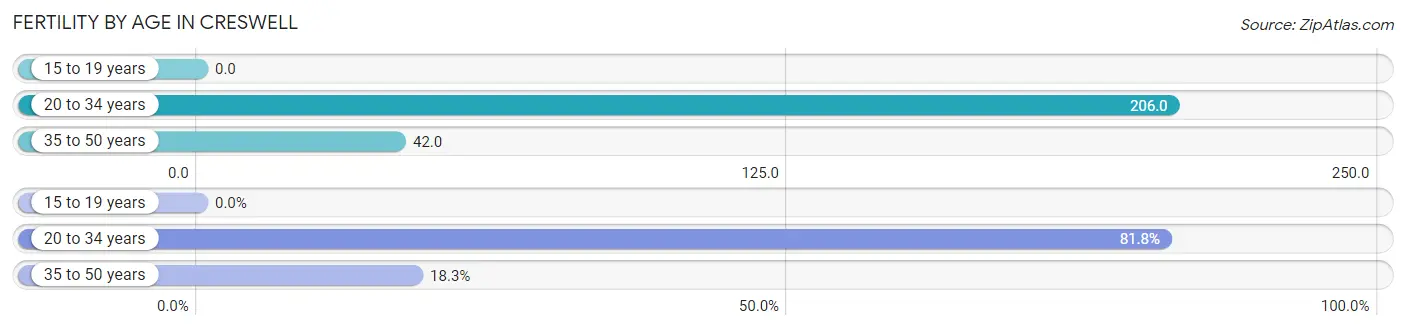
| Age Bracket | Women with Births | Births / 1,000 Women |
| 15 to 19 years | 0 (0.0%) | 0.0 |
| 20 to 34 years | 112 (81.8%) | 206.0 |
| 35 to 50 years | 25 (18.2%) | 42.0 |
| Total | 137 (100.0%) | 110.0 |
Fertility by Age by Marriage Status in Creswell
97.1% of women with births (137) in Creswell are married. The highest percentage of unmarried women with births falls into 20 to 34 years age bracket with 3.6% of them unmarried at the time of birth, while the lowest percentage of unmarried women with births belong to 35 to 50 years age bracket with 0.0% of them unmarried.
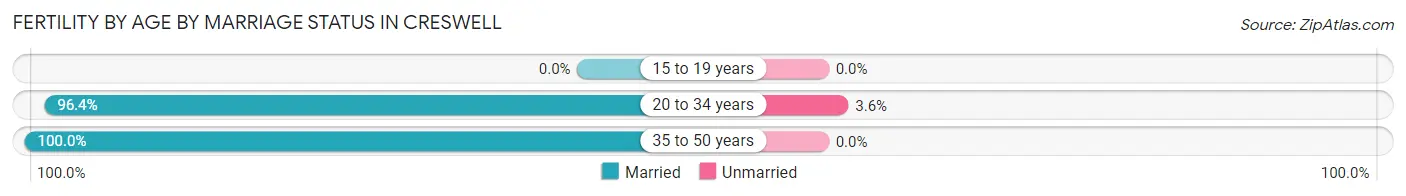
| Age Bracket | Married | Unmarried |
| 15 to 19 years | 0 (0.0%) | 0 (0.0%) |
| 20 to 34 years | 108 (96.4%) | 4 (3.6%) |
| 35 to 50 years | 25 (100.0%) | 0 (0.0%) |
| Total | 133 (97.1%) | 4 (2.9%) |
Fertility by Education in Creswell
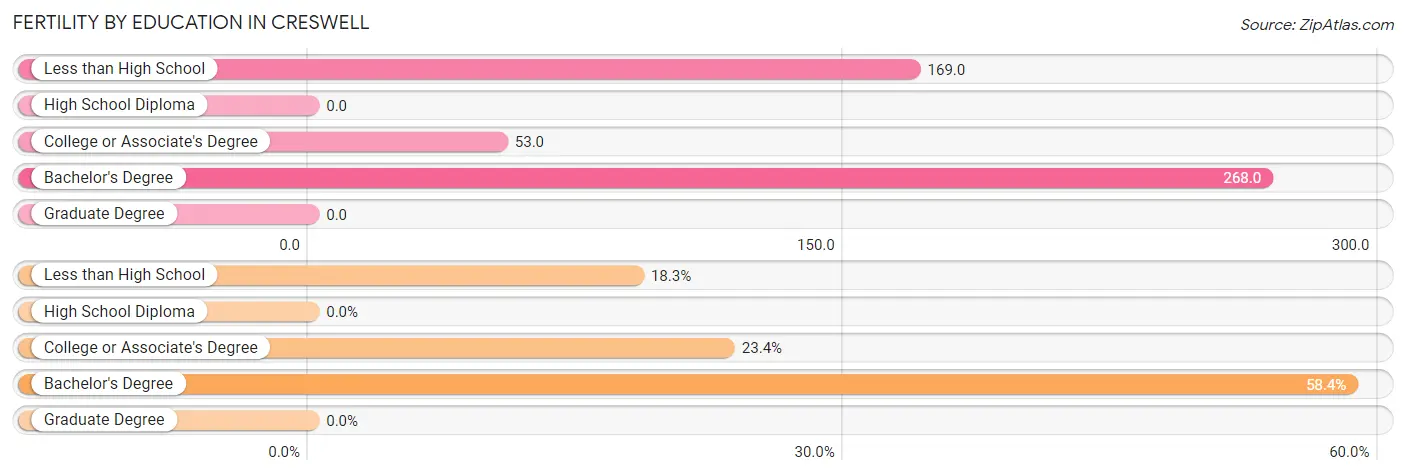
| Educational Attainment | Women with Births | Births / 1,000 Women |
| Less than High School | 25 (18.2%) | 169.0 |
| High School Diploma | 0 (0.0%) | 0.0 |
| College or Associate's Degree | 32 (23.4%) | 53.0 |
| Bachelor's Degree | 80 (58.4%) | 268.0 |
| Graduate Degree | 0 (0.0%) | 0.0 |
| Total | 137 (100.0%) | 110.0 |
Fertility by Education by Marriage Status in Creswell
2.9% of women with births in Creswell are unmarried. Women with the educational attainment of less than high school are most likely to be married with 100.0% of them married at childbirth, while women with the educational attainment of college or associate's degree are least likely to be married with 12.5% of them unmarried at childbirth.
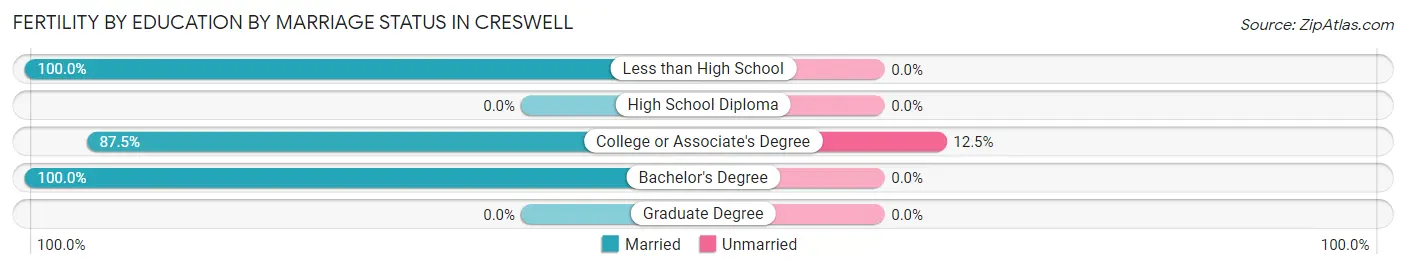
| Educational Attainment | Married | Unmarried |
| Less than High School | 25 (100.0%) | 0 (0.0%) |
| High School Diploma | 0 (0.0%) | 0 (0.0%) |
| College or Associate's Degree | 28 (87.5%) | 4 (12.5%) |
| Bachelor's Degree | 80 (100.0%) | 0 (0.0%) |
| Graduate Degree | 0 (0.0%) | 0 (0.0%) |
| Total | 133 (97.1%) | 4 (2.9%) |
Employment Characteristics in Creswell
Employment by Class of Employer in Creswell
Among the 2,978 employed individuals in Creswell, private company employees (1,800 | 60.4%), local government employees (401 | 13.5%), and self-employed (not incorporated) (191 | 6.4%) make up the most common classes of employment.
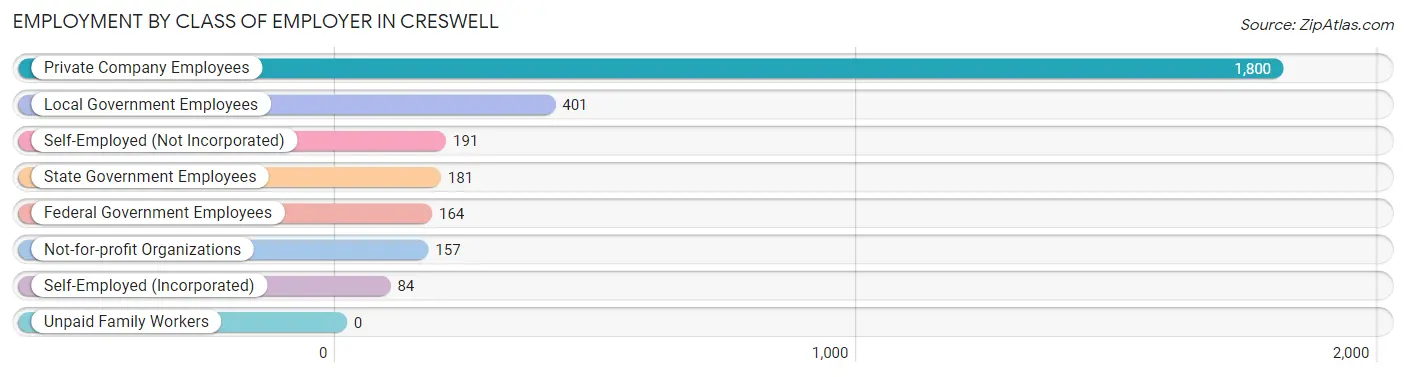
| Employer Class | # Employees | % Employees |
| Private Company Employees | 1,800 | 60.4% |
| Self-Employed (Incorporated) | 84 | 2.8% |
| Self-Employed (Not Incorporated) | 191 | 6.4% |
| Not-for-profit Organizations | 157 | 5.3% |
| Local Government Employees | 401 | 13.5% |
| State Government Employees | 181 | 6.1% |
| Federal Government Employees | 164 | 5.5% |
| Unpaid Family Workers | 0 | 0.0% |
| Total | 2,978 | 100.0% |
Employment Status by Age in Creswell
According to the labor force statistics for Creswell, out of the total population over 16 years of age (4,451), 67.6% or 3,009 individuals are in the labor force, with 1.0% or 30 of them unemployed. The age group with the highest labor force participation rate is 35 to 44 years, with 89.0% or 848 individuals in the labor force. Within the labor force, the 20 to 24 years age range has the highest percentage of unemployed individuals, with 4.7% or 12 of them being unemployed.
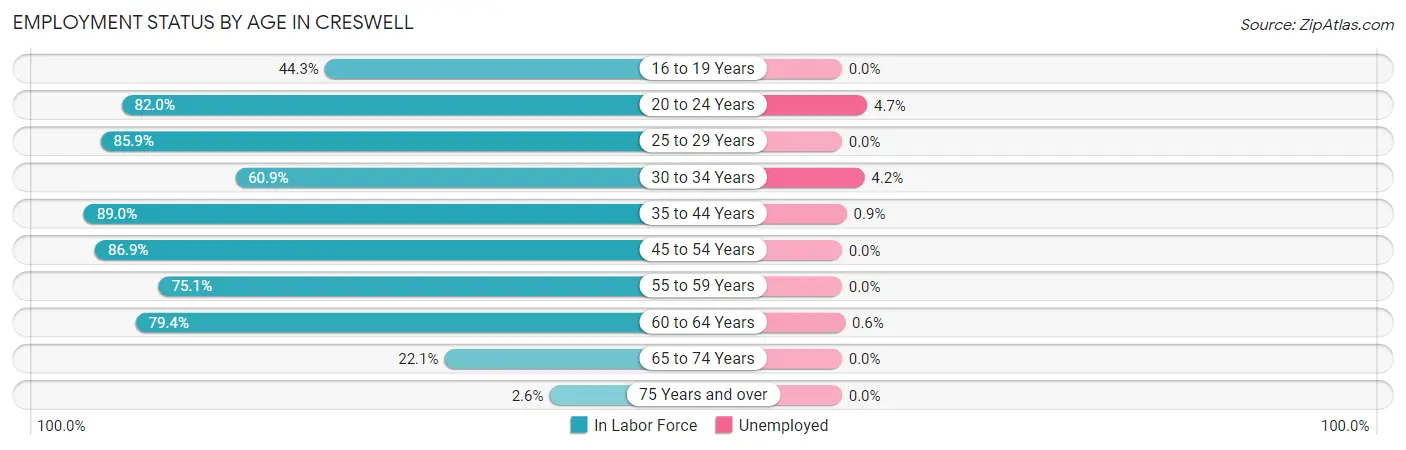
| Age Bracket | In Labor Force | Unemployed |
| 16 to 19 Years | 70 (44.3%) | 0 (0.0%) |
| 20 to 24 Years | 255 (82.0%) | 12 (4.7%) |
| 25 to 29 Years | 548 (85.9%) | 0 (0.0%) |
| 30 to 34 Years | 213 (60.9%) | 9 (4.2%) |
| 35 to 44 Years | 848 (89.0%) | 8 (0.9%) |
| 45 to 54 Years | 522 (86.9%) | 0 (0.0%) |
| 55 to 59 Years | 257 (75.1%) | 0 (0.0%) |
| 60 to 64 Years | 166 (79.4%) | 1 (0.6%) |
| 65 to 74 Years | 120 (22.1%) | 0 (0.0%) |
| 75 Years and over | 9 (2.6%) | 0 (0.0%) |
| Total | 3,009 (67.6%) | 30 (1.0%) |
Employment Status by Educational Attainment in Creswell
According to labor force statistics for Creswell, 82.6% of individuals (2,555) out of the total population between 25 and 64 years of age (3,093) are in the labor force, with 0.7% or 18 of them being unemployed. The group with the highest labor force participation rate are those with the educational attainment of college / associate degree, with 89.2% or 987 individuals in the labor force. Within the labor force, individuals with less than high school education have the highest percentage of unemployment, with 5.1% or 5 of them being unemployed.
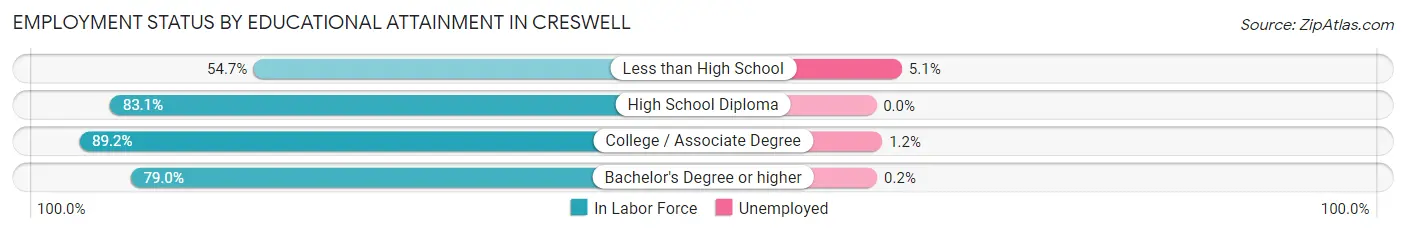
| Educational Attainment | In Labor Force | Unemployed |
| Less than High School | 99 (54.7%) | 9 (5.1%) |
| High School Diploma | 863 (83.1%) | 0 (0.0%) |
| College / Associate Degree | 987 (89.2%) | 13 (1.2%) |
| Bachelor's Degree or higher | 605 (79.0%) | 2 (0.2%) |
| Total | 2,555 (82.6%) | 22 (0.7%) |
Employment Occupations by Sex in Creswell
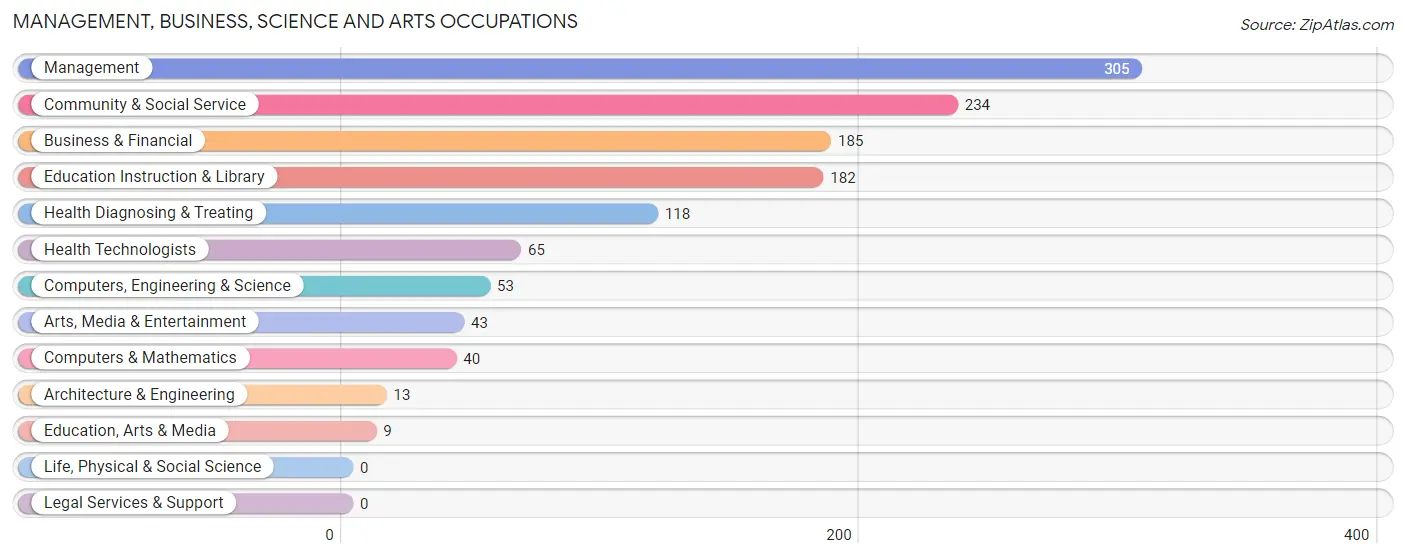
Management, Business, Science and Arts Occupations
The most common Management, Business, Science and Arts occupations in Creswell are Management (305 | 10.2%), Community & Social Service (234 | 7.9%), Business & Financial (185 | 6.2%), Education Instruction & Library (182 | 6.1%), and Health Diagnosing & Treating (118 | 4.0%).
Management, Business, Science and Arts Occupations by Sex
Within the Management, Business, Science and Arts occupations in Creswell, the most male-oriented occupations are Architecture & Engineering (100.0%), Management (59.7%), and Computers, Engineering & Science (54.7%), while the most female-oriented occupations are Education, Arts & Media (100.0%), Health Technologists (100.0%), and Business & Financial (87.0%).
| Occupation | Male | Female |
| Management | 182 (59.7%) | 123 (40.3%) |
| Business & Financial | 24 (13.0%) | 161 (87.0%) |
| Computers, Engineering & Science | 29 (54.7%) | 24 (45.3%) |
| Computers & Mathematics | 16 (40.0%) | 24 (60.0%) |
| Architecture & Engineering | 13 (100.0%) | 0 (0.0%) |
| Life, Physical & Social Science | 0 (0.0%) | 0 (0.0%) |
| Community & Social Service | 44 (18.8%) | 190 (81.2%) |
| Education, Arts & Media | 0 (0.0%) | 9 (100.0%) |
| Legal Services & Support | 0 (0.0%) | 0 (0.0%) |
| Education Instruction & Library | 34 (18.7%) | 148 (81.3%) |
| Arts, Media & Entertainment | 10 (23.3%) | 33 (76.7%) |
| Health Diagnosing & Treating | 53 (44.9%) | 65 (55.1%) |
| Health Technologists | 0 (0.0%) | 65 (100.0%) |
| Total (Category) | 332 (37.1%) | 563 (62.9%) |
| Total (Overall) | 1,797 (60.3%) | 1,181 (39.7%) |
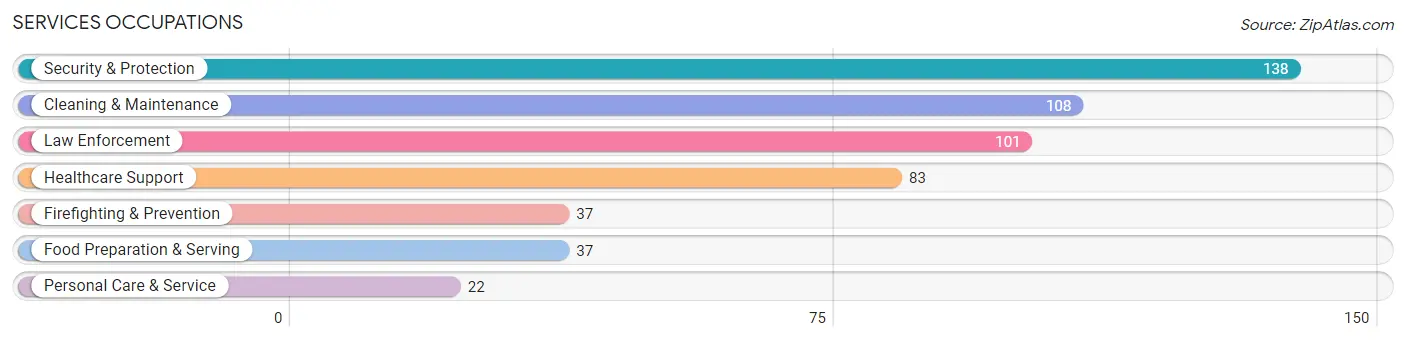
Services Occupations
The most common Services occupations in Creswell are Security & Protection (138 | 4.6%), Cleaning & Maintenance (108 | 3.6%), Law Enforcement (101 | 3.4%), Healthcare Support (83 | 2.8%), and Firefighting & Prevention (37 | 1.2%).
Services Occupations by Sex
Within the Services occupations in Creswell, the most male-oriented occupations are Security & Protection (100.0%), Firefighting & Prevention (100.0%), and Law Enforcement (100.0%), while the most female-oriented occupations are Healthcare Support (100.0%), Food Preparation & Serving (100.0%), and Personal Care & Service (100.0%).
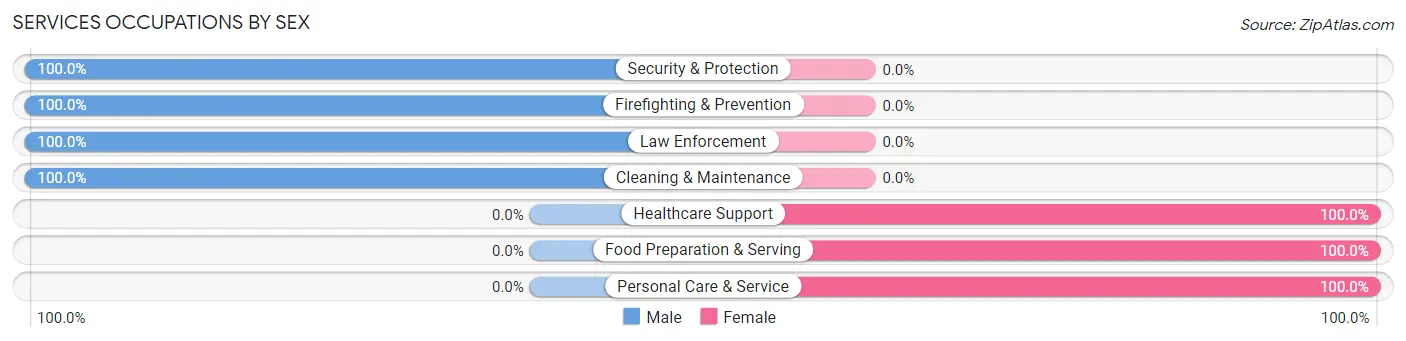
| Occupation | Male | Female |
| Healthcare Support | 0 (0.0%) | 83 (100.0%) |
| Security & Protection | 138 (100.0%) | 0 (0.0%) |
| Firefighting & Prevention | 37 (100.0%) | 0 (0.0%) |
| Law Enforcement | 101 (100.0%) | 0 (0.0%) |
| Food Preparation & Serving | 0 (0.0%) | 37 (100.0%) |
| Cleaning & Maintenance | 108 (100.0%) | 0 (0.0%) |
| Personal Care & Service | 0 (0.0%) | 22 (100.0%) |
| Total (Category) | 246 (63.4%) | 142 (36.6%) |
| Total (Overall) | 1,797 (60.3%) | 1,181 (39.7%) |
Sales and Office Occupations
The most common Sales and Office occupations in Creswell are Office & Administration (338 | 11.4%), and Sales & Related (320 | 10.7%).
Sales and Office Occupations by Sex
| Occupation | Male | Female |
| Sales & Related | 169 (52.8%) | 151 (47.2%) |
| Office & Administration | 140 (41.4%) | 198 (58.6%) |
| Total (Category) | 309 (47.0%) | 349 (53.0%) |
| Total (Overall) | 1,797 (60.3%) | 1,181 (39.7%) |
Natural Resources, Construction and Maintenance Occupations
The most common Natural Resources, Construction and Maintenance occupations in Creswell are Installation, Maintenance & Repair (246 | 8.3%), Construction & Extraction (177 | 5.9%), and Farming, Fishing & Forestry (58 | 1.9%).
Natural Resources, Construction and Maintenance Occupations by Sex
| Occupation | Male | Female |
| Farming, Fishing & Forestry | 58 (100.0%) | 0 (0.0%) |
| Construction & Extraction | 171 (96.6%) | 6 (3.4%) |
| Installation, Maintenance & Repair | 246 (100.0%) | 0 (0.0%) |
| Total (Category) | 475 (98.8%) | 6 (1.3%) |
| Total (Overall) | 1,797 (60.3%) | 1,181 (39.7%) |
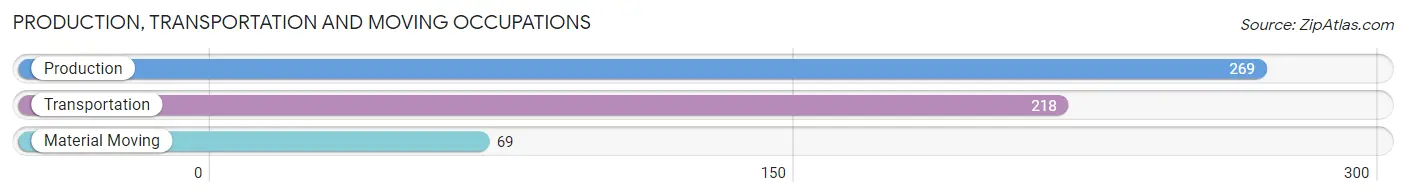
Production, Transportation and Moving Occupations
The most common Production, Transportation and Moving occupations in Creswell are Production (269 | 9.0%), Transportation (218 | 7.3%), and Material Moving (69 | 2.3%).
Production, Transportation and Moving Occupations by Sex
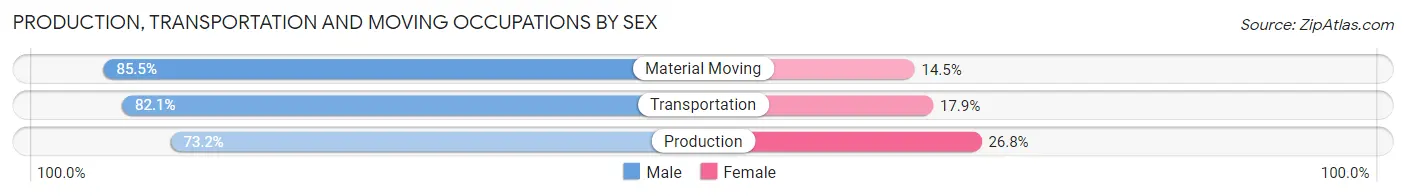
| Occupation | Male | Female |
| Production | 197 (73.2%) | 72 (26.8%) |
| Transportation | 179 (82.1%) | 39 (17.9%) |
| Material Moving | 59 (85.5%) | 10 (14.5%) |
| Total (Category) | 435 (78.2%) | 121 (21.8%) |
| Total (Overall) | 1,797 (60.3%) | 1,181 (39.7%) |
Employment Industries by Sex in Creswell
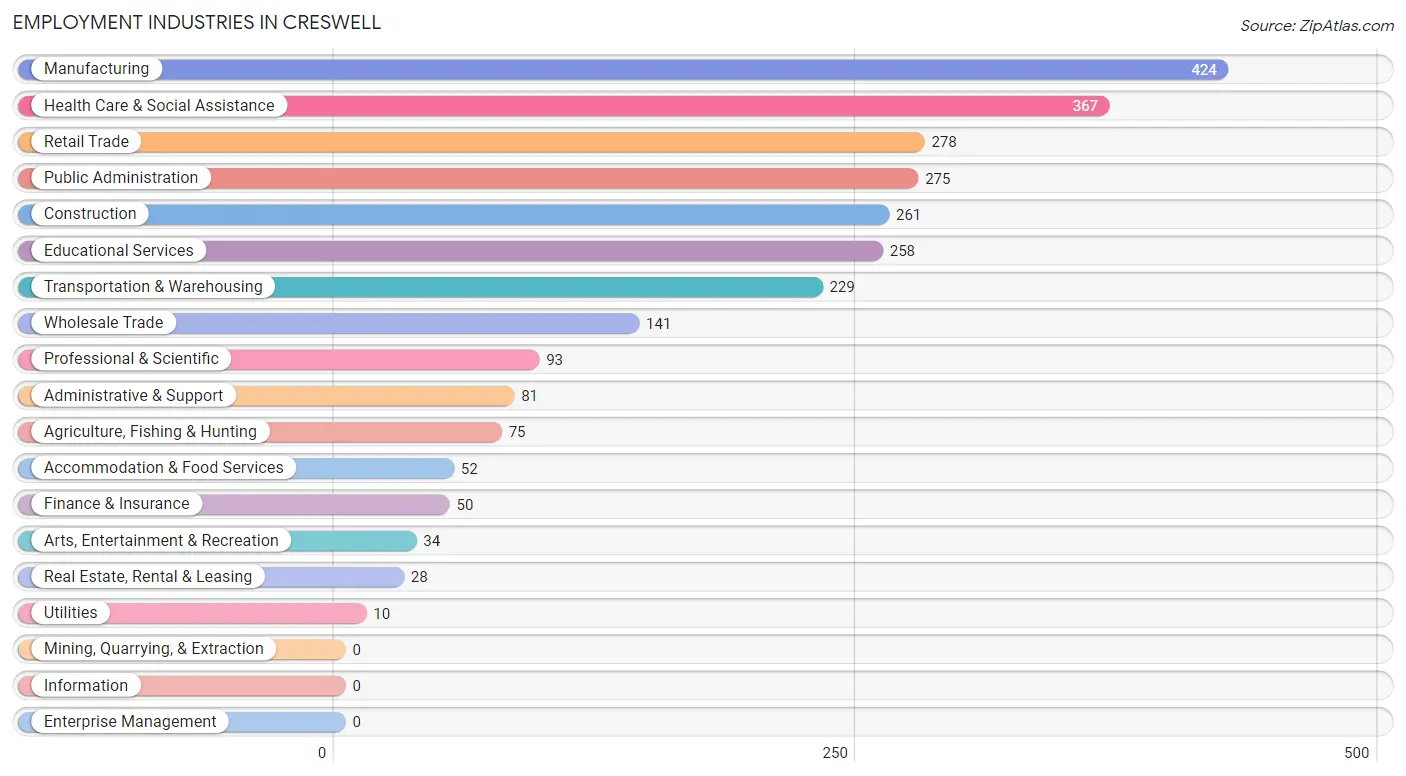
Employment Industries in Creswell
The major employment industries in Creswell include Manufacturing (424 | 14.2%), Health Care & Social Assistance (367 | 12.3%), Retail Trade (278 | 9.3%), Public Administration (275 | 9.2%), and Construction (261 | 8.8%).
Employment Industries by Sex in Creswell
The Creswell industries that see more men than women are Utilities (100.0%), Administrative & Support (100.0%), and Transportation & Warehousing (92.6%), whereas the industries that tend to have a higher number of women are Accommodation & Food Services (100.0%), Educational Services (84.5%), and Health Care & Social Assistance (70.3%).
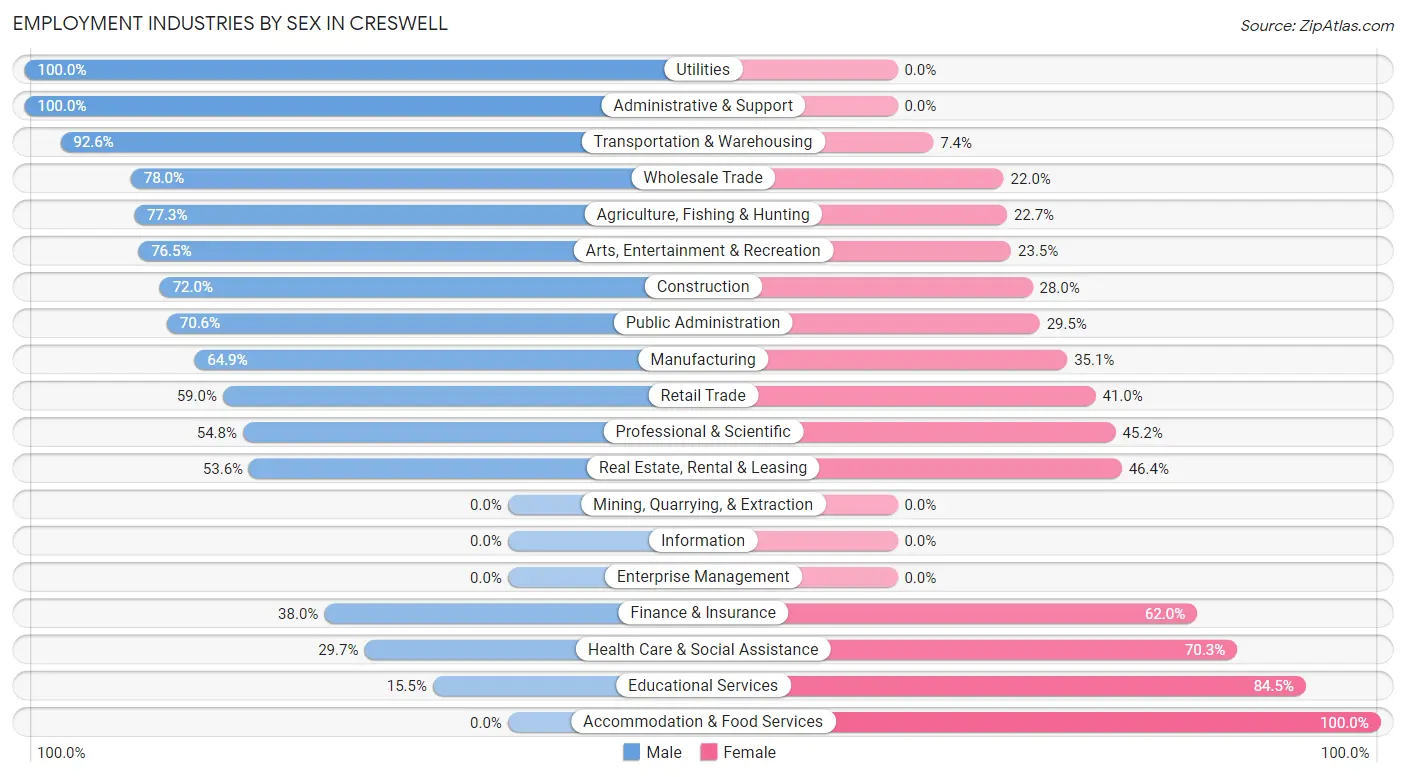
| Industry | Male | Female |
| Agriculture, Fishing & Hunting | 58 (77.3%) | 17 (22.7%) |
| Mining, Quarrying, & Extraction | 0 (0.0%) | 0 (0.0%) |
| Construction | 188 (72.0%) | 73 (28.0%) |
| Manufacturing | 275 (64.9%) | 149 (35.1%) |
| Wholesale Trade | 110 (78.0%) | 31 (22.0%) |
| Retail Trade | 164 (59.0%) | 114 (41.0%) |
| Transportation & Warehousing | 212 (92.6%) | 17 (7.4%) |
| Utilities | 10 (100.0%) | 0 (0.0%) |
| Information | 0 (0.0%) | 0 (0.0%) |
| Finance & Insurance | 19 (38.0%) | 31 (62.0%) |
| Real Estate, Rental & Leasing | 15 (53.6%) | 13 (46.4%) |
| Professional & Scientific | 51 (54.8%) | 42 (45.2%) |
| Enterprise Management | 0 (0.0%) | 0 (0.0%) |
| Administrative & Support | 81 (100.0%) | 0 (0.0%) |
| Educational Services | 40 (15.5%) | 218 (84.5%) |
| Health Care & Social Assistance | 109 (29.7%) | 258 (70.3%) |
| Arts, Entertainment & Recreation | 26 (76.5%) | 8 (23.5%) |
| Accommodation & Food Services | 0 (0.0%) | 52 (100.0%) |
| Public Administration | 194 (70.6%) | 81 (29.4%) |
| Total | 1,797 (60.3%) | 1,181 (39.7%) |
Education in Creswell
School Enrollment in Creswell
The most common levels of schooling among the 970 students in Creswell are middle school (240 | 24.7%), elementary school (199 | 20.5%), and college / undergraduate (199 | 20.5%).
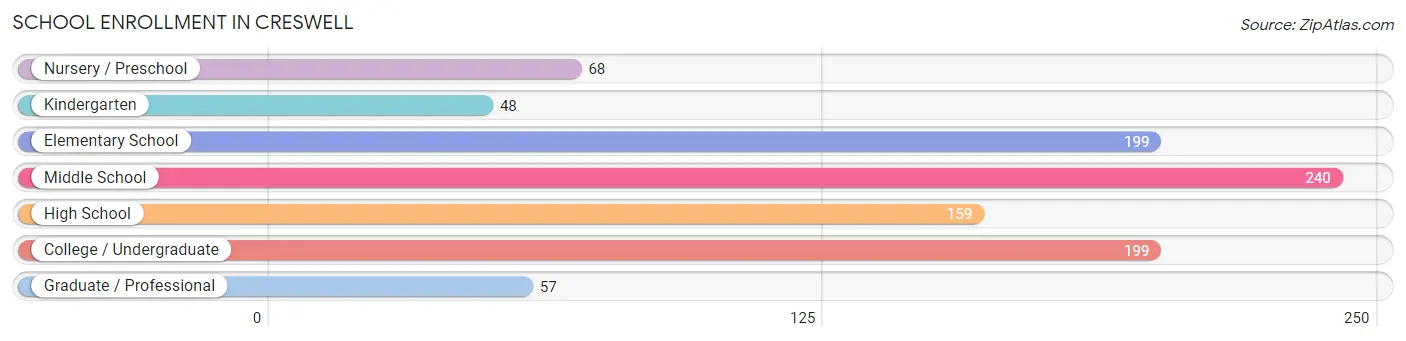
| School Level | # Students | % Students |
| Nursery / Preschool | 68 | 7.0% |
| Kindergarten | 48 | 5.0% |
| Elementary School | 199 | 20.5% |
| Middle School | 240 | 24.7% |
| High School | 159 | 16.4% |
| College / Undergraduate | 199 | 20.5% |
| Graduate / Professional | 57 | 5.9% |
| Total | 970 | 100.0% |
School Enrollment by Age by Funding Source in Creswell
Out of a total of 970 students who are enrolled in schools in Creswell, 203 (20.9%) attend a private institution, while the remaining 767 (79.1%) are enrolled in public schools. The age group of 3 to 4 year olds has the highest likelihood of being enrolled in private schools, with 56 (82.4% in the age bracket) enrolled. Conversely, the age group of 5 to 9 year old has the lowest likelihood of being enrolled in a private school, with 231 (100.0% in the age bracket) attending a public institution.
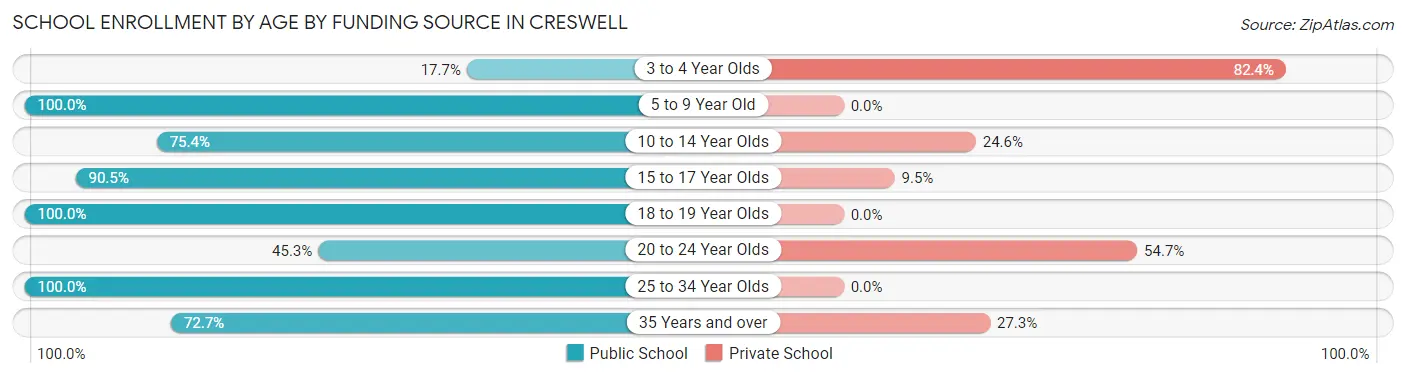
| Age Bracket | Public School | Private School |
| 3 to 4 Year Olds | 12 (17.6%) | 56 (82.4%) |
| 5 to 9 Year Old | 231 (100.0%) | 0 (0.0%) |
| 10 to 14 Year Olds | 193 (75.4%) | 63 (24.6%) |
| 15 to 17 Year Olds | 124 (90.5%) | 13 (9.5%) |
| 18 to 19 Year Olds | 51 (100.0%) | 0 (0.0%) |
| 20 to 24 Year Olds | 34 (45.3%) | 41 (54.7%) |
| 25 to 34 Year Olds | 42 (100.0%) | 0 (0.0%) |
| 35 Years and over | 80 (72.7%) | 30 (27.3%) |
| Total | 767 (79.1%) | 203 (20.9%) |
Educational Attainment by Field of Study in Creswell
Business (320 | 29.0%), arts & humanities (167 | 15.1%), social sciences (126 | 11.4%), liberal arts & history (109 | 9.9%), and education (96 | 8.7%) are the most common fields of study among 1,104 individuals in Creswell who have obtained a bachelor's degree or higher.
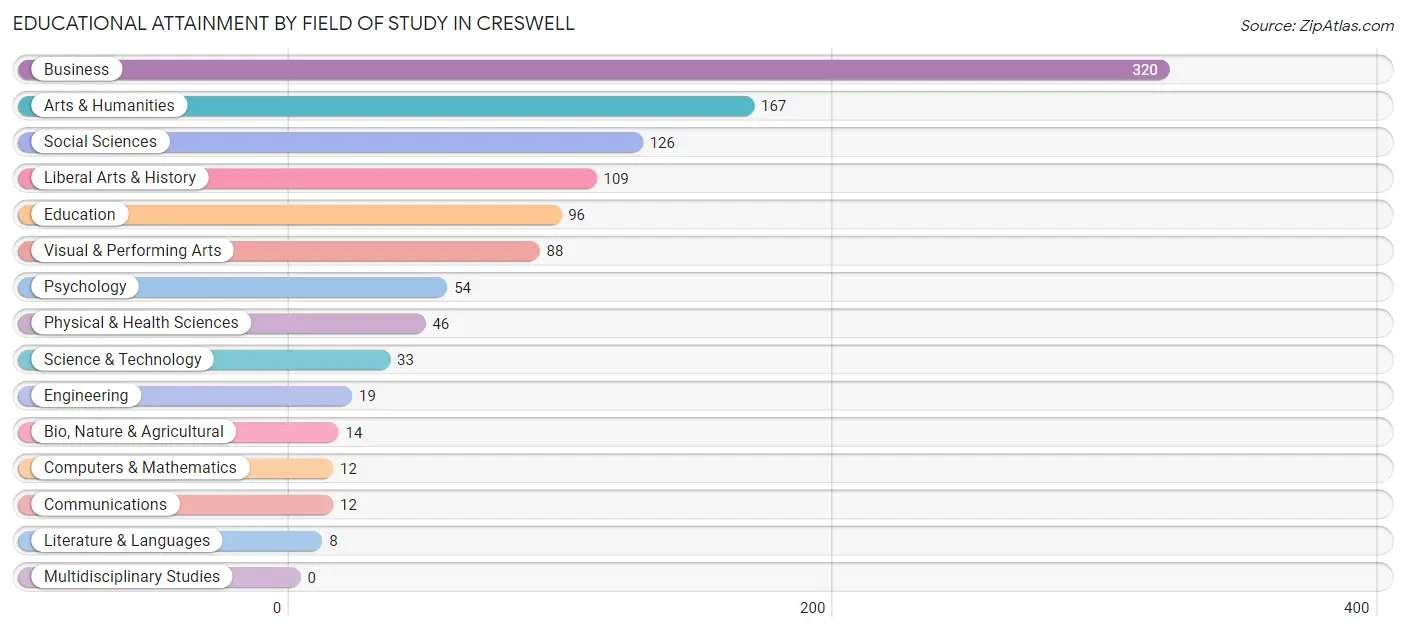
| Field of Study | # Graduates | % Graduates |
| Computers & Mathematics | 12 | 1.1% |
| Bio, Nature & Agricultural | 14 | 1.3% |
| Physical & Health Sciences | 46 | 4.2% |
| Psychology | 54 | 4.9% |
| Social Sciences | 126 | 11.4% |
| Engineering | 19 | 1.7% |
| Multidisciplinary Studies | 0 | 0.0% |
| Science & Technology | 33 | 3.0% |
| Business | 320 | 29.0% |
| Education | 96 | 8.7% |
| Literature & Languages | 8 | 0.7% |
| Liberal Arts & History | 109 | 9.9% |
| Visual & Performing Arts | 88 | 8.0% |
| Communications | 12 | 1.1% |
| Arts & Humanities | 167 | 15.1% |
| Total | 1,104 | 100.0% |
Transportation & Commute in Creswell
Vehicle Availability by Sex in Creswell
The most prevalent vehicle ownership categories in Creswell are males with 2 vehicles (828, accounting for 46.3%) and females with 2 vehicles (627, making up 70.1%).
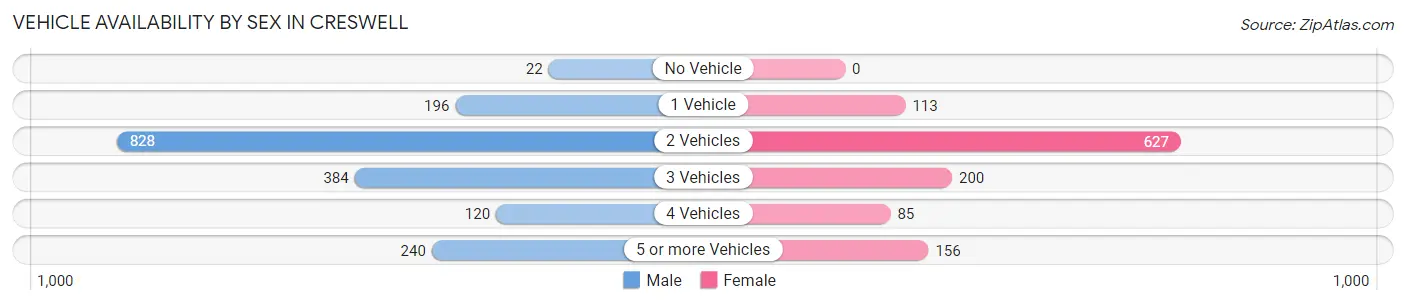
| Vehicles Available | Male | Female |
| No Vehicle | 22 (1.2%) | 0 (0.0%) |
| 1 Vehicle | 196 (11.0%) | 113 (9.6%) |
| 2 Vehicles | 828 (46.3%) | 627 (53.1%) |
| 3 Vehicles | 384 (21.4%) | 200 (16.9%) |
| 4 Vehicles | 120 (6.7%) | 85 (7.2%) |
| 5 or more Vehicles | 240 (13.4%) | 156 (13.2%) |
| Total | 1,790 (100.0%) | 1,181 (100.0%) |
Commute Time in Creswell
The most frequently occuring commute durations in Creswell are 15 to 19 minutes (586 commuters, 21.0%), 20 to 24 minutes (478 commuters, 17.2%), and 10 to 14 minutes (426 commuters, 15.3%).
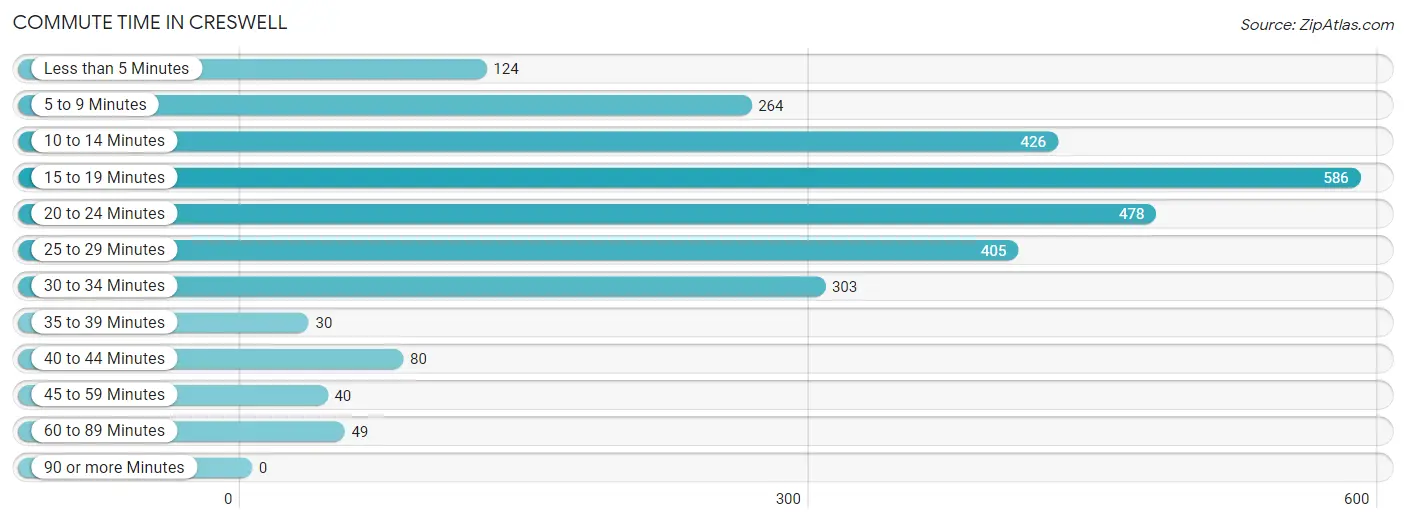
| Commute Time | # Commuters | % Commuters |
| Less than 5 Minutes | 124 | 4.4% |
| 5 to 9 Minutes | 264 | 9.5% |
| 10 to 14 Minutes | 426 | 15.3% |
| 15 to 19 Minutes | 586 | 21.0% |
| 20 to 24 Minutes | 478 | 17.2% |
| 25 to 29 Minutes | 405 | 14.5% |
| 30 to 34 Minutes | 303 | 10.9% |
| 35 to 39 Minutes | 30 | 1.1% |
| 40 to 44 Minutes | 80 | 2.9% |
| 45 to 59 Minutes | 40 | 1.4% |
| 60 to 89 Minutes | 49 | 1.8% |
| 90 or more Minutes | 0 | 0.0% |
Commute Time by Sex in Creswell
The most common commute times in Creswell are 10 to 14 minutes (391 commuters, 22.3%) for males and 15 to 19 minutes (225 commuters, 21.8%) for females.
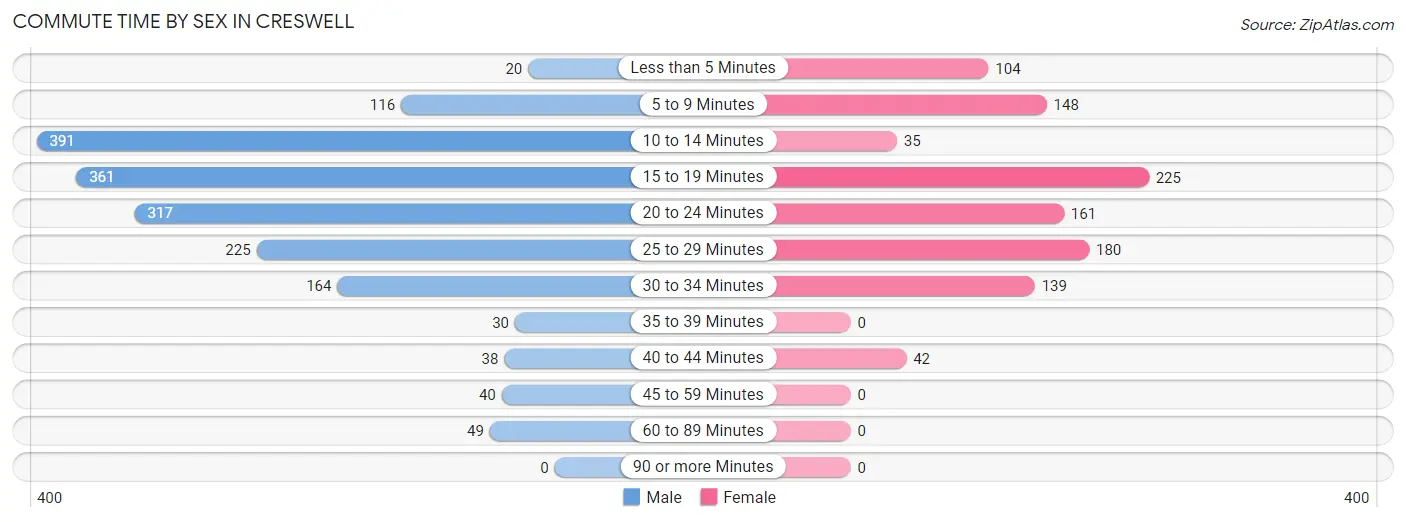
| Commute Time | Male | Female |
| Less than 5 Minutes | 20 (1.1%) | 104 (10.1%) |
| 5 to 9 Minutes | 116 (6.6%) | 148 (14.3%) |
| 10 to 14 Minutes | 391 (22.3%) | 35 (3.4%) |
| 15 to 19 Minutes | 361 (20.6%) | 225 (21.8%) |
| 20 to 24 Minutes | 317 (18.1%) | 161 (15.6%) |
| 25 to 29 Minutes | 225 (12.9%) | 180 (17.4%) |
| 30 to 34 Minutes | 164 (9.4%) | 139 (13.4%) |
| 35 to 39 Minutes | 30 (1.7%) | 0 (0.0%) |
| 40 to 44 Minutes | 38 (2.2%) | 42 (4.1%) |
| 45 to 59 Minutes | 40 (2.3%) | 0 (0.0%) |
| 60 to 89 Minutes | 49 (2.8%) | 0 (0.0%) |
| 90 or more Minutes | 0 (0.0%) | 0 (0.0%) |
Time of Departure to Work by Sex in Creswell
The most frequent times of departure to work in Creswell are 6:30 AM to 6:59 AM (360, 20.6%) for males and 7:30 AM to 7:59 AM (344, 33.3%) for females.
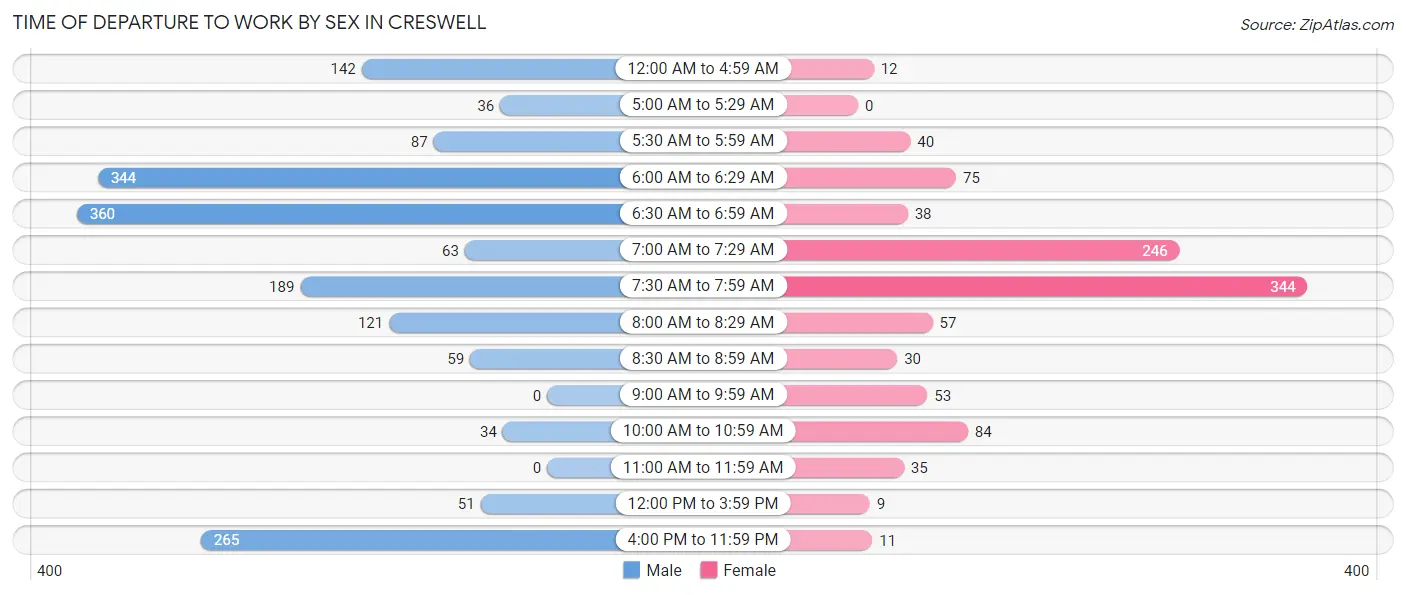
| Time of Departure | Male | Female |
| 12:00 AM to 4:59 AM | 142 (8.1%) | 12 (1.2%) |
| 5:00 AM to 5:29 AM | 36 (2.1%) | 0 (0.0%) |
| 5:30 AM to 5:59 AM | 87 (5.0%) | 40 (3.9%) |
| 6:00 AM to 6:29 AM | 344 (19.7%) | 75 (7.2%) |
| 6:30 AM to 6:59 AM | 360 (20.6%) | 38 (3.7%) |
| 7:00 AM to 7:29 AM | 63 (3.6%) | 246 (23.8%) |
| 7:30 AM to 7:59 AM | 189 (10.8%) | 344 (33.3%) |
| 8:00 AM to 8:29 AM | 121 (6.9%) | 57 (5.5%) |
| 8:30 AM to 8:59 AM | 59 (3.4%) | 30 (2.9%) |
| 9:00 AM to 9:59 AM | 0 (0.0%) | 53 (5.1%) |
| 10:00 AM to 10:59 AM | 34 (1.9%) | 84 (8.1%) |
| 11:00 AM to 11:59 AM | 0 (0.0%) | 35 (3.4%) |
| 12:00 PM to 3:59 PM | 51 (2.9%) | 9 (0.9%) |
| 4:00 PM to 11:59 PM | 265 (15.1%) | 11 (1.1%) |
| Total | 1,751 (100.0%) | 1,034 (100.0%) |
Housing Occupancy in Creswell
Occupancy by Ownership in Creswell
Of the total 2,037 dwellings in Creswell, owner-occupied units account for 1,464 (71.9%), while renter-occupied units make up 573 (28.1%).
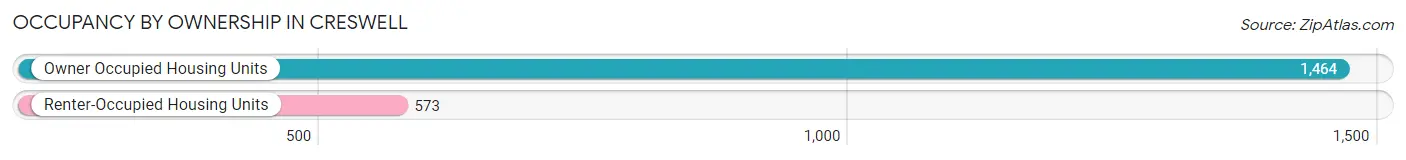
| Occupancy | # Housing Units | % Housing Units |
| Owner Occupied Housing Units | 1,464 | 71.9% |
| Renter-Occupied Housing Units | 573 | 28.1% |
| Total Occupied Housing Units | 2,037 | 100.0% |
Occupancy by Household Size in Creswell
| Household Size | # Housing Units | % Housing Units |
| 1-Person Household | 293 | 14.4% |
| 2-Person Household | 677 | 33.2% |
| 3-Person Household | 606 | 29.7% |
| 4+ Person Household | 461 | 22.6% |
| Total Housing Units | 2,037 | 100.0% |
Occupancy by Ownership by Household Size in Creswell
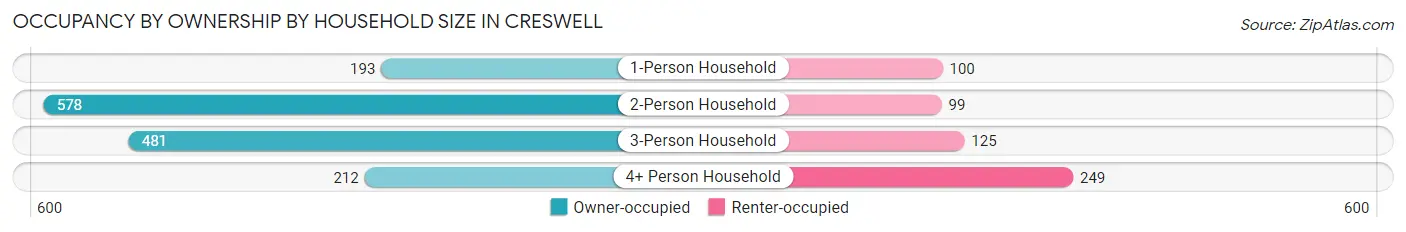
| Household Size | Owner-occupied | Renter-occupied |
| 1-Person Household | 193 (65.9%) | 100 (34.1%) |
| 2-Person Household | 578 (85.4%) | 99 (14.6%) |
| 3-Person Household | 481 (79.4%) | 125 (20.6%) |
| 4+ Person Household | 212 (46.0%) | 249 (54.0%) |
| Total Housing Units | 1,464 (71.9%) | 573 (28.1%) |
Occupancy by Educational Attainment in Creswell
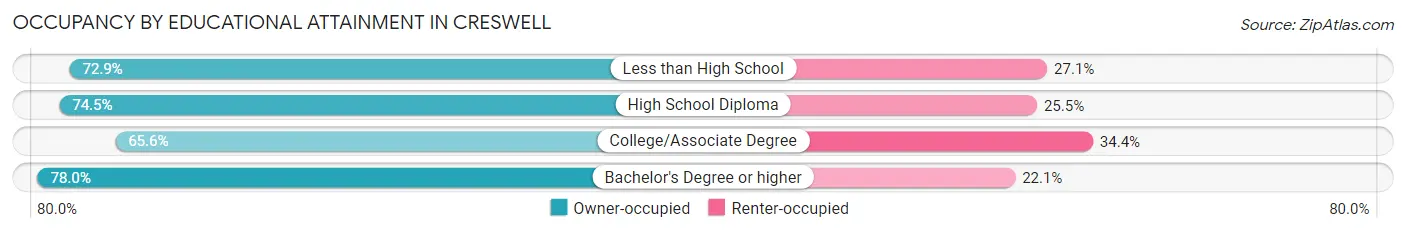
| Household Size | Owner-occupied | Renter-occupied |
| Less than High School | 86 (72.9%) | 32 (27.1%) |
| High School Diploma | 330 (74.5%) | 113 (25.5%) |
| College/Associate Degree | 546 (65.6%) | 286 (34.4%) |
| Bachelor's Degree or higher | 502 (77.9%) | 142 (22.1%) |
Occupancy by Age of Householder in Creswell
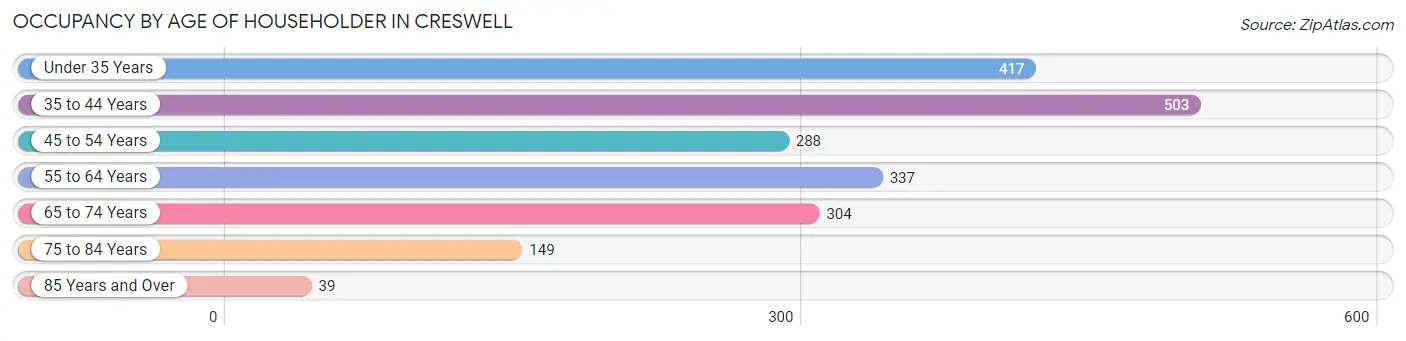
| Age Bracket | # Households | % Households |
| Under 35 Years | 417 | 20.5% |
| 35 to 44 Years | 503 | 24.7% |
| 45 to 54 Years | 288 | 14.1% |
| 55 to 64 Years | 337 | 16.5% |
| 65 to 74 Years | 304 | 14.9% |
| 75 to 84 Years | 149 | 7.3% |
| 85 Years and Over | 39 | 1.9% |
| Total | 2,037 | 100.0% |
Housing Finances in Creswell
Median Income by Occupancy in Creswell
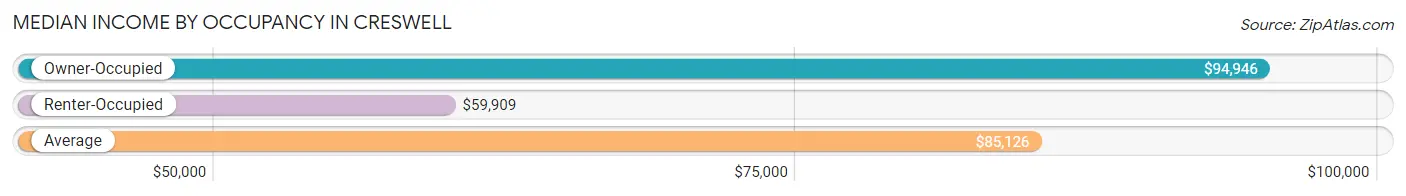
| Occupancy Type | # Households | Median Income |
| Owner-Occupied | 1,464 (71.9%) | $94,946 |
| Renter-Occupied | 573 (28.1%) | $59,909 |
| Average | 2,037 (100.0%) | $85,126 |
Occupancy by Householder Income Bracket in Creswell
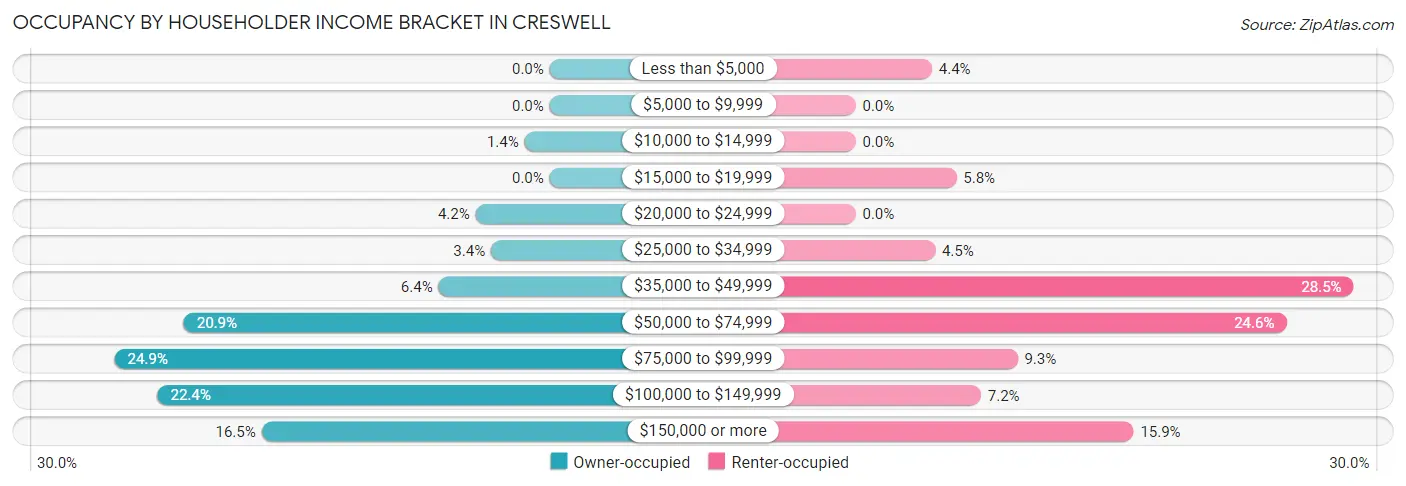
| Income Bracket | Owner-occupied | Renter-occupied |
| Less than $5,000 | 0 (0.0%) | 25 (4.4%) |
| $5,000 to $9,999 | 0 (0.0%) | 0 (0.0%) |
| $10,000 to $14,999 | 21 (1.4%) | 0 (0.0%) |
| $15,000 to $19,999 | 0 (0.0%) | 33 (5.8%) |
| $20,000 to $24,999 | 62 (4.2%) | 0 (0.0%) |
| $25,000 to $34,999 | 49 (3.4%) | 26 (4.5%) |
| $35,000 to $49,999 | 93 (6.4%) | 163 (28.4%) |
| $50,000 to $74,999 | 306 (20.9%) | 141 (24.6%) |
| $75,000 to $99,999 | 364 (24.9%) | 53 (9.2%) |
| $100,000 to $149,999 | 328 (22.4%) | 41 (7.2%) |
| $150,000 or more | 241 (16.5%) | 91 (15.9%) |
| Total | 1,464 (100.0%) | 573 (100.0%) |
Monthly Housing Cost Tiers in Creswell
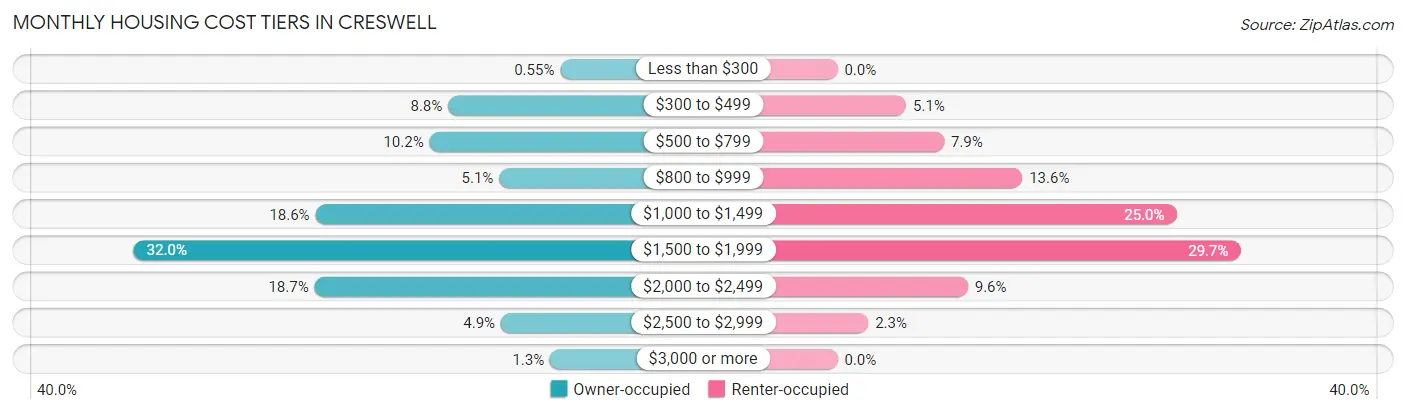
| Monthly Cost | Owner-occupied | Renter-occupied |
| Less than $300 | 8 (0.5%) | 0 (0.0%) |
| $300 to $499 | 129 (8.8%) | 29 (5.1%) |
| $500 to $799 | 149 (10.2%) | 45 (7.9%) |
| $800 to $999 | 74 (5.1%) | 78 (13.6%) |
| $1,000 to $1,499 | 272 (18.6%) | 143 (25.0%) |
| $1,500 to $1,999 | 468 (32.0%) | 170 (29.7%) |
| $2,000 to $2,499 | 273 (18.6%) | 55 (9.6%) |
| $2,500 to $2,999 | 72 (4.9%) | 13 (2.3%) |
| $3,000 or more | 19 (1.3%) | 0 (0.0%) |
| Total | 1,464 (100.0%) | 573 (100.0%) |
Physical Housing Characteristics in Creswell
Housing Structures in Creswell
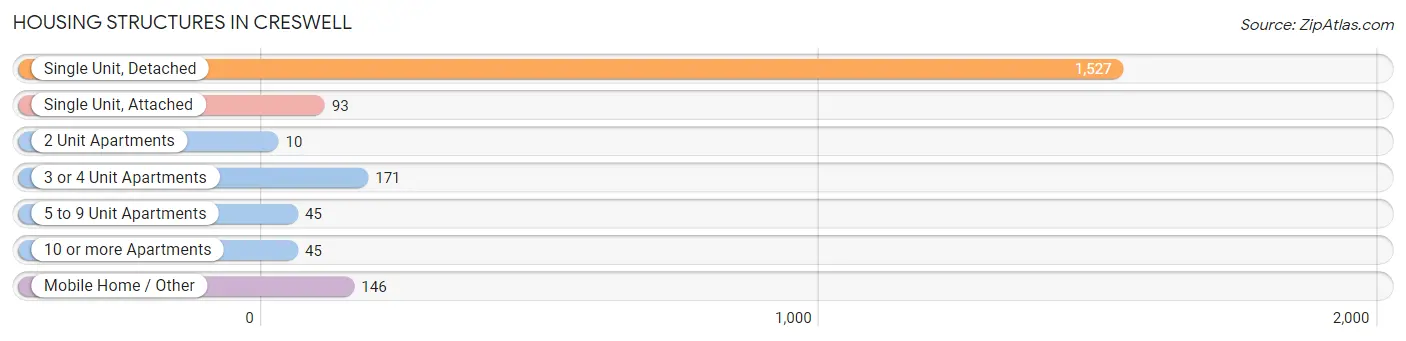
| Structure Type | # Housing Units | % Housing Units |
| Single Unit, Detached | 1,527 | 75.0% |
| Single Unit, Attached | 93 | 4.6% |
| 2 Unit Apartments | 10 | 0.5% |
| 3 or 4 Unit Apartments | 171 | 8.4% |
| 5 to 9 Unit Apartments | 45 | 2.2% |
| 10 or more Apartments | 45 | 2.2% |
| Mobile Home / Other | 146 | 7.2% |
| Total | 2,037 | 100.0% |
Housing Structures by Occupancy in Creswell
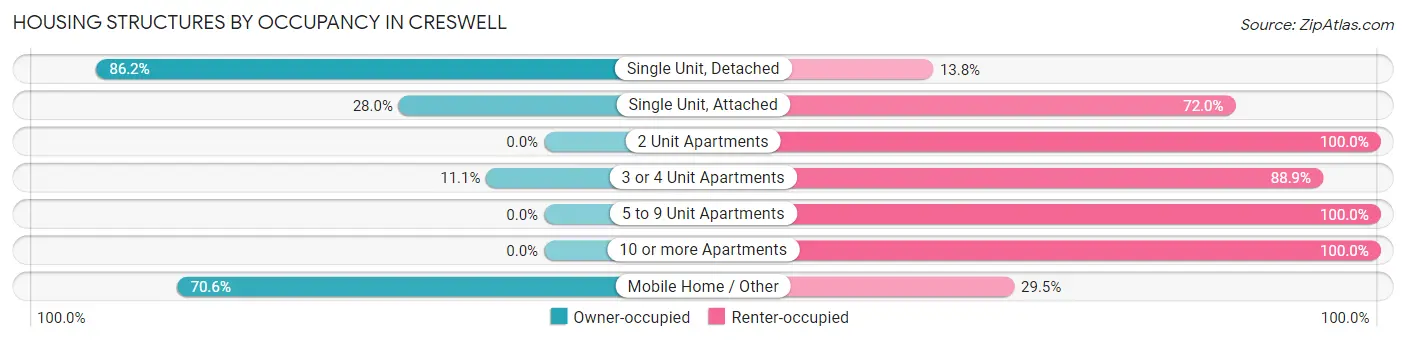
| Structure Type | Owner-occupied | Renter-occupied |
| Single Unit, Detached | 1,316 (86.2%) | 211 (13.8%) |
| Single Unit, Attached | 26 (28.0%) | 67 (72.0%) |
| 2 Unit Apartments | 0 (0.0%) | 10 (100.0%) |
| 3 or 4 Unit Apartments | 19 (11.1%) | 152 (88.9%) |
| 5 to 9 Unit Apartments | 0 (0.0%) | 45 (100.0%) |
| 10 or more Apartments | 0 (0.0%) | 45 (100.0%) |
| Mobile Home / Other | 103 (70.6%) | 43 (29.4%) |
| Total | 1,464 (71.9%) | 573 (28.1%) |
Housing Structures by Number of Rooms in Creswell
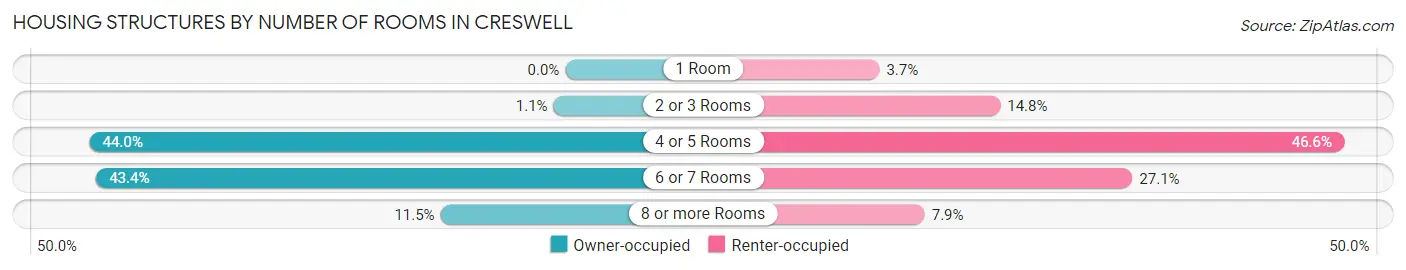
| Number of Rooms | Owner-occupied | Renter-occupied |
| 1 Room | 0 (0.0%) | 21 (3.7%) |
| 2 or 3 Rooms | 16 (1.1%) | 85 (14.8%) |
| 4 or 5 Rooms | 644 (44.0%) | 267 (46.6%) |
| 6 or 7 Rooms | 635 (43.4%) | 155 (27.1%) |
| 8 or more Rooms | 169 (11.5%) | 45 (7.9%) |
| Total | 1,464 (100.0%) | 573 (100.0%) |
Housing Structure by Heating Type in Creswell
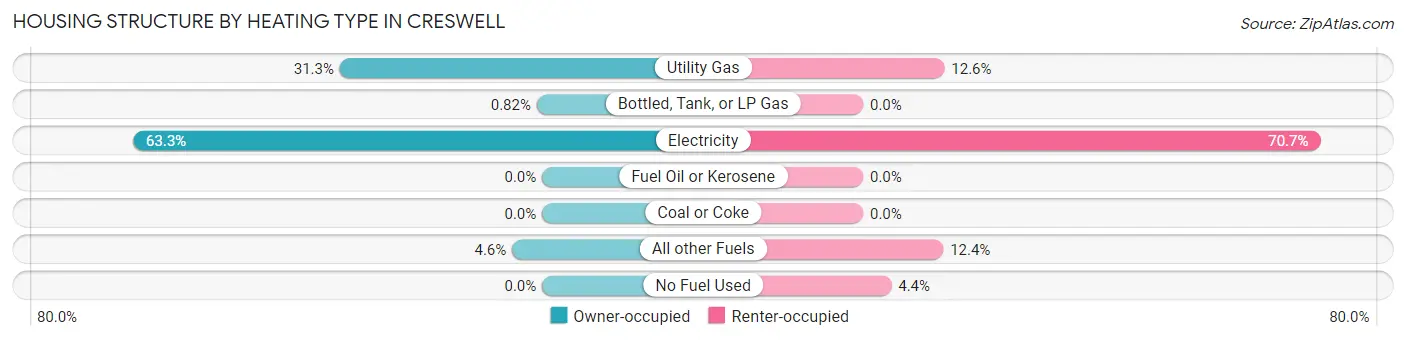
| Heating Type | Owner-occupied | Renter-occupied |
| Utility Gas | 458 (31.3%) | 72 (12.6%) |
| Bottled, Tank, or LP Gas | 12 (0.8%) | 0 (0.0%) |
| Electricity | 926 (63.2%) | 405 (70.7%) |
| Fuel Oil or Kerosene | 0 (0.0%) | 0 (0.0%) |
| Coal or Coke | 0 (0.0%) | 0 (0.0%) |
| All other Fuels | 68 (4.6%) | 71 (12.4%) |
| No Fuel Used | 0 (0.0%) | 25 (4.4%) |
| Total | 1,464 (100.0%) | 573 (100.0%) |
Household Vehicle Usage in Creswell
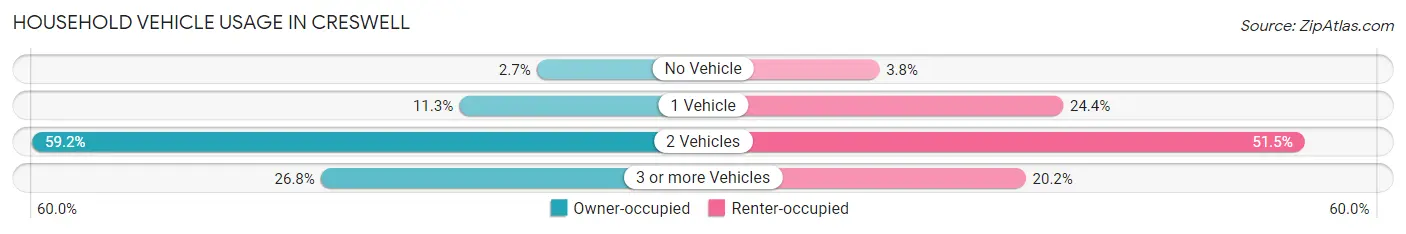
| Vehicles per Household | Owner-occupied | Renter-occupied |
| No Vehicle | 39 (2.7%) | 22 (3.8%) |
| 1 Vehicle | 166 (11.3%) | 140 (24.4%) |
| 2 Vehicles | 866 (59.2%) | 295 (51.5%) |
| 3 or more Vehicles | 393 (26.8%) | 116 (20.2%) |
| Total | 1,464 (100.0%) | 573 (100.0%) |
Real Estate & Mortgages in Creswell
Real Estate and Mortgage Overview in Creswell
| Characteristic | Without Mortgage | With Mortgage |
| Housing Units | 346 | 1,118 |
| Median Property Value | $329,300 | $330,300 |
| Median Household Income | $70,781 | $209 |
| Monthly Housing Costs | $541 | $19 |
| Real Estate Taxes | $2,074 | $26 |
Property Value by Mortgage Status in Creswell
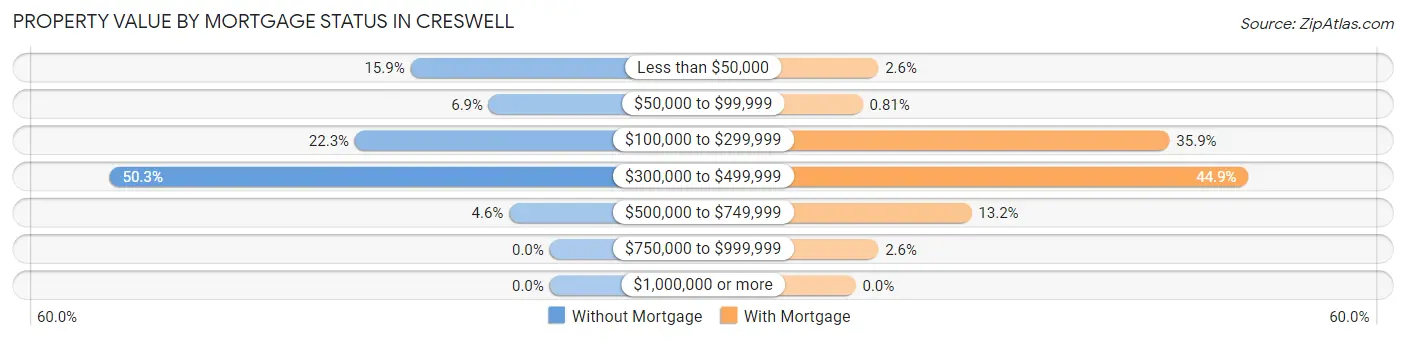
| Property Value | Without Mortgage | With Mortgage |
| Less than $50,000 | 55 (15.9%) | 29 (2.6%) |
| $50,000 to $99,999 | 24 (6.9%) | 9 (0.8%) |
| $100,000 to $299,999 | 77 (22.3%) | 401 (35.9%) |
| $300,000 to $499,999 | 174 (50.3%) | 502 (44.9%) |
| $500,000 to $749,999 | 16 (4.6%) | 148 (13.2%) |
| $750,000 to $999,999 | 0 (0.0%) | 29 (2.6%) |
| $1,000,000 or more | 0 (0.0%) | 0 (0.0%) |
| Total | 346 (100.0%) | 1,118 (100.0%) |
Household Income by Mortgage Status in Creswell
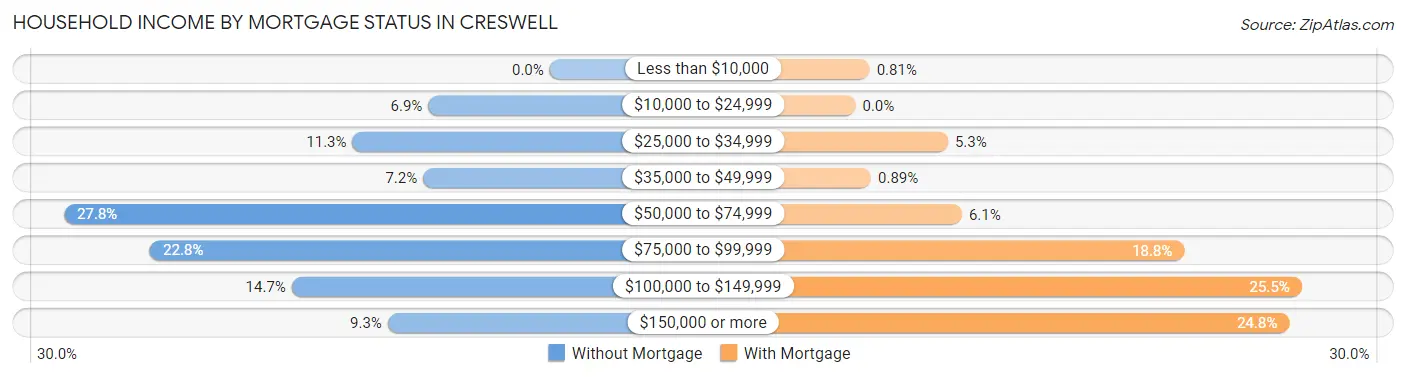
| Household Income | Without Mortgage | With Mortgage |
| Less than $10,000 | 0 (0.0%) | 9 (0.8%) |
| $10,000 to $24,999 | 24 (6.9%) | 0 (0.0%) |
| $25,000 to $34,999 | 39 (11.3%) | 59 (5.3%) |
| $35,000 to $49,999 | 25 (7.2%) | 10 (0.9%) |
| $50,000 to $74,999 | 96 (27.8%) | 68 (6.1%) |
| $75,000 to $99,999 | 79 (22.8%) | 210 (18.8%) |
| $100,000 to $149,999 | 51 (14.7%) | 285 (25.5%) |
| $150,000 or more | 32 (9.2%) | 277 (24.8%) |
| Total | 346 (100.0%) | 1,118 (100.0%) |
Property Value to Household Income Ratio in Creswell
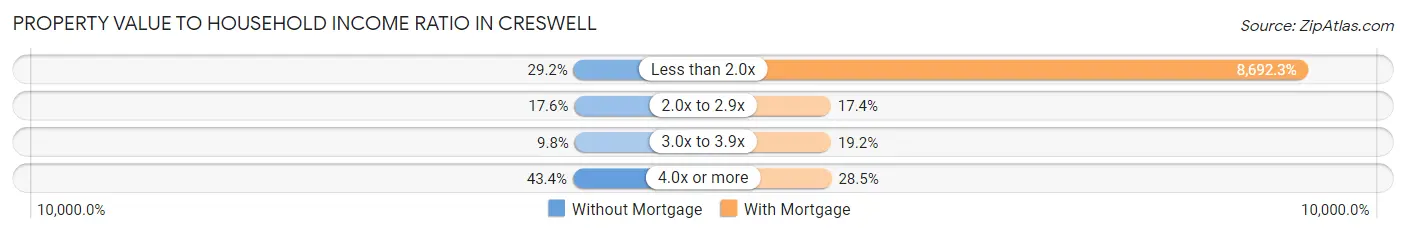
| Value-to-Income Ratio | Without Mortgage | With Mortgage |
| Less than 2.0x | 101 (29.2%) | 97,180 (8,692.3%) |
| 2.0x to 2.9x | 61 (17.6%) | 194 (17.3%) |
| 3.0x to 3.9x | 34 (9.8%) | 215 (19.2%) |
| 4.0x or more | 150 (43.3%) | 319 (28.5%) |
| Total | 346 (100.0%) | 1,118 (100.0%) |
Real Estate Taxes by Mortgage Status in Creswell
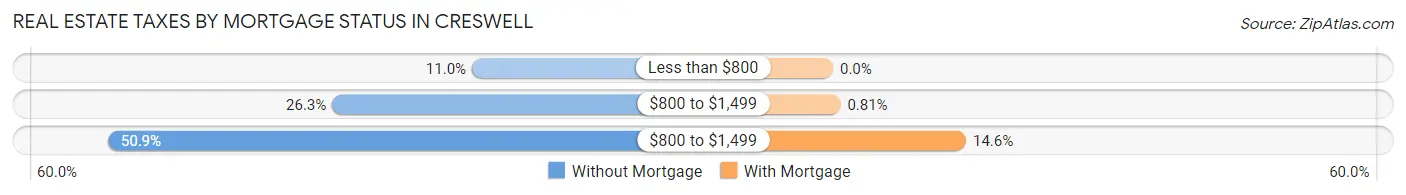
| Property Taxes | Without Mortgage | With Mortgage |
| Less than $800 | 38 (11.0%) | 0 (0.0%) |
| $800 to $1,499 | 91 (26.3%) | 9 (0.8%) |
| $800 to $1,499 | 176 (50.9%) | 163 (14.6%) |
| Total | 346 (100.0%) | 1,118 (100.0%) |
Health & Disability in Creswell
Health Insurance Coverage by Age in Creswell
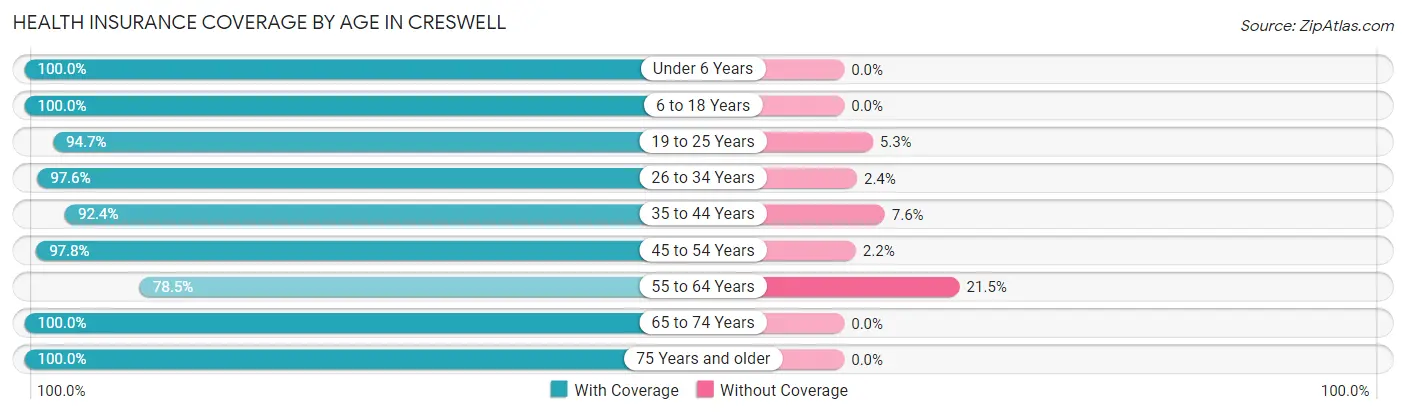
| Age Bracket | With Coverage | Without Coverage |
| Under 6 Years | 542 (100.0%) | 0 (0.0%) |
| 6 to 18 Years | 731 (100.0%) | 0 (0.0%) |
| 19 to 25 Years | 391 (94.7%) | 22 (5.3%) |
| 26 to 34 Years | 904 (97.6%) | 22 (2.4%) |
| 35 to 44 Years | 881 (92.4%) | 72 (7.6%) |
| 45 to 54 Years | 586 (97.8%) | 13 (2.2%) |
| 55 to 64 Years | 427 (78.5%) | 117 (21.5%) |
| 65 to 74 Years | 543 (100.0%) | 0 (0.0%) |
| 75 Years and older | 315 (100.0%) | 0 (0.0%) |
| Total | 5,320 (95.6%) | 246 (4.4%) |
Health Insurance Coverage by Citizenship Status in Creswell
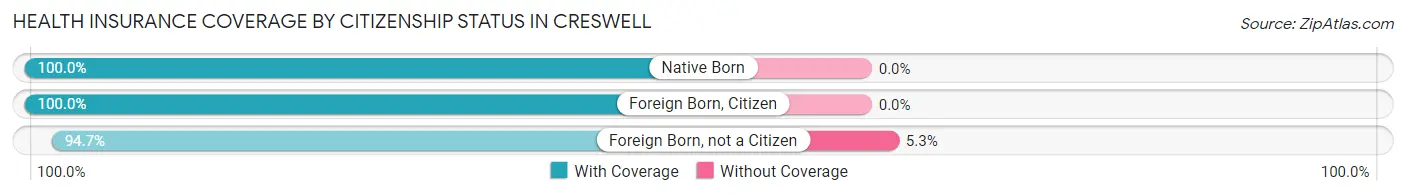
| Citizenship Status | With Coverage | Without Coverage |
| Native Born | 542 (100.0%) | 0 (0.0%) |
| Foreign Born, Citizen | 731 (100.0%) | 0 (0.0%) |
| Foreign Born, not a Citizen | 391 (94.7%) | 22 (5.3%) |
Health Insurance Coverage by Household Income in Creswell
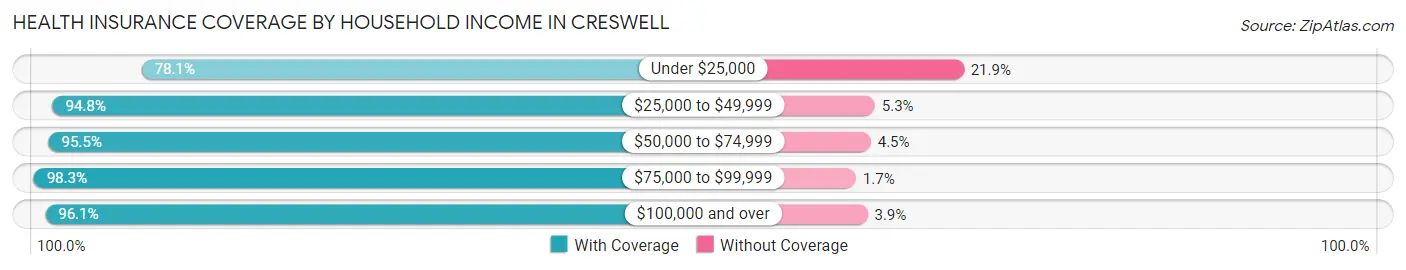
| Household Income | With Coverage | Without Coverage |
| Under $25,000 | 139 (78.1%) | 39 (21.9%) |
| $25,000 to $49,999 | 848 (94.8%) | 47 (5.2%) |
| $50,000 to $74,999 | 1,235 (95.5%) | 58 (4.5%) |
| $75,000 to $99,999 | 970 (98.3%) | 17 (1.7%) |
| $100,000 and over | 2,105 (96.1%) | 85 (3.9%) |
Public vs Private Health Insurance Coverage by Age in Creswell
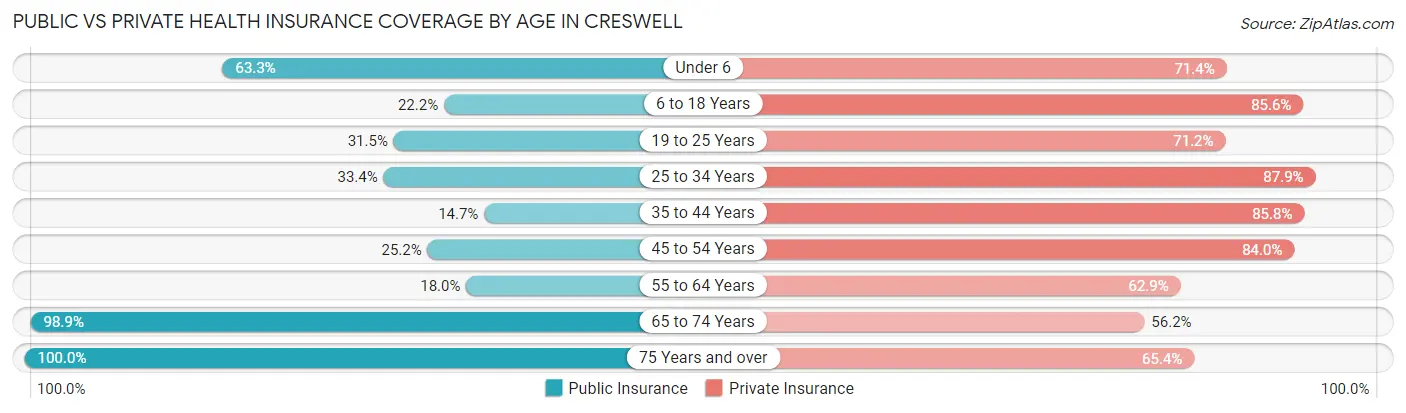
| Age Bracket | Public Insurance | Private Insurance |
| Under 6 | 343 (63.3%) | 387 (71.4%) |
| 6 to 18 Years | 162 (22.2%) | 626 (85.6%) |
| 19 to 25 Years | 130 (31.5%) | 294 (71.2%) |
| 25 to 34 Years | 309 (33.4%) | 814 (87.9%) |
| 35 to 44 Years | 140 (14.7%) | 818 (85.8%) |
| 45 to 54 Years | 151 (25.2%) | 503 (84.0%) |
| 55 to 64 Years | 98 (18.0%) | 342 (62.9%) |
| 65 to 74 Years | 537 (98.9%) | 305 (56.2%) |
| 75 Years and over | 315 (100.0%) | 206 (65.4%) |
| Total | 2,185 (39.3%) | 4,295 (77.2%) |
Disability Status by Sex by Age in Creswell
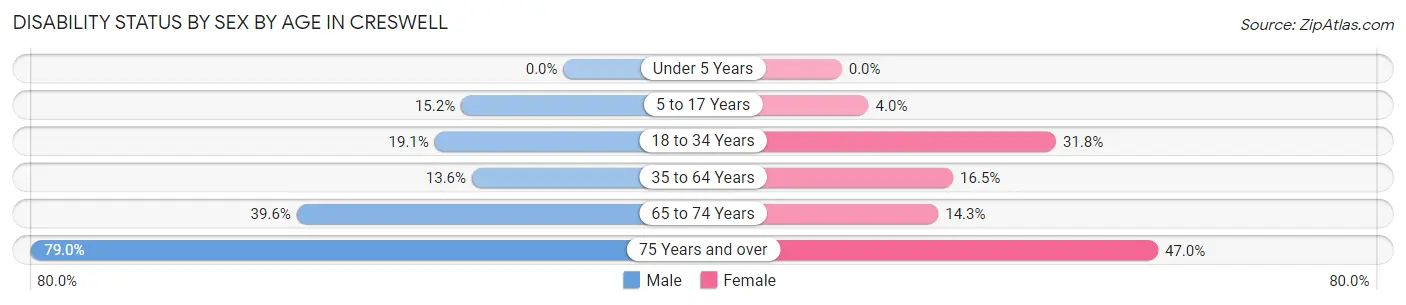
| Age Bracket | Male | Female |
| Under 5 Years | 0 (0.0%) | 0 (0.0%) |
| 5 to 17 Years | 69 (15.2%) | 11 (4.0%) |
| 18 to 34 Years | 153 (19.1%) | 182 (31.8%) |
| 35 to 64 Years | 146 (13.6%) | 169 (16.5%) |
| 65 to 74 Years | 99 (39.6%) | 42 (14.3%) |
| 75 Years and over | 158 (79.0%) | 54 (47.0%) |
Disability Class by Sex by Age in Creswell
Disability Class: Hearing Difficulty
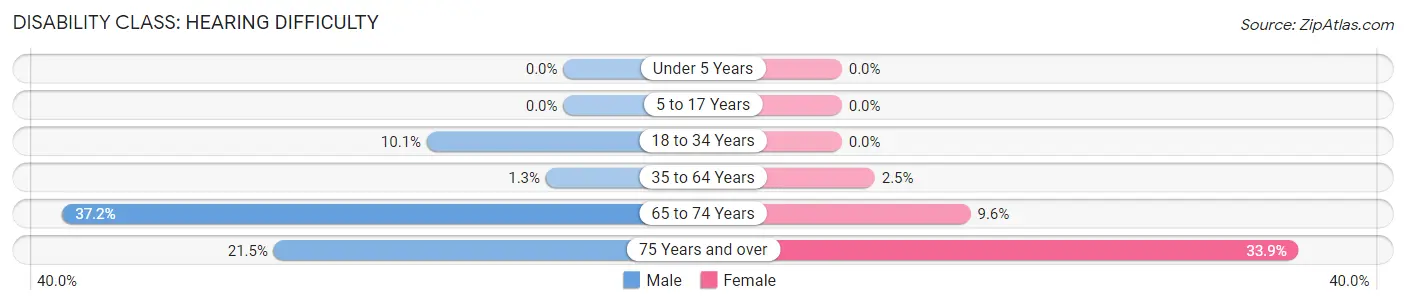
| Age Bracket | Male | Female |
| Under 5 Years | 0 (0.0%) | 0 (0.0%) |
| 5 to 17 Years | 0 (0.0%) | 0 (0.0%) |
| 18 to 34 Years | 81 (10.1%) | 0 (0.0%) |
| 35 to 64 Years | 14 (1.3%) | 25 (2.5%) |
| 65 to 74 Years | 93 (37.2%) | 28 (9.6%) |
| 75 Years and over | 43 (21.5%) | 39 (33.9%) |
Disability Class: Vision Difficulty
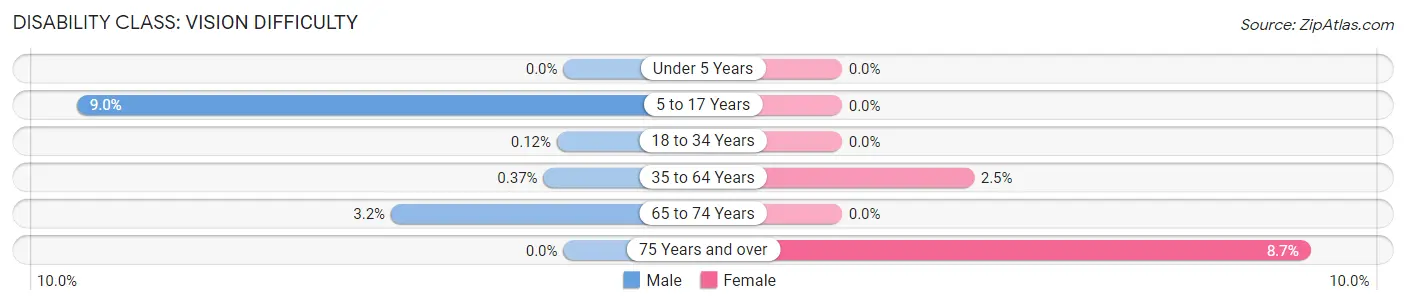
| Age Bracket | Male | Female |
| Under 5 Years | 0 (0.0%) | 0 (0.0%) |
| 5 to 17 Years | 41 (9.0%) | 0 (0.0%) |
| 18 to 34 Years | 1 (0.1%) | 0 (0.0%) |
| 35 to 64 Years | 4 (0.4%) | 25 (2.5%) |
| 65 to 74 Years | 8 (3.2%) | 0 (0.0%) |
| 75 Years and over | 0 (0.0%) | 10 (8.7%) |
Disability Class: Cognitive Difficulty
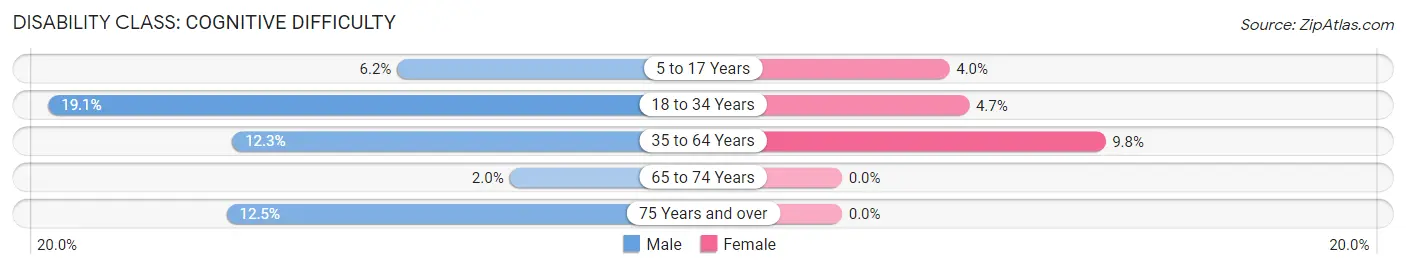
| Age Bracket | Male | Female |
| 5 to 17 Years | 28 (6.2%) | 11 (4.0%) |
| 18 to 34 Years | 153 (19.1%) | 27 (4.7%) |
| 35 to 64 Years | 132 (12.3%) | 100 (9.8%) |
| 65 to 74 Years | 5 (2.0%) | 0 (0.0%) |
| 75 Years and over | 25 (12.5%) | 0 (0.0%) |
Disability Class: Ambulatory Difficulty
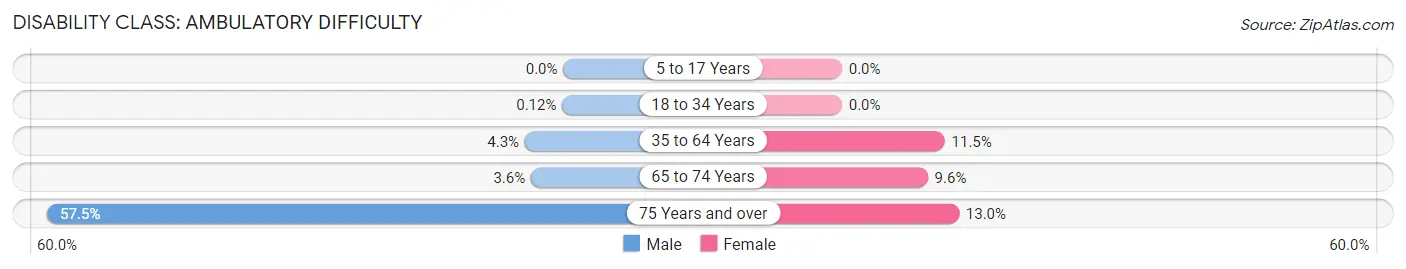
| Age Bracket | Male | Female |
| 5 to 17 Years | 0 (0.0%) | 0 (0.0%) |
| 18 to 34 Years | 1 (0.1%) | 0 (0.0%) |
| 35 to 64 Years | 46 (4.3%) | 117 (11.5%) |
| 65 to 74 Years | 9 (3.6%) | 28 (9.6%) |
| 75 Years and over | 115 (57.5%) | 15 (13.0%) |
Disability Class: Self-Care Difficulty
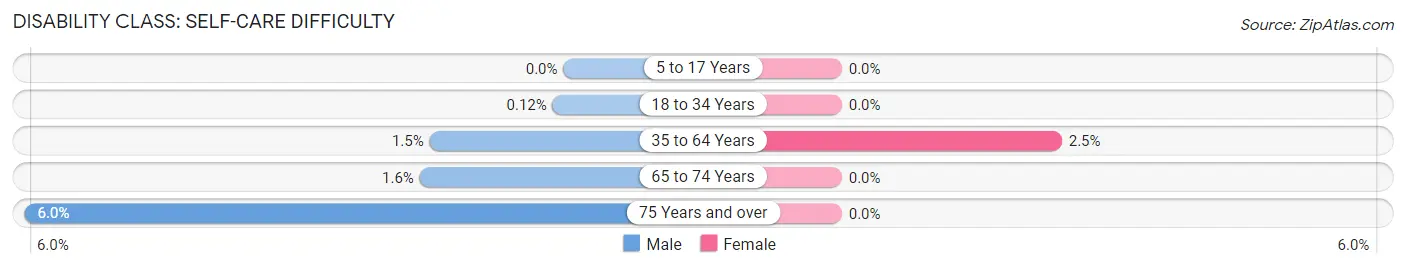
| Age Bracket | Male | Female |
| 5 to 17 Years | 0 (0.0%) | 0 (0.0%) |
| 18 to 34 Years | 1 (0.1%) | 0 (0.0%) |
| 35 to 64 Years | 16 (1.5%) | 25 (2.5%) |
| 65 to 74 Years | 4 (1.6%) | 0 (0.0%) |
| 75 Years and over | 12 (6.0%) | 0 (0.0%) |
Technology Access in Creswell
Computing Device Access in Creswell
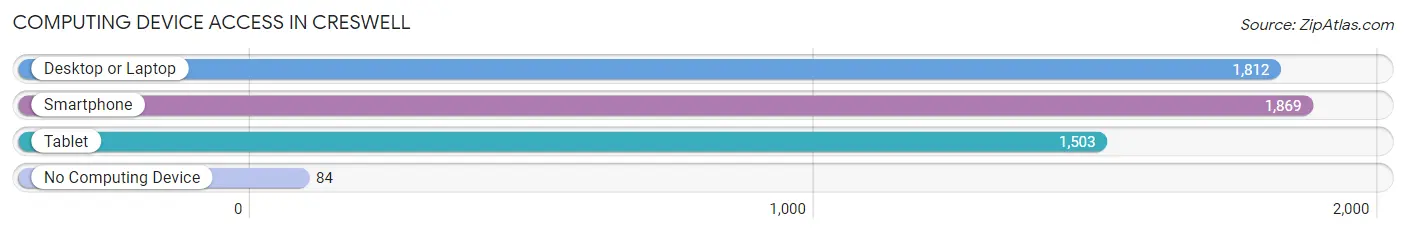
| Device Type | # Households | % Households |
| Desktop or Laptop | 1,812 | 88.9% |
| Smartphone | 1,869 | 91.7% |
| Tablet | 1,503 | 73.8% |
| No Computing Device | 84 | 4.1% |
| Total | 2,037 | 100.0% |
Internet Access in Creswell
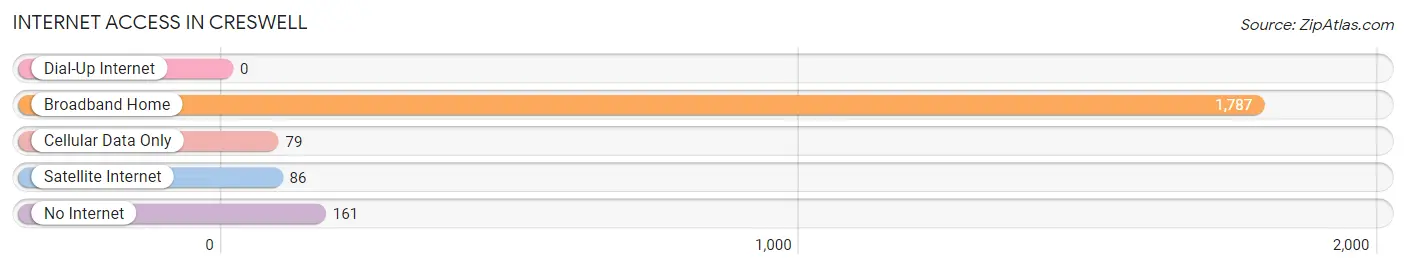
| Internet Type | # Households | % Households |
| Dial-Up Internet | 0 | 0.0% |
| Broadband Home | 1,787 | 87.7% |
| Cellular Data Only | 79 | 3.9% |
| Satellite Internet | 86 | 4.2% |
| No Internet | 161 | 7.9% |
| Total | 2,037 | 100.0% |
Creswell Summary
Creswell, Oregon is a small city located in Lane County, Oregon, United States. It is situated in the southern part of the Willamette Valley, about 15 miles south of Eugene. The city has a population of approximately 5,000 people and is part of the Eugene-Springfield Metropolitan Statistical Area.
History
The area that is now Creswell was originally inhabited by the Kalapuya Native American tribe. The first European settlers arrived in the area in the mid-1800s and established a small farming community. The town was officially incorporated in 1891 and was named after the Creswell family, who were among the first settlers in the area.
In the early 1900s, Creswell began to grow and develop as a small agricultural community. The town was home to several small businesses, including a sawmill, a creamery, and a cannery. The town also had a railroad station, which connected it to the larger cities of Eugene and Springfield.
In the 1950s, Creswell began to experience a period of growth and development. The town was home to several new businesses, including a lumber mill, a furniture factory, and a dairy. The town also had a new school, a library, and a post office.
Geography
Creswell is located in the southern part of the Willamette Valley, about 15 miles south of Eugene. The city is situated on the banks of the Willamette River and is surrounded by rolling hills and farmland. The city has a total area of 2.3 square miles, all of which is land.
The climate in Creswell is mild and temperate. The average temperature in the summer is around 75 degrees Fahrenheit, while the average temperature in the winter is around 40 degrees Fahrenheit. The city receives an average of 37 inches of precipitation per year.
Economy
The economy of Creswell is largely based on agriculture and manufacturing. The city is home to several small businesses, including a lumber mill, a furniture factory, and a dairy. The city also has a number of retail stores, restaurants, and other services.
The city is also home to several large employers, including the University of Oregon, the Eugene Water & Electric Board, and the Lane County government. The city is also home to several small businesses, including a sawmill, a creamery, and a cannery.
Demographics
As of the 2010 census, the population of Creswell was 5,000. The racial makeup of the city was 90.2% White, 0.7% African American, 0.4% Native American, 0.7% Asian, 0.1% Pacific Islander, and 2.9% from other races. The median household income in the city was $45,000.
Conclusion
Creswell, Oregon is a small city located in Lane County, Oregon, United States. It is situated in the southern part of the Willamette Valley, about 15 miles south of Eugene. The city has a population of approximately 5,000 people and is part of the Eugene-Springfield Metropolitan Statistical Area. The economy of Creswell is largely based on agriculture and manufacturing, and the city is home to several large employers. The racial makeup of the city is predominantly White, with a small percentage of African American, Native American, Asian, and Pacific Islander residents.
Common Questions
What is Per Capita Income in Creswell?
Per Capita income in Creswell is $35,761.
What is the Median Family Income in Creswell?
Median Family Income in Creswell is $94,239.
What is the Median Household income in Creswell?
Median Household Income in Creswell is $85,126.
What is Income or Wage Gap in Creswell?
Income or Wage Gap in Creswell is 21.8%.
Women in Creswell earn 78.2 cents for every dollar earned by a man.
What is Inequality or Gini Index in Creswell?
Inequality or Gini Index in Creswell is 0.34.
What is the Total Population of Creswell?
Total Population of Creswell is 5,607.
What is the Total Male Population of Creswell?
Total Male Population of Creswell is 2,957.
What is the Total Female Population of Creswell?
Total Female Population of Creswell is 2,650.
What is the Ratio of Males per 100 Females in Creswell?
There are 111.58 Males per 100 Females in Creswell.
What is the Ratio of Females per 100 Males in Creswell?
There are 89.62 Females per 100 Males in Creswell.
What is the Median Population Age in Creswell?
Median Population Age in Creswell is 36.9 Years.
What is the Average Family Size in Creswell
Average Family Size in Creswell is 3.0 People.
What is the Average Household Size in Creswell
Average Household Size in Creswell is 2.7 People.
How Large is the Labor Force in Creswell?
There are 3,009 People in the Labor Forcein in Creswell.
What is the Percentage of People in the Labor Force in Creswell?
67.6% of People are in the Labor Force in Creswell.
What is the Unemployment Rate in Creswell?
Unemployment Rate in Creswell is 1.0%.