Indian River Shores, FL Map & Demographics
Indian River Shores Map
Indian River Shores Overview
$151,119
PER CAPITA INCOME
$214,038
AVG FAMILY INCOME
$153,242
AVG HOUSEHOLD INCOME
75.5%
WAGE / INCOME GAP [ % ]
24.5¢/ $1
WAGE / INCOME GAP [ $ ]
0.59
INEQUALITY / GINI INDEX
4,266
TOTAL POPULATION
2,005
MALE POPULATION
2,261
FEMALE POPULATION
88.68
MALES / 100 FEMALES
112.77
FEMALES / 100 MALES
74.4
MEDIAN AGE
2.3
AVG FAMILY SIZE
1.9
AVG HOUSEHOLD SIZE
826
LABOR FORCE [ PEOPLE ]
20.6%
PERCENT IN LABOR FORCE
0.6%
UNEMPLOYMENT RATE
Indian River Shores Area Codes
Income in Indian River Shores
Income Overview in Indian River Shores
Per Capita Income in Indian River Shores is $151,119, while median incomes of families and households are $214,038 and $153,242 respectively.
| Characteristic | Number | Measure |
| Per Capita Income | 4,266 | $151,119 |
| Median Family Income | 1,390 | $214,038 |
| Mean Family Income | 1,390 | $365,285 |
| Median Household Income | 2,271 | $153,242 |
| Mean Household Income | 2,271 | $287,179 |
| Income Deficit | 1,390 | $0 |
| Wage / Income Gap (%) | 4,266 | 75.45% |
| Wage / Income Gap ($) | 4,266 | 24.55¢ per $1 |
| Gini / Inequality Index | 4,266 | 0.59 |
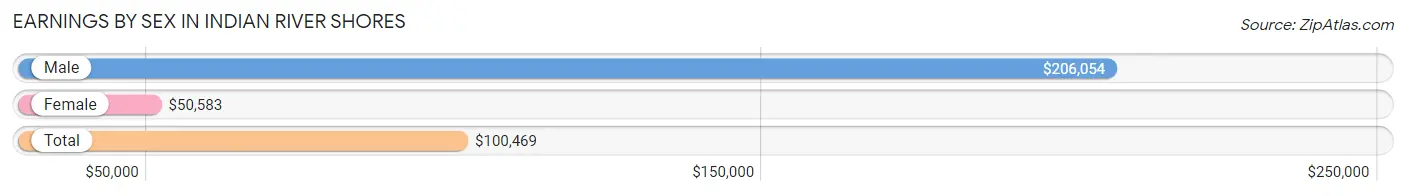
Earnings by Sex in Indian River Shores
Average Earnings in Indian River Shores are $100,469, $206,054 for men and $50,583 for women, a difference of 75.4%.
| Sex | Number | Average Earnings |
| Male | 677 (65.6%) | $206,054 |
| Female | 355 (34.4%) | $50,583 |
| Total | 1,032 (100.0%) | $100,469 |
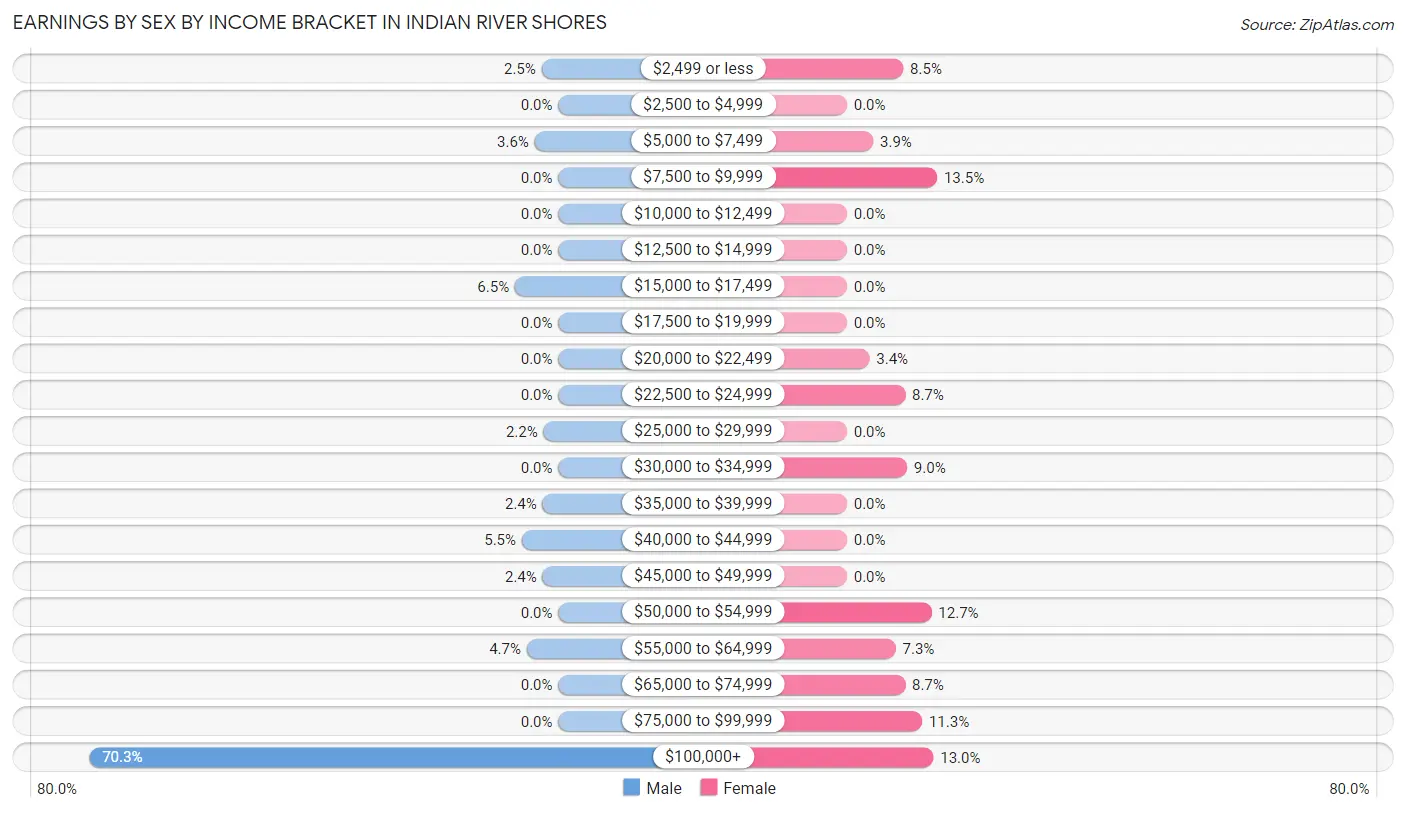
Earnings by Sex by Income Bracket in Indian River Shores
The most common earnings brackets in Indian River Shores are $100,000+ for men (476 | 70.3%) and $7,500 to $9,999 for women (48 | 13.5%).
| Income | Male | Female |
| $2,499 or less | 17 (2.5%) | 30 (8.5%) |
| $2,500 to $4,999 | 0 (0.0%) | 0 (0.0%) |
| $5,000 to $7,499 | 24 (3.5%) | 14 (3.9%) |
| $7,500 to $9,999 | 0 (0.0%) | 48 (13.5%) |
| $10,000 to $12,499 | 0 (0.0%) | 0 (0.0%) |
| $12,500 to $14,999 | 0 (0.0%) | 0 (0.0%) |
| $15,000 to $17,499 | 44 (6.5%) | 0 (0.0%) |
| $17,500 to $19,999 | 0 (0.0%) | 0 (0.0%) |
| $20,000 to $22,499 | 0 (0.0%) | 12 (3.4%) |
| $22,500 to $24,999 | 0 (0.0%) | 31 (8.7%) |
| $25,000 to $29,999 | 15 (2.2%) | 0 (0.0%) |
| $30,000 to $34,999 | 0 (0.0%) | 32 (9.0%) |
| $35,000 to $39,999 | 16 (2.4%) | 0 (0.0%) |
| $40,000 to $44,999 | 37 (5.5%) | 0 (0.0%) |
| $45,000 to $49,999 | 16 (2.4%) | 0 (0.0%) |
| $50,000 to $54,999 | 0 (0.0%) | 45 (12.7%) |
| $55,000 to $64,999 | 32 (4.7%) | 26 (7.3%) |
| $65,000 to $74,999 | 0 (0.0%) | 31 (8.7%) |
| $75,000 to $99,999 | 0 (0.0%) | 40 (11.3%) |
| $100,000+ | 476 (70.3%) | 46 (13.0%) |
| Total | 677 (100.0%) | 355 (100.0%) |
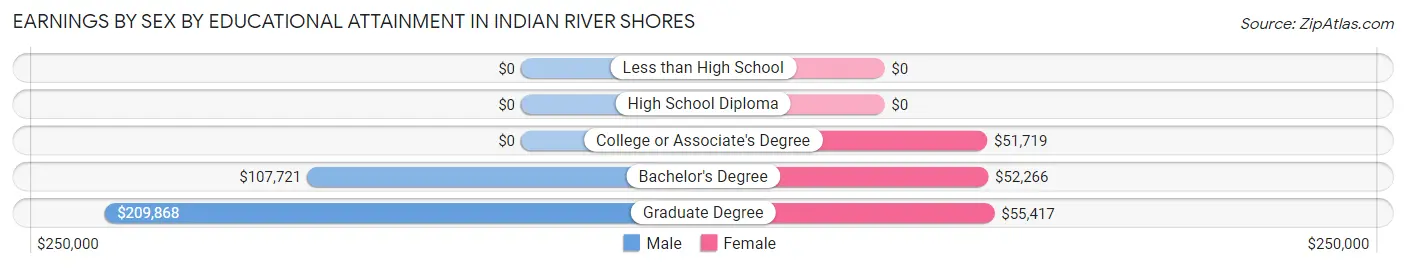
Earnings by Sex by Educational Attainment in Indian River Shores
Average earnings in Indian River Shores are $206,054 for men and $51,417 for women, a difference of 75.0%. Men with an educational attainment of graduate degree enjoy the highest average annual earnings of $209,868, while those with bachelor's degree education earn the least with $107,721. Women with an educational attainment of graduate degree earn the most with the average annual earnings of $55,417, while those with college or associate's degree education have the smallest earnings of $51,719.
| Educational Attainment | Male Income | Female Income |
| Less than High School | - | - |
| High School Diploma | - | - |
| College or Associate's Degree | - | - |
| Bachelor's Degree | $107,721 | $52,266 |
| Graduate Degree | $209,868 | $55,417 |
| Total | $206,054 | $51,417 |
Family Income in Indian River Shores
Family Income Brackets in Indian River Shores
According to the Indian River Shores family income data, there are 760 families falling into the $200,000+ income range, which is the most common income bracket and makes up 54.7% of all families.
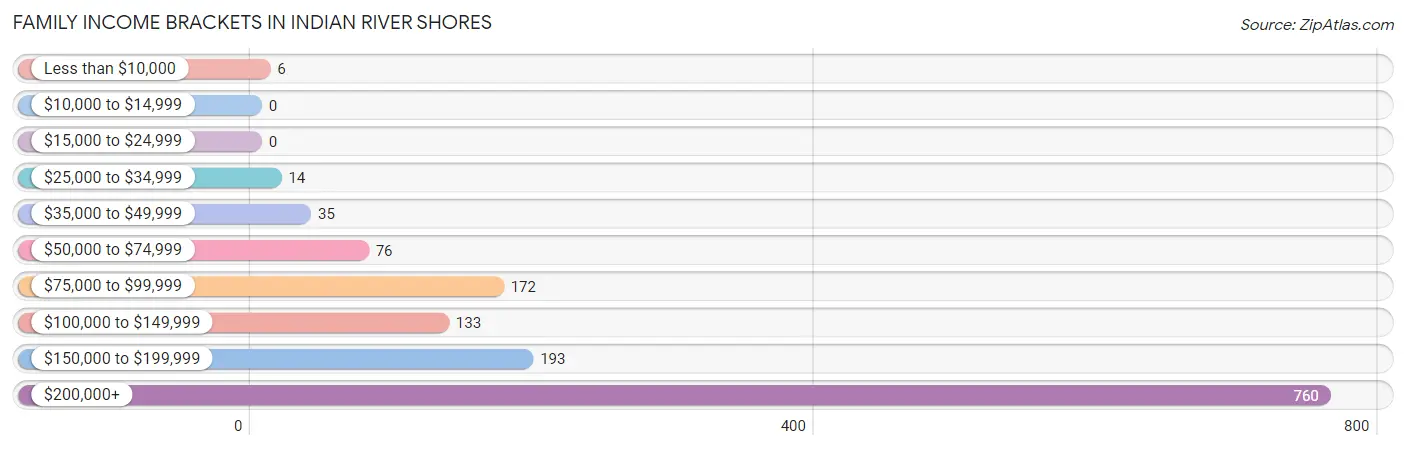
| Income Bracket | # Families | % Families |
| Less than $10,000 | 6 | 0.4% |
| $10,000 to $14,999 | 0 | 0.0% |
| $15,000 to $24,999 | 0 | 0.0% |
| $25,000 to $34,999 | 14 | 1.0% |
| $35,000 to $49,999 | 35 | 2.5% |
| $50,000 to $74,999 | 76 | 5.5% |
| $75,000 to $99,999 | 172 | 12.4% |
| $100,000 to $149,999 | 133 | 9.6% |
| $150,000 to $199,999 | 193 | 13.9% |
| $200,000+ | 760 | 54.7% |
Family Income by Famaliy Size in Indian River Shores
2-person families (1,219 | 87.7%) account for the highest median family income in Indian River Shores with $214,639 per family, while 2-person families (1,219 | 87.7%) have the highest median income of $107,320 per family member.
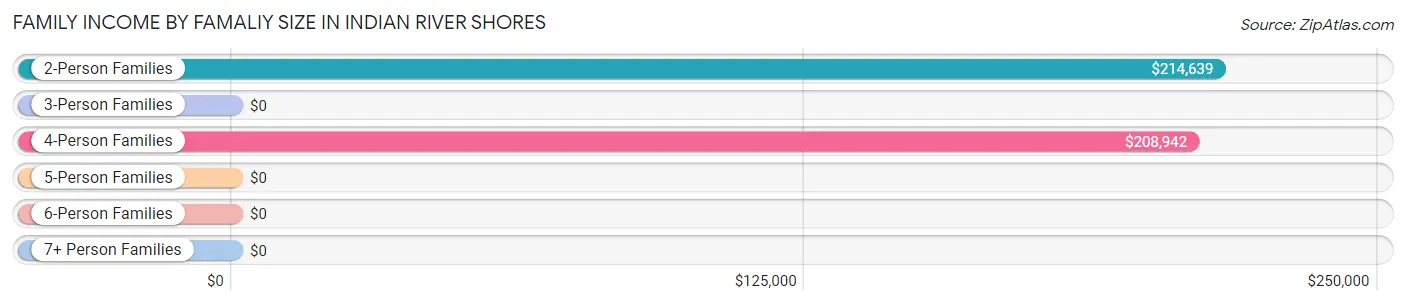
| Income Bracket | # Families | Median Income |
| 2-Person Families | 1,219 (87.7%) | $214,639 |
| 3-Person Families | 29 (2.1%) | $0 |
| 4-Person Families | 74 (5.3%) | $208,942 |
| 5-Person Families | 68 (4.9%) | $0 |
| 6-Person Families | 0 (0.0%) | $0 |
| 7+ Person Families | 0 (0.0%) | $0 |
| Total | 1,390 (100.0%) | $214,038 |
Family Income by Number of Earners in Indian River Shores
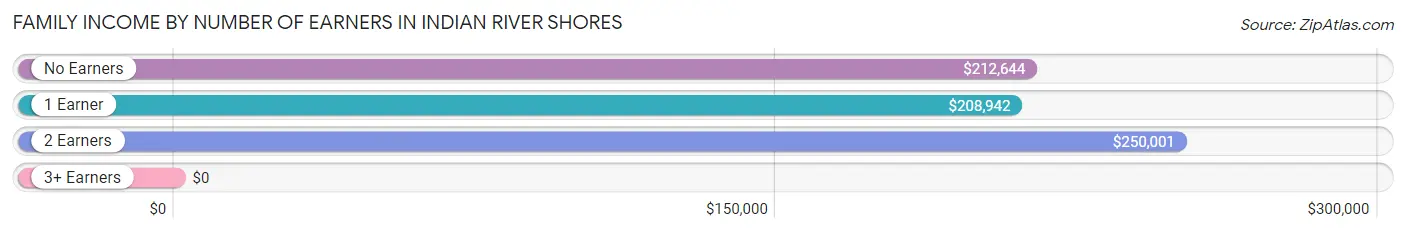
| Number of Earners | # Families | Median Income |
| No Earners | 786 (56.6%) | $212,644 |
| 1 Earner | 498 (35.8%) | $208,942 |
| 2 Earners | 106 (7.6%) | $250,001 |
| 3+ Earners | 0 (0.0%) | $0 |
| Total | 1,390 (100.0%) | $214,038 |
Household Income in Indian River Shores
Household Income Brackets in Indian River Shores
With 940 households falling in the category, the $200,000+ income range is the most frequent in Indian River Shores, accounting for 41.4% of all households. In contrast, only 23 households (1.0%) fall into the $10,000 to $14,999 income bracket, making it the least populous group.
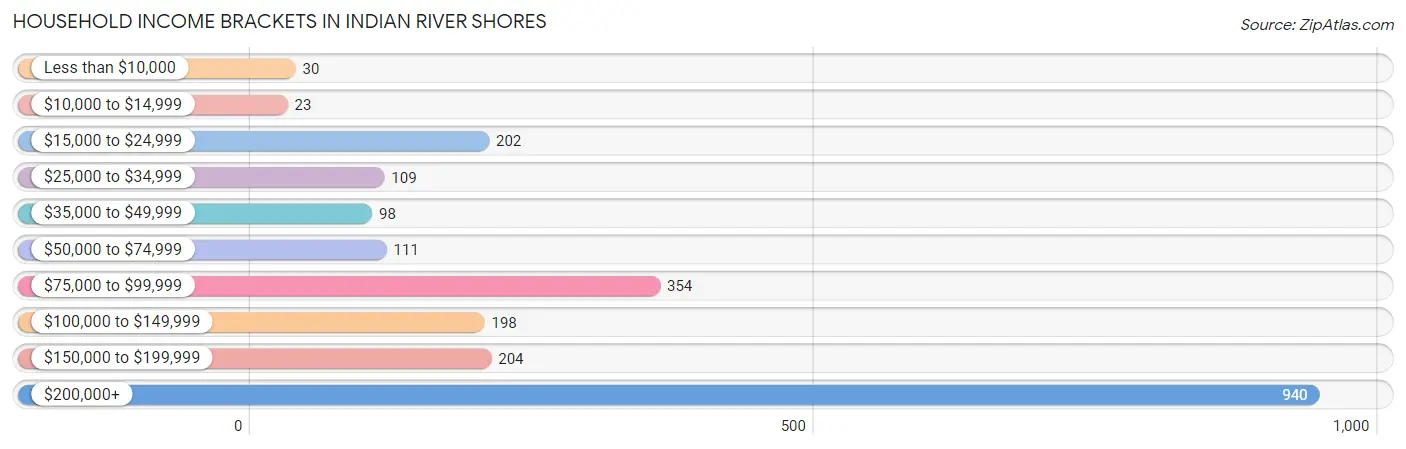
| Income Bracket | # Households | % Households |
| Less than $10,000 | 30 | 1.3% |
| $10,000 to $14,999 | 23 | 1.0% |
| $15,000 to $24,999 | 202 | 8.9% |
| $25,000 to $34,999 | 109 | 4.8% |
| $35,000 to $49,999 | 98 | 4.3% |
| $50,000 to $74,999 | 111 | 4.9% |
| $75,000 to $99,999 | 354 | 15.6% |
| $100,000 to $149,999 | 198 | 8.7% |
| $150,000 to $199,999 | 204 | 9.0% |
| $200,000+ | 940 | 41.4% |
Household Income by Householder Age in Indian River Shores
The median household income in Indian River Shores is $153,242, with the highest median household income of $207,730 found in the 45 to 64 years age bracket for the primary householder. A total of 426 households (18.8%) fall into this category.
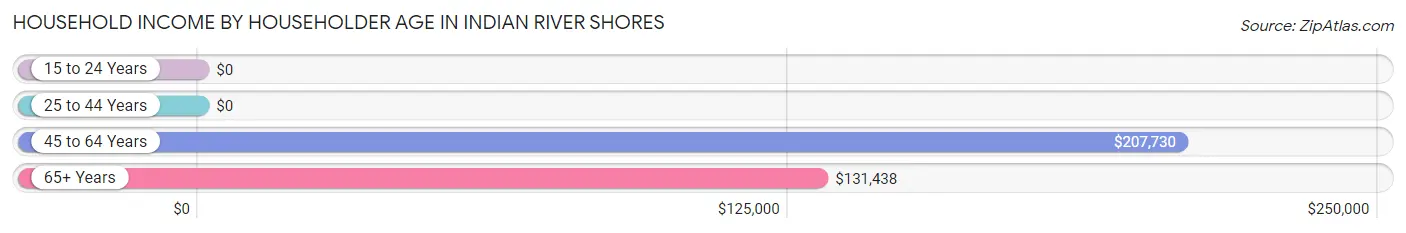
| Income Bracket | # Households | Median Income |
| 15 to 24 Years | 0 (0.0%) | $0 |
| 25 to 44 Years | 13 (0.6%) | $0 |
| 45 to 64 Years | 426 (18.8%) | $207,730 |
| 65+ Years | 1,832 (80.7%) | $131,438 |
| Total | 2,271 (100.0%) | $153,242 |
Poverty in Indian River Shores
Income Below Poverty by Sex and Age in Indian River Shores
With 1.3% poverty level for males and 4.6% for females among the residents of Indian River Shores, 65 to 74 year old males and 55 to 64 year old females are the most vulnerable to poverty, with 21 males (4.0%) and 65 females (22.6%) in their respective age groups living below the poverty level.
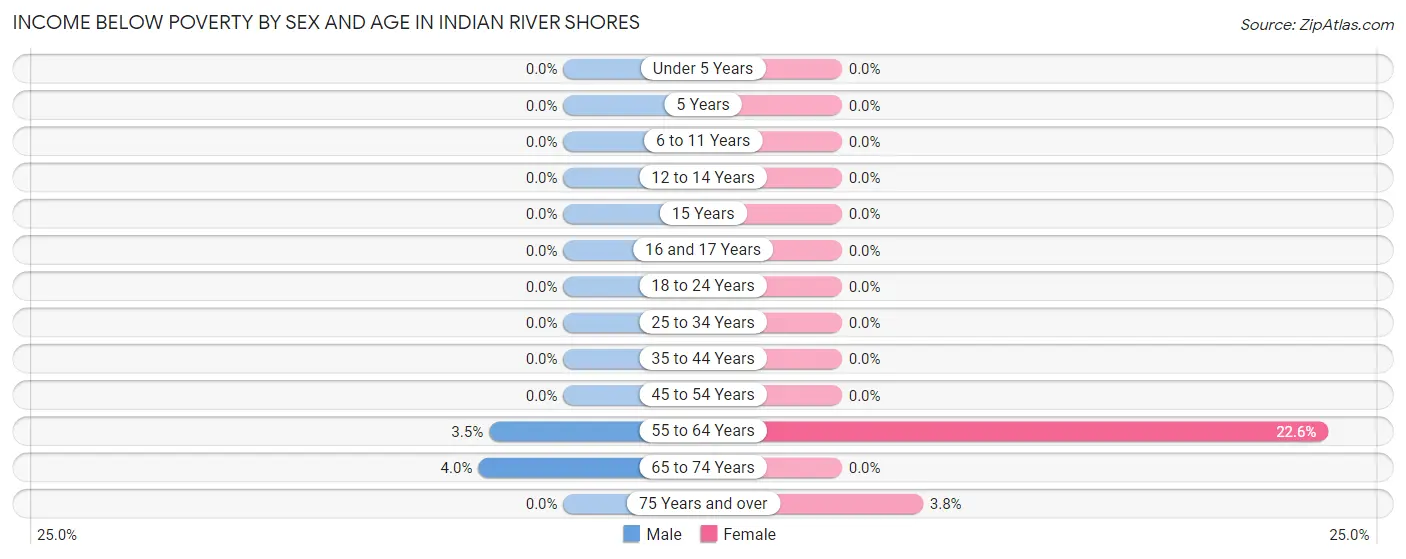
| Age Bracket | Male | Female |
| Under 5 Years | 0 (0.0%) | 0 (0.0%) |
| 5 Years | 0 (0.0%) | 0 (0.0%) |
| 6 to 11 Years | 0 (0.0%) | 0 (0.0%) |
| 12 to 14 Years | 0 (0.0%) | 0 (0.0%) |
| 15 Years | 0 (0.0%) | 0 (0.0%) |
| 16 and 17 Years | 0 (0.0%) | 0 (0.0%) |
| 18 to 24 Years | 0 (0.0%) | 0 (0.0%) |
| 25 to 34 Years | 0 (0.0%) | 0 (0.0%) |
| 35 to 44 Years | 0 (0.0%) | 0 (0.0%) |
| 45 to 54 Years | 0 (0.0%) | 0 (0.0%) |
| 55 to 64 Years | 6 (3.5%) | 65 (22.6%) |
| 65 to 74 Years | 21 (4.0%) | 0 (0.0%) |
| 75 Years and over | 0 (0.0%) | 40 (3.8%) |
| Total | 27 (1.3%) | 105 (4.6%) |
Income Above Poverty by Sex and Age in Indian River Shores
According to the poverty statistics in Indian River Shores, males aged 6 to 11 years and females aged 6 to 11 years are the age groups that are most secure financially, with 100.0% of males and 100.0% of females in these age groups living above the poverty line.
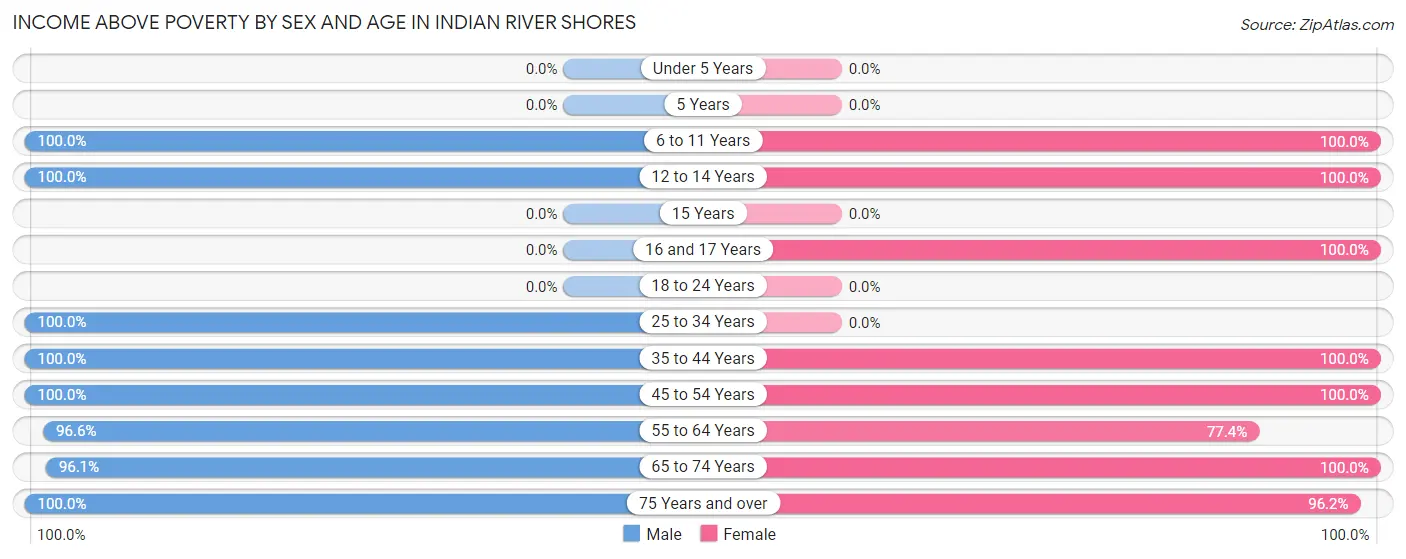
| Age Bracket | Male | Female |
| Under 5 Years | 0 (0.0%) | 0 (0.0%) |
| 5 Years | 0 (0.0%) | 0 (0.0%) |
| 6 to 11 Years | 64 (100.0%) | 34 (100.0%) |
| 12 to 14 Years | 76 (100.0%) | 82 (100.0%) |
| 15 Years | 0 (0.0%) | 0 (0.0%) |
| 16 and 17 Years | 0 (0.0%) | 30 (100.0%) |
| 18 to 24 Years | 0 (0.0%) | 0 (0.0%) |
| 25 to 34 Years | 16 (100.0%) | 0 (0.0%) |
| 35 to 44 Years | 93 (100.0%) | 20 (100.0%) |
| 45 to 54 Years | 123 (100.0%) | 185 (100.0%) |
| 55 to 64 Years | 168 (96.6%) | 223 (77.4%) |
| 65 to 74 Years | 511 (96.1%) | 559 (100.0%) |
| 75 Years and over | 927 (100.0%) | 1,023 (96.2%) |
| Total | 1,978 (98.7%) | 2,156 (95.4%) |
Income Below Poverty Among Married-Couple Families in Indian River Shores
The poverty statistics for married-couple families in Indian River Shores show that 0.4% or 6 of the total 1,376 families live below the poverty line. Families with no children have the highest poverty rate of 0.5%, comprising of 6 families. On the other hand, families with 1 or 2 children have the lowest poverty rate of 0.0%, which includes 0 families.
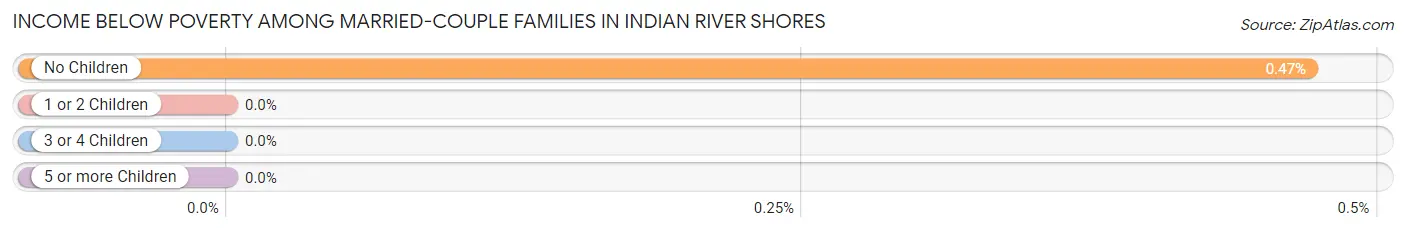
| Children | Above Poverty | Below Poverty |
| No Children | 1,262 (99.5%) | 6 (0.5%) |
| 1 or 2 Children | 58 (100.0%) | 0 (0.0%) |
| 3 or 4 Children | 50 (100.0%) | 0 (0.0%) |
| 5 or more Children | 0 (0.0%) | 0 (0.0%) |
| Total | 1,370 (99.6%) | 6 (0.4%) |
Income Below Poverty Among Single-Parent Households in Indian River Shores
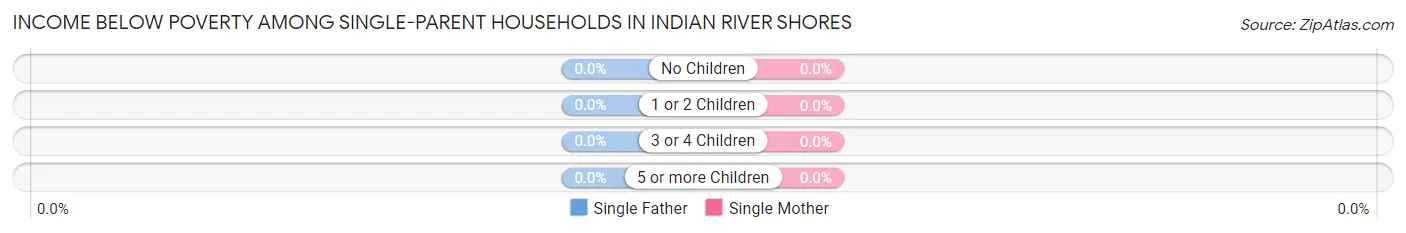
| Children | Single Father | Single Mother |
| No Children | 0 (0.0%) | 0 (0.0%) |
| 1 or 2 Children | 0 (0.0%) | 0 (0.0%) |
| 3 or 4 Children | 0 (0.0%) | 0 (0.0%) |
| 5 or more Children | 0 (0.0%) | 0 (0.0%) |
| Total | 0 (0.0%) | 0 (0.0%) |
Income Below Poverty Among Married-Couple vs Single-Parent Households in Indian River Shores
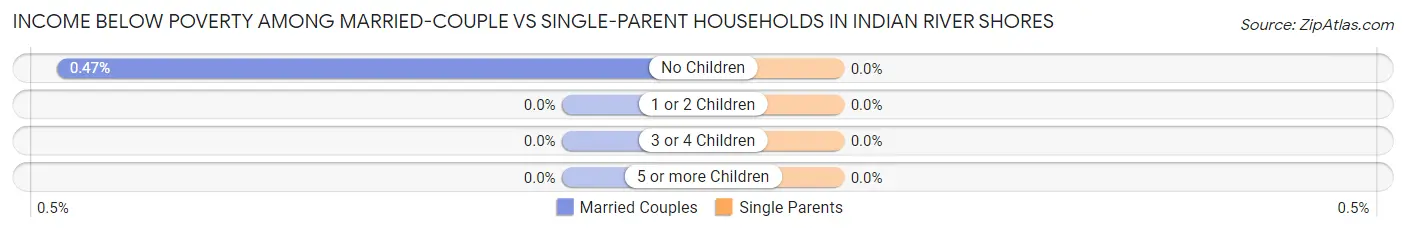
| Children | Married-Couple Families | Single-Parent Households |
| No Children | 6 (0.5%) | 0 (0.0%) |
| 1 or 2 Children | 0 (0.0%) | 0 (0.0%) |
| 3 or 4 Children | 0 (0.0%) | 0 (0.0%) |
| 5 or more Children | 0 (0.0%) | 0 (0.0%) |
| Total | 6 (0.4%) | 0 (0.0%) |
Race in Indian River Shores
The most populous races in Indian River Shores are White / Caucasian (3,929 | 92.1%), Asian (154 | 3.6%), and Two or more Races (152 | 3.6%).
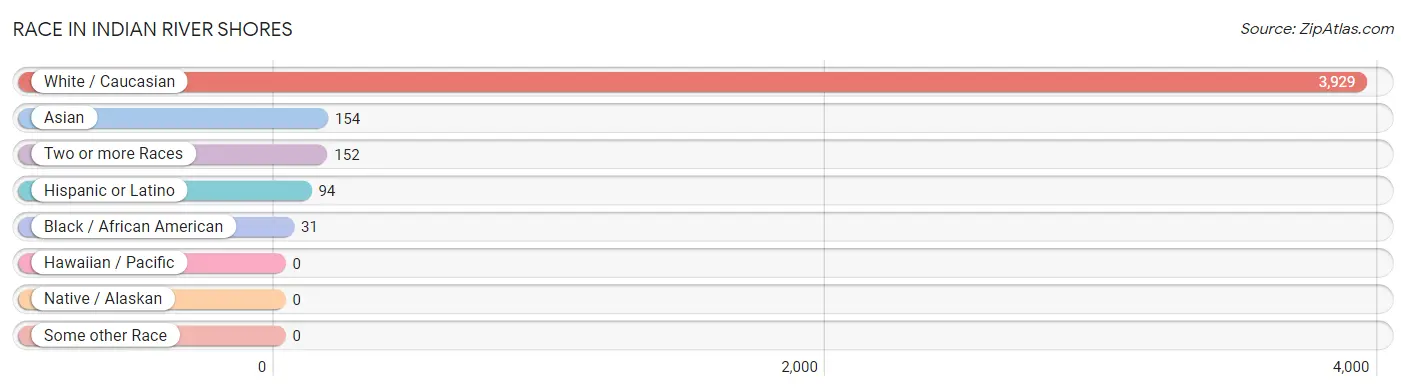
| Race | # Population | % Population |
| Asian | 154 | 3.6% |
| Black / African American | 31 | 0.7% |
| Hawaiian / Pacific | 0 | 0.0% |
| Hispanic or Latino | 94 | 2.2% |
| Native / Alaskan | 0 | 0.0% |
| White / Caucasian | 3,929 | 92.1% |
| Two or more Races | 152 | 3.6% |
| Some other Race | 0 | 0.0% |
| Total | 4,266 | 100.0% |
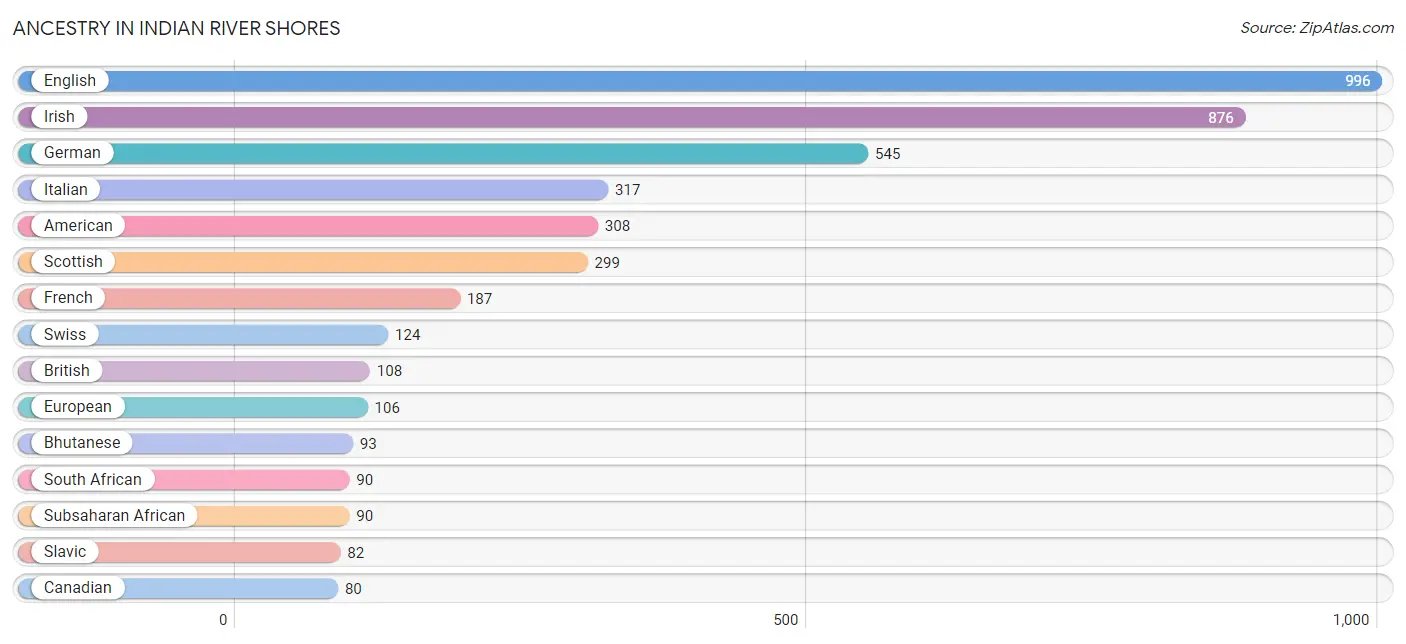
Ancestry in Indian River Shores
The most populous ancestries reported in Indian River Shores are English (996 | 23.4%), Irish (876 | 20.5%), German (545 | 12.8%), Italian (317 | 7.4%), and American (308 | 7.2%), together accounting for 71.3% of all Indian River Shores residents.
| Ancestry | # Population | % Population |
| American | 308 | 7.2% |
| Arab | 56 | 1.3% |
| Austrian | 38 | 0.9% |
| Bhutanese | 93 | 2.2% |
| British | 108 | 2.5% |
| Canadian | 80 | 1.9% |
| Central American | 32 | 0.7% |
| Cuban | 32 | 0.7% |
| Cypriot | 17 | 0.4% |
| Czech | 5 | 0.1% |
| Czechoslovakian | 19 | 0.4% |
| Danish | 26 | 0.6% |
| Dutch | 7 | 0.2% |
| Eastern European | 66 | 1.5% |
| Egyptian | 16 | 0.4% |
| English | 996 | 23.4% |
| European | 106 | 2.5% |
| French | 187 | 4.4% |
| German | 545 | 12.8% |
| Greek | 38 | 0.9% |
| Honduran | 32 | 0.7% |
| Hungarian | 33 | 0.8% |
| Indian (Asian) | 54 | 1.3% |
| Irish | 876 | 20.5% |
| Italian | 317 | 7.4% |
| Korean | 47 | 1.1% |
| Lebanese | 40 | 0.9% |
| Norwegian | 27 | 0.6% |
| Polish | 14 | 0.3% |
| Puerto Rican | 16 | 0.4% |
| Russian | 14 | 0.3% |
| Scotch-Irish | 22 | 0.5% |
| Scottish | 299 | 7.0% |
| Serbian | 35 | 0.8% |
| Slavic | 82 | 1.9% |
| Slovene | 12 | 0.3% |
| South African | 90 | 2.1% |
| Spaniard | 14 | 0.3% |
| Subsaharan African | 90 | 2.1% |
| Swedish | 34 | 0.8% |
| Swiss | 124 | 2.9% |
| Turkish | 5 | 0.1% |
| Ukrainian | 24 | 0.6% |
| Welsh | 20 | 0.5% | View All 44 Rows |
Immigrants in Indian River Shores
The most numerous immigrant groups reported in Indian River Shores came from Asia (154 | 3.6%), South Eastern Asia (154 | 3.6%), Canada (116 | 2.7%), Europe (106 | 2.5%), and Philippines (100 | 2.3%), together accounting for 14.8% of all Indian River Shores residents.
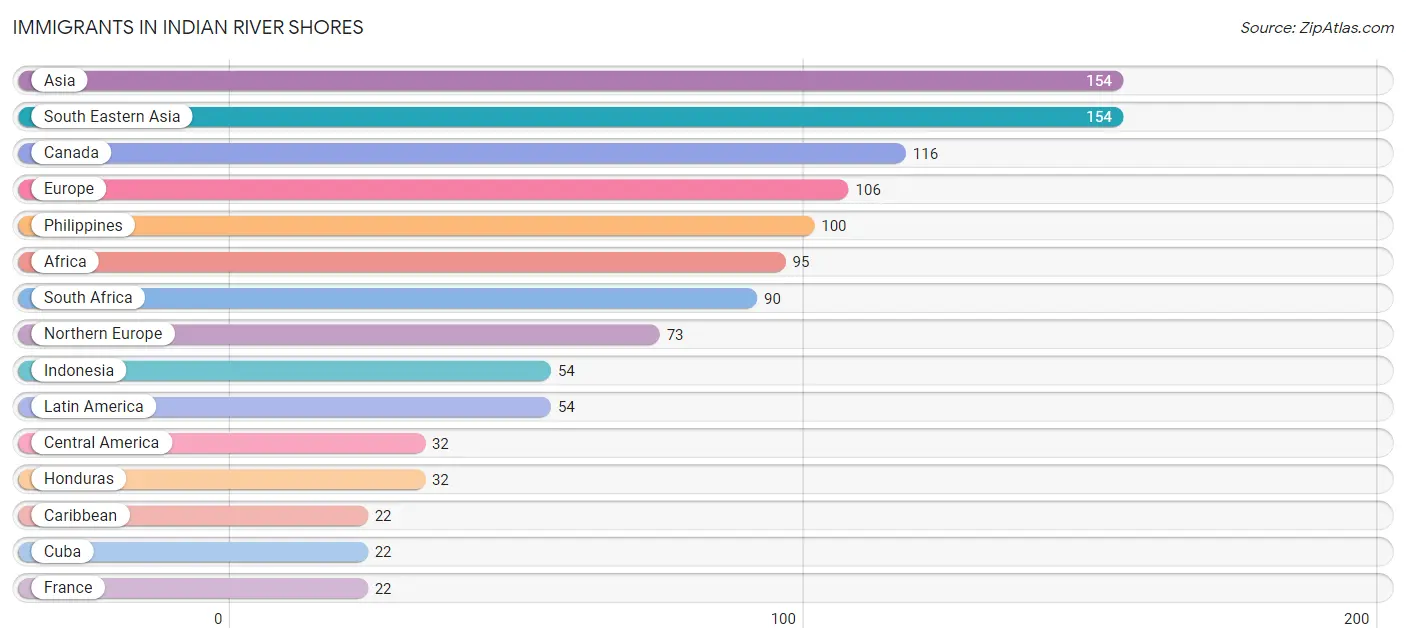
| Immigration Origin | # Population | % Population |
| Africa | 95 | 2.2% |
| Asia | 154 | 3.6% |
| Canada | 116 | 2.7% |
| Caribbean | 22 | 0.5% |
| Central America | 32 | 0.7% |
| Cuba | 22 | 0.5% |
| Eastern Europe | 11 | 0.3% |
| Egypt | 5 | 0.1% |
| Europe | 106 | 2.5% |
| France | 22 | 0.5% |
| Honduras | 32 | 0.7% |
| Hungary | 11 | 0.3% |
| Indonesia | 54 | 1.3% |
| Latin America | 54 | 1.3% |
| Northern Africa | 5 | 0.1% |
| Northern Europe | 73 | 1.7% |
| Philippines | 100 | 2.3% |
| South Africa | 90 | 2.1% |
| South Eastern Asia | 154 | 3.6% |
| Western Europe | 22 | 0.5% | View All 20 Rows |
Sex and Age in Indian River Shores
Sex and Age in Indian River Shores
The most populous age groups in Indian River Shores are 85 Years and over (365 | 18.2%) for men and 85 Years and over (479 | 21.2%) for women.
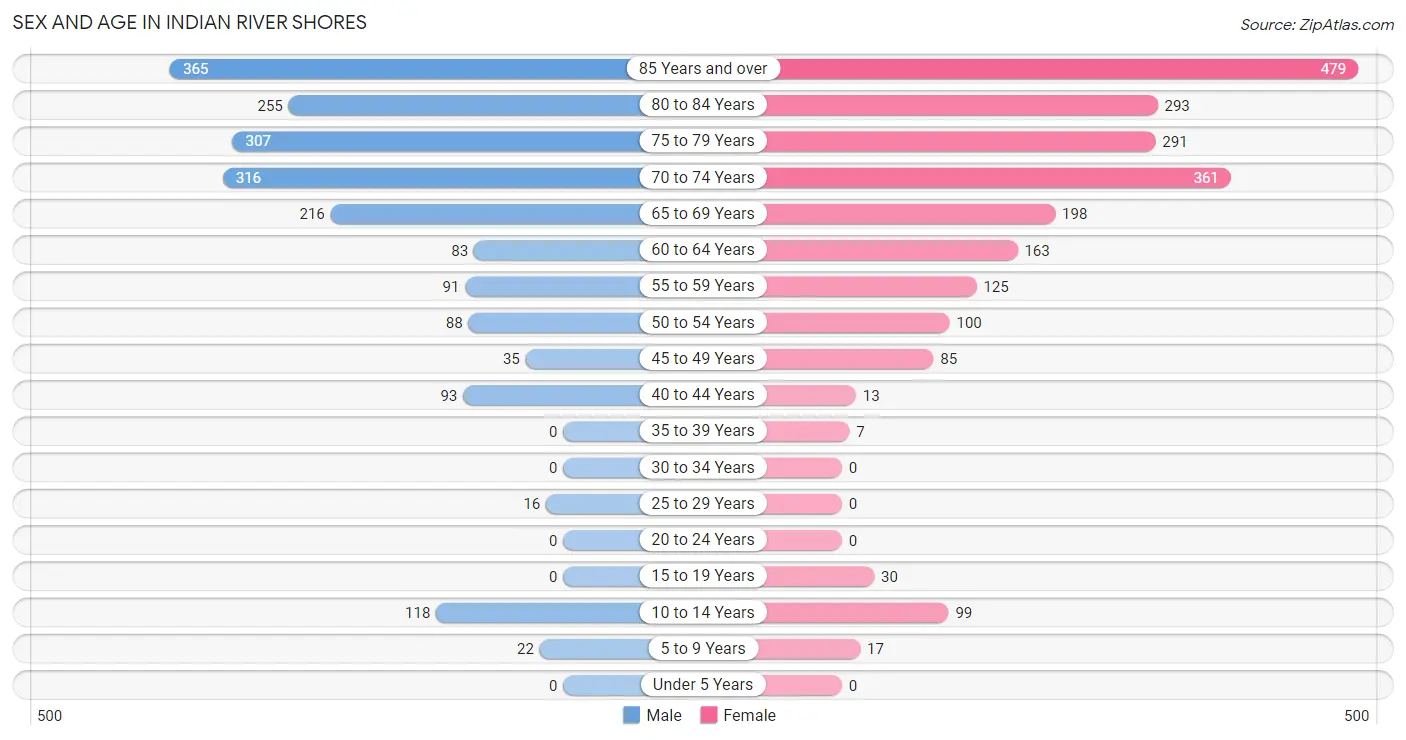
| Age Bracket | Male | Female |
| Under 5 Years | 0 (0.0%) | 0 (0.0%) |
| 5 to 9 Years | 22 (1.1%) | 17 (0.7%) |
| 10 to 14 Years | 118 (5.9%) | 99 (4.4%) |
| 15 to 19 Years | 0 (0.0%) | 30 (1.3%) |
| 20 to 24 Years | 0 (0.0%) | 0 (0.0%) |
| 25 to 29 Years | 16 (0.8%) | 0 (0.0%) |
| 30 to 34 Years | 0 (0.0%) | 0 (0.0%) |
| 35 to 39 Years | 0 (0.0%) | 7 (0.3%) |
| 40 to 44 Years | 93 (4.6%) | 13 (0.6%) |
| 45 to 49 Years | 35 (1.8%) | 85 (3.8%) |
| 50 to 54 Years | 88 (4.4%) | 100 (4.4%) |
| 55 to 59 Years | 91 (4.5%) | 125 (5.5%) |
| 60 to 64 Years | 83 (4.1%) | 163 (7.2%) |
| 65 to 69 Years | 216 (10.8%) | 198 (8.8%) |
| 70 to 74 Years | 316 (15.8%) | 361 (16.0%) |
| 75 to 79 Years | 307 (15.3%) | 291 (12.9%) |
| 80 to 84 Years | 255 (12.7%) | 293 (13.0%) |
| 85 Years and over | 365 (18.2%) | 479 (21.2%) |
| Total | 2,005 (100.0%) | 2,261 (100.0%) |
Families and Households in Indian River Shores
Median Family Size in Indian River Shores
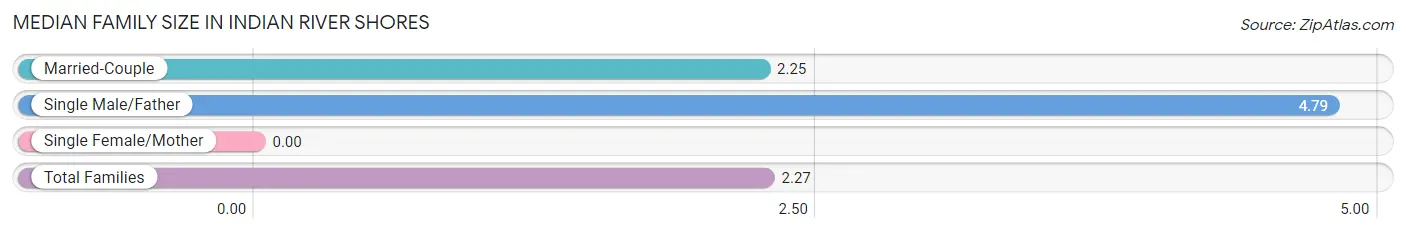
| Family Type | # Families | Family Size |
| Married-Couple | 1,376 (99.0%) | 2.25 |
| Single Male/Father | 14 (1.0%) | 4.79 |
| Single Female/Mother | 0 (0.0%) | - |
| Total Families | 1,390 (100.0%) | 2.27 |
Median Household Size in Indian River Shores
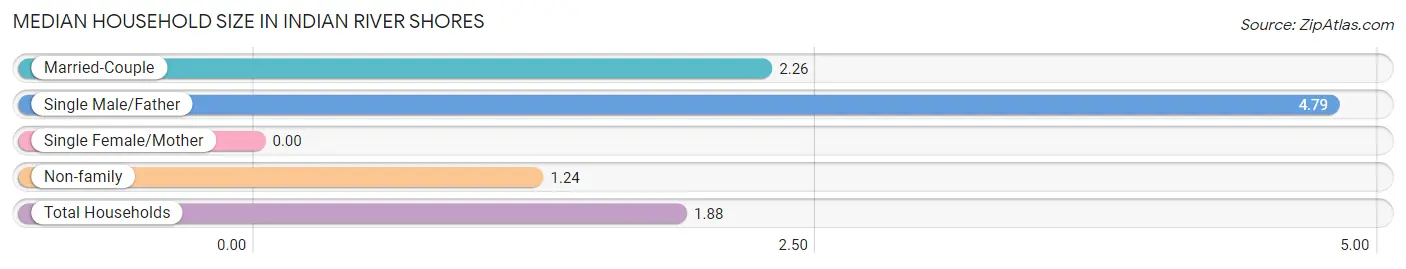
| Household Type | # Households | Household Size |
| Married-Couple | 1,376 (60.6%) | 2.26 |
| Single Male/Father | 14 (0.6%) | 4.79 |
| Single Female/Mother | 0 (0.0%) | - |
| Non-family | 881 (38.8%) | 1.24 |
| Total Households | 2,271 (100.0%) | 1.88 |
Household Size by Marriage Status in Indian River Shores
Out of a total of 2,271 households in Indian River Shores, 1,390 (61.2%) are family households, while 881 (38.8%) are nonfamily households. The most numerous type of family households are 2-person households, comprising 1,219, and the most common type of nonfamily households are 1-person households, comprising 744.
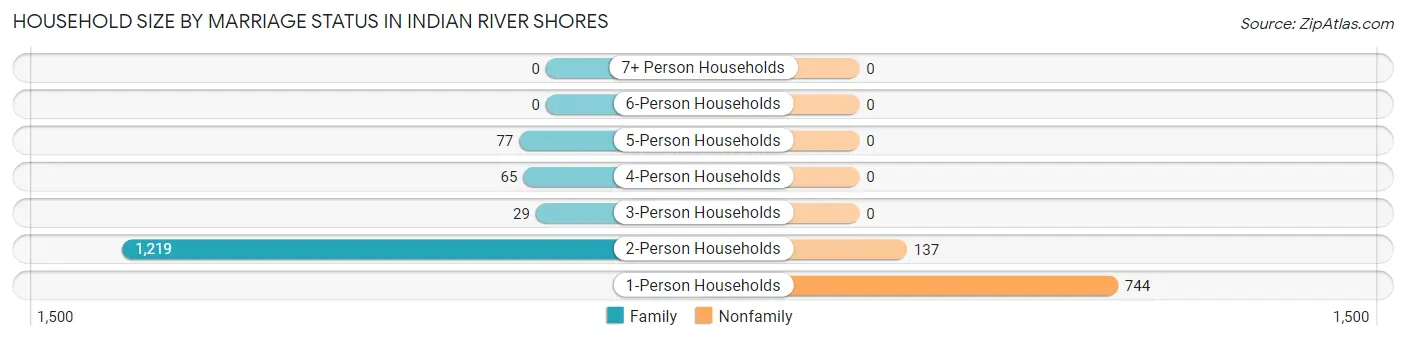
| Household Size | Family Households | Nonfamily Households |
| 1-Person Households | - | 744 (32.8%) |
| 2-Person Households | 1,219 (53.7%) | 137 (6.0%) |
| 3-Person Households | 29 (1.3%) | 0 (0.0%) |
| 4-Person Households | 65 (2.9%) | 0 (0.0%) |
| 5-Person Households | 77 (3.4%) | 0 (0.0%) |
| 6-Person Households | 0 (0.0%) | 0 (0.0%) |
| 7+ Person Households | 0 (0.0%) | 0 (0.0%) |
| Total | 1,390 (61.2%) | 881 (38.8%) |
Female Fertility in Indian River Shores
Fertility by Age in Indian River Shores
| Age Bracket | Women with Births | Births / 1,000 Women |
| 15 to 19 years | 0 (0.0%) | 0.0 |
| 20 to 34 years | 0 (0.0%) | 0.0 |
| 35 to 50 years | 0 (0.0%) | 0.0 |
| Total | 0 (0.0%) | 0.0 |
Fertility by Age by Marriage Status in Indian River Shores
| Age Bracket | Married | Unmarried |
| 15 to 19 years | 0 (0.0%) | 0 (0.0%) |
| 20 to 34 years | 0 (0.0%) | 0 (0.0%) |
| 35 to 50 years | 0 (0.0%) | 0 (0.0%) |
| Total | 0 (0.0%) | 0 (0.0%) |
Fertility by Education in Indian River Shores
| Educational Attainment | Women with Births | Births / 1,000 Women |
| Less than High School | 0 (0.0%) | 0.0 |
| High School Diploma | 0 (0.0%) | 0.0 |
| College or Associate's Degree | 0 (0.0%) | 0.0 |
| Bachelor's Degree | 0 (0.0%) | 0.0 |
| Graduate Degree | 0 (0.0%) | 0.0 |
| Total | 0 (0.0%) | 0.0 |
Fertility by Education by Marriage Status in Indian River Shores
| Educational Attainment | Married | Unmarried |
| Less than High School | 0 (0.0%) | 0 (0.0%) |
| High School Diploma | 0 (0.0%) | 0 (0.0%) |
| College or Associate's Degree | 0 (0.0%) | 0 (0.0%) |
| Bachelor's Degree | 0 (0.0%) | 0 (0.0%) |
| Graduate Degree | 0 (0.0%) | 0 (0.0%) |
| Total | 0 (0.0%) | 0 (0.0%) |
Employment Characteristics in Indian River Shores
Employment by Class of Employer in Indian River Shores
Among the 822 employed individuals in Indian River Shores, private company employees (380 | 46.2%), self-employed (incorporated) (239 | 29.1%), and self-employed (not incorporated) (153 | 18.6%) make up the most common classes of employment.
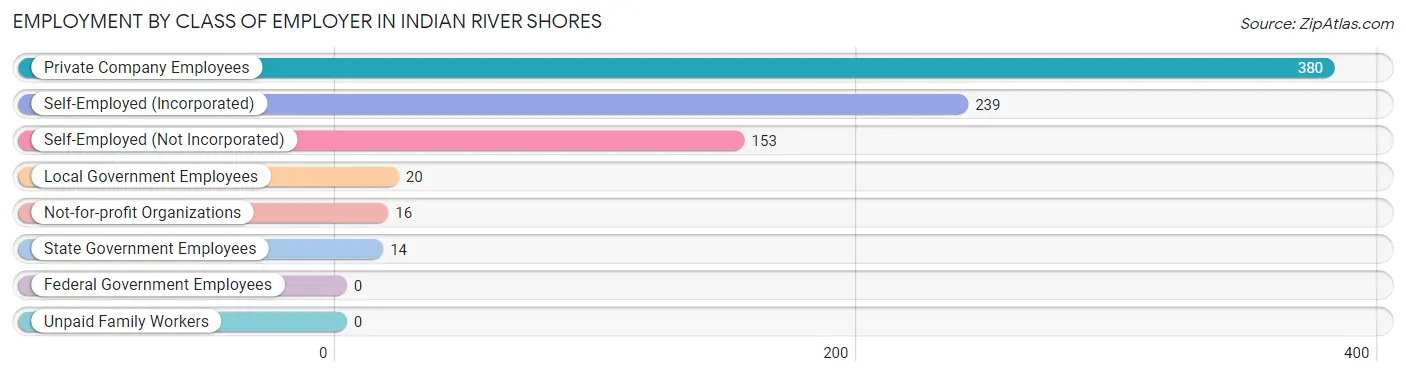
| Employer Class | # Employees | % Employees |
| Private Company Employees | 380 | 46.2% |
| Self-Employed (Incorporated) | 239 | 29.1% |
| Self-Employed (Not Incorporated) | 153 | 18.6% |
| Not-for-profit Organizations | 16 | 1.9% |
| Local Government Employees | 20 | 2.4% |
| State Government Employees | 14 | 1.7% |
| Federal Government Employees | 0 | 0.0% |
| Unpaid Family Workers | 0 | 0.0% |
| Total | 822 | 100.0% |
Employment Status by Age in Indian River Shores
According to the labor force statistics for Indian River Shores, out of the total population over 16 years of age (4,010), 20.6% or 826 individuals are in the labor force, with 0.6% or 5 of them unemployed. The age group with the highest labor force participation rate is 25 to 29 years, with 100.0% or 16 individuals in the labor force. Within the labor force, the 55 to 59 years age range has the highest percentage of unemployed individuals, with 3.4% or 5 of them being unemployed.
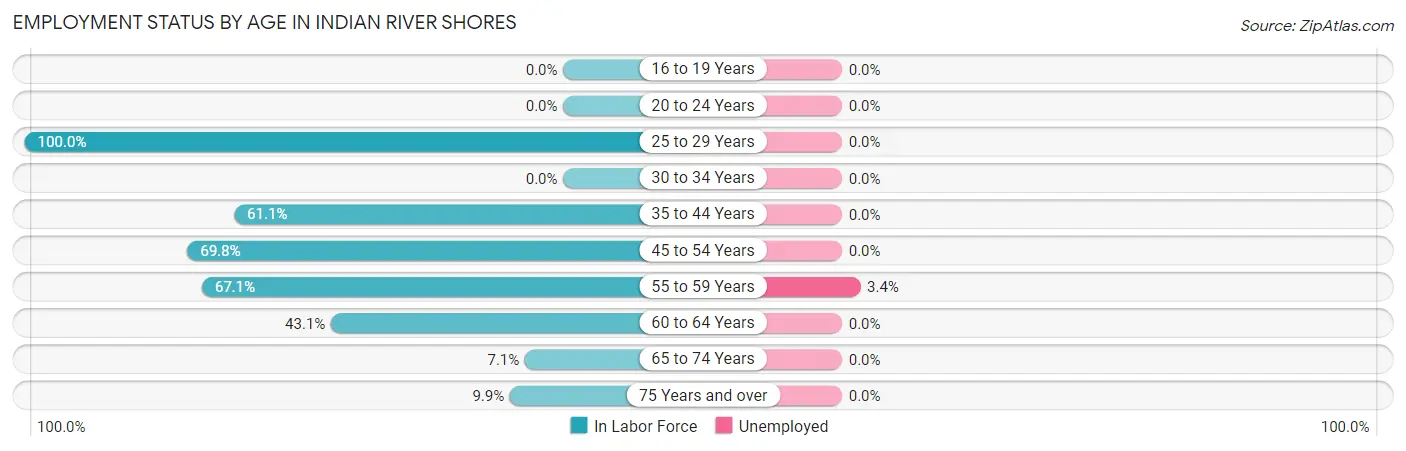
| Age Bracket | In Labor Force | Unemployed |
| 16 to 19 Years | 0 (0.0%) | 0 (0.0%) |
| 20 to 24 Years | 0 (0.0%) | 0 (0.0%) |
| 25 to 29 Years | 16 (100.0%) | 0 (0.0%) |
| 30 to 34 Years | 0 (0.0%) | 0 (0.0%) |
| 35 to 44 Years | 69 (61.1%) | 0 (0.0%) |
| 45 to 54 Years | 215 (69.8%) | 0 (0.0%) |
| 55 to 59 Years | 145 (67.1%) | 5 (3.4%) |
| 60 to 64 Years | 106 (43.1%) | 0 (0.0%) |
| 65 to 74 Years | 77 (7.1%) | 0 (0.0%) |
| 75 Years and over | 197 (9.9%) | 0 (0.0%) |
| Total | 826 (20.6%) | 5 (0.6%) |
Employment Status by Educational Attainment in Indian River Shores
According to labor force statistics for Indian River Shores, 61.3% of individuals (551) out of the total population between 25 and 64 years of age (899) are in the labor force, with 0.9% or 5 of them being unemployed. The group with the highest labor force participation rate are those with the educational attainment of college / associate degree, with 80.0% or 84 individuals in the labor force. Within the labor force, individuals with bachelor's degree or higher education have the highest percentage of unemployment, with 1.1% or 5 of them being unemployed.
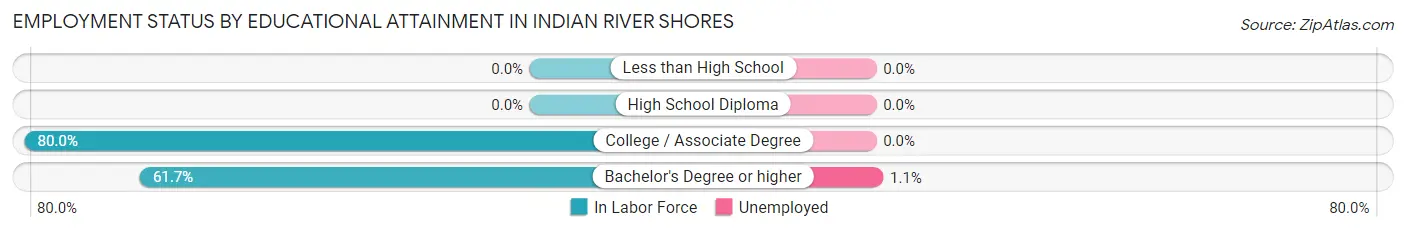
| Educational Attainment | In Labor Force | Unemployed |
| Less than High School | 0 (0.0%) | 0 (0.0%) |
| High School Diploma | 0 (0.0%) | 0 (0.0%) |
| College / Associate Degree | 84 (80.0%) | 0 (0.0%) |
| Bachelor's Degree or higher | 467 (61.7%) | 8 (1.1%) |
| Total | 551 (61.3%) | 8 (0.9%) |
Employment Occupations by Sex in Indian River Shores
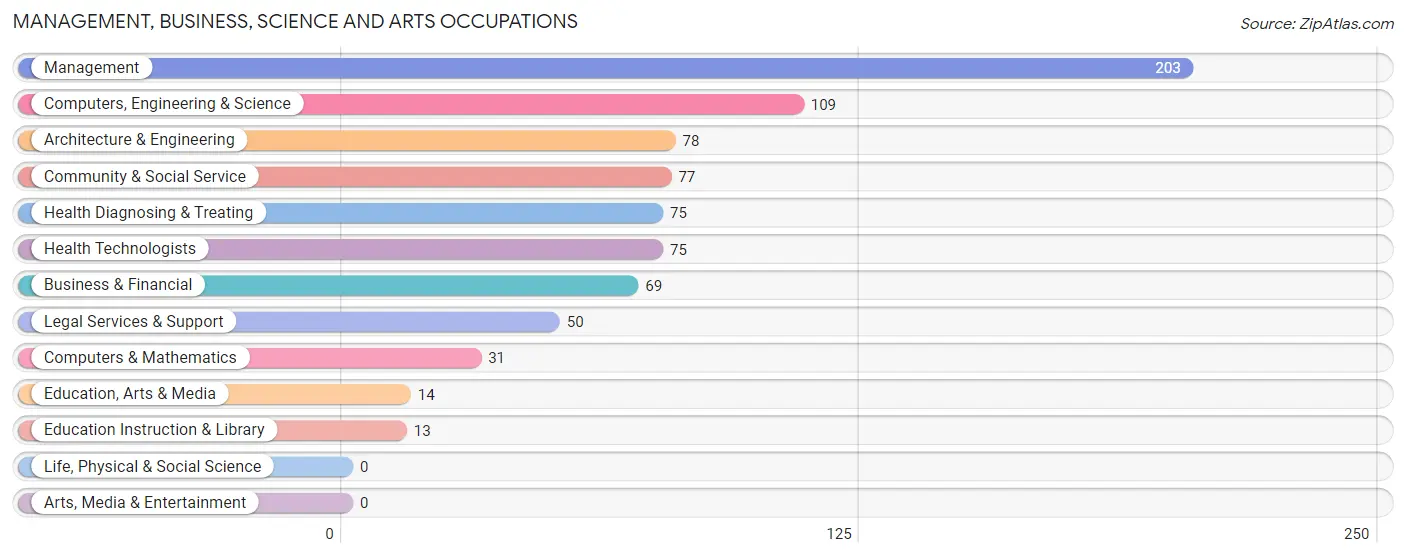
Management, Business, Science and Arts Occupations
The most common Management, Business, Science and Arts occupations in Indian River Shores are Management (203 | 24.7%), Computers, Engineering & Science (109 | 13.3%), Architecture & Engineering (78 | 9.5%), Community & Social Service (77 | 9.4%), and Health Diagnosing & Treating (75 | 9.1%).
Management, Business, Science and Arts Occupations by Sex
Within the Management, Business, Science and Arts occupations in Indian River Shores, the most male-oriented occupations are Architecture & Engineering (100.0%), Legal Services & Support (100.0%), and Management (74.9%), while the most female-oriented occupations are Computers & Mathematics (100.0%), Education, Arts & Media (100.0%), and Education Instruction & Library (100.0%).
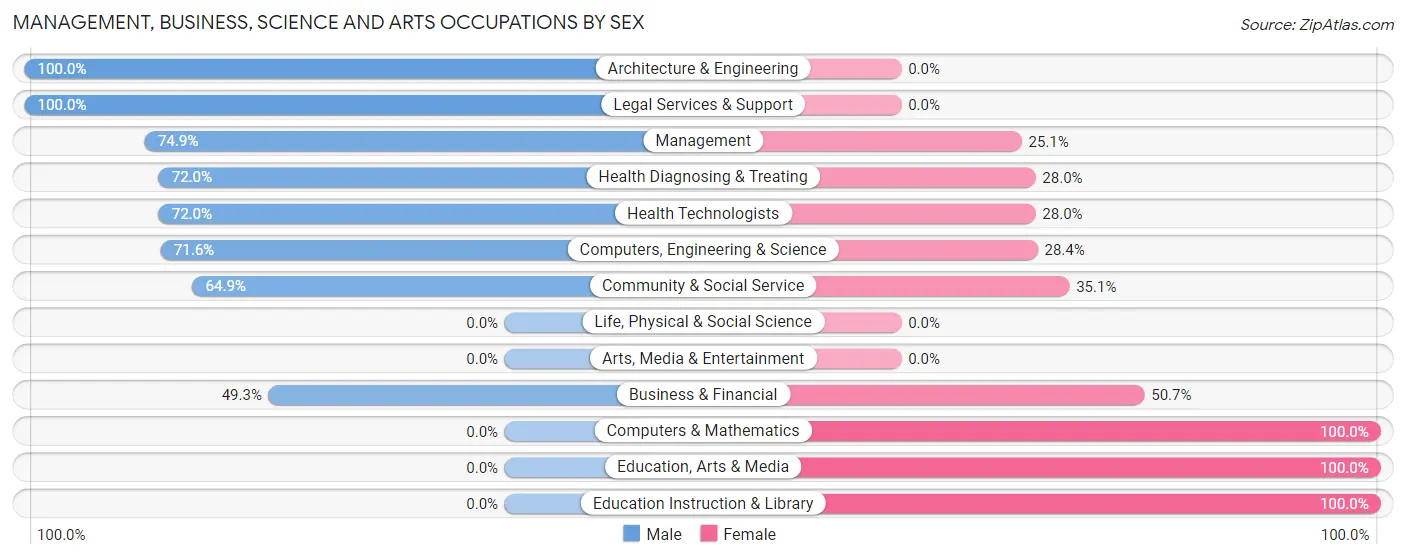
| Occupation | Male | Female |
| Management | 152 (74.9%) | 51 (25.1%) |
| Business & Financial | 34 (49.3%) | 35 (50.7%) |
| Computers, Engineering & Science | 78 (71.6%) | 31 (28.4%) |
| Computers & Mathematics | 0 (0.0%) | 31 (100.0%) |
| Architecture & Engineering | 78 (100.0%) | 0 (0.0%) |
| Life, Physical & Social Science | 0 (0.0%) | 0 (0.0%) |
| Community & Social Service | 50 (64.9%) | 27 (35.1%) |
| Education, Arts & Media | 0 (0.0%) | 14 (100.0%) |
| Legal Services & Support | 50 (100.0%) | 0 (0.0%) |
| Education Instruction & Library | 0 (0.0%) | 13 (100.0%) |
| Arts, Media & Entertainment | 0 (0.0%) | 0 (0.0%) |
| Health Diagnosing & Treating | 54 (72.0%) | 21 (28.0%) |
| Health Technologists | 54 (72.0%) | 21 (28.0%) |
| Total (Category) | 368 (69.0%) | 165 (31.0%) |
| Total (Overall) | 525 (63.9%) | 297 (36.1%) |
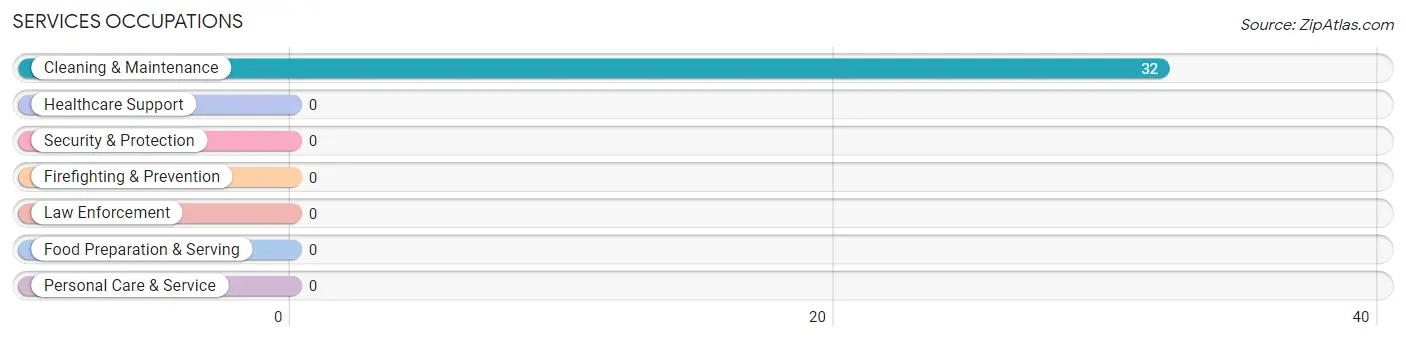
Services Occupations
The most common Services occupations in Indian River Shores are , and Cleaning & Maintenance (32 | 3.9%).
Services Occupations by Sex
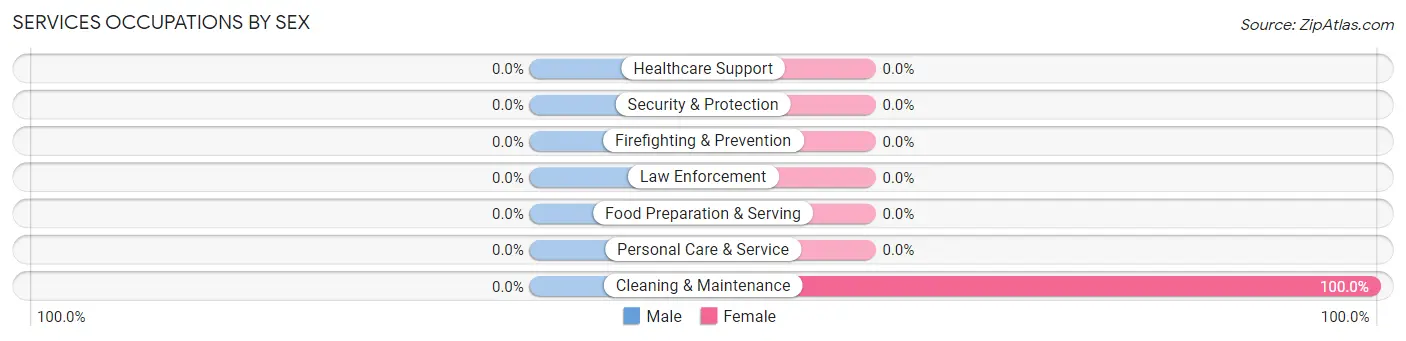
| Occupation | Male | Female |
| Healthcare Support | 0 (0.0%) | 0 (0.0%) |
| Security & Protection | 0 (0.0%) | 0 (0.0%) |
| Firefighting & Prevention | 0 (0.0%) | 0 (0.0%) |
| Law Enforcement | 0 (0.0%) | 0 (0.0%) |
| Food Preparation & Serving | 0 (0.0%) | 0 (0.0%) |
| Cleaning & Maintenance | 0 (0.0%) | 32 (100.0%) |
| Personal Care & Service | 0 (0.0%) | 0 (0.0%) |
| Total (Category) | 0 (0.0%) | 32 (100.0%) |
| Total (Overall) | 525 (63.9%) | 297 (36.1%) |
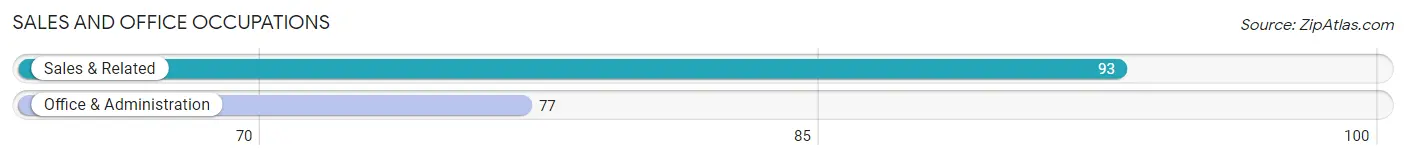
Sales and Office Occupations
The most common Sales and Office occupations in Indian River Shores are Sales & Related (93 | 11.3%), and Office & Administration (77 | 9.4%).
Sales and Office Occupations by Sex
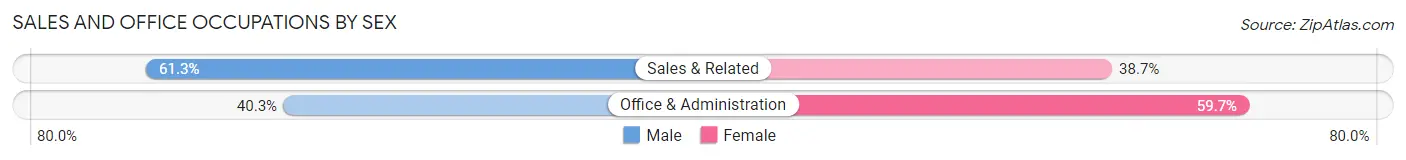
| Occupation | Male | Female |
| Sales & Related | 57 (61.3%) | 36 (38.7%) |
| Office & Administration | 31 (40.3%) | 46 (59.7%) |
| Total (Category) | 88 (51.8%) | 82 (48.2%) |
| Total (Overall) | 525 (63.9%) | 297 (36.1%) |
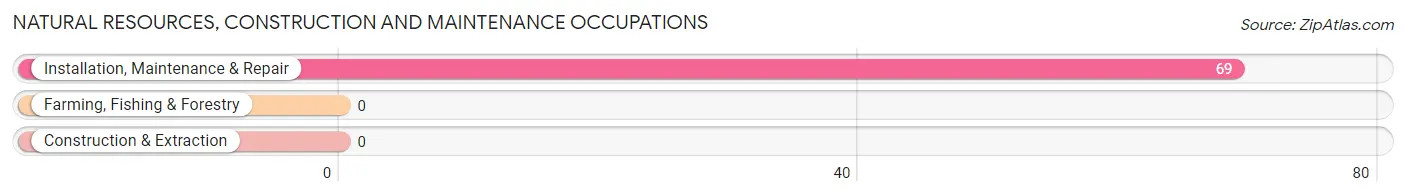
Natural Resources, Construction and Maintenance Occupations
The most common Natural Resources, Construction and Maintenance occupations in Indian River Shores are , and Installation, Maintenance & Repair (69 | 8.4%).
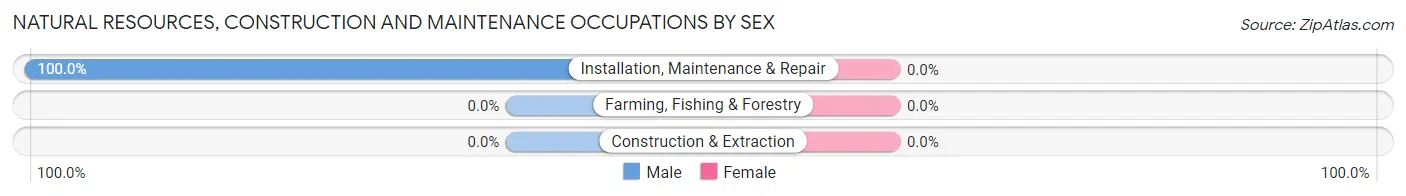
Natural Resources, Construction and Maintenance Occupations by Sex
| Occupation | Male | Female |
| Farming, Fishing & Forestry | 0 (0.0%) | 0 (0.0%) |
| Construction & Extraction | 0 (0.0%) | 0 (0.0%) |
| Installation, Maintenance & Repair | 69 (100.0%) | 0 (0.0%) |
| Total (Category) | 69 (100.0%) | 0 (0.0%) |
| Total (Overall) | 525 (63.9%) | 297 (36.1%) |
Production, Transportation and Moving Occupations
The most common Production, Transportation and Moving occupations in Indian River Shores are , and Production (18 | 2.2%).
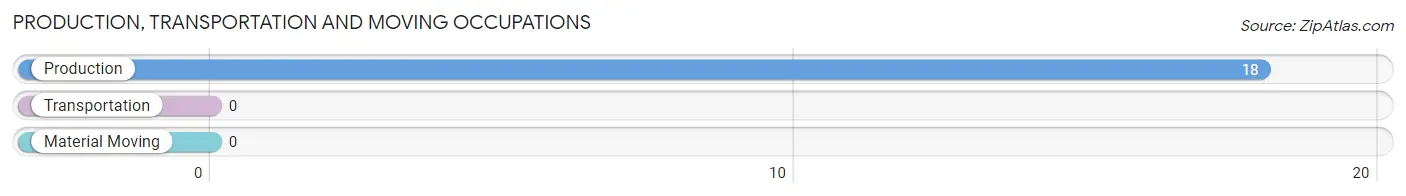
Production, Transportation and Moving Occupations by Sex
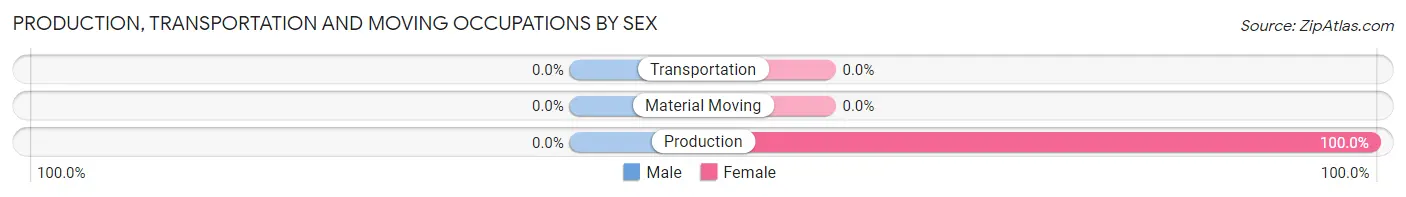
| Occupation | Male | Female |
| Production | 0 (0.0%) | 18 (100.0%) |
| Transportation | 0 (0.0%) | 0 (0.0%) |
| Material Moving | 0 (0.0%) | 0 (0.0%) |
| Total (Category) | 0 (0.0%) | 18 (100.0%) |
| Total (Overall) | 525 (63.9%) | 297 (36.1%) |
Employment Industries by Sex in Indian River Shores
Employment Industries in Indian River Shores
The major employment industries in Indian River Shores include Finance & Insurance (220 | 26.8%), Professional & Scientific (174 | 21.2%), Manufacturing (98 | 11.9%), Health Care & Social Assistance (95 | 11.6%), and Real Estate, Rental & Leasing (49 | 6.0%).
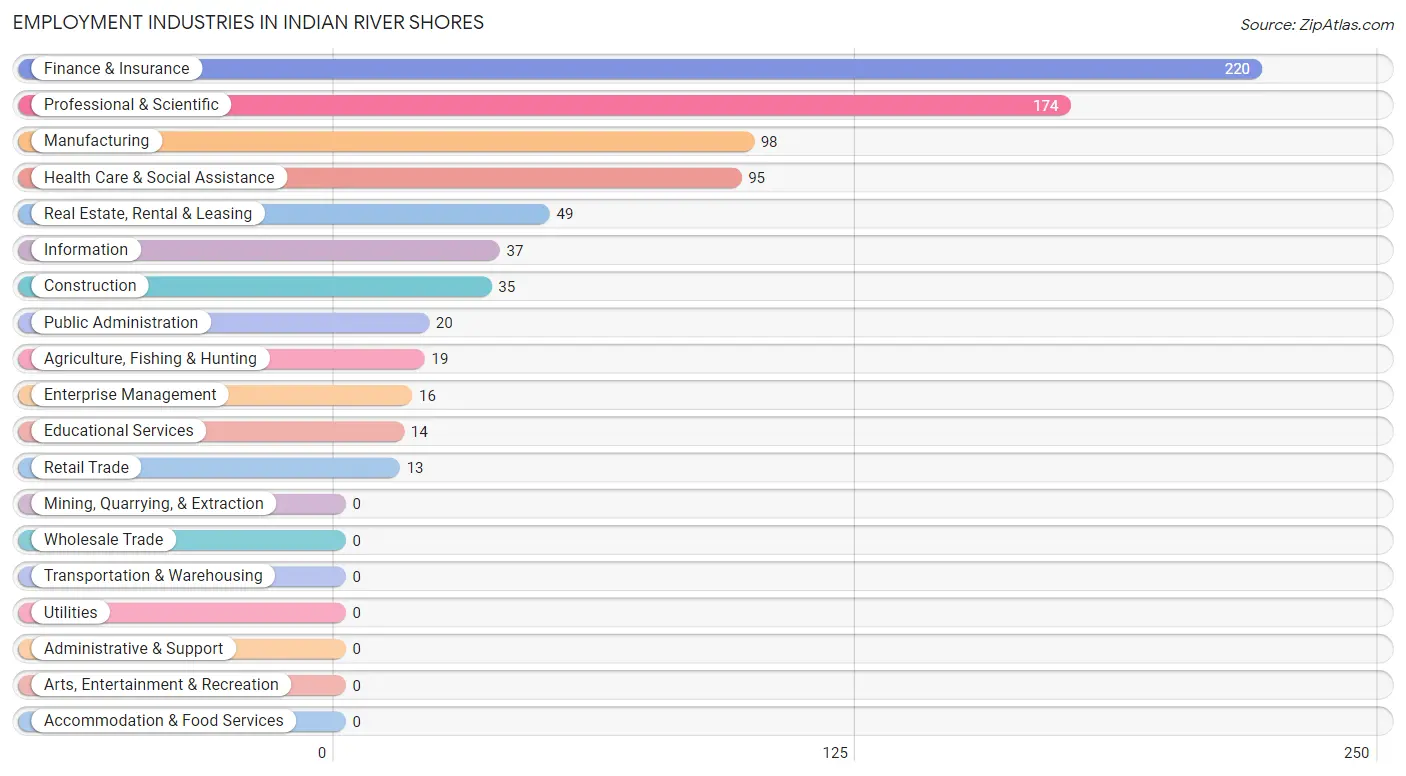
Employment Industries by Sex in Indian River Shores
The Indian River Shores industries that see more men than women are Agriculture, Fishing & Hunting (100.0%), Information (100.0%), and Enterprise Management (100.0%), whereas the industries that tend to have a higher number of women are Real Estate, Rental & Leasing (100.0%), Educational Services (100.0%), and Construction (74.3%).
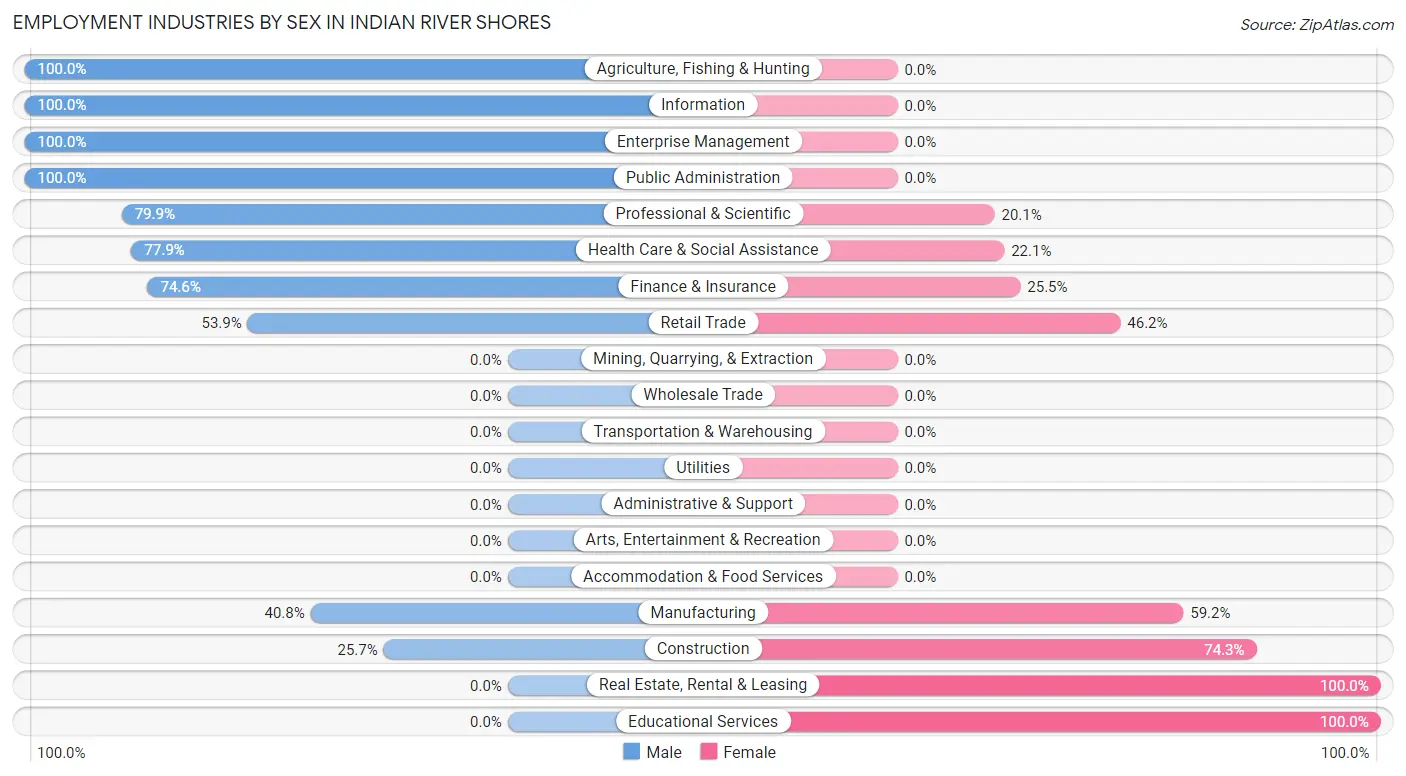
| Industry | Male | Female |
| Agriculture, Fishing & Hunting | 19 (100.0%) | 0 (0.0%) |
| Mining, Quarrying, & Extraction | 0 (0.0%) | 0 (0.0%) |
| Construction | 9 (25.7%) | 26 (74.3%) |
| Manufacturing | 40 (40.8%) | 58 (59.2%) |
| Wholesale Trade | 0 (0.0%) | 0 (0.0%) |
| Retail Trade | 7 (53.8%) | 6 (46.2%) |
| Transportation & Warehousing | 0 (0.0%) | 0 (0.0%) |
| Utilities | 0 (0.0%) | 0 (0.0%) |
| Information | 37 (100.0%) | 0 (0.0%) |
| Finance & Insurance | 164 (74.6%) | 56 (25.5%) |
| Real Estate, Rental & Leasing | 0 (0.0%) | 49 (100.0%) |
| Professional & Scientific | 139 (79.9%) | 35 (20.1%) |
| Enterprise Management | 16 (100.0%) | 0 (0.0%) |
| Administrative & Support | 0 (0.0%) | 0 (0.0%) |
| Educational Services | 0 (0.0%) | 14 (100.0%) |
| Health Care & Social Assistance | 74 (77.9%) | 21 (22.1%) |
| Arts, Entertainment & Recreation | 0 (0.0%) | 0 (0.0%) |
| Accommodation & Food Services | 0 (0.0%) | 0 (0.0%) |
| Public Administration | 20 (100.0%) | 0 (0.0%) |
| Total | 525 (63.9%) | 297 (36.1%) |
Education in Indian River Shores
School Enrollment in Indian River Shores
The most common levels of schooling among the 476 students in Indian River Shores are middle school (117 | 24.6%), graduate / professional (103 | 21.6%), and elementary school (98 | 20.6%).
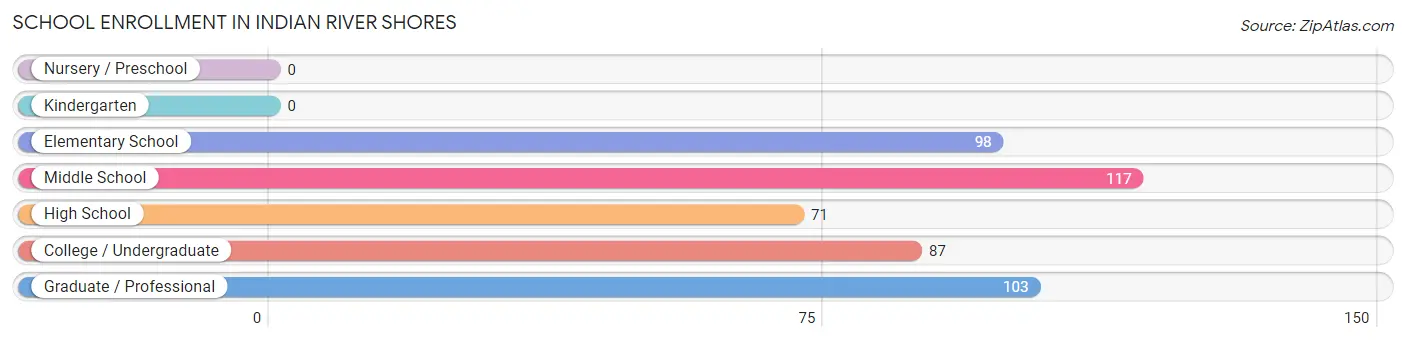
| School Level | # Students | % Students |
| Nursery / Preschool | 0 | 0.0% |
| Kindergarten | 0 | 0.0% |
| Elementary School | 98 | 20.6% |
| Middle School | 117 | 24.6% |
| High School | 71 | 14.9% |
| College / Undergraduate | 87 | 18.3% |
| Graduate / Professional | 103 | 21.6% |
| Total | 476 | 100.0% |
School Enrollment by Age by Funding Source in Indian River Shores
Out of a total of 476 students who are enrolled in schools in Indian River Shores, 323 (67.9%) attend a private institution, while the remaining 153 (32.1%) are enrolled in public schools. The age group of 10 to 14 year olds has the highest likelihood of being enrolled in private schools, with 194 (89.4% in the age bracket) enrolled. Conversely, the age group of 15 to 17 year olds has the lowest likelihood of being enrolled in a private school, with 30 (100.0% in the age bracket) attending a public institution.
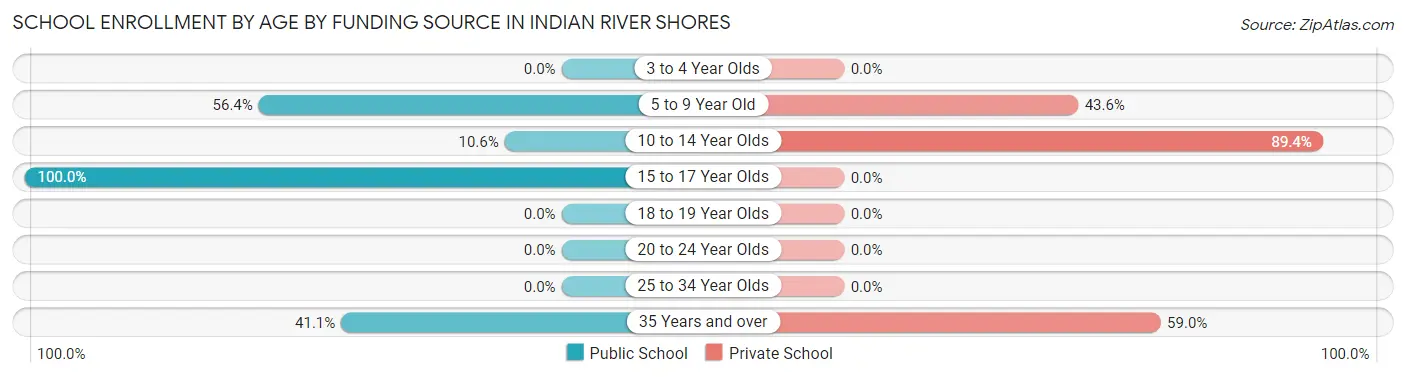
| Age Bracket | Public School | Private School |
| 3 to 4 Year Olds | 0 (0.0%) | 0 (0.0%) |
| 5 to 9 Year Old | 22 (56.4%) | 17 (43.6%) |
| 10 to 14 Year Olds | 23 (10.6%) | 194 (89.4%) |
| 15 to 17 Year Olds | 30 (100.0%) | 0 (0.0%) |
| 18 to 19 Year Olds | 0 (0.0%) | 0 (0.0%) |
| 20 to 24 Year Olds | 0 (0.0%) | 0 (0.0%) |
| 25 to 34 Year Olds | 0 (0.0%) | 0 (0.0%) |
| 35 Years and over | 78 (41.0%) | 112 (59.0%) |
| Total | 153 (32.1%) | 323 (67.9%) |
Educational Attainment by Field of Study in Indian River Shores
Business (878 | 26.6%), liberal arts & history (447 | 13.5%), social sciences (424 | 12.8%), education (331 | 10.0%), and engineering (308 | 9.3%) are the most common fields of study among 3,306 individuals in Indian River Shores who have obtained a bachelor's degree or higher.
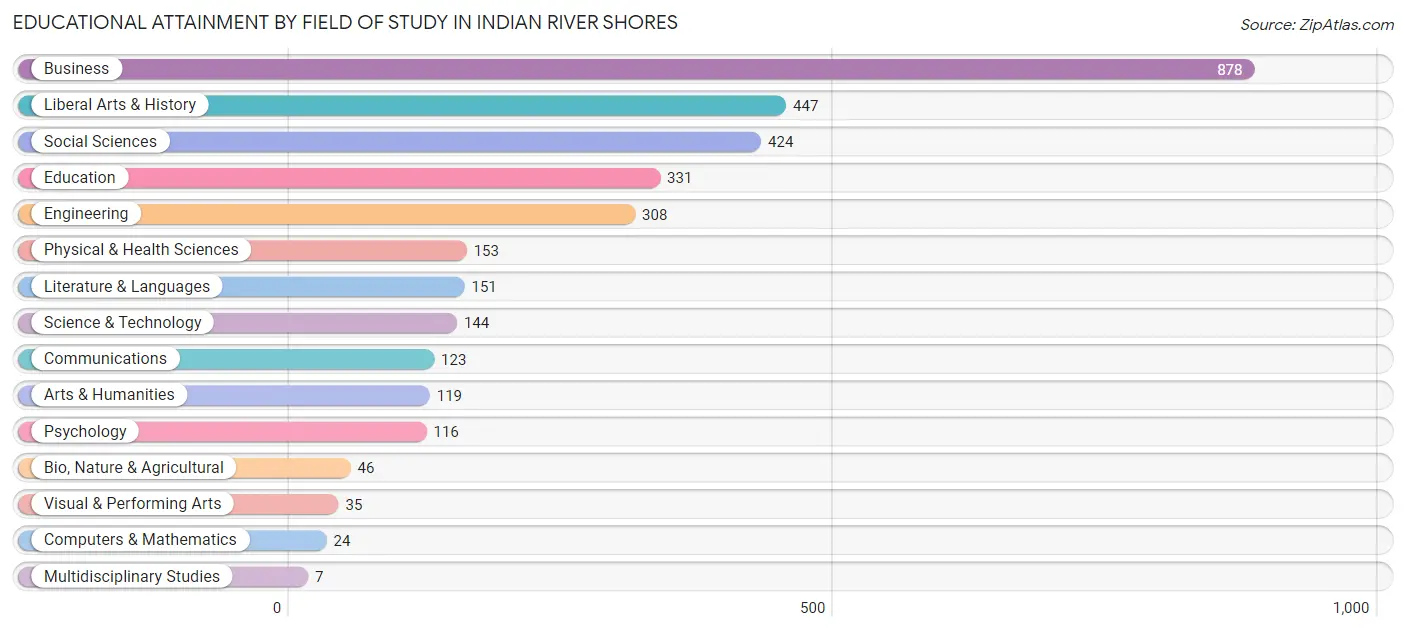
| Field of Study | # Graduates | % Graduates |
| Computers & Mathematics | 24 | 0.7% |
| Bio, Nature & Agricultural | 46 | 1.4% |
| Physical & Health Sciences | 153 | 4.6% |
| Psychology | 116 | 3.5% |
| Social Sciences | 424 | 12.8% |
| Engineering | 308 | 9.3% |
| Multidisciplinary Studies | 7 | 0.2% |
| Science & Technology | 144 | 4.4% |
| Business | 878 | 26.6% |
| Education | 331 | 10.0% |
| Literature & Languages | 151 | 4.6% |
| Liberal Arts & History | 447 | 13.5% |
| Visual & Performing Arts | 35 | 1.1% |
| Communications | 123 | 3.7% |
| Arts & Humanities | 119 | 3.6% |
| Total | 3,306 | 100.0% |
Transportation & Commute in Indian River Shores
Vehicle Availability by Sex in Indian River Shores
The most prevalent vehicle ownership categories in Indian River Shores are males with 2 vehicles (243, accounting for 46.3%) and females with 2 vehicles (186, making up 81.8%).
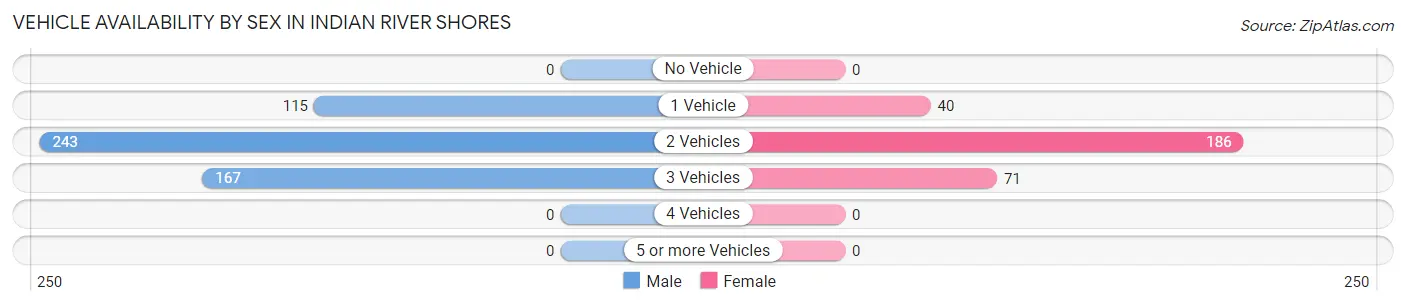
| Vehicles Available | Male | Female |
| No Vehicle | 0 (0.0%) | 0 (0.0%) |
| 1 Vehicle | 115 (21.9%) | 40 (13.5%) |
| 2 Vehicles | 243 (46.3%) | 186 (62.6%) |
| 3 Vehicles | 167 (31.8%) | 71 (23.9%) |
| 4 Vehicles | 0 (0.0%) | 0 (0.0%) |
| 5 or more Vehicles | 0 (0.0%) | 0 (0.0%) |
| Total | 525 (100.0%) | 297 (100.0%) |
Commute Time in Indian River Shores
The most frequently occuring commute durations in Indian River Shores are 10 to 14 minutes (146 commuters, 26.8%), 5 to 9 minutes (118 commuters, 21.7%), and 15 to 19 minutes (118 commuters, 21.7%).
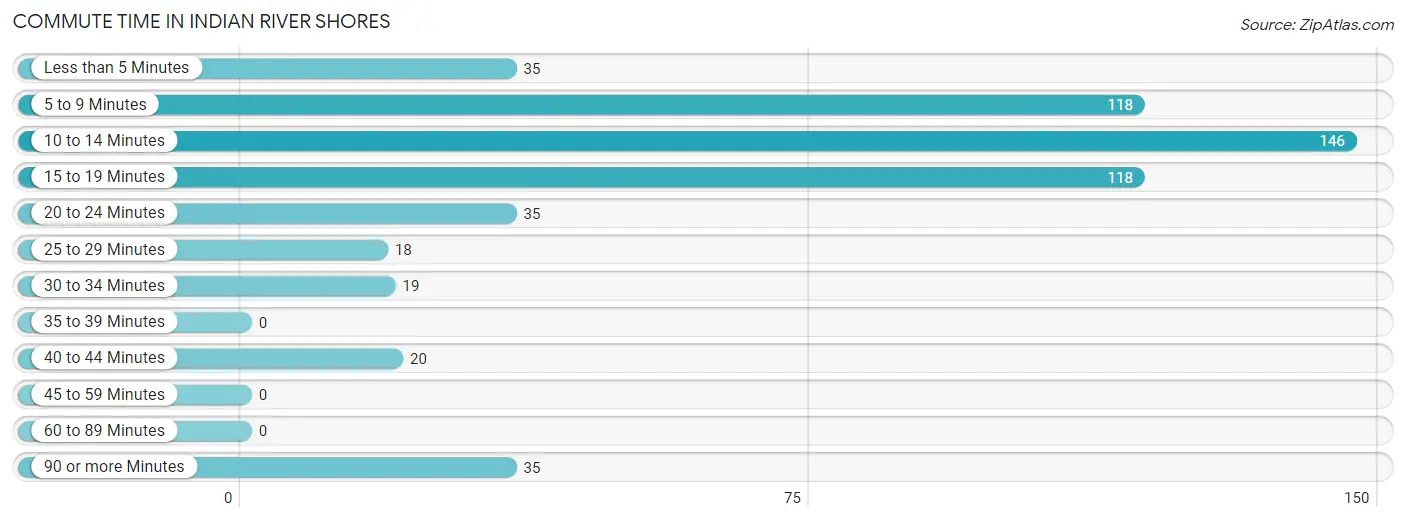
| Commute Time | # Commuters | % Commuters |
| Less than 5 Minutes | 35 | 6.4% |
| 5 to 9 Minutes | 118 | 21.7% |
| 10 to 14 Minutes | 146 | 26.8% |
| 15 to 19 Minutes | 118 | 21.7% |
| 20 to 24 Minutes | 35 | 6.4% |
| 25 to 29 Minutes | 18 | 3.3% |
| 30 to 34 Minutes | 19 | 3.5% |
| 35 to 39 Minutes | 0 | 0.0% |
| 40 to 44 Minutes | 20 | 3.7% |
| 45 to 59 Minutes | 0 | 0.0% |
| 60 to 89 Minutes | 0 | 0.0% |
| 90 or more Minutes | 35 | 6.4% |
Commute Time by Sex in Indian River Shores
The most common commute times in Indian River Shores are 10 to 14 minutes (94 commuters, 26.2%) for males and 10 to 14 minutes (52 commuters, 28.1%) for females.
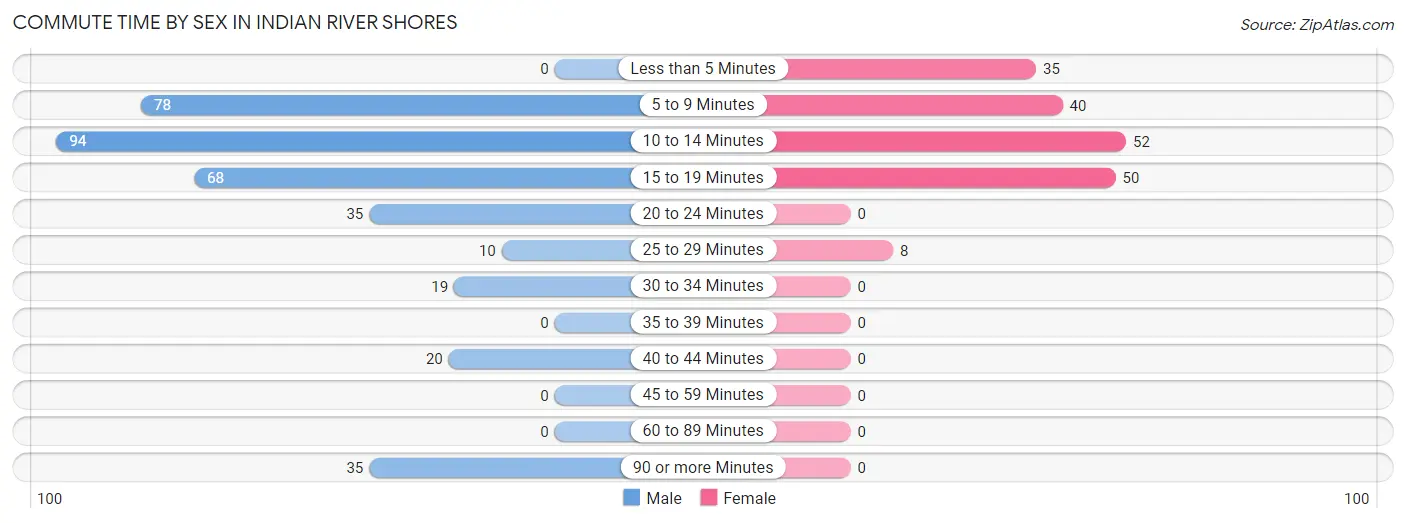
| Commute Time | Male | Female |
| Less than 5 Minutes | 0 (0.0%) | 35 (18.9%) |
| 5 to 9 Minutes | 78 (21.7%) | 40 (21.6%) |
| 10 to 14 Minutes | 94 (26.2%) | 52 (28.1%) |
| 15 to 19 Minutes | 68 (18.9%) | 50 (27.0%) |
| 20 to 24 Minutes | 35 (9.8%) | 0 (0.0%) |
| 25 to 29 Minutes | 10 (2.8%) | 8 (4.3%) |
| 30 to 34 Minutes | 19 (5.3%) | 0 (0.0%) |
| 35 to 39 Minutes | 0 (0.0%) | 0 (0.0%) |
| 40 to 44 Minutes | 20 (5.6%) | 0 (0.0%) |
| 45 to 59 Minutes | 0 (0.0%) | 0 (0.0%) |
| 60 to 89 Minutes | 0 (0.0%) | 0 (0.0%) |
| 90 or more Minutes | 35 (9.8%) | 0 (0.0%) |
Time of Departure to Work by Sex in Indian River Shores
The most frequent times of departure to work in Indian River Shores are 6:30 AM to 6:59 AM (125, 34.8%) for males and 10:00 AM to 10:59 AM (54, 29.2%) for females.
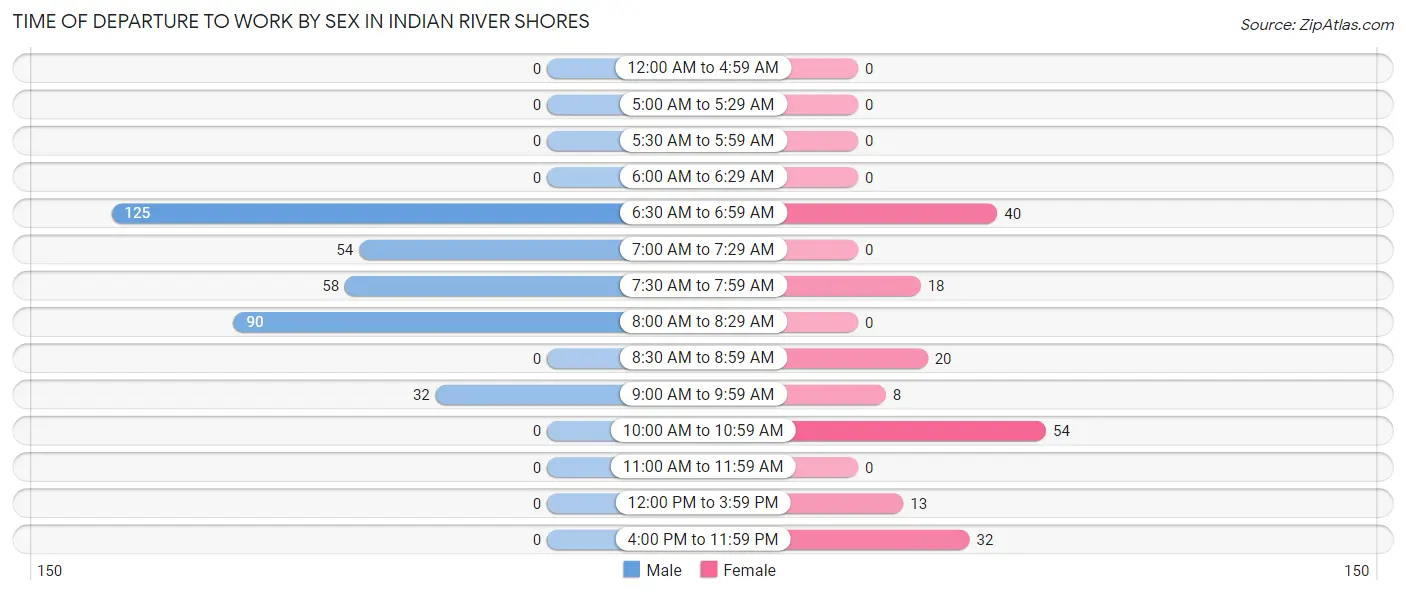
| Time of Departure | Male | Female |
| 12:00 AM to 4:59 AM | 0 (0.0%) | 0 (0.0%) |
| 5:00 AM to 5:29 AM | 0 (0.0%) | 0 (0.0%) |
| 5:30 AM to 5:59 AM | 0 (0.0%) | 0 (0.0%) |
| 6:00 AM to 6:29 AM | 0 (0.0%) | 0 (0.0%) |
| 6:30 AM to 6:59 AM | 125 (34.8%) | 40 (21.6%) |
| 7:00 AM to 7:29 AM | 54 (15.0%) | 0 (0.0%) |
| 7:30 AM to 7:59 AM | 58 (16.2%) | 18 (9.7%) |
| 8:00 AM to 8:29 AM | 90 (25.1%) | 0 (0.0%) |
| 8:30 AM to 8:59 AM | 0 (0.0%) | 20 (10.8%) |
| 9:00 AM to 9:59 AM | 32 (8.9%) | 8 (4.3%) |
| 10:00 AM to 10:59 AM | 0 (0.0%) | 54 (29.2%) |
| 11:00 AM to 11:59 AM | 0 (0.0%) | 0 (0.0%) |
| 12:00 PM to 3:59 PM | 0 (0.0%) | 13 (7.0%) |
| 4:00 PM to 11:59 PM | 0 (0.0%) | 32 (17.3%) |
| Total | 359 (100.0%) | 185 (100.0%) |
Housing Occupancy in Indian River Shores
Occupancy by Ownership in Indian River Shores
Of the total 2,271 dwellings in Indian River Shores, owner-occupied units account for 2,228 (98.1%), while renter-occupied units make up 43 (1.9%).
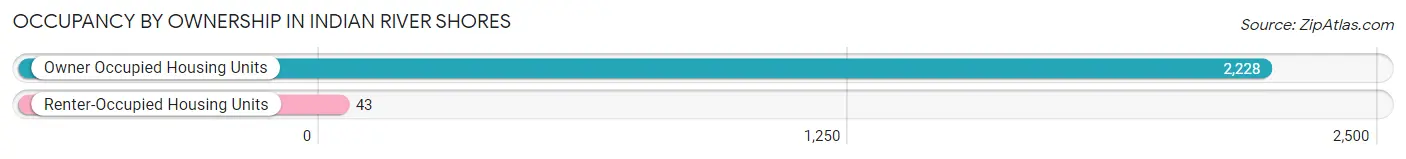
| Occupancy | # Housing Units | % Housing Units |
| Owner Occupied Housing Units | 2,228 | 98.1% |
| Renter-Occupied Housing Units | 43 | 1.9% |
| Total Occupied Housing Units | 2,271 | 100.0% |
Occupancy by Household Size in Indian River Shores
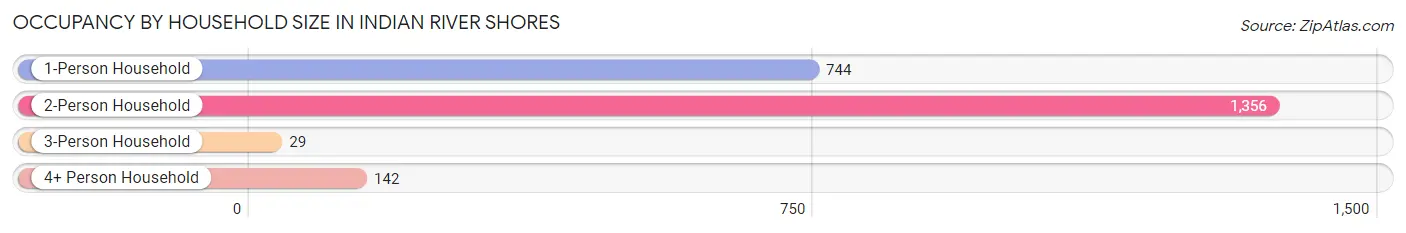
| Household Size | # Housing Units | % Housing Units |
| 1-Person Household | 744 | 32.8% |
| 2-Person Household | 1,356 | 59.7% |
| 3-Person Household | 29 | 1.3% |
| 4+ Person Household | 142 | 6.2% |
| Total Housing Units | 2,271 | 100.0% |
Occupancy by Ownership by Household Size in Indian River Shores
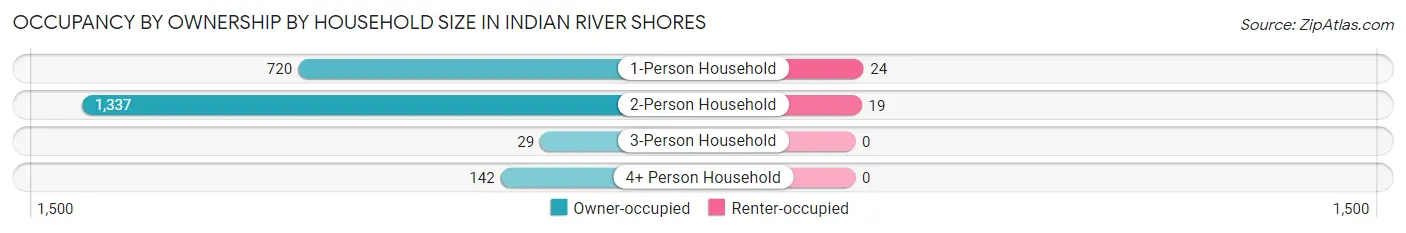
| Household Size | Owner-occupied | Renter-occupied |
| 1-Person Household | 720 (96.8%) | 24 (3.2%) |
| 2-Person Household | 1,337 (98.6%) | 19 (1.4%) |
| 3-Person Household | 29 (100.0%) | 0 (0.0%) |
| 4+ Person Household | 142 (100.0%) | 0 (0.0%) |
| Total Housing Units | 2,228 (98.1%) | 43 (1.9%) |
Occupancy by Educational Attainment in Indian River Shores
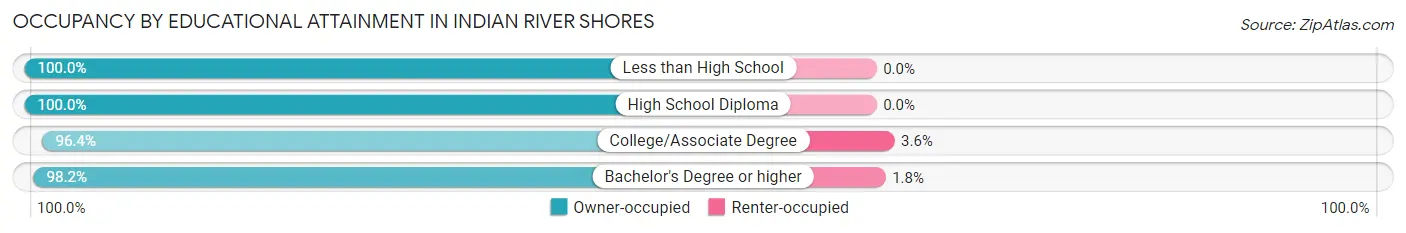
| Household Size | Owner-occupied | Renter-occupied |
| Less than High School | 11 (100.0%) | 0 (0.0%) |
| High School Diploma | 143 (100.0%) | 0 (0.0%) |
| College/Associate Degree | 271 (96.4%) | 10 (3.6%) |
| Bachelor's Degree or higher | 1,803 (98.2%) | 33 (1.8%) |
Occupancy by Age of Householder in Indian River Shores
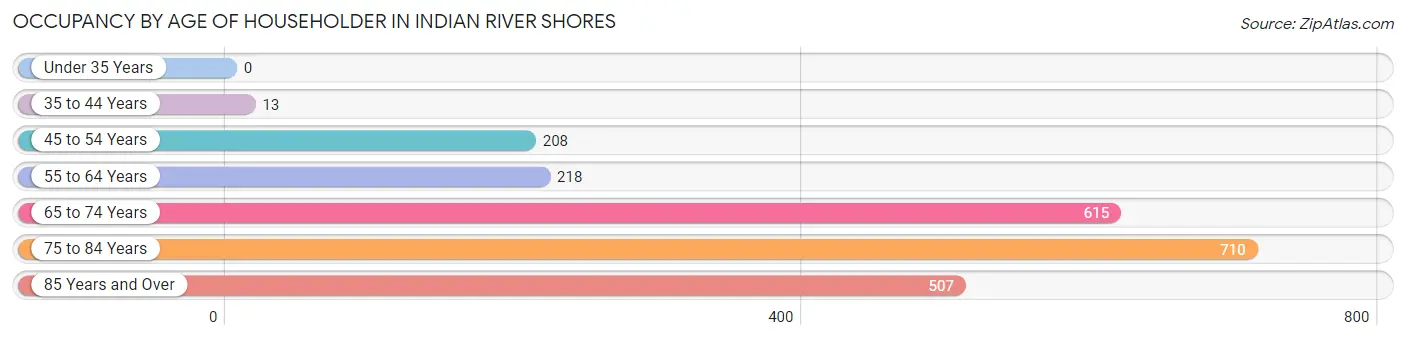
| Age Bracket | # Households | % Households |
| Under 35 Years | 0 | 0.0% |
| 35 to 44 Years | 13 | 0.6% |
| 45 to 54 Years | 208 | 9.2% |
| 55 to 64 Years | 218 | 9.6% |
| 65 to 74 Years | 615 | 27.1% |
| 75 to 84 Years | 710 | 31.3% |
| 85 Years and Over | 507 | 22.3% |
| Total | 2,271 | 100.0% |
Housing Finances in Indian River Shores
Median Income by Occupancy in Indian River Shores
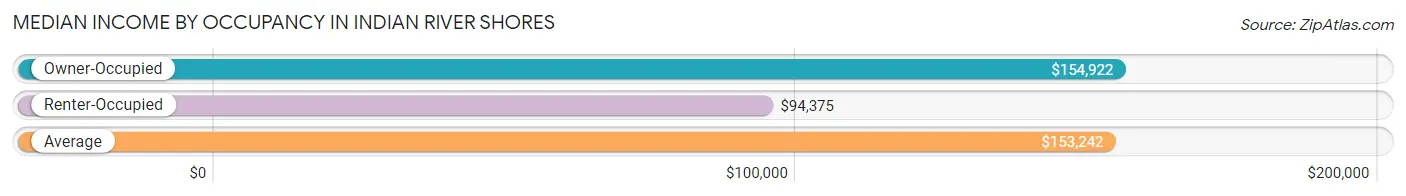
| Occupancy Type | # Households | Median Income |
| Owner-Occupied | 2,228 (98.1%) | $154,922 |
| Renter-Occupied | 43 (1.9%) | $94,375 |
| Average | 2,271 (100.0%) | $153,242 |
Occupancy by Householder Income Bracket in Indian River Shores
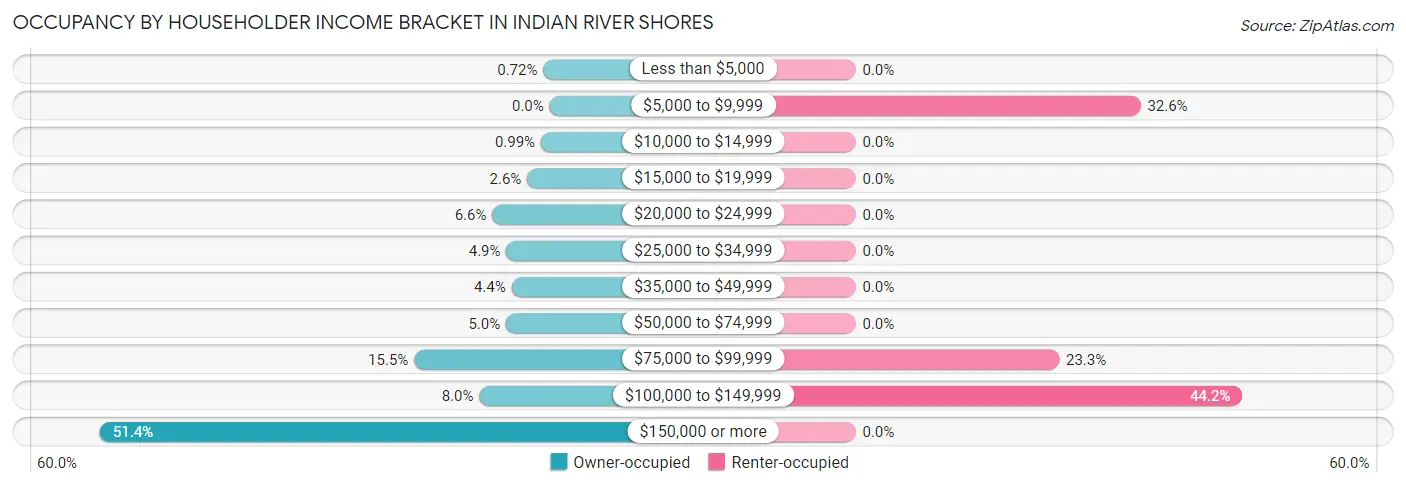
| Income Bracket | Owner-occupied | Renter-occupied |
| Less than $5,000 | 16 (0.7%) | 0 (0.0%) |
| $5,000 to $9,999 | 0 (0.0%) | 14 (32.6%) |
| $10,000 to $14,999 | 22 (1.0%) | 0 (0.0%) |
| $15,000 to $19,999 | 57 (2.6%) | 0 (0.0%) |
| $20,000 to $24,999 | 146 (6.6%) | 0 (0.0%) |
| $25,000 to $34,999 | 110 (4.9%) | 0 (0.0%) |
| $35,000 to $49,999 | 97 (4.3%) | 0 (0.0%) |
| $50,000 to $74,999 | 111 (5.0%) | 0 (0.0%) |
| $75,000 to $99,999 | 345 (15.5%) | 10 (23.3%) |
| $100,000 to $149,999 | 179 (8.0%) | 19 (44.2%) |
| $150,000 or more | 1,145 (51.4%) | 0 (0.0%) |
| Total | 2,228 (100.0%) | 43 (100.0%) |
Monthly Housing Cost Tiers in Indian River Shores
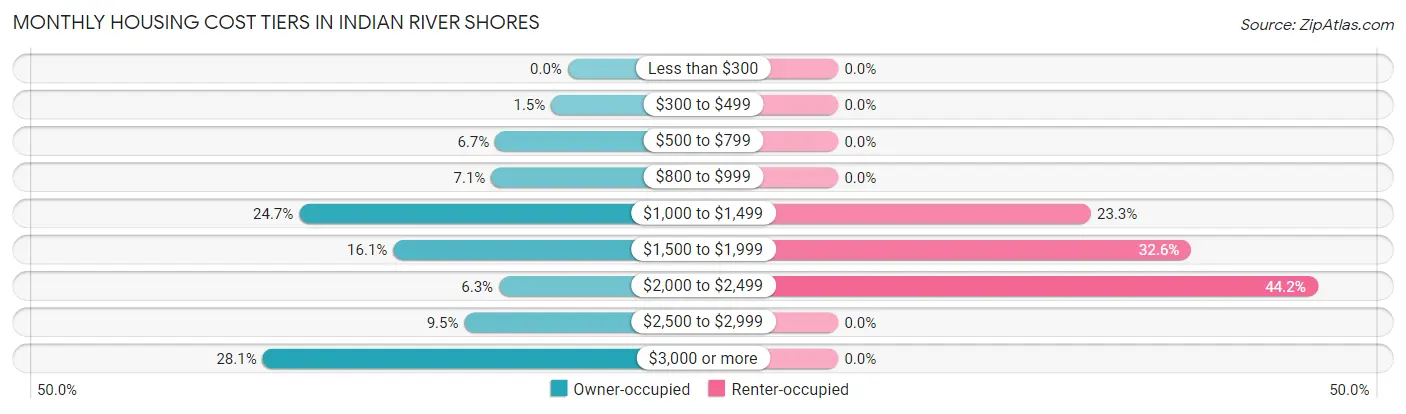
| Monthly Cost | Owner-occupied | Renter-occupied |
| Less than $300 | 0 (0.0%) | 0 (0.0%) |
| $300 to $499 | 34 (1.5%) | 0 (0.0%) |
| $500 to $799 | 149 (6.7%) | 0 (0.0%) |
| $800 to $999 | 157 (7.0%) | 0 (0.0%) |
| $1,000 to $1,499 | 551 (24.7%) | 10 (23.3%) |
| $1,500 to $1,999 | 358 (16.1%) | 14 (32.6%) |
| $2,000 to $2,499 | 141 (6.3%) | 19 (44.2%) |
| $2,500 to $2,999 | 212 (9.5%) | 0 (0.0%) |
| $3,000 or more | 626 (28.1%) | 0 (0.0%) |
| Total | 2,228 (100.0%) | 43 (100.0%) |
Physical Housing Characteristics in Indian River Shores
Housing Structures in Indian River Shores
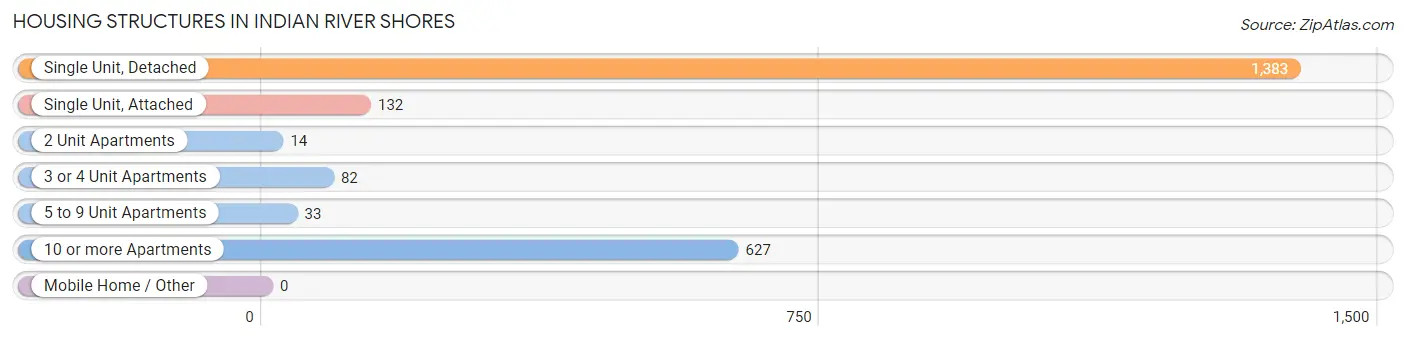
| Structure Type | # Housing Units | % Housing Units |
| Single Unit, Detached | 1,383 | 60.9% |
| Single Unit, Attached | 132 | 5.8% |
| 2 Unit Apartments | 14 | 0.6% |
| 3 or 4 Unit Apartments | 82 | 3.6% |
| 5 to 9 Unit Apartments | 33 | 1.5% |
| 10 or more Apartments | 627 | 27.6% |
| Mobile Home / Other | 0 | 0.0% |
| Total | 2,271 | 100.0% |
Housing Structures by Occupancy in Indian River Shores
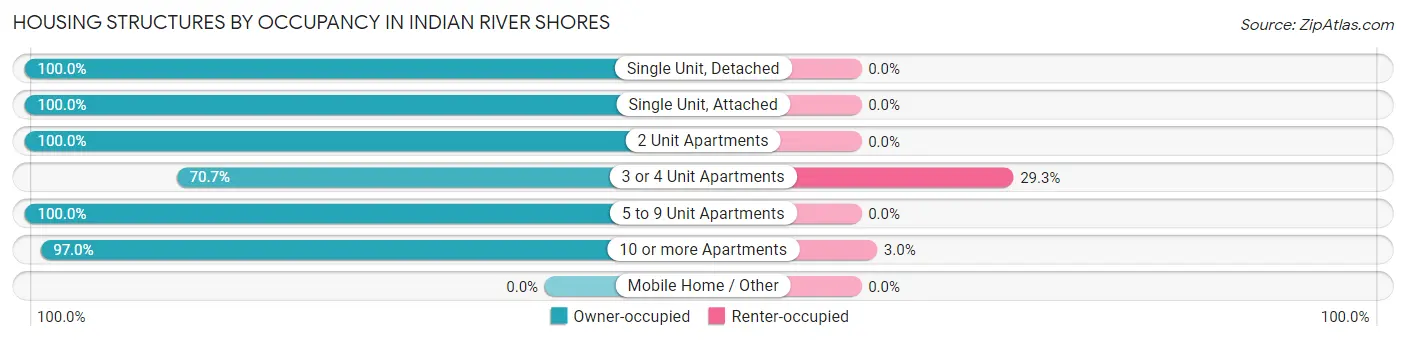
| Structure Type | Owner-occupied | Renter-occupied |
| Single Unit, Detached | 1,383 (100.0%) | 0 (0.0%) |
| Single Unit, Attached | 132 (100.0%) | 0 (0.0%) |
| 2 Unit Apartments | 14 (100.0%) | 0 (0.0%) |
| 3 or 4 Unit Apartments | 58 (70.7%) | 24 (29.3%) |
| 5 to 9 Unit Apartments | 33 (100.0%) | 0 (0.0%) |
| 10 or more Apartments | 608 (97.0%) | 19 (3.0%) |
| Mobile Home / Other | 0 (0.0%) | 0 (0.0%) |
| Total | 2,228 (98.1%) | 43 (1.9%) |
Housing Structures by Number of Rooms in Indian River Shores
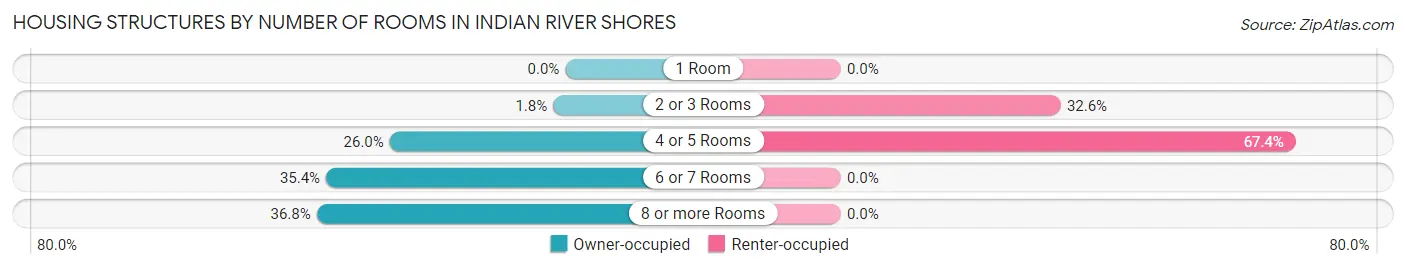
| Number of Rooms | Owner-occupied | Renter-occupied |
| 1 Room | 0 (0.0%) | 0 (0.0%) |
| 2 or 3 Rooms | 40 (1.8%) | 14 (32.6%) |
| 4 or 5 Rooms | 579 (26.0%) | 29 (67.4%) |
| 6 or 7 Rooms | 789 (35.4%) | 0 (0.0%) |
| 8 or more Rooms | 820 (36.8%) | 0 (0.0%) |
| Total | 2,228 (100.0%) | 43 (100.0%) |
Housing Structure by Heating Type in Indian River Shores
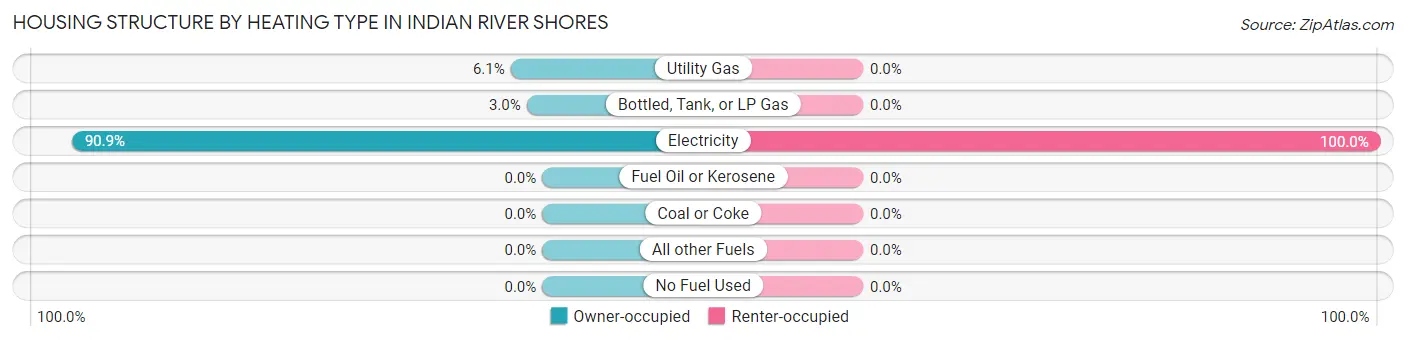
| Heating Type | Owner-occupied | Renter-occupied |
| Utility Gas | 136 (6.1%) | 0 (0.0%) |
| Bottled, Tank, or LP Gas | 67 (3.0%) | 0 (0.0%) |
| Electricity | 2,025 (90.9%) | 43 (100.0%) |
| Fuel Oil or Kerosene | 0 (0.0%) | 0 (0.0%) |
| Coal or Coke | 0 (0.0%) | 0 (0.0%) |
| All other Fuels | 0 (0.0%) | 0 (0.0%) |
| No Fuel Used | 0 (0.0%) | 0 (0.0%) |
| Total | 2,228 (100.0%) | 43 (100.0%) |
Household Vehicle Usage in Indian River Shores
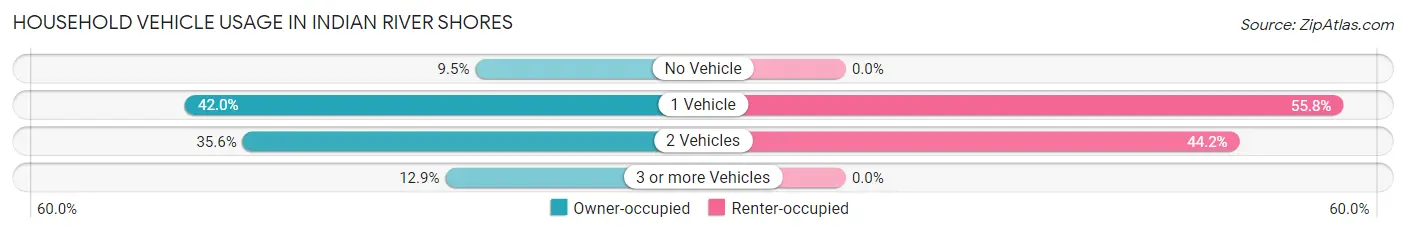
| Vehicles per Household | Owner-occupied | Renter-occupied |
| No Vehicle | 212 (9.5%) | 0 (0.0%) |
| 1 Vehicle | 936 (42.0%) | 24 (55.8%) |
| 2 Vehicles | 793 (35.6%) | 19 (44.2%) |
| 3 or more Vehicles | 287 (12.9%) | 0 (0.0%) |
| Total | 2,228 (100.0%) | 43 (100.0%) |
Real Estate & Mortgages in Indian River Shores
Real Estate and Mortgage Overview in Indian River Shores
| Characteristic | Without Mortgage | With Mortgage |
| Housing Units | 1,765 | 463 |
| Median Property Value | $987,900 | $1,006,800 |
| Median Household Income | $139,107 | $310 |
| Monthly Housing Costs | $1,501 | $310 |
| Real Estate Taxes | $8,464 | $0 |
Property Value by Mortgage Status in Indian River Shores
| Property Value | Without Mortgage | With Mortgage |
| Less than $50,000 | 28 (1.6%) | 0 (0.0%) |
| $50,000 to $99,999 | 0 (0.0%) | 0 (0.0%) |
| $100,000 to $299,999 | 188 (10.6%) | 20 (4.3%) |
| $300,000 to $499,999 | 231 (13.1%) | 98 (21.2%) |
| $500,000 to $749,999 | 150 (8.5%) | 68 (14.7%) |
| $750,000 to $999,999 | 300 (17.0%) | 43 (9.3%) |
| $1,000,000 or more | 868 (49.2%) | 234 (50.5%) |
| Total | 1,765 (100.0%) | 463 (100.0%) |
Household Income by Mortgage Status in Indian River Shores
| Household Income | Without Mortgage | With Mortgage |
| Less than $10,000 | 16 (0.9%) | 12 (2.6%) |
| $10,000 to $24,999 | 225 (12.8%) | 0 (0.0%) |
| $25,000 to $34,999 | 77 (4.4%) | 0 (0.0%) |
| $35,000 to $49,999 | 97 (5.5%) | 33 (7.1%) |
| $50,000 to $74,999 | 90 (5.1%) | 0 (0.0%) |
| $75,000 to $99,999 | 316 (17.9%) | 21 (4.5%) |
| $100,000 to $149,999 | 109 (6.2%) | 29 (6.3%) |
| $150,000 or more | 835 (47.3%) | 70 (15.1%) |
| Total | 1,765 (100.0%) | 463 (100.0%) |
Property Value to Household Income Ratio in Indian River Shores
| Value-to-Income Ratio | Without Mortgage | With Mortgage |
| Less than 2.0x | 267 (15.1%) | 209,663 (45,283.6%) |
| 2.0x to 2.9x | 135 (7.6%) | 71 (15.3%) |
| 3.0x to 3.9x | 90 (5.1%) | 111 (24.0%) |
| 4.0x or more | 1,273 (72.1%) | 42 (9.1%) |
| Total | 1,765 (100.0%) | 463 (100.0%) |
Real Estate Taxes by Mortgage Status in Indian River Shores
| Property Taxes | Without Mortgage | With Mortgage |
| Less than $800 | 40 (2.3%) | 0 (0.0%) |
| $800 to $1,499 | 116 (6.6%) | 11 (2.4%) |
| $800 to $1,499 | 1,609 (91.2%) | 0 (0.0%) |
| Total | 1,765 (100.0%) | 463 (100.0%) |
Health & Disability in Indian River Shores
Health Insurance Coverage by Age in Indian River Shores
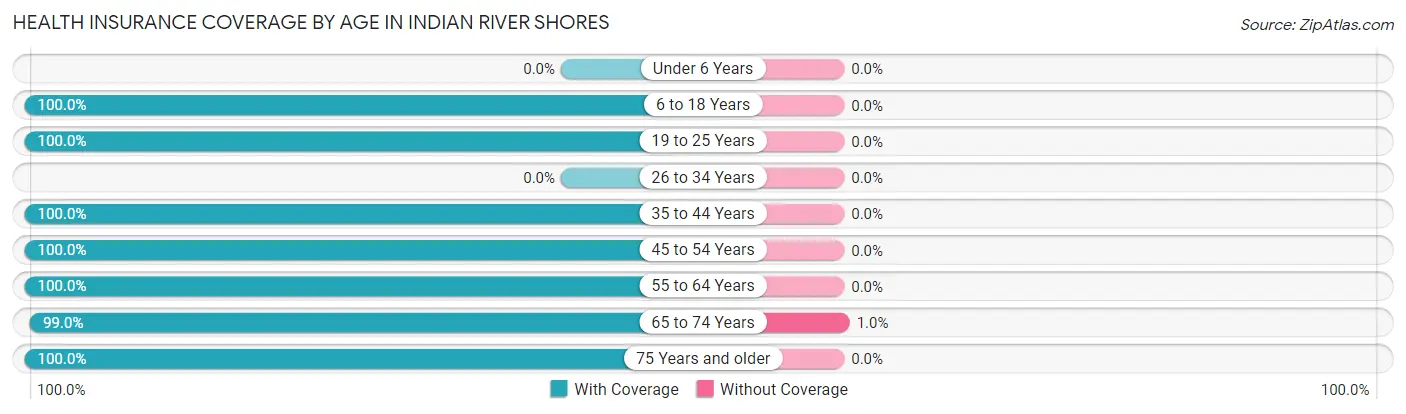
| Age Bracket | With Coverage | Without Coverage |
| Under 6 Years | 0 (0.0%) | 0 (0.0%) |
| 6 to 18 Years | 286 (100.0%) | 0 (0.0%) |
| 19 to 25 Years | 16 (100.0%) | 0 (0.0%) |
| 26 to 34 Years | 0 (0.0%) | 0 (0.0%) |
| 35 to 44 Years | 113 (100.0%) | 0 (0.0%) |
| 45 to 54 Years | 308 (100.0%) | 0 (0.0%) |
| 55 to 64 Years | 462 (100.0%) | 0 (0.0%) |
| 65 to 74 Years | 1,080 (99.0%) | 11 (1.0%) |
| 75 Years and older | 1,990 (100.0%) | 0 (0.0%) |
| Total | 4,255 (99.7%) | 11 (0.3%) |
Health Insurance Coverage by Citizenship Status in Indian River Shores
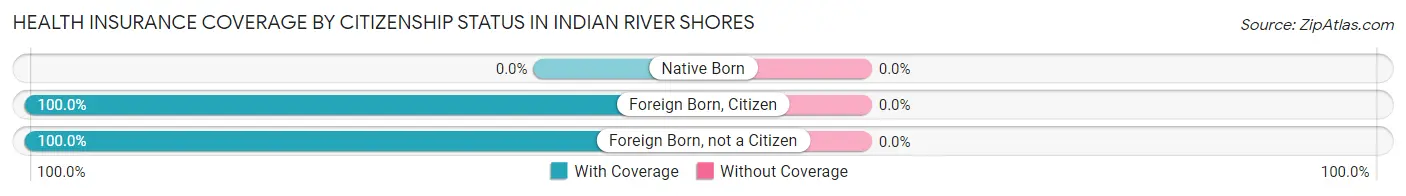
| Citizenship Status | With Coverage | Without Coverage |
| Native Born | 0 (0.0%) | 0 (0.0%) |
| Foreign Born, Citizen | 286 (100.0%) | 0 (0.0%) |
| Foreign Born, not a Citizen | 16 (100.0%) | 0 (0.0%) |
Health Insurance Coverage by Household Income in Indian River Shores
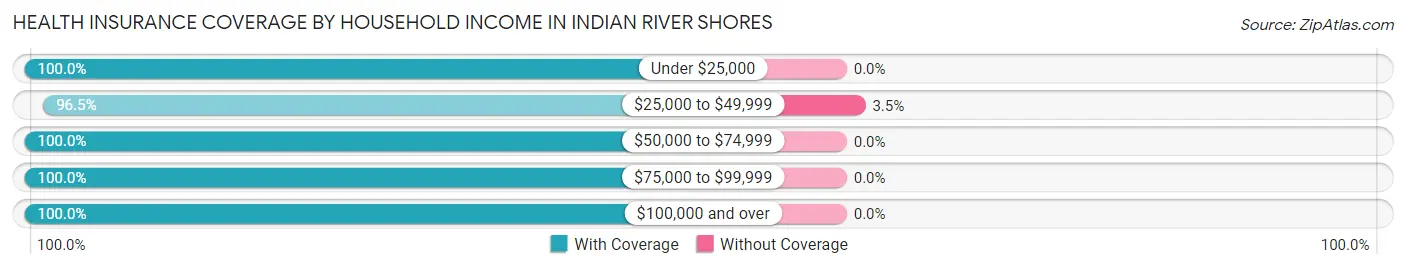
| Household Income | With Coverage | Without Coverage |
| Under $25,000 | 261 (100.0%) | 0 (0.0%) |
| $25,000 to $49,999 | 303 (96.5%) | 11 (3.5%) |
| $50,000 to $74,999 | 217 (100.0%) | 0 (0.0%) |
| $75,000 to $99,999 | 562 (100.0%) | 0 (0.0%) |
| $100,000 and over | 2,912 (100.0%) | 0 (0.0%) |
Public vs Private Health Insurance Coverage by Age in Indian River Shores
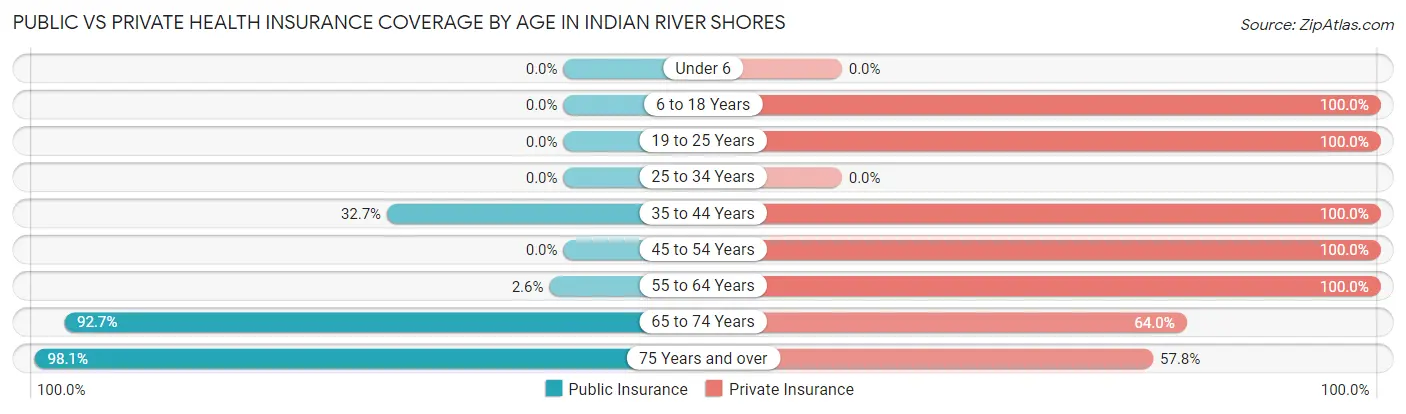
| Age Bracket | Public Insurance | Private Insurance |
| Under 6 | 0 (0.0%) | 0 (0.0%) |
| 6 to 18 Years | 0 (0.0%) | 286 (100.0%) |
| 19 to 25 Years | 0 (0.0%) | 16 (100.0%) |
| 25 to 34 Years | 0 (0.0%) | 0 (0.0%) |
| 35 to 44 Years | 37 (32.7%) | 113 (100.0%) |
| 45 to 54 Years | 0 (0.0%) | 308 (100.0%) |
| 55 to 64 Years | 12 (2.6%) | 462 (100.0%) |
| 65 to 74 Years | 1,011 (92.7%) | 698 (64.0%) |
| 75 Years and over | 1,953 (98.1%) | 1,150 (57.8%) |
| Total | 3,013 (70.6%) | 3,033 (71.1%) |
Disability Status by Sex by Age in Indian River Shores
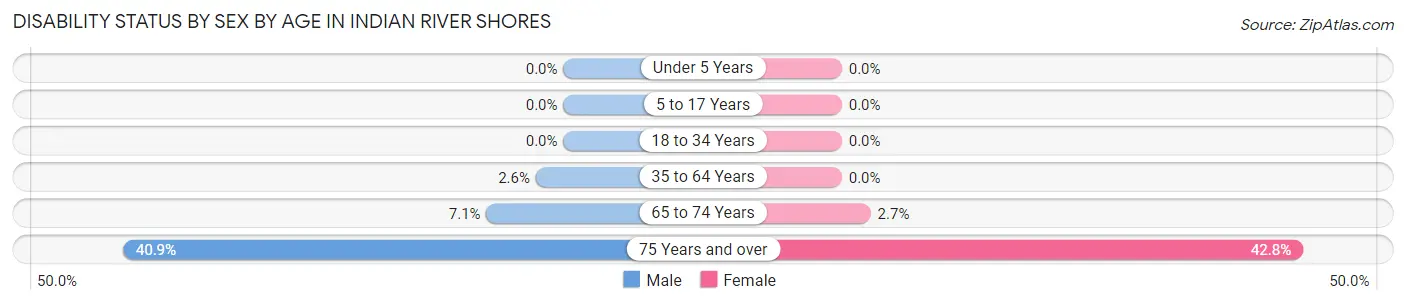
| Age Bracket | Male | Female |
| Under 5 Years | 0 (0.0%) | 0 (0.0%) |
| 5 to 17 Years | 0 (0.0%) | 0 (0.0%) |
| 18 to 34 Years | 0 (0.0%) | 0 (0.0%) |
| 35 to 64 Years | 10 (2.6%) | 0 (0.0%) |
| 65 to 74 Years | 38 (7.1%) | 15 (2.7%) |
| 75 Years and over | 379 (40.9%) | 455 (42.8%) |
Disability Class by Sex by Age in Indian River Shores
Disability Class: Hearing Difficulty

| Age Bracket | Male | Female |
| Under 5 Years | 0 (0.0%) | 0 (0.0%) |
| 5 to 17 Years | 0 (0.0%) | 0 (0.0%) |
| 18 to 34 Years | 0 (0.0%) | 0 (0.0%) |
| 35 to 64 Years | 10 (2.6%) | 0 (0.0%) |
| 65 to 74 Years | 38 (7.1%) | 0 (0.0%) |
| 75 Years and over | 212 (22.9%) | 146 (13.7%) |
Disability Class: Vision Difficulty
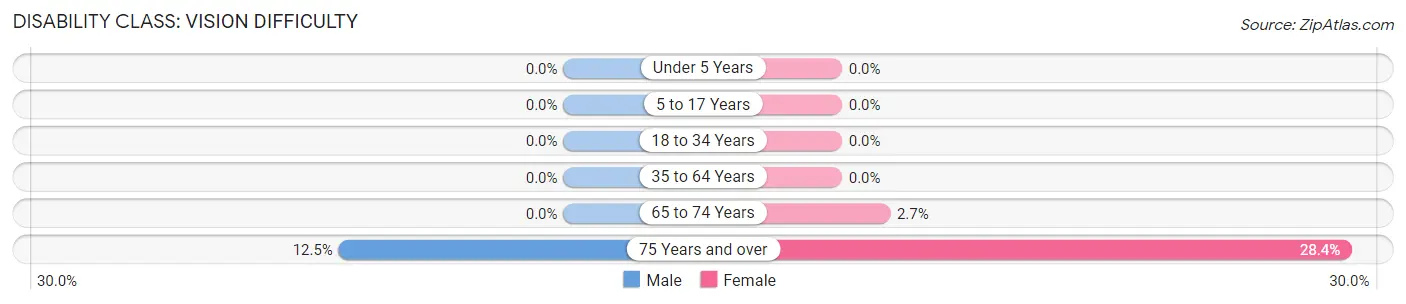
| Age Bracket | Male | Female |
| Under 5 Years | 0 (0.0%) | 0 (0.0%) |
| 5 to 17 Years | 0 (0.0%) | 0 (0.0%) |
| 18 to 34 Years | 0 (0.0%) | 0 (0.0%) |
| 35 to 64 Years | 0 (0.0%) | 0 (0.0%) |
| 65 to 74 Years | 0 (0.0%) | 15 (2.7%) |
| 75 Years and over | 116 (12.5%) | 302 (28.4%) |
Disability Class: Cognitive Difficulty
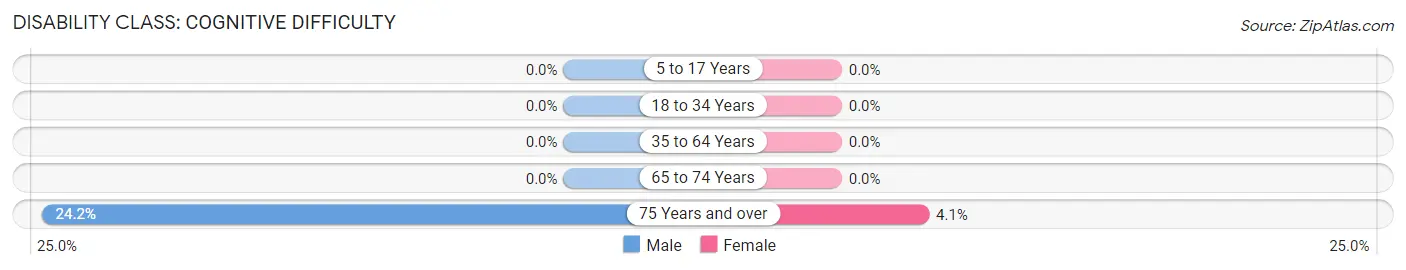
| Age Bracket | Male | Female |
| 5 to 17 Years | 0 (0.0%) | 0 (0.0%) |
| 18 to 34 Years | 0 (0.0%) | 0 (0.0%) |
| 35 to 64 Years | 0 (0.0%) | 0 (0.0%) |
| 65 to 74 Years | 0 (0.0%) | 0 (0.0%) |
| 75 Years and over | 224 (24.2%) | 43 (4.1%) |
Disability Class: Ambulatory Difficulty
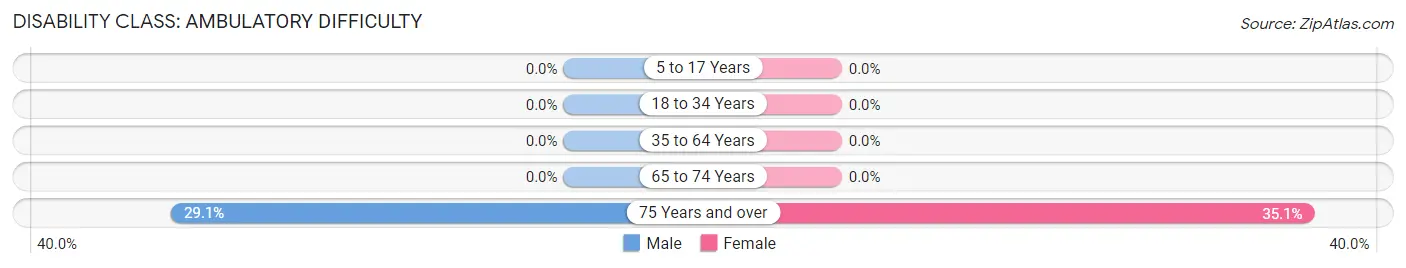
| Age Bracket | Male | Female |
| 5 to 17 Years | 0 (0.0%) | 0 (0.0%) |
| 18 to 34 Years | 0 (0.0%) | 0 (0.0%) |
| 35 to 64 Years | 0 (0.0%) | 0 (0.0%) |
| 65 to 74 Years | 0 (0.0%) | 0 (0.0%) |
| 75 Years and over | 270 (29.1%) | 373 (35.1%) |
Disability Class: Self-Care Difficulty
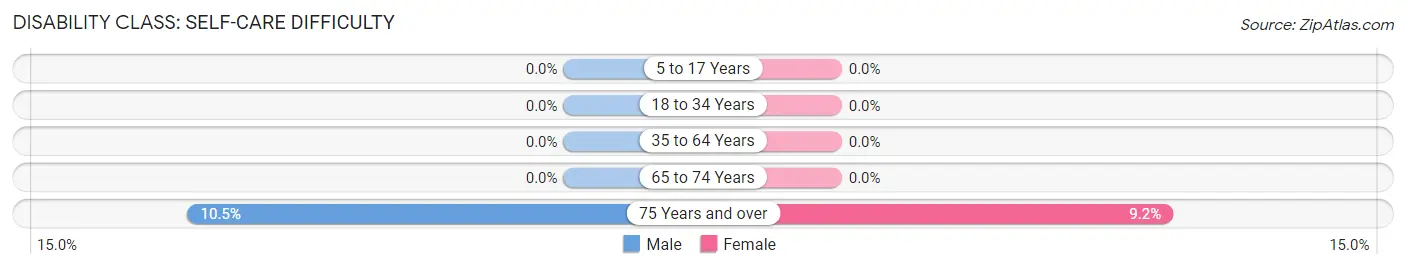
| Age Bracket | Male | Female |
| 5 to 17 Years | 0 (0.0%) | 0 (0.0%) |
| 18 to 34 Years | 0 (0.0%) | 0 (0.0%) |
| 35 to 64 Years | 0 (0.0%) | 0 (0.0%) |
| 65 to 74 Years | 0 (0.0%) | 0 (0.0%) |
| 75 Years and over | 97 (10.5%) | 98 (9.2%) |
Technology Access in Indian River Shores
Computing Device Access in Indian River Shores
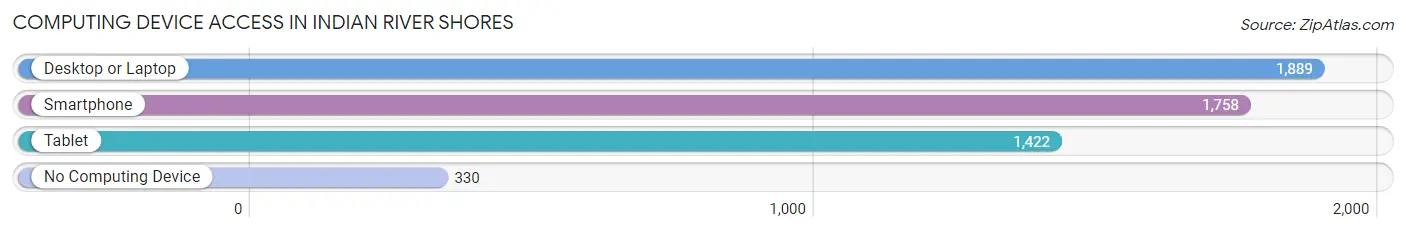
| Device Type | # Households | % Households |
| Desktop or Laptop | 1,889 | 83.2% |
| Smartphone | 1,758 | 77.4% |
| Tablet | 1,422 | 62.6% |
| No Computing Device | 330 | 14.5% |
| Total | 2,271 | 100.0% |
Internet Access in Indian River Shores
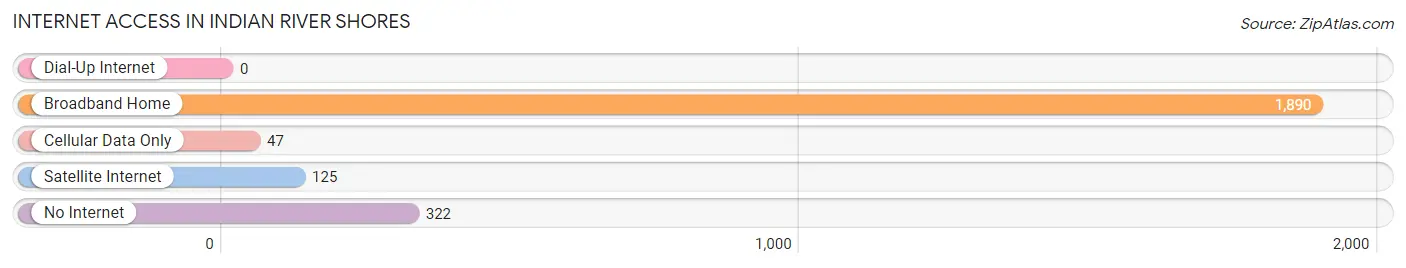
| Internet Type | # Households | % Households |
| Dial-Up Internet | 0 | 0.0% |
| Broadband Home | 1,890 | 83.2% |
| Cellular Data Only | 47 | 2.1% |
| Satellite Internet | 125 | 5.5% |
| No Internet | 322 | 14.2% |
| Total | 2,271 | 100.0% |
Indian River Shores Summary
Introduction
Located on the east coast of Florida, Indian River Shores is a small town with a population of just over 3,000 people. It is located in Indian River County, which is part of the Treasure Coast region of Florida. The town is known for its beautiful beaches, lush vegetation, and its laid-back atmosphere. Indian River Shores is a popular destination for retirees and vacationers alike, and it is home to some of the most luxurious real estate in the state.
History
The area that is now Indian River Shores was originally inhabited by the Ais Indians, who were part of the Seminole tribe. The Ais Indians lived in the area for centuries before the arrival of European settlers in the late 1700s. The first European settlers were mostly farmers and fishermen, and they established small settlements along the Indian River.
In the early 1900s, the area began to attract more visitors, and the town of Indian River Shores was officially incorporated in 1925. The town was named after the Indian River, which runs through the area.
In the 1950s, the town began to attract more tourists, and the population began to grow. The town was also home to a number of resorts and hotels, which helped to attract more visitors.
In the late 1970s, the town began to experience a population boom, and the population has continued to grow ever since.
Geography
Indian River Shores is located on the east coast of Florida, in Indian River County. The town is bordered by the Indian River to the east, and the Atlantic Ocean to the east. The town is located just south of the city of Vero Beach, and it is about a 45-minute drive from the city of Orlando.
The town is located on a barrier island, and it is surrounded by the Indian River Lagoon. The town is known for its beautiful beaches, and it is home to a number of parks and nature preserves.
Economy
The economy of Indian River Shores is largely based on tourism and real estate. The town is home to a number of resorts and hotels, which attract visitors from all over the world. The town is also home to a number of luxury real estate developments, which attract wealthy retirees and vacationers.
The town is also home to a number of small businesses, including restaurants, shops, and other services. The town is also home to a number of marinas, which attract boaters from all over the world.
Demographics
As of the 2010 census, the population of Indian River Shores was 3,121. The population is largely made up of retirees, with the median age being 68. The town is also home to a number of wealthy residents, with the median household income being $90,000.
Conclusion
Indian River Shores is a small town located on the east coast of Florida. The town is known for its beautiful beaches, lush vegetation, and its laid-back atmosphere. The town is home to a number of resorts and luxury real estate developments, which attract visitors and retirees from all over the world. The town is also home to a number of small businesses, which help to support the local economy. The population of Indian River Shores is largely made up of retirees, and the median age is 68. The town is also home to a number of wealthy residents, with the median household income being $90,000.
Common Questions
What is Per Capita Income in Indian River Shores?
Per Capita income in Indian River Shores is $151,119.
What is the Median Family Income in Indian River Shores?
Median Family Income in Indian River Shores is $214,038.
What is the Median Household income in Indian River Shores?
Median Household Income in Indian River Shores is $153,242.
What is Income or Wage Gap in Indian River Shores?
Income or Wage Gap in Indian River Shores is 75.5%.
Women in Indian River Shores earn 24.5 cents for every dollar earned by a man.
What is Inequality or Gini Index in Indian River Shores?
Inequality or Gini Index in Indian River Shores is 0.59.
What is the Total Population of Indian River Shores?
Total Population of Indian River Shores is 4,266.
What is the Total Male Population of Indian River Shores?
Total Male Population of Indian River Shores is 2,005.
What is the Total Female Population of Indian River Shores?
Total Female Population of Indian River Shores is 2,261.
What is the Ratio of Males per 100 Females in Indian River Shores?
There are 88.68 Males per 100 Females in Indian River Shores.
What is the Ratio of Females per 100 Males in Indian River Shores?
There are 112.77 Females per 100 Males in Indian River Shores.
What is the Median Population Age in Indian River Shores?
Median Population Age in Indian River Shores is 74.4 Years.
What is the Average Family Size in Indian River Shores
Average Family Size in Indian River Shores is 2.3 People.
What is the Average Household Size in Indian River Shores
Average Household Size in Indian River Shores is 1.9 People.
How Large is the Labor Force in Indian River Shores?
There are 826 People in the Labor Forcein in Indian River Shores.
What is the Percentage of People in the Labor Force in Indian River Shores?
20.6% of People are in the Labor Force in Indian River Shores.
What is the Unemployment Rate in Indian River Shores?
Unemployment Rate in Indian River Shores is 0.6%.