Tega Cay, SC Map & Demographics
Tega Cay Map
Tega Cay Overview
$62,042
PER CAPITA INCOME
$144,157
AVG FAMILY INCOME
$140,172
AVG HOUSEHOLD INCOME
55.4%
WAGE / INCOME GAP [ % ]
44.6¢/ $1
WAGE / INCOME GAP [ $ ]
0.36
INEQUALITY / GINI INDEX
12,816
TOTAL POPULATION
6,337
MALE POPULATION
6,479
FEMALE POPULATION
97.81
MALES / 100 FEMALES
102.24
FEMALES / 100 MALES
41.6
MEDIAN AGE
2.9
AVG FAMILY SIZE
2.7
AVG HOUSEHOLD SIZE
6,304
LABOR FORCE [ PEOPLE ]
64.2%
PERCENT IN LABOR FORCE
1.3%
UNEMPLOYMENT RATE
Tega Cay Area Codes
Income in Tega Cay
Income Overview in Tega Cay
Per Capita Income in Tega Cay is $62,042, while median incomes of families and households are $144,157 and $140,172 respectively.
| Characteristic | Number | Measure |
| Per Capita Income | 12,816 | $62,042 |
| Median Family Income | 4,194 | $144,157 |
| Mean Family Income | 4,194 | $182,368 |
| Median Household Income | 4,729 | $140,172 |
| Mean Household Income | 4,729 | $169,602 |
| Income Deficit | 4,194 | $0 |
| Wage / Income Gap (%) | 12,816 | 55.41% |
| Wage / Income Gap ($) | 12,816 | 44.59¢ per $1 |
| Gini / Inequality Index | 12,816 | 0.36 |
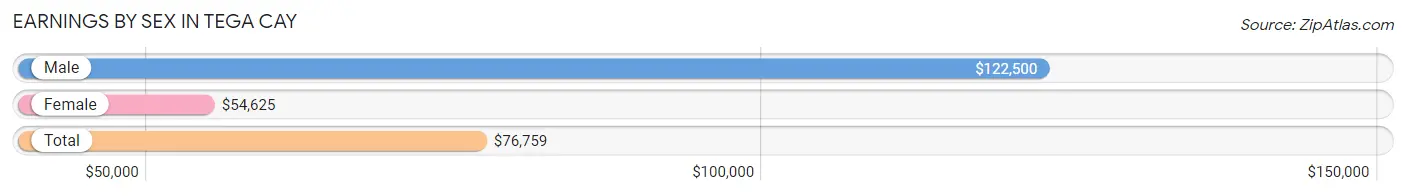
Earnings by Sex in Tega Cay
Average Earnings in Tega Cay are $76,759, $122,500 for men and $54,625 for women, a difference of 55.4%.
| Sex | Number | Average Earnings |
| Male | 3,736 (53.9%) | $122,500 |
| Female | 3,197 (46.1%) | $54,625 |
| Total | 6,933 (100.0%) | $76,759 |
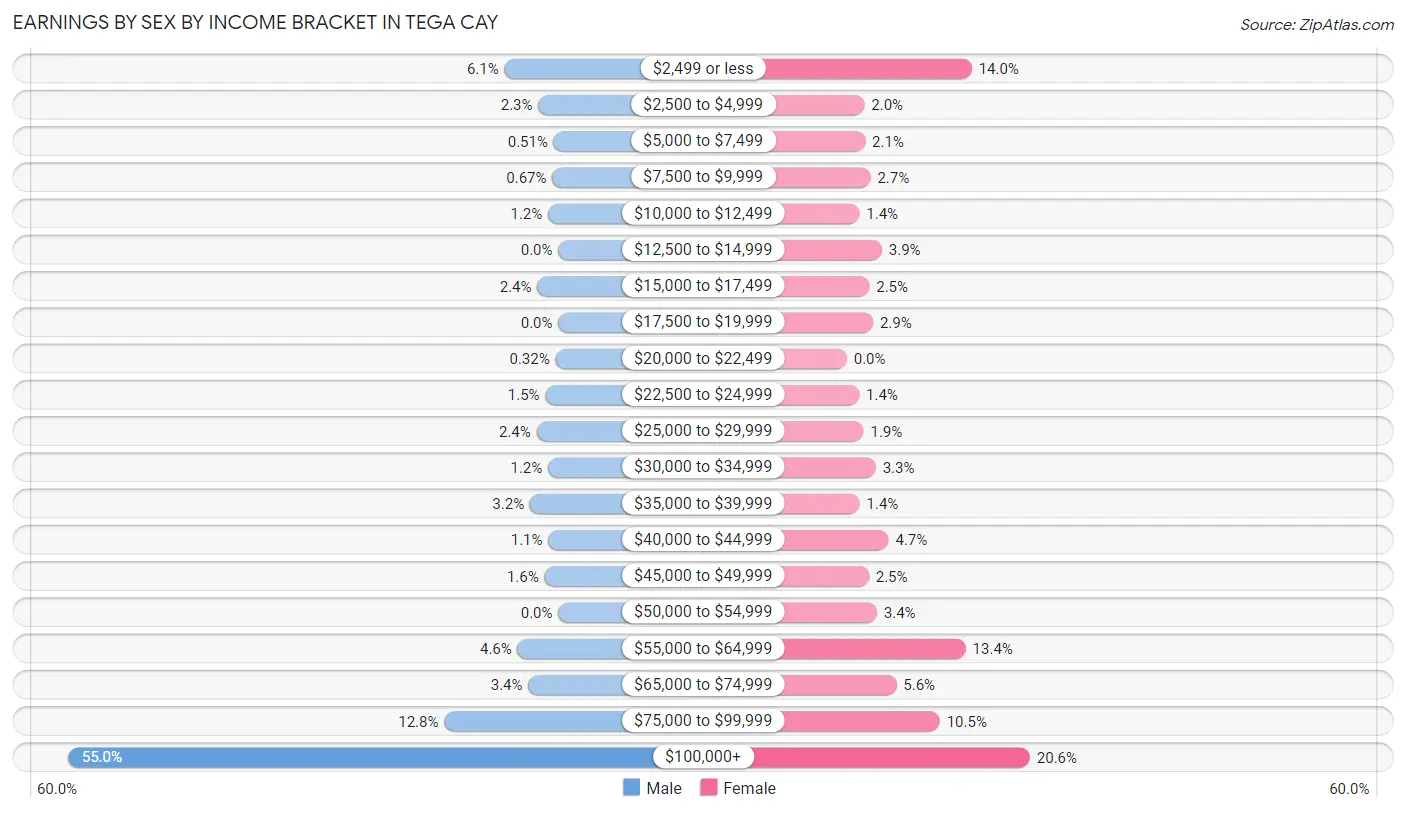
Earnings by Sex by Income Bracket in Tega Cay
The most common earnings brackets in Tega Cay are $100,000+ for men (2,056 | 55.0%) and $100,000+ for women (658 | 20.6%).
| Income | Male | Female |
| $2,499 or less | 226 (6.0%) | 449 (14.0%) |
| $2,500 to $4,999 | 84 (2.2%) | 63 (2.0%) |
| $5,000 to $7,499 | 19 (0.5%) | 66 (2.1%) |
| $7,500 to $9,999 | 25 (0.7%) | 85 (2.7%) |
| $10,000 to $12,499 | 43 (1.1%) | 45 (1.4%) |
| $12,500 to $14,999 | 0 (0.0%) | 126 (3.9%) |
| $15,000 to $17,499 | 88 (2.4%) | 81 (2.5%) |
| $17,500 to $19,999 | 0 (0.0%) | 94 (2.9%) |
| $20,000 to $22,499 | 12 (0.3%) | 0 (0.0%) |
| $22,500 to $24,999 | 54 (1.5%) | 44 (1.4%) |
| $25,000 to $29,999 | 91 (2.4%) | 60 (1.9%) |
| $30,000 to $34,999 | 43 (1.1%) | 104 (3.3%) |
| $35,000 to $39,999 | 119 (3.2%) | 46 (1.4%) |
| $40,000 to $44,999 | 42 (1.1%) | 150 (4.7%) |
| $45,000 to $49,999 | 58 (1.5%) | 79 (2.5%) |
| $50,000 to $54,999 | 0 (0.0%) | 108 (3.4%) |
| $55,000 to $64,999 | 171 (4.6%) | 427 (13.4%) |
| $65,000 to $74,999 | 126 (3.4%) | 178 (5.6%) |
| $75,000 to $99,999 | 479 (12.8%) | 334 (10.4%) |
| $100,000+ | 2,056 (55.0%) | 658 (20.6%) |
| Total | 3,736 (100.0%) | 3,197 (100.0%) |
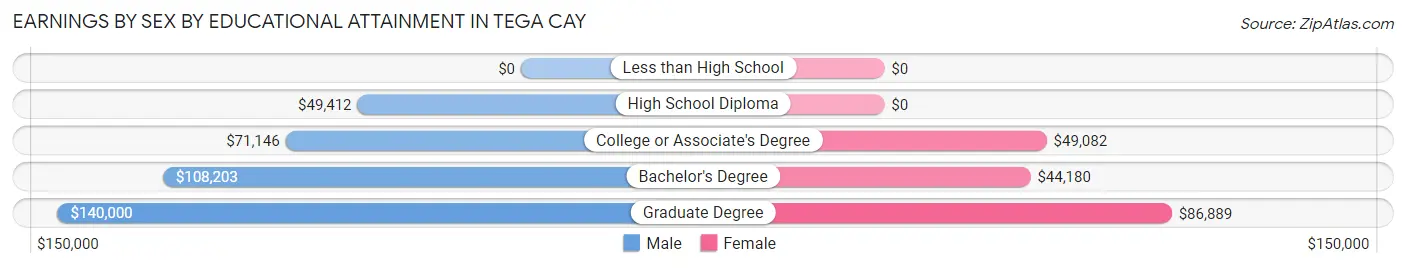
Earnings by Sex by Educational Attainment in Tega Cay
Average earnings in Tega Cay are $123,458 for men and $56,879 for women, a difference of 53.9%. Men with an educational attainment of graduate degree enjoy the highest average annual earnings of $140,000, while those with high school diploma education earn the least with $49,412. Women with an educational attainment of graduate degree earn the most with the average annual earnings of $86,889, while those with bachelor's degree education have the smallest earnings of $44,180.
| Educational Attainment | Male Income | Female Income |
| Less than High School | - | - |
| High School Diploma | $49,412 | $0 |
| College or Associate's Degree | $71,146 | $49,082 |
| Bachelor's Degree | $108,203 | $44,180 |
| Graduate Degree | $140,000 | $86,889 |
| Total | $123,458 | $56,879 |
Family Income in Tega Cay
Family Income Brackets in Tega Cay
According to the Tega Cay family income data, there are 1,283 families falling into the $100,000 to $149,999 income range, which is the most common income bracket and makes up 30.6% of all families.
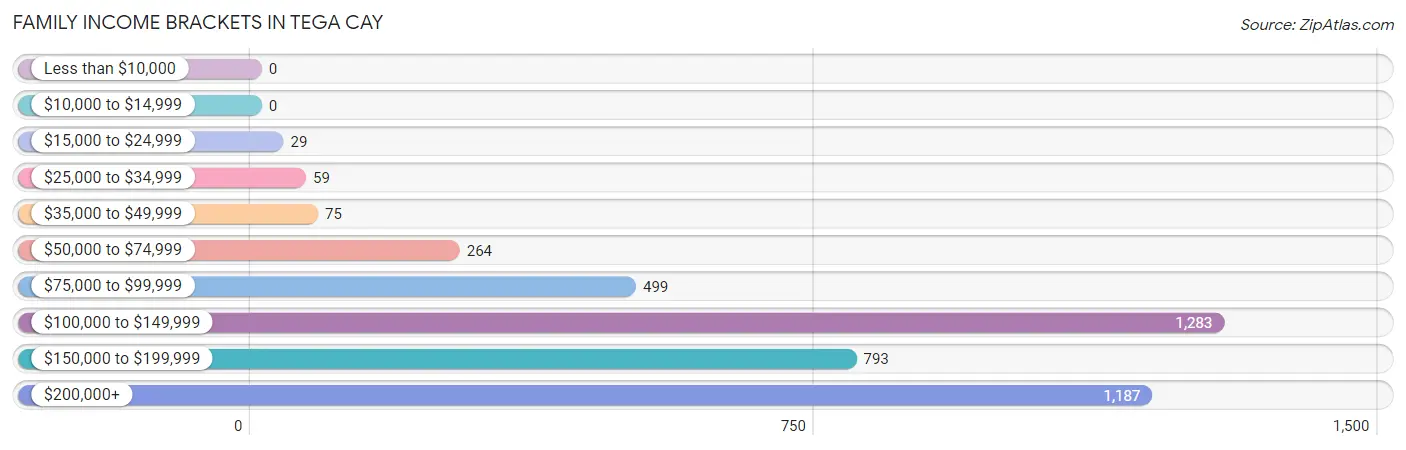
| Income Bracket | # Families | % Families |
| Less than $10,000 | 0 | 0.0% |
| $10,000 to $14,999 | 0 | 0.0% |
| $15,000 to $24,999 | 29 | 0.7% |
| $25,000 to $34,999 | 59 | 1.4% |
| $35,000 to $49,999 | 75 | 1.8% |
| $50,000 to $74,999 | 264 | 6.3% |
| $75,000 to $99,999 | 499 | 11.9% |
| $100,000 to $149,999 | 1,283 | 30.6% |
| $150,000 to $199,999 | 793 | 18.9% |
| $200,000+ | 1,187 | 28.3% |
Family Income by Famaliy Size in Tega Cay
5-person families (191 | 4.5%) account for the highest median family income in Tega Cay with $215,972 per family, while 2-person families (1,743 | 41.6%) have the highest median income of $55,896 per family member.
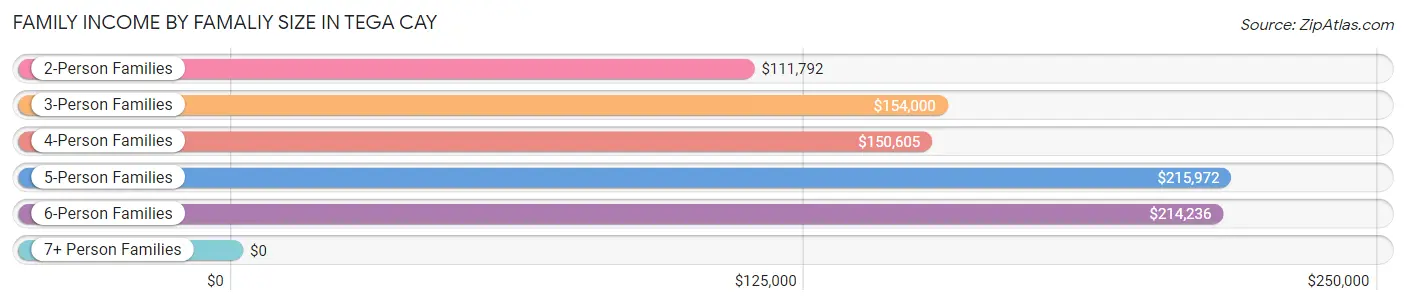
| Income Bracket | # Families | Median Income |
| 2-Person Families | 1,743 (41.6%) | $111,792 |
| 3-Person Families | 1,078 (25.7%) | $154,000 |
| 4-Person Families | 1,117 (26.6%) | $150,605 |
| 5-Person Families | 191 (4.5%) | $215,972 |
| 6-Person Families | 65 (1.5%) | $214,236 |
| 7+ Person Families | 0 (0.0%) | $0 |
| Total | 4,194 (100.0%) | $144,157 |
Family Income by Number of Earners in Tega Cay
The median family income in Tega Cay is $144,157, with families comprising 3+ earners (363) having the highest median family income of $200,656, while families with no earners (622) have the lowest median family income of $91,479, accounting for 8.7% and 14.8% of families, respectively.
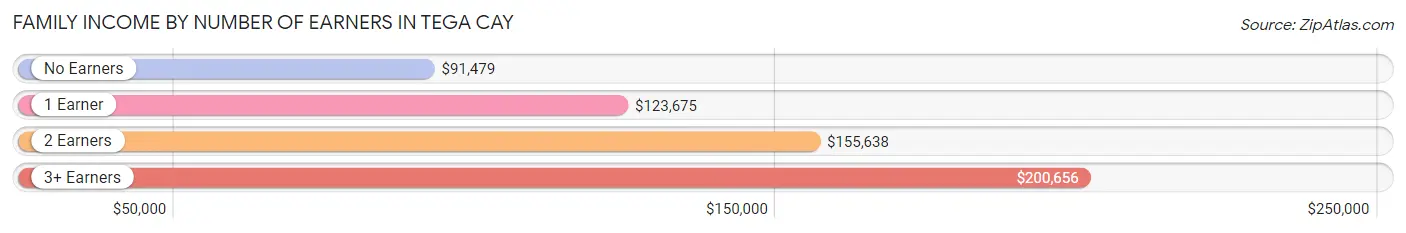
| Number of Earners | # Families | Median Income |
| No Earners | 622 (14.8%) | $91,479 |
| 1 Earner | 1,028 (24.5%) | $123,675 |
| 2 Earners | 2,181 (52.0%) | $155,638 |
| 3+ Earners | 363 (8.7%) | $200,656 |
| Total | 4,194 (100.0%) | $144,157 |
Household Income in Tega Cay
Household Income Brackets in Tega Cay
With 1,386 households falling in the category, the $100,000 to $149,999 income range is the most frequent in Tega Cay, accounting for 29.3% of all households. In contrast, only 5 households (0.1%) fall into the $10,000 to $14,999 income bracket, making it the least populous group.
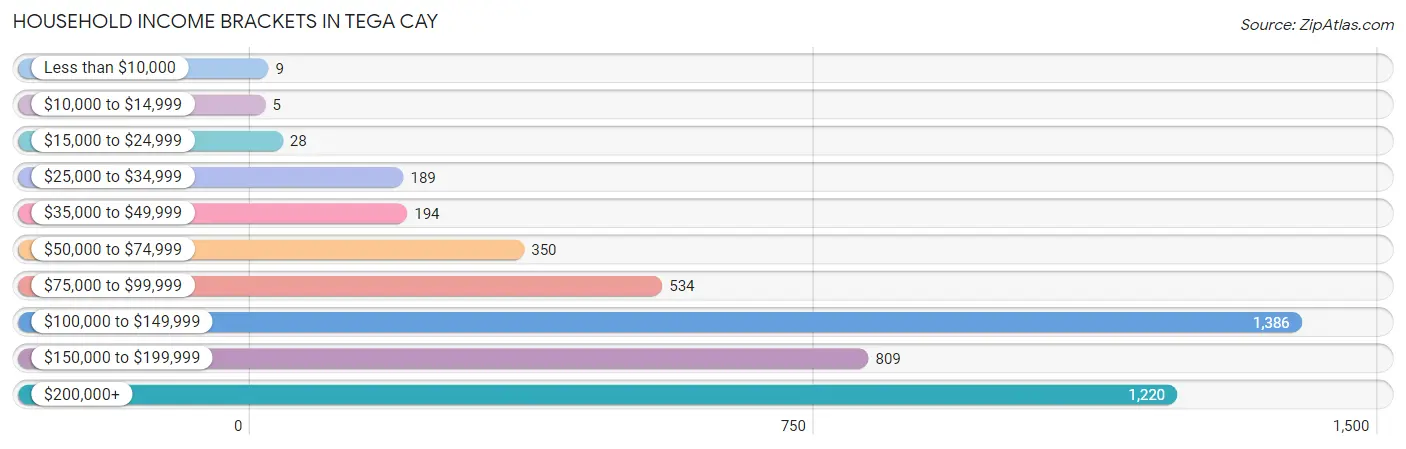
| Income Bracket | # Households | % Households |
| Less than $10,000 | 9 | 0.2% |
| $10,000 to $14,999 | 5 | 0.1% |
| $15,000 to $24,999 | 28 | 0.6% |
| $25,000 to $34,999 | 189 | 4.0% |
| $35,000 to $49,999 | 194 | 4.1% |
| $50,000 to $74,999 | 350 | 7.4% |
| $75,000 to $99,999 | 534 | 11.3% |
| $100,000 to $149,999 | 1,386 | 29.3% |
| $150,000 to $199,999 | 809 | 17.1% |
| $200,000+ | 1,220 | 25.8% |
Household Income by Householder Age in Tega Cay
The median household income in Tega Cay is $140,172, with the highest median household income of $166,884 found in the 45 to 64 years age bracket for the primary householder. A total of 1,823 households (38.6%) fall into this category.
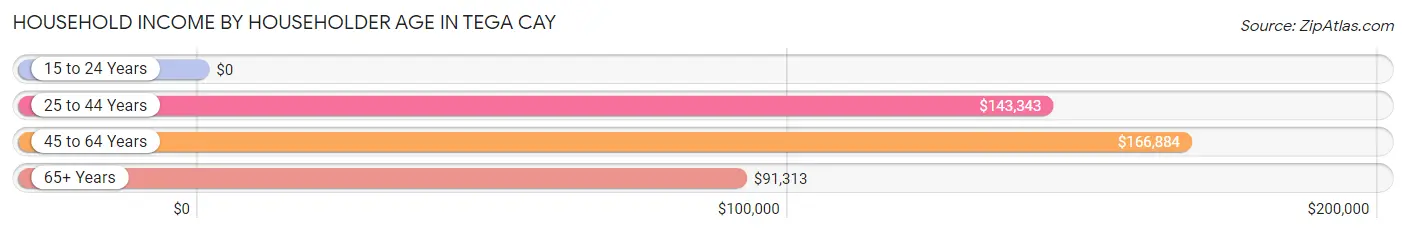
| Income Bracket | # Households | Median Income |
| 15 to 24 Years | 0 (0.0%) | $0 |
| 25 to 44 Years | 1,580 (33.4%) | $143,343 |
| 45 to 64 Years | 1,823 (38.6%) | $166,884 |
| 65+ Years | 1,326 (28.0%) | $91,313 |
| Total | 4,729 (100.0%) | $140,172 |
Poverty in Tega Cay
Income Below Poverty by Sex and Age in Tega Cay
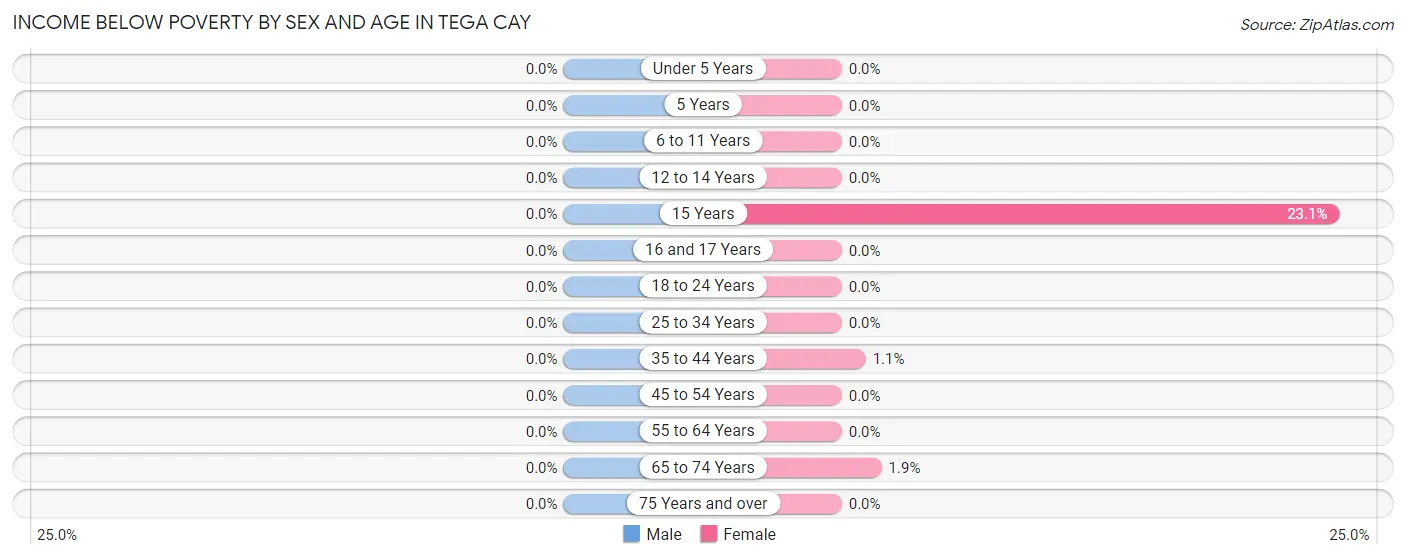
| Age Bracket | Male | Female |
| Under 5 Years | 0 (0.0%) | 0 (0.0%) |
| 5 Years | 0 (0.0%) | 0 (0.0%) |
| 6 to 11 Years | 0 (0.0%) | 0 (0.0%) |
| 12 to 14 Years | 0 (0.0%) | 0 (0.0%) |
| 15 Years | 0 (0.0%) | 18 (23.1%) |
| 16 and 17 Years | 0 (0.0%) | 0 (0.0%) |
| 18 to 24 Years | 0 (0.0%) | 0 (0.0%) |
| 25 to 34 Years | 0 (0.0%) | 0 (0.0%) |
| 35 to 44 Years | 0 (0.0%) | 16 (1.1%) |
| 45 to 54 Years | 0 (0.0%) | 0 (0.0%) |
| 55 to 64 Years | 0 (0.0%) | 0 (0.0%) |
| 65 to 74 Years | 0 (0.0%) | 15 (1.8%) |
| 75 Years and over | 0 (0.0%) | 0 (0.0%) |
| Total | 0 (0.0%) | 49 (0.8%) |
Income Above Poverty by Sex and Age in Tega Cay
According to the poverty statistics in Tega Cay, males aged under 5 years and females aged under 5 years are the age groups that are most secure financially, with 100.0% of males and 100.0% of females in these age groups living above the poverty line.
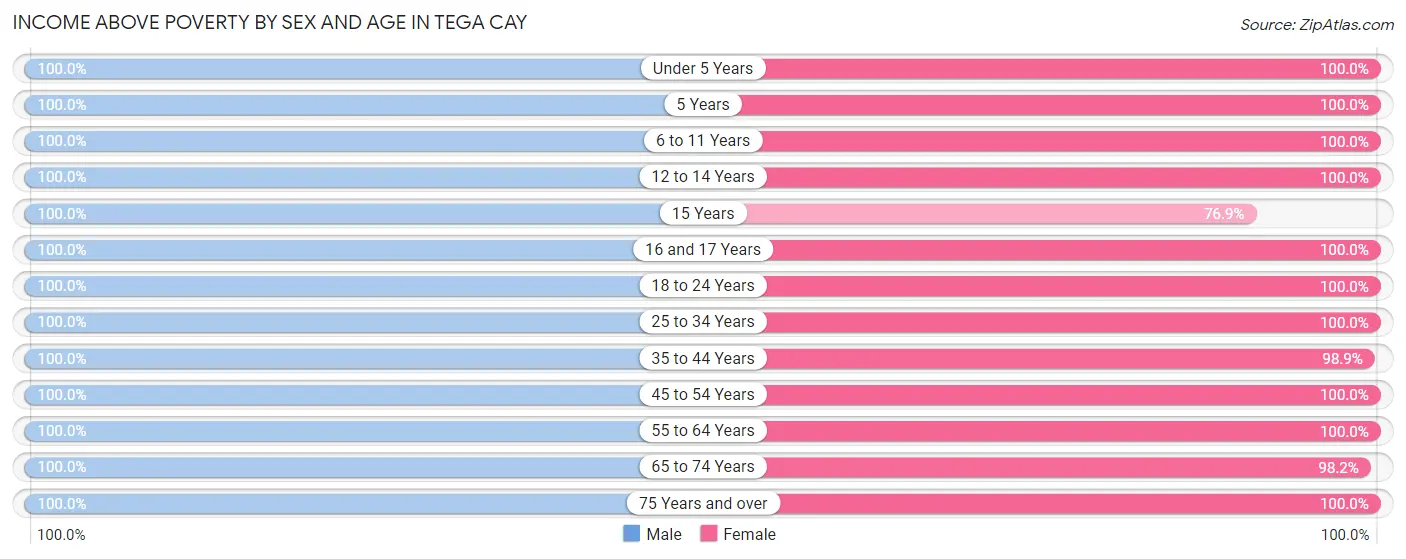
| Age Bracket | Male | Female |
| Under 5 Years | 429 (100.0%) | 303 (100.0%) |
| 5 Years | 17 (100.0%) | 160 (100.0%) |
| 6 to 11 Years | 790 (100.0%) | 663 (100.0%) |
| 12 to 14 Years | 224 (100.0%) | 309 (100.0%) |
| 15 Years | 23 (100.0%) | 60 (76.9%) |
| 16 and 17 Years | 199 (100.0%) | 156 (100.0%) |
| 18 to 24 Years | 120 (100.0%) | 188 (100.0%) |
| 25 to 34 Years | 237 (100.0%) | 283 (100.0%) |
| 35 to 44 Years | 1,480 (100.0%) | 1,430 (98.9%) |
| 45 to 54 Years | 899 (100.0%) | 887 (100.0%) |
| 55 to 64 Years | 822 (100.0%) | 932 (100.0%) |
| 65 to 74 Years | 847 (100.0%) | 794 (98.2%) |
| 75 Years and over | 250 (100.0%) | 265 (100.0%) |
| Total | 6,337 (100.0%) | 6,430 (99.2%) |
Income Below Poverty Among Married-Couple Families in Tega Cay
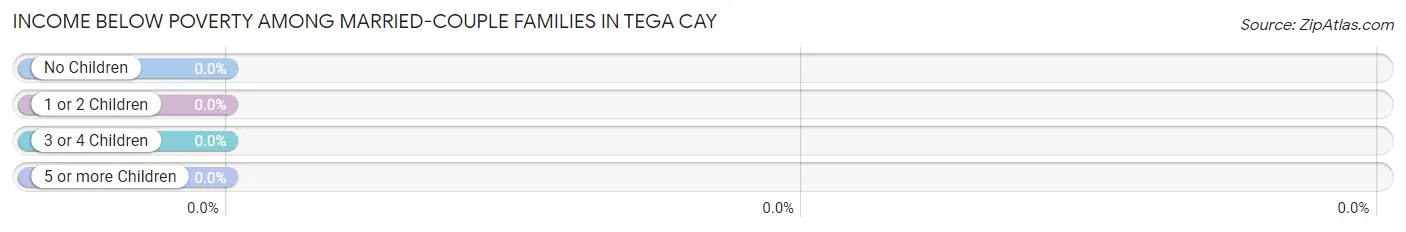
| Children | Above Poverty | Below Poverty |
| No Children | 1,883 (100.0%) | 0 (0.0%) |
| 1 or 2 Children | 1,979 (100.0%) | 0 (0.0%) |
| 3 or 4 Children | 132 (100.0%) | 0 (0.0%) |
| 5 or more Children | 0 (0.0%) | 0 (0.0%) |
| Total | 3,994 (100.0%) | 0 (0.0%) |
Income Below Poverty Among Single-Parent Households in Tega Cay
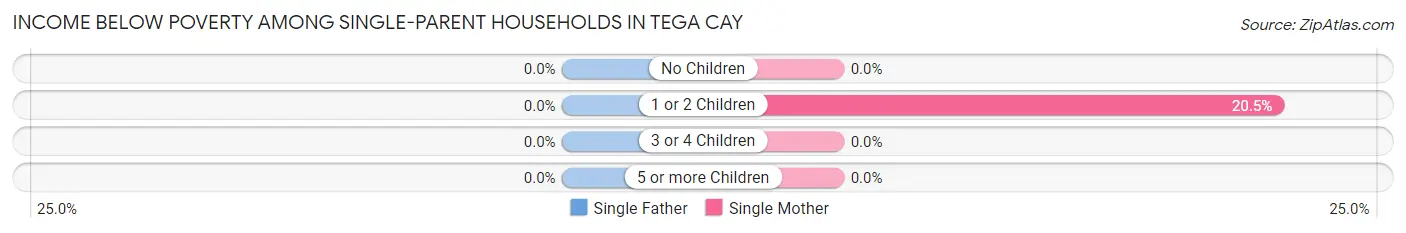
| Children | Single Father | Single Mother |
| No Children | 0 (0.0%) | 0 (0.0%) |
| 1 or 2 Children | 0 (0.0%) | 16 (20.5%) |
| 3 or 4 Children | 0 (0.0%) | 0 (0.0%) |
| 5 or more Children | 0 (0.0%) | 0 (0.0%) |
| Total | 0 (0.0%) | 16 (10.1%) |
Income Below Poverty Among Married-Couple vs Single-Parent Households in Tega Cay
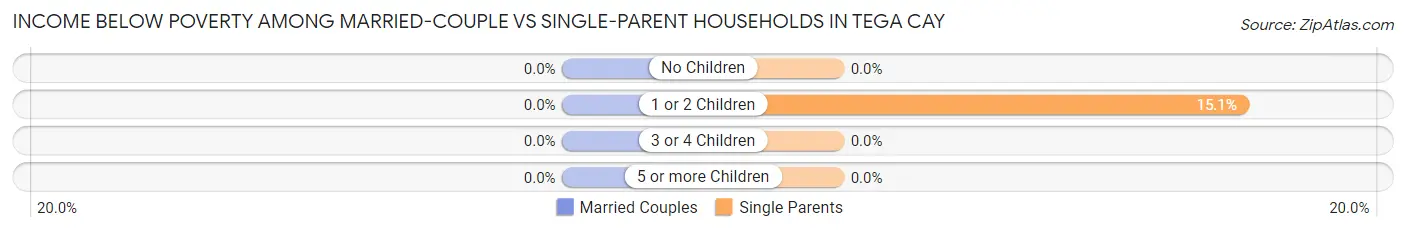
| Children | Married-Couple Families | Single-Parent Households |
| No Children | 0 (0.0%) | 0 (0.0%) |
| 1 or 2 Children | 0 (0.0%) | 16 (15.1%) |
| 3 or 4 Children | 0 (0.0%) | 0 (0.0%) |
| 5 or more Children | 0 (0.0%) | 0 (0.0%) |
| Total | 0 (0.0%) | 16 (8.0%) |
Race in Tega Cay
The most populous races in Tega Cay are White / Caucasian (9,815 | 76.6%), Hispanic or Latino (1,524 | 11.9%), and Two or more Races (1,401 | 10.9%).
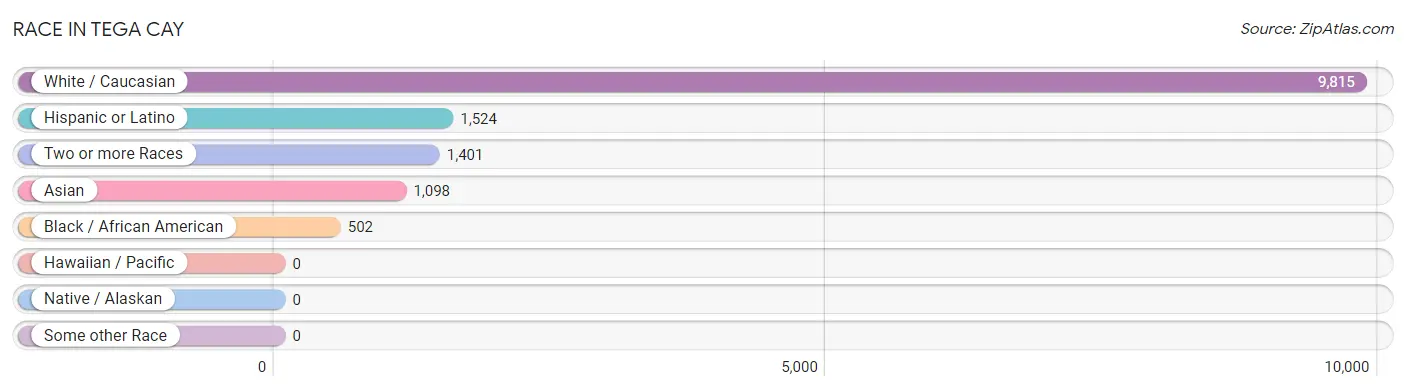
| Race | # Population | % Population |
| Asian | 1,098 | 8.6% |
| Black / African American | 502 | 3.9% |
| Hawaiian / Pacific | 0 | 0.0% |
| Hispanic or Latino | 1,524 | 11.9% |
| Native / Alaskan | 0 | 0.0% |
| White / Caucasian | 9,815 | 76.6% |
| Two or more Races | 1,401 | 10.9% |
| Some other Race | 0 | 0.0% |
| Total | 12,816 | 100.0% |
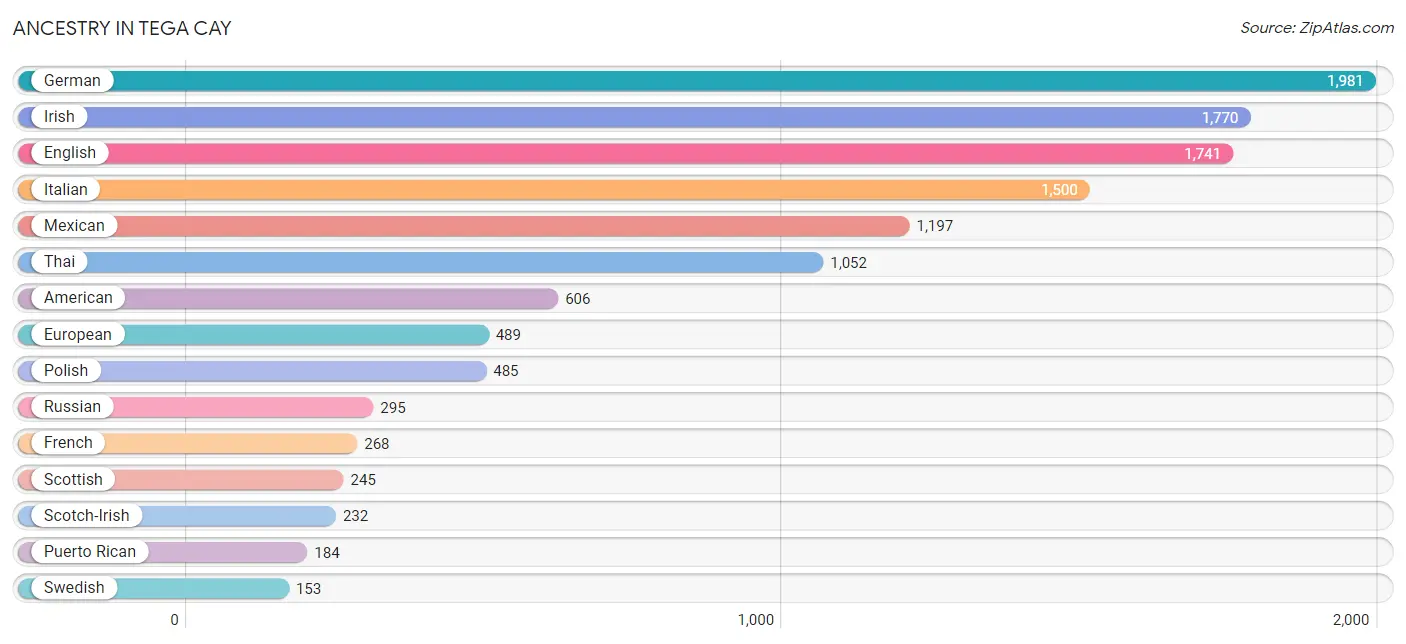
Ancestry in Tega Cay
The most populous ancestries reported in Tega Cay are German (1,981 | 15.5%), Irish (1,770 | 13.8%), English (1,741 | 13.6%), Italian (1,500 | 11.7%), and Mexican (1,197 | 9.3%), together accounting for 63.9% of all Tega Cay residents.
| Ancestry | # Population | % Population |
| American | 606 | 4.7% |
| Arab | 108 | 0.8% |
| Austrian | 41 | 0.3% |
| Belgian | 27 | 0.2% |
| British | 65 | 0.5% |
| Burmese | 71 | 0.5% |
| Canadian | 33 | 0.3% |
| Cherokee | 38 | 0.3% |
| Colombian | 15 | 0.1% |
| Croatian | 24 | 0.2% |
| Cuban | 80 | 0.6% |
| Cypriot | 28 | 0.2% |
| Czech | 24 | 0.2% |
| Czechoslovakian | 14 | 0.1% |
| Danish | 89 | 0.7% |
| Dutch | 82 | 0.6% |
| Eastern European | 7 | 0.1% |
| English | 1,741 | 13.6% |
| European | 489 | 3.8% |
| French | 268 | 2.1% |
| French Canadian | 99 | 0.8% |
| German | 1,981 | 15.5% |
| Greek | 10 | 0.1% |
| Indian (Asian) | 14 | 0.1% |
| Irish | 1,770 | 13.8% |
| Italian | 1,500 | 11.7% |
| Korean | 32 | 0.3% |
| Lebanese | 49 | 0.4% |
| Mexican | 1,197 | 9.3% |
| Northern European | 19 | 0.2% |
| Norwegian | 71 | 0.5% |
| Peruvian | 17 | 0.1% |
| Polish | 485 | 3.8% |
| Puerto Rican | 184 | 1.4% |
| Russian | 295 | 2.3% |
| Scotch-Irish | 232 | 1.8% |
| Scottish | 245 | 1.9% |
| Serbian | 34 | 0.3% |
| Slovak | 145 | 1.1% |
| Slovene | 55 | 0.4% |
| South American | 32 | 0.3% |
| Spanish | 15 | 0.1% |
| Swedish | 153 | 1.2% |
| Thai | 1,052 | 8.2% |
| Trinidadian and Tobagonian | 12 | 0.1% |
| Ukrainian | 81 | 0.6% |
| Welsh | 144 | 1.1% |
| Yugoslavian | 14 | 0.1% | View All 48 Rows |
Immigrants in Tega Cay
The most numerous immigrant groups reported in Tega Cay came from Asia (783 | 6.1%), India (713 | 5.6%), South Central Asia (713 | 5.6%), Latin America (637 | 5.0%), and Central America (587 | 4.6%), together accounting for 26.8% of all Tega Cay residents.
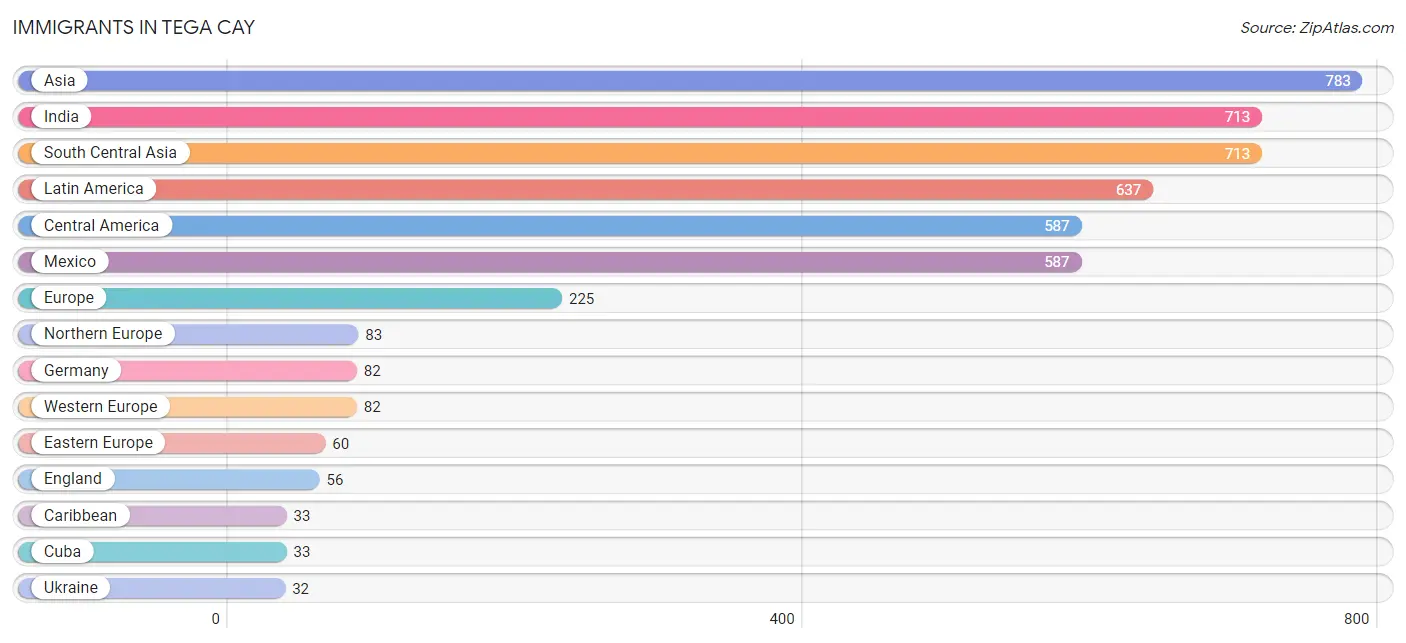
| Immigration Origin | # Population | % Population |
| Africa | 9 | 0.1% |
| Asia | 783 | 6.1% |
| Canada | 7 | 0.1% |
| Caribbean | 33 | 0.3% |
| Central America | 587 | 4.6% |
| China | 14 | 0.1% |
| Cuba | 33 | 0.3% |
| Eastern Asia | 14 | 0.1% |
| Eastern Europe | 60 | 0.5% |
| England | 56 | 0.4% |
| Europe | 225 | 1.8% |
| Germany | 82 | 0.6% |
| India | 713 | 5.6% |
| Latin America | 637 | 5.0% |
| Mexico | 587 | 4.6% |
| Northern Europe | 83 | 0.6% |
| Peru | 17 | 0.1% |
| Philippines | 12 | 0.1% |
| Russia | 28 | 0.2% |
| South Africa | 9 | 0.1% |
| South America | 17 | 0.1% |
| South Central Asia | 713 | 5.6% |
| South Eastern Asia | 28 | 0.2% |
| Taiwan | 7 | 0.1% |
| Thailand | 16 | 0.1% |
| Ukraine | 32 | 0.3% |
| Western Asia | 28 | 0.2% |
| Western Europe | 82 | 0.6% | View All 28 Rows |
Sex and Age in Tega Cay
Sex and Age in Tega Cay
The most populous age groups in Tega Cay are 35 to 39 Years (798 | 12.6%) for men and 35 to 39 Years (779 | 12.0%) for women.
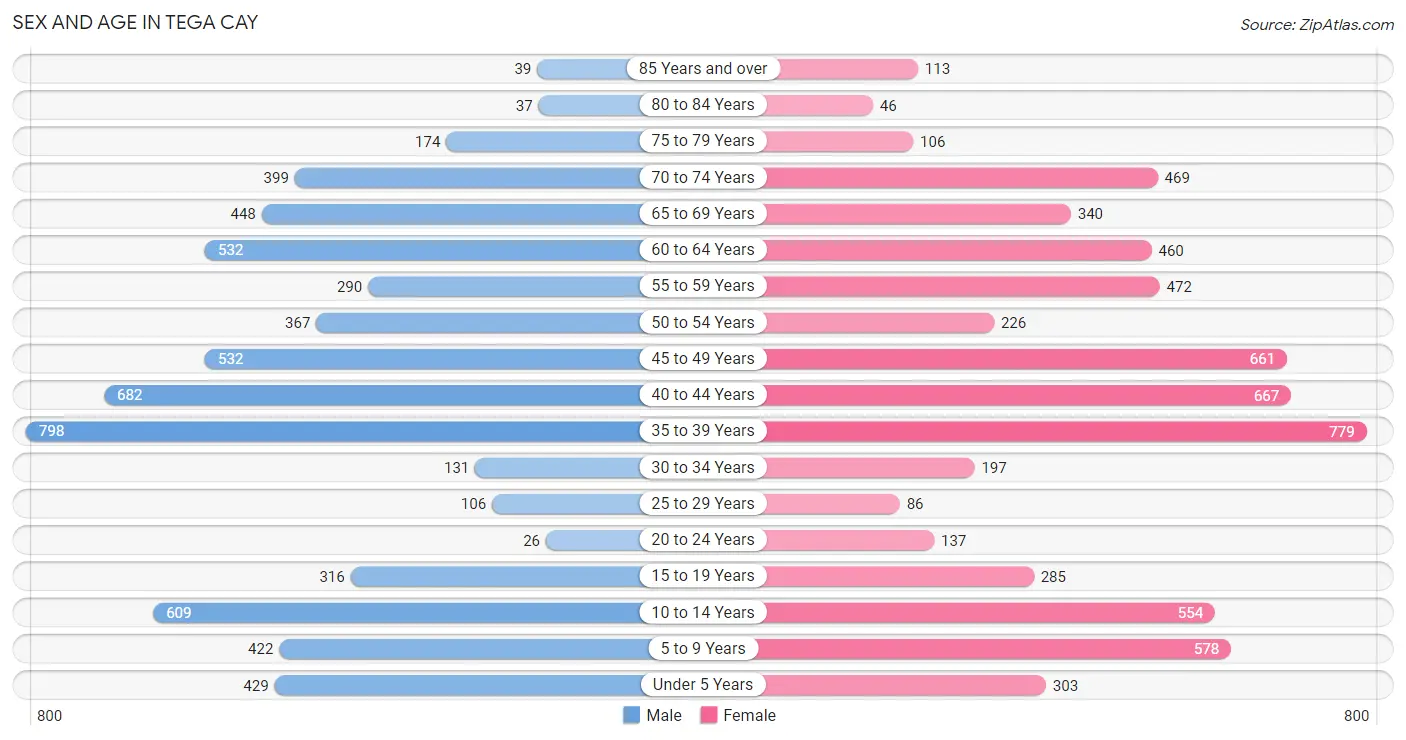
| Age Bracket | Male | Female |
| Under 5 Years | 429 (6.8%) | 303 (4.7%) |
| 5 to 9 Years | 422 (6.7%) | 578 (8.9%) |
| 10 to 14 Years | 609 (9.6%) | 554 (8.6%) |
| 15 to 19 Years | 316 (5.0%) | 285 (4.4%) |
| 20 to 24 Years | 26 (0.4%) | 137 (2.1%) |
| 25 to 29 Years | 106 (1.7%) | 86 (1.3%) |
| 30 to 34 Years | 131 (2.1%) | 197 (3.0%) |
| 35 to 39 Years | 798 (12.6%) | 779 (12.0%) |
| 40 to 44 Years | 682 (10.8%) | 667 (10.3%) |
| 45 to 49 Years | 532 (8.4%) | 661 (10.2%) |
| 50 to 54 Years | 367 (5.8%) | 226 (3.5%) |
| 55 to 59 Years | 290 (4.6%) | 472 (7.3%) |
| 60 to 64 Years | 532 (8.4%) | 460 (7.1%) |
| 65 to 69 Years | 448 (7.1%) | 340 (5.2%) |
| 70 to 74 Years | 399 (6.3%) | 469 (7.2%) |
| 75 to 79 Years | 174 (2.8%) | 106 (1.6%) |
| 80 to 84 Years | 37 (0.6%) | 46 (0.7%) |
| 85 Years and over | 39 (0.6%) | 113 (1.7%) |
| Total | 6,337 (100.0%) | 6,479 (100.0%) |
Families and Households in Tega Cay
Median Family Size in Tega Cay
The median family size in Tega Cay is 2.93 persons per family, with married-couple families (3,994 | 95.2%) accounting for the largest median family size of 2.94 persons per family. On the other hand, single male/father families (42 | 1.0%) represent the smallest median family size with 2.57 persons per family.
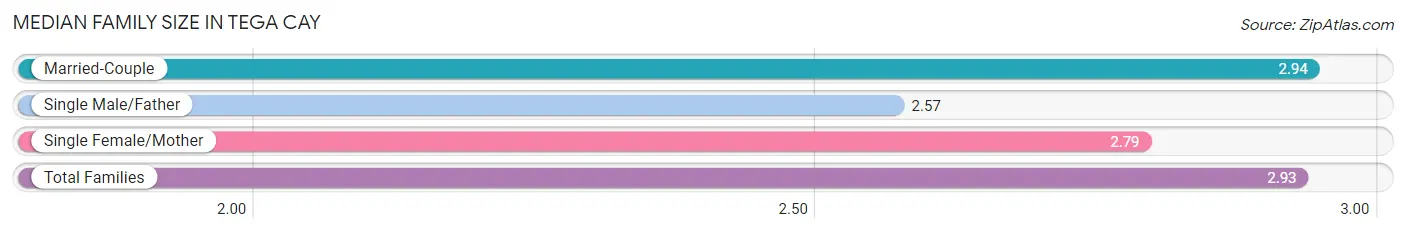
| Family Type | # Families | Family Size |
| Married-Couple | 3,994 (95.2%) | 2.94 |
| Single Male/Father | 42 (1.0%) | 2.57 |
| Single Female/Mother | 158 (3.8%) | 2.79 |
| Total Families | 4,194 (100.0%) | 2.93 |
Median Household Size in Tega Cay
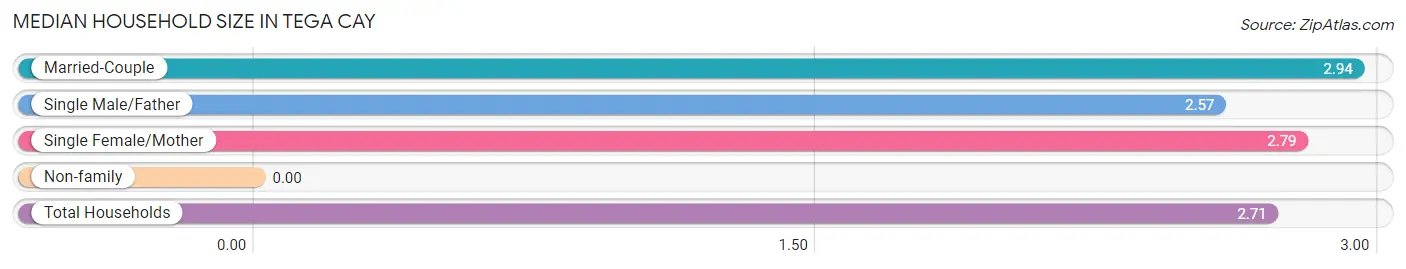
| Household Type | # Households | Household Size |
| Married-Couple | 3,994 (84.5%) | 2.94 |
| Single Male/Father | 42 (0.9%) | 2.57 |
| Single Female/Mother | 158 (3.3%) | 2.79 |
| Non-family | 535 (11.3%) | - |
| Total Households | 4,729 (100.0%) | 2.71 |
Household Size by Marriage Status in Tega Cay
Out of a total of 4,729 households in Tega Cay, 4,194 (88.7%) are family households, while 535 (11.3%) are nonfamily households. The most numerous type of family households are 2-person households, comprising 1,743, and the most common type of nonfamily households are 1-person households, comprising 535.
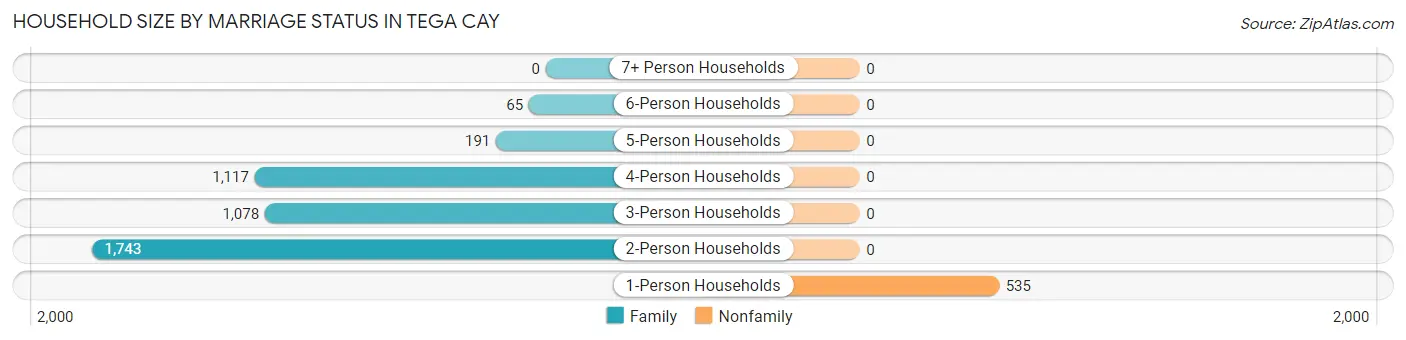
| Household Size | Family Households | Nonfamily Households |
| 1-Person Households | - | 535 (11.3%) |
| 2-Person Households | 1,743 (36.9%) | 0 (0.0%) |
| 3-Person Households | 1,078 (22.8%) | 0 (0.0%) |
| 4-Person Households | 1,117 (23.6%) | 0 (0.0%) |
| 5-Person Households | 191 (4.0%) | 0 (0.0%) |
| 6-Person Households | 65 (1.4%) | 0 (0.0%) |
| 7+ Person Households | 0 (0.0%) | 0 (0.0%) |
| Total | 4,194 (88.7%) | 535 (11.3%) |
Female Fertility in Tega Cay
Fertility by Age in Tega Cay
Average fertility rate in Tega Cay is 32.0 births per 1,000 women. Women in the age bracket of 35 to 50 years have the highest fertility rate with 43.0 births per 1,000 women. Women in the age bracket of 35 to 50 years acount for 100.0% of all women with births.
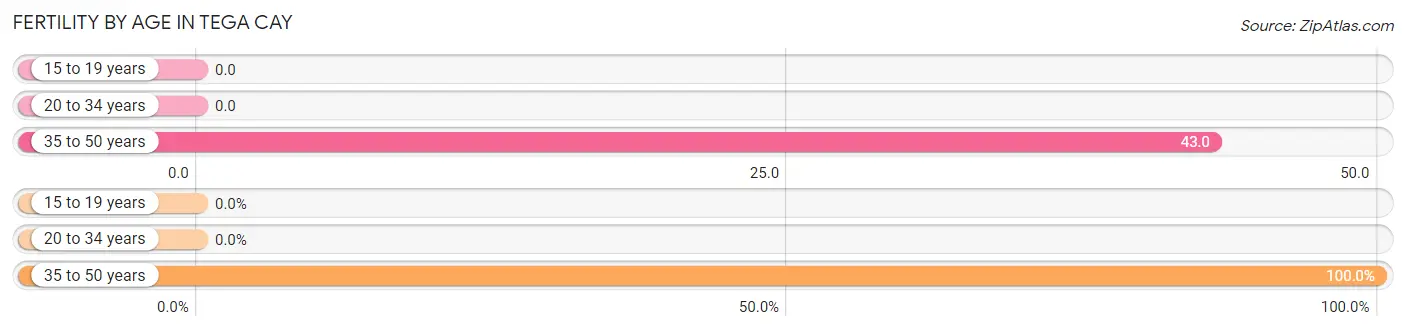
| Age Bracket | Women with Births | Births / 1,000 Women |
| 15 to 19 years | 0 (0.0%) | 0.0 |
| 20 to 34 years | 0 (0.0%) | 0.0 |
| 35 to 50 years | 92 (100.0%) | 43.0 |
| Total | 92 (100.0%) | 32.0 |
Fertility by Age by Marriage Status in Tega Cay
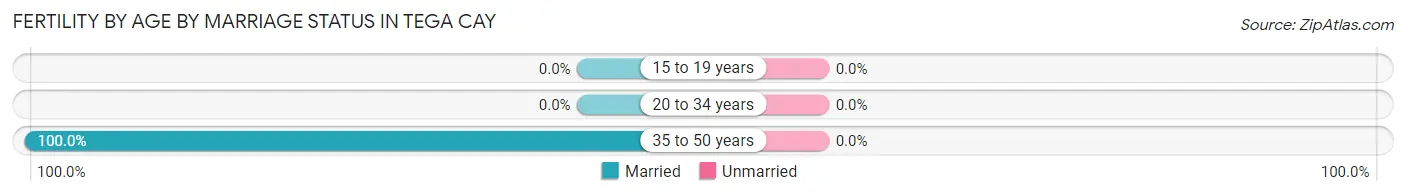
| Age Bracket | Married | Unmarried |
| 15 to 19 years | 0 (0.0%) | 0 (0.0%) |
| 20 to 34 years | 0 (0.0%) | 0 (0.0%) |
| 35 to 50 years | 92 (100.0%) | 0 (0.0%) |
| Total | 92 (100.0%) | 0 (0.0%) |
Fertility by Education in Tega Cay
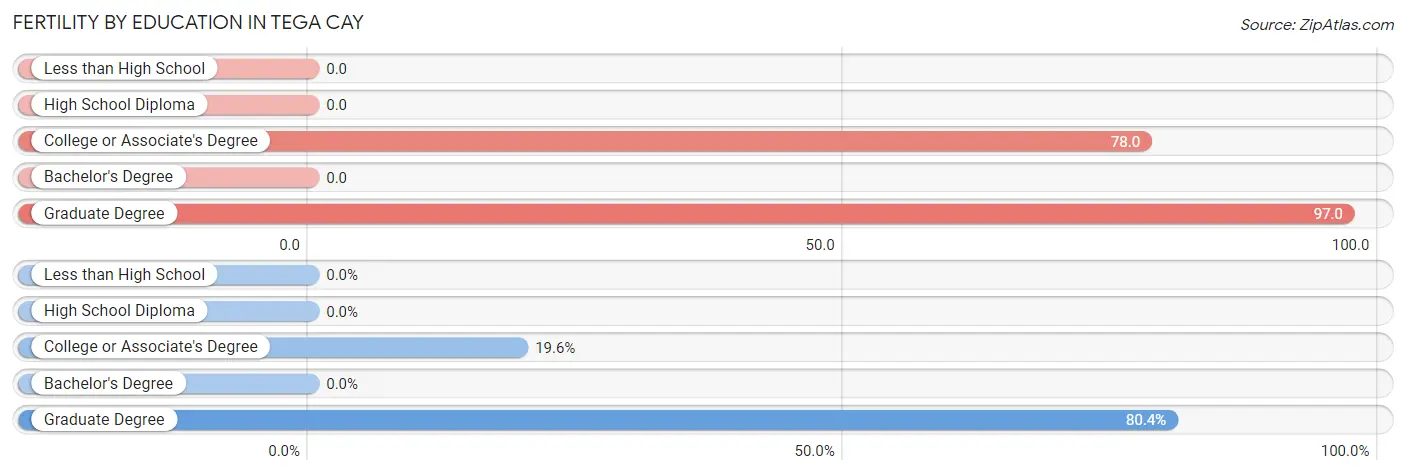
| Educational Attainment | Women with Births | Births / 1,000 Women |
| Less than High School | 0 (0.0%) | 0.0 |
| High School Diploma | 0 (0.0%) | 0.0 |
| College or Associate's Degree | 18 (19.6%) | 78.0 |
| Bachelor's Degree | 0 (0.0%) | 0.0 |
| Graduate Degree | 74 (80.4%) | 97.0 |
| Total | 92 (100.0%) | 32.0 |
Fertility by Education by Marriage Status in Tega Cay
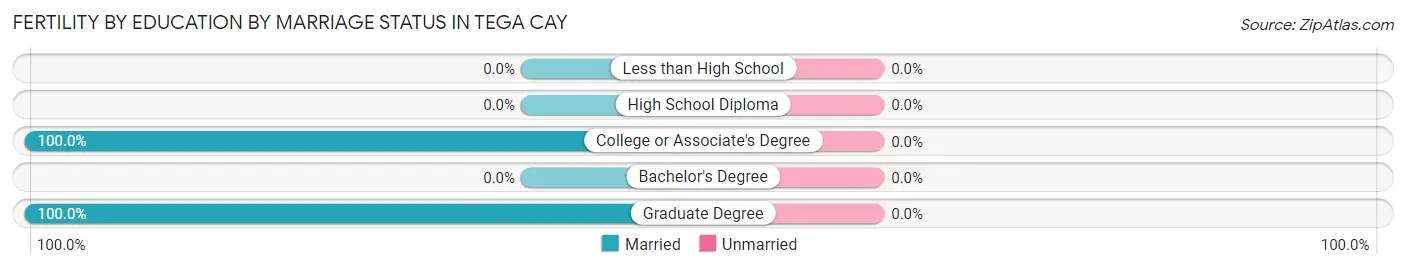
| Educational Attainment | Married | Unmarried |
| Less than High School | 0 (0.0%) | 0 (0.0%) |
| High School Diploma | 0 (0.0%) | 0 (0.0%) |
| College or Associate's Degree | 18 (100.0%) | 0 (0.0%) |
| Bachelor's Degree | 0 (0.0%) | 0 (0.0%) |
| Graduate Degree | 74 (100.0%) | 0 (0.0%) |
| Total | 92 (100.0%) | 0 (0.0%) |
Employment Characteristics in Tega Cay
Employment by Class of Employer in Tega Cay
Among the 6,093 employed individuals in Tega Cay, private company employees (4,632 | 76.0%), self-employed (incorporated) (362 | 5.9%), and not-for-profit organizations (308 | 5.1%) make up the most common classes of employment.
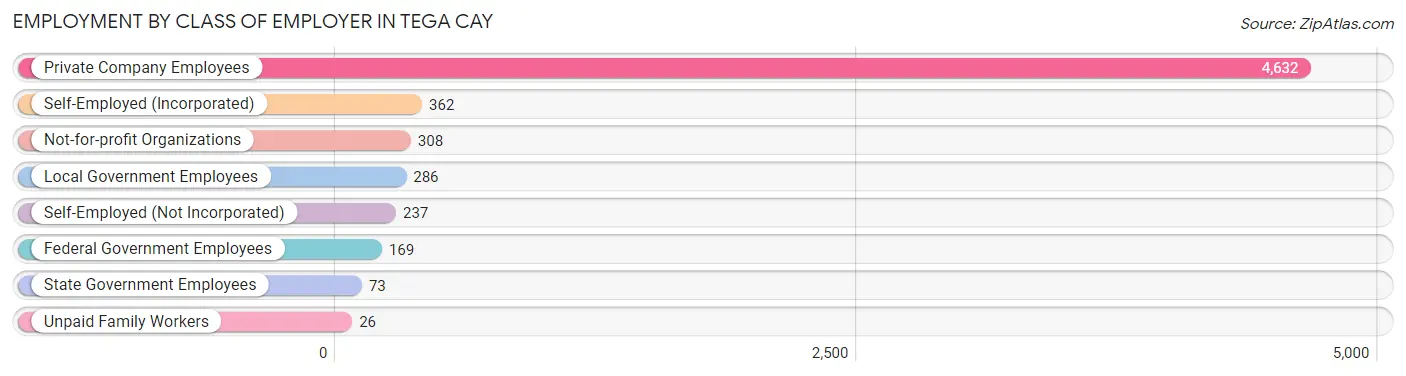
| Employer Class | # Employees | % Employees |
| Private Company Employees | 4,632 | 76.0% |
| Self-Employed (Incorporated) | 362 | 5.9% |
| Self-Employed (Not Incorporated) | 237 | 3.9% |
| Not-for-profit Organizations | 308 | 5.1% |
| Local Government Employees | 286 | 4.7% |
| State Government Employees | 73 | 1.2% |
| Federal Government Employees | 169 | 2.8% |
| Unpaid Family Workers | 26 | 0.4% |
| Total | 6,093 | 100.0% |
Employment Status by Age in Tega Cay
According to the labor force statistics for Tega Cay, out of the total population over 16 years of age (9,820), 64.2% or 6,304 individuals are in the labor force, with 1.3% or 82 of them unemployed. The age group with the highest labor force participation rate is 45 to 54 years, with 96.4% or 1,722 individuals in the labor force. Within the labor force, the 16 to 19 years age range has the highest percentage of unemployed individuals, with 4.6% or 8 of them being unemployed.
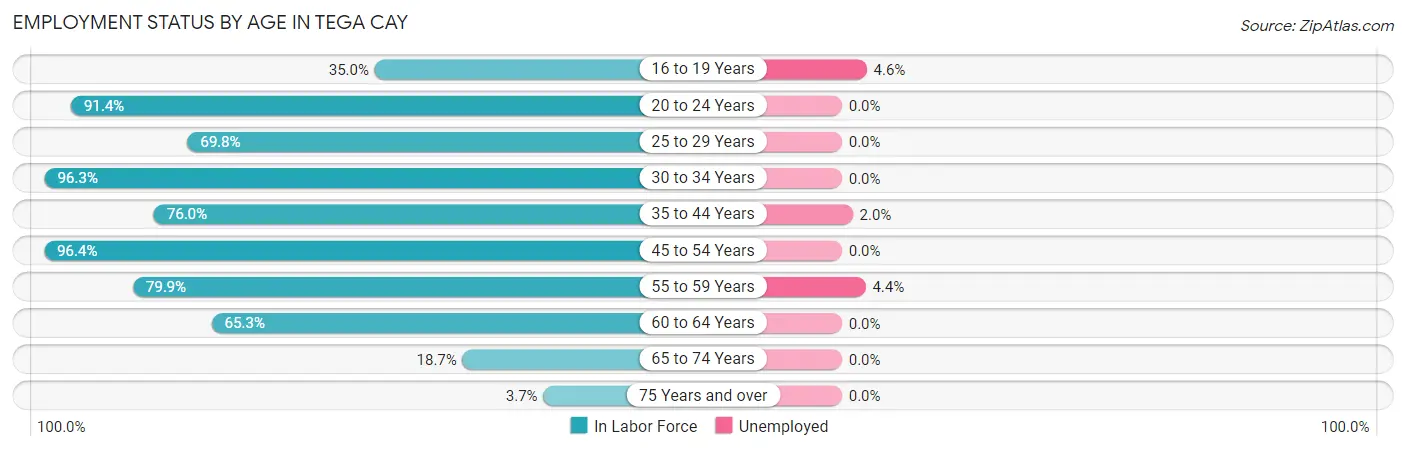
| Age Bracket | In Labor Force | Unemployed |
| 16 to 19 Years | 175 (35.0%) | 8 (4.6%) |
| 20 to 24 Years | 149 (91.4%) | 0 (0.0%) |
| 25 to 29 Years | 134 (69.8%) | 0 (0.0%) |
| 30 to 34 Years | 316 (96.3%) | 0 (0.0%) |
| 35 to 44 Years | 2,224 (76.0%) | 44 (2.0%) |
| 45 to 54 Years | 1,722 (96.4%) | 0 (0.0%) |
| 55 to 59 Years | 609 (79.9%) | 27 (4.4%) |
| 60 to 64 Years | 648 (65.3%) | 0 (0.0%) |
| 65 to 74 Years | 310 (18.7%) | 0 (0.0%) |
| 75 Years and over | 19 (3.7%) | 0 (0.0%) |
| Total | 6,304 (64.2%) | 82 (1.3%) |
Employment Status by Educational Attainment in Tega Cay
According to labor force statistics for Tega Cay, 80.9% of individuals (5,652) out of the total population between 25 and 64 years of age (6,986) are in the labor force, with 1.3% or 73 of them being unemployed. The group with the highest labor force participation rate are those with the educational attainment of bachelor's degree or higher, with 87.5% or 4,407 individuals in the labor force. Within the labor force, individuals with college / associate degree education have the highest percentage of unemployment, with 3.3% or 27 of them being unemployed.
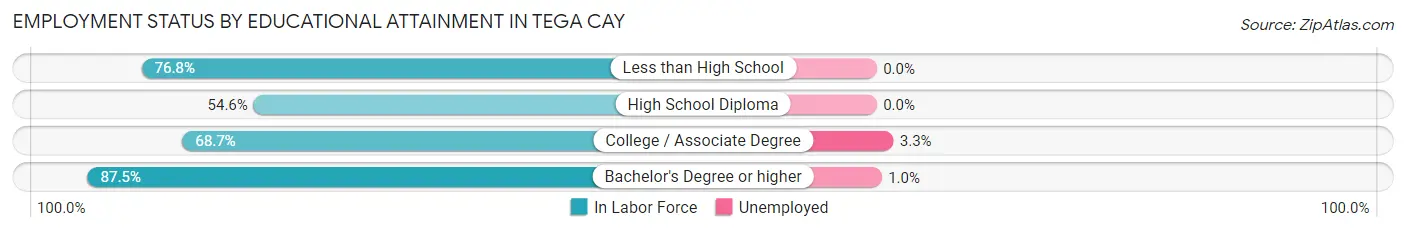
| Educational Attainment | In Labor Force | Unemployed |
| Less than High School | 53 (76.8%) | 0 (0.0%) |
| High School Diploma | 378 (54.6%) | 0 (0.0%) |
| College / Associate Degree | 816 (68.7%) | 39 (3.3%) |
| Bachelor's Degree or higher | 4,407 (87.5%) | 50 (1.0%) |
| Total | 5,652 (80.9%) | 91 (1.3%) |
Employment Occupations by Sex in Tega Cay
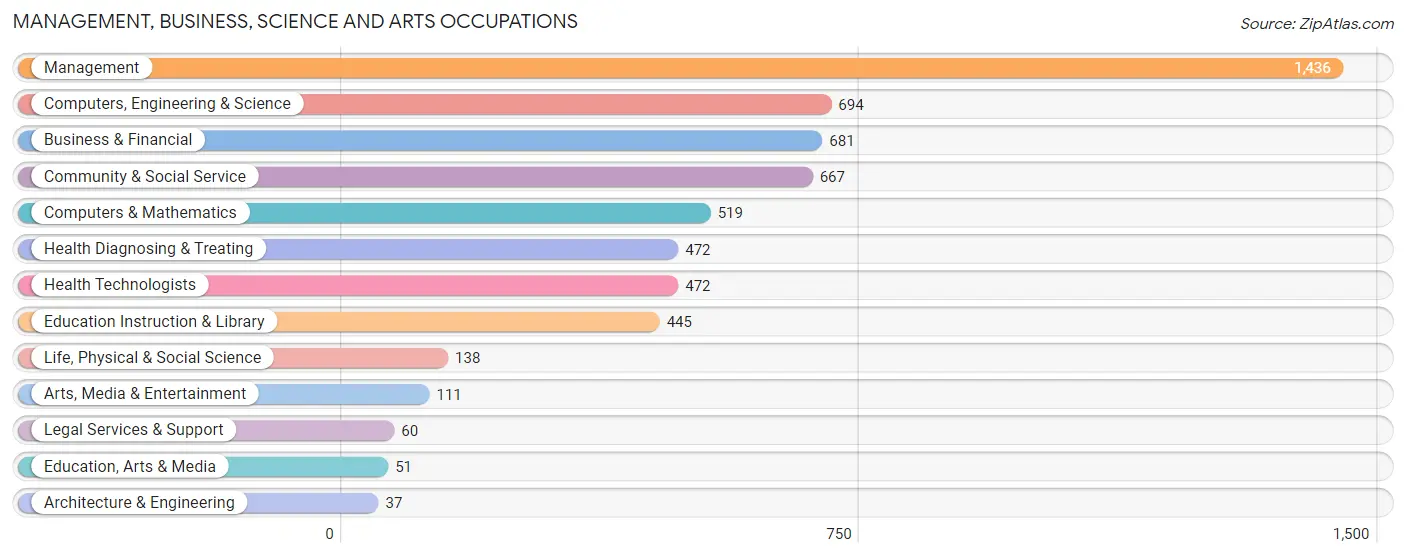
Management, Business, Science and Arts Occupations
The most common Management, Business, Science and Arts occupations in Tega Cay are Management (1,436 | 23.1%), Computers, Engineering & Science (694 | 11.2%), Business & Financial (681 | 11.0%), Community & Social Service (667 | 10.7%), and Computers & Mathematics (519 | 8.4%).
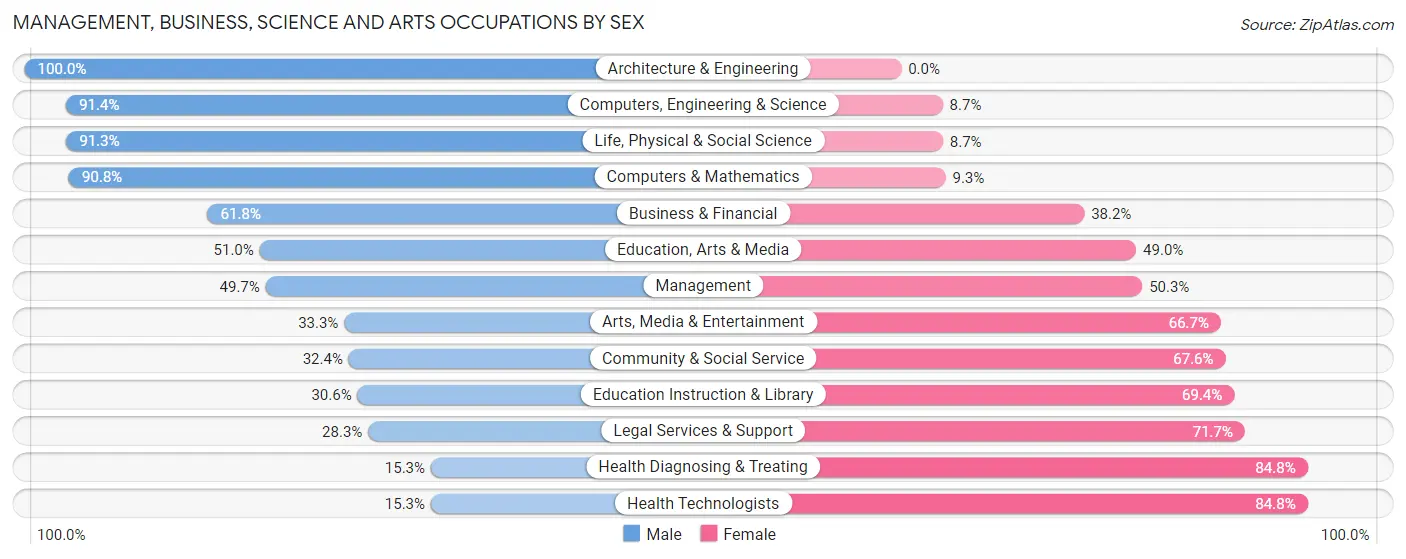
Management, Business, Science and Arts Occupations by Sex
Within the Management, Business, Science and Arts occupations in Tega Cay, the most male-oriented occupations are Architecture & Engineering (100.0%), Computers, Engineering & Science (91.3%), and Life, Physical & Social Science (91.3%), while the most female-oriented occupations are Health Diagnosing & Treating (84.8%), Health Technologists (84.8%), and Legal Services & Support (71.7%).
| Occupation | Male | Female |
| Management | 714 (49.7%) | 722 (50.3%) |
| Business & Financial | 421 (61.8%) | 260 (38.2%) |
| Computers, Engineering & Science | 634 (91.3%) | 60 (8.6%) |
| Computers & Mathematics | 471 (90.7%) | 48 (9.2%) |
| Architecture & Engineering | 37 (100.0%) | 0 (0.0%) |
| Life, Physical & Social Science | 126 (91.3%) | 12 (8.7%) |
| Community & Social Service | 216 (32.4%) | 451 (67.6%) |
| Education, Arts & Media | 26 (51.0%) | 25 (49.0%) |
| Legal Services & Support | 17 (28.3%) | 43 (71.7%) |
| Education Instruction & Library | 136 (30.6%) | 309 (69.4%) |
| Arts, Media & Entertainment | 37 (33.3%) | 74 (66.7%) |
| Health Diagnosing & Treating | 72 (15.2%) | 400 (84.8%) |
| Health Technologists | 72 (15.2%) | 400 (84.8%) |
| Total (Category) | 2,057 (52.1%) | 1,893 (47.9%) |
| Total (Overall) | 3,392 (54.6%) | 2,815 (45.4%) |
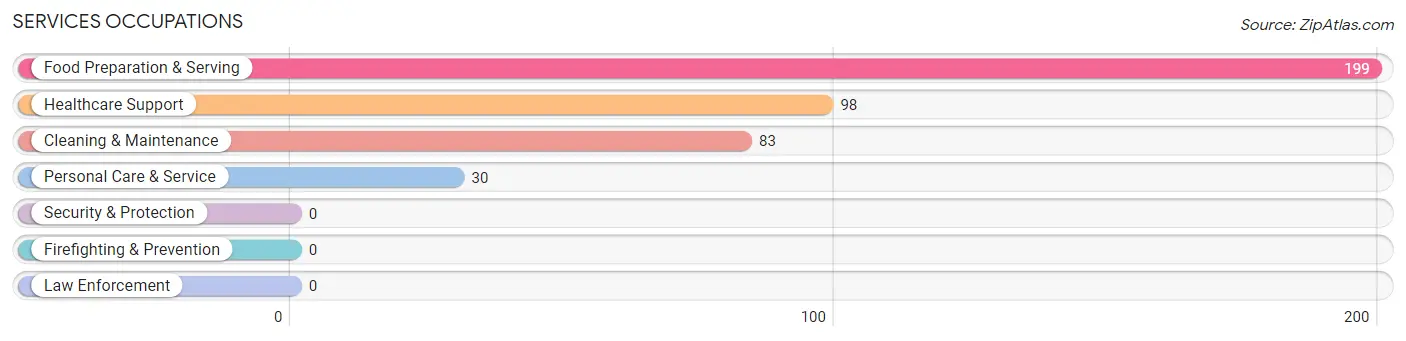
Services Occupations
The most common Services occupations in Tega Cay are Food Preparation & Serving (199 | 3.2%), Healthcare Support (98 | 1.6%), Cleaning & Maintenance (83 | 1.3%), and Personal Care & Service (30 | 0.5%).
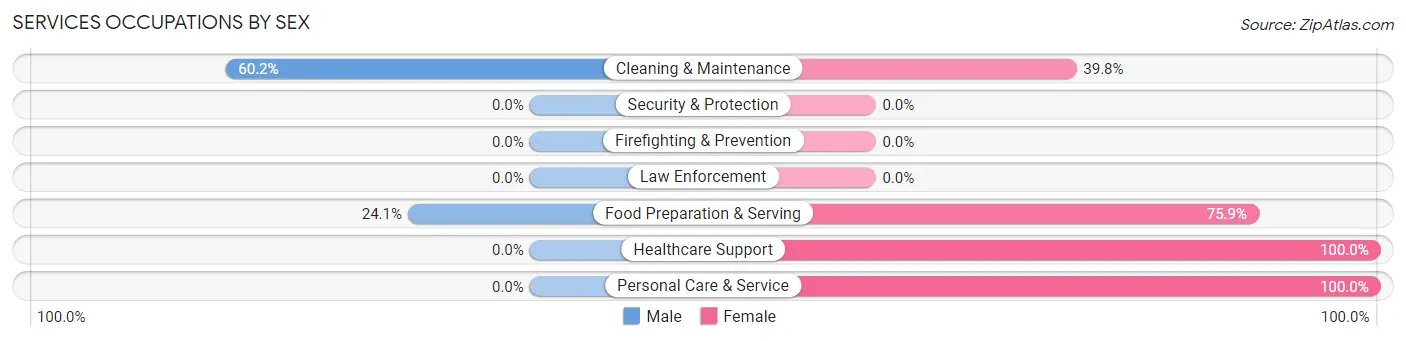
Services Occupations by Sex
Within the Services occupations in Tega Cay, the most male-oriented occupations are Cleaning & Maintenance (60.2%), and Food Preparation & Serving (24.1%), while the most female-oriented occupations are Healthcare Support (100.0%), Personal Care & Service (100.0%), and Food Preparation & Serving (75.9%).
| Occupation | Male | Female |
| Healthcare Support | 0 (0.0%) | 98 (100.0%) |
| Security & Protection | 0 (0.0%) | 0 (0.0%) |
| Firefighting & Prevention | 0 (0.0%) | 0 (0.0%) |
| Law Enforcement | 0 (0.0%) | 0 (0.0%) |
| Food Preparation & Serving | 48 (24.1%) | 151 (75.9%) |
| Cleaning & Maintenance | 50 (60.2%) | 33 (39.8%) |
| Personal Care & Service | 0 (0.0%) | 30 (100.0%) |
| Total (Category) | 98 (23.9%) | 312 (76.1%) |
| Total (Overall) | 3,392 (54.6%) | 2,815 (45.4%) |
Sales and Office Occupations
The most common Sales and Office occupations in Tega Cay are Sales & Related (663 | 10.7%), and Office & Administration (472 | 7.6%).

Sales and Office Occupations by Sex

| Occupation | Male | Female |
| Sales & Related | 361 (54.4%) | 302 (45.6%) |
| Office & Administration | 212 (44.9%) | 260 (55.1%) |
| Total (Category) | 573 (50.5%) | 562 (49.5%) |
| Total (Overall) | 3,392 (54.6%) | 2,815 (45.4%) |
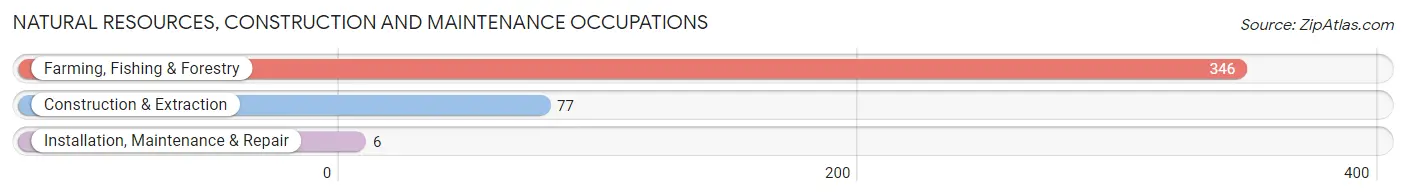
Natural Resources, Construction and Maintenance Occupations
The most common Natural Resources, Construction and Maintenance occupations in Tega Cay are Farming, Fishing & Forestry (346 | 5.6%), Construction & Extraction (77 | 1.2%), and Installation, Maintenance & Repair (6 | 0.1%).
Natural Resources, Construction and Maintenance Occupations by Sex
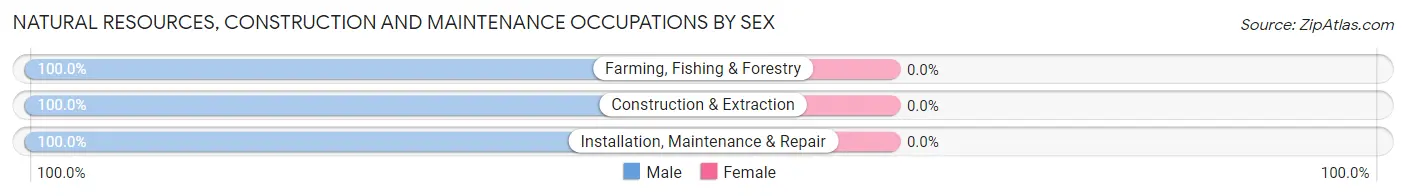
| Occupation | Male | Female |
| Farming, Fishing & Forestry | 346 (100.0%) | 0 (0.0%) |
| Construction & Extraction | 77 (100.0%) | 0 (0.0%) |
| Installation, Maintenance & Repair | 6 (100.0%) | 0 (0.0%) |
| Total (Category) | 429 (100.0%) | 0 (0.0%) |
| Total (Overall) | 3,392 (54.6%) | 2,815 (45.4%) |
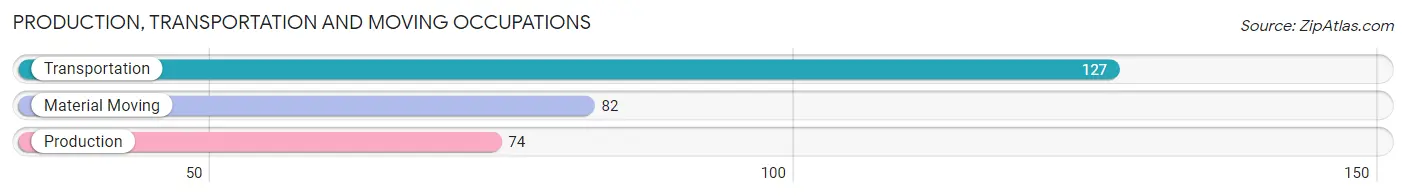
Production, Transportation and Moving Occupations
The most common Production, Transportation and Moving occupations in Tega Cay are Transportation (127 | 2.1%), Material Moving (82 | 1.3%), and Production (74 | 1.2%).
Production, Transportation and Moving Occupations by Sex
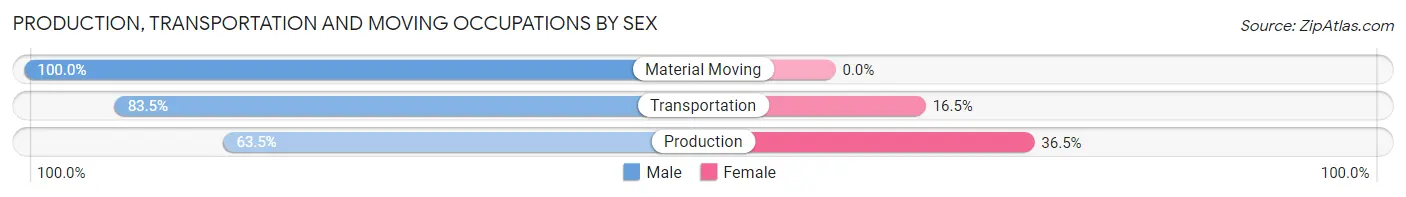
| Occupation | Male | Female |
| Production | 47 (63.5%) | 27 (36.5%) |
| Transportation | 106 (83.5%) | 21 (16.5%) |
| Material Moving | 82 (100.0%) | 0 (0.0%) |
| Total (Category) | 235 (83.0%) | 48 (17.0%) |
| Total (Overall) | 3,392 (54.6%) | 2,815 (45.4%) |
Employment Industries by Sex in Tega Cay
Employment Industries in Tega Cay
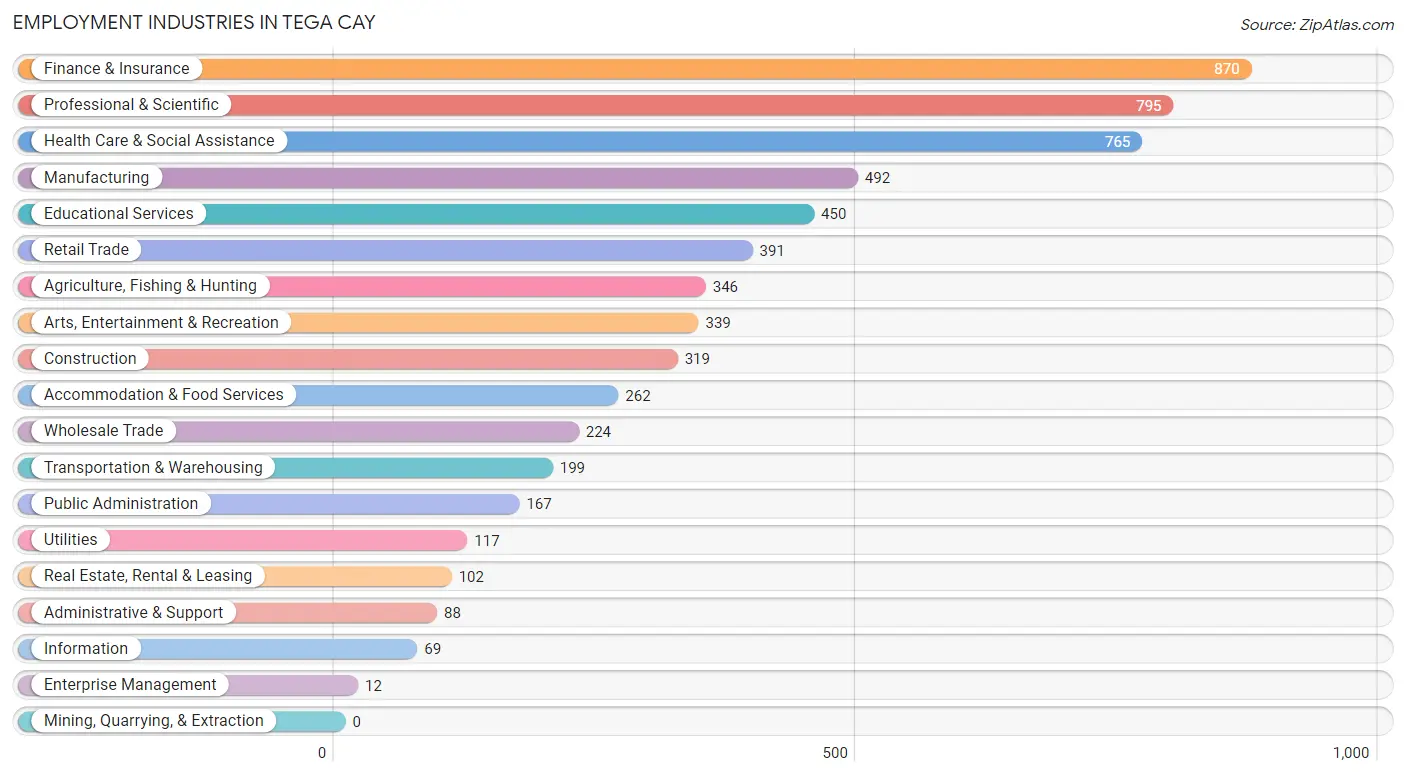
The major employment industries in Tega Cay include Finance & Insurance (870 | 14.0%), Professional & Scientific (795 | 12.8%), Health Care & Social Assistance (765 | 12.3%), Manufacturing (492 | 7.9%), and Educational Services (450 | 7.2%).
Employment Industries by Sex in Tega Cay
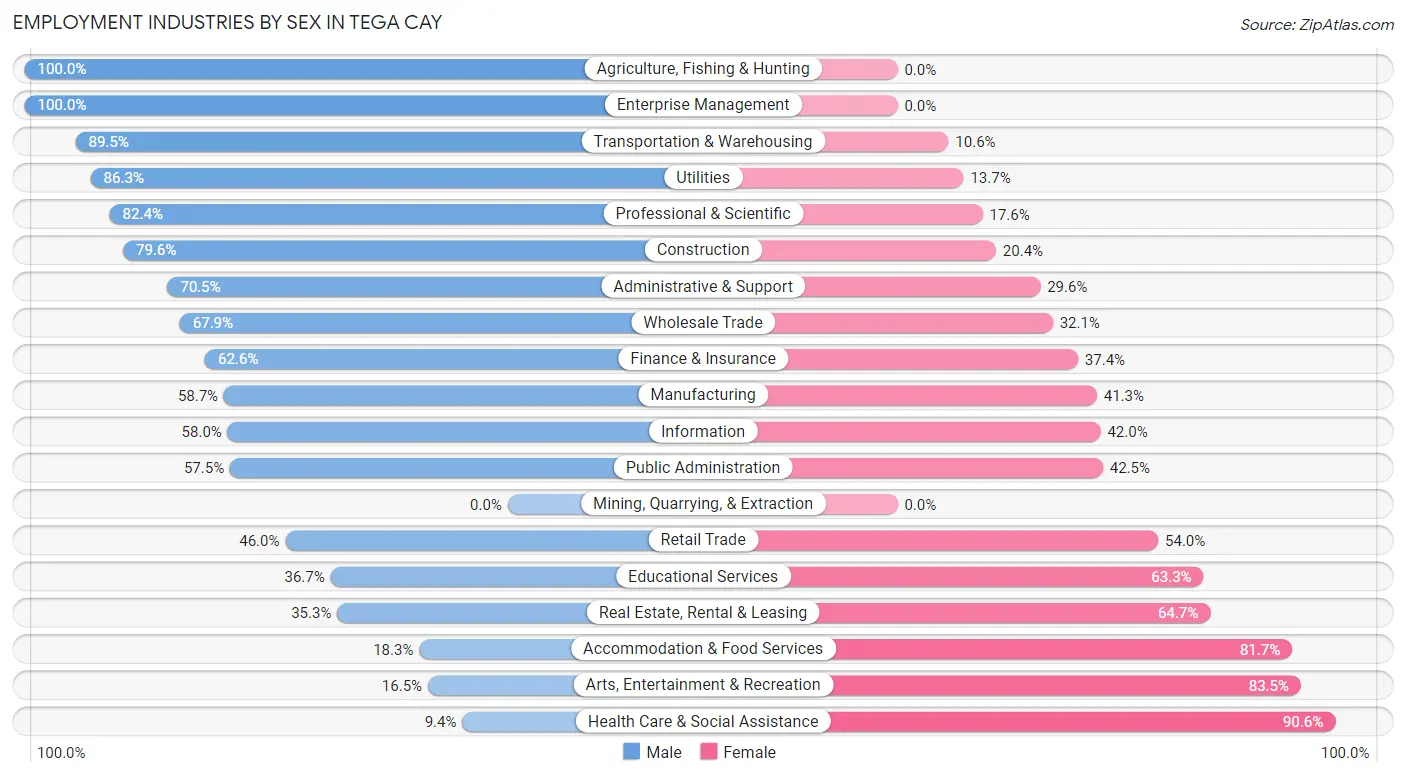
The Tega Cay industries that see more men than women are Agriculture, Fishing & Hunting (100.0%), Enterprise Management (100.0%), and Transportation & Warehousing (89.4%), whereas the industries that tend to have a higher number of women are Health Care & Social Assistance (90.6%), Arts, Entertainment & Recreation (83.5%), and Accommodation & Food Services (81.7%).
| Industry | Male | Female |
| Agriculture, Fishing & Hunting | 346 (100.0%) | 0 (0.0%) |
| Mining, Quarrying, & Extraction | 0 (0.0%) | 0 (0.0%) |
| Construction | 254 (79.6%) | 65 (20.4%) |
| Manufacturing | 289 (58.7%) | 203 (41.3%) |
| Wholesale Trade | 152 (67.9%) | 72 (32.1%) |
| Retail Trade | 180 (46.0%) | 211 (54.0%) |
| Transportation & Warehousing | 178 (89.4%) | 21 (10.5%) |
| Utilities | 101 (86.3%) | 16 (13.7%) |
| Information | 40 (58.0%) | 29 (42.0%) |
| Finance & Insurance | 545 (62.6%) | 325 (37.4%) |
| Real Estate, Rental & Leasing | 36 (35.3%) | 66 (64.7%) |
| Professional & Scientific | 655 (82.4%) | 140 (17.6%) |
| Enterprise Management | 12 (100.0%) | 0 (0.0%) |
| Administrative & Support | 62 (70.5%) | 26 (29.5%) |
| Educational Services | 165 (36.7%) | 285 (63.3%) |
| Health Care & Social Assistance | 72 (9.4%) | 693 (90.6%) |
| Arts, Entertainment & Recreation | 56 (16.5%) | 283 (83.5%) |
| Accommodation & Food Services | 48 (18.3%) | 214 (81.7%) |
| Public Administration | 96 (57.5%) | 71 (42.5%) |
| Total | 3,392 (54.6%) | 2,815 (45.4%) |
Education in Tega Cay
School Enrollment in Tega Cay
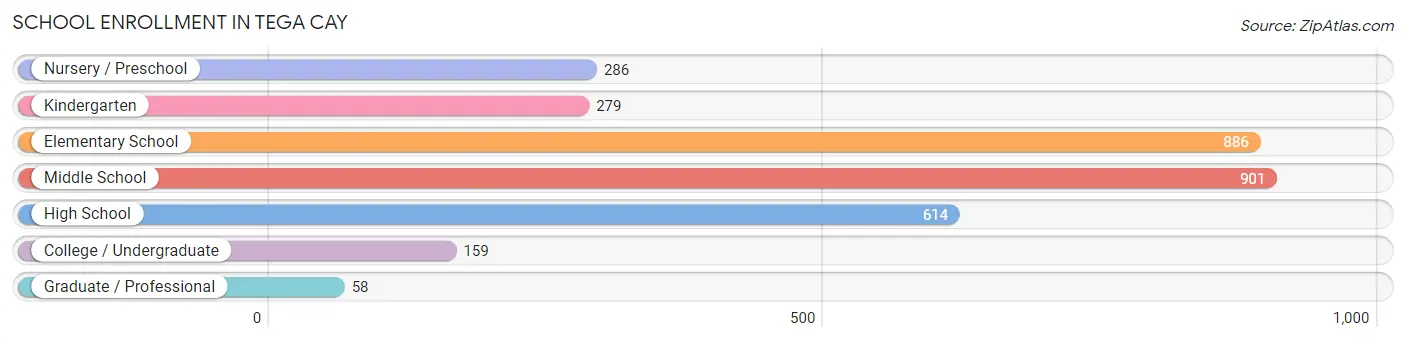
The most common levels of schooling among the 3,183 students in Tega Cay are middle school (901 | 28.3%), elementary school (886 | 27.8%), and high school (614 | 19.3%).
| School Level | # Students | % Students |
| Nursery / Preschool | 286 | 9.0% |
| Kindergarten | 279 | 8.8% |
| Elementary School | 886 | 27.8% |
| Middle School | 901 | 28.3% |
| High School | 614 | 19.3% |
| College / Undergraduate | 159 | 5.0% |
| Graduate / Professional | 58 | 1.8% |
| Total | 3,183 | 100.0% |
School Enrollment by Age by Funding Source in Tega Cay
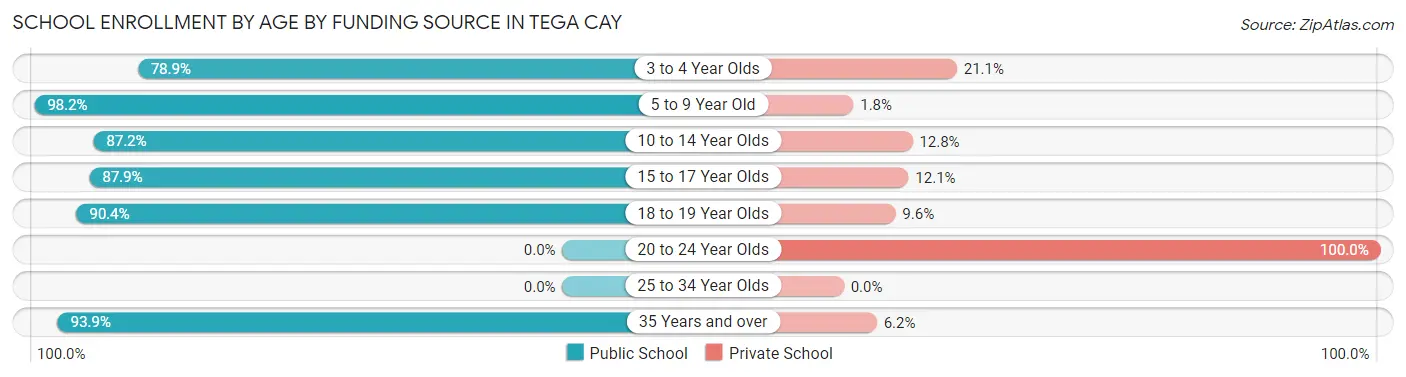
Out of a total of 3,183 students who are enrolled in schools in Tega Cay, 325 (10.2%) attend a private institution, while the remaining 2,858 (89.8%) are enrolled in public schools. The age group of 20 to 24 year olds has the highest likelihood of being enrolled in private schools, with 14 (100.0% in the age bracket) enrolled. Conversely, the age group of 5 to 9 year old has the lowest likelihood of being enrolled in a private school, with 934 (98.2% in the age bracket) attending a public institution.
| Age Bracket | Public School | Private School |
| 3 to 4 Year Olds | 266 (78.9%) | 71 (21.1%) |
| 5 to 9 Year Old | 934 (98.2%) | 17 (1.8%) |
| 10 to 14 Year Olds | 1,014 (87.2%) | 149 (12.8%) |
| 15 to 17 Year Olds | 401 (87.9%) | 55 (12.1%) |
| 18 to 19 Year Olds | 75 (90.4%) | 8 (9.6%) |
| 20 to 24 Year Olds | 0 (0.0%) | 14 (100.0%) |
| 25 to 34 Year Olds | 0 (0.0%) | 0 (0.0%) |
| 35 Years and over | 168 (93.9%) | 11 (6.1%) |
| Total | 2,858 (89.8%) | 325 (10.2%) |
Educational Attainment by Field of Study in Tega Cay
Business (2,600 | 37.9%), education (688 | 10.0%), computers & mathematics (636 | 9.3%), social sciences (555 | 8.1%), and communications (423 | 6.2%) are the most common fields of study among 6,859 individuals in Tega Cay who have obtained a bachelor's degree or higher.
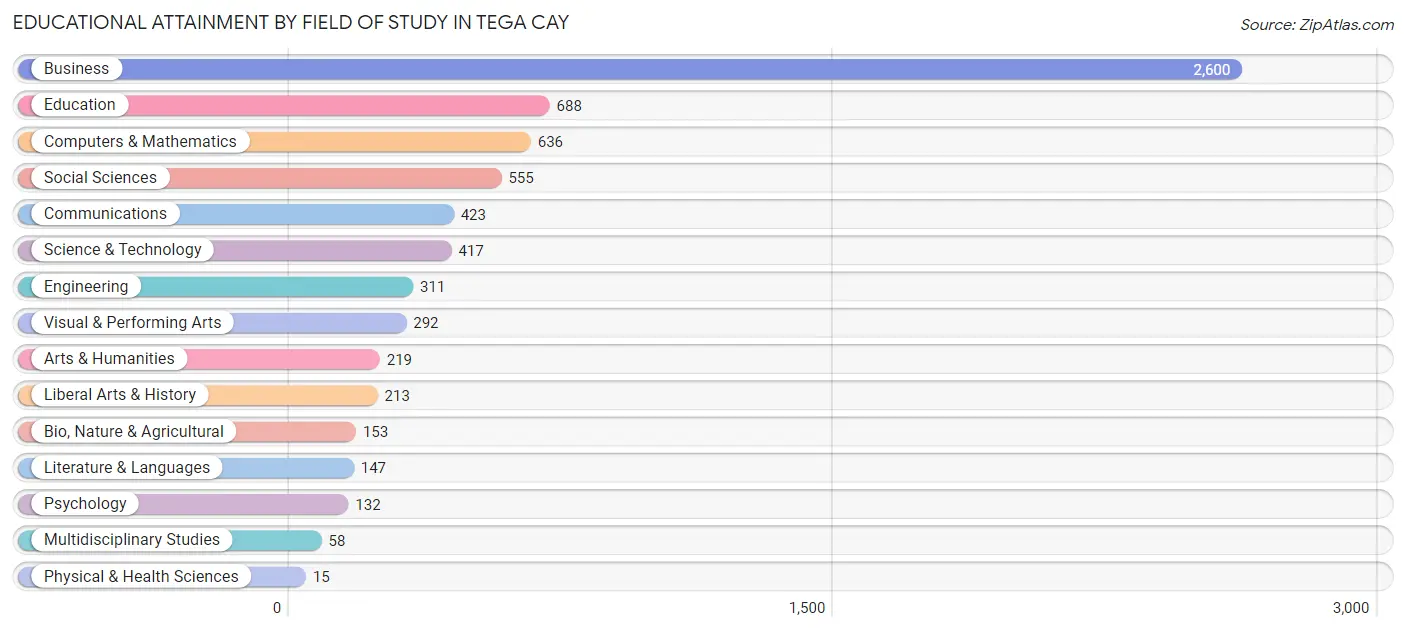
| Field of Study | # Graduates | % Graduates |
| Computers & Mathematics | 636 | 9.3% |
| Bio, Nature & Agricultural | 153 | 2.2% |
| Physical & Health Sciences | 15 | 0.2% |
| Psychology | 132 | 1.9% |
| Social Sciences | 555 | 8.1% |
| Engineering | 311 | 4.5% |
| Multidisciplinary Studies | 58 | 0.9% |
| Science & Technology | 417 | 6.1% |
| Business | 2,600 | 37.9% |
| Education | 688 | 10.0% |
| Literature & Languages | 147 | 2.1% |
| Liberal Arts & History | 213 | 3.1% |
| Visual & Performing Arts | 292 | 4.3% |
| Communications | 423 | 6.2% |
| Arts & Humanities | 219 | 3.2% |
| Total | 6,859 | 100.0% |
Transportation & Commute in Tega Cay
Vehicle Availability by Sex in Tega Cay
The most prevalent vehicle ownership categories in Tega Cay are males with 2 vehicles (2,050, accounting for 62.0%) and females with 2 vehicles (1,578, making up 73.6%).
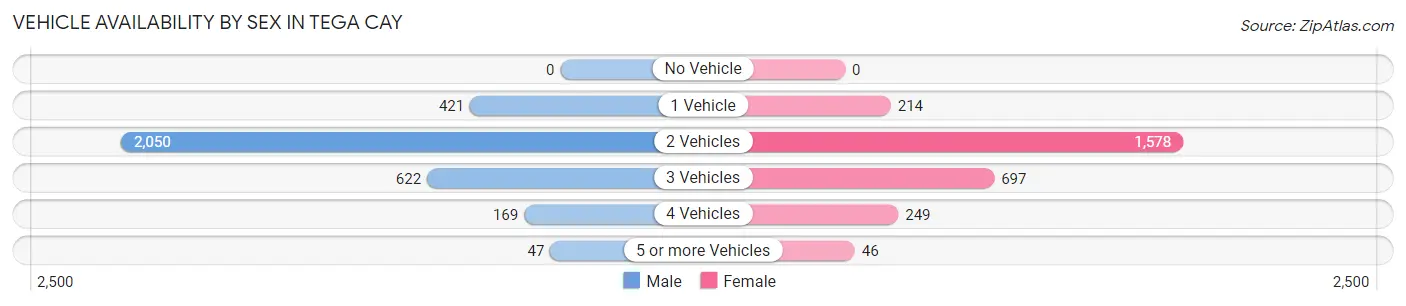
| Vehicles Available | Male | Female |
| No Vehicle | 0 (0.0%) | 0 (0.0%) |
| 1 Vehicle | 421 (12.7%) | 214 (7.7%) |
| 2 Vehicles | 2,050 (62.0%) | 1,578 (56.7%) |
| 3 Vehicles | 622 (18.8%) | 697 (25.0%) |
| 4 Vehicles | 169 (5.1%) | 249 (8.9%) |
| 5 or more Vehicles | 47 (1.4%) | 46 (1.7%) |
| Total | 3,309 (100.0%) | 2,784 (100.0%) |
Commute Time in Tega Cay
The most frequently occuring commute durations in Tega Cay are 15 to 19 minutes (835 commuters, 17.5%), 45 to 59 minutes (796 commuters, 16.7%), and 30 to 34 minutes (760 commuters, 15.9%).
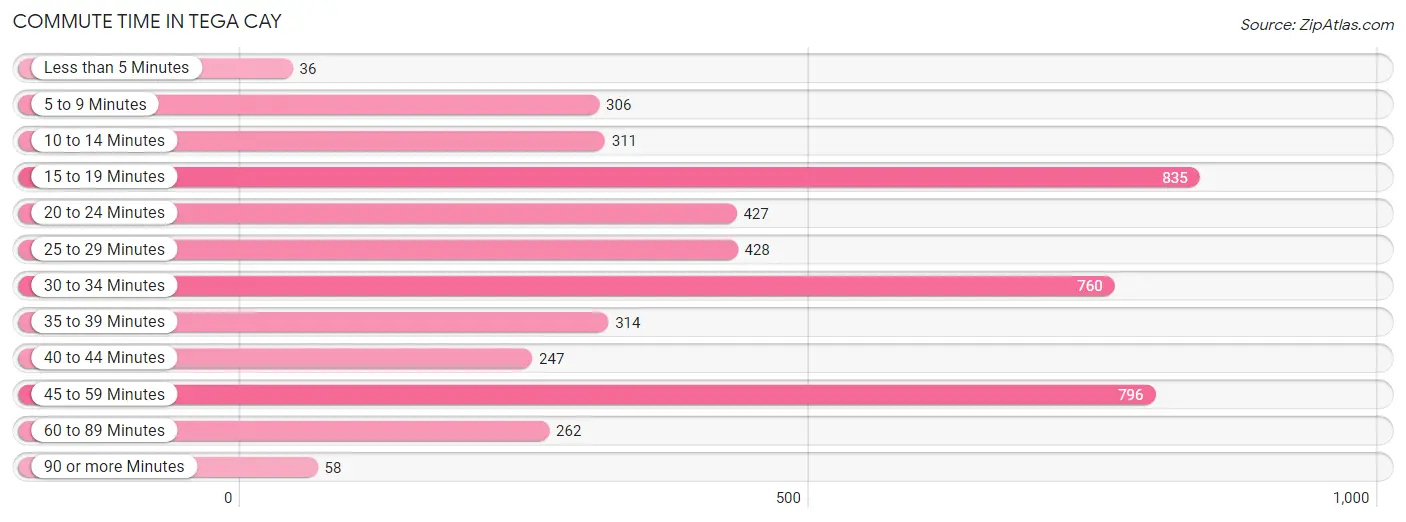
| Commute Time | # Commuters | % Commuters |
| Less than 5 Minutes | 36 | 0.7% |
| 5 to 9 Minutes | 306 | 6.4% |
| 10 to 14 Minutes | 311 | 6.5% |
| 15 to 19 Minutes | 835 | 17.5% |
| 20 to 24 Minutes | 427 | 8.9% |
| 25 to 29 Minutes | 428 | 8.9% |
| 30 to 34 Minutes | 760 | 15.9% |
| 35 to 39 Minutes | 314 | 6.6% |
| 40 to 44 Minutes | 247 | 5.2% |
| 45 to 59 Minutes | 796 | 16.7% |
| 60 to 89 Minutes | 262 | 5.5% |
| 90 or more Minutes | 58 | 1.2% |
Commute Time by Sex in Tega Cay
The most common commute times in Tega Cay are 15 to 19 minutes (680 commuters, 26.3%) for males and 45 to 59 minutes (537 commuters, 24.4%) for females.
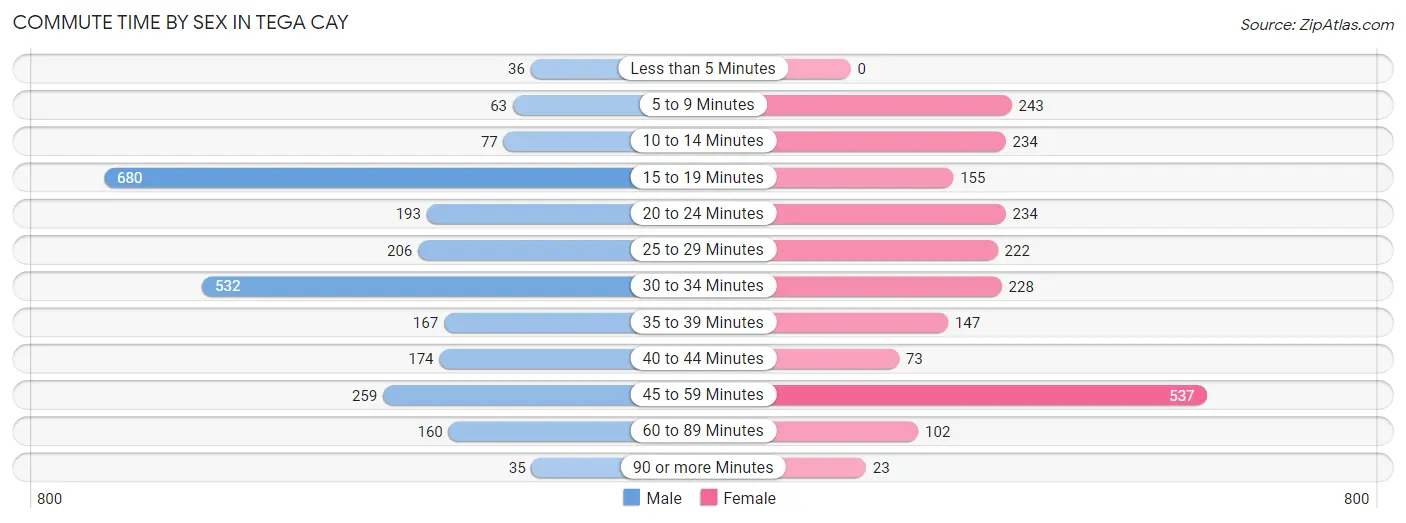
| Commute Time | Male | Female |
| Less than 5 Minutes | 36 (1.4%) | 0 (0.0%) |
| 5 to 9 Minutes | 63 (2.4%) | 243 (11.1%) |
| 10 to 14 Minutes | 77 (3.0%) | 234 (10.6%) |
| 15 to 19 Minutes | 680 (26.3%) | 155 (7.0%) |
| 20 to 24 Minutes | 193 (7.5%) | 234 (10.6%) |
| 25 to 29 Minutes | 206 (8.0%) | 222 (10.1%) |
| 30 to 34 Minutes | 532 (20.6%) | 228 (10.4%) |
| 35 to 39 Minutes | 167 (6.5%) | 147 (6.7%) |
| 40 to 44 Minutes | 174 (6.7%) | 73 (3.3%) |
| 45 to 59 Minutes | 259 (10.0%) | 537 (24.4%) |
| 60 to 89 Minutes | 160 (6.2%) | 102 (4.6%) |
| 90 or more Minutes | 35 (1.4%) | 23 (1.1%) |
Time of Departure to Work by Sex in Tega Cay
The most frequent times of departure to work in Tega Cay are 6:30 AM to 6:59 AM (627, 24.3%) for males and 9:00 AM to 9:59 AM (361, 16.4%) for females.
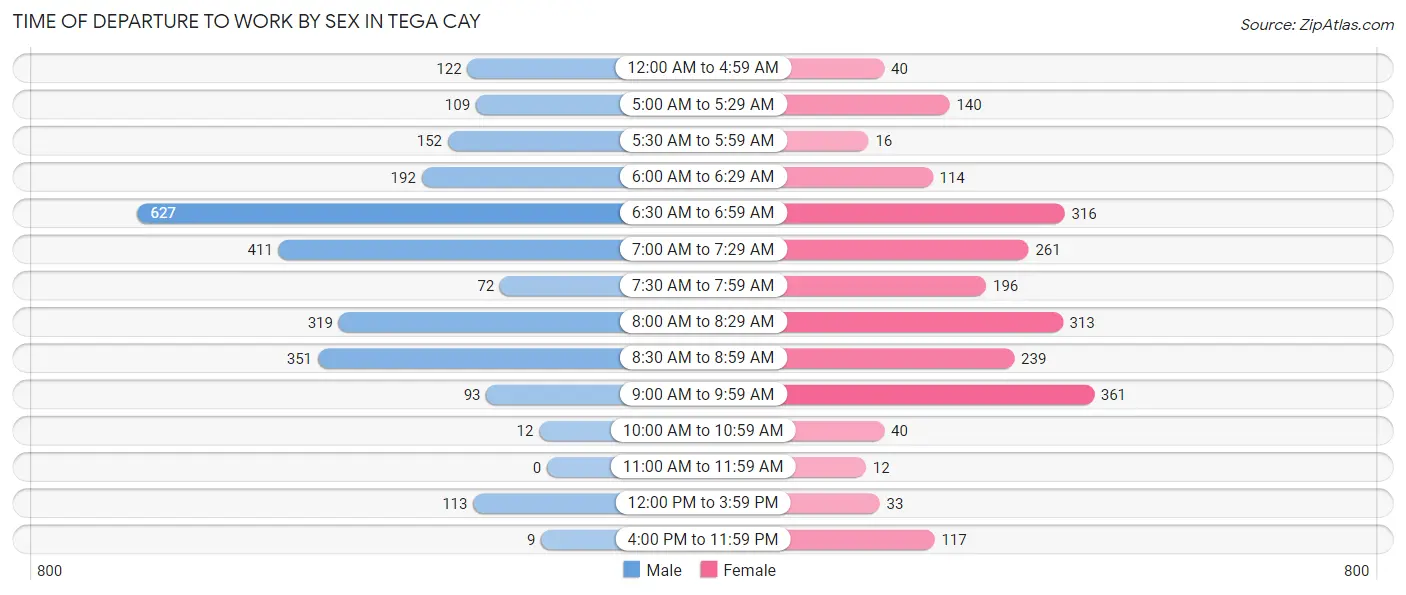
| Time of Departure | Male | Female |
| 12:00 AM to 4:59 AM | 122 (4.7%) | 40 (1.8%) |
| 5:00 AM to 5:29 AM | 109 (4.2%) | 140 (6.4%) |
| 5:30 AM to 5:59 AM | 152 (5.9%) | 16 (0.7%) |
| 6:00 AM to 6:29 AM | 192 (7.4%) | 114 (5.2%) |
| 6:30 AM to 6:59 AM | 627 (24.3%) | 316 (14.4%) |
| 7:00 AM to 7:29 AM | 411 (15.9%) | 261 (11.9%) |
| 7:30 AM to 7:59 AM | 72 (2.8%) | 196 (8.9%) |
| 8:00 AM to 8:29 AM | 319 (12.3%) | 313 (14.2%) |
| 8:30 AM to 8:59 AM | 351 (13.6%) | 239 (10.9%) |
| 9:00 AM to 9:59 AM | 93 (3.6%) | 361 (16.4%) |
| 10:00 AM to 10:59 AM | 12 (0.5%) | 40 (1.8%) |
| 11:00 AM to 11:59 AM | 0 (0.0%) | 12 (0.5%) |
| 12:00 PM to 3:59 PM | 113 (4.4%) | 33 (1.5%) |
| 4:00 PM to 11:59 PM | 9 (0.4%) | 117 (5.3%) |
| Total | 2,582 (100.0%) | 2,198 (100.0%) |
Housing Occupancy in Tega Cay
Occupancy by Ownership in Tega Cay
Of the total 4,729 dwellings in Tega Cay, owner-occupied units account for 4,095 (86.6%), while renter-occupied units make up 634 (13.4%).
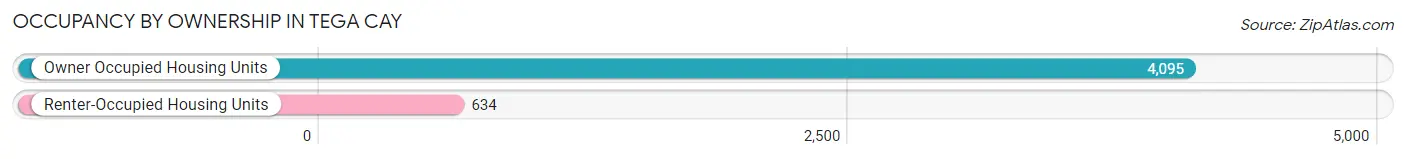
| Occupancy | # Housing Units | % Housing Units |
| Owner Occupied Housing Units | 4,095 | 86.6% |
| Renter-Occupied Housing Units | 634 | 13.4% |
| Total Occupied Housing Units | 4,729 | 100.0% |
Occupancy by Household Size in Tega Cay
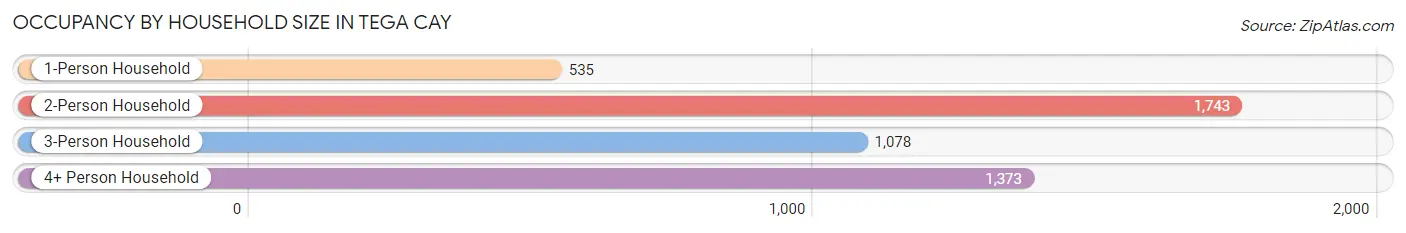
| Household Size | # Housing Units | % Housing Units |
| 1-Person Household | 535 | 11.3% |
| 2-Person Household | 1,743 | 36.9% |
| 3-Person Household | 1,078 | 22.8% |
| 4+ Person Household | 1,373 | 29.0% |
| Total Housing Units | 4,729 | 100.0% |
Occupancy by Ownership by Household Size in Tega Cay
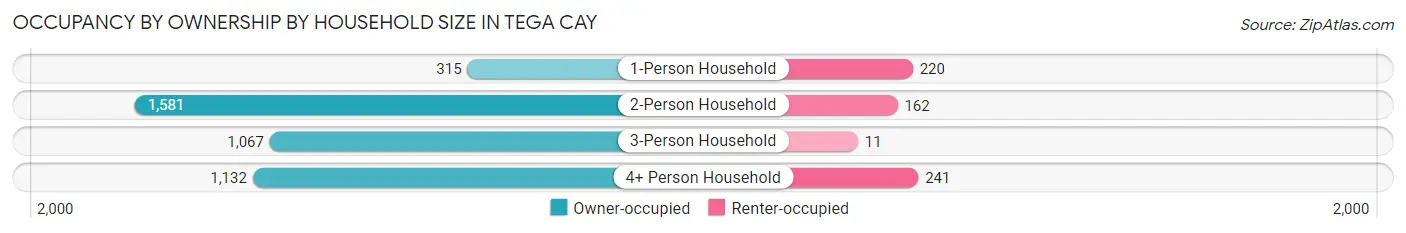
| Household Size | Owner-occupied | Renter-occupied |
| 1-Person Household | 315 (58.9%) | 220 (41.1%) |
| 2-Person Household | 1,581 (90.7%) | 162 (9.3%) |
| 3-Person Household | 1,067 (99.0%) | 11 (1.0%) |
| 4+ Person Household | 1,132 (82.5%) | 241 (17.5%) |
| Total Housing Units | 4,095 (86.6%) | 634 (13.4%) |
Occupancy by Educational Attainment in Tega Cay
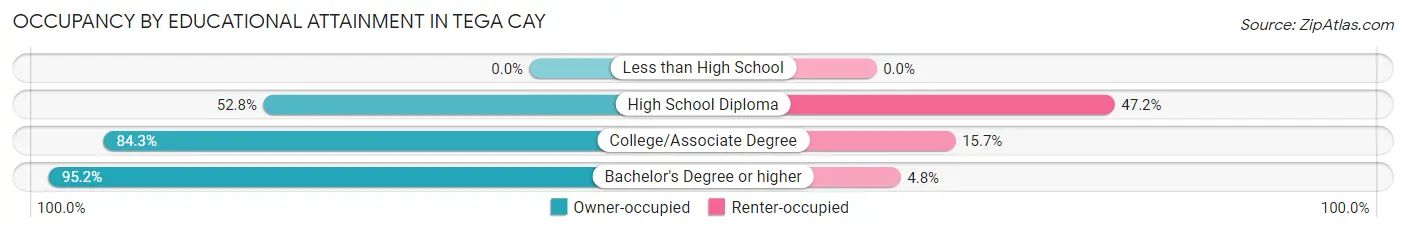
| Household Size | Owner-occupied | Renter-occupied |
| Less than High School | 0 (0.0%) | 0 (0.0%) |
| High School Diploma | 362 (52.8%) | 324 (47.2%) |
| College/Associate Degree | 899 (84.3%) | 167 (15.7%) |
| Bachelor's Degree or higher | 2,834 (95.2%) | 143 (4.8%) |
Occupancy by Age of Householder in Tega Cay
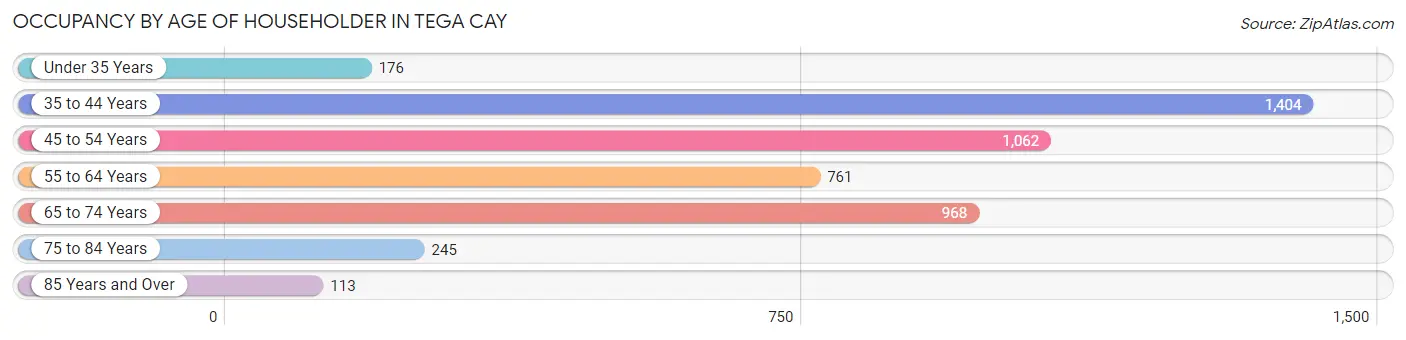
| Age Bracket | # Households | % Households |
| Under 35 Years | 176 | 3.7% |
| 35 to 44 Years | 1,404 | 29.7% |
| 45 to 54 Years | 1,062 | 22.5% |
| 55 to 64 Years | 761 | 16.1% |
| 65 to 74 Years | 968 | 20.5% |
| 75 to 84 Years | 245 | 5.2% |
| 85 Years and Over | 113 | 2.4% |
| Total | 4,729 | 100.0% |
Housing Finances in Tega Cay
Median Income by Occupancy in Tega Cay
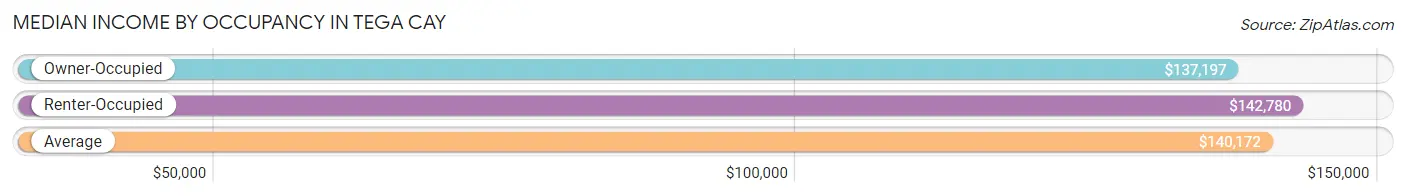
| Occupancy Type | # Households | Median Income |
| Owner-Occupied | 4,095 (86.6%) | $137,197 |
| Renter-Occupied | 634 (13.4%) | $142,780 |
| Average | 4,729 (100.0%) | $140,172 |
Occupancy by Householder Income Bracket in Tega Cay
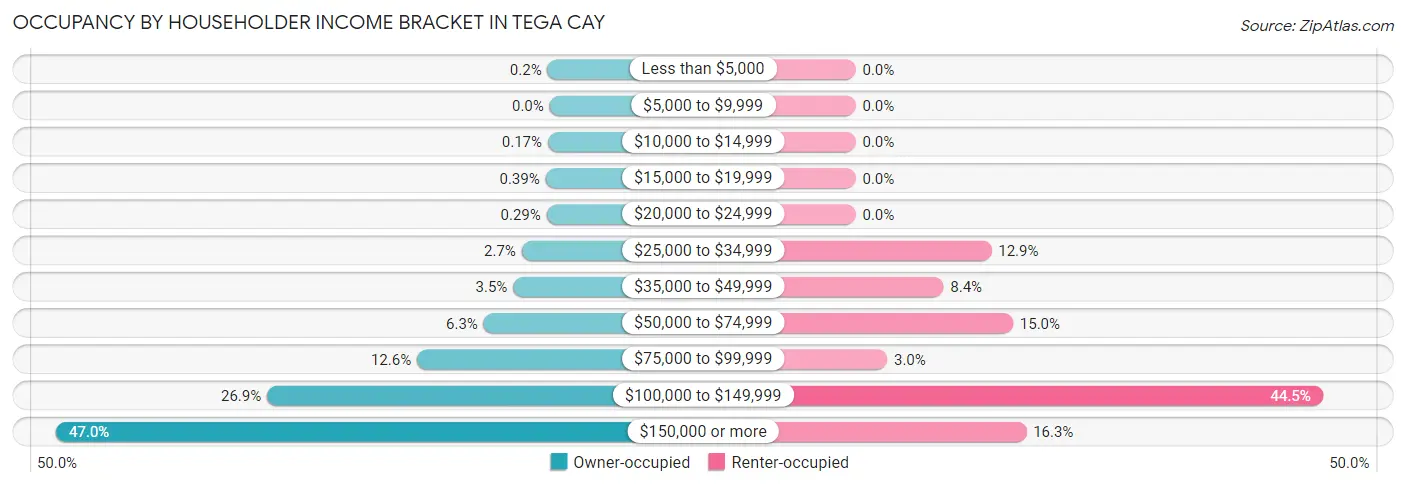
| Income Bracket | Owner-occupied | Renter-occupied |
| Less than $5,000 | 8 (0.2%) | 0 (0.0%) |
| $5,000 to $9,999 | 0 (0.0%) | 0 (0.0%) |
| $10,000 to $14,999 | 7 (0.2%) | 0 (0.0%) |
| $15,000 to $19,999 | 16 (0.4%) | 0 (0.0%) |
| $20,000 to $24,999 | 12 (0.3%) | 0 (0.0%) |
| $25,000 to $34,999 | 109 (2.7%) | 82 (12.9%) |
| $35,000 to $49,999 | 142 (3.5%) | 53 (8.4%) |
| $50,000 to $74,999 | 257 (6.3%) | 95 (15.0%) |
| $75,000 to $99,999 | 517 (12.6%) | 19 (3.0%) |
| $100,000 to $149,999 | 1,102 (26.9%) | 282 (44.5%) |
| $150,000 or more | 1,925 (47.0%) | 103 (16.3%) |
| Total | 4,095 (100.0%) | 634 (100.0%) |
Monthly Housing Cost Tiers in Tega Cay
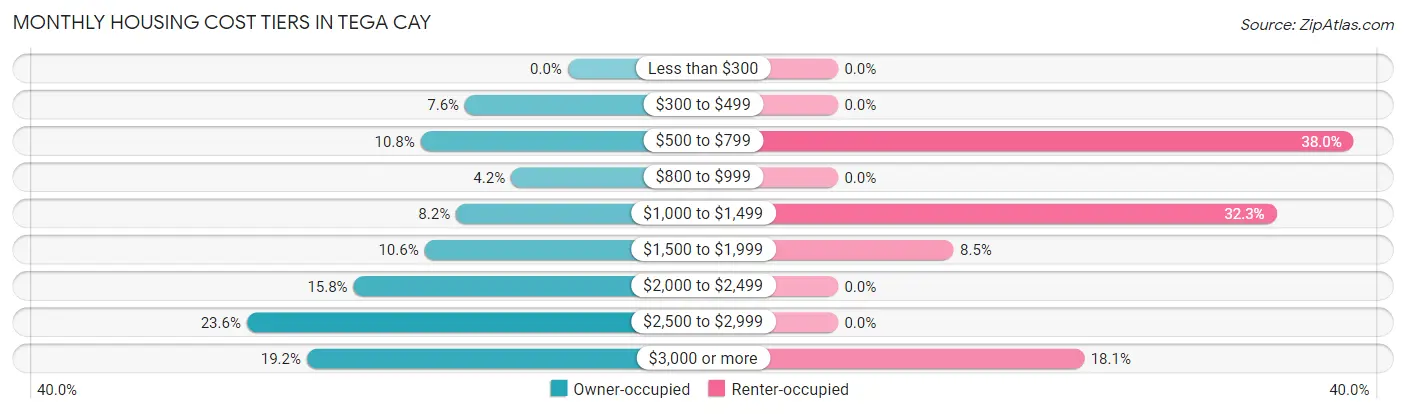
| Monthly Cost | Owner-occupied | Renter-occupied |
| Less than $300 | 0 (0.0%) | 0 (0.0%) |
| $300 to $499 | 310 (7.6%) | 0 (0.0%) |
| $500 to $799 | 444 (10.8%) | 241 (38.0%) |
| $800 to $999 | 171 (4.2%) | 0 (0.0%) |
| $1,000 to $1,499 | 337 (8.2%) | 205 (32.3%) |
| $1,500 to $1,999 | 432 (10.5%) | 54 (8.5%) |
| $2,000 to $2,499 | 646 (15.8%) | 0 (0.0%) |
| $2,500 to $2,999 | 968 (23.6%) | 0 (0.0%) |
| $3,000 or more | 787 (19.2%) | 115 (18.1%) |
| Total | 4,095 (100.0%) | 634 (100.0%) |
Physical Housing Characteristics in Tega Cay
Housing Structures in Tega Cay
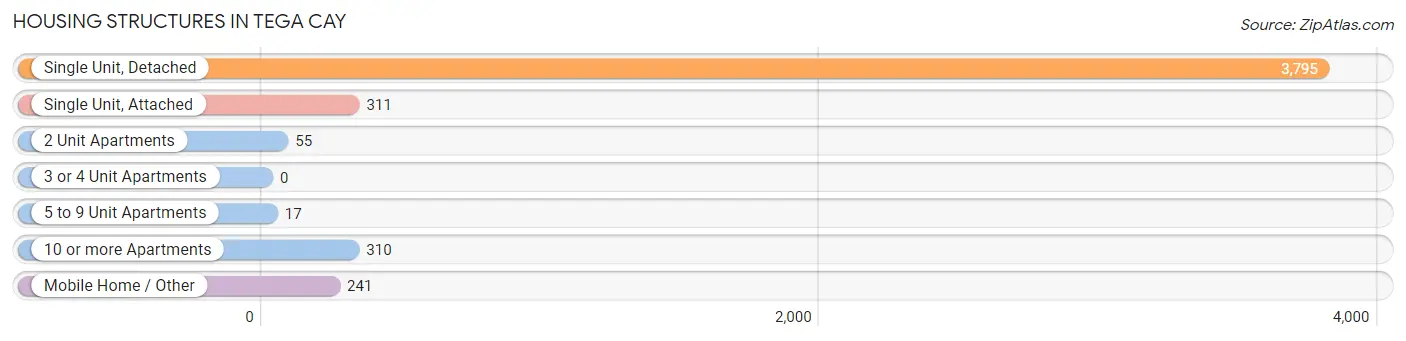
| Structure Type | # Housing Units | % Housing Units |
| Single Unit, Detached | 3,795 | 80.2% |
| Single Unit, Attached | 311 | 6.6% |
| 2 Unit Apartments | 55 | 1.2% |
| 3 or 4 Unit Apartments | 0 | 0.0% |
| 5 to 9 Unit Apartments | 17 | 0.4% |
| 10 or more Apartments | 310 | 6.6% |
| Mobile Home / Other | 241 | 5.1% |
| Total | 4,729 | 100.0% |
Housing Structures by Occupancy in Tega Cay
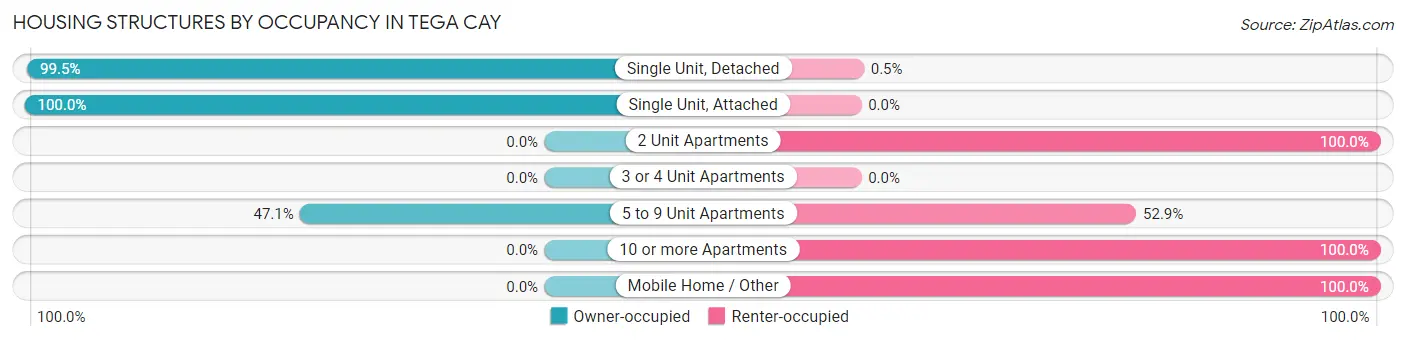
| Structure Type | Owner-occupied | Renter-occupied |
| Single Unit, Detached | 3,776 (99.5%) | 19 (0.5%) |
| Single Unit, Attached | 311 (100.0%) | 0 (0.0%) |
| 2 Unit Apartments | 0 (0.0%) | 55 (100.0%) |
| 3 or 4 Unit Apartments | 0 (0.0%) | 0 (0.0%) |
| 5 to 9 Unit Apartments | 8 (47.1%) | 9 (52.9%) |
| 10 or more Apartments | 0 (0.0%) | 310 (100.0%) |
| Mobile Home / Other | 0 (0.0%) | 241 (100.0%) |
| Total | 4,095 (86.6%) | 634 (13.4%) |
Housing Structures by Number of Rooms in Tega Cay
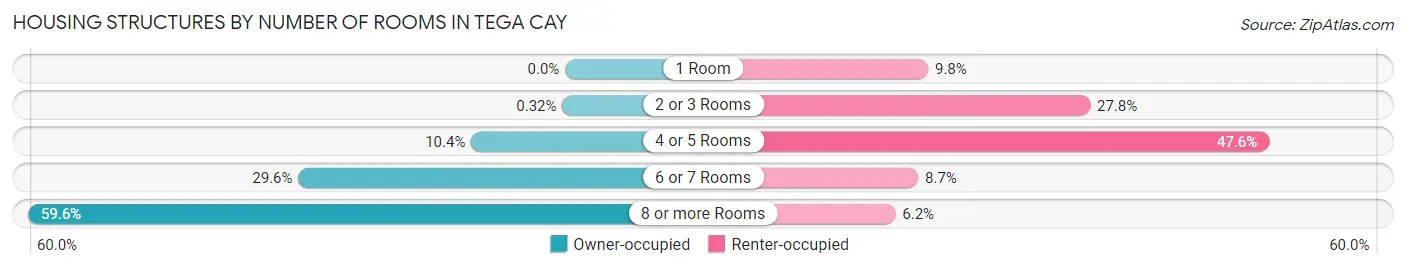
| Number of Rooms | Owner-occupied | Renter-occupied |
| 1 Room | 0 (0.0%) | 62 (9.8%) |
| 2 or 3 Rooms | 13 (0.3%) | 176 (27.8%) |
| 4 or 5 Rooms | 427 (10.4%) | 302 (47.6%) |
| 6 or 7 Rooms | 1,213 (29.6%) | 55 (8.7%) |
| 8 or more Rooms | 2,442 (59.6%) | 39 (6.1%) |
| Total | 4,095 (100.0%) | 634 (100.0%) |
Housing Structure by Heating Type in Tega Cay
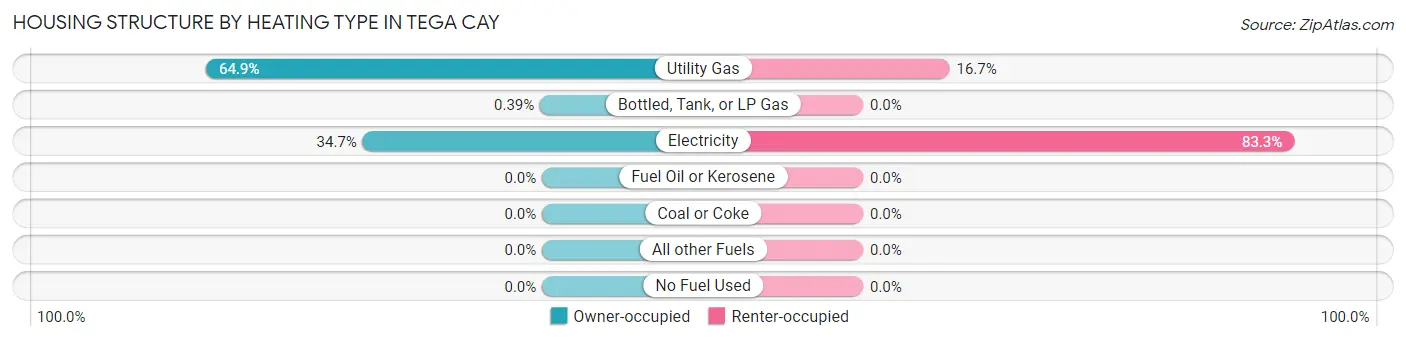
| Heating Type | Owner-occupied | Renter-occupied |
| Utility Gas | 2,659 (64.9%) | 106 (16.7%) |
| Bottled, Tank, or LP Gas | 16 (0.4%) | 0 (0.0%) |
| Electricity | 1,420 (34.7%) | 528 (83.3%) |
| Fuel Oil or Kerosene | 0 (0.0%) | 0 (0.0%) |
| Coal or Coke | 0 (0.0%) | 0 (0.0%) |
| All other Fuels | 0 (0.0%) | 0 (0.0%) |
| No Fuel Used | 0 (0.0%) | 0 (0.0%) |
| Total | 4,095 (100.0%) | 634 (100.0%) |
Household Vehicle Usage in Tega Cay
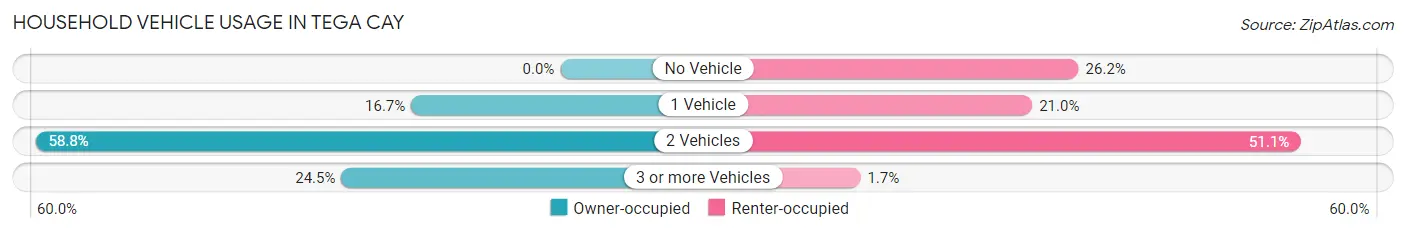
| Vehicles per Household | Owner-occupied | Renter-occupied |
| No Vehicle | 0 (0.0%) | 166 (26.2%) |
| 1 Vehicle | 684 (16.7%) | 133 (21.0%) |
| 2 Vehicles | 2,407 (58.8%) | 324 (51.1%) |
| 3 or more Vehicles | 1,004 (24.5%) | 11 (1.7%) |
| Total | 4,095 (100.0%) | 634 (100.0%) |
Real Estate & Mortgages in Tega Cay
Real Estate and Mortgage Overview in Tega Cay
| Characteristic | Without Mortgage | With Mortgage |
| Housing Units | 836 | 3,259 |
| Median Property Value | $344,100 | $486,800 |
| Median Household Income | $91,131 | $1,786 |
| Monthly Housing Costs | $567 | $787 |
| Real Estate Taxes | $2,182 | $13 |
Property Value by Mortgage Status in Tega Cay
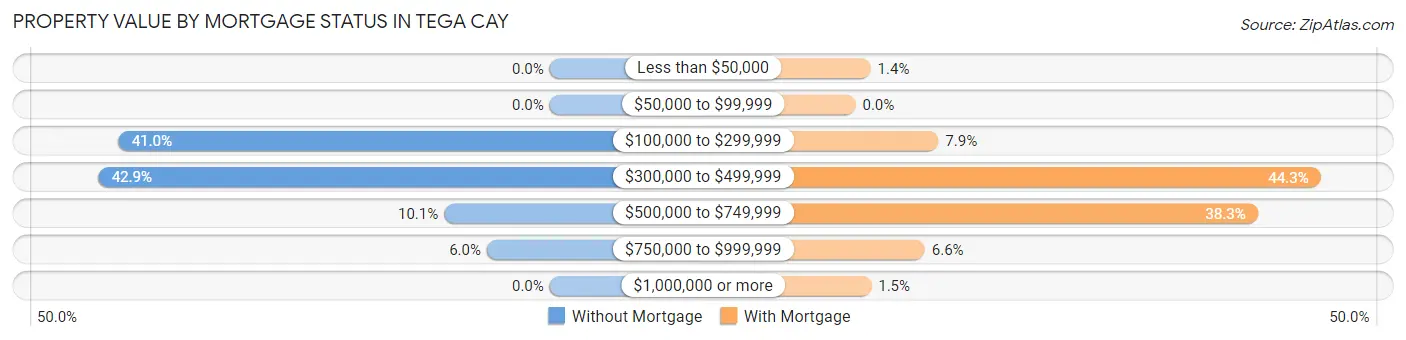
| Property Value | Without Mortgage | With Mortgage |
| Less than $50,000 | 0 (0.0%) | 47 (1.4%) |
| $50,000 to $99,999 | 0 (0.0%) | 0 (0.0%) |
| $100,000 to $299,999 | 343 (41.0%) | 257 (7.9%) |
| $300,000 to $499,999 | 359 (42.9%) | 1,443 (44.3%) |
| $500,000 to $749,999 | 84 (10.1%) | 1,248 (38.3%) |
| $750,000 to $999,999 | 50 (6.0%) | 215 (6.6%) |
| $1,000,000 or more | 0 (0.0%) | 49 (1.5%) |
| Total | 836 (100.0%) | 3,259 (100.0%) |
Household Income by Mortgage Status in Tega Cay
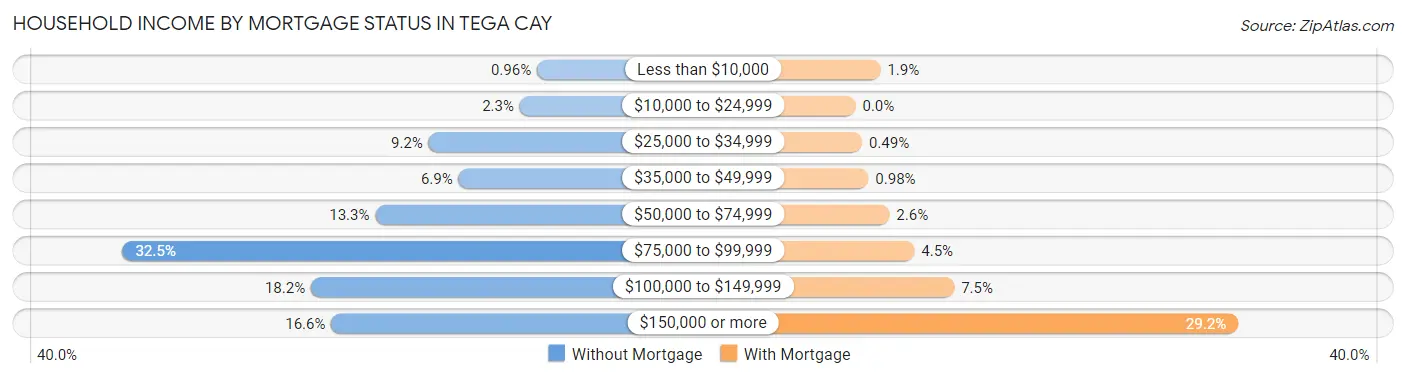
| Household Income | Without Mortgage | With Mortgage |
| Less than $10,000 | 8 (1.0%) | 62 (1.9%) |
| $10,000 to $24,999 | 19 (2.3%) | 0 (0.0%) |
| $25,000 to $34,999 | 77 (9.2%) | 16 (0.5%) |
| $35,000 to $49,999 | 58 (6.9%) | 32 (1.0%) |
| $50,000 to $74,999 | 111 (13.3%) | 84 (2.6%) |
| $75,000 to $99,999 | 272 (32.5%) | 146 (4.5%) |
| $100,000 to $149,999 | 152 (18.2%) | 245 (7.5%) |
| $150,000 or more | 139 (16.6%) | 950 (29.1%) |
| Total | 836 (100.0%) | 3,259 (100.0%) |
Property Value to Household Income Ratio in Tega Cay
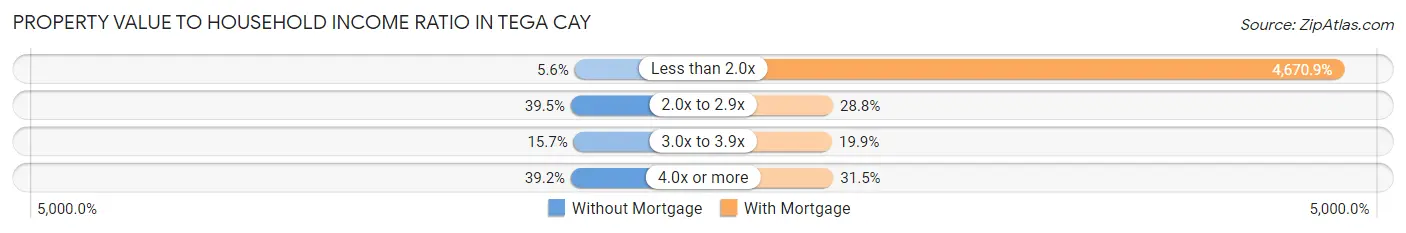
| Value-to-Income Ratio | Without Mortgage | With Mortgage |
| Less than 2.0x | 47 (5.6%) | 152,223 (4,670.9%) |
| 2.0x to 2.9x | 330 (39.5%) | 937 (28.7%) |
| 3.0x to 3.9x | 131 (15.7%) | 649 (19.9%) |
| 4.0x or more | 328 (39.2%) | 1,026 (31.5%) |
| Total | 836 (100.0%) | 3,259 (100.0%) |
Real Estate Taxes by Mortgage Status in Tega Cay
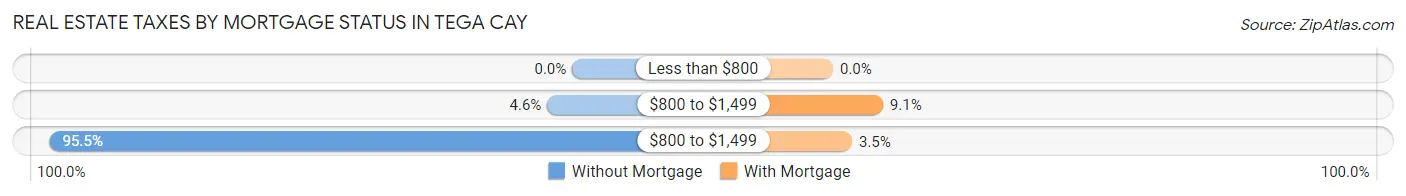
| Property Taxes | Without Mortgage | With Mortgage |
| Less than $800 | 0 (0.0%) | 0 (0.0%) |
| $800 to $1,499 | 38 (4.5%) | 297 (9.1%) |
| $800 to $1,499 | 798 (95.5%) | 113 (3.5%) |
| Total | 836 (100.0%) | 3,259 (100.0%) |
Health & Disability in Tega Cay
Health Insurance Coverage by Age in Tega Cay
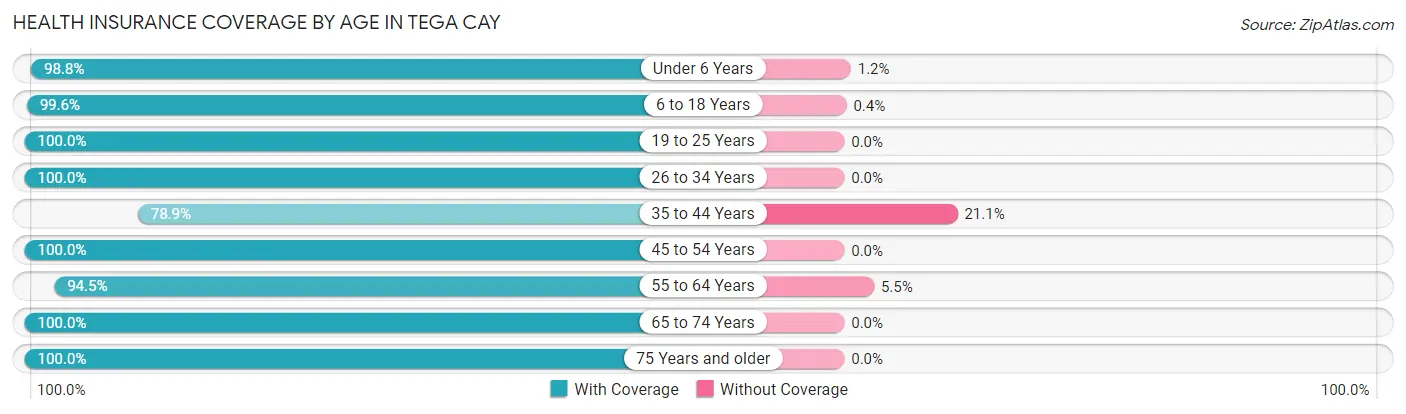
| Age Bracket | With Coverage | Without Coverage |
| Under 6 Years | 898 (98.8%) | 11 (1.2%) |
| 6 to 18 Years | 2,498 (99.6%) | 10 (0.4%) |
| 19 to 25 Years | 289 (100.0%) | 0 (0.0%) |
| 26 to 34 Years | 473 (100.0%) | 0 (0.0%) |
| 35 to 44 Years | 2,294 (78.9%) | 614 (21.1%) |
| 45 to 54 Years | 1,786 (100.0%) | 0 (0.0%) |
| 55 to 64 Years | 1,657 (94.5%) | 97 (5.5%) |
| 65 to 74 Years | 1,656 (100.0%) | 0 (0.0%) |
| 75 Years and older | 515 (100.0%) | 0 (0.0%) |
| Total | 12,066 (94.3%) | 732 (5.7%) |
Health Insurance Coverage by Citizenship Status in Tega Cay
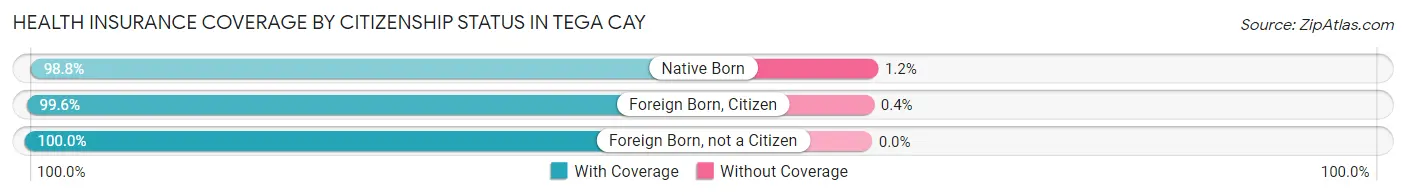
| Citizenship Status | With Coverage | Without Coverage |
| Native Born | 898 (98.8%) | 11 (1.2%) |
| Foreign Born, Citizen | 2,498 (99.6%) | 10 (0.4%) |
| Foreign Born, not a Citizen | 289 (100.0%) | 0 (0.0%) |
Health Insurance Coverage by Household Income in Tega Cay
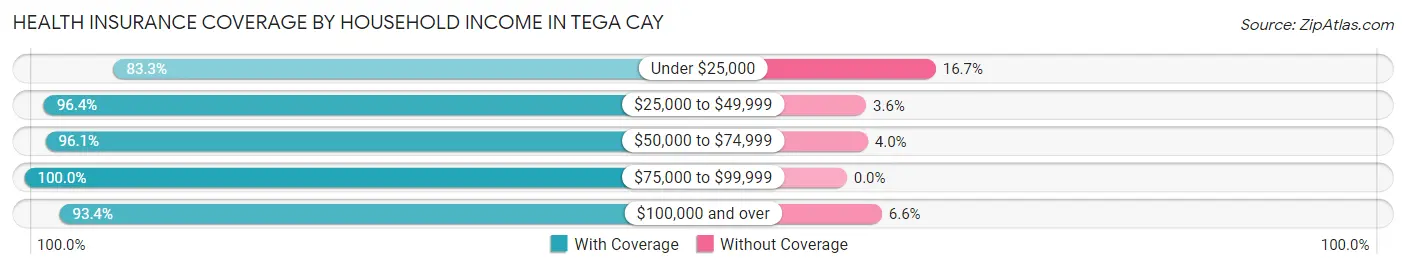
| Household Income | With Coverage | Without Coverage |
| Under $25,000 | 60 (83.3%) | 12 (16.7%) |
| $25,000 to $49,999 | 559 (96.4%) | 21 (3.6%) |
| $50,000 to $74,999 | 657 (96.1%) | 27 (4.0%) |
| $75,000 to $99,999 | 1,241 (100.0%) | 0 (0.0%) |
| $100,000 and over | 9,549 (93.4%) | 672 (6.6%) |
Public vs Private Health Insurance Coverage by Age in Tega Cay
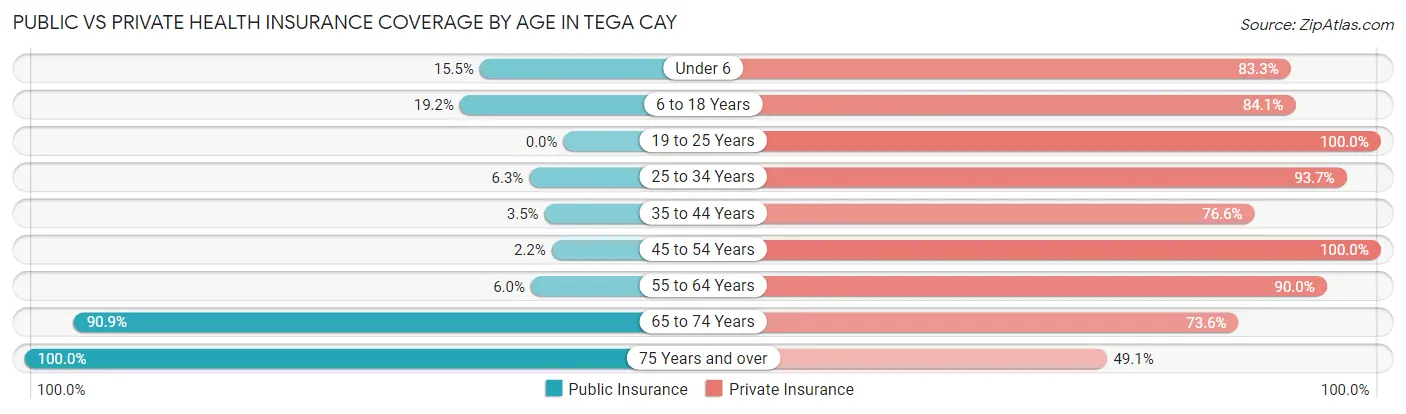
| Age Bracket | Public Insurance | Private Insurance |
| Under 6 | 141 (15.5%) | 757 (83.3%) |
| 6 to 18 Years | 482 (19.2%) | 2,110 (84.1%) |
| 19 to 25 Years | 0 (0.0%) | 289 (100.0%) |
| 25 to 34 Years | 30 (6.3%) | 443 (93.7%) |
| 35 to 44 Years | 102 (3.5%) | 2,227 (76.6%) |
| 45 to 54 Years | 39 (2.2%) | 1,786 (100.0%) |
| 55 to 64 Years | 106 (6.0%) | 1,578 (90.0%) |
| 65 to 74 Years | 1,505 (90.9%) | 1,219 (73.6%) |
| 75 Years and over | 515 (100.0%) | 253 (49.1%) |
| Total | 2,920 (22.8%) | 10,662 (83.3%) |
Disability Status by Sex by Age in Tega Cay
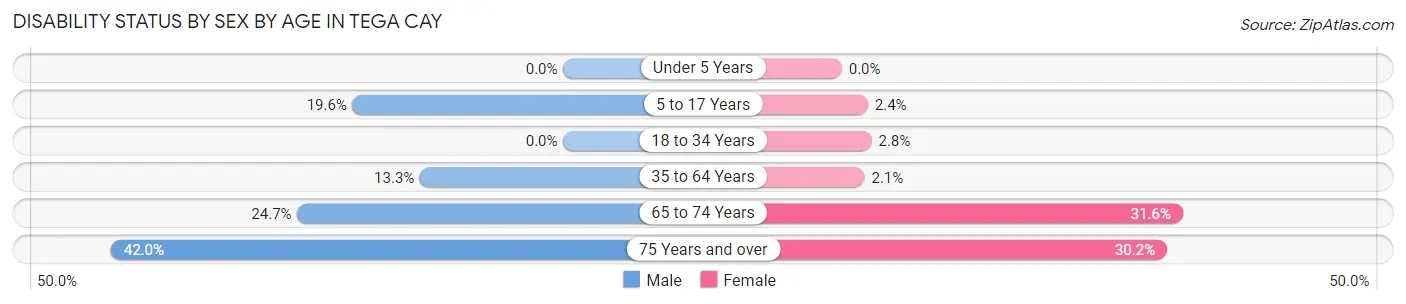
| Age Bracket | Male | Female |
| Under 5 Years | 0 (0.0%) | 0 (0.0%) |
| 5 to 17 Years | 245 (19.6%) | 33 (2.4%) |
| 18 to 34 Years | 0 (0.0%) | 13 (2.8%) |
| 35 to 64 Years | 423 (13.3%) | 69 (2.1%) |
| 65 to 74 Years | 209 (24.7%) | 256 (31.6%) |
| 75 Years and over | 105 (42.0%) | 80 (30.2%) |
Disability Class by Sex by Age in Tega Cay
Disability Class: Hearing Difficulty
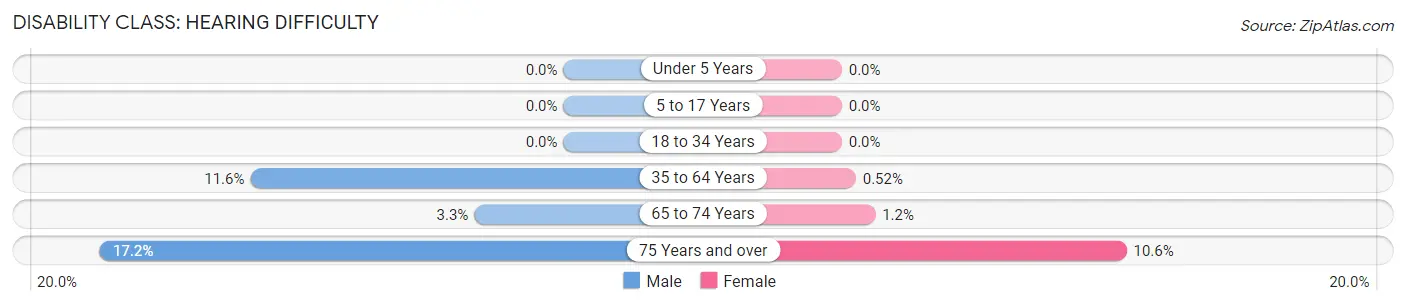
| Age Bracket | Male | Female |
| Under 5 Years | 0 (0.0%) | 0 (0.0%) |
| 5 to 17 Years | 0 (0.0%) | 0 (0.0%) |
| 18 to 34 Years | 0 (0.0%) | 0 (0.0%) |
| 35 to 64 Years | 370 (11.6%) | 17 (0.5%) |
| 65 to 74 Years | 28 (3.3%) | 10 (1.2%) |
| 75 Years and over | 43 (17.2%) | 28 (10.6%) |
Disability Class: Vision Difficulty
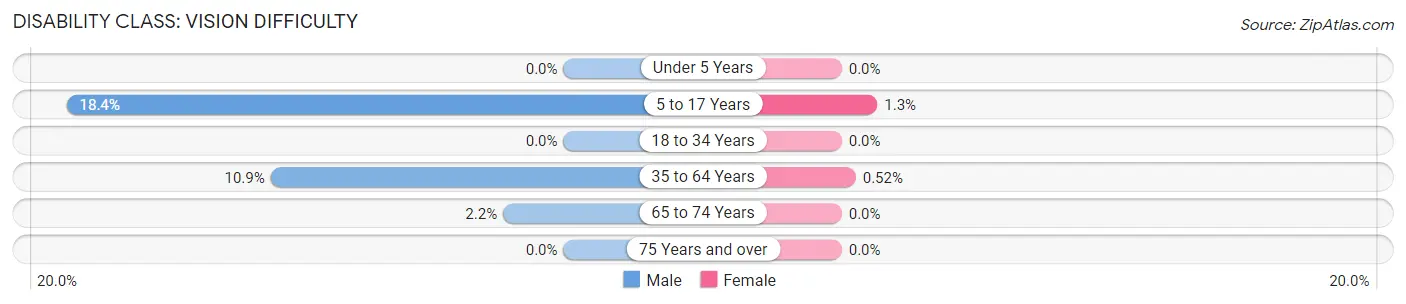
| Age Bracket | Male | Female |
| Under 5 Years | 0 (0.0%) | 0 (0.0%) |
| 5 to 17 Years | 231 (18.4%) | 18 (1.3%) |
| 18 to 34 Years | 0 (0.0%) | 0 (0.0%) |
| 35 to 64 Years | 346 (10.9%) | 17 (0.5%) |
| 65 to 74 Years | 19 (2.2%) | 0 (0.0%) |
| 75 Years and over | 0 (0.0%) | 0 (0.0%) |
Disability Class: Cognitive Difficulty
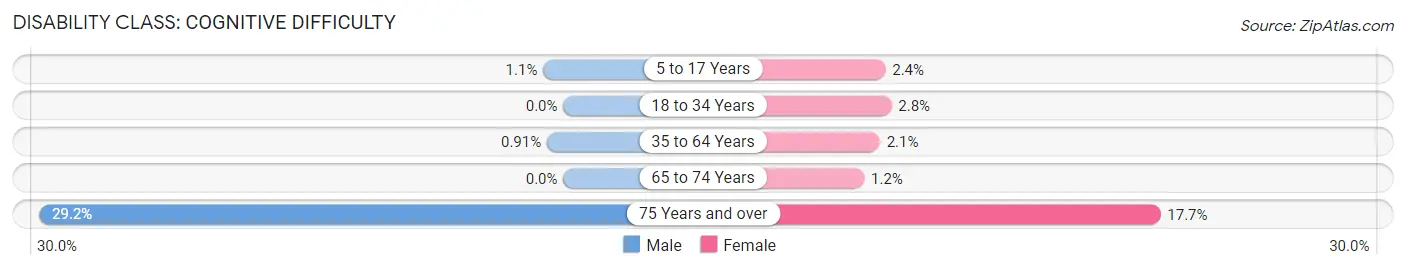
| Age Bracket | Male | Female |
| 5 to 17 Years | 14 (1.1%) | 33 (2.4%) |
| 18 to 34 Years | 0 (0.0%) | 13 (2.8%) |
| 35 to 64 Years | 29 (0.9%) | 69 (2.1%) |
| 65 to 74 Years | 0 (0.0%) | 10 (1.2%) |
| 75 Years and over | 73 (29.2%) | 47 (17.7%) |
Disability Class: Ambulatory Difficulty
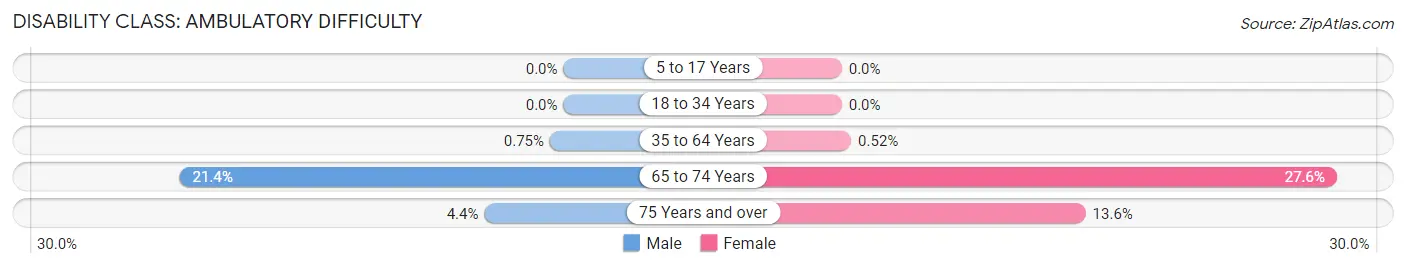
| Age Bracket | Male | Female |
| 5 to 17 Years | 0 (0.0%) | 0 (0.0%) |
| 18 to 34 Years | 0 (0.0%) | 0 (0.0%) |
| 35 to 64 Years | 24 (0.7%) | 17 (0.5%) |
| 65 to 74 Years | 181 (21.4%) | 223 (27.6%) |
| 75 Years and over | 11 (4.4%) | 36 (13.6%) |
Disability Class: Self-Care Difficulty
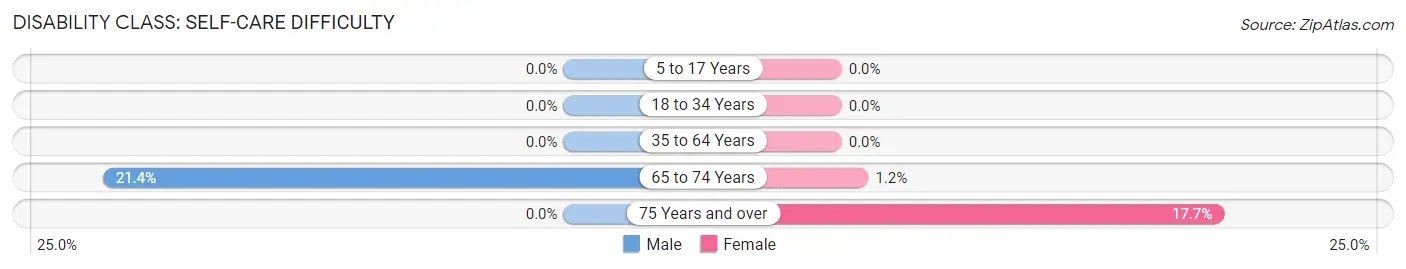
| Age Bracket | Male | Female |
| 5 to 17 Years | 0 (0.0%) | 0 (0.0%) |
| 18 to 34 Years | 0 (0.0%) | 0 (0.0%) |
| 35 to 64 Years | 0 (0.0%) | 0 (0.0%) |
| 65 to 74 Years | 181 (21.4%) | 10 (1.2%) |
| 75 Years and over | 0 (0.0%) | 47 (17.7%) |
Technology Access in Tega Cay
Computing Device Access in Tega Cay
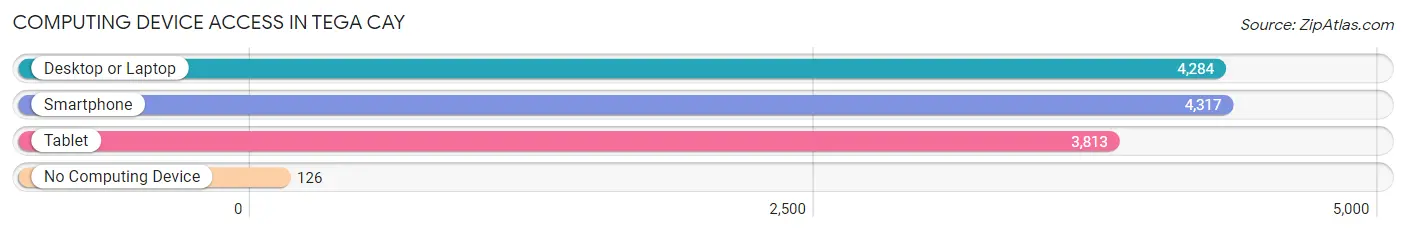
| Device Type | # Households | % Households |
| Desktop or Laptop | 4,284 | 90.6% |
| Smartphone | 4,317 | 91.3% |
| Tablet | 3,813 | 80.6% |
| No Computing Device | 126 | 2.7% |
| Total | 4,729 | 100.0% |
Internet Access in Tega Cay
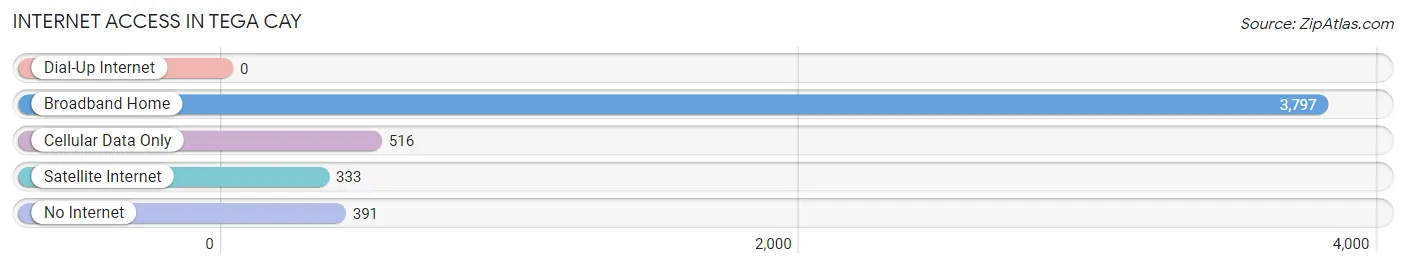
| Internet Type | # Households | % Households |
| Dial-Up Internet | 0 | 0.0% |
| Broadband Home | 3,797 | 80.3% |
| Cellular Data Only | 516 | 10.9% |
| Satellite Internet | 333 | 7.0% |
| No Internet | 391 | 8.3% |
| Total | 4,729 | 100.0% |
Tega Cay Summary
Tega Cay, South Carolina is a small city located in York County, South Carolina, United States. It is situated on a peninsula on Lake Wylie, which is part of the Catawba River. The city was incorporated in 1981 and has a population of approximately 8,000 people.
History
Tega Cay was founded in the late 1970s by a group of developers from Charlotte, North Carolina. The developers purchased the land from Duke Power Company and began to develop the area into a residential community. The name “Tega Cay” is derived from the Polynesian words “tega” meaning “beautiful” and “cay” meaning “island”. The developers chose this name to reflect the beauty of the area.
The city was officially incorporated in 1981 and the first mayor was elected in 1982. Since then, the city has grown steadily and is now home to a variety of businesses, restaurants, and recreational activities.
Geography
Tega Cay is located in York County, South Carolina, United States. It is situated on a peninsula on Lake Wylie, which is part of the Catawba River. The city is bordered by the cities of Fort Mill and Rock Hill to the north, and the towns of Clover and Lake Wylie to the south.
The city has a total area of 4.2 square miles, of which 3.9 square miles is land and 0.3 square miles is water. The terrain is mostly flat with some rolling hills. The highest point in the city is located at the intersection of Tega Cay Drive and Gold Hill Road, which is approximately 300 feet above sea level.
Economy
Tega Cay has a strong economy that is largely based on tourism and retail. The city is home to a variety of businesses, including restaurants, retail stores, and professional services. The city also has a number of recreational activities, such as golf courses, parks, and marinas.
The city is also home to a number of large employers, including Duke Energy, Tega Cay Marina, and Tega Cay Golf Club. The city also has a number of small businesses, such as restaurants, retail stores, and professional services.
Demographics
As of the 2010 census, the population of Tega Cay was 8,000. The racial makeup of the city was 87.3% White, 6.2% African American, 0.3% Native American, 2.2% Asian, 0.1% Pacific Islander, 1.2% from other races, and 2.9% from two or more races. Hispanic or Latino of any race were 4.2% of the population.
The median income for a household in the city was $87,917, and the median income for a family was $97,917. The per capita income for the city was $41,917. About 4.2% of families and 5.2% of the population were below the poverty line, including 6.2% of those under age 18 and 4.2% of those age 65 or over.
Tega Cay is a small city with a strong economy and a diverse population. The city is home to a variety of businesses, recreational activities, and employers. The city has a strong sense of community and is a great place to live and work.
Common Questions
What is Per Capita Income in Tega Cay?
Per Capita income in Tega Cay is $62,042.
What is the Median Family Income in Tega Cay?
Median Family Income in Tega Cay is $144,157.
What is the Median Household income in Tega Cay?
Median Household Income in Tega Cay is $140,172.
What is Income or Wage Gap in Tega Cay?
Income or Wage Gap in Tega Cay is 55.4%.
Women in Tega Cay earn 44.6 cents for every dollar earned by a man.
What is Inequality or Gini Index in Tega Cay?
Inequality or Gini Index in Tega Cay is 0.36.
What is the Total Population of Tega Cay?
Total Population of Tega Cay is 12,816.
What is the Total Male Population of Tega Cay?
Total Male Population of Tega Cay is 6,337.
What is the Total Female Population of Tega Cay?
Total Female Population of Tega Cay is 6,479.
What is the Ratio of Males per 100 Females in Tega Cay?
There are 97.81 Males per 100 Females in Tega Cay.
What is the Ratio of Females per 100 Males in Tega Cay?
There are 102.24 Females per 100 Males in Tega Cay.
What is the Median Population Age in Tega Cay?
Median Population Age in Tega Cay is 41.6 Years.
What is the Average Family Size in Tega Cay
Average Family Size in Tega Cay is 2.9 People.
What is the Average Household Size in Tega Cay
Average Household Size in Tega Cay is 2.7 People.
How Large is the Labor Force in Tega Cay?
There are 6,304 People in the Labor Forcein in Tega Cay.
What is the Percentage of People in the Labor Force in Tega Cay?
64.2% of People are in the Labor Force in Tega Cay.
What is the Unemployment Rate in Tega Cay?
Unemployment Rate in Tega Cay is 1.3%.