Greenfield, MN Map & Demographics
Greenfield Map
Greenfield Overview
$60,163
PER CAPITA INCOME
$154,129
AVG FAMILY INCOME
$142,214
AVG HOUSEHOLD INCOME
16.6%
WAGE / INCOME GAP [ % ]
83.4¢/ $1
WAGE / INCOME GAP [ $ ]
0.37
INEQUALITY / GINI INDEX
2,909
TOTAL POPULATION
1,513
MALE POPULATION
1,396
FEMALE POPULATION
108.38
MALES / 100 FEMALES
92.27
FEMALES / 100 MALES
45.2
MEDIAN AGE
3.2
AVG FAMILY SIZE
2.9
AVG HOUSEHOLD SIZE
1,575
LABOR FORCE [ PEOPLE ]
69.3%
PERCENT IN LABOR FORCE
0.8%
UNEMPLOYMENT RATE
Income in Greenfield
Income Overview in Greenfield
Per Capita Income in Greenfield is $60,163, while median incomes of families and households are $154,129 and $142,214 respectively.
| Characteristic | Number | Measure |
| Per Capita Income | 2,909 | $60,163 |
| Median Family Income | 831 | $154,129 |
| Mean Family Income | 831 | $191,336 |
| Median Household Income | 1,001 | $142,214 |
| Mean Household Income | 1,001 | $173,749 |
| Income Deficit | 831 | $0 |
| Wage / Income Gap (%) | 2,909 | 16.55% |
| Wage / Income Gap ($) | 2,909 | 83.45¢ per $1 |
| Gini / Inequality Index | 2,909 | 0.37 |
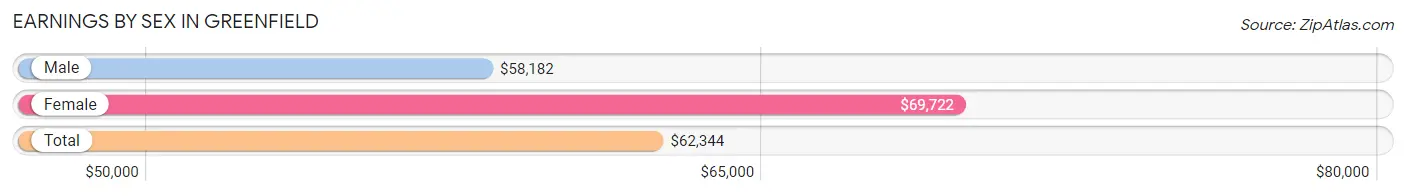
Earnings by Sex in Greenfield
Average Earnings in Greenfield are $62,344, $58,182 for men and $69,722 for women, a difference of 16.6%.
| Sex | Number | Average Earnings |
| Male | 918 (52.8%) | $58,182 |
| Female | 820 (47.2%) | $69,722 |
| Total | 1,738 (100.0%) | $62,344 |
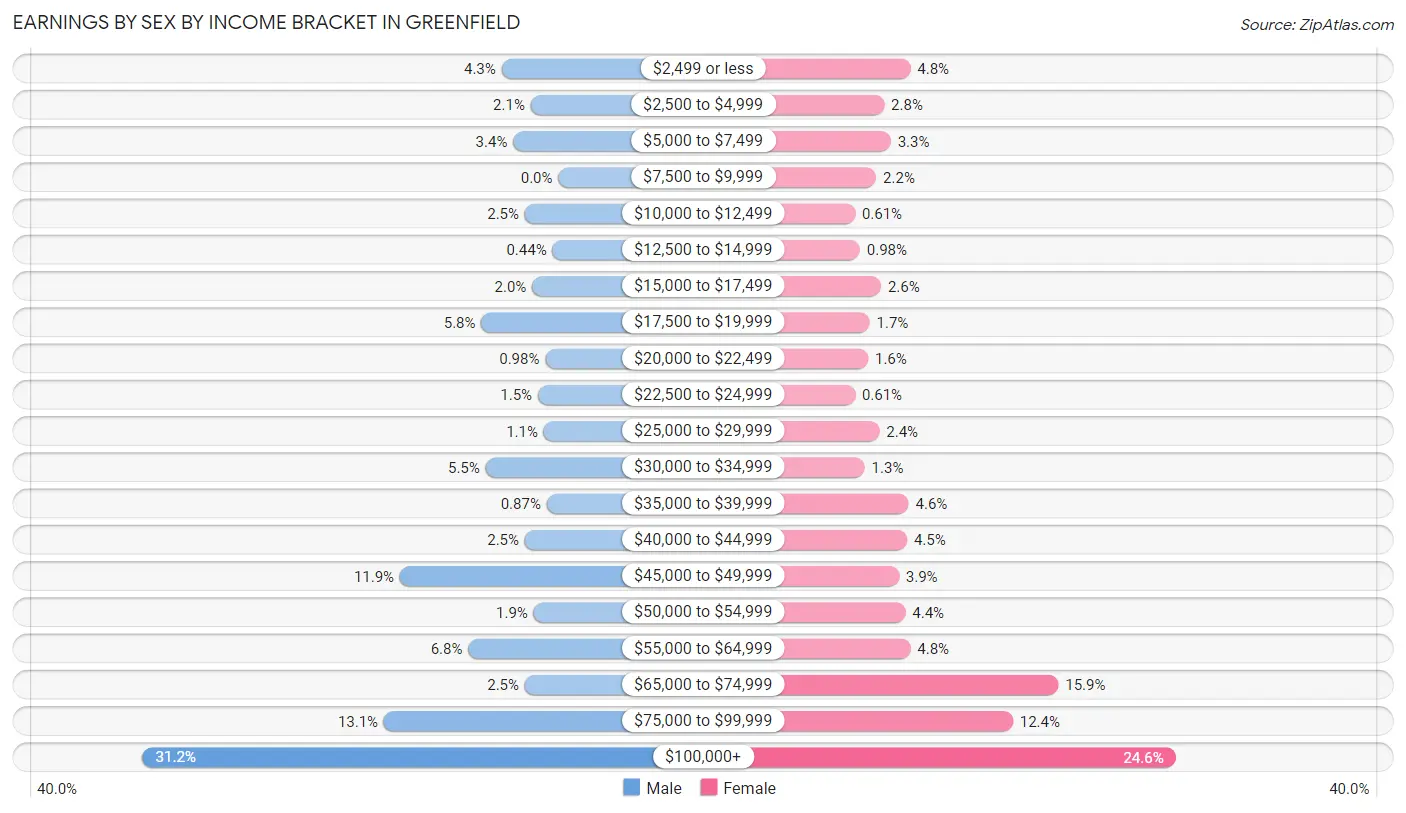
Earnings by Sex by Income Bracket in Greenfield
The most common earnings brackets in Greenfield are $100,000+ for men (286 | 31.1%) and $100,000+ for women (202 | 24.6%).
| Income | Male | Female |
| $2,499 or less | 39 (4.3%) | 39 (4.8%) |
| $2,500 to $4,999 | 19 (2.1%) | 23 (2.8%) |
| $5,000 to $7,499 | 31 (3.4%) | 27 (3.3%) |
| $7,500 to $9,999 | 0 (0.0%) | 18 (2.2%) |
| $10,000 to $12,499 | 23 (2.5%) | 5 (0.6%) |
| $12,500 to $14,999 | 4 (0.4%) | 8 (1.0%) |
| $15,000 to $17,499 | 18 (2.0%) | 21 (2.6%) |
| $17,500 to $19,999 | 53 (5.8%) | 14 (1.7%) |
| $20,000 to $22,499 | 9 (1.0%) | 13 (1.6%) |
| $22,500 to $24,999 | 14 (1.5%) | 5 (0.6%) |
| $25,000 to $29,999 | 10 (1.1%) | 20 (2.4%) |
| $30,000 to $34,999 | 50 (5.4%) | 11 (1.3%) |
| $35,000 to $39,999 | 8 (0.9%) | 38 (4.6%) |
| $40,000 to $44,999 | 23 (2.5%) | 37 (4.5%) |
| $45,000 to $49,999 | 109 (11.9%) | 32 (3.9%) |
| $50,000 to $54,999 | 17 (1.8%) | 36 (4.4%) |
| $55,000 to $64,999 | 62 (6.8%) | 39 (4.8%) |
| $65,000 to $74,999 | 23 (2.5%) | 130 (15.9%) |
| $75,000 to $99,999 | 120 (13.1%) | 102 (12.4%) |
| $100,000+ | 286 (31.1%) | 202 (24.6%) |
| Total | 918 (100.0%) | 820 (100.0%) |
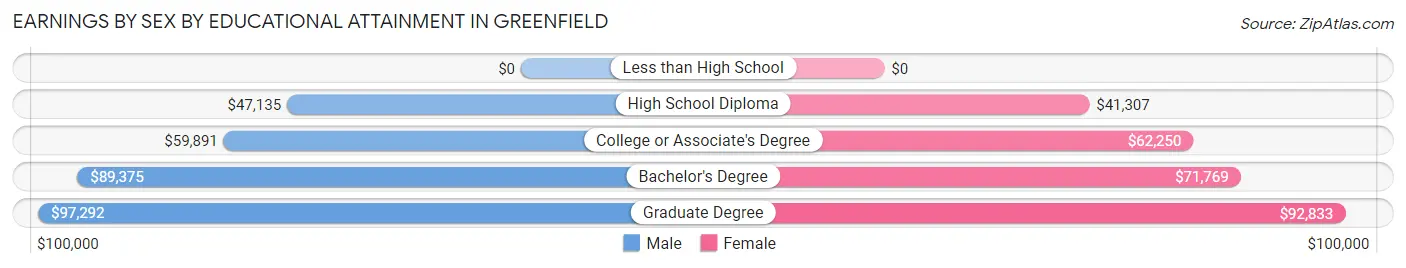
Earnings by Sex by Educational Attainment in Greenfield
Average earnings in Greenfield are $80,536 for men and $71,024 for women, a difference of 11.8%. Men with an educational attainment of graduate degree enjoy the highest average annual earnings of $97,292, while those with high school diploma education earn the least with $47,135. Women with an educational attainment of graduate degree earn the most with the average annual earnings of $92,833, while those with high school diploma education have the smallest earnings of $41,307.
| Educational Attainment | Male Income | Female Income |
| Less than High School | - | - |
| High School Diploma | $47,135 | $41,307 |
| College or Associate's Degree | $59,891 | $62,250 |
| Bachelor's Degree | $89,375 | $71,769 |
| Graduate Degree | $97,292 | $92,833 |
| Total | $80,536 | $71,024 |
Family Income in Greenfield
Family Income Brackets in Greenfield
According to the Greenfield family income data, there are 271 families falling into the $200,000+ income range, which is the most common income bracket and makes up 32.6% of all families.
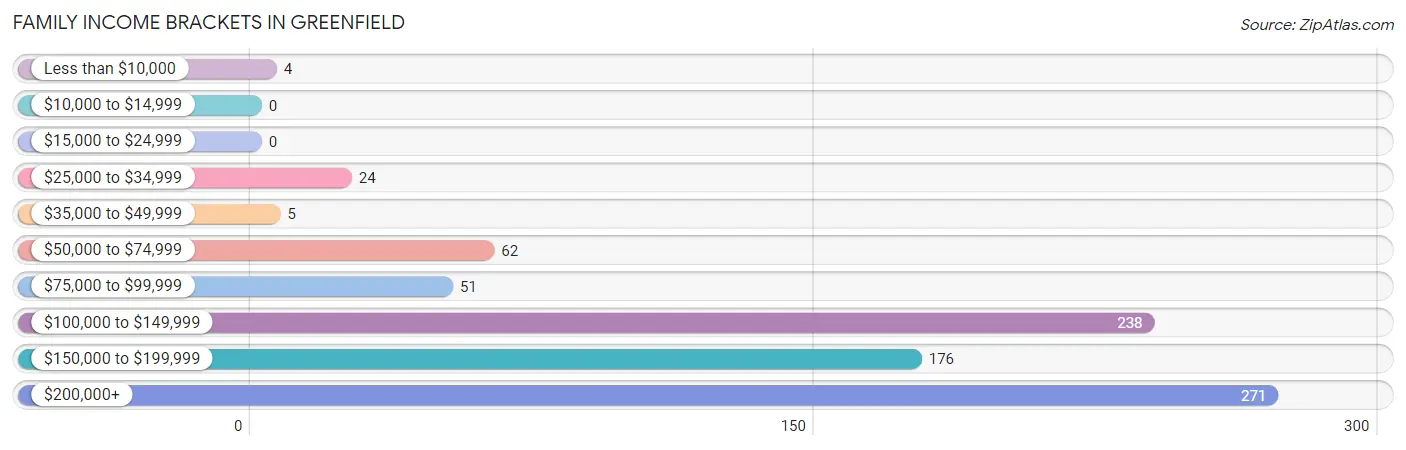
| Income Bracket | # Families | % Families |
| Less than $10,000 | 4 | 0.5% |
| $10,000 to $14,999 | 0 | 0.0% |
| $15,000 to $24,999 | 0 | 0.0% |
| $25,000 to $34,999 | 24 | 2.9% |
| $35,000 to $49,999 | 5 | 0.6% |
| $50,000 to $74,999 | 62 | 7.5% |
| $75,000 to $99,999 | 51 | 6.1% |
| $100,000 to $149,999 | 238 | 28.6% |
| $150,000 to $199,999 | 176 | 21.2% |
| $200,000+ | 271 | 32.6% |
Family Income by Famaliy Size in Greenfield
6-person families (37 | 4.4%) account for the highest median family income in Greenfield with $250,001 per family, while 2-person families (396 | 47.6%) have the highest median income of $71,875 per family member.
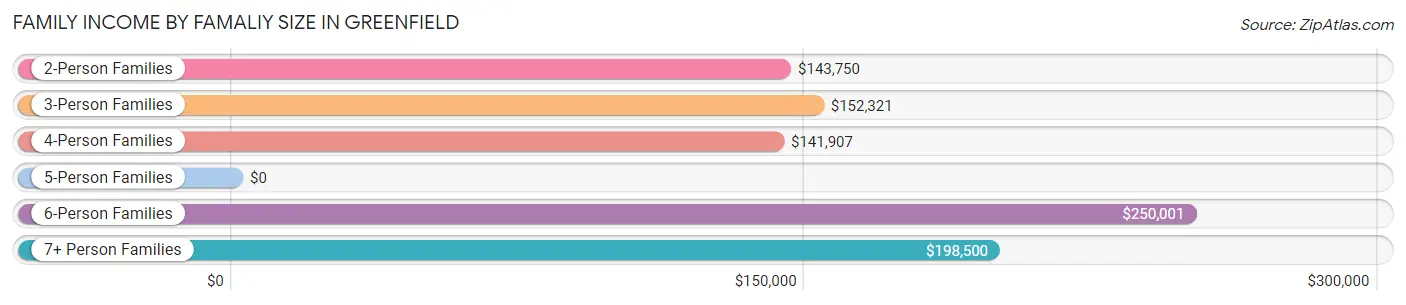
| Income Bracket | # Families | Median Income |
| 2-Person Families | 396 (47.6%) | $143,750 |
| 3-Person Families | 121 (14.6%) | $152,321 |
| 4-Person Families | 150 (18.0%) | $141,907 |
| 5-Person Families | 91 (11.0%) | $0 |
| 6-Person Families | 37 (4.4%) | $250,001 |
| 7+ Person Families | 36 (4.3%) | $198,500 |
| Total | 831 (100.0%) | $154,129 |
Family Income by Number of Earners in Greenfield
The median family income in Greenfield is $154,129, with families comprising 2 earners (408) having the highest median family income of $178,750, while families with no earners (131) have the lowest median family income of $78,281, accounting for 49.1% and 15.8% of families, respectively.
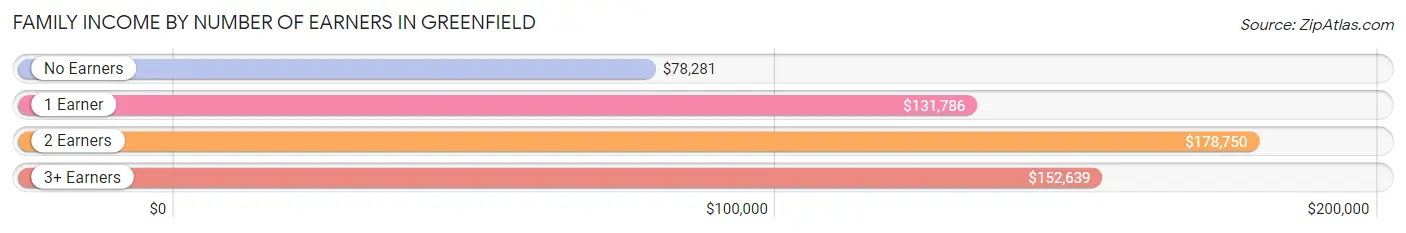
| Number of Earners | # Families | Median Income |
| No Earners | 131 (15.8%) | $78,281 |
| 1 Earner | 112 (13.5%) | $131,786 |
| 2 Earners | 408 (49.1%) | $178,750 |
| 3+ Earners | 180 (21.7%) | $152,639 |
| Total | 831 (100.0%) | $154,129 |
Household Income in Greenfield
Household Income Brackets in Greenfield
With 287 households falling in the category, the $200,000+ income range is the most frequent in Greenfield, accounting for 28.7% of all households.
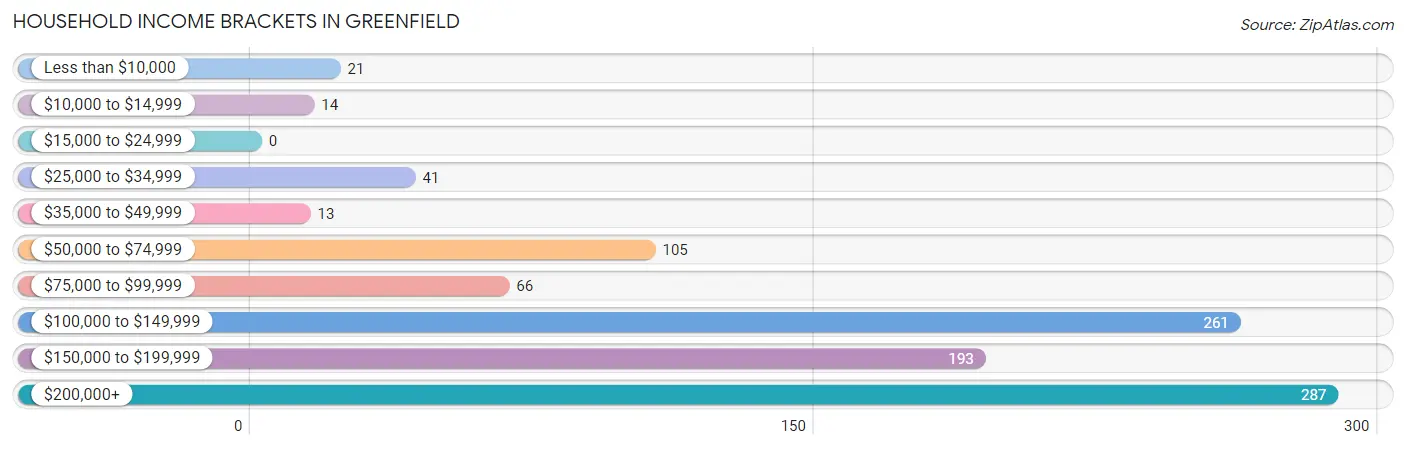
| Income Bracket | # Households | % Households |
| Less than $10,000 | 21 | 2.1% |
| $10,000 to $14,999 | 14 | 1.4% |
| $15,000 to $24,999 | 0 | 0.0% |
| $25,000 to $34,999 | 41 | 4.1% |
| $35,000 to $49,999 | 13 | 1.3% |
| $50,000 to $74,999 | 105 | 10.5% |
| $75,000 to $99,999 | 66 | 6.6% |
| $100,000 to $149,999 | 261 | 26.1% |
| $150,000 to $199,999 | 193 | 19.3% |
| $200,000+ | 287 | 28.7% |
Household Income by Householder Age in Greenfield
The median household income in Greenfield is $142,214, with the highest median household income of $165,446 found in the 25 to 44 years age bracket for the primary householder. A total of 229 households (22.9%) fall into this category. Meanwhile, the 15 to 24 years age bracket for the primary householder has the lowest median household income of $0, with 7 households (0.7%) in this group.
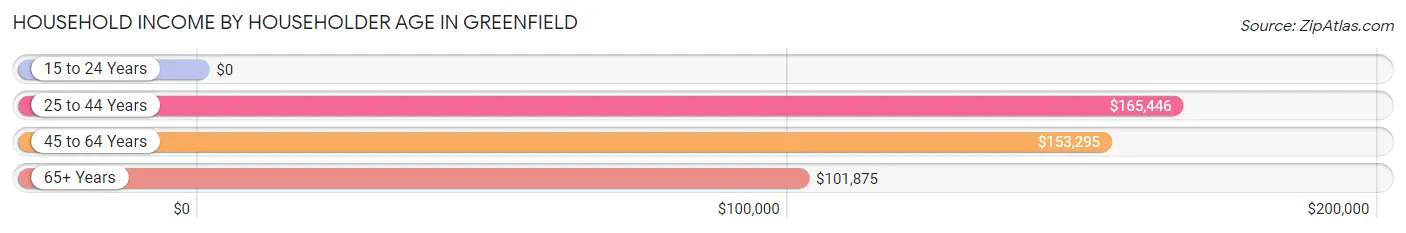
| Income Bracket | # Households | Median Income |
| 15 to 24 Years | 7 (0.7%) | $0 |
| 25 to 44 Years | 229 (22.9%) | $165,446 |
| 45 to 64 Years | 517 (51.6%) | $153,295 |
| 65+ Years | 248 (24.8%) | $101,875 |
| Total | 1,001 (100.0%) | $142,214 |
Poverty in Greenfield
Income Below Poverty by Sex and Age in Greenfield
With 2.7% poverty level for males and 1.8% for females among the residents of Greenfield, 75 year old and over males and 16 and 17 year old females are the most vulnerable to poverty, with 11 males (18.6%) and 11 females (19.3%) in their respective age groups living below the poverty level.
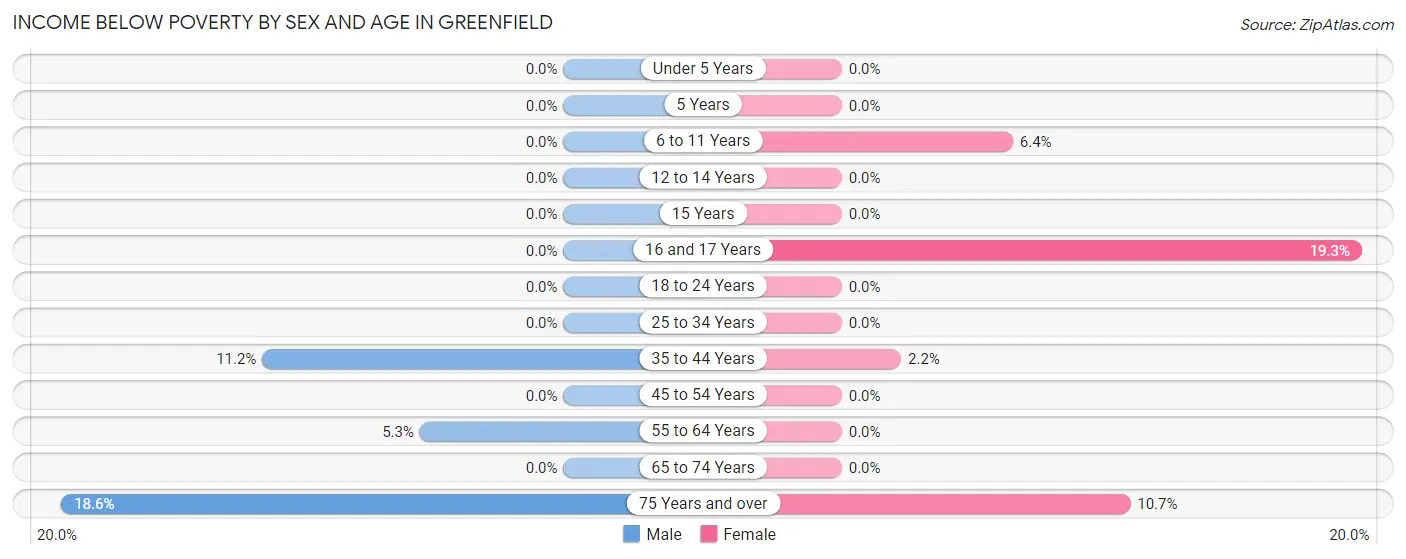
| Age Bracket | Male | Female |
| Under 5 Years | 0 (0.0%) | 0 (0.0%) |
| 5 Years | 0 (0.0%) | 0 (0.0%) |
| 6 to 11 Years | 0 (0.0%) | 4 (6.4%) |
| 12 to 14 Years | 0 (0.0%) | 0 (0.0%) |
| 15 Years | 0 (0.0%) | 0 (0.0%) |
| 16 and 17 Years | 0 (0.0%) | 11 (19.3%) |
| 18 to 24 Years | 0 (0.0%) | 0 (0.0%) |
| 25 to 34 Years | 0 (0.0%) | 0 (0.0%) |
| 35 to 44 Years | 18 (11.2%) | 4 (2.2%) |
| 45 to 54 Years | 0 (0.0%) | 0 (0.0%) |
| 55 to 64 Years | 12 (5.3%) | 0 (0.0%) |
| 65 to 74 Years | 0 (0.0%) | 0 (0.0%) |
| 75 Years and over | 11 (18.6%) | 6 (10.7%) |
| Total | 41 (2.7%) | 25 (1.8%) |
Income Above Poverty by Sex and Age in Greenfield
According to the poverty statistics in Greenfield, males aged under 5 years and females aged under 5 years are the age groups that are most secure financially, with 100.0% of males and 100.0% of females in these age groups living above the poverty line.
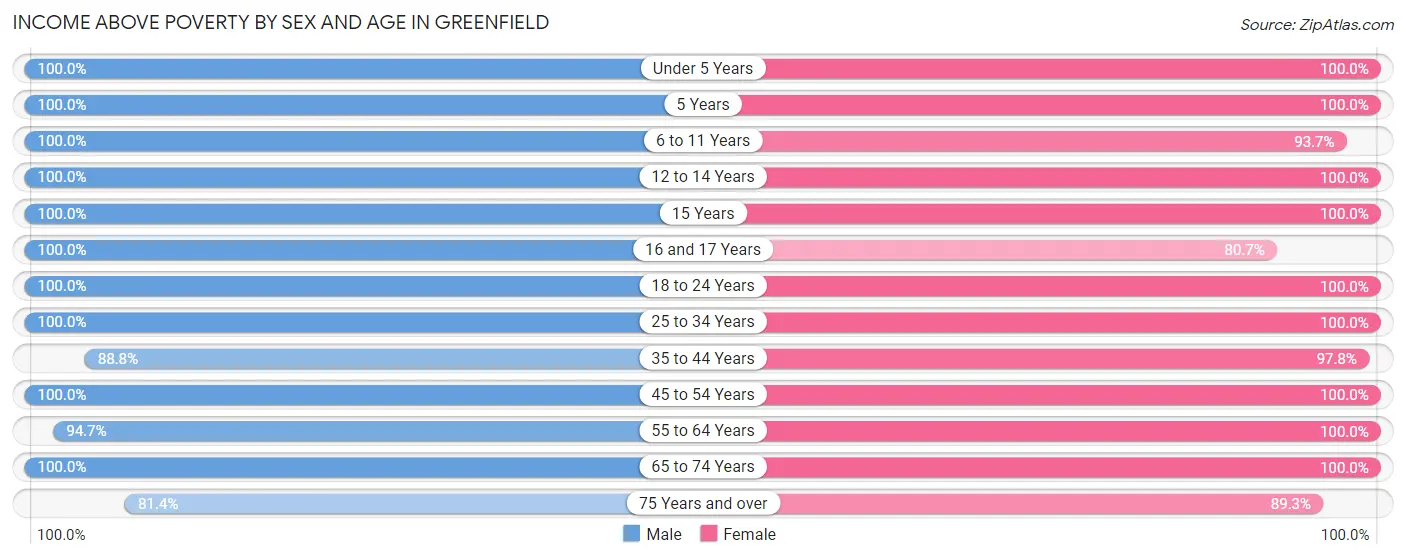
| Age Bracket | Male | Female |
| Under 5 Years | 58 (100.0%) | 59 (100.0%) |
| 5 Years | 10 (100.0%) | 10 (100.0%) |
| 6 to 11 Years | 163 (100.0%) | 59 (93.6%) |
| 12 to 14 Years | 58 (100.0%) | 72 (100.0%) |
| 15 Years | 98 (100.0%) | 39 (100.0%) |
| 16 and 17 Years | 15 (100.0%) | 46 (80.7%) |
| 18 to 24 Years | 150 (100.0%) | 70 (100.0%) |
| 25 to 34 Years | 75 (100.0%) | 100 (100.0%) |
| 35 to 44 Years | 143 (88.8%) | 178 (97.8%) |
| 45 to 54 Years | 261 (100.0%) | 282 (100.0%) |
| 55 to 64 Years | 213 (94.7%) | 261 (100.0%) |
| 65 to 74 Years | 174 (100.0%) | 145 (100.0%) |
| 75 Years and over | 48 (81.4%) | 50 (89.3%) |
| Total | 1,466 (97.3%) | 1,371 (98.2%) |
Income Below Poverty Among Married-Couple Families in Greenfield
The poverty statistics for married-couple families in Greenfield show that 0.5% or 4 of the total 770 families live below the poverty line. Families with 1 or 2 children have the highest poverty rate of 2.1%, comprising of 4 families. On the other hand, families with no children have the lowest poverty rate of 0.0%, which includes 0 families.
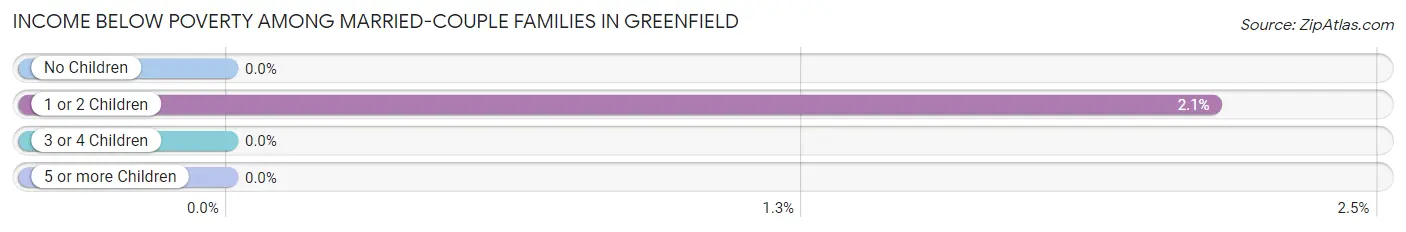
| Children | Above Poverty | Below Poverty |
| No Children | 446 (100.0%) | 0 (0.0%) |
| 1 or 2 Children | 183 (97.9%) | 4 (2.1%) |
| 3 or 4 Children | 121 (100.0%) | 0 (0.0%) |
| 5 or more Children | 16 (100.0%) | 0 (0.0%) |
| Total | 766 (99.5%) | 4 (0.5%) |
Income Below Poverty Among Single-Parent Households in Greenfield
| Children | Single Father | Single Mother |
| No Children | 0 (0.0%) | 0 (0.0%) |
| 1 or 2 Children | 0 (0.0%) | 0 (0.0%) |
| 3 or 4 Children | 0 (0.0%) | 0 (0.0%) |
| 5 or more Children | 0 (0.0%) | 0 (0.0%) |
| Total | 0 (0.0%) | 0 (0.0%) |
Income Below Poverty Among Married-Couple vs Single-Parent Households in Greenfield
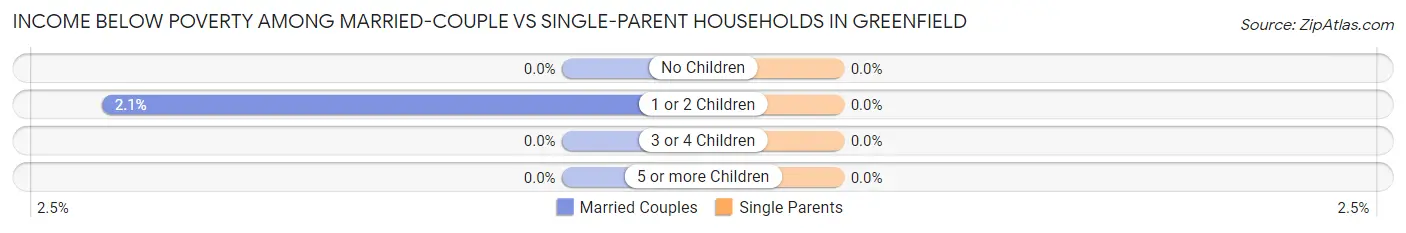
| Children | Married-Couple Families | Single-Parent Households |
| No Children | 0 (0.0%) | 0 (0.0%) |
| 1 or 2 Children | 4 (2.1%) | 0 (0.0%) |
| 3 or 4 Children | 0 (0.0%) | 0 (0.0%) |
| 5 or more Children | 0 (0.0%) | 0 (0.0%) |
| Total | 4 (0.5%) | 0 (0.0%) |
Race in Greenfield
The most populous races in Greenfield are White / Caucasian (2,741 | 94.2%), Black / African American (90 | 3.1%), and Two or more Races (62 | 2.1%).
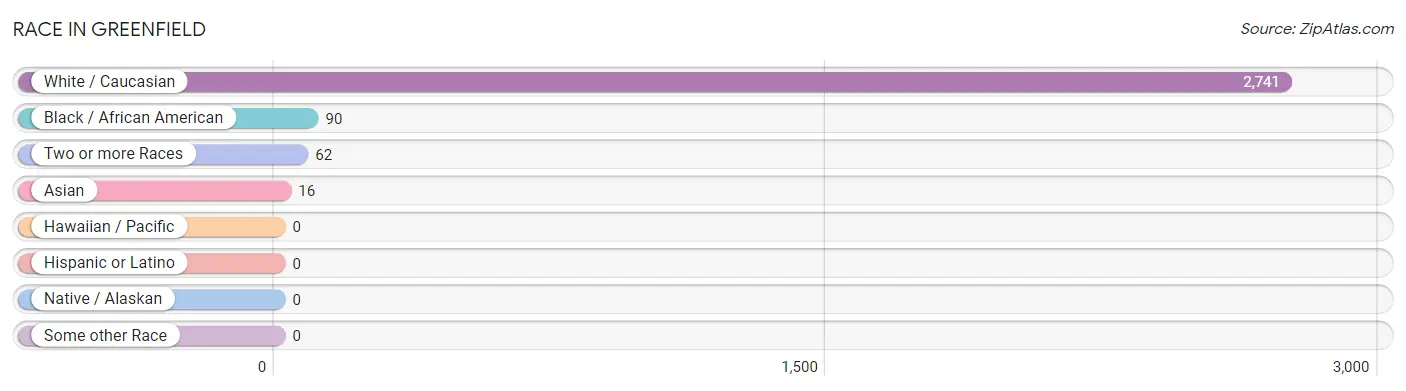
| Race | # Population | % Population |
| Asian | 16 | 0.5% |
| Black / African American | 90 | 3.1% |
| Hawaiian / Pacific | 0 | 0.0% |
| Hispanic or Latino | 0 | 0.0% |
| Native / Alaskan | 0 | 0.0% |
| White / Caucasian | 2,741 | 94.2% |
| Two or more Races | 62 | 2.1% |
| Some other Race | 0 | 0.0% |
| Total | 2,909 | 100.0% |
Ancestry in Greenfield
The most populous ancestries reported in Greenfield are German (1,349 | 46.4%), Norwegian (483 | 16.6%), Swedish (328 | 11.3%), Irish (211 | 7.2%), and Polish (187 | 6.4%), together accounting for 87.9% of all Greenfield residents.
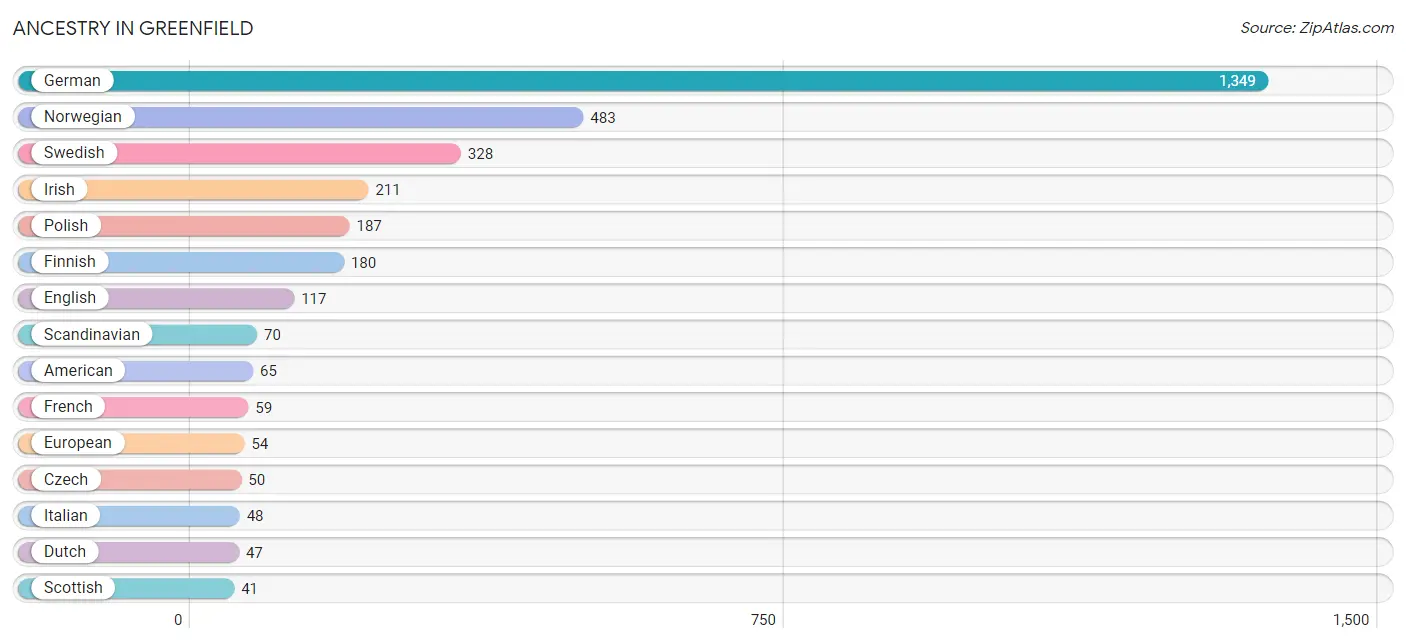
| Ancestry | # Population | % Population |
| American | 65 | 2.2% |
| Austrian | 2 | 0.1% |
| Bangladeshi | 10 | 0.3% |
| Burmese | 32 | 1.1% |
| Chippewa | 3 | 0.1% |
| Czech | 50 | 1.7% |
| Danish | 28 | 1.0% |
| Dutch | 47 | 1.6% |
| English | 117 | 4.0% |
| European | 54 | 1.9% |
| Finnish | 180 | 6.2% |
| French | 59 | 2.0% |
| French Canadian | 33 | 1.1% |
| German | 1,349 | 46.4% |
| Greek | 16 | 0.5% |
| Irish | 211 | 7.2% |
| Italian | 48 | 1.7% |
| Kenyan | 40 | 1.4% |
| Norwegian | 483 | 16.6% |
| Polish | 187 | 6.4% |
| Russian | 22 | 0.8% |
| Scandinavian | 70 | 2.4% |
| Scotch-Irish | 2 | 0.1% |
| Scottish | 41 | 1.4% |
| Slovene | 5 | 0.2% |
| Subsaharan African | 40 | 1.4% |
| Swedish | 328 | 11.3% |
| Swiss | 8 | 0.3% |
| Welsh | 4 | 0.1% | View All 29 Rows |
Immigrants in Greenfield
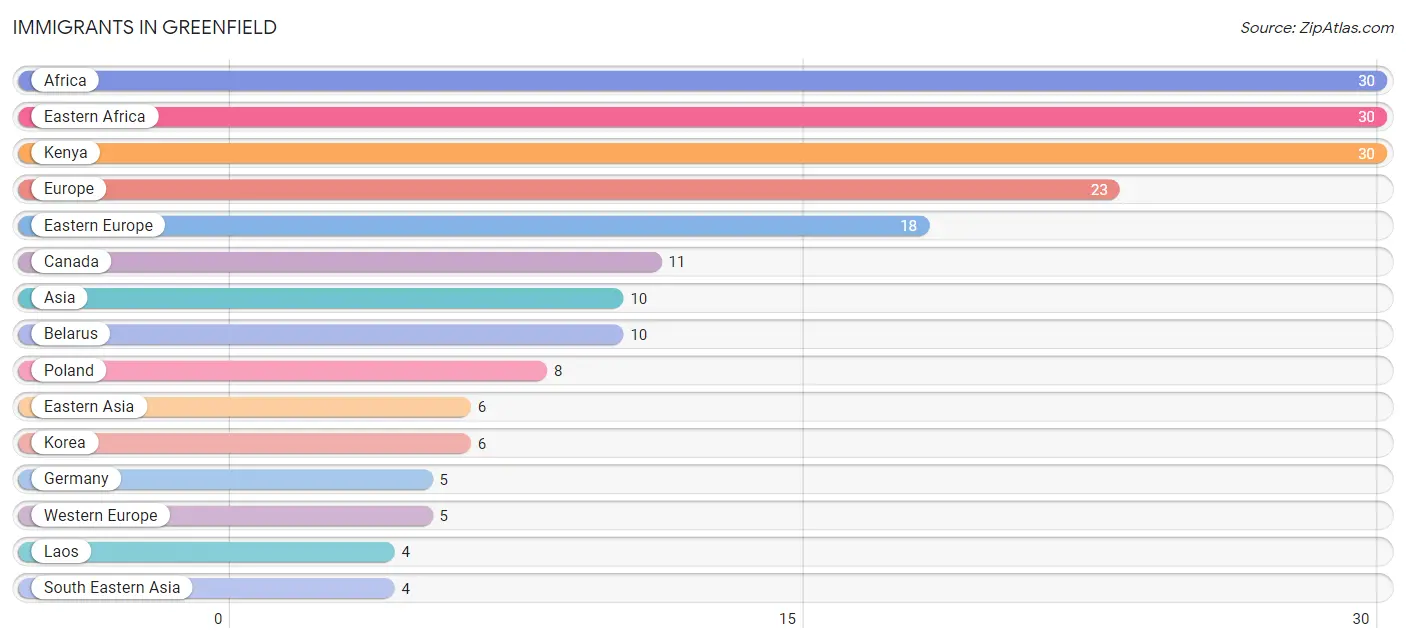
The most numerous immigrant groups reported in Greenfield came from Africa (30 | 1.0%), Eastern Africa (30 | 1.0%), Kenya (30 | 1.0%), Europe (23 | 0.8%), and Eastern Europe (18 | 0.6%), together accounting for 4.5% of all Greenfield residents.
| Immigration Origin | # Population | % Population |
| Africa | 30 | 1.0% |
| Asia | 10 | 0.3% |
| Belarus | 10 | 0.3% |
| Canada | 11 | 0.4% |
| Eastern Africa | 30 | 1.0% |
| Eastern Asia | 6 | 0.2% |
| Eastern Europe | 18 | 0.6% |
| Europe | 23 | 0.8% |
| Germany | 5 | 0.2% |
| Kenya | 30 | 1.0% |
| Korea | 6 | 0.2% |
| Laos | 4 | 0.1% |
| Poland | 8 | 0.3% |
| South Eastern Asia | 4 | 0.1% |
| Western Europe | 5 | 0.2% | View All 15 Rows |
Sex and Age in Greenfield
Sex and Age in Greenfield
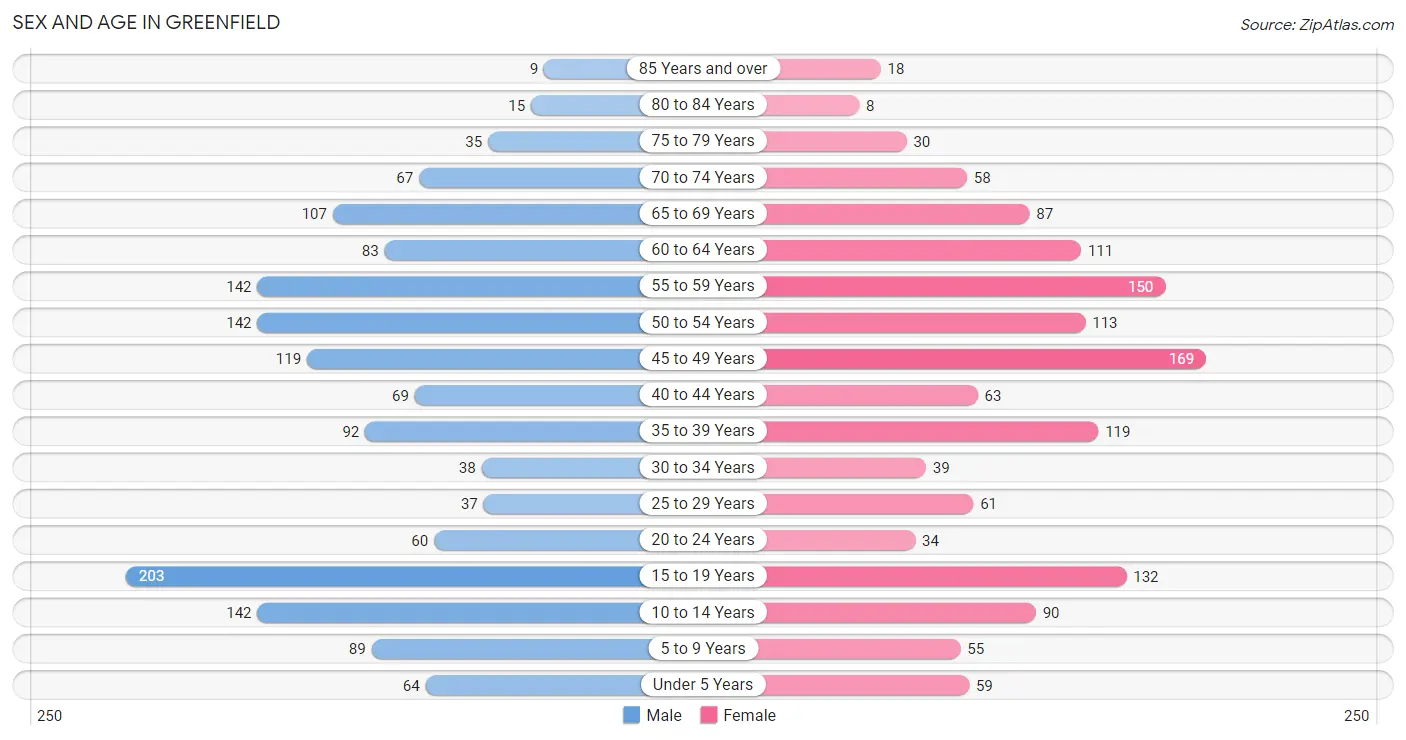
The most populous age groups in Greenfield are 15 to 19 Years (203 | 13.4%) for men and 45 to 49 Years (169 | 12.1%) for women.
| Age Bracket | Male | Female |
| Under 5 Years | 64 (4.2%) | 59 (4.2%) |
| 5 to 9 Years | 89 (5.9%) | 55 (3.9%) |
| 10 to 14 Years | 142 (9.4%) | 90 (6.5%) |
| 15 to 19 Years | 203 (13.4%) | 132 (9.5%) |
| 20 to 24 Years | 60 (4.0%) | 34 (2.4%) |
| 25 to 29 Years | 37 (2.5%) | 61 (4.4%) |
| 30 to 34 Years | 38 (2.5%) | 39 (2.8%) |
| 35 to 39 Years | 92 (6.1%) | 119 (8.5%) |
| 40 to 44 Years | 69 (4.6%) | 63 (4.5%) |
| 45 to 49 Years | 119 (7.9%) | 169 (12.1%) |
| 50 to 54 Years | 142 (9.4%) | 113 (8.1%) |
| 55 to 59 Years | 142 (9.4%) | 150 (10.7%) |
| 60 to 64 Years | 83 (5.5%) | 111 (8.0%) |
| 65 to 69 Years | 107 (7.1%) | 87 (6.2%) |
| 70 to 74 Years | 67 (4.4%) | 58 (4.2%) |
| 75 to 79 Years | 35 (2.3%) | 30 (2.1%) |
| 80 to 84 Years | 15 (1.0%) | 8 (0.6%) |
| 85 Years and over | 9 (0.6%) | 18 (1.3%) |
| Total | 1,513 (100.0%) | 1,396 (100.0%) |
Families and Households in Greenfield
Median Family Size in Greenfield
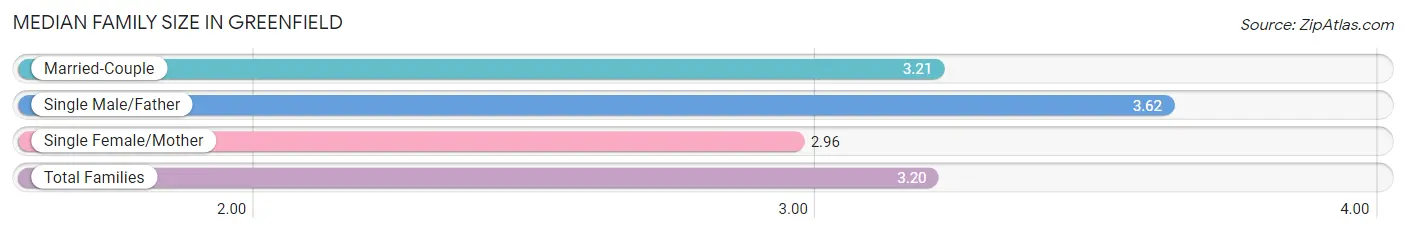
The median family size in Greenfield is 3.20 persons per family, with single male/father families (13 | 1.6%) accounting for the largest median family size of 3.62 persons per family. On the other hand, single female/mother families (48 | 5.8%) represent the smallest median family size with 2.96 persons per family.
| Family Type | # Families | Family Size |
| Married-Couple | 770 (92.7%) | 3.21 |
| Single Male/Father | 13 (1.6%) | 3.62 |
| Single Female/Mother | 48 (5.8%) | 2.96 |
| Total Families | 831 (100.0%) | 3.20 |
Median Household Size in Greenfield
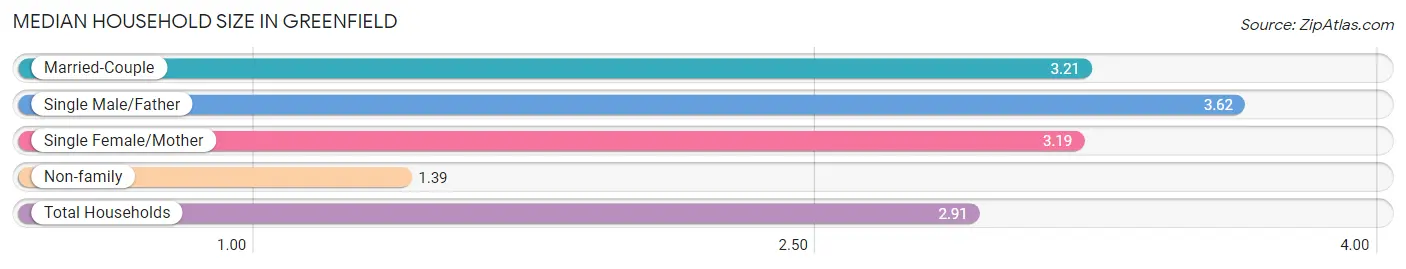
The median household size in Greenfield is 2.91 persons per household, with single male/father households (13 | 1.3%) accounting for the largest median household size of 3.62 persons per household. non-family households (170 | 17.0%) represent the smallest median household size with 1.39 persons per household.
| Household Type | # Households | Household Size |
| Married-Couple | 770 (76.9%) | 3.21 |
| Single Male/Father | 13 (1.3%) | 3.62 |
| Single Female/Mother | 48 (4.8%) | 3.19 |
| Non-family | 170 (17.0%) | 1.39 |
| Total Households | 1,001 (100.0%) | 2.91 |
Household Size by Marriage Status in Greenfield
Out of a total of 1,001 households in Greenfield, 831 (83.0%) are family households, while 170 (17.0%) are nonfamily households. The most numerous type of family households are 2-person households, comprising 392, and the most common type of nonfamily households are 1-person households, comprising 137.
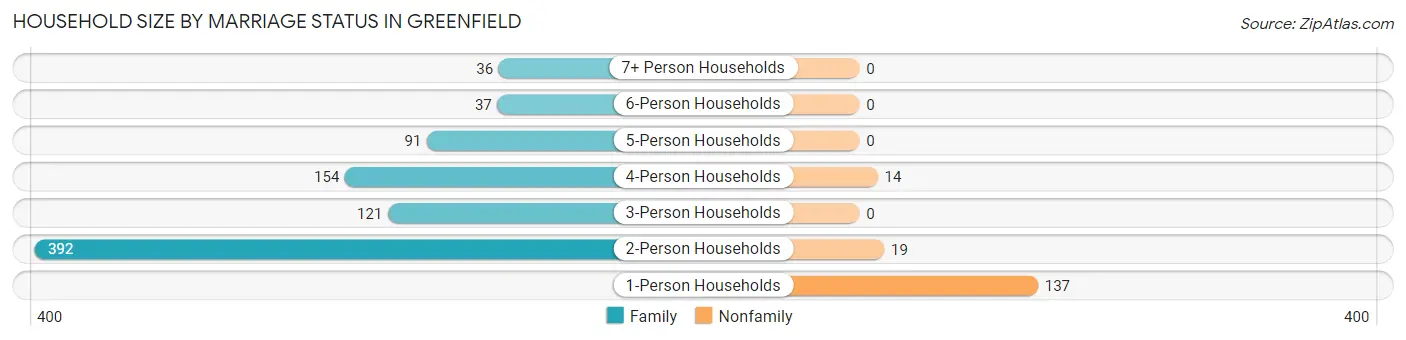
| Household Size | Family Households | Nonfamily Households |
| 1-Person Households | - | 137 (13.7%) |
| 2-Person Households | 392 (39.2%) | 19 (1.9%) |
| 3-Person Households | 121 (12.1%) | 0 (0.0%) |
| 4-Person Households | 154 (15.4%) | 14 (1.4%) |
| 5-Person Households | 91 (9.1%) | 0 (0.0%) |
| 6-Person Households | 37 (3.7%) | 0 (0.0%) |
| 7+ Person Households | 36 (3.6%) | 0 (0.0%) |
| Total | 831 (83.0%) | 170 (17.0%) |
Female Fertility in Greenfield
Fertility by Age in Greenfield
Average fertility rate in Greenfield is 34.0 births per 1,000 women. Women in the age bracket of 20 to 34 years have the highest fertility rate with 164.0 births per 1,000 women. Women in the age bracket of 20 to 34 years acount for 100.0% of all women with births.
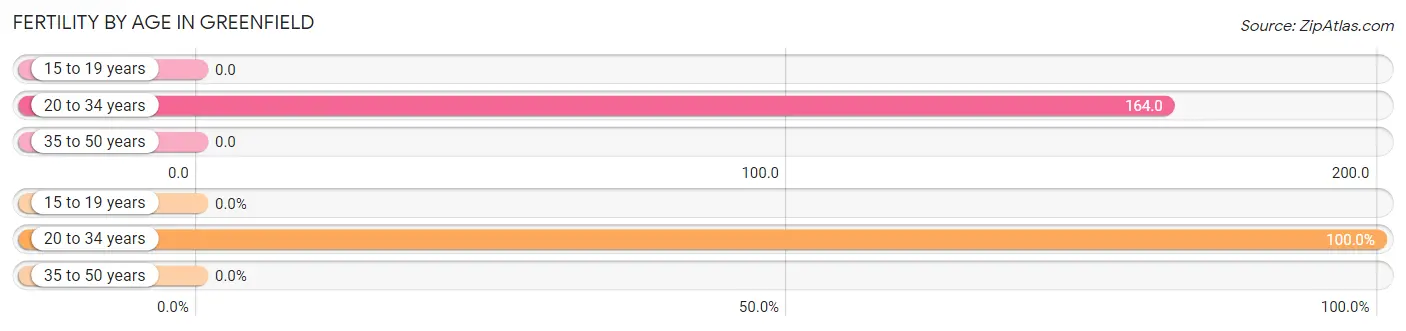
| Age Bracket | Women with Births | Births / 1,000 Women |
| 15 to 19 years | 0 (0.0%) | 0.0 |
| 20 to 34 years | 22 (100.0%) | 164.0 |
| 35 to 50 years | 0 (0.0%) | 0.0 |
| Total | 22 (100.0%) | 34.0 |
Fertility by Age by Marriage Status in Greenfield
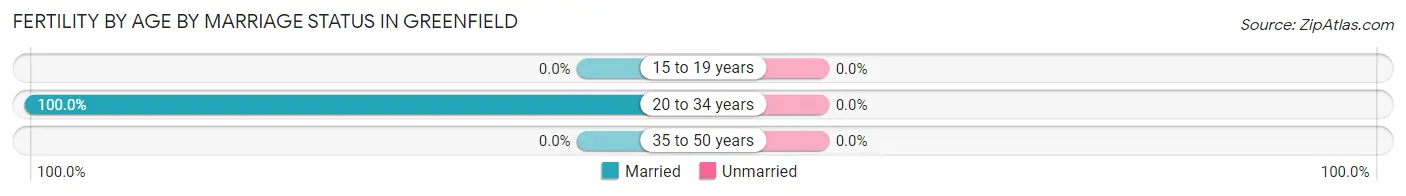
| Age Bracket | Married | Unmarried |
| 15 to 19 years | 0 (0.0%) | 0 (0.0%) |
| 20 to 34 years | 22 (100.0%) | 0 (0.0%) |
| 35 to 50 years | 0 (0.0%) | 0 (0.0%) |
| Total | 22 (100.0%) | 0 (0.0%) |
Fertility by Education in Greenfield
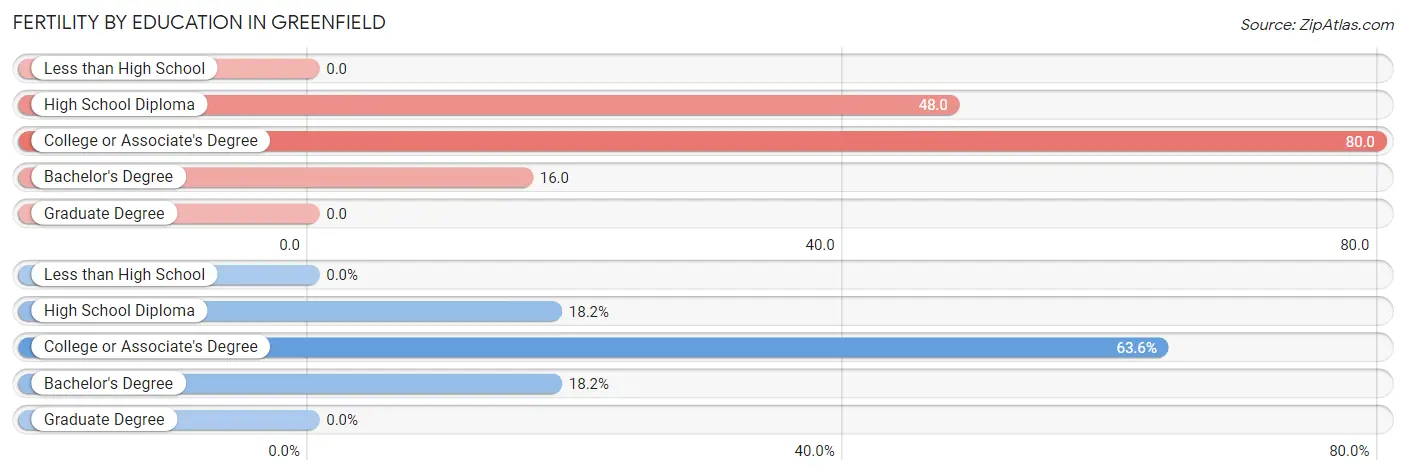
| Educational Attainment | Women with Births | Births / 1,000 Women |
| Less than High School | 0 (0.0%) | 0.0 |
| High School Diploma | 4 (18.2%) | 48.0 |
| College or Associate's Degree | 14 (63.6%) | 80.0 |
| Bachelor's Degree | 4 (18.2%) | 16.0 |
| Graduate Degree | 0 (0.0%) | 0.0 |
| Total | 22 (100.0%) | 34.0 |
Fertility by Education by Marriage Status in Greenfield
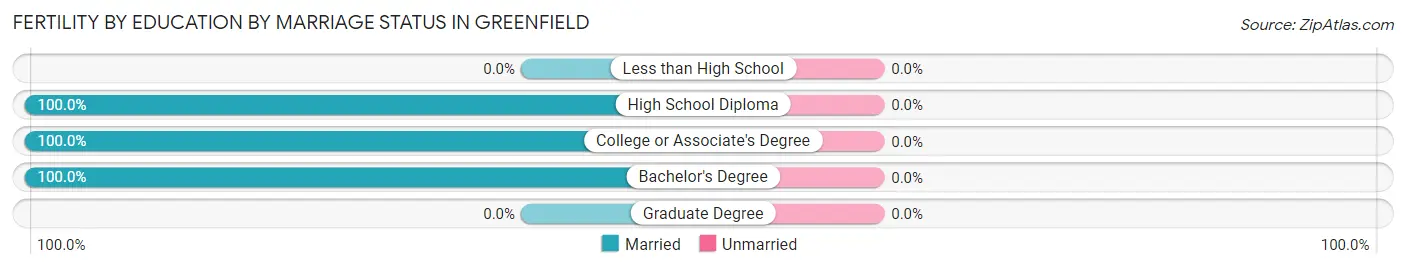
| Educational Attainment | Married | Unmarried |
| Less than High School | 0 (0.0%) | 0 (0.0%) |
| High School Diploma | 4 (100.0%) | 0 (0.0%) |
| College or Associate's Degree | 14 (100.0%) | 0 (0.0%) |
| Bachelor's Degree | 4 (100.0%) | 0 (0.0%) |
| Graduate Degree | 0 (0.0%) | 0 (0.0%) |
| Total | 22 (100.0%) | 0 (0.0%) |
Employment Characteristics in Greenfield
Employment by Class of Employer in Greenfield
Among the 1,521 employed individuals in Greenfield, private company employees (1,090 | 71.7%), not-for-profit organizations (131 | 8.6%), and self-employed (incorporated) (117 | 7.7%) make up the most common classes of employment.
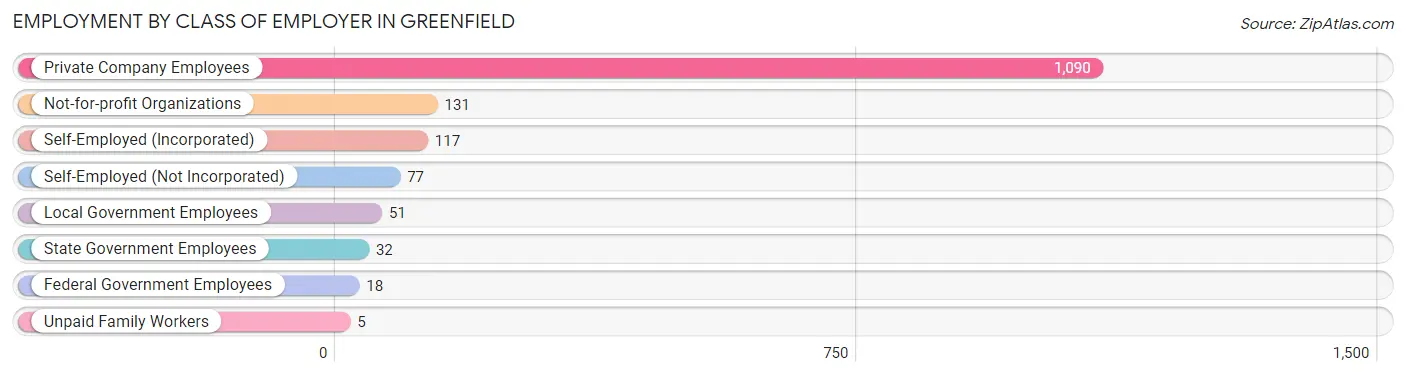
| Employer Class | # Employees | % Employees |
| Private Company Employees | 1,090 | 71.7% |
| Self-Employed (Incorporated) | 117 | 7.7% |
| Self-Employed (Not Incorporated) | 77 | 5.1% |
| Not-for-profit Organizations | 131 | 8.6% |
| Local Government Employees | 51 | 3.4% |
| State Government Employees | 32 | 2.1% |
| Federal Government Employees | 18 | 1.2% |
| Unpaid Family Workers | 5 | 0.3% |
| Total | 1,521 | 100.0% |
Employment Status by Age in Greenfield
According to the labor force statistics for Greenfield, out of the total population over 16 years of age (2,273), 69.3% or 1,575 individuals are in the labor force, with 0.8% or 13 of them unemployed. The age group with the highest labor force participation rate is 25 to 29 years, with 100.0% or 98 individuals in the labor force. Within the labor force, the 25 to 29 years age range has the highest percentage of unemployed individuals, with 4.1% or 4 of them being unemployed.
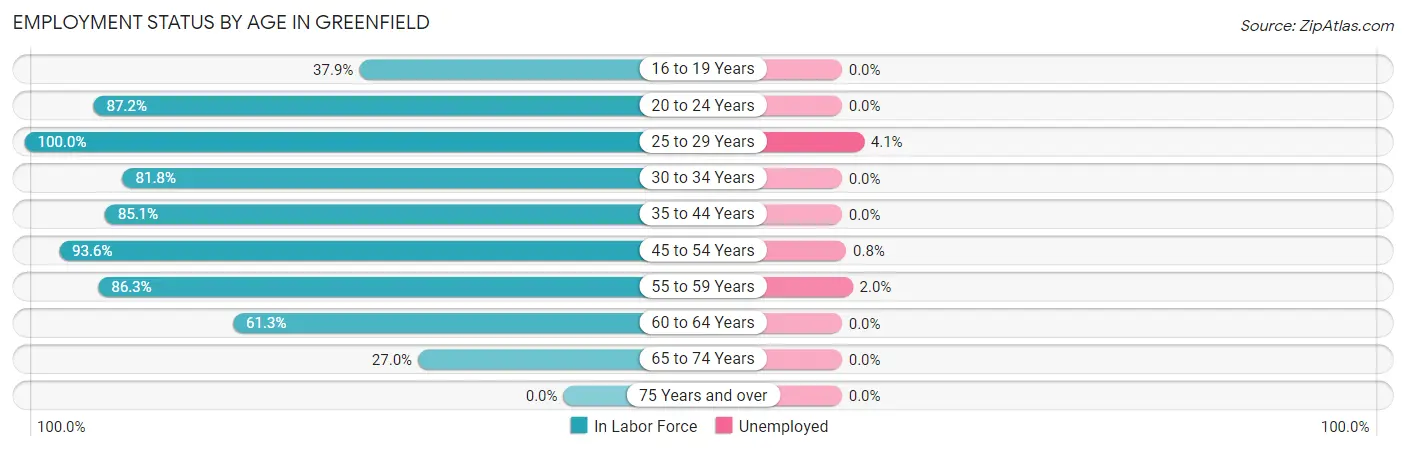
| Age Bracket | In Labor Force | Unemployed |
| 16 to 19 Years | 75 (37.9%) | 0 (0.0%) |
| 20 to 24 Years | 82 (87.2%) | 0 (0.0%) |
| 25 to 29 Years | 98 (100.0%) | 4 (4.1%) |
| 30 to 34 Years | 63 (81.8%) | 0 (0.0%) |
| 35 to 44 Years | 292 (85.1%) | 0 (0.0%) |
| 45 to 54 Years | 508 (93.6%) | 4 (0.8%) |
| 55 to 59 Years | 252 (86.3%) | 5 (2.0%) |
| 60 to 64 Years | 119 (61.3%) | 0 (0.0%) |
| 65 to 74 Years | 86 (27.0%) | 0 (0.0%) |
| 75 Years and over | 0 (0.0%) | 0 (0.0%) |
| Total | 1,575 (69.3%) | 13 (0.8%) |
Employment Status by Educational Attainment in Greenfield
According to labor force statistics for Greenfield, 86.1% of individuals (1,332) out of the total population between 25 and 64 years of age (1,547) are in the labor force, with 1.0% or 13 of them being unemployed. The group with the highest labor force participation rate are those with the educational attainment of less than high school, with 100.0% or 5 individuals in the labor force. Within the labor force, individuals with bachelor's degree or higher education have the highest percentage of unemployment, with 1.8% or 13 of them being unemployed.
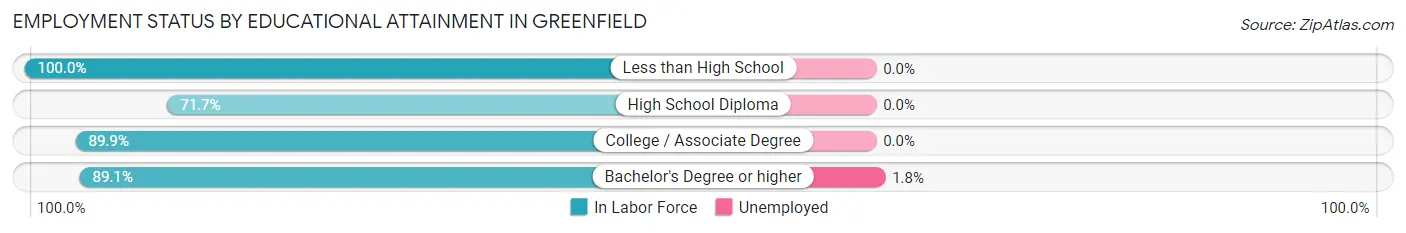
| Educational Attainment | In Labor Force | Unemployed |
| Less than High School | 5 (100.0%) | 0 (0.0%) |
| High School Diploma | 208 (71.7%) | 0 (0.0%) |
| College / Associate Degree | 392 (89.9%) | 0 (0.0%) |
| Bachelor's Degree or higher | 727 (89.1%) | 15 (1.8%) |
| Total | 1,332 (86.1%) | 15 (1.0%) |
Employment Occupations by Sex in Greenfield
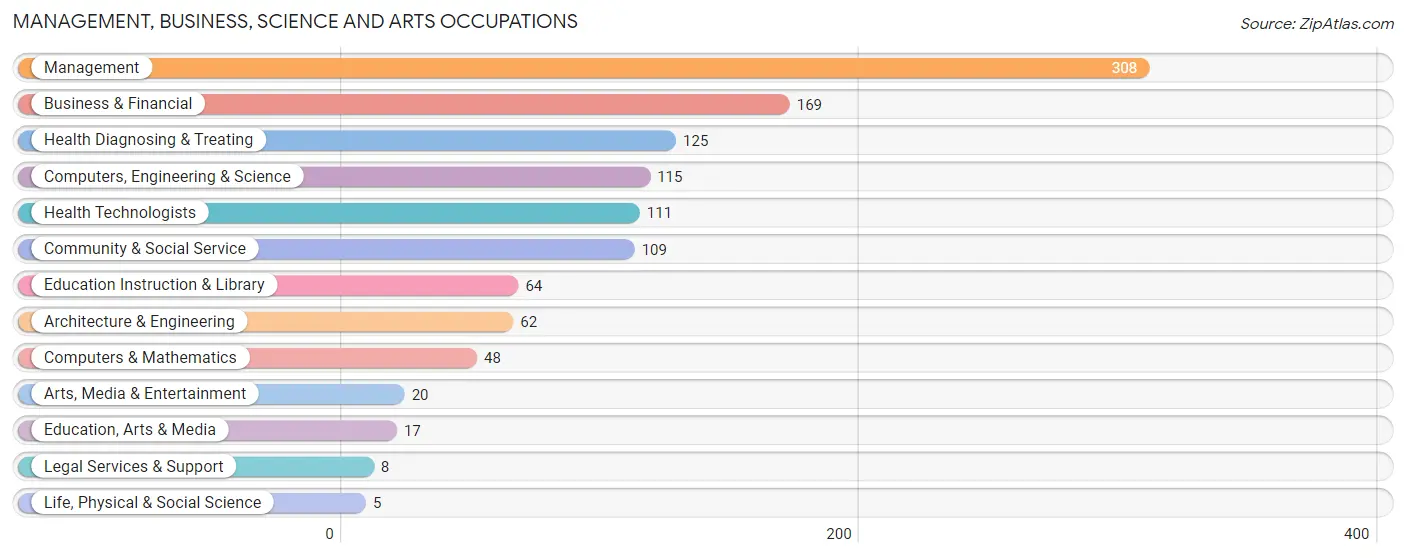
Management, Business, Science and Arts Occupations
The most common Management, Business, Science and Arts occupations in Greenfield are Management (308 | 19.7%), Business & Financial (169 | 10.8%), Health Diagnosing & Treating (125 | 8.0%), Computers, Engineering & Science (115 | 7.4%), and Health Technologists (111 | 7.1%).
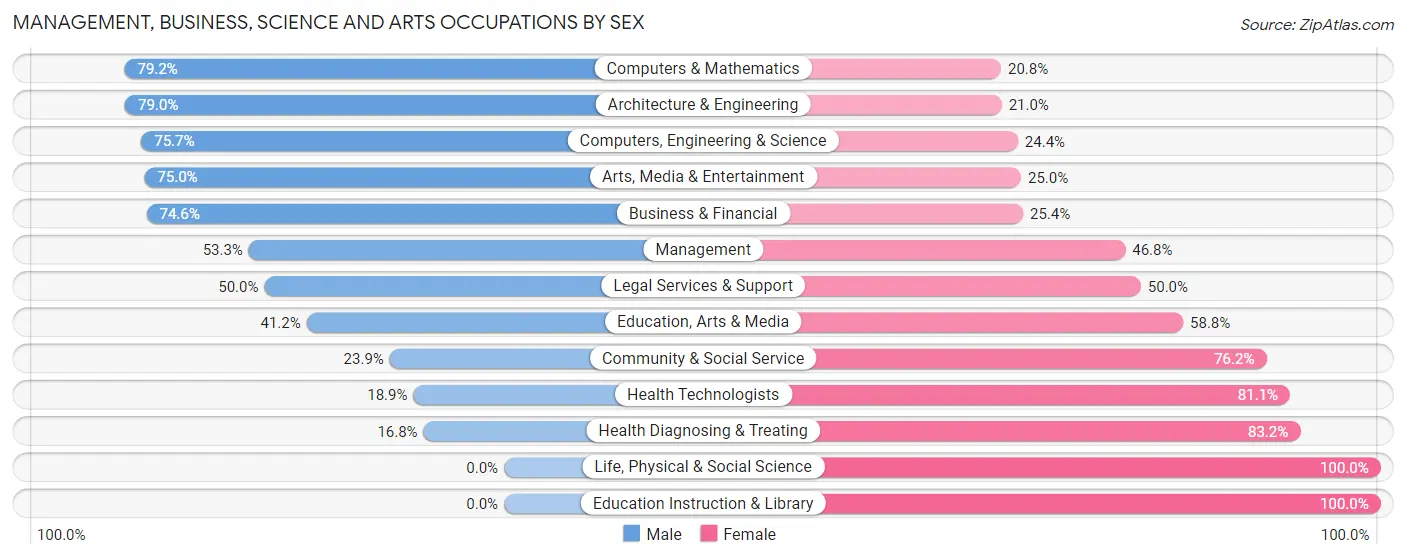
Management, Business, Science and Arts Occupations by Sex
Within the Management, Business, Science and Arts occupations in Greenfield, the most male-oriented occupations are Computers & Mathematics (79.2%), Architecture & Engineering (79.0%), and Computers, Engineering & Science (75.6%), while the most female-oriented occupations are Life, Physical & Social Science (100.0%), Education Instruction & Library (100.0%), and Health Diagnosing & Treating (83.2%).
| Occupation | Male | Female |
| Management | 164 (53.2%) | 144 (46.8%) |
| Business & Financial | 126 (74.6%) | 43 (25.4%) |
| Computers, Engineering & Science | 87 (75.6%) | 28 (24.3%) |
| Computers & Mathematics | 38 (79.2%) | 10 (20.8%) |
| Architecture & Engineering | 49 (79.0%) | 13 (21.0%) |
| Life, Physical & Social Science | 0 (0.0%) | 5 (100.0%) |
| Community & Social Service | 26 (23.8%) | 83 (76.1%) |
| Education, Arts & Media | 7 (41.2%) | 10 (58.8%) |
| Legal Services & Support | 4 (50.0%) | 4 (50.0%) |
| Education Instruction & Library | 0 (0.0%) | 64 (100.0%) |
| Arts, Media & Entertainment | 15 (75.0%) | 5 (25.0%) |
| Health Diagnosing & Treating | 21 (16.8%) | 104 (83.2%) |
| Health Technologists | 21 (18.9%) | 90 (81.1%) |
| Total (Category) | 424 (51.3%) | 402 (48.7%) |
| Total (Overall) | 793 (50.8%) | 769 (49.2%) |
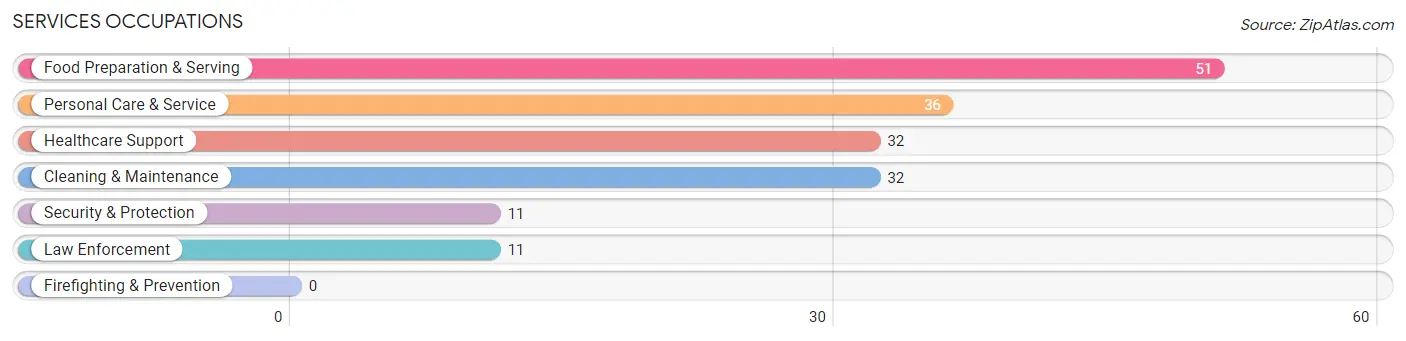
Services Occupations
The most common Services occupations in Greenfield are Food Preparation & Serving (51 | 3.3%), Personal Care & Service (36 | 2.3%), Healthcare Support (32 | 2.1%), Cleaning & Maintenance (32 | 2.1%), and Security & Protection (11 | 0.7%).
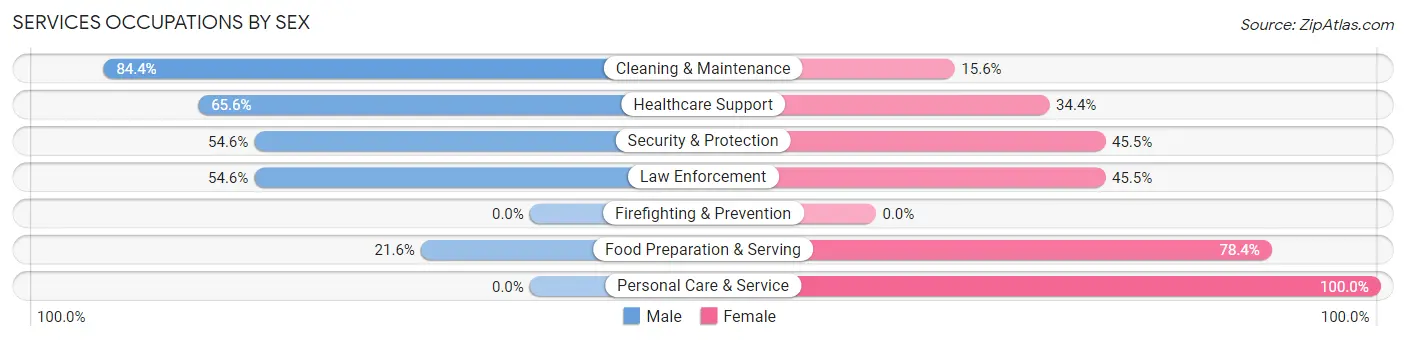
Services Occupations by Sex
Within the Services occupations in Greenfield, the most male-oriented occupations are Cleaning & Maintenance (84.4%), Healthcare Support (65.6%), and Security & Protection (54.5%), while the most female-oriented occupations are Personal Care & Service (100.0%), Food Preparation & Serving (78.4%), and Security & Protection (45.5%).
| Occupation | Male | Female |
| Healthcare Support | 21 (65.6%) | 11 (34.4%) |
| Security & Protection | 6 (54.5%) | 5 (45.5%) |
| Firefighting & Prevention | 0 (0.0%) | 0 (0.0%) |
| Law Enforcement | 6 (54.5%) | 5 (45.5%) |
| Food Preparation & Serving | 11 (21.6%) | 40 (78.4%) |
| Cleaning & Maintenance | 27 (84.4%) | 5 (15.6%) |
| Personal Care & Service | 0 (0.0%) | 36 (100.0%) |
| Total (Category) | 65 (40.1%) | 97 (59.9%) |
| Total (Overall) | 793 (50.8%) | 769 (49.2%) |
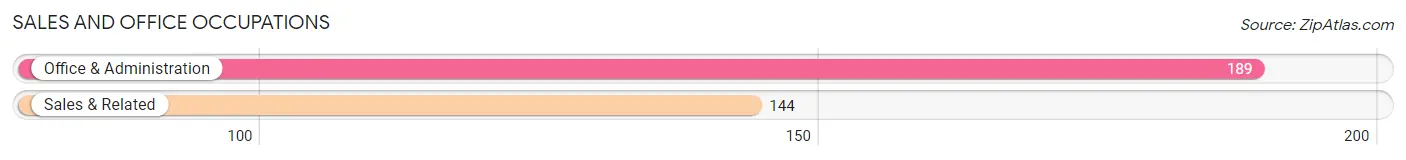
Sales and Office Occupations
The most common Sales and Office occupations in Greenfield are Office & Administration (189 | 12.1%), and Sales & Related (144 | 9.2%).
Sales and Office Occupations by Sex
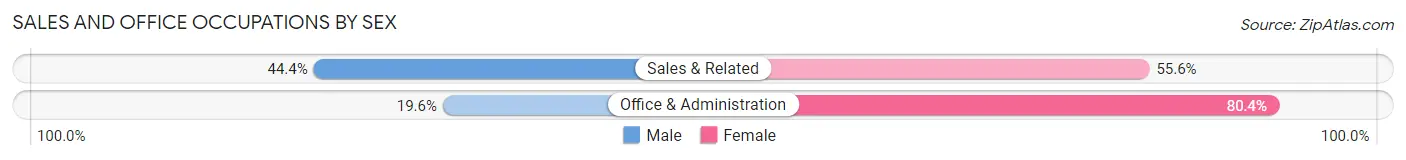
| Occupation | Male | Female |
| Sales & Related | 64 (44.4%) | 80 (55.6%) |
| Office & Administration | 37 (19.6%) | 152 (80.4%) |
| Total (Category) | 101 (30.3%) | 232 (69.7%) |
| Total (Overall) | 793 (50.8%) | 769 (49.2%) |
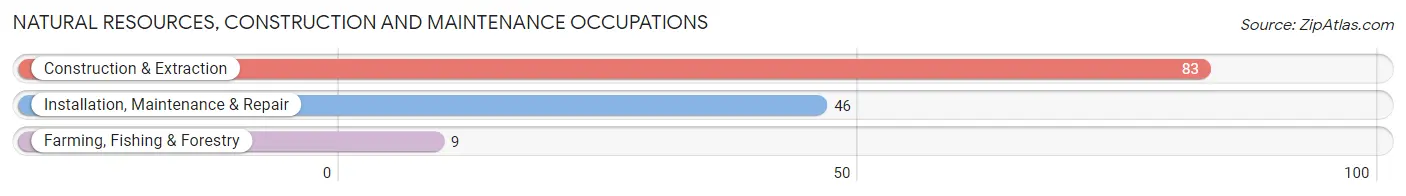
Natural Resources, Construction and Maintenance Occupations
The most common Natural Resources, Construction and Maintenance occupations in Greenfield are Construction & Extraction (83 | 5.3%), Installation, Maintenance & Repair (46 | 2.9%), and Farming, Fishing & Forestry (9 | 0.6%).
Natural Resources, Construction and Maintenance Occupations by Sex
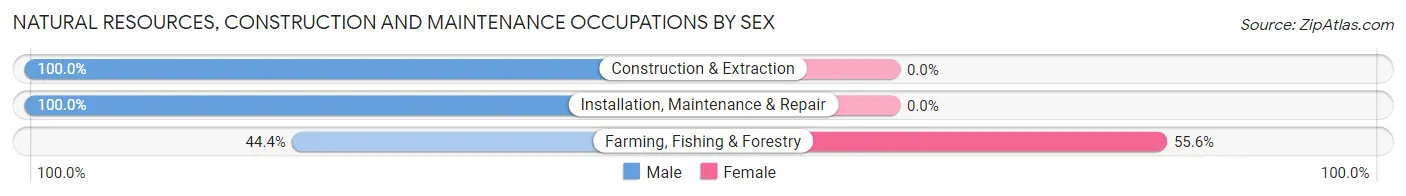
| Occupation | Male | Female |
| Farming, Fishing & Forestry | 4 (44.4%) | 5 (55.6%) |
| Construction & Extraction | 83 (100.0%) | 0 (0.0%) |
| Installation, Maintenance & Repair | 46 (100.0%) | 0 (0.0%) |
| Total (Category) | 133 (96.4%) | 5 (3.6%) |
| Total (Overall) | 793 (50.8%) | 769 (49.2%) |
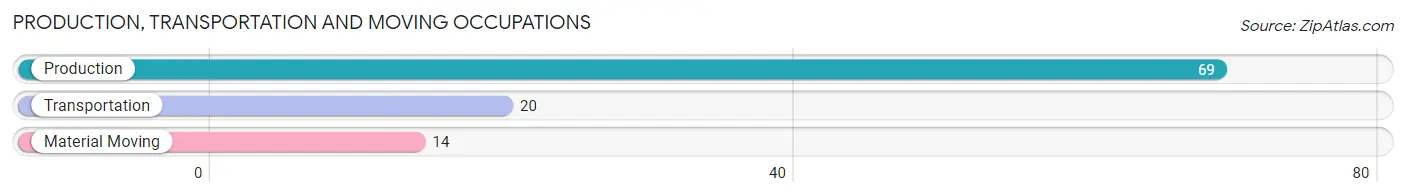
Production, Transportation and Moving Occupations
The most common Production, Transportation and Moving occupations in Greenfield are Production (69 | 4.4%), Transportation (20 | 1.3%), and Material Moving (14 | 0.9%).
Production, Transportation and Moving Occupations by Sex
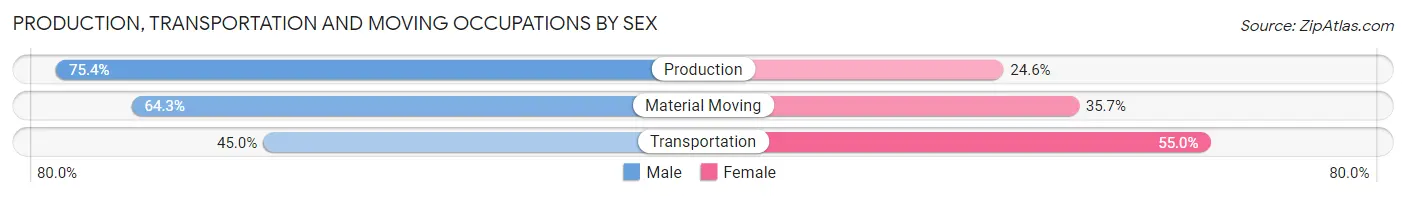
| Occupation | Male | Female |
| Production | 52 (75.4%) | 17 (24.6%) |
| Transportation | 9 (45.0%) | 11 (55.0%) |
| Material Moving | 9 (64.3%) | 5 (35.7%) |
| Total (Category) | 70 (68.0%) | 33 (32.0%) |
| Total (Overall) | 793 (50.8%) | 769 (49.2%) |
Employment Industries by Sex in Greenfield
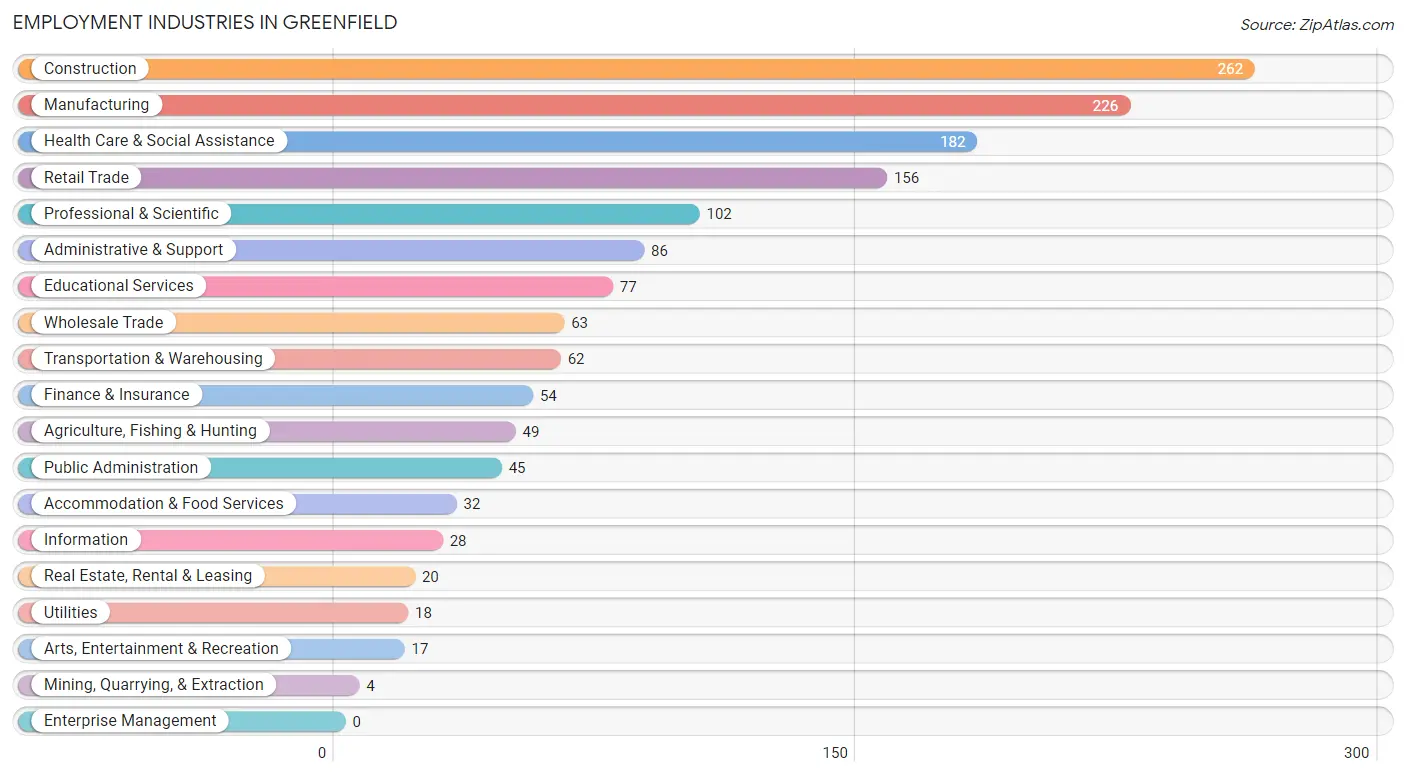
Employment Industries in Greenfield
The major employment industries in Greenfield include Construction (262 | 16.8%), Manufacturing (226 | 14.5%), Health Care & Social Assistance (182 | 11.7%), Retail Trade (156 | 10.0%), and Professional & Scientific (102 | 6.5%).
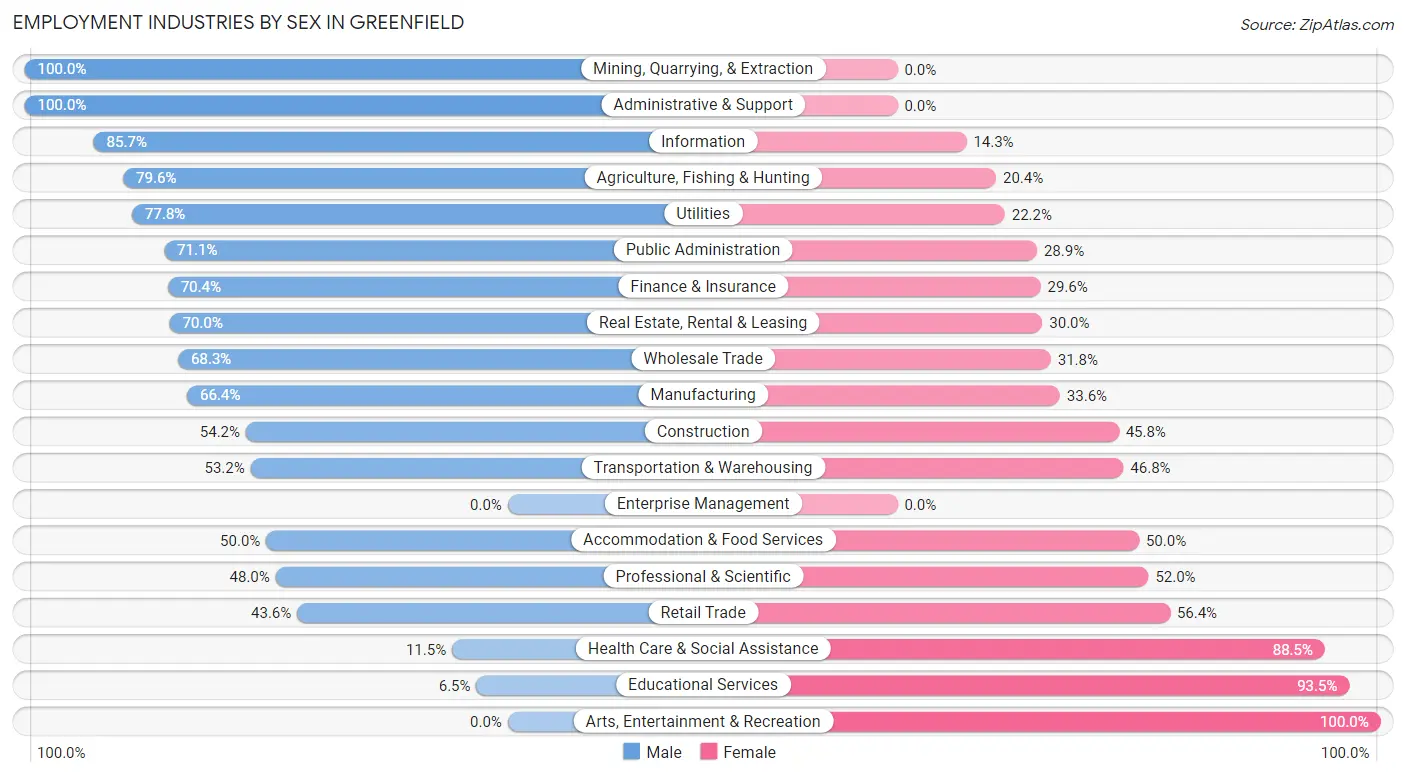
Employment Industries by Sex in Greenfield
The Greenfield industries that see more men than women are Mining, Quarrying, & Extraction (100.0%), Administrative & Support (100.0%), and Information (85.7%), whereas the industries that tend to have a higher number of women are Arts, Entertainment & Recreation (100.0%), Educational Services (93.5%), and Health Care & Social Assistance (88.5%).
| Industry | Male | Female |
| Agriculture, Fishing & Hunting | 39 (79.6%) | 10 (20.4%) |
| Mining, Quarrying, & Extraction | 4 (100.0%) | 0 (0.0%) |
| Construction | 142 (54.2%) | 120 (45.8%) |
| Manufacturing | 150 (66.4%) | 76 (33.6%) |
| Wholesale Trade | 43 (68.2%) | 20 (31.8%) |
| Retail Trade | 68 (43.6%) | 88 (56.4%) |
| Transportation & Warehousing | 33 (53.2%) | 29 (46.8%) |
| Utilities | 14 (77.8%) | 4 (22.2%) |
| Information | 24 (85.7%) | 4 (14.3%) |
| Finance & Insurance | 38 (70.4%) | 16 (29.6%) |
| Real Estate, Rental & Leasing | 14 (70.0%) | 6 (30.0%) |
| Professional & Scientific | 49 (48.0%) | 53 (52.0%) |
| Enterprise Management | 0 (0.0%) | 0 (0.0%) |
| Administrative & Support | 86 (100.0%) | 0 (0.0%) |
| Educational Services | 5 (6.5%) | 72 (93.5%) |
| Health Care & Social Assistance | 21 (11.5%) | 161 (88.5%) |
| Arts, Entertainment & Recreation | 0 (0.0%) | 17 (100.0%) |
| Accommodation & Food Services | 16 (50.0%) | 16 (50.0%) |
| Public Administration | 32 (71.1%) | 13 (28.9%) |
| Total | 793 (50.8%) | 769 (49.2%) |
Education in Greenfield
School Enrollment in Greenfield
The most common levels of schooling among the 835 students in Greenfield are high school (266 | 31.9%), middle school (183 | 21.9%), and elementary school (128 | 15.3%).
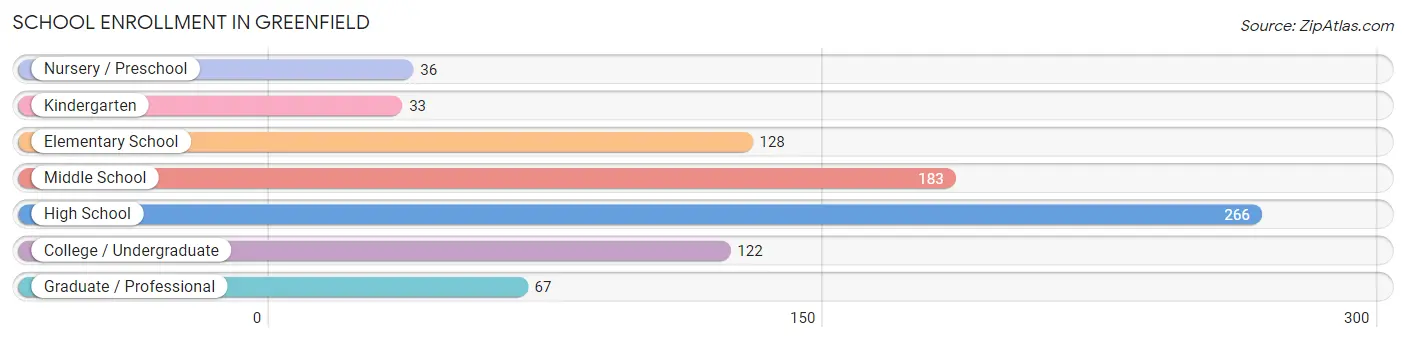
| School Level | # Students | % Students |
| Nursery / Preschool | 36 | 4.3% |
| Kindergarten | 33 | 4.0% |
| Elementary School | 128 | 15.3% |
| Middle School | 183 | 21.9% |
| High School | 266 | 31.9% |
| College / Undergraduate | 122 | 14.6% |
| Graduate / Professional | 67 | 8.0% |
| Total | 835 | 100.0% |
School Enrollment by Age by Funding Source in Greenfield
Out of a total of 835 students who are enrolled in schools in Greenfield, 154 (18.4%) attend a private institution, while the remaining 681 (81.6%) are enrolled in public schools. The age group of 3 to 4 year olds has the highest likelihood of being enrolled in private schools, with 17 (65.4% in the age bracket) enrolled. Conversely, the age group of 20 to 24 year olds has the lowest likelihood of being enrolled in a private school, with 33 (100.0% in the age bracket) attending a public institution.
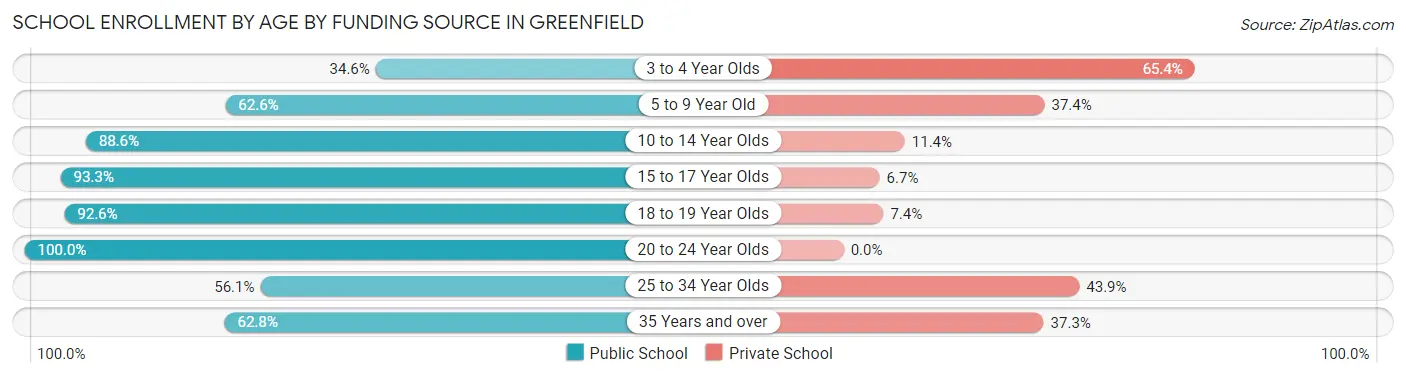
| Age Bracket | Public School | Private School |
| 3 to 4 Year Olds | 9 (34.6%) | 17 (65.4%) |
| 5 to 9 Year Old | 87 (62.6%) | 52 (37.4%) |
| 10 to 14 Year Olds | 202 (88.6%) | 26 (11.4%) |
| 15 to 17 Year Olds | 195 (93.3%) | 14 (6.7%) |
| 18 to 19 Year Olds | 100 (92.6%) | 8 (7.4%) |
| 20 to 24 Year Olds | 33 (100.0%) | 0 (0.0%) |
| 25 to 34 Year Olds | 23 (56.1%) | 18 (43.9%) |
| 35 Years and over | 32 (62.7%) | 19 (37.2%) |
| Total | 681 (81.6%) | 154 (18.4%) |
Educational Attainment by Field of Study in Greenfield
Business (329 | 28.1%), bio, nature & agricultural (136 | 11.6%), science & technology (118 | 10.1%), education (114 | 9.7%), and communications (88 | 7.5%) are the most common fields of study among 1,170 individuals in Greenfield who have obtained a bachelor's degree or higher.
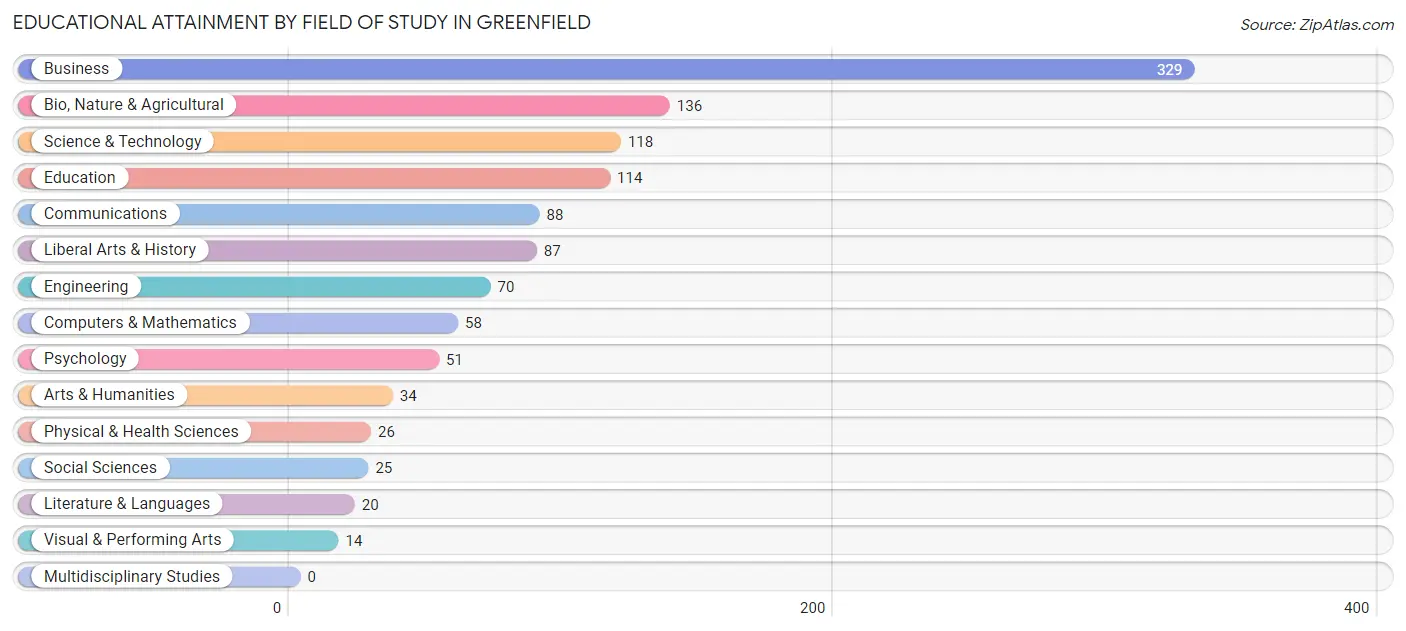
| Field of Study | # Graduates | % Graduates |
| Computers & Mathematics | 58 | 5.0% |
| Bio, Nature & Agricultural | 136 | 11.6% |
| Physical & Health Sciences | 26 | 2.2% |
| Psychology | 51 | 4.4% |
| Social Sciences | 25 | 2.1% |
| Engineering | 70 | 6.0% |
| Multidisciplinary Studies | 0 | 0.0% |
| Science & Technology | 118 | 10.1% |
| Business | 329 | 28.1% |
| Education | 114 | 9.7% |
| Literature & Languages | 20 | 1.7% |
| Liberal Arts & History | 87 | 7.4% |
| Visual & Performing Arts | 14 | 1.2% |
| Communications | 88 | 7.5% |
| Arts & Humanities | 34 | 2.9% |
| Total | 1,170 | 100.0% |
Transportation & Commute in Greenfield
Vehicle Availability by Sex in Greenfield
The most prevalent vehicle ownership categories in Greenfield are males with 3 vehicles (269, accounting for 34.9%) and females with 3 vehicles (315, making up 35.8%).
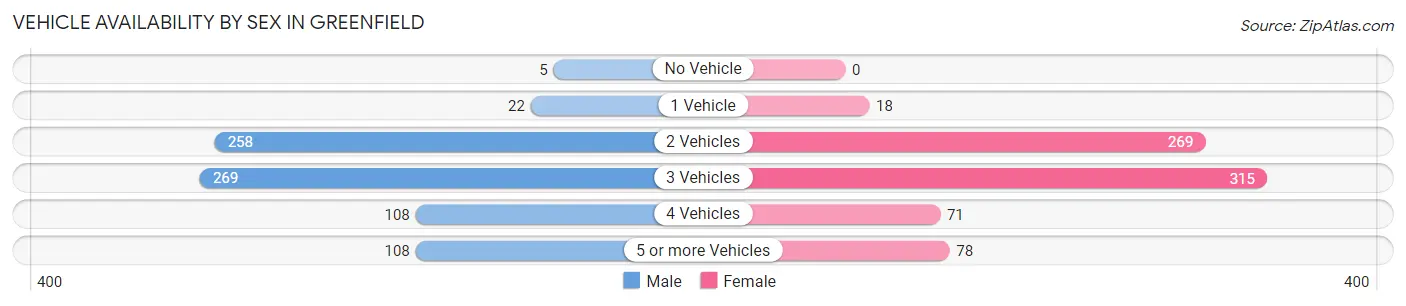
| Vehicles Available | Male | Female |
| No Vehicle | 5 (0.6%) | 0 (0.0%) |
| 1 Vehicle | 22 (2.9%) | 18 (2.4%) |
| 2 Vehicles | 258 (33.5%) | 269 (35.8%) |
| 3 Vehicles | 269 (34.9%) | 315 (41.9%) |
| 4 Vehicles | 108 (14.0%) | 71 (9.5%) |
| 5 or more Vehicles | 108 (14.0%) | 78 (10.4%) |
| Total | 770 (100.0%) | 751 (100.0%) |
Commute Time in Greenfield
The most frequently occuring commute durations in Greenfield are 45 to 59 minutes (324 commuters, 24.2%), 30 to 34 minutes (254 commuters, 19.0%), and 5 to 9 minutes (156 commuters, 11.7%).
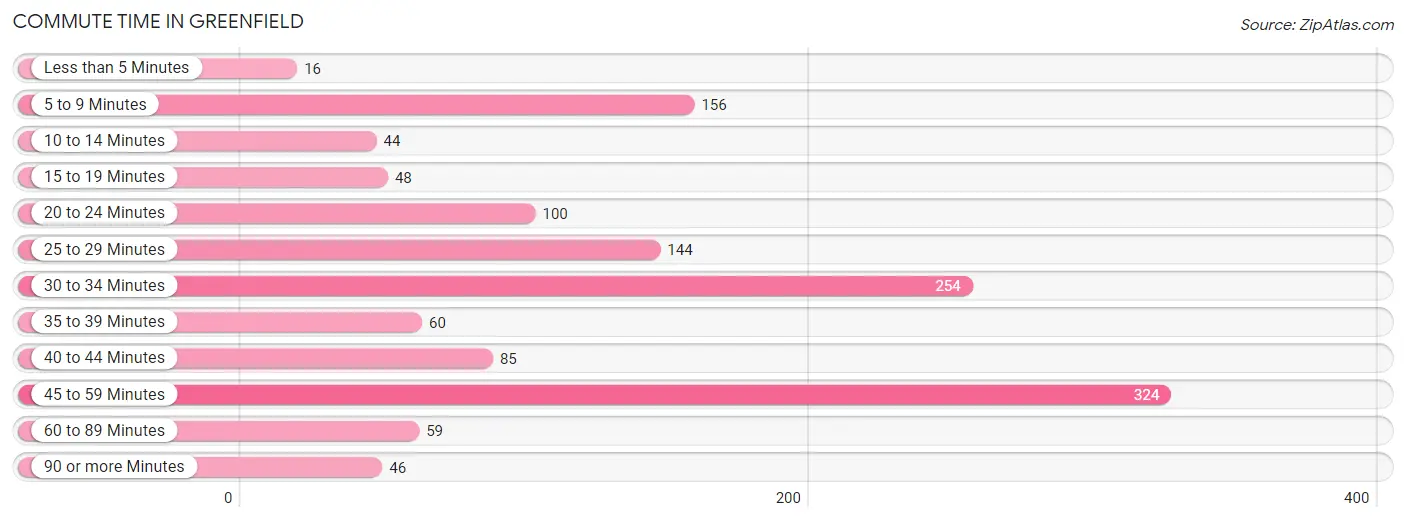
| Commute Time | # Commuters | % Commuters |
| Less than 5 Minutes | 16 | 1.2% |
| 5 to 9 Minutes | 156 | 11.7% |
| 10 to 14 Minutes | 44 | 3.3% |
| 15 to 19 Minutes | 48 | 3.6% |
| 20 to 24 Minutes | 100 | 7.5% |
| 25 to 29 Minutes | 144 | 10.8% |
| 30 to 34 Minutes | 254 | 19.0% |
| 35 to 39 Minutes | 60 | 4.5% |
| 40 to 44 Minutes | 85 | 6.4% |
| 45 to 59 Minutes | 324 | 24.2% |
| 60 to 89 Minutes | 59 | 4.4% |
| 90 or more Minutes | 46 | 3.4% |
Commute Time by Sex in Greenfield
The most common commute times in Greenfield are 30 to 34 minutes (190 commuters, 28.5%) for males and 45 to 59 minutes (174 commuters, 26.0%) for females.
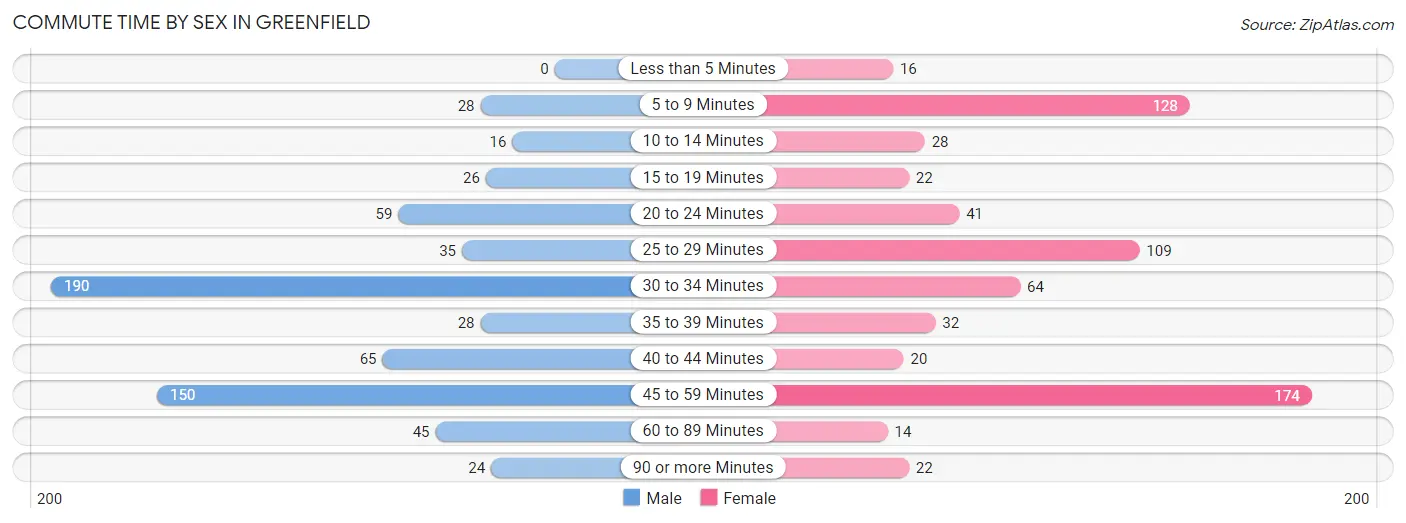
| Commute Time | Male | Female |
| Less than 5 Minutes | 0 (0.0%) | 16 (2.4%) |
| 5 to 9 Minutes | 28 (4.2%) | 128 (19.1%) |
| 10 to 14 Minutes | 16 (2.4%) | 28 (4.2%) |
| 15 to 19 Minutes | 26 (3.9%) | 22 (3.3%) |
| 20 to 24 Minutes | 59 (8.9%) | 41 (6.1%) |
| 25 to 29 Minutes | 35 (5.3%) | 109 (16.3%) |
| 30 to 34 Minutes | 190 (28.5%) | 64 (9.6%) |
| 35 to 39 Minutes | 28 (4.2%) | 32 (4.8%) |
| 40 to 44 Minutes | 65 (9.8%) | 20 (3.0%) |
| 45 to 59 Minutes | 150 (22.5%) | 174 (26.0%) |
| 60 to 89 Minutes | 45 (6.8%) | 14 (2.1%) |
| 90 or more Minutes | 24 (3.6%) | 22 (3.3%) |
Time of Departure to Work by Sex in Greenfield
The most frequent times of departure to work in Greenfield are 7:00 AM to 7:29 AM (166, 24.9%) for males and 6:00 AM to 6:29 AM (122, 18.2%) for females.
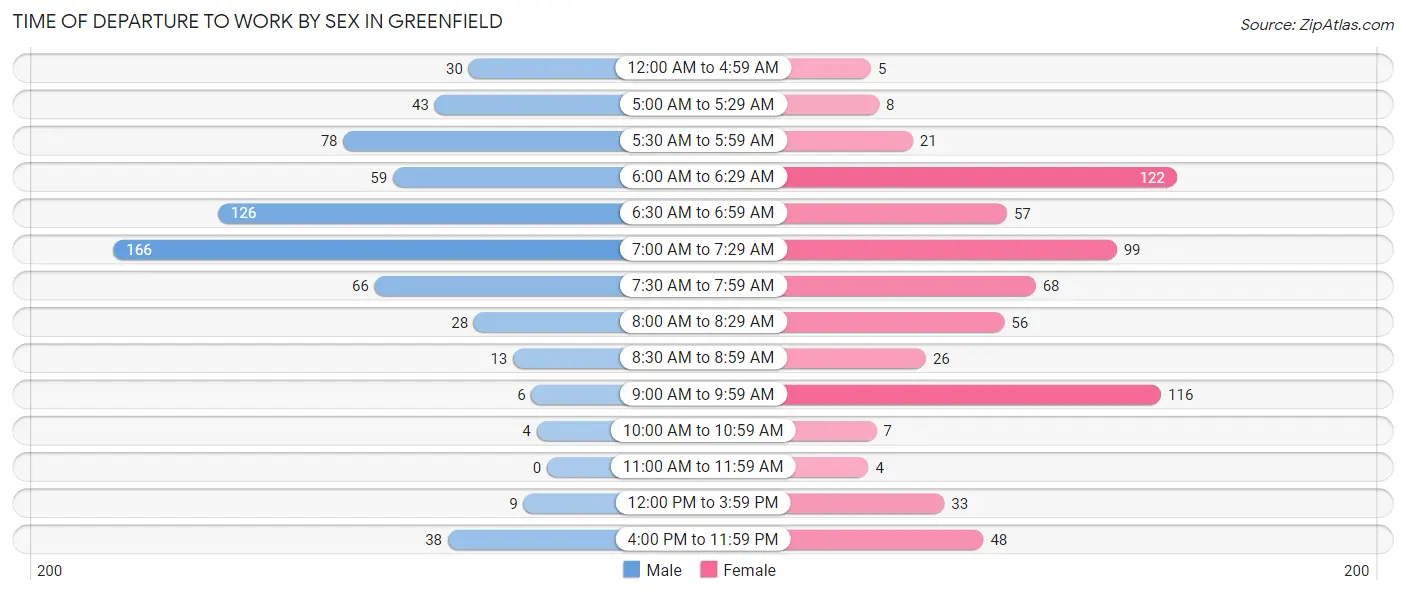
| Time of Departure | Male | Female |
| 12:00 AM to 4:59 AM | 30 (4.5%) | 5 (0.7%) |
| 5:00 AM to 5:29 AM | 43 (6.5%) | 8 (1.2%) |
| 5:30 AM to 5:59 AM | 78 (11.7%) | 21 (3.1%) |
| 6:00 AM to 6:29 AM | 59 (8.9%) | 122 (18.2%) |
| 6:30 AM to 6:59 AM | 126 (18.9%) | 57 (8.5%) |
| 7:00 AM to 7:29 AM | 166 (24.9%) | 99 (14.8%) |
| 7:30 AM to 7:59 AM | 66 (9.9%) | 68 (10.2%) |
| 8:00 AM to 8:29 AM | 28 (4.2%) | 56 (8.4%) |
| 8:30 AM to 8:59 AM | 13 (1.9%) | 26 (3.9%) |
| 9:00 AM to 9:59 AM | 6 (0.9%) | 116 (17.3%) |
| 10:00 AM to 10:59 AM | 4 (0.6%) | 7 (1.0%) |
| 11:00 AM to 11:59 AM | 0 (0.0%) | 4 (0.6%) |
| 12:00 PM to 3:59 PM | 9 (1.3%) | 33 (4.9%) |
| 4:00 PM to 11:59 PM | 38 (5.7%) | 48 (7.2%) |
| Total | 666 (100.0%) | 670 (100.0%) |
Housing Occupancy in Greenfield
Occupancy by Ownership in Greenfield
Of the total 1,001 dwellings in Greenfield, owner-occupied units account for 969 (96.8%), while renter-occupied units make up 32 (3.2%).
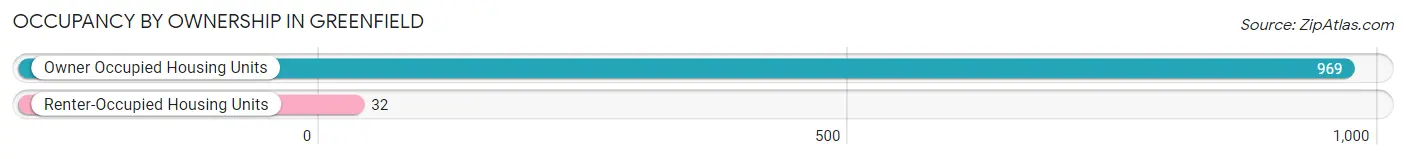
| Occupancy | # Housing Units | % Housing Units |
| Owner Occupied Housing Units | 969 | 96.8% |
| Renter-Occupied Housing Units | 32 | 3.2% |
| Total Occupied Housing Units | 1,001 | 100.0% |
Occupancy by Household Size in Greenfield
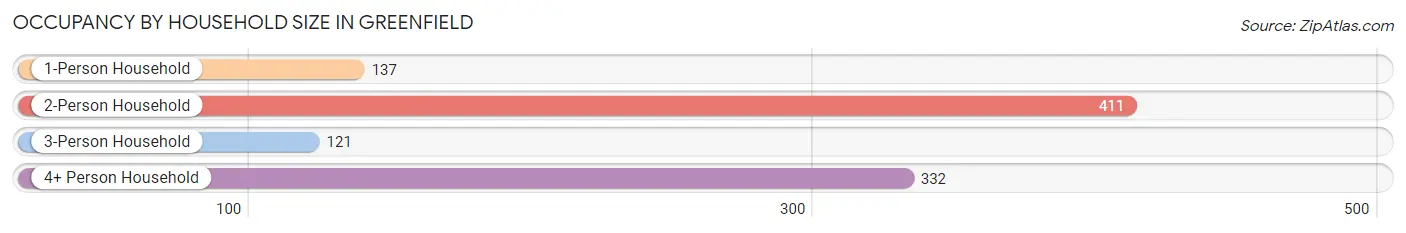
| Household Size | # Housing Units | % Housing Units |
| 1-Person Household | 137 | 13.7% |
| 2-Person Household | 411 | 41.1% |
| 3-Person Household | 121 | 12.1% |
| 4+ Person Household | 332 | 33.2% |
| Total Housing Units | 1,001 | 100.0% |
Occupancy by Ownership by Household Size in Greenfield
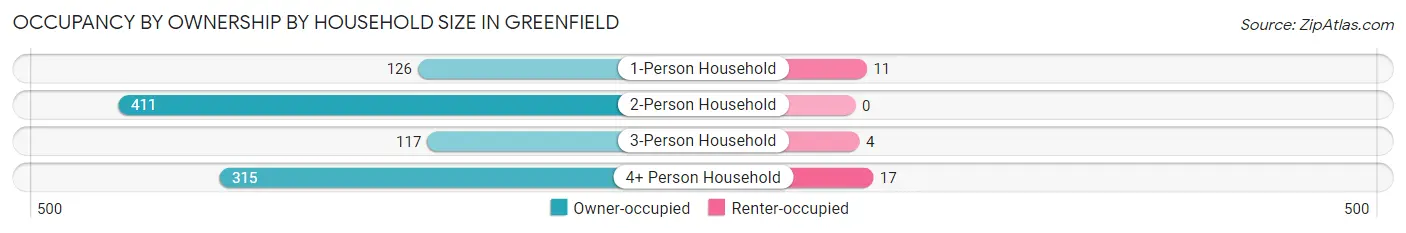
| Household Size | Owner-occupied | Renter-occupied |
| 1-Person Household | 126 (92.0%) | 11 (8.0%) |
| 2-Person Household | 411 (100.0%) | 0 (0.0%) |
| 3-Person Household | 117 (96.7%) | 4 (3.3%) |
| 4+ Person Household | 315 (94.9%) | 17 (5.1%) |
| Total Housing Units | 969 (96.8%) | 32 (3.2%) |
Occupancy by Educational Attainment in Greenfield
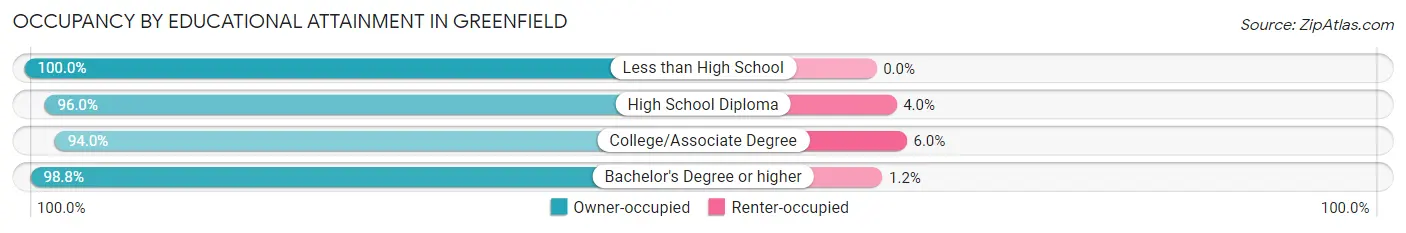
| Household Size | Owner-occupied | Renter-occupied |
| Less than High School | 11 (100.0%) | 0 (0.0%) |
| High School Diploma | 145 (96.0%) | 6 (4.0%) |
| College/Associate Degree | 312 (94.0%) | 20 (6.0%) |
| Bachelor's Degree or higher | 501 (98.8%) | 6 (1.2%) |
Occupancy by Age of Householder in Greenfield
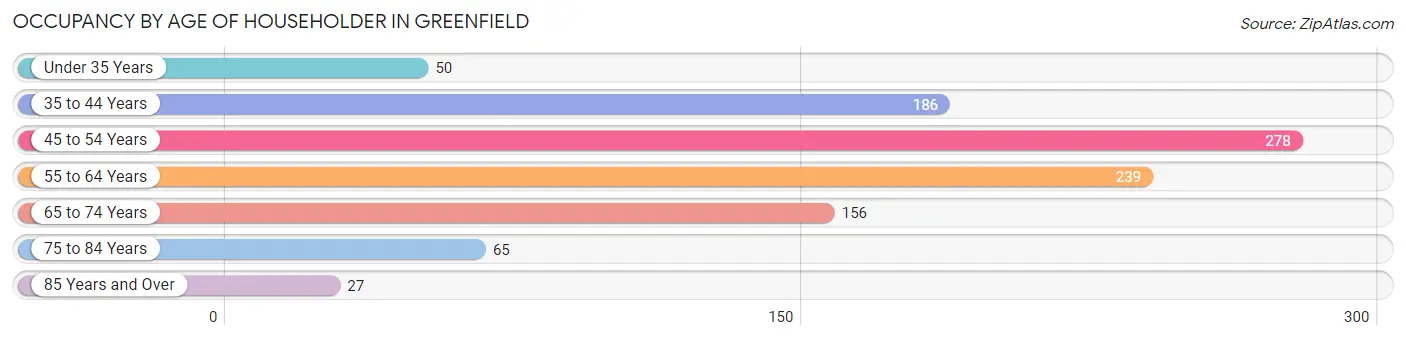
| Age Bracket | # Households | % Households |
| Under 35 Years | 50 | 5.0% |
| 35 to 44 Years | 186 | 18.6% |
| 45 to 54 Years | 278 | 27.8% |
| 55 to 64 Years | 239 | 23.9% |
| 65 to 74 Years | 156 | 15.6% |
| 75 to 84 Years | 65 | 6.5% |
| 85 Years and Over | 27 | 2.7% |
| Total | 1,001 | 100.0% |
Housing Finances in Greenfield
Median Income by Occupancy in Greenfield
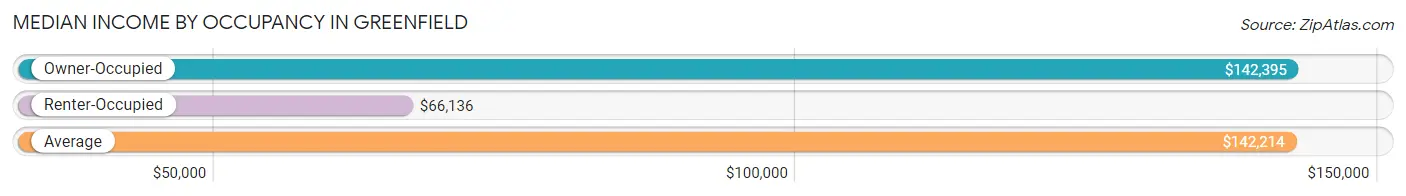
| Occupancy Type | # Households | Median Income |
| Owner-Occupied | 969 (96.8%) | $142,395 |
| Renter-Occupied | 32 (3.2%) | $66,136 |
| Average | 1,001 (100.0%) | $142,214 |
Occupancy by Householder Income Bracket in Greenfield
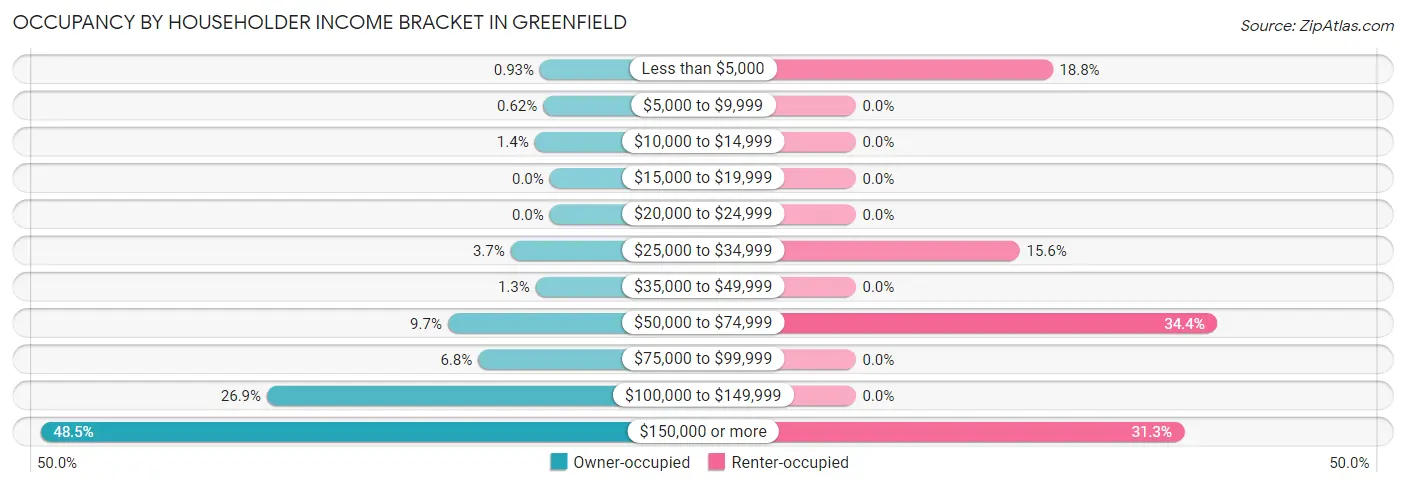
| Income Bracket | Owner-occupied | Renter-occupied |
| Less than $5,000 | 9 (0.9%) | 6 (18.8%) |
| $5,000 to $9,999 | 6 (0.6%) | 0 (0.0%) |
| $10,000 to $14,999 | 14 (1.4%) | 0 (0.0%) |
| $15,000 to $19,999 | 0 (0.0%) | 0 (0.0%) |
| $20,000 to $24,999 | 0 (0.0%) | 0 (0.0%) |
| $25,000 to $34,999 | 36 (3.7%) | 5 (15.6%) |
| $35,000 to $49,999 | 13 (1.3%) | 0 (0.0%) |
| $50,000 to $74,999 | 94 (9.7%) | 11 (34.4%) |
| $75,000 to $99,999 | 66 (6.8%) | 0 (0.0%) |
| $100,000 to $149,999 | 261 (26.9%) | 0 (0.0%) |
| $150,000 or more | 470 (48.5%) | 10 (31.2%) |
| Total | 969 (100.0%) | 32 (100.0%) |
Monthly Housing Cost Tiers in Greenfield
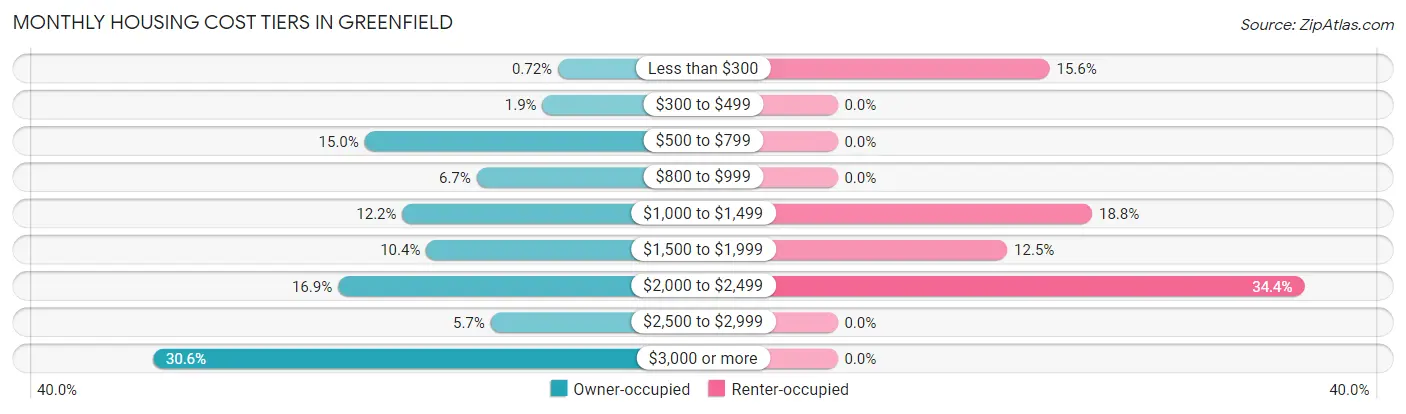
| Monthly Cost | Owner-occupied | Renter-occupied |
| Less than $300 | 7 (0.7%) | 5 (15.6%) |
| $300 to $499 | 18 (1.9%) | 0 (0.0%) |
| $500 to $799 | 145 (15.0%) | 0 (0.0%) |
| $800 to $999 | 65 (6.7%) | 0 (0.0%) |
| $1,000 to $1,499 | 118 (12.2%) | 6 (18.8%) |
| $1,500 to $1,999 | 101 (10.4%) | 4 (12.5%) |
| $2,000 to $2,499 | 164 (16.9%) | 11 (34.4%) |
| $2,500 to $2,999 | 55 (5.7%) | 0 (0.0%) |
| $3,000 or more | 296 (30.5%) | 0 (0.0%) |
| Total | 969 (100.0%) | 32 (100.0%) |
Physical Housing Characteristics in Greenfield
Housing Structures in Greenfield
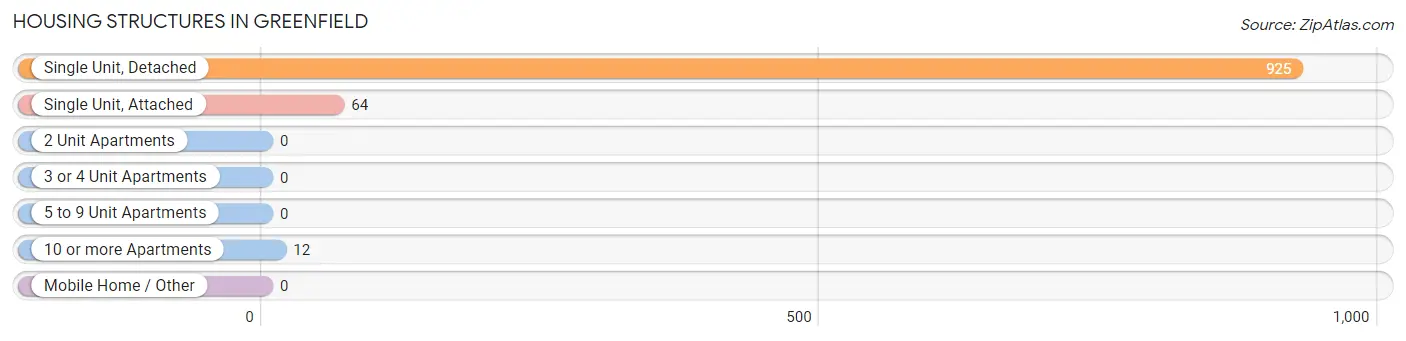
| Structure Type | # Housing Units | % Housing Units |
| Single Unit, Detached | 925 | 92.4% |
| Single Unit, Attached | 64 | 6.4% |
| 2 Unit Apartments | 0 | 0.0% |
| 3 or 4 Unit Apartments | 0 | 0.0% |
| 5 to 9 Unit Apartments | 0 | 0.0% |
| 10 or more Apartments | 12 | 1.2% |
| Mobile Home / Other | 0 | 0.0% |
| Total | 1,001 | 100.0% |
Housing Structures by Occupancy in Greenfield
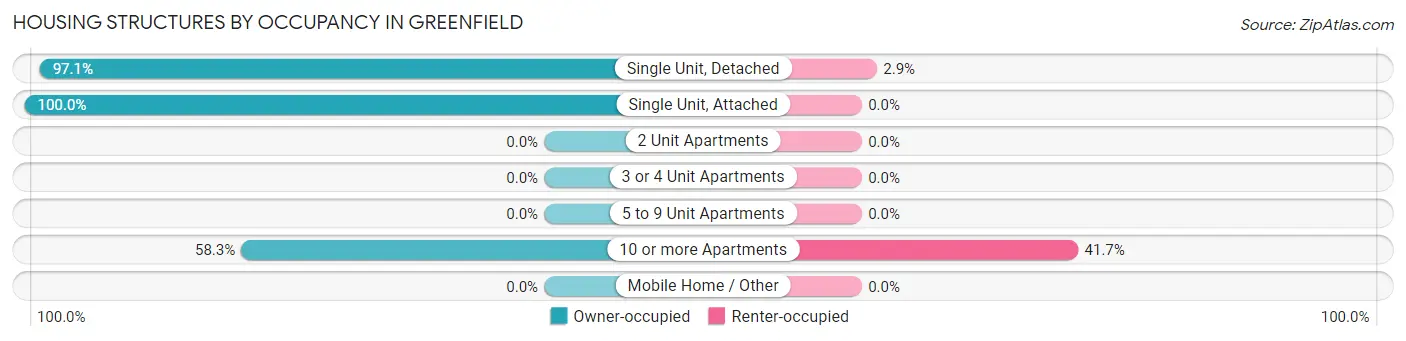
| Structure Type | Owner-occupied | Renter-occupied |
| Single Unit, Detached | 898 (97.1%) | 27 (2.9%) |
| Single Unit, Attached | 64 (100.0%) | 0 (0.0%) |
| 2 Unit Apartments | 0 (0.0%) | 0 (0.0%) |
| 3 or 4 Unit Apartments | 0 (0.0%) | 0 (0.0%) |
| 5 to 9 Unit Apartments | 0 (0.0%) | 0 (0.0%) |
| 10 or more Apartments | 7 (58.3%) | 5 (41.7%) |
| Mobile Home / Other | 0 (0.0%) | 0 (0.0%) |
| Total | 969 (96.8%) | 32 (3.2%) |
Housing Structures by Number of Rooms in Greenfield
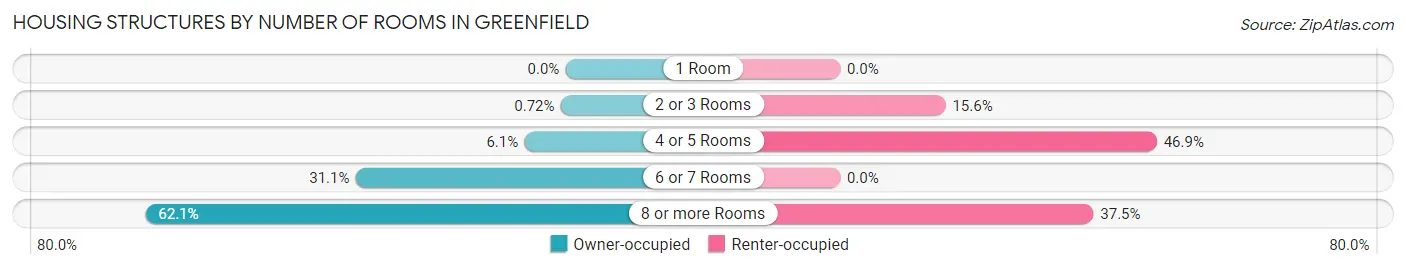
| Number of Rooms | Owner-occupied | Renter-occupied |
| 1 Room | 0 (0.0%) | 0 (0.0%) |
| 2 or 3 Rooms | 7 (0.7%) | 5 (15.6%) |
| 4 or 5 Rooms | 59 (6.1%) | 15 (46.9%) |
| 6 or 7 Rooms | 301 (31.1%) | 0 (0.0%) |
| 8 or more Rooms | 602 (62.1%) | 12 (37.5%) |
| Total | 969 (100.0%) | 32 (100.0%) |
Housing Structure by Heating Type in Greenfield
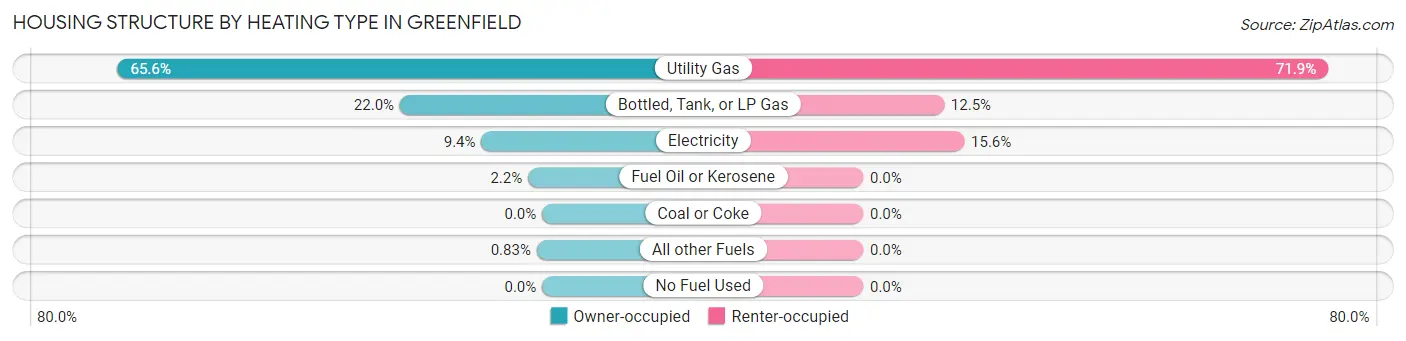
| Heating Type | Owner-occupied | Renter-occupied |
| Utility Gas | 636 (65.6%) | 23 (71.9%) |
| Bottled, Tank, or LP Gas | 213 (22.0%) | 4 (12.5%) |
| Electricity | 91 (9.4%) | 5 (15.6%) |
| Fuel Oil or Kerosene | 21 (2.2%) | 0 (0.0%) |
| Coal or Coke | 0 (0.0%) | 0 (0.0%) |
| All other Fuels | 8 (0.8%) | 0 (0.0%) |
| No Fuel Used | 0 (0.0%) | 0 (0.0%) |
| Total | 969 (100.0%) | 32 (100.0%) |
Household Vehicle Usage in Greenfield
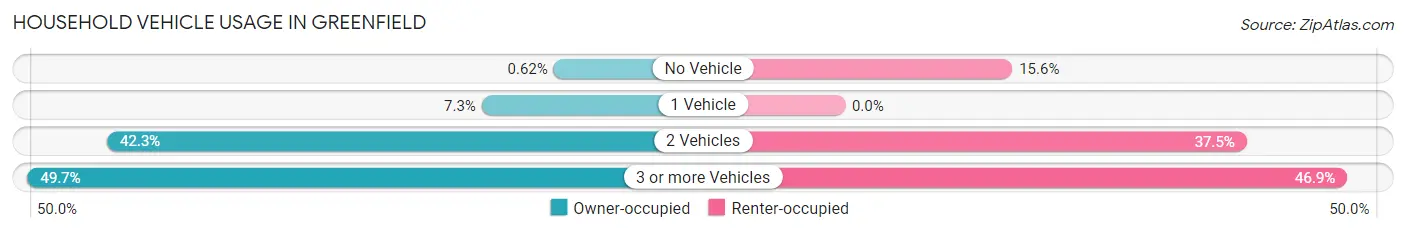
| Vehicles per Household | Owner-occupied | Renter-occupied |
| No Vehicle | 6 (0.6%) | 5 (15.6%) |
| 1 Vehicle | 71 (7.3%) | 0 (0.0%) |
| 2 Vehicles | 410 (42.3%) | 12 (37.5%) |
| 3 or more Vehicles | 482 (49.7%) | 15 (46.9%) |
| Total | 969 (100.0%) | 32 (100.0%) |
Real Estate & Mortgages in Greenfield
Real Estate and Mortgage Overview in Greenfield
| Characteristic | Without Mortgage | With Mortgage |
| Housing Units | 282 | 687 |
| Median Property Value | $471,200 | $517,900 |
| Median Household Income | $117,905 | $390 |
| Monthly Housing Costs | $775 | $296 |
| Real Estate Taxes | $5,060 | $15 |
Property Value by Mortgage Status in Greenfield
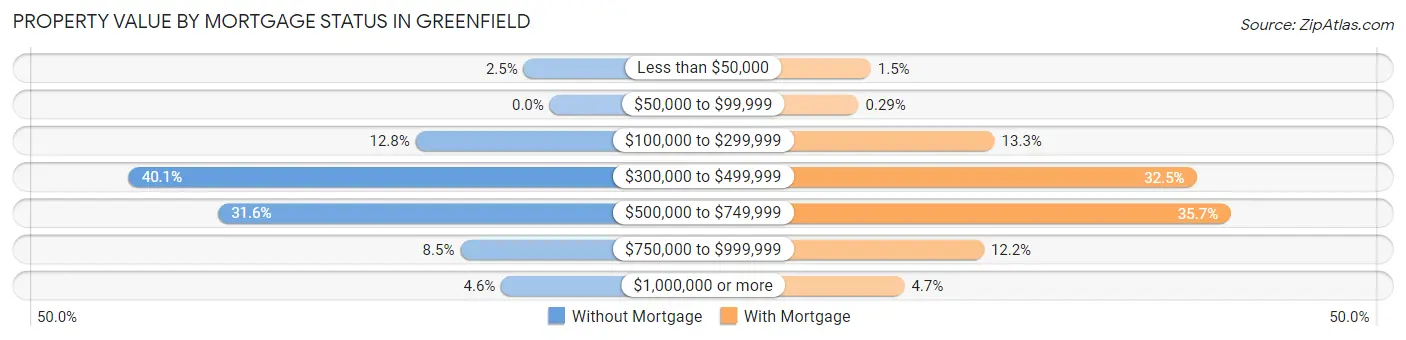
| Property Value | Without Mortgage | With Mortgage |
| Less than $50,000 | 7 (2.5%) | 10 (1.5%) |
| $50,000 to $99,999 | 0 (0.0%) | 2 (0.3%) |
| $100,000 to $299,999 | 36 (12.8%) | 91 (13.3%) |
| $300,000 to $499,999 | 113 (40.1%) | 223 (32.5%) |
| $500,000 to $749,999 | 89 (31.6%) | 245 (35.7%) |
| $750,000 to $999,999 | 24 (8.5%) | 84 (12.2%) |
| $1,000,000 or more | 13 (4.6%) | 32 (4.7%) |
| Total | 282 (100.0%) | 687 (100.0%) |
Household Income by Mortgage Status in Greenfield
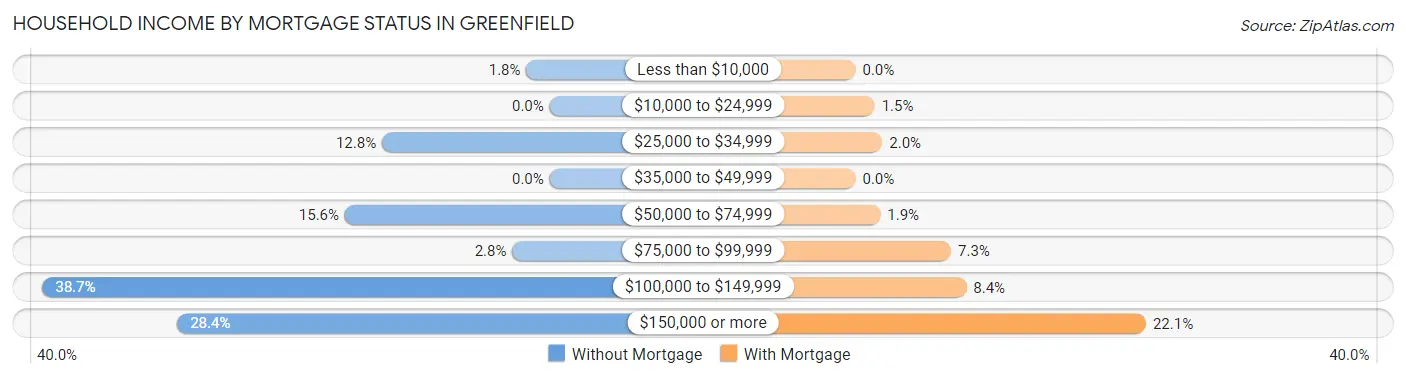
| Household Income | Without Mortgage | With Mortgage |
| Less than $10,000 | 5 (1.8%) | 0 (0.0%) |
| $10,000 to $24,999 | 0 (0.0%) | 10 (1.5%) |
| $25,000 to $34,999 | 36 (12.8%) | 14 (2.0%) |
| $35,000 to $49,999 | 0 (0.0%) | 0 (0.0%) |
| $50,000 to $74,999 | 44 (15.6%) | 13 (1.9%) |
| $75,000 to $99,999 | 8 (2.8%) | 50 (7.3%) |
| $100,000 to $149,999 | 109 (38.7%) | 58 (8.4%) |
| $150,000 or more | 80 (28.4%) | 152 (22.1%) |
| Total | 282 (100.0%) | 687 (100.0%) |
Property Value to Household Income Ratio in Greenfield
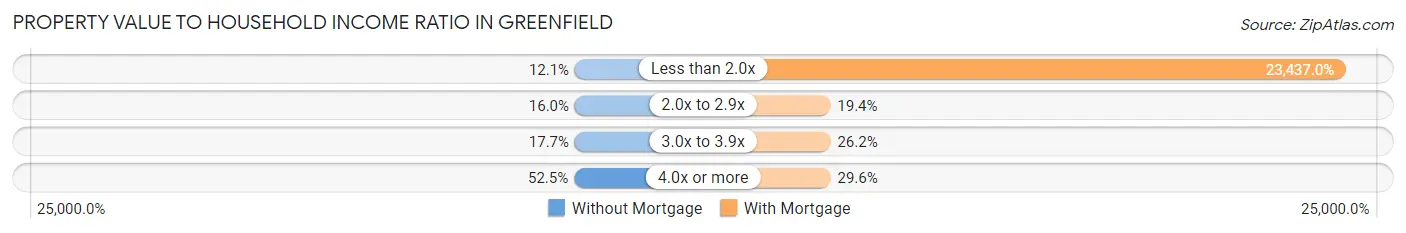
| Value-to-Income Ratio | Without Mortgage | With Mortgage |
| Less than 2.0x | 34 (12.1%) | 161,012 (23,437.0%) |
| 2.0x to 2.9x | 45 (16.0%) | 133 (19.4%) |
| 3.0x to 3.9x | 50 (17.7%) | 180 (26.2%) |
| 4.0x or more | 148 (52.5%) | 203 (29.5%) |
| Total | 282 (100.0%) | 687 (100.0%) |
Real Estate Taxes by Mortgage Status in Greenfield
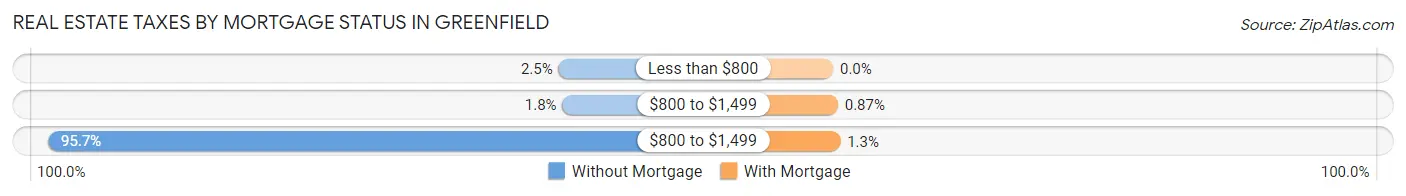
| Property Taxes | Without Mortgage | With Mortgage |
| Less than $800 | 7 (2.5%) | 0 (0.0%) |
| $800 to $1,499 | 5 (1.8%) | 6 (0.9%) |
| $800 to $1,499 | 270 (95.7%) | 9 (1.3%) |
| Total | 282 (100.0%) | 687 (100.0%) |
Health & Disability in Greenfield
Health Insurance Coverage by Age in Greenfield
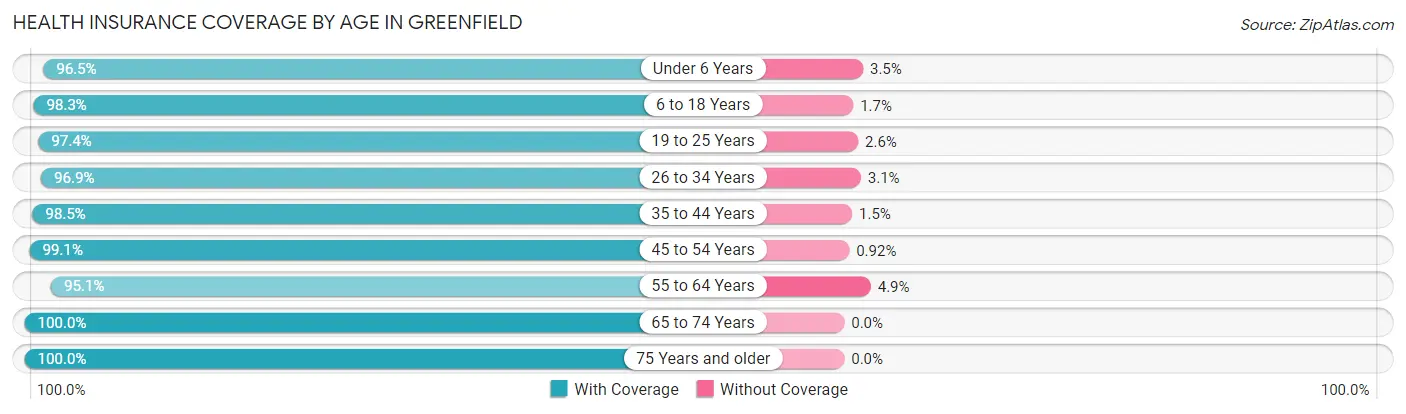
| Age Bracket | With Coverage | Without Coverage |
| Under 6 Years | 138 (96.5%) | 5 (3.5%) |
| 6 to 18 Years | 594 (98.3%) | 10 (1.7%) |
| 19 to 25 Years | 189 (97.4%) | 5 (2.6%) |
| 26 to 34 Years | 157 (96.9%) | 5 (3.1%) |
| 35 to 44 Years | 338 (98.5%) | 5 (1.5%) |
| 45 to 54 Years | 538 (99.1%) | 5 (0.9%) |
| 55 to 64 Years | 462 (95.1%) | 24 (4.9%) |
| 65 to 74 Years | 319 (100.0%) | 0 (0.0%) |
| 75 Years and older | 115 (100.0%) | 0 (0.0%) |
| Total | 2,850 (98.0%) | 59 (2.0%) |
Health Insurance Coverage by Citizenship Status in Greenfield
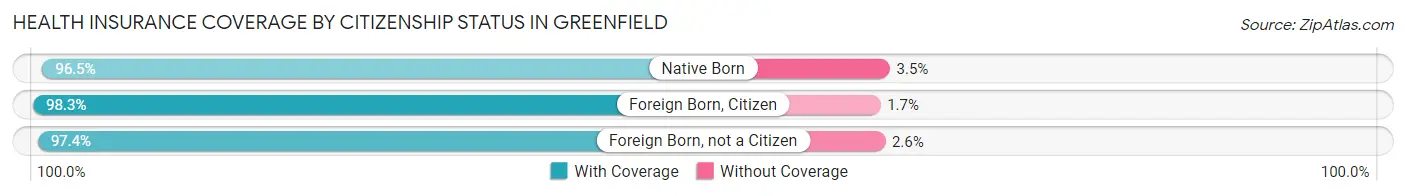
| Citizenship Status | With Coverage | Without Coverage |
| Native Born | 138 (96.5%) | 5 (3.5%) |
| Foreign Born, Citizen | 594 (98.3%) | 10 (1.7%) |
| Foreign Born, not a Citizen | 189 (97.4%) | 5 (2.6%) |
Health Insurance Coverage by Household Income in Greenfield
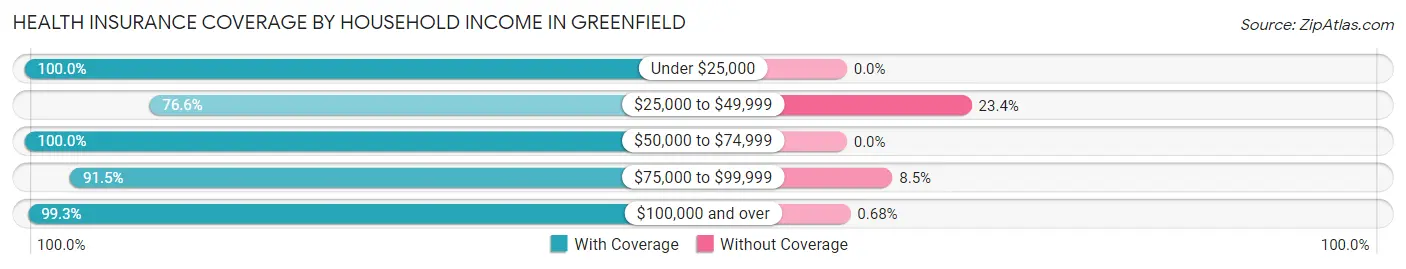
| Household Income | With Coverage | Without Coverage |
| Under $25,000 | 43 (100.0%) | 0 (0.0%) |
| $25,000 to $49,999 | 95 (76.6%) | 29 (23.4%) |
| $50,000 to $74,999 | 209 (100.0%) | 0 (0.0%) |
| $75,000 to $99,999 | 150 (91.5%) | 14 (8.5%) |
| $100,000 and over | 2,353 (99.3%) | 16 (0.7%) |
Public vs Private Health Insurance Coverage by Age in Greenfield
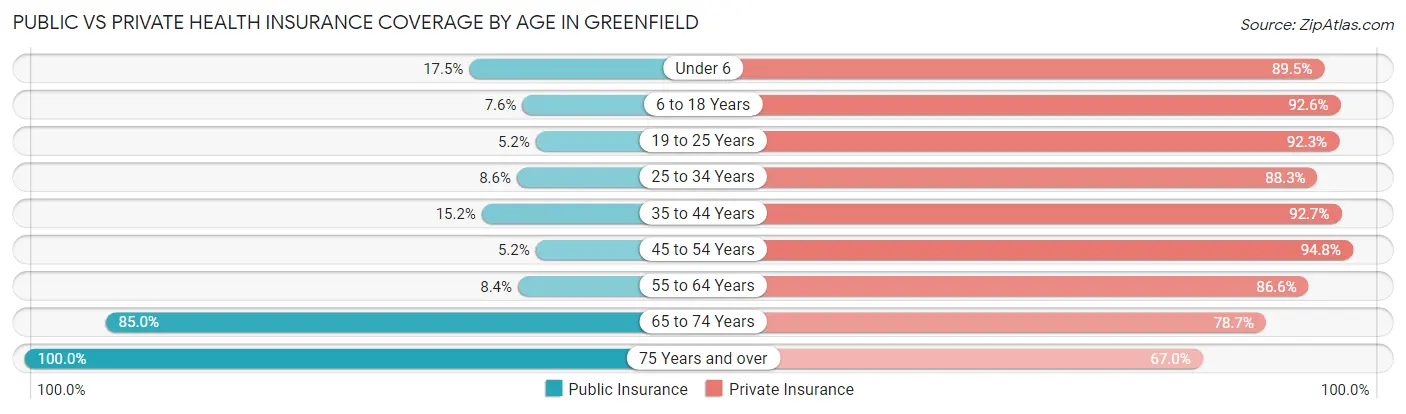
| Age Bracket | Public Insurance | Private Insurance |
| Under 6 | 25 (17.5%) | 128 (89.5%) |
| 6 to 18 Years | 46 (7.6%) | 559 (92.5%) |
| 19 to 25 Years | 10 (5.1%) | 179 (92.3%) |
| 25 to 34 Years | 14 (8.6%) | 143 (88.3%) |
| 35 to 44 Years | 52 (15.2%) | 318 (92.7%) |
| 45 to 54 Years | 28 (5.2%) | 515 (94.8%) |
| 55 to 64 Years | 41 (8.4%) | 421 (86.6%) |
| 65 to 74 Years | 271 (85.0%) | 251 (78.7%) |
| 75 Years and over | 115 (100.0%) | 77 (67.0%) |
| Total | 602 (20.7%) | 2,591 (89.1%) |
Disability Status by Sex by Age in Greenfield
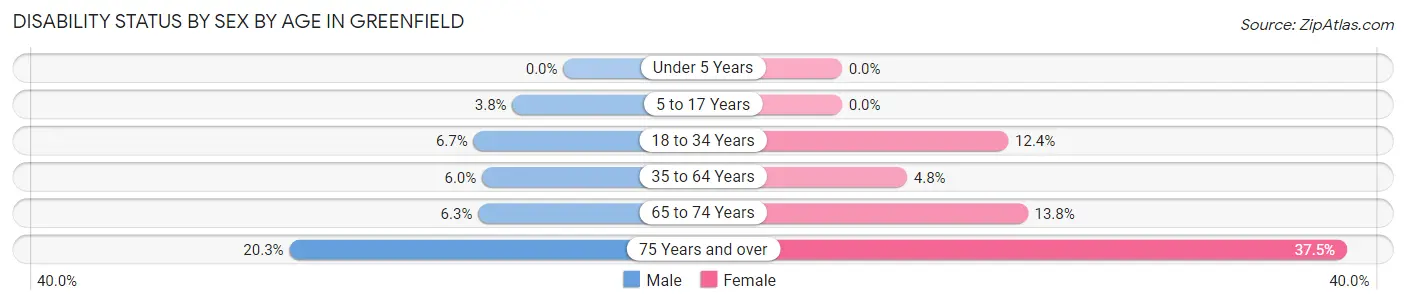
| Age Bracket | Male | Female |
| Under 5 Years | 0 (0.0%) | 0 (0.0%) |
| 5 to 17 Years | 13 (3.8%) | 0 (0.0%) |
| 18 to 34 Years | 15 (6.7%) | 21 (12.3%) |
| 35 to 64 Years | 39 (6.0%) | 35 (4.8%) |
| 65 to 74 Years | 11 (6.3%) | 20 (13.8%) |
| 75 Years and over | 12 (20.3%) | 21 (37.5%) |
Disability Class by Sex by Age in Greenfield
Disability Class: Hearing Difficulty
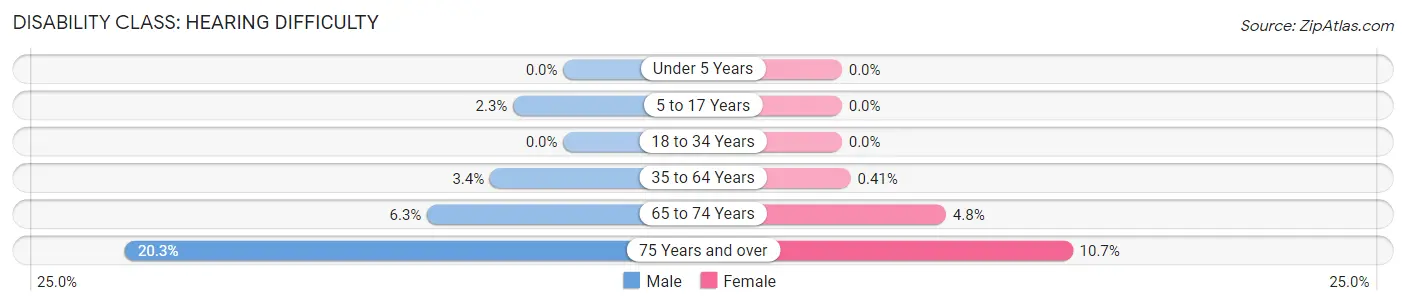
| Age Bracket | Male | Female |
| Under 5 Years | 0 (0.0%) | 0 (0.0%) |
| 5 to 17 Years | 8 (2.3%) | 0 (0.0%) |
| 18 to 34 Years | 0 (0.0%) | 0 (0.0%) |
| 35 to 64 Years | 22 (3.4%) | 3 (0.4%) |
| 65 to 74 Years | 11 (6.3%) | 7 (4.8%) |
| 75 Years and over | 12 (20.3%) | 6 (10.7%) |
Disability Class: Vision Difficulty
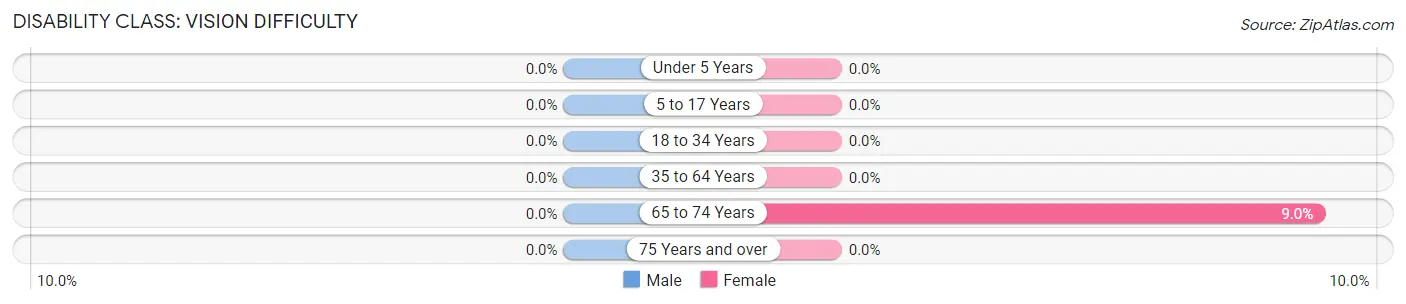
| Age Bracket | Male | Female |
| Under 5 Years | 0 (0.0%) | 0 (0.0%) |
| 5 to 17 Years | 0 (0.0%) | 0 (0.0%) |
| 18 to 34 Years | 0 (0.0%) | 0 (0.0%) |
| 35 to 64 Years | 0 (0.0%) | 0 (0.0%) |
| 65 to 74 Years | 0 (0.0%) | 13 (9.0%) |
| 75 Years and over | 0 (0.0%) | 0 (0.0%) |
Disability Class: Cognitive Difficulty
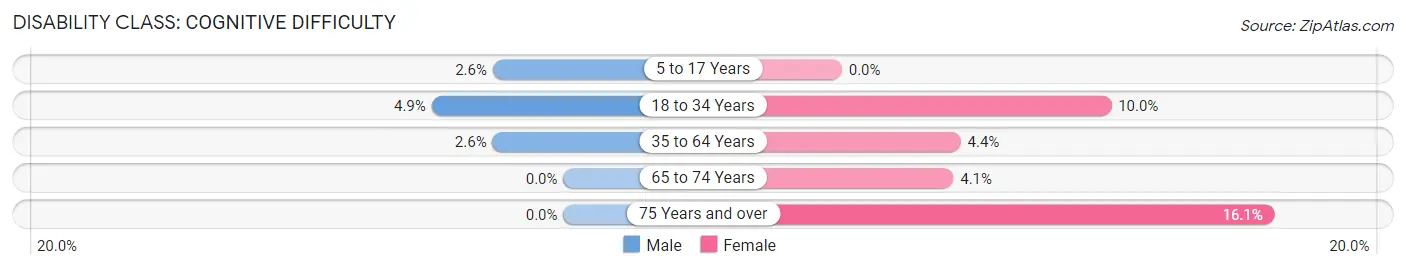
| Age Bracket | Male | Female |
| 5 to 17 Years | 9 (2.6%) | 0 (0.0%) |
| 18 to 34 Years | 11 (4.9%) | 17 (10.0%) |
| 35 to 64 Years | 17 (2.6%) | 32 (4.4%) |
| 65 to 74 Years | 0 (0.0%) | 6 (4.1%) |
| 75 Years and over | 0 (0.0%) | 9 (16.1%) |
Disability Class: Ambulatory Difficulty
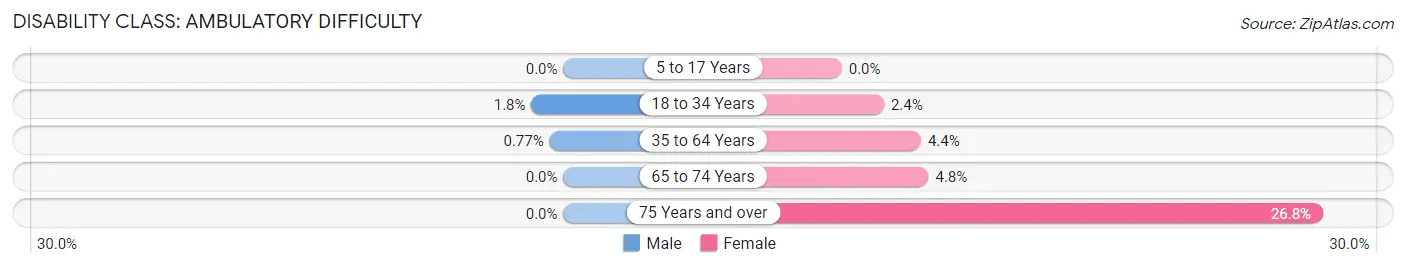
| Age Bracket | Male | Female |
| 5 to 17 Years | 0 (0.0%) | 0 (0.0%) |
| 18 to 34 Years | 4 (1.8%) | 4 (2.4%) |
| 35 to 64 Years | 5 (0.8%) | 32 (4.4%) |
| 65 to 74 Years | 0 (0.0%) | 7 (4.8%) |
| 75 Years and over | 0 (0.0%) | 15 (26.8%) |
Disability Class: Self-Care Difficulty
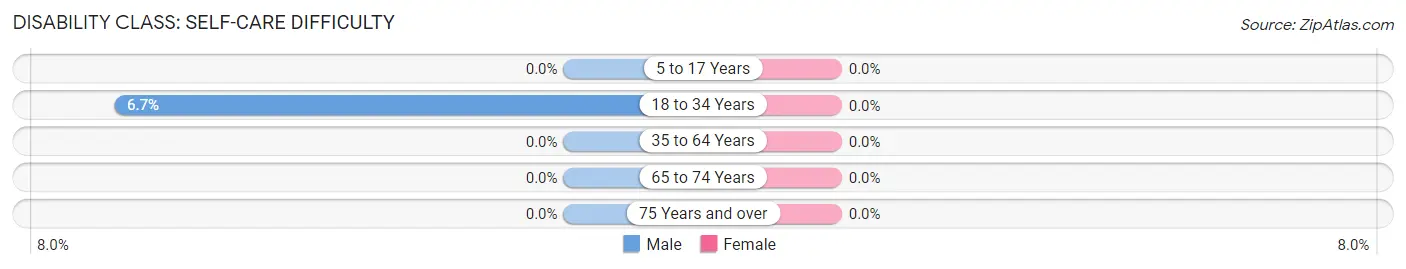
| Age Bracket | Male | Female |
| 5 to 17 Years | 0 (0.0%) | 0 (0.0%) |
| 18 to 34 Years | 15 (6.7%) | 0 (0.0%) |
| 35 to 64 Years | 0 (0.0%) | 0 (0.0%) |
| 65 to 74 Years | 0 (0.0%) | 0 (0.0%) |
| 75 Years and over | 0 (0.0%) | 0 (0.0%) |
Technology Access in Greenfield
Computing Device Access in Greenfield
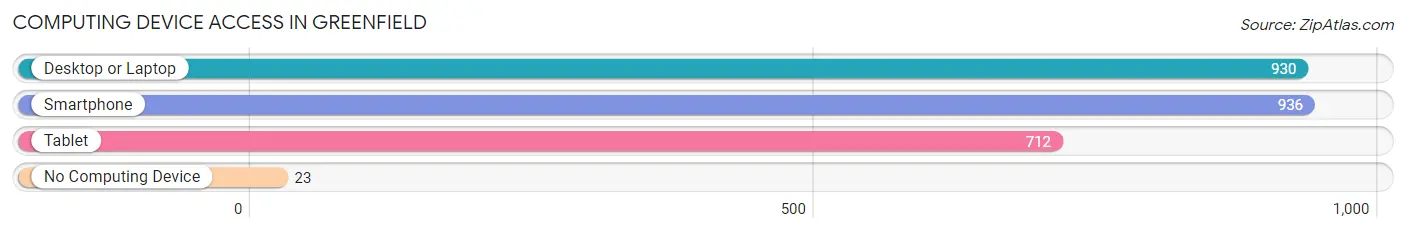
| Device Type | # Households | % Households |
| Desktop or Laptop | 930 | 92.9% |
| Smartphone | 936 | 93.5% |
| Tablet | 712 | 71.1% |
| No Computing Device | 23 | 2.3% |
| Total | 1,001 | 100.0% |
Internet Access in Greenfield
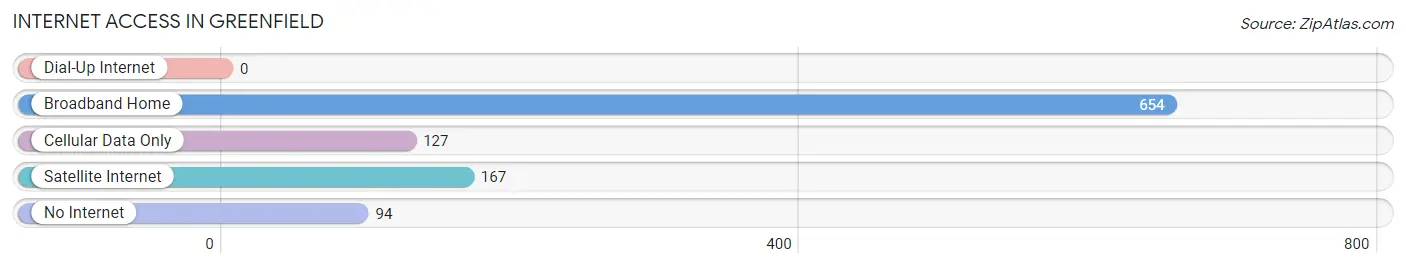
| Internet Type | # Households | % Households |
| Dial-Up Internet | 0 | 0.0% |
| Broadband Home | 654 | 65.3% |
| Cellular Data Only | 127 | 12.7% |
| Satellite Internet | 167 | 16.7% |
| No Internet | 94 | 9.4% |
| Total | 1,001 | 100.0% |
Greenfield Summary
Greenfield, Minnesota is a small city located in the southeastern corner of the state, just north of the Iowa border. It is part of the Mankato-North Mankato Metropolitan Statistical Area and is home to a population of just over 1,000 people. The city is known for its rural charm and its close proximity to the Minnesota River.
History
Greenfield was first settled in 1856 by a group of settlers from Wisconsin. The town was originally named “Greenfield Township” and was located in Blue Earth County. The first post office was established in 1858 and the town was officially incorporated in 1872.
The town was originally a farming community, but in the late 19th century, it began to develop into a small industrial center. The first industry in the town was a sawmill, which was built in 1876. This was followed by a flour mill, a creamery, and a brickyard.
In the early 20th century, the town began to experience a population boom. This was due to the arrival of the railroad, which connected the town to the larger cities of Mankato and St. Paul. The railroad also allowed for the development of a number of businesses, including a lumberyard, a grain elevator, and a creamery.
Geography
Greenfield is located in the southeastern corner of Minnesota, just north of the Iowa border. It is part of the Mankato-North Mankato Metropolitan Statistical Area and is home to a population of just over 1,000 people. The city is situated on the Minnesota River and is surrounded by rolling hills and farmland.
The city has a total area of 1.2 square miles, all of which is land. The average elevation is 1,068 feet above sea level. The climate is classified as humid continental, with hot summers and cold winters.
Economy
Greenfield’s economy is largely based on agriculture and manufacturing. The city is home to a number of small businesses, including a lumberyard, a grain elevator, and a creamery. The city also has a number of small retail stores, restaurants, and other services.
The city is also home to a number of industrial businesses, including a plastics manufacturer, a metal fabricator, and a printing company. The city is also home to a number of small farms, which produce a variety of crops, including corn, soybeans, and wheat.
Demographics
As of the 2010 census, Greenfield had a population of 1,072 people. The racial makeup of the city was 97.2% White, 0.7% African American, 0.2% Native American, 0.2% Asian, 0.1% Pacific Islander, 0.7% from other races, and 0.9% from two or more races. Hispanic or Latino of any race were 1.3% of the population.
The median income for a household in the city was $41,250, and the median income for a family was $50,000. The per capita income for the city was $20,845. About 8.2% of families and 10.2% of the population were below the poverty line, including 14.3% of those under age 18 and 8.3% of those age 65 or over.
Greenfield is a small city with a rich history and a strong sense of community. It is home to a diverse population and a variety of businesses and industries. The city is a great place to live and work, and it offers a unique blend of rural charm and modern amenities.
Common Questions
What is Per Capita Income in Greenfield?
Per Capita income in Greenfield is $60,163.
What is the Median Family Income in Greenfield?
Median Family Income in Greenfield is $154,129.
What is the Median Household income in Greenfield?
Median Household Income in Greenfield is $142,214.
What is Income or Wage Gap in Greenfield?
Income or Wage Gap in Greenfield is 16.6%.
Women in Greenfield earn 83.4 cents for every dollar earned by a man.
What is Inequality or Gini Index in Greenfield?
Inequality or Gini Index in Greenfield is 0.37.
What is the Total Population of Greenfield?
Total Population of Greenfield is 2,909.
What is the Total Male Population of Greenfield?
Total Male Population of Greenfield is 1,513.
What is the Total Female Population of Greenfield?
Total Female Population of Greenfield is 1,396.
What is the Ratio of Males per 100 Females in Greenfield?
There are 108.38 Males per 100 Females in Greenfield.
What is the Ratio of Females per 100 Males in Greenfield?
There are 92.27 Females per 100 Males in Greenfield.
What is the Median Population Age in Greenfield?
Median Population Age in Greenfield is 45.2 Years.
What is the Average Family Size in Greenfield
Average Family Size in Greenfield is 3.2 People.
What is the Average Household Size in Greenfield
Average Household Size in Greenfield is 2.9 People.
How Large is the Labor Force in Greenfield?
There are 1,575 People in the Labor Forcein in Greenfield.
What is the Percentage of People in the Labor Force in Greenfield?
69.3% of People are in the Labor Force in Greenfield.
What is the Unemployment Rate in Greenfield?
Unemployment Rate in Greenfield is 0.8%.