Lake Mary, FL Map & Demographics
Lake Mary Map
Lake Mary Overview
$54,399
PER CAPITA INCOME
$130,094
AVG FAMILY INCOME
$106,971
AVG HOUSEHOLD INCOME
36.9%
WAGE / INCOME GAP [ % ]
63.1¢/ $1
WAGE / INCOME GAP [ $ ]
0.42
INEQUALITY / GINI INDEX
16,636
TOTAL POPULATION
7,348
MALE POPULATION
9,288
FEMALE POPULATION
79.11
MALES / 100 FEMALES
126.40
FEMALES / 100 MALES
41.9
MEDIAN AGE
2.9
AVG FAMILY SIZE
2.5
AVG HOUSEHOLD SIZE
9,173
LABOR FORCE [ PEOPLE ]
66.4%
PERCENT IN LABOR FORCE
1.7%
UNEMPLOYMENT RATE
Lake Mary Zip Codes
Lake Mary Area Codes
Income in Lake Mary
Income Overview in Lake Mary
Per Capita Income in Lake Mary is $54,399, while median incomes of families and households are $130,094 and $106,971 respectively.
| Characteristic | Number | Measure |
| Per Capita Income | 16,636 | $54,399 |
| Median Family Income | 4,770 | $130,094 |
| Mean Family Income | 4,770 | $158,272 |
| Median Household Income | 6,557 | $106,971 |
| Mean Household Income | 6,557 | $136,086 |
| Income Deficit | 4,770 | $0 |
| Wage / Income Gap (%) | 16,636 | 36.86% |
| Wage / Income Gap ($) | 16,636 | 63.14¢ per $1 |
| Gini / Inequality Index | 16,636 | 0.42 |
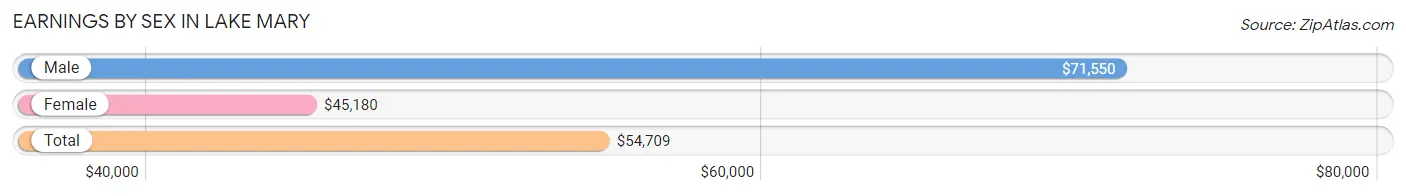
Earnings by Sex in Lake Mary
Average Earnings in Lake Mary are $54,709, $71,550 for men and $45,180 for women, a difference of 36.9%.
| Sex | Number | Average Earnings |
| Male | 4,598 (48.3%) | $71,550 |
| Female | 4,925 (51.7%) | $45,180 |
| Total | 9,523 (100.0%) | $54,709 |
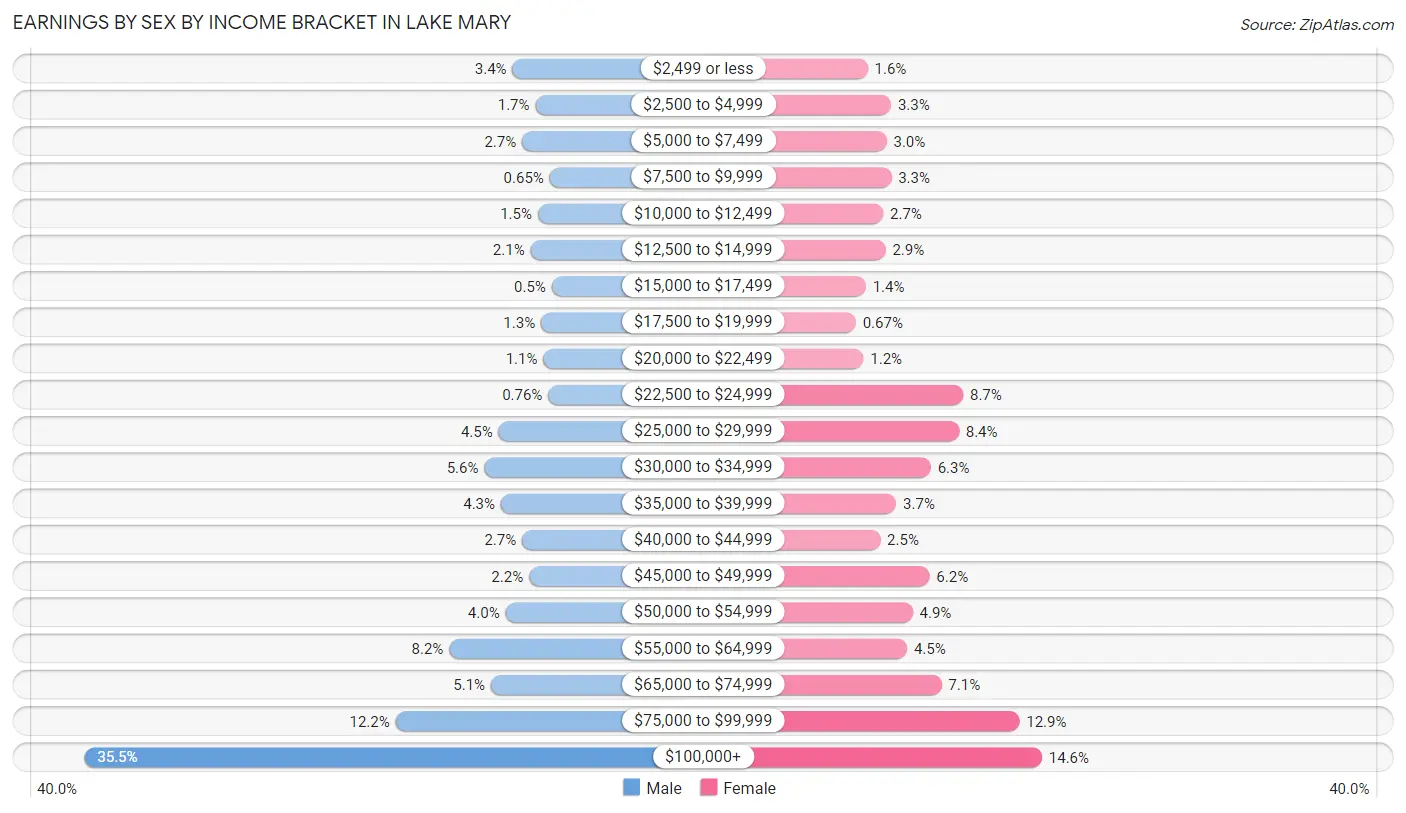
Earnings by Sex by Income Bracket in Lake Mary
The most common earnings brackets in Lake Mary are $100,000+ for men (1,633 | 35.5%) and $100,000+ for women (720 | 14.6%).
| Income | Male | Female |
| $2,499 or less | 158 (3.4%) | 77 (1.6%) |
| $2,500 to $4,999 | 79 (1.7%) | 163 (3.3%) |
| $5,000 to $7,499 | 125 (2.7%) | 147 (3.0%) |
| $7,500 to $9,999 | 30 (0.6%) | 164 (3.3%) |
| $10,000 to $12,499 | 71 (1.5%) | 134 (2.7%) |
| $12,500 to $14,999 | 96 (2.1%) | 143 (2.9%) |
| $15,000 to $17,499 | 23 (0.5%) | 70 (1.4%) |
| $17,500 to $19,999 | 60 (1.3%) | 33 (0.7%) |
| $20,000 to $22,499 | 52 (1.1%) | 61 (1.2%) |
| $22,500 to $24,999 | 35 (0.8%) | 429 (8.7%) |
| $25,000 to $29,999 | 206 (4.5%) | 413 (8.4%) |
| $30,000 to $34,999 | 255 (5.6%) | 310 (6.3%) |
| $35,000 to $39,999 | 198 (4.3%) | 182 (3.7%) |
| $40,000 to $44,999 | 125 (2.7%) | 123 (2.5%) |
| $45,000 to $49,999 | 101 (2.2%) | 305 (6.2%) |
| $50,000 to $54,999 | 182 (4.0%) | 243 (4.9%) |
| $55,000 to $64,999 | 376 (8.2%) | 222 (4.5%) |
| $65,000 to $74,999 | 232 (5.1%) | 349 (7.1%) |
| $75,000 to $99,999 | 561 (12.2%) | 637 (12.9%) |
| $100,000+ | 1,633 (35.5%) | 720 (14.6%) |
| Total | 4,598 (100.0%) | 4,925 (100.0%) |
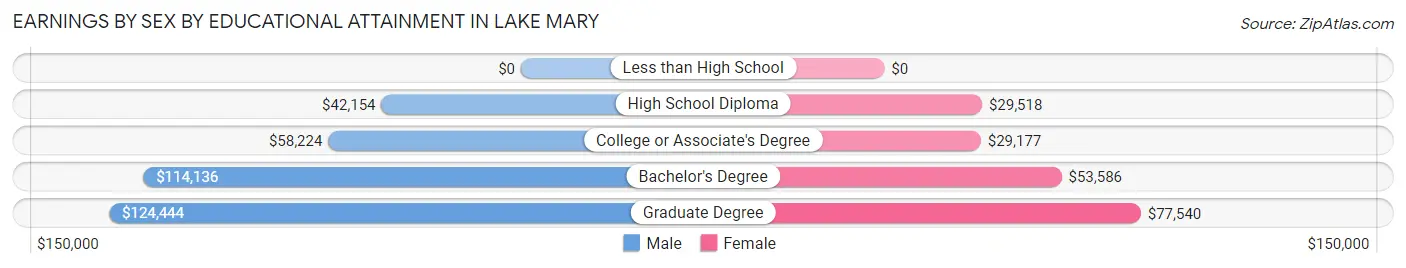
Earnings by Sex by Educational Attainment in Lake Mary
Average earnings in Lake Mary are $81,723 for men and $47,487 for women, a difference of 41.9%. Men with an educational attainment of graduate degree enjoy the highest average annual earnings of $124,444, while those with high school diploma education earn the least with $42,154. Women with an educational attainment of graduate degree earn the most with the average annual earnings of $77,540, while those with college or associate's degree education have the smallest earnings of $29,177.
| Educational Attainment | Male Income | Female Income |
| Less than High School | - | - |
| High School Diploma | $42,154 | $29,518 |
| College or Associate's Degree | $58,224 | $29,177 |
| Bachelor's Degree | $114,136 | $53,586 |
| Graduate Degree | $124,444 | $77,540 |
| Total | $81,723 | $47,487 |
Family Income in Lake Mary
Family Income Brackets in Lake Mary
According to the Lake Mary family income data, there are 1,116 families falling into the $200,000+ income range, which is the most common income bracket and makes up 23.4% of all families.
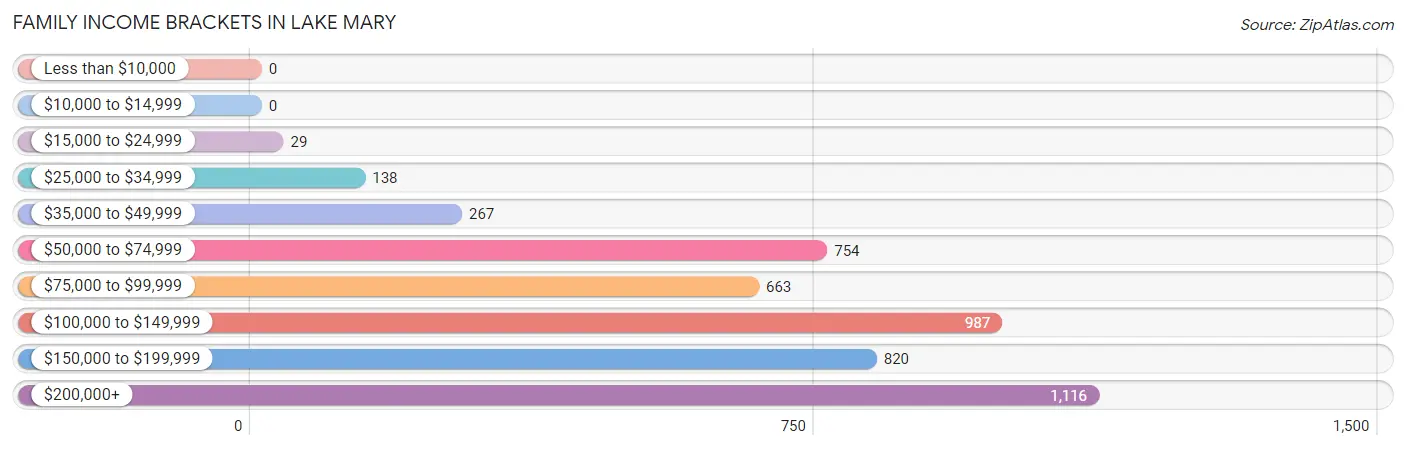
| Income Bracket | # Families | % Families |
| Less than $10,000 | 0 | 0.0% |
| $10,000 to $14,999 | 0 | 0.0% |
| $15,000 to $24,999 | 29 | 0.6% |
| $25,000 to $34,999 | 138 | 2.9% |
| $35,000 to $49,999 | 267 | 5.6% |
| $50,000 to $74,999 | 754 | 15.8% |
| $75,000 to $99,999 | 663 | 13.9% |
| $100,000 to $149,999 | 987 | 20.7% |
| $150,000 to $199,999 | 820 | 17.2% |
| $200,000+ | 1,116 | 23.4% |
Family Income by Famaliy Size in Lake Mary
3-person families (1,045 | 21.9%) account for the highest median family income in Lake Mary with $160,150 per family, while 2-person families (2,442 | 51.2%) have the highest median income of $56,935 per family member.
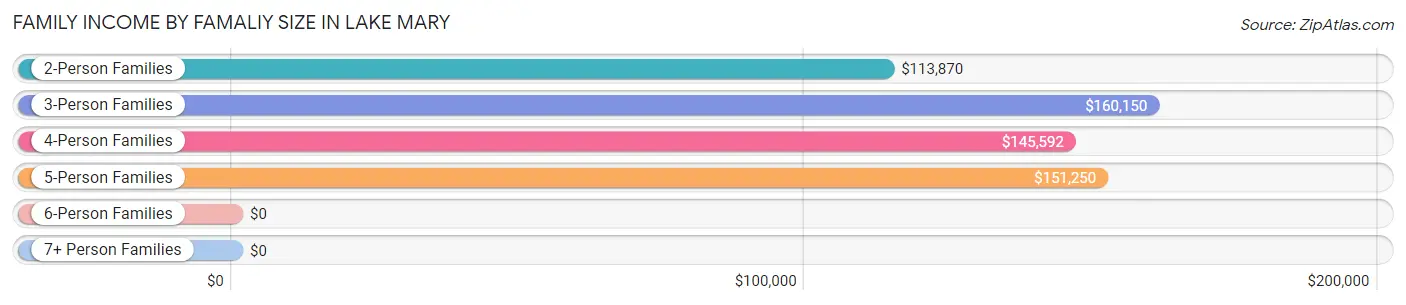
| Income Bracket | # Families | Median Income |
| 2-Person Families | 2,442 (51.2%) | $113,870 |
| 3-Person Families | 1,045 (21.9%) | $160,150 |
| 4-Person Families | 830 (17.4%) | $145,592 |
| 5-Person Families | 280 (5.9%) | $151,250 |
| 6-Person Families | 173 (3.6%) | $0 |
| 7+ Person Families | 0 (0.0%) | $0 |
| Total | 4,770 (100.0%) | $130,094 |
Family Income by Number of Earners in Lake Mary
The median family income in Lake Mary is $130,094, with families comprising 3+ earners (443) having the highest median family income of $189,135, while families with no earners (584) have the lowest median family income of $84,651, accounting for 9.3% and 12.2% of families, respectively.
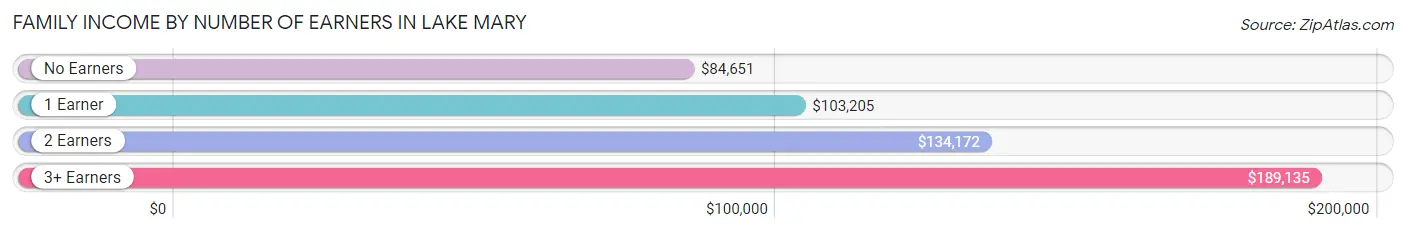
| Number of Earners | # Families | Median Income |
| No Earners | 584 (12.2%) | $84,651 |
| 1 Earner | 1,346 (28.2%) | $103,205 |
| 2 Earners | 2,397 (50.2%) | $134,172 |
| 3+ Earners | 443 (9.3%) | $189,135 |
| Total | 4,770 (100.0%) | $130,094 |
Household Income in Lake Mary
Household Income Brackets in Lake Mary
With 1,272 households falling in the category, the $100,000 to $149,999 income range is the most frequent in Lake Mary, accounting for 19.4% of all households. In contrast, only 13 households (0.2%) fall into the less than $10,000 income bracket, making it the least populous group.
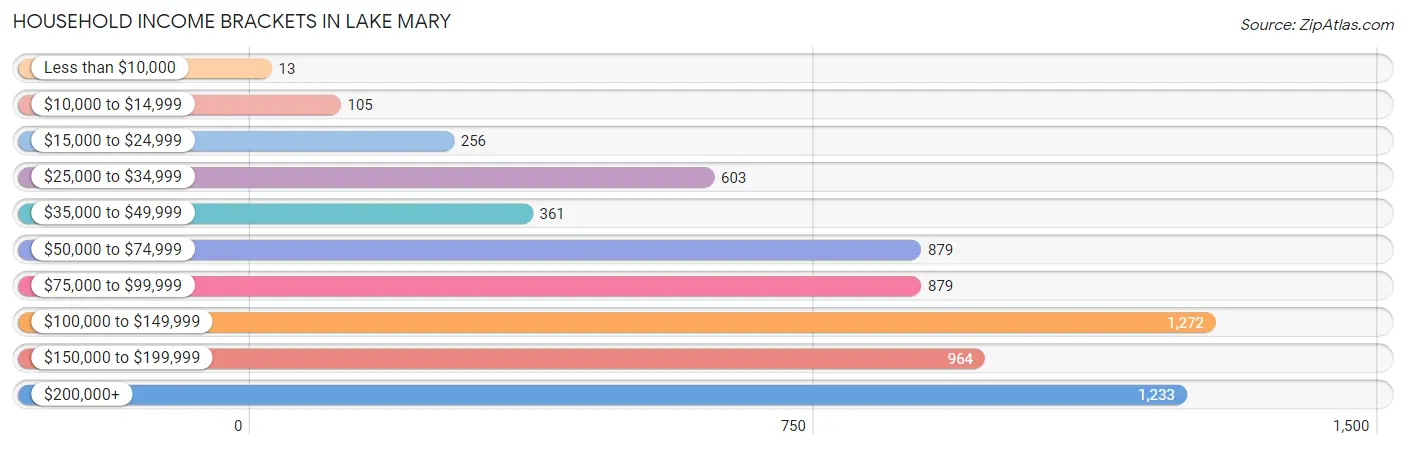
| Income Bracket | # Households | % Households |
| Less than $10,000 | 13 | 0.2% |
| $10,000 to $14,999 | 105 | 1.6% |
| $15,000 to $24,999 | 256 | 3.9% |
| $25,000 to $34,999 | 603 | 9.2% |
| $35,000 to $49,999 | 361 | 5.5% |
| $50,000 to $74,999 | 879 | 13.4% |
| $75,000 to $99,999 | 879 | 13.4% |
| $100,000 to $149,999 | 1,272 | 19.4% |
| $150,000 to $199,999 | 964 | 14.7% |
| $200,000+ | 1,233 | 18.8% |
Household Income by Householder Age in Lake Mary
The median household income in Lake Mary is $106,971, with the highest median household income of $116,985 found in the 45 to 64 years age bracket for the primary householder. A total of 2,831 households (43.2%) fall into this category. Meanwhile, the 15 to 24 years age bracket for the primary householder has the lowest median household income of $42,477, with 107 households (1.6%) in this group.
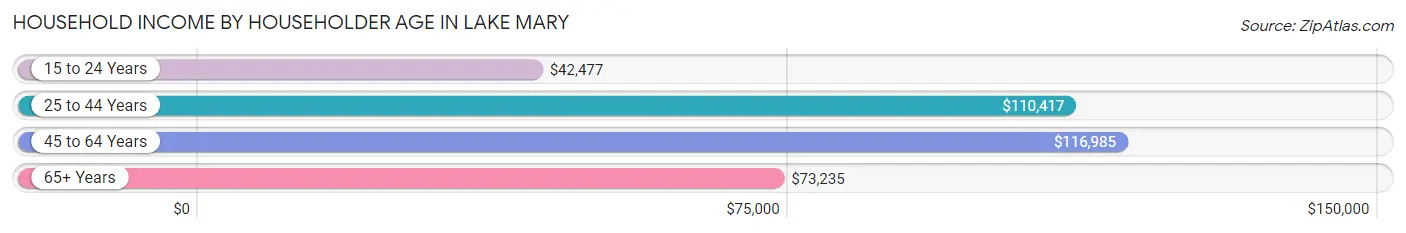
| Income Bracket | # Households | Median Income |
| 15 to 24 Years | 107 (1.6%) | $42,477 |
| 25 to 44 Years | 2,027 (30.9%) | $110,417 |
| 45 to 64 Years | 2,831 (43.2%) | $116,985 |
| 65+ Years | 1,592 (24.3%) | $73,235 |
| Total | 6,557 (100.0%) | $106,971 |
Poverty in Lake Mary
Income Below Poverty by Sex and Age in Lake Mary
With 1.1% poverty level for males and 3.2% for females among the residents of Lake Mary, 55 to 64 year old males and 18 to 24 year old females are the most vulnerable to poverty, with 34 males (4.1%) and 79 females (15.0%) in their respective age groups living below the poverty level.
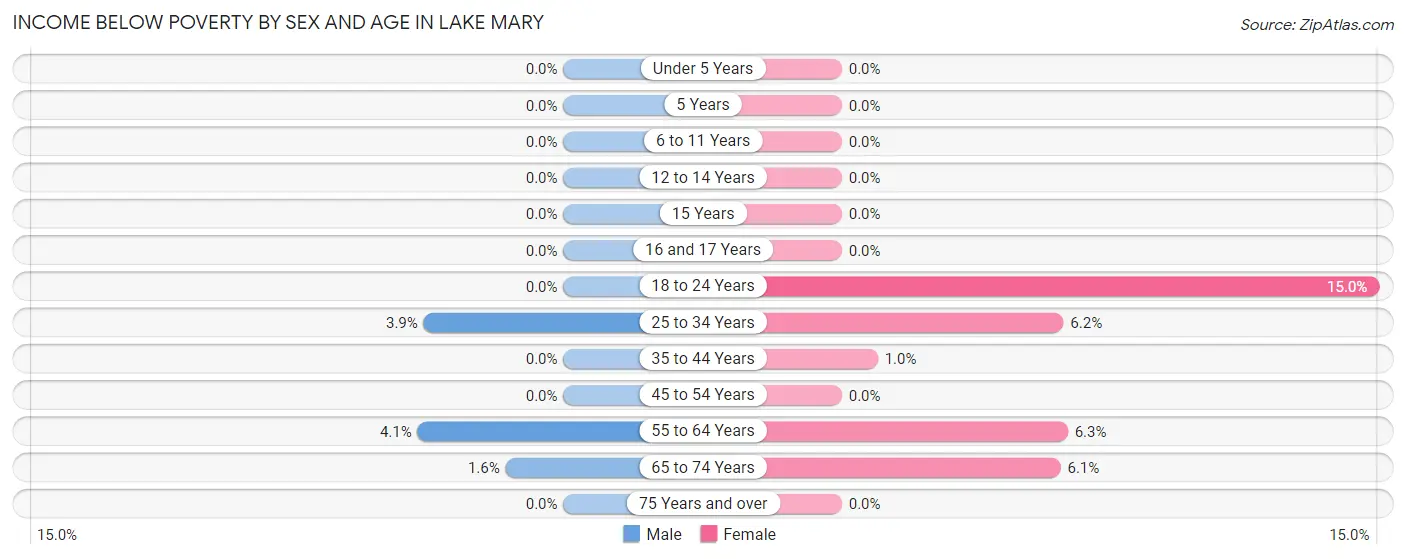
| Age Bracket | Male | Female |
| Under 5 Years | 0 (0.0%) | 0 (0.0%) |
| 5 Years | 0 (0.0%) | 0 (0.0%) |
| 6 to 11 Years | 0 (0.0%) | 0 (0.0%) |
| 12 to 14 Years | 0 (0.0%) | 0 (0.0%) |
| 15 Years | 0 (0.0%) | 0 (0.0%) |
| 16 and 17 Years | 0 (0.0%) | 0 (0.0%) |
| 18 to 24 Years | 0 (0.0%) | 79 (15.0%) |
| 25 to 34 Years | 35 (3.9%) | 56 (6.2%) |
| 35 to 44 Years | 0 (0.0%) | 16 (1.0%) |
| 45 to 54 Years | 0 (0.0%) | 0 (0.0%) |
| 55 to 64 Years | 34 (4.1%) | 78 (6.3%) |
| 65 to 74 Years | 11 (1.6%) | 61 (6.1%) |
| 75 Years and over | 0 (0.0%) | 0 (0.0%) |
| Total | 80 (1.1%) | 290 (3.2%) |
Income Above Poverty by Sex and Age in Lake Mary
According to the poverty statistics in Lake Mary, males aged under 5 years and females aged under 5 years are the age groups that are most secure financially, with 100.0% of males and 100.0% of females in these age groups living above the poverty line.
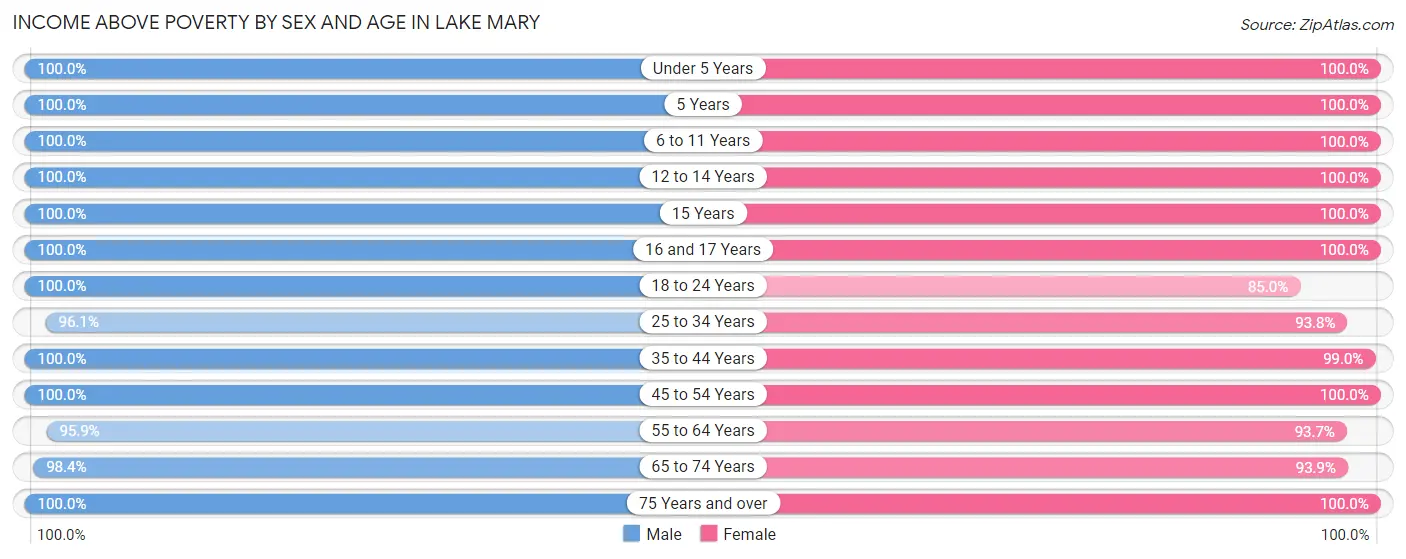
| Age Bracket | Male | Female |
| Under 5 Years | 407 (100.0%) | 510 (100.0%) |
| 5 Years | 136 (100.0%) | 87 (100.0%) |
| 6 to 11 Years | 324 (100.0%) | 417 (100.0%) |
| 12 to 14 Years | 234 (100.0%) | 369 (100.0%) |
| 15 Years | 239 (100.0%) | 87 (100.0%) |
| 16 and 17 Years | 156 (100.0%) | 343 (100.0%) |
| 18 to 24 Years | 556 (100.0%) | 449 (85.0%) |
| 25 to 34 Years | 864 (96.1%) | 852 (93.8%) |
| 35 to 44 Years | 1,042 (100.0%) | 1,577 (99.0%) |
| 45 to 54 Years | 1,128 (100.0%) | 1,391 (100.0%) |
| 55 to 64 Years | 804 (95.9%) | 1,163 (93.7%) |
| 65 to 74 Years | 674 (98.4%) | 940 (93.9%) |
| 75 Years and over | 631 (100.0%) | 620 (100.0%) |
| Total | 7,195 (98.9%) | 8,805 (96.8%) |
Income Below Poverty Among Married-Couple Families in Lake Mary
The poverty statistics for married-couple families in Lake Mary show that 0.5% or 20 of the total 3,692 families live below the poverty line. Families with no children have the highest poverty rate of 0.9%, comprising of 20 families. On the other hand, families with 1 or 2 children have the lowest poverty rate of 0.0%, which includes 0 families.
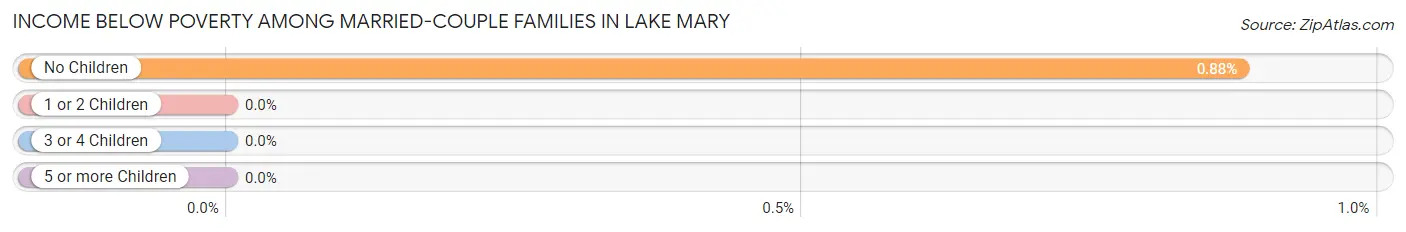
| Children | Above Poverty | Below Poverty |
| No Children | 2,246 (99.1%) | 20 (0.9%) |
| 1 or 2 Children | 1,187 (100.0%) | 0 (0.0%) |
| 3 or 4 Children | 239 (100.0%) | 0 (0.0%) |
| 5 or more Children | 0 (0.0%) | 0 (0.0%) |
| Total | 3,672 (99.5%) | 20 (0.5%) |
Income Below Poverty Among Single-Parent Households in Lake Mary
| Children | Single Father | Single Mother |
| No Children | 0 (0.0%) | 0 (0.0%) |
| 1 or 2 Children | 0 (0.0%) | 0 (0.0%) |
| 3 or 4 Children | 0 (0.0%) | 0 (0.0%) |
| 5 or more Children | 0 (0.0%) | 0 (0.0%) |
| Total | 0 (0.0%) | 0 (0.0%) |
Income Below Poverty Among Married-Couple vs Single-Parent Households in Lake Mary
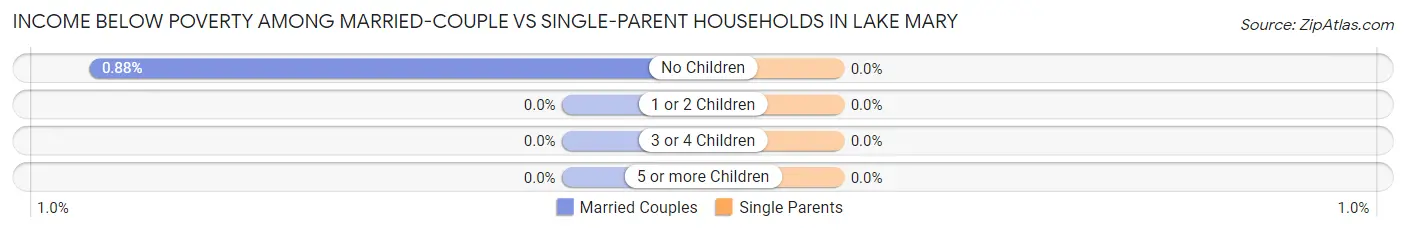
| Children | Married-Couple Families | Single-Parent Households |
| No Children | 20 (0.9%) | 0 (0.0%) |
| 1 or 2 Children | 0 (0.0%) | 0 (0.0%) |
| 3 or 4 Children | 0 (0.0%) | 0 (0.0%) |
| 5 or more Children | 0 (0.0%) | 0 (0.0%) |
| Total | 20 (0.5%) | 0 (0.0%) |
Race in Lake Mary
The most populous races in Lake Mary are White / Caucasian (11,712 | 70.4%), Hispanic or Latino (1,931 | 11.6%), and Black / African American (1,636 | 9.8%).
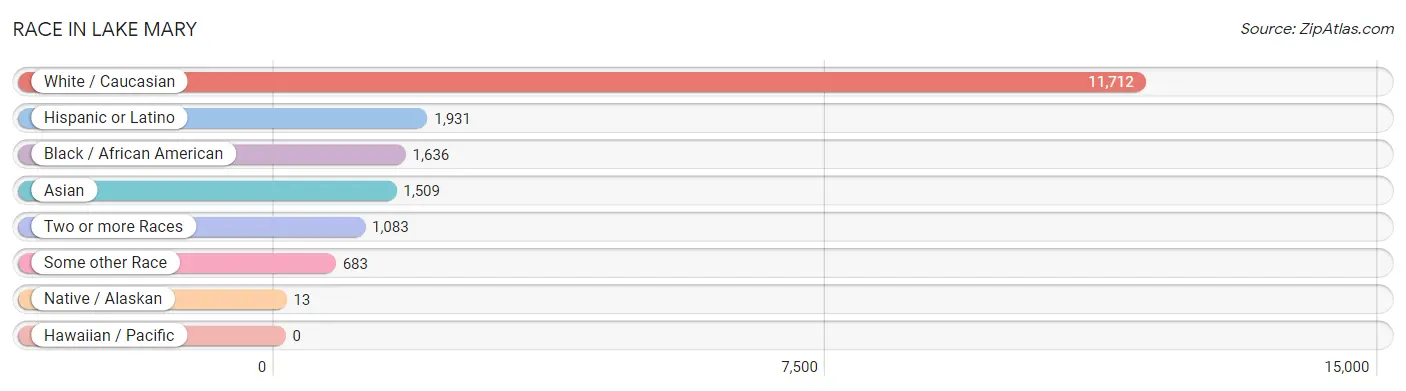
| Race | # Population | % Population |
| Asian | 1,509 | 9.1% |
| Black / African American | 1,636 | 9.8% |
| Hawaiian / Pacific | 0 | 0.0% |
| Hispanic or Latino | 1,931 | 11.6% |
| Native / Alaskan | 13 | 0.1% |
| White / Caucasian | 11,712 | 70.4% |
| Two or more Races | 1,083 | 6.5% |
| Some other Race | 683 | 4.1% |
| Total | 16,636 | 100.0% |
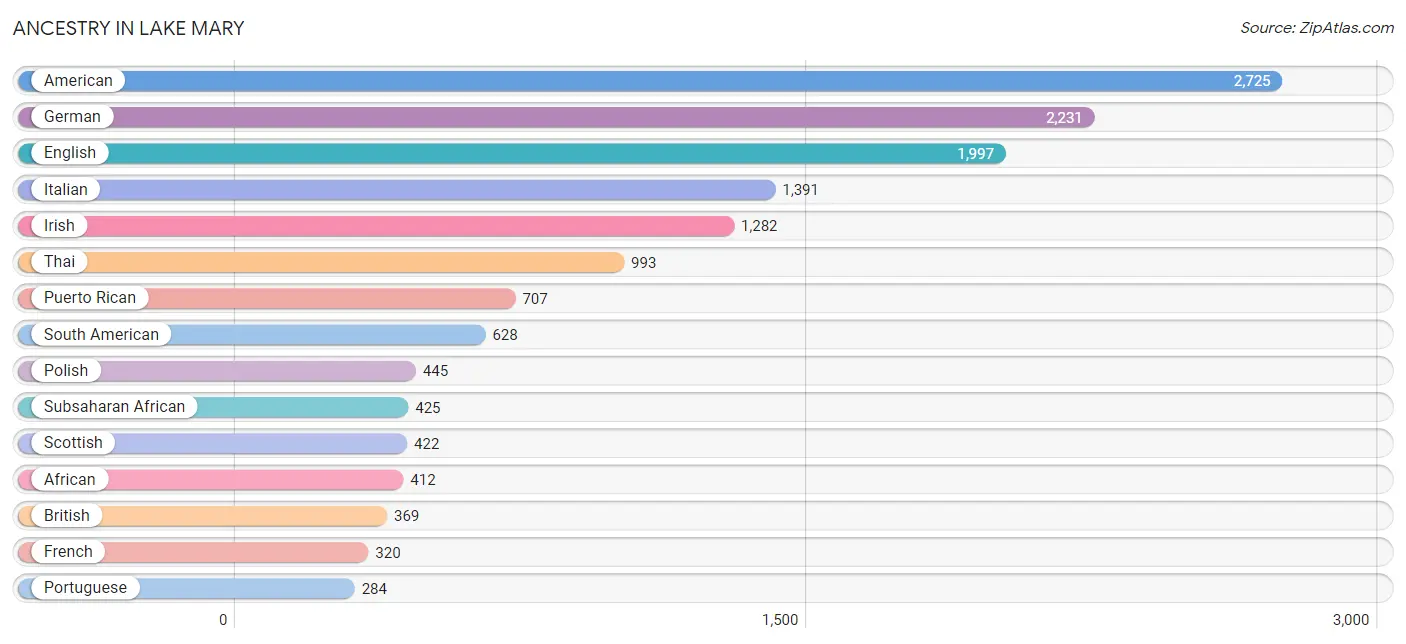
Ancestry in Lake Mary
The most populous ancestries reported in Lake Mary are American (2,725 | 16.4%), German (2,231 | 13.4%), English (1,997 | 12.0%), Italian (1,391 | 8.4%), and Irish (1,282 | 7.7%), together accounting for 57.9% of all Lake Mary residents.
| Ancestry | # Population | % Population |
| African | 412 | 2.5% |
| American | 2,725 | 16.4% |
| Arab | 39 | 0.2% |
| Austrian | 24 | 0.1% |
| Bhutanese | 12 | 0.1% |
| Brazilian | 70 | 0.4% |
| British | 369 | 2.2% |
| Burmese | 24 | 0.1% |
| Cajun | 24 | 0.1% |
| Canadian | 79 | 0.5% |
| Central American | 22 | 0.1% |
| Cherokee | 209 | 1.3% |
| Choctaw | 9 | 0.1% |
| Colombian | 275 | 1.7% |
| Croatian | 97 | 0.6% |
| Cuban | 210 | 1.3% |
| Czech | 37 | 0.2% |
| Czechoslovakian | 11 | 0.1% |
| Danish | 79 | 0.5% |
| Dominican | 254 | 1.5% |
| Dutch | 63 | 0.4% |
| Eastern European | 89 | 0.5% |
| Ecuadorian | 27 | 0.2% |
| Egyptian | 25 | 0.2% |
| English | 1,997 | 12.0% |
| European | 153 | 0.9% |
| French | 320 | 1.9% |
| French Canadian | 29 | 0.2% |
| German | 2,231 | 13.4% |
| Greek | 51 | 0.3% |
| Guyanese | 14 | 0.1% |
| Haitian | 37 | 0.2% |
| Hungarian | 51 | 0.3% |
| Indian (Asian) | 49 | 0.3% |
| Iranian | 79 | 0.5% |
| Irish | 1,282 | 7.7% |
| Iroquois | 10 | 0.1% |
| Israeli | 15 | 0.1% |
| Italian | 1,391 | 8.4% |
| Jamaican | 70 | 0.4% |
| Korean | 262 | 1.6% |
| Lebanese | 14 | 0.1% |
| Malaysian | 14 | 0.1% |
| Mexican | 61 | 0.4% |
| Native Hawaiian | 10 | 0.1% |
| Nigerian | 13 | 0.1% |
| Northern European | 54 | 0.3% |
| Norwegian | 44 | 0.3% |
| Pakistani | 42 | 0.3% |
| Peruvian | 78 | 0.5% |
| Polish | 445 | 2.7% |
| Portuguese | 284 | 1.7% |
| Puerto Rican | 707 | 4.3% |
| Russian | 198 | 1.2% |
| Salvadoran | 22 | 0.1% |
| Scotch-Irish | 74 | 0.4% |
| Scottish | 422 | 2.5% |
| South American | 628 | 3.8% |
| Spaniard | 10 | 0.1% |
| Spanish | 39 | 0.2% |
| Spanish American Indian | 5 | 0.0% |
| Sri Lankan | 273 | 1.6% |
| Subsaharan African | 425 | 2.5% |
| Swedish | 30 | 0.2% |
| Swiss | 18 | 0.1% |
| Thai | 993 | 6.0% |
| Trinidadian and Tobagonian | 173 | 1.0% |
| U.S. Virgin Islander | 33 | 0.2% |
| Ukrainian | 130 | 0.8% |
| Venezuelan | 248 | 1.5% | View All 70 Rows |
Immigrants in Lake Mary
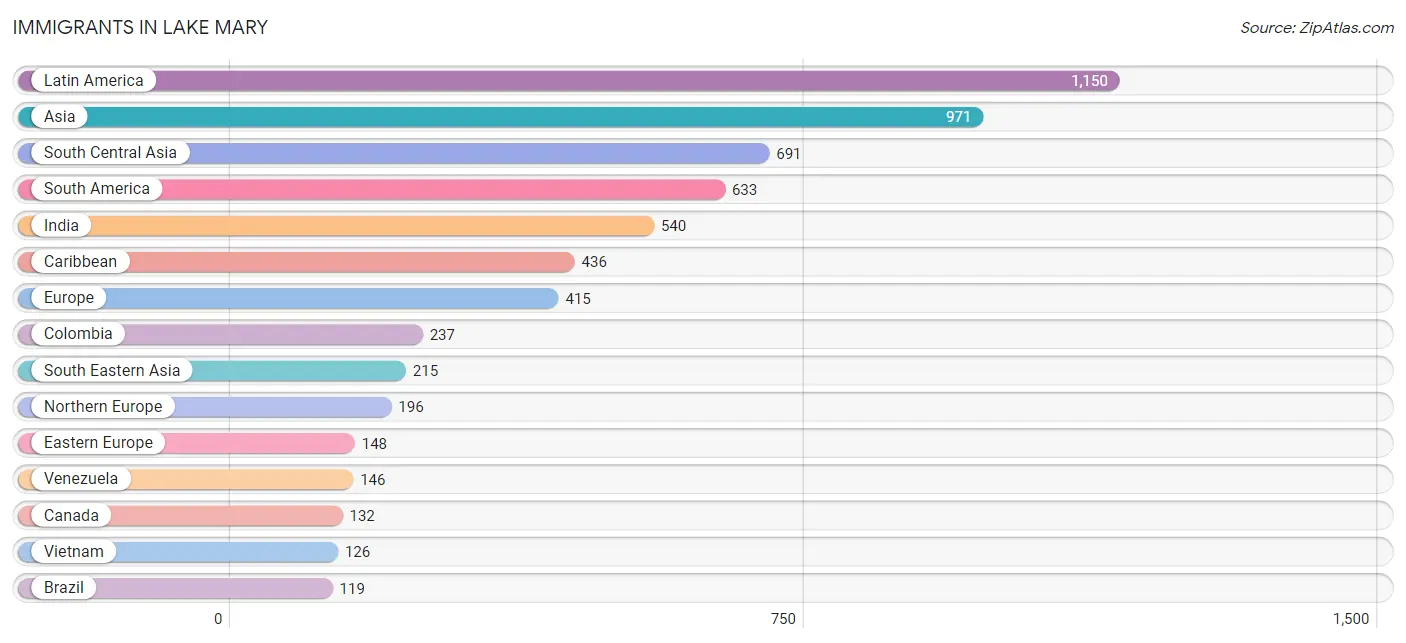
The most numerous immigrant groups reported in Lake Mary came from Latin America (1,150 | 6.9%), Asia (971 | 5.8%), South Central Asia (691 | 4.2%), South America (633 | 3.8%), and India (540 | 3.3%), together accounting for 24.0% of all Lake Mary residents.
| Immigration Origin | # Population | % Population |
| Africa | 82 | 0.5% |
| Asia | 971 | 5.8% |
| Bahamas | 11 | 0.1% |
| Barbados | 23 | 0.1% |
| Belarus | 34 | 0.2% |
| Brazil | 119 | 0.7% |
| Canada | 132 | 0.8% |
| Caribbean | 436 | 2.6% |
| Central America | 81 | 0.5% |
| China | 37 | 0.2% |
| Colombia | 237 | 1.4% |
| Cuba | 13 | 0.1% |
| Dominican Republic | 69 | 0.4% |
| Eastern Africa | 22 | 0.1% |
| Eastern Asia | 65 | 0.4% |
| Eastern Europe | 148 | 0.9% |
| Ecuador | 27 | 0.2% |
| Egypt | 25 | 0.2% |
| El Salvador | 22 | 0.1% |
| England | 116 | 0.7% |
| Europe | 415 | 2.5% |
| Germany | 29 | 0.2% |
| Grenada | 68 | 0.4% |
| Guyana | 48 | 0.3% |
| Haiti | 26 | 0.2% |
| India | 540 | 3.3% |
| Iran | 50 | 0.3% |
| Ireland | 47 | 0.3% |
| Jamaica | 95 | 0.6% |
| Japan | 12 | 0.1% |
| Korea | 16 | 0.1% |
| Latin America | 1,150 | 6.9% |
| Liberia | 22 | 0.1% |
| Mexico | 45 | 0.3% |
| Nigeria | 13 | 0.1% |
| Northern Africa | 25 | 0.2% |
| Northern Europe | 196 | 1.2% |
| Pakistan | 11 | 0.1% |
| Panama | 14 | 0.1% |
| Peru | 56 | 0.3% |
| Philippines | 47 | 0.3% |
| Portugal | 42 | 0.3% |
| Russia | 79 | 0.5% |
| South America | 633 | 3.8% |
| South Central Asia | 691 | 4.2% |
| South Eastern Asia | 215 | 1.3% |
| Southern Europe | 42 | 0.3% |
| Taiwan | 13 | 0.1% |
| Thailand | 42 | 0.3% |
| Trinidad and Tobago | 117 | 0.7% |
| Ukraine | 35 | 0.2% |
| Venezuela | 146 | 0.9% |
| Vietnam | 126 | 0.8% |
| West Indies | 14 | 0.1% |
| Western Africa | 35 | 0.2% |
| Western Europe | 29 | 0.2% | View All 56 Rows |
Sex and Age in Lake Mary
Sex and Age in Lake Mary
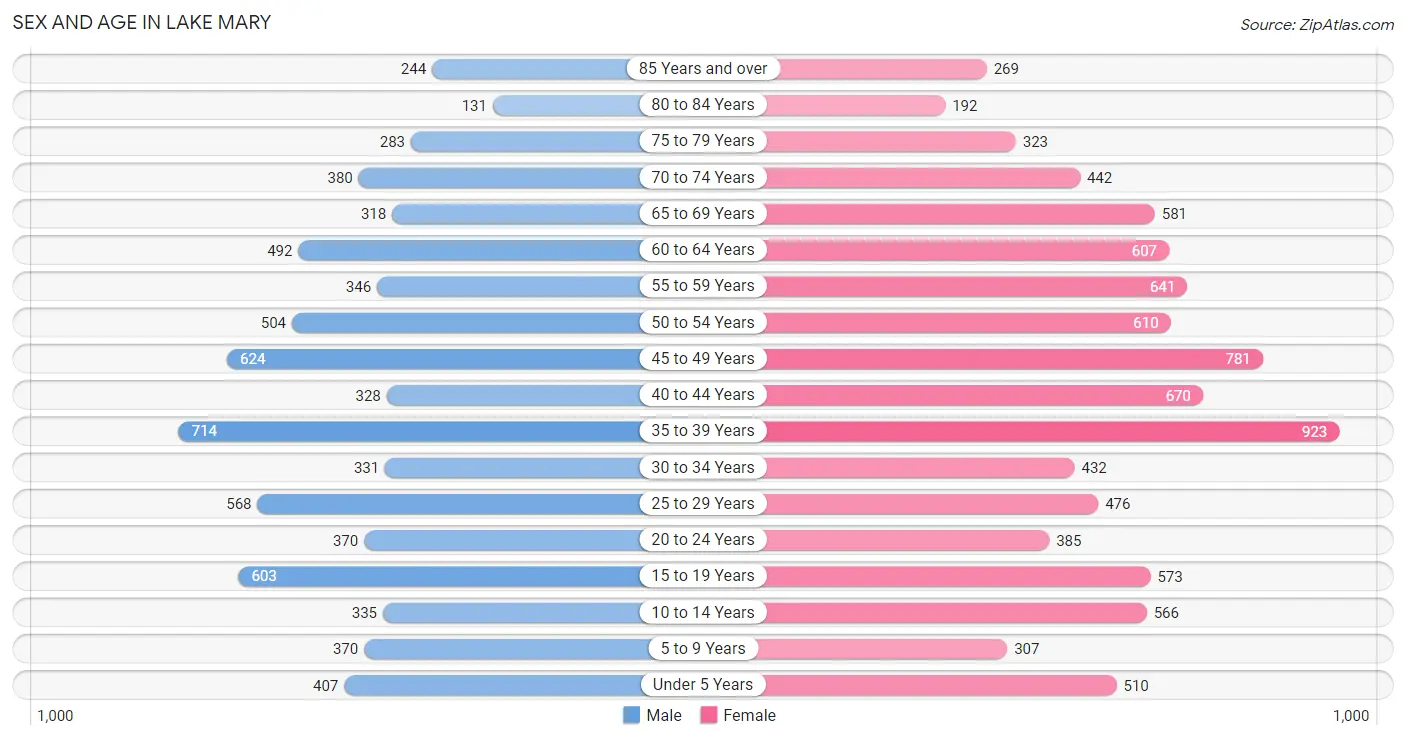
The most populous age groups in Lake Mary are 35 to 39 Years (714 | 9.7%) for men and 35 to 39 Years (923 | 9.9%) for women.
| Age Bracket | Male | Female |
| Under 5 Years | 407 (5.5%) | 510 (5.5%) |
| 5 to 9 Years | 370 (5.0%) | 307 (3.3%) |
| 10 to 14 Years | 335 (4.6%) | 566 (6.1%) |
| 15 to 19 Years | 603 (8.2%) | 573 (6.2%) |
| 20 to 24 Years | 370 (5.0%) | 385 (4.2%) |
| 25 to 29 Years | 568 (7.7%) | 476 (5.1%) |
| 30 to 34 Years | 331 (4.5%) | 432 (4.6%) |
| 35 to 39 Years | 714 (9.7%) | 923 (9.9%) |
| 40 to 44 Years | 328 (4.5%) | 670 (7.2%) |
| 45 to 49 Years | 624 (8.5%) | 781 (8.4%) |
| 50 to 54 Years | 504 (6.9%) | 610 (6.6%) |
| 55 to 59 Years | 346 (4.7%) | 641 (6.9%) |
| 60 to 64 Years | 492 (6.7%) | 607 (6.5%) |
| 65 to 69 Years | 318 (4.3%) | 581 (6.3%) |
| 70 to 74 Years | 380 (5.2%) | 442 (4.8%) |
| 75 to 79 Years | 283 (3.8%) | 323 (3.5%) |
| 80 to 84 Years | 131 (1.8%) | 192 (2.1%) |
| 85 Years and over | 244 (3.3%) | 269 (2.9%) |
| Total | 7,348 (100.0%) | 9,288 (100.0%) |
Families and Households in Lake Mary
Median Family Size in Lake Mary
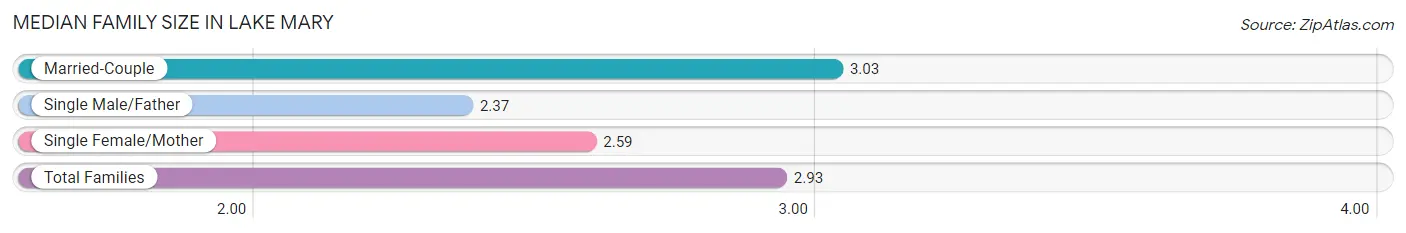
The median family size in Lake Mary is 2.93 persons per family, with married-couple families (3,692 | 77.4%) accounting for the largest median family size of 3.03 persons per family. On the other hand, single male/father families (113 | 2.4%) represent the smallest median family size with 2.37 persons per family.
| Family Type | # Families | Family Size |
| Married-Couple | 3,692 (77.4%) | 3.03 |
| Single Male/Father | 113 (2.4%) | 2.37 |
| Single Female/Mother | 965 (20.2%) | 2.59 |
| Total Families | 4,770 (100.0%) | 2.93 |
Median Household Size in Lake Mary
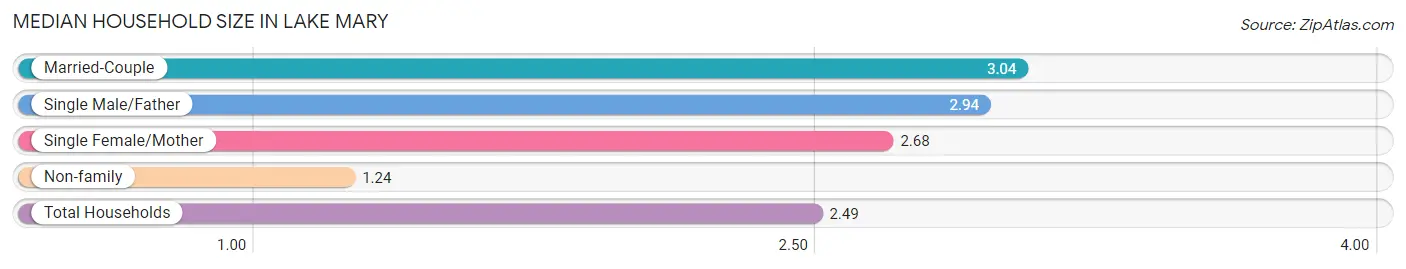
The median household size in Lake Mary is 2.49 persons per household, with married-couple households (3,692 | 56.3%) accounting for the largest median household size of 3.04 persons per household. non-family households (1,787 | 27.3%) represent the smallest median household size with 1.24 persons per household.
| Household Type | # Households | Household Size |
| Married-Couple | 3,692 (56.3%) | 3.04 |
| Single Male/Father | 113 (1.7%) | 2.94 |
| Single Female/Mother | 965 (14.7%) | 2.68 |
| Non-family | 1,787 (27.3%) | 1.24 |
| Total Households | 6,557 (100.0%) | 2.49 |
Household Size by Marriage Status in Lake Mary
Out of a total of 6,557 households in Lake Mary, 4,770 (72.8%) are family households, while 1,787 (27.3%) are nonfamily households. The most numerous type of family households are 2-person households, comprising 2,363, and the most common type of nonfamily households are 1-person households, comprising 1,431.
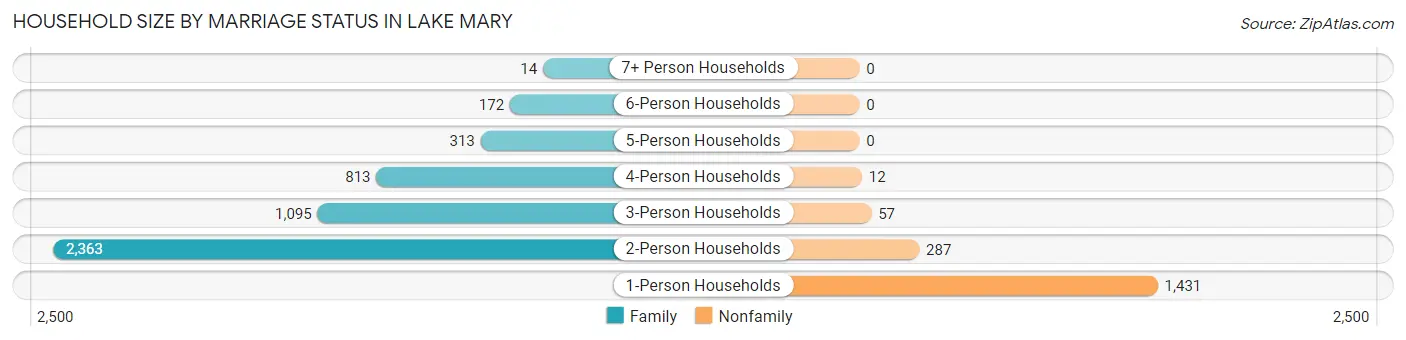
| Household Size | Family Households | Nonfamily Households |
| 1-Person Households | - | 1,431 (21.8%) |
| 2-Person Households | 2,363 (36.0%) | 287 (4.4%) |
| 3-Person Households | 1,095 (16.7%) | 57 (0.9%) |
| 4-Person Households | 813 (12.4%) | 12 (0.2%) |
| 5-Person Households | 313 (4.8%) | 0 (0.0%) |
| 6-Person Households | 172 (2.6%) | 0 (0.0%) |
| 7+ Person Households | 14 (0.2%) | 0 (0.0%) |
| Total | 4,770 (72.8%) | 1,787 (27.3%) |
Female Fertility in Lake Mary
Fertility by Age in Lake Mary
Average fertility rate in Lake Mary is 15.0 births per 1,000 women. Women in the age bracket of 20 to 34 years have the highest fertility rate with 19.0 births per 1,000 women. Women in the age bracket of 35 to 50 years acount for 63.6% of all women with births.
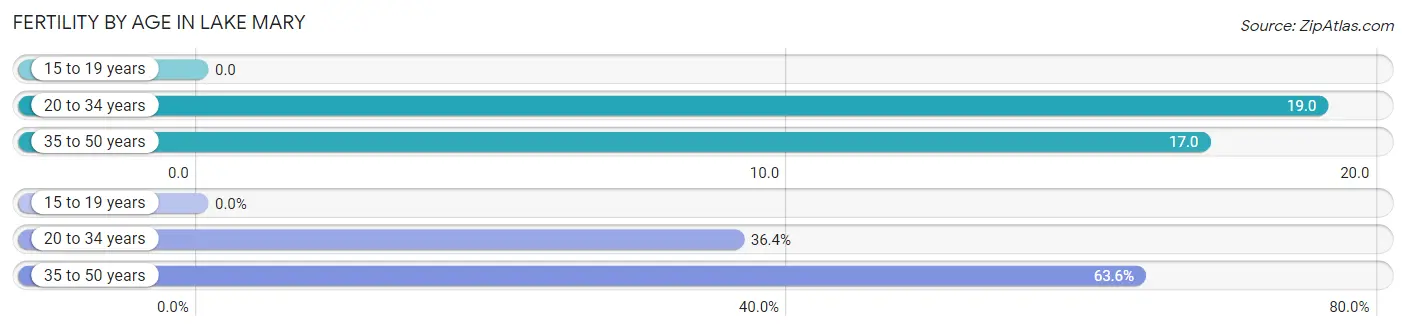
| Age Bracket | Women with Births | Births / 1,000 Women |
| 15 to 19 years | 0 (0.0%) | 0.0 |
| 20 to 34 years | 24 (36.4%) | 19.0 |
| 35 to 50 years | 42 (63.6%) | 17.0 |
| Total | 66 (100.0%) | 15.0 |
Fertility by Age by Marriage Status in Lake Mary
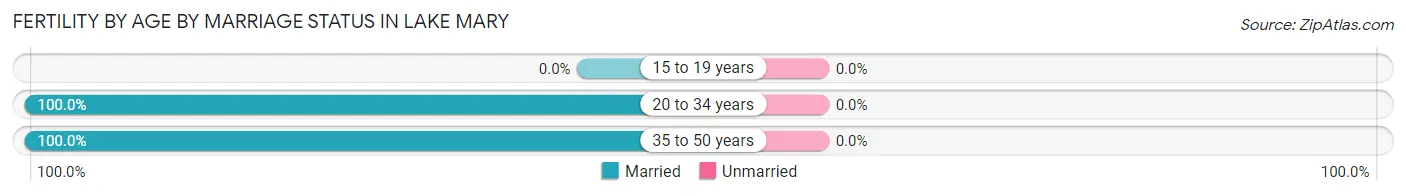
| Age Bracket | Married | Unmarried |
| 15 to 19 years | 0 (0.0%) | 0 (0.0%) |
| 20 to 34 years | 24 (100.0%) | 0 (0.0%) |
| 35 to 50 years | 42 (100.0%) | 0 (0.0%) |
| Total | 66 (100.0%) | 0 (0.0%) |
Fertility by Education in Lake Mary
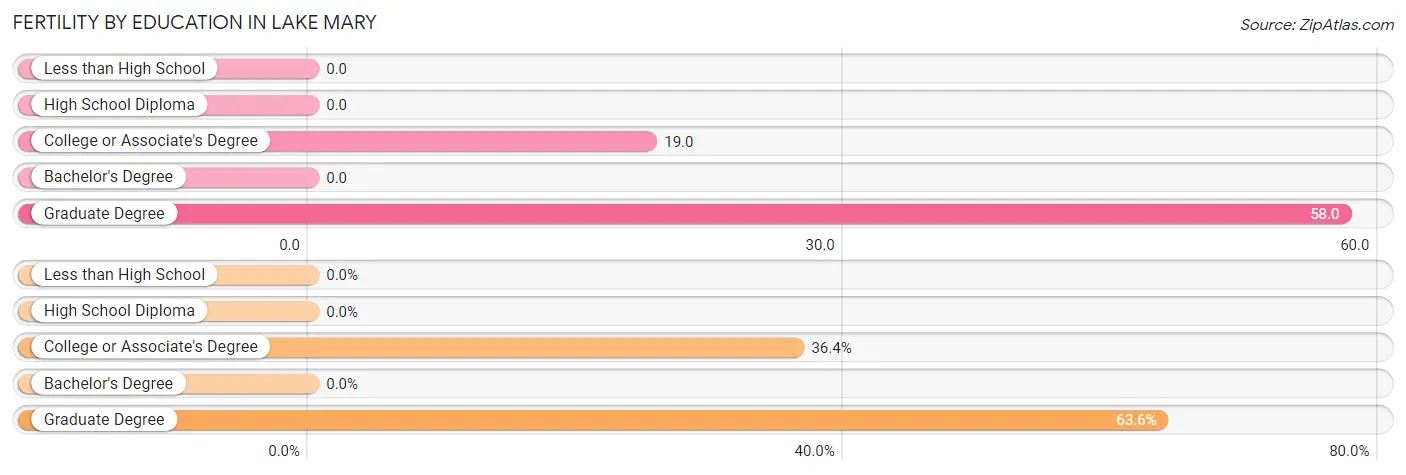
| Educational Attainment | Women with Births | Births / 1,000 Women |
| Less than High School | 0 (0.0%) | 0.0 |
| High School Diploma | 0 (0.0%) | 0.0 |
| College or Associate's Degree | 24 (36.4%) | 19.0 |
| Bachelor's Degree | 0 (0.0%) | 0.0 |
| Graduate Degree | 42 (63.6%) | 58.0 |
| Total | 66 (100.0%) | 15.0 |
Fertility by Education by Marriage Status in Lake Mary
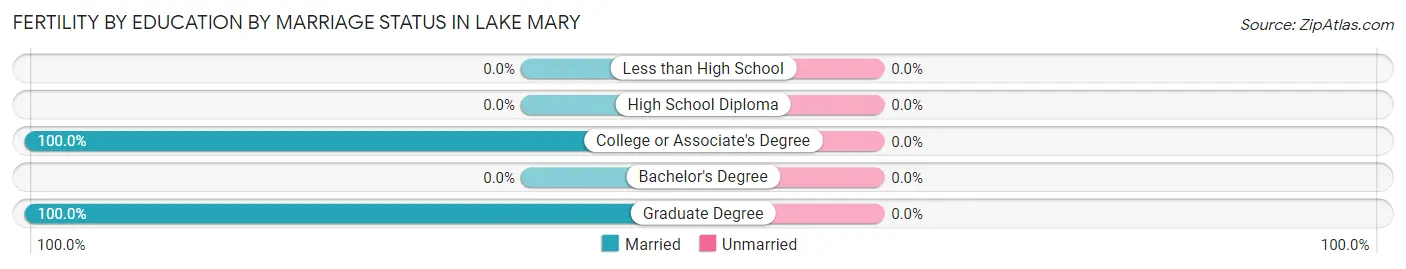
| Educational Attainment | Married | Unmarried |
| Less than High School | 0 (0.0%) | 0 (0.0%) |
| High School Diploma | 0 (0.0%) | 0 (0.0%) |
| College or Associate's Degree | 24 (100.0%) | 0 (0.0%) |
| Bachelor's Degree | 0 (0.0%) | 0 (0.0%) |
| Graduate Degree | 42 (100.0%) | 0 (0.0%) |
| Total | 66 (100.0%) | 0 (0.0%) |
Employment Characteristics in Lake Mary
Employment by Class of Employer in Lake Mary
Among the 8,957 employed individuals in Lake Mary, private company employees (6,238 | 69.6%), self-employed (incorporated) (739 | 8.3%), and state government employees (596 | 6.7%) make up the most common classes of employment.
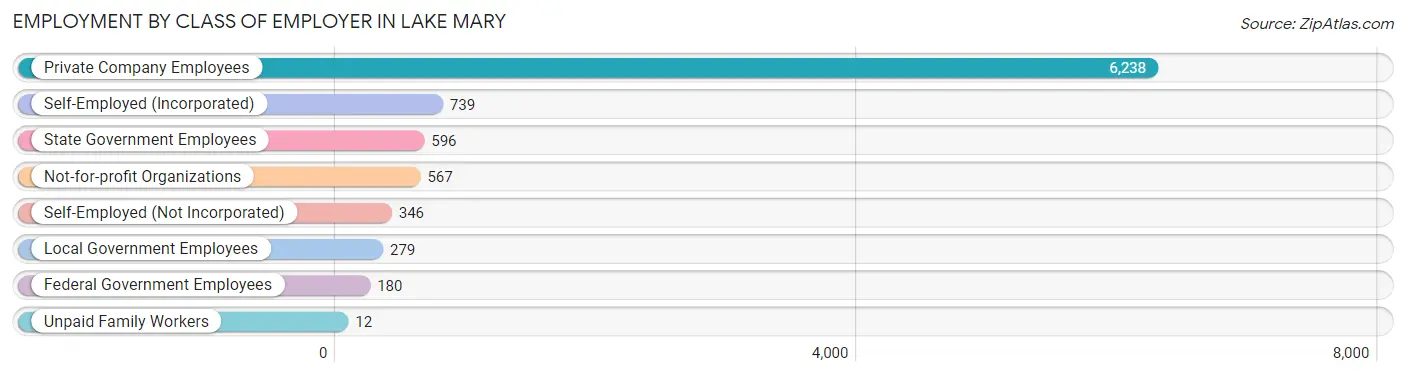
| Employer Class | # Employees | % Employees |
| Private Company Employees | 6,238 | 69.6% |
| Self-Employed (Incorporated) | 739 | 8.3% |
| Self-Employed (Not Incorporated) | 346 | 3.9% |
| Not-for-profit Organizations | 567 | 6.3% |
| Local Government Employees | 279 | 3.1% |
| State Government Employees | 596 | 6.7% |
| Federal Government Employees | 180 | 2.0% |
| Unpaid Family Workers | 12 | 0.1% |
| Total | 8,957 | 100.0% |
Employment Status by Age in Lake Mary
According to the labor force statistics for Lake Mary, out of the total population over 16 years of age (13,815), 66.4% or 9,173 individuals are in the labor force, with 1.7% or 156 of them unemployed. The age group with the highest labor force participation rate is 20 to 24 years, with 95.0% or 717 individuals in the labor force. Within the labor force, the 55 to 59 years age range has the highest percentage of unemployed individuals, with 4.0% or 30 of them being unemployed.
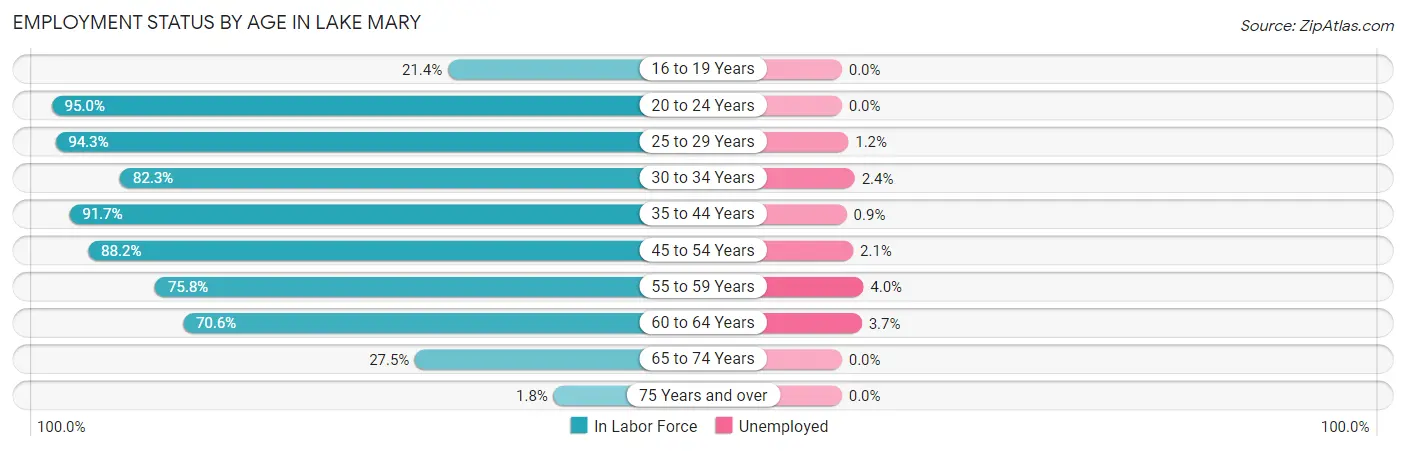
| Age Bracket | In Labor Force | Unemployed |
| 16 to 19 Years | 182 (21.4%) | 0 (0.0%) |
| 20 to 24 Years | 717 (95.0%) | 0 (0.0%) |
| 25 to 29 Years | 984 (94.3%) | 12 (1.2%) |
| 30 to 34 Years | 628 (82.3%) | 15 (2.4%) |
| 35 to 44 Years | 2,416 (91.7%) | 22 (0.9%) |
| 45 to 54 Years | 2,222 (88.2%) | 47 (2.1%) |
| 55 to 59 Years | 748 (75.8%) | 30 (4.0%) |
| 60 to 64 Years | 776 (70.6%) | 29 (3.7%) |
| 65 to 74 Years | 473 (27.5%) | 0 (0.0%) |
| 75 Years and over | 26 (1.8%) | 0 (0.0%) |
| Total | 9,173 (66.4%) | 156 (1.7%) |
Employment Status by Educational Attainment in Lake Mary
According to labor force statistics for Lake Mary, 85.9% of individuals (7,771) out of the total population between 25 and 64 years of age (9,047) are in the labor force, with 2.0% or 155 of them being unemployed. The group with the highest labor force participation rate are those with the educational attainment of bachelor's degree or higher, with 89.9% or 4,718 individuals in the labor force. Within the labor force, individuals with college / associate degree education have the highest percentage of unemployment, with 2.4% or 48 of them being unemployed.
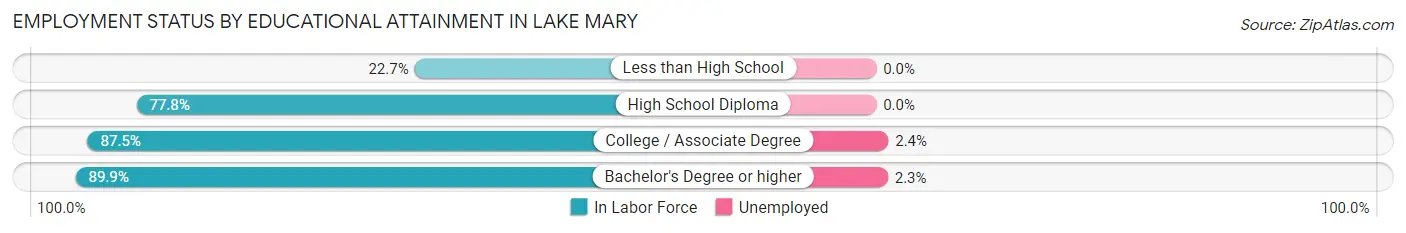
| Educational Attainment | In Labor Force | Unemployed |
| Less than High School | 49 (22.7%) | 0 (0.0%) |
| High School Diploma | 1,011 (77.8%) | 0 (0.0%) |
| College / Associate Degree | 1,998 (87.5%) | 55 (2.4%) |
| Bachelor's Degree or higher | 4,718 (89.9%) | 121 (2.3%) |
| Total | 7,771 (85.9%) | 181 (2.0%) |
Employment Occupations by Sex in Lake Mary
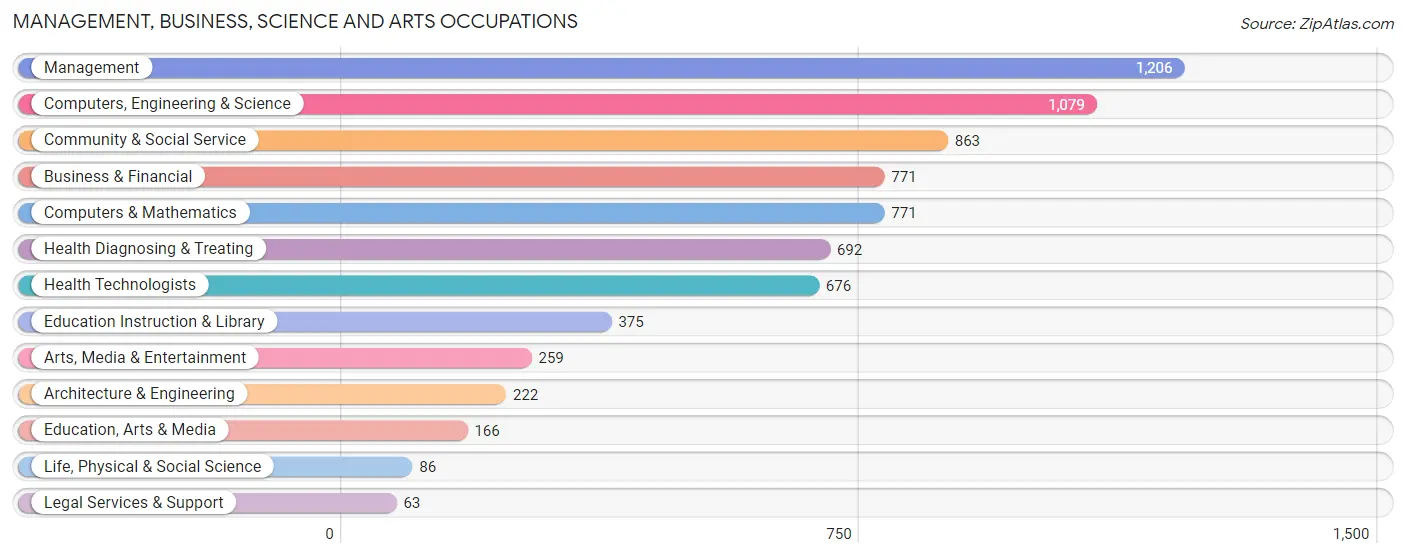
Management, Business, Science and Arts Occupations
The most common Management, Business, Science and Arts occupations in Lake Mary are Management (1,206 | 13.4%), Computers, Engineering & Science (1,079 | 12.0%), Community & Social Service (863 | 9.6%), Business & Financial (771 | 8.6%), and Computers & Mathematics (771 | 8.6%).
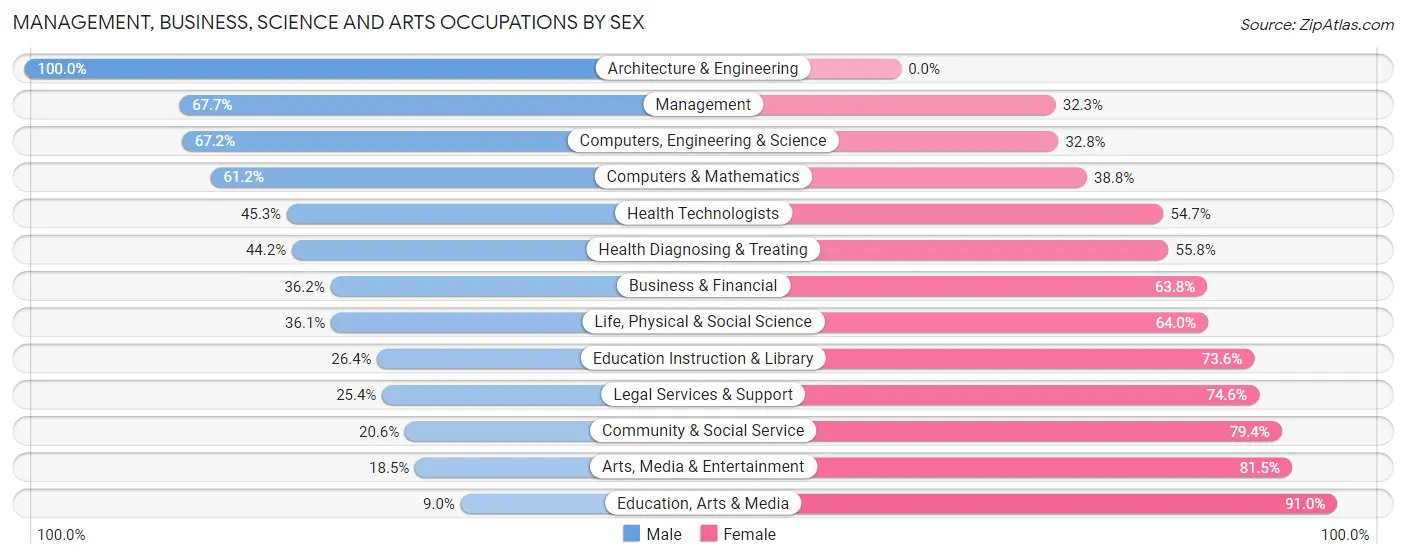
Management, Business, Science and Arts Occupations by Sex
Within the Management, Business, Science and Arts occupations in Lake Mary, the most male-oriented occupations are Architecture & Engineering (100.0%), Management (67.7%), and Computers, Engineering & Science (67.2%), while the most female-oriented occupations are Education, Arts & Media (91.0%), Arts, Media & Entertainment (81.5%), and Community & Social Service (79.4%).
| Occupation | Male | Female |
| Management | 817 (67.7%) | 389 (32.3%) |
| Business & Financial | 279 (36.2%) | 492 (63.8%) |
| Computers, Engineering & Science | 725 (67.2%) | 354 (32.8%) |
| Computers & Mathematics | 472 (61.2%) | 299 (38.8%) |
| Architecture & Engineering | 222 (100.0%) | 0 (0.0%) |
| Life, Physical & Social Science | 31 (36.0%) | 55 (63.9%) |
| Community & Social Service | 178 (20.6%) | 685 (79.4%) |
| Education, Arts & Media | 15 (9.0%) | 151 (91.0%) |
| Legal Services & Support | 16 (25.4%) | 47 (74.6%) |
| Education Instruction & Library | 99 (26.4%) | 276 (73.6%) |
| Arts, Media & Entertainment | 48 (18.5%) | 211 (81.5%) |
| Health Diagnosing & Treating | 306 (44.2%) | 386 (55.8%) |
| Health Technologists | 306 (45.3%) | 370 (54.7%) |
| Total (Category) | 2,305 (50.0%) | 2,306 (50.0%) |
| Total (Overall) | 4,265 (47.3%) | 4,754 (52.7%) |
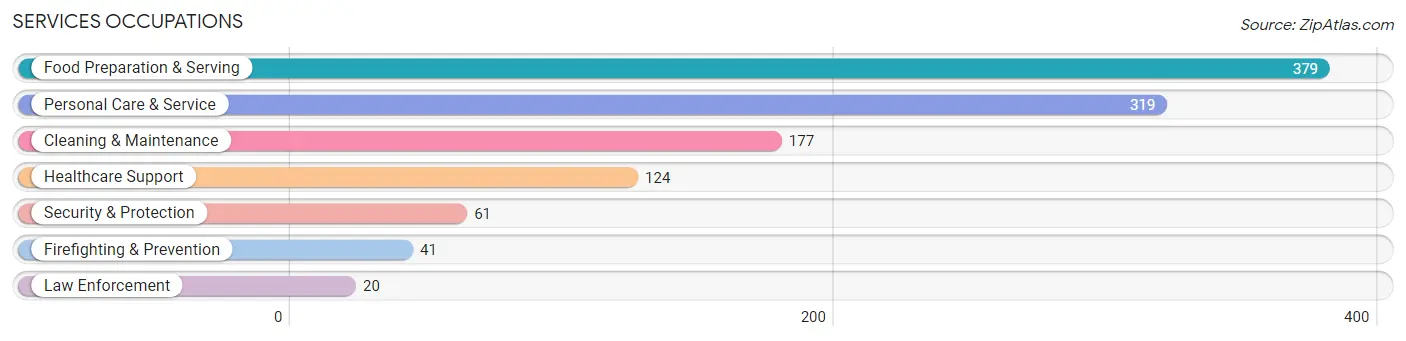
Services Occupations
The most common Services occupations in Lake Mary are Food Preparation & Serving (379 | 4.2%), Personal Care & Service (319 | 3.5%), Cleaning & Maintenance (177 | 2.0%), Healthcare Support (124 | 1.4%), and Security & Protection (61 | 0.7%).
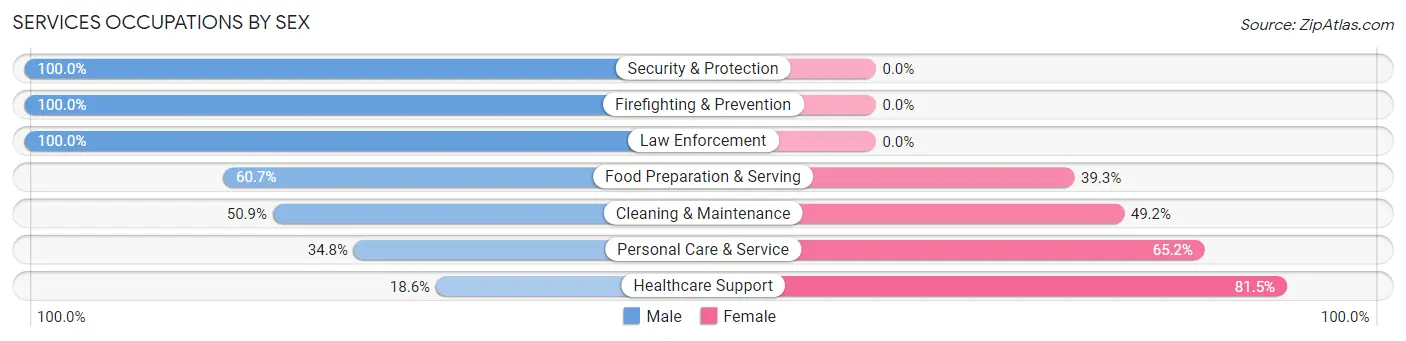
Services Occupations by Sex
Within the Services occupations in Lake Mary, the most male-oriented occupations are Security & Protection (100.0%), Firefighting & Prevention (100.0%), and Law Enforcement (100.0%), while the most female-oriented occupations are Healthcare Support (81.5%), Personal Care & Service (65.2%), and Cleaning & Maintenance (49.1%).
| Occupation | Male | Female |
| Healthcare Support | 23 (18.5%) | 101 (81.5%) |
| Security & Protection | 61 (100.0%) | 0 (0.0%) |
| Firefighting & Prevention | 41 (100.0%) | 0 (0.0%) |
| Law Enforcement | 20 (100.0%) | 0 (0.0%) |
| Food Preparation & Serving | 230 (60.7%) | 149 (39.3%) |
| Cleaning & Maintenance | 90 (50.8%) | 87 (49.1%) |
| Personal Care & Service | 111 (34.8%) | 208 (65.2%) |
| Total (Category) | 515 (48.6%) | 545 (51.4%) |
| Total (Overall) | 4,265 (47.3%) | 4,754 (52.7%) |
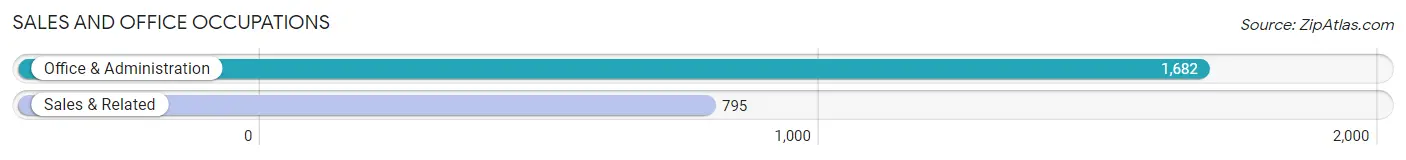
Sales and Office Occupations
The most common Sales and Office occupations in Lake Mary are Office & Administration (1,682 | 18.6%), and Sales & Related (795 | 8.8%).
Sales and Office Occupations by Sex
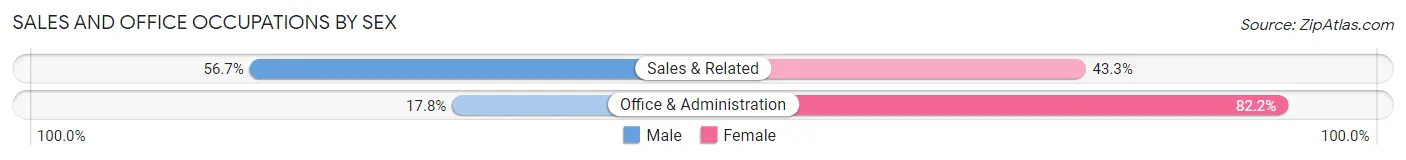
| Occupation | Male | Female |
| Sales & Related | 451 (56.7%) | 344 (43.3%) |
| Office & Administration | 299 (17.8%) | 1,383 (82.2%) |
| Total (Category) | 750 (30.3%) | 1,727 (69.7%) |
| Total (Overall) | 4,265 (47.3%) | 4,754 (52.7%) |
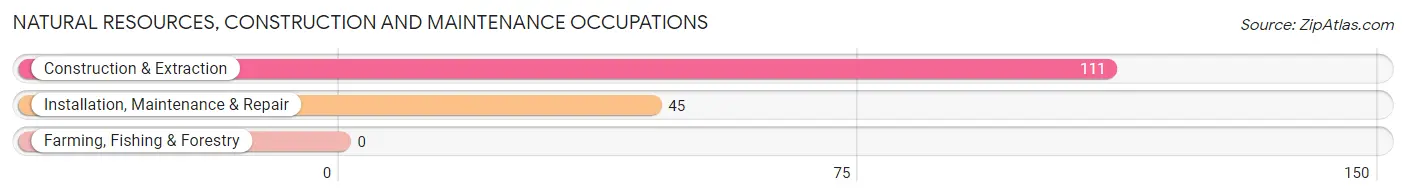
Natural Resources, Construction and Maintenance Occupations
The most common Natural Resources, Construction and Maintenance occupations in Lake Mary are Construction & Extraction (111 | 1.2%), and Installation, Maintenance & Repair (45 | 0.5%).
Natural Resources, Construction and Maintenance Occupations by Sex
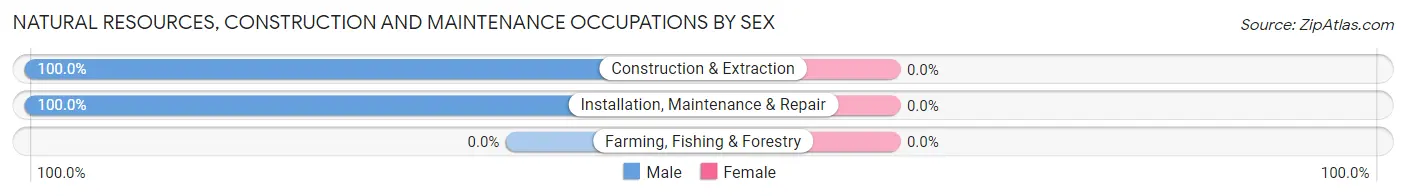
| Occupation | Male | Female |
| Farming, Fishing & Forestry | 0 (0.0%) | 0 (0.0%) |
| Construction & Extraction | 111 (100.0%) | 0 (0.0%) |
| Installation, Maintenance & Repair | 45 (100.0%) | 0 (0.0%) |
| Total (Category) | 156 (100.0%) | 0 (0.0%) |
| Total (Overall) | 4,265 (47.3%) | 4,754 (52.7%) |
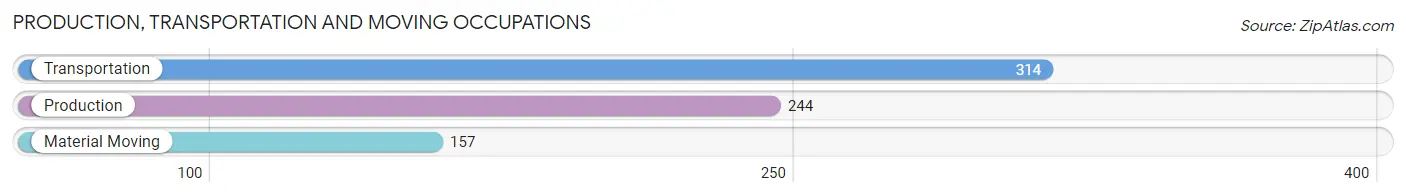
Production, Transportation and Moving Occupations
The most common Production, Transportation and Moving occupations in Lake Mary are Transportation (314 | 3.5%), Production (244 | 2.7%), and Material Moving (157 | 1.7%).
Production, Transportation and Moving Occupations by Sex
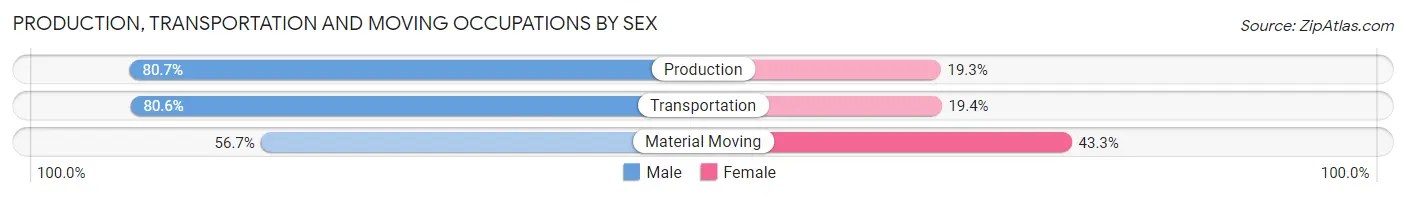
| Occupation | Male | Female |
| Production | 197 (80.7%) | 47 (19.3%) |
| Transportation | 253 (80.6%) | 61 (19.4%) |
| Material Moving | 89 (56.7%) | 68 (43.3%) |
| Total (Category) | 539 (75.4%) | 176 (24.6%) |
| Total (Overall) | 4,265 (47.3%) | 4,754 (52.7%) |
Employment Industries by Sex in Lake Mary
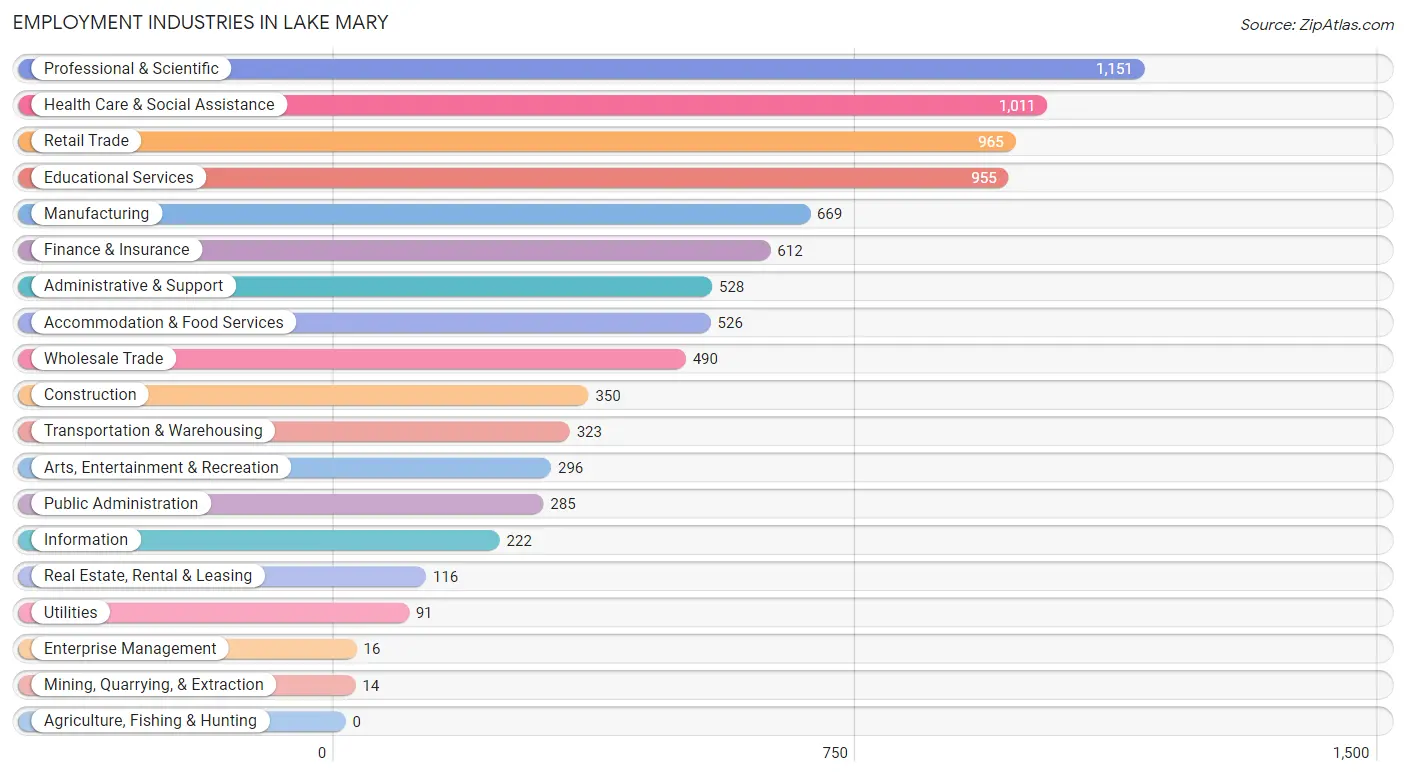
Employment Industries in Lake Mary
The major employment industries in Lake Mary include Professional & Scientific (1,151 | 12.8%), Health Care & Social Assistance (1,011 | 11.2%), Retail Trade (965 | 10.7%), Educational Services (955 | 10.6%), and Manufacturing (669 | 7.4%).
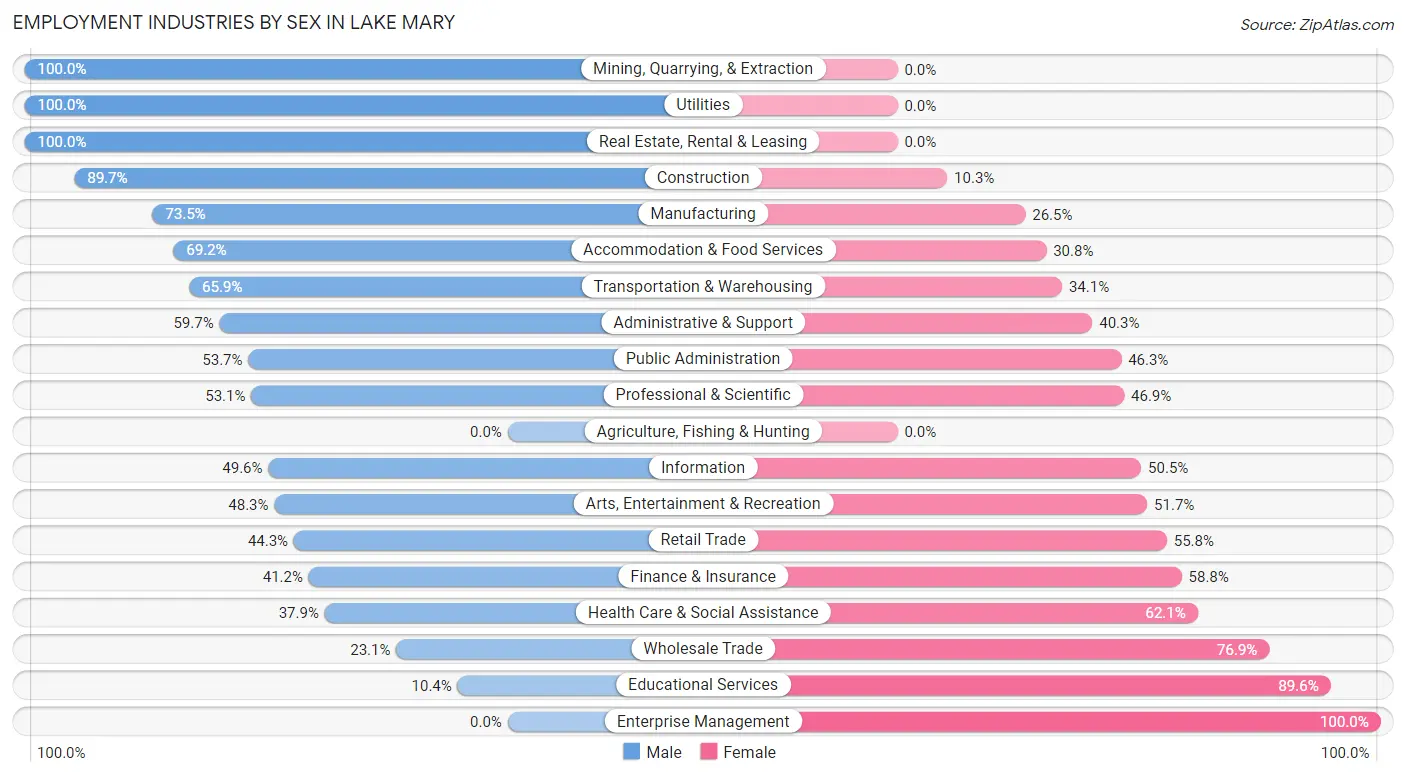
Employment Industries by Sex in Lake Mary
The Lake Mary industries that see more men than women are Mining, Quarrying, & Extraction (100.0%), Utilities (100.0%), and Real Estate, Rental & Leasing (100.0%), whereas the industries that tend to have a higher number of women are Enterprise Management (100.0%), Educational Services (89.6%), and Wholesale Trade (76.9%).
| Industry | Male | Female |
| Agriculture, Fishing & Hunting | 0 (0.0%) | 0 (0.0%) |
| Mining, Quarrying, & Extraction | 14 (100.0%) | 0 (0.0%) |
| Construction | 314 (89.7%) | 36 (10.3%) |
| Manufacturing | 492 (73.5%) | 177 (26.5%) |
| Wholesale Trade | 113 (23.1%) | 377 (76.9%) |
| Retail Trade | 427 (44.3%) | 538 (55.7%) |
| Transportation & Warehousing | 213 (65.9%) | 110 (34.1%) |
| Utilities | 91 (100.0%) | 0 (0.0%) |
| Information | 110 (49.5%) | 112 (50.4%) |
| Finance & Insurance | 252 (41.2%) | 360 (58.8%) |
| Real Estate, Rental & Leasing | 116 (100.0%) | 0 (0.0%) |
| Professional & Scientific | 611 (53.1%) | 540 (46.9%) |
| Enterprise Management | 0 (0.0%) | 16 (100.0%) |
| Administrative & Support | 315 (59.7%) | 213 (40.3%) |
| Educational Services | 99 (10.4%) | 856 (89.6%) |
| Health Care & Social Assistance | 383 (37.9%) | 628 (62.1%) |
| Arts, Entertainment & Recreation | 143 (48.3%) | 153 (51.7%) |
| Accommodation & Food Services | 364 (69.2%) | 162 (30.8%) |
| Public Administration | 153 (53.7%) | 132 (46.3%) |
| Total | 4,265 (47.3%) | 4,754 (52.7%) |
Education in Lake Mary
School Enrollment in Lake Mary
The most common levels of schooling among the 3,738 students in Lake Mary are high school (995 | 26.6%), college / undergraduate (913 | 24.4%), and middle school (729 | 19.5%).
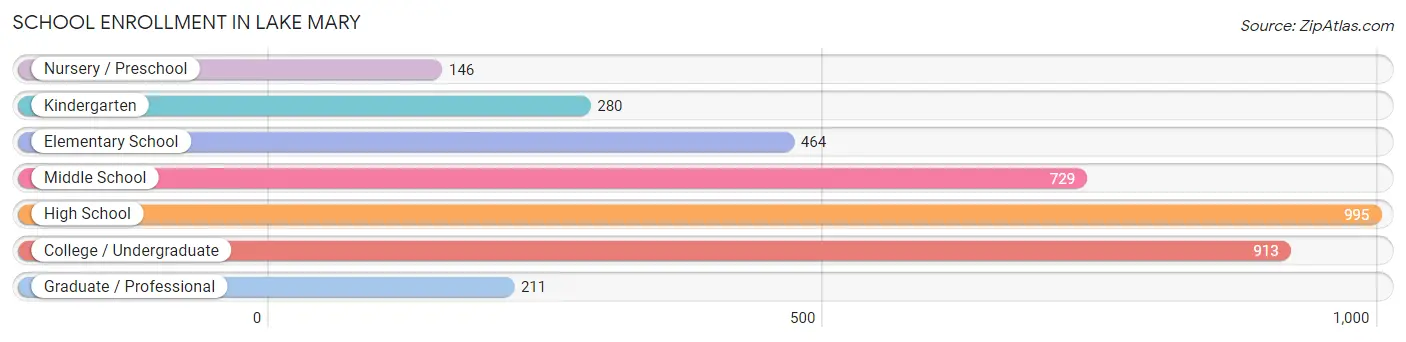
| School Level | # Students | % Students |
| Nursery / Preschool | 146 | 3.9% |
| Kindergarten | 280 | 7.5% |
| Elementary School | 464 | 12.4% |
| Middle School | 729 | 19.5% |
| High School | 995 | 26.6% |
| College / Undergraduate | 913 | 24.4% |
| Graduate / Professional | 211 | 5.6% |
| Total | 3,738 | 100.0% |
School Enrollment by Age by Funding Source in Lake Mary
Out of a total of 3,738 students who are enrolled in schools in Lake Mary, 766 (20.5%) attend a private institution, while the remaining 2,972 (79.5%) are enrolled in public schools. The age group of 3 to 4 year olds has the highest likelihood of being enrolled in private schools, with 101 (100.0% in the age bracket) enrolled. Conversely, the age group of 18 to 19 year olds has the lowest likelihood of being enrolled in a private school, with 273 (90.7% in the age bracket) attending a public institution.
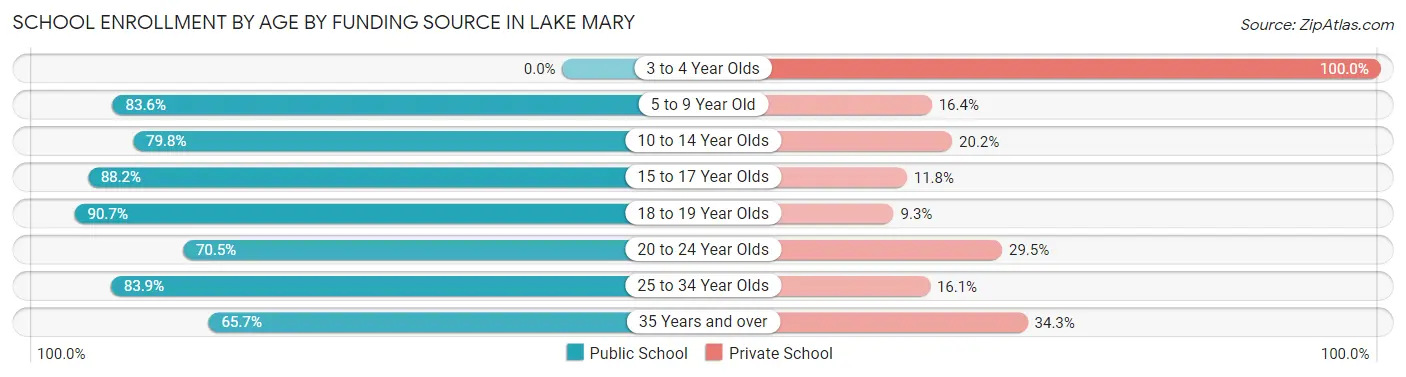
| Age Bracket | Public School | Private School |
| 3 to 4 Year Olds | 0 (0.0%) | 101 (100.0%) |
| 5 to 9 Year Old | 566 (83.6%) | 111 (16.4%) |
| 10 to 14 Year Olds | 719 (79.8%) | 182 (20.2%) |
| 15 to 17 Year Olds | 728 (88.2%) | 97 (11.8%) |
| 18 to 19 Year Olds | 273 (90.7%) | 28 (9.3%) |
| 20 to 24 Year Olds | 239 (70.5%) | 100 (29.5%) |
| 25 to 34 Year Olds | 256 (83.9%) | 49 (16.1%) |
| 35 Years and over | 190 (65.7%) | 99 (34.3%) |
| Total | 2,972 (79.5%) | 766 (20.5%) |
Educational Attainment by Field of Study in Lake Mary
Business (1,650 | 23.9%), engineering (759 | 11.0%), science & technology (686 | 10.0%), computers & mathematics (615 | 8.9%), and social sciences (529 | 7.7%) are the most common fields of study among 6,897 individuals in Lake Mary who have obtained a bachelor's degree or higher.
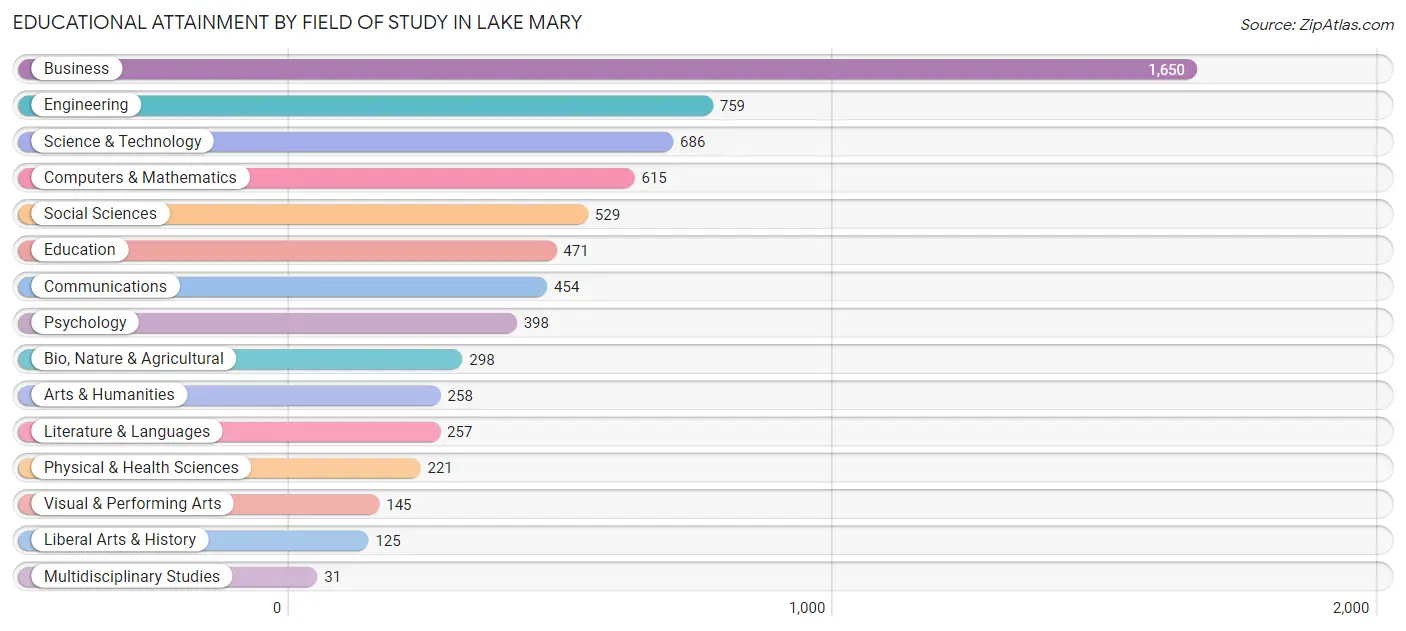
| Field of Study | # Graduates | % Graduates |
| Computers & Mathematics | 615 | 8.9% |
| Bio, Nature & Agricultural | 298 | 4.3% |
| Physical & Health Sciences | 221 | 3.2% |
| Psychology | 398 | 5.8% |
| Social Sciences | 529 | 7.7% |
| Engineering | 759 | 11.0% |
| Multidisciplinary Studies | 31 | 0.4% |
| Science & Technology | 686 | 10.0% |
| Business | 1,650 | 23.9% |
| Education | 471 | 6.8% |
| Literature & Languages | 257 | 3.7% |
| Liberal Arts & History | 125 | 1.8% |
| Visual & Performing Arts | 145 | 2.1% |
| Communications | 454 | 6.6% |
| Arts & Humanities | 258 | 3.7% |
| Total | 6,897 | 100.0% |
Transportation & Commute in Lake Mary
Vehicle Availability by Sex in Lake Mary
The most prevalent vehicle ownership categories in Lake Mary are males with 2 vehicles (2,006, accounting for 47.2%) and females with 2 vehicles (2,345, making up 42.6%).
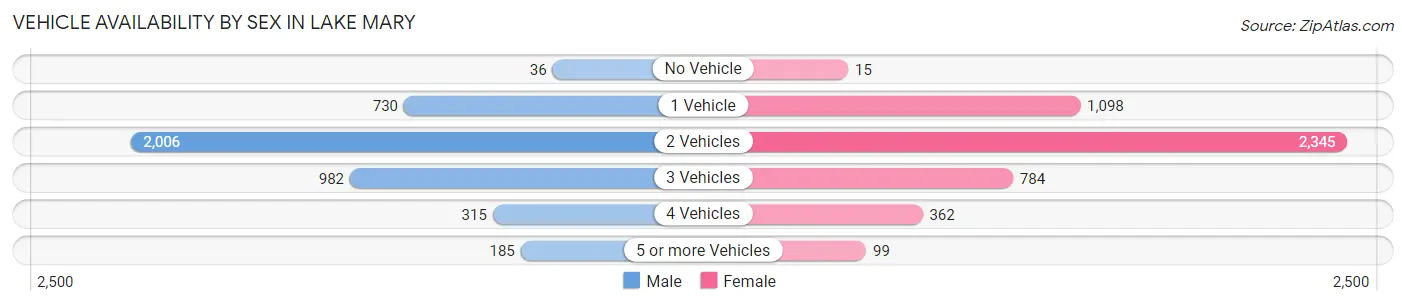
| Vehicles Available | Male | Female |
| No Vehicle | 36 (0.9%) | 15 (0.3%) |
| 1 Vehicle | 730 (17.2%) | 1,098 (23.4%) |
| 2 Vehicles | 2,006 (47.2%) | 2,345 (49.9%) |
| 3 Vehicles | 982 (23.1%) | 784 (16.7%) |
| 4 Vehicles | 315 (7.4%) | 362 (7.7%) |
| 5 or more Vehicles | 185 (4.3%) | 99 (2.1%) |
| Total | 4,254 (100.0%) | 4,703 (100.0%) |
Commute Time in Lake Mary
The most frequently occuring commute durations in Lake Mary are 10 to 14 minutes (1,304 commuters, 17.9%), 15 to 19 minutes (1,286 commuters, 17.7%), and 30 to 34 minutes (969 commuters, 13.3%).
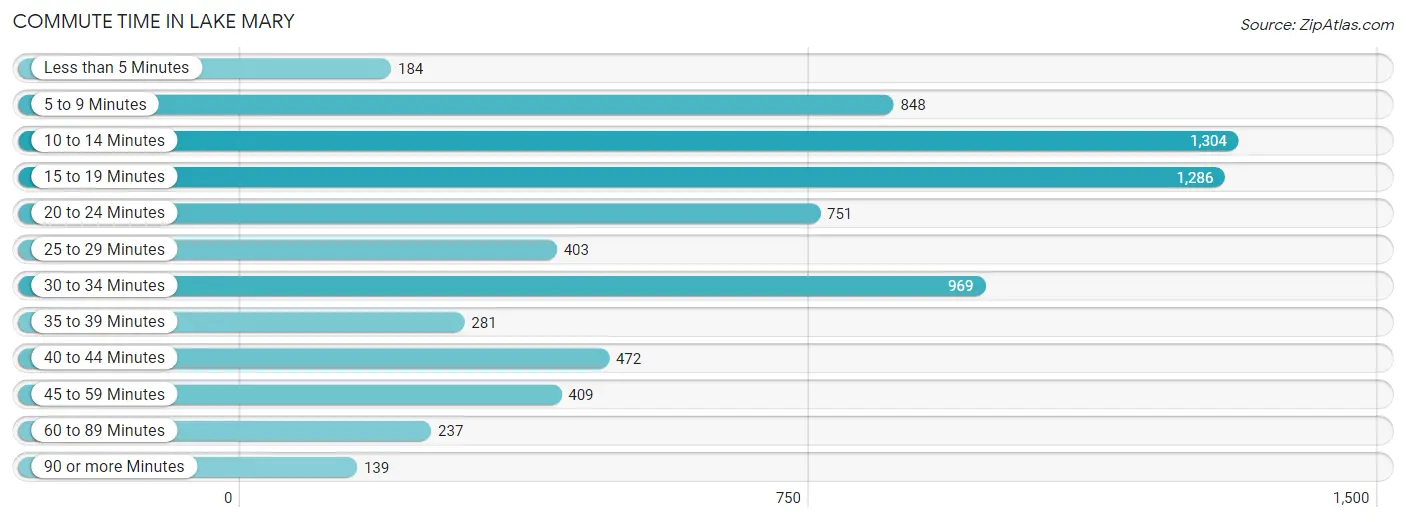
| Commute Time | # Commuters | % Commuters |
| Less than 5 Minutes | 184 | 2.5% |
| 5 to 9 Minutes | 848 | 11.6% |
| 10 to 14 Minutes | 1,304 | 17.9% |
| 15 to 19 Minutes | 1,286 | 17.7% |
| 20 to 24 Minutes | 751 | 10.3% |
| 25 to 29 Minutes | 403 | 5.5% |
| 30 to 34 Minutes | 969 | 13.3% |
| 35 to 39 Minutes | 281 | 3.9% |
| 40 to 44 Minutes | 472 | 6.5% |
| 45 to 59 Minutes | 409 | 5.6% |
| 60 to 89 Minutes | 237 | 3.3% |
| 90 or more Minutes | 139 | 1.9% |
Commute Time by Sex in Lake Mary
The most common commute times in Lake Mary are 10 to 14 minutes (725 commuters, 20.0%) for males and 15 to 19 minutes (714 commuters, 19.6%) for females.
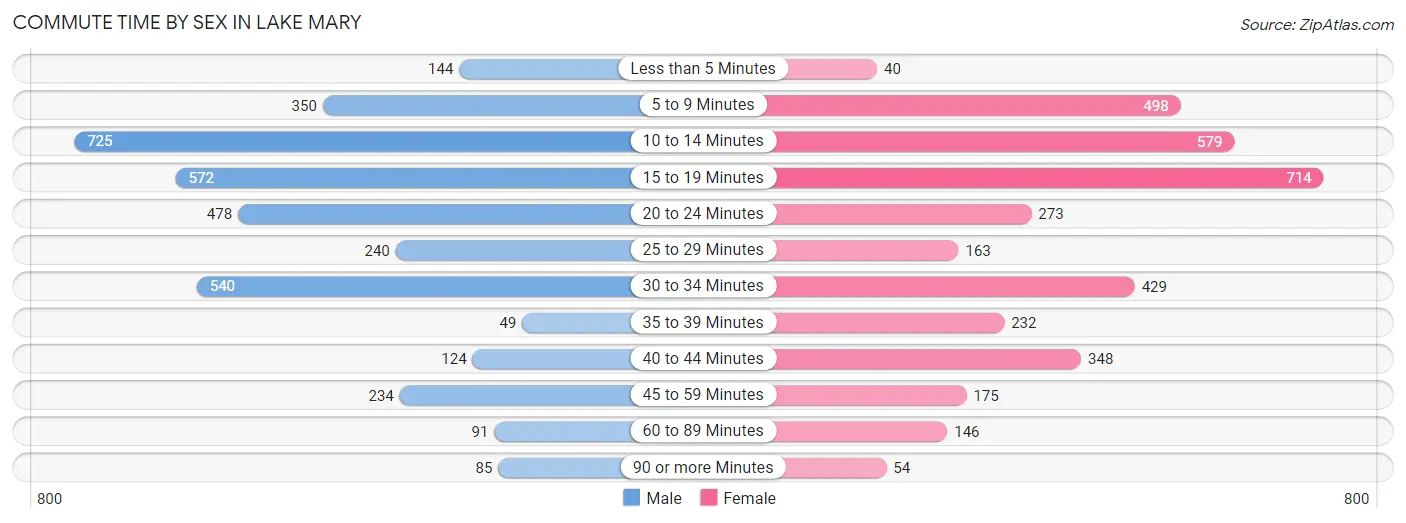
| Commute Time | Male | Female |
| Less than 5 Minutes | 144 (4.0%) | 40 (1.1%) |
| 5 to 9 Minutes | 350 (9.6%) | 498 (13.6%) |
| 10 to 14 Minutes | 725 (20.0%) | 579 (15.9%) |
| 15 to 19 Minutes | 572 (15.8%) | 714 (19.6%) |
| 20 to 24 Minutes | 478 (13.2%) | 273 (7.5%) |
| 25 to 29 Minutes | 240 (6.6%) | 163 (4.5%) |
| 30 to 34 Minutes | 540 (14.9%) | 429 (11.7%) |
| 35 to 39 Minutes | 49 (1.3%) | 232 (6.4%) |
| 40 to 44 Minutes | 124 (3.4%) | 348 (9.5%) |
| 45 to 59 Minutes | 234 (6.4%) | 175 (4.8%) |
| 60 to 89 Minutes | 91 (2.5%) | 146 (4.0%) |
| 90 or more Minutes | 85 (2.3%) | 54 (1.5%) |
Time of Departure to Work by Sex in Lake Mary
The most frequent times of departure to work in Lake Mary are 7:30 AM to 7:59 AM (642, 17.7%) for males and 7:00 AM to 7:29 AM (800, 21.9%) for females.
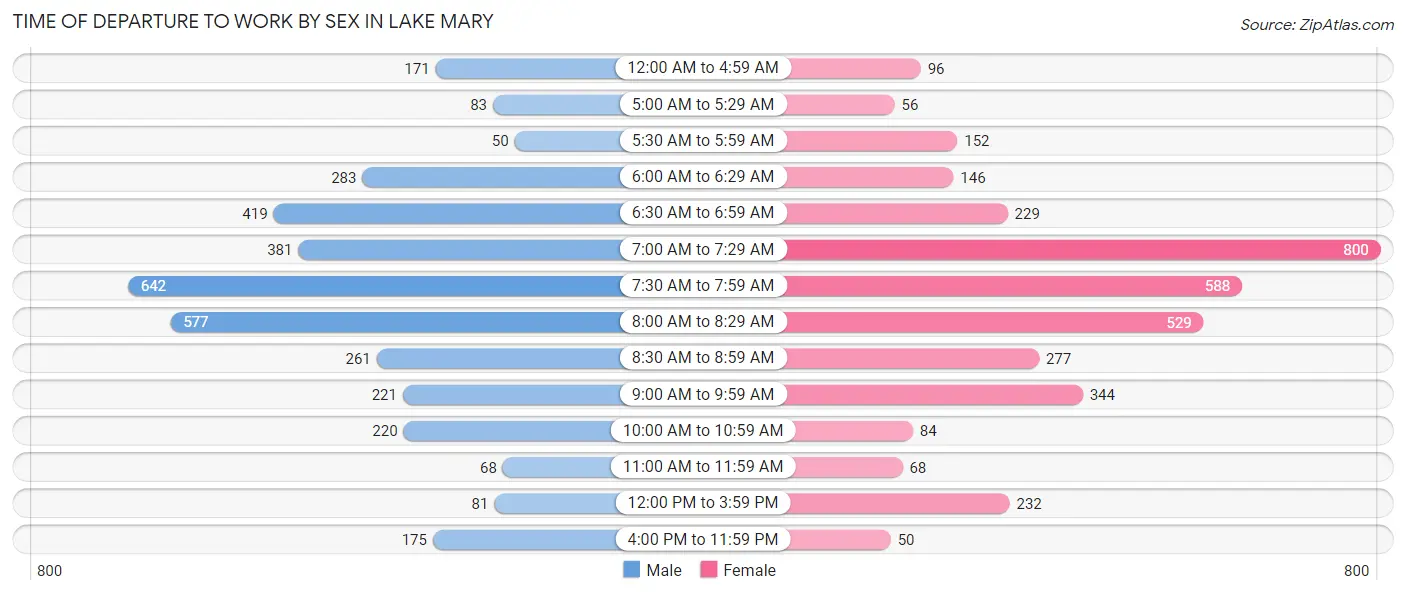
| Time of Departure | Male | Female |
| 12:00 AM to 4:59 AM | 171 (4.7%) | 96 (2.6%) |
| 5:00 AM to 5:29 AM | 83 (2.3%) | 56 (1.5%) |
| 5:30 AM to 5:59 AM | 50 (1.4%) | 152 (4.2%) |
| 6:00 AM to 6:29 AM | 283 (7.8%) | 146 (4.0%) |
| 6:30 AM to 6:59 AM | 419 (11.5%) | 229 (6.3%) |
| 7:00 AM to 7:29 AM | 381 (10.5%) | 800 (21.9%) |
| 7:30 AM to 7:59 AM | 642 (17.7%) | 588 (16.1%) |
| 8:00 AM to 8:29 AM | 577 (15.9%) | 529 (14.5%) |
| 8:30 AM to 8:59 AM | 261 (7.2%) | 277 (7.6%) |
| 9:00 AM to 9:59 AM | 221 (6.1%) | 344 (9.4%) |
| 10:00 AM to 10:59 AM | 220 (6.1%) | 84 (2.3%) |
| 11:00 AM to 11:59 AM | 68 (1.9%) | 68 (1.9%) |
| 12:00 PM to 3:59 PM | 81 (2.2%) | 232 (6.4%) |
| 4:00 PM to 11:59 PM | 175 (4.8%) | 50 (1.4%) |
| Total | 3,632 (100.0%) | 3,651 (100.0%) |
Housing Occupancy in Lake Mary
Occupancy by Ownership in Lake Mary
Of the total 6,557 dwellings in Lake Mary, owner-occupied units account for 4,478 (68.3%), while renter-occupied units make up 2,079 (31.7%).
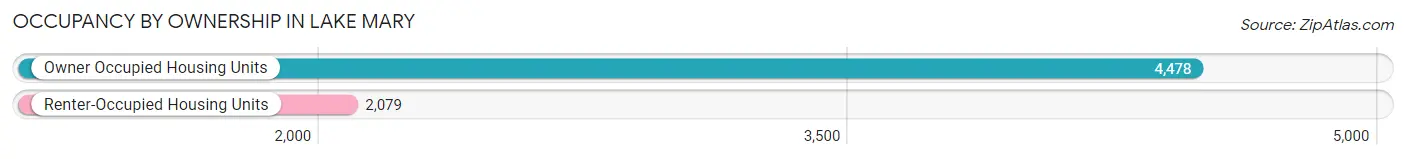
| Occupancy | # Housing Units | % Housing Units |
| Owner Occupied Housing Units | 4,478 | 68.3% |
| Renter-Occupied Housing Units | 2,079 | 31.7% |
| Total Occupied Housing Units | 6,557 | 100.0% |
Occupancy by Household Size in Lake Mary
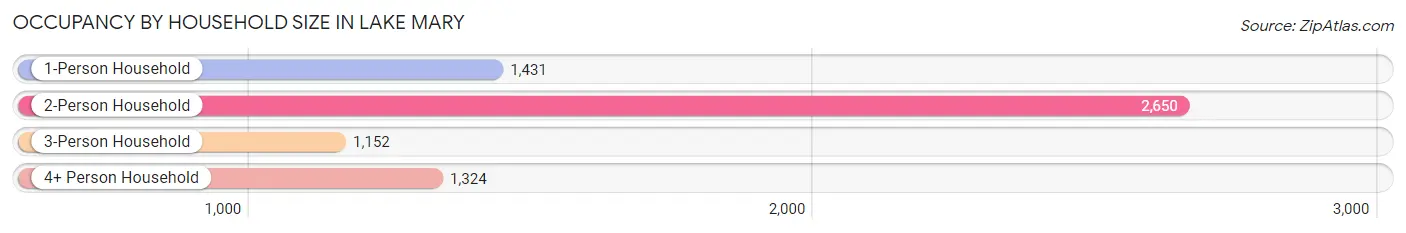
| Household Size | # Housing Units | % Housing Units |
| 1-Person Household | 1,431 | 21.8% |
| 2-Person Household | 2,650 | 40.4% |
| 3-Person Household | 1,152 | 17.6% |
| 4+ Person Household | 1,324 | 20.2% |
| Total Housing Units | 6,557 | 100.0% |
Occupancy by Ownership by Household Size in Lake Mary
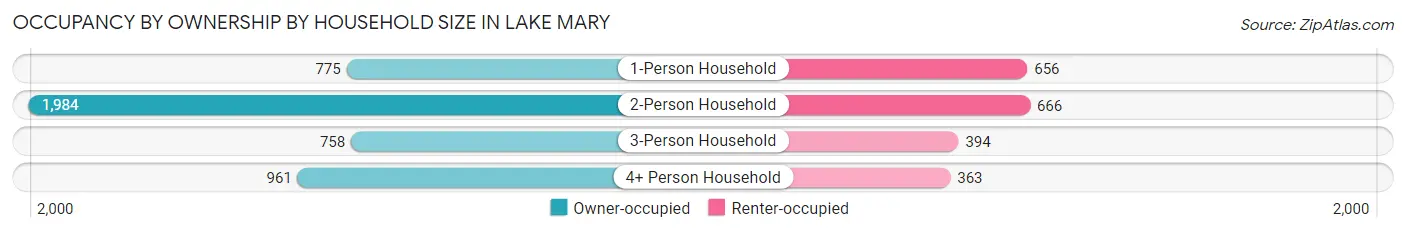
| Household Size | Owner-occupied | Renter-occupied |
| 1-Person Household | 775 (54.2%) | 656 (45.8%) |
| 2-Person Household | 1,984 (74.9%) | 666 (25.1%) |
| 3-Person Household | 758 (65.8%) | 394 (34.2%) |
| 4+ Person Household | 961 (72.6%) | 363 (27.4%) |
| Total Housing Units | 4,478 (68.3%) | 2,079 (31.7%) |
Occupancy by Educational Attainment in Lake Mary
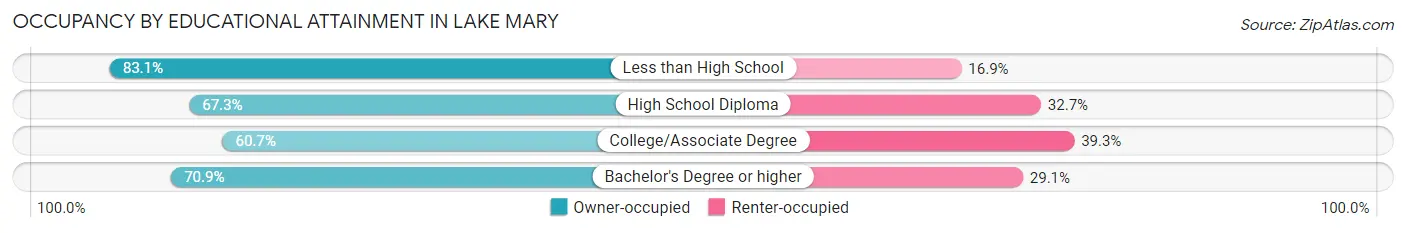
| Household Size | Owner-occupied | Renter-occupied |
| Less than High School | 118 (83.1%) | 24 (16.9%) |
| High School Diploma | 563 (67.3%) | 273 (32.7%) |
| College/Associate Degree | 953 (60.7%) | 616 (39.3%) |
| Bachelor's Degree or higher | 2,844 (70.9%) | 1,166 (29.1%) |
Occupancy by Age of Householder in Lake Mary
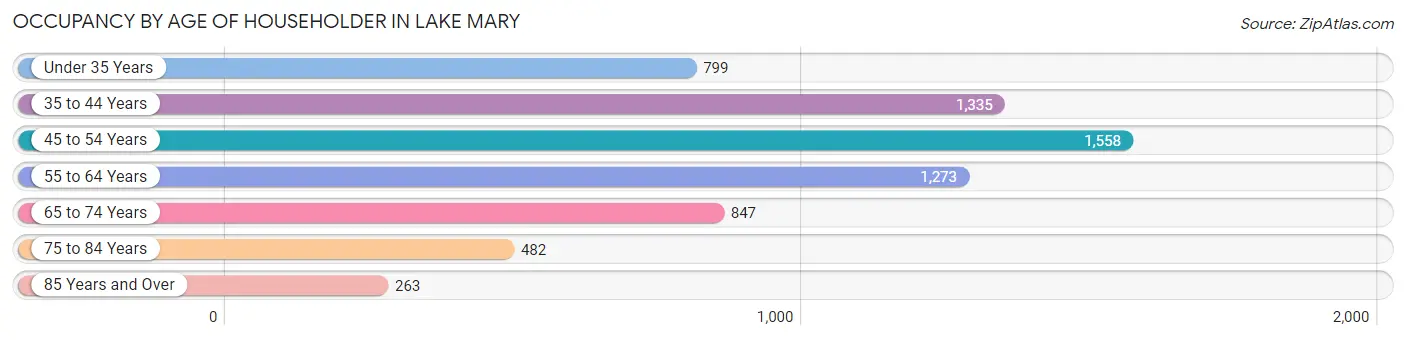
| Age Bracket | # Households | % Households |
| Under 35 Years | 799 | 12.2% |
| 35 to 44 Years | 1,335 | 20.4% |
| 45 to 54 Years | 1,558 | 23.8% |
| 55 to 64 Years | 1,273 | 19.4% |
| 65 to 74 Years | 847 | 12.9% |
| 75 to 84 Years | 482 | 7.3% |
| 85 Years and Over | 263 | 4.0% |
| Total | 6,557 | 100.0% |
Housing Finances in Lake Mary
Median Income by Occupancy in Lake Mary
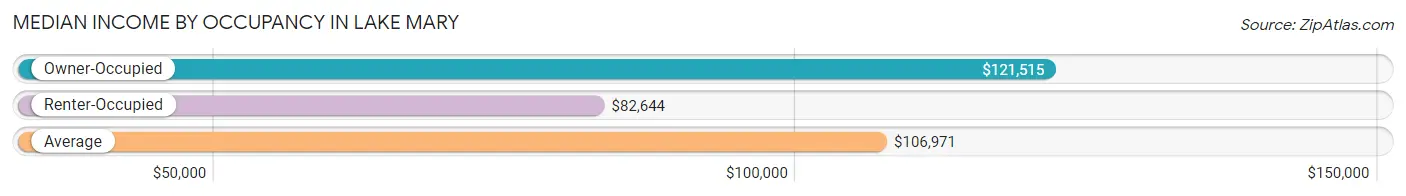
| Occupancy Type | # Households | Median Income |
| Owner-Occupied | 4,478 (68.3%) | $121,515 |
| Renter-Occupied | 2,079 (31.7%) | $82,644 |
| Average | 6,557 (100.0%) | $106,971 |
Occupancy by Householder Income Bracket in Lake Mary
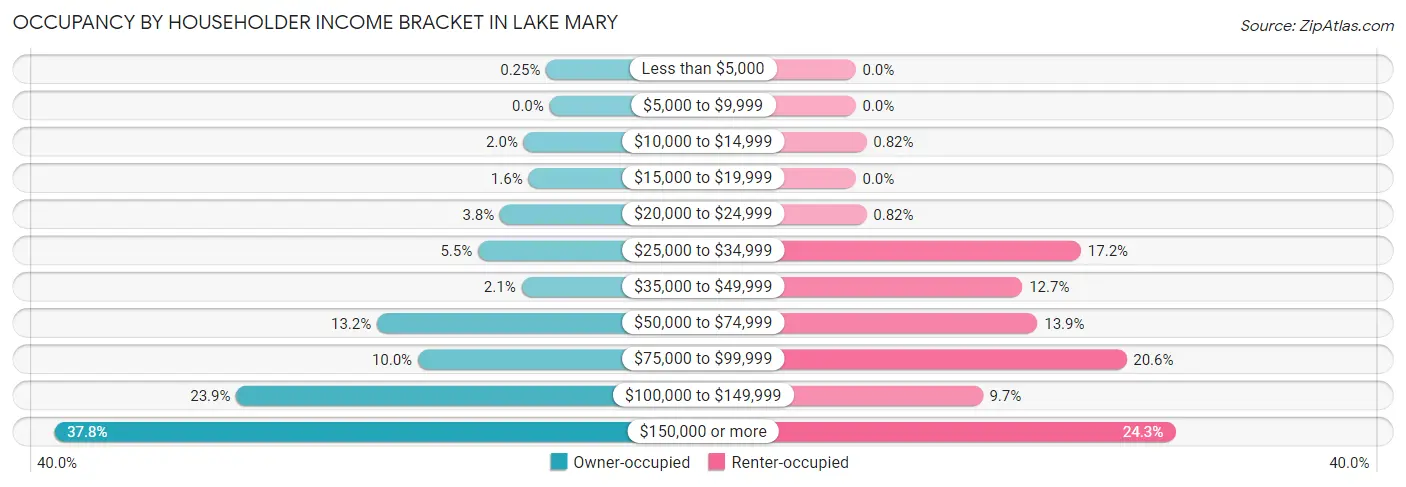
| Income Bracket | Owner-occupied | Renter-occupied |
| Less than $5,000 | 11 (0.3%) | 0 (0.0%) |
| $5,000 to $9,999 | 0 (0.0%) | 0 (0.0%) |
| $10,000 to $14,999 | 88 (2.0%) | 17 (0.8%) |
| $15,000 to $19,999 | 72 (1.6%) | 0 (0.0%) |
| $20,000 to $24,999 | 169 (3.8%) | 17 (0.8%) |
| $25,000 to $34,999 | 244 (5.4%) | 357 (17.2%) |
| $35,000 to $49,999 | 96 (2.1%) | 264 (12.7%) |
| $50,000 to $74,999 | 589 (13.2%) | 288 (13.9%) |
| $75,000 to $99,999 | 449 (10.0%) | 429 (20.6%) |
| $100,000 to $149,999 | 1,069 (23.9%) | 201 (9.7%) |
| $150,000 or more | 1,691 (37.8%) | 506 (24.3%) |
| Total | 4,478 (100.0%) | 2,079 (100.0%) |
Monthly Housing Cost Tiers in Lake Mary
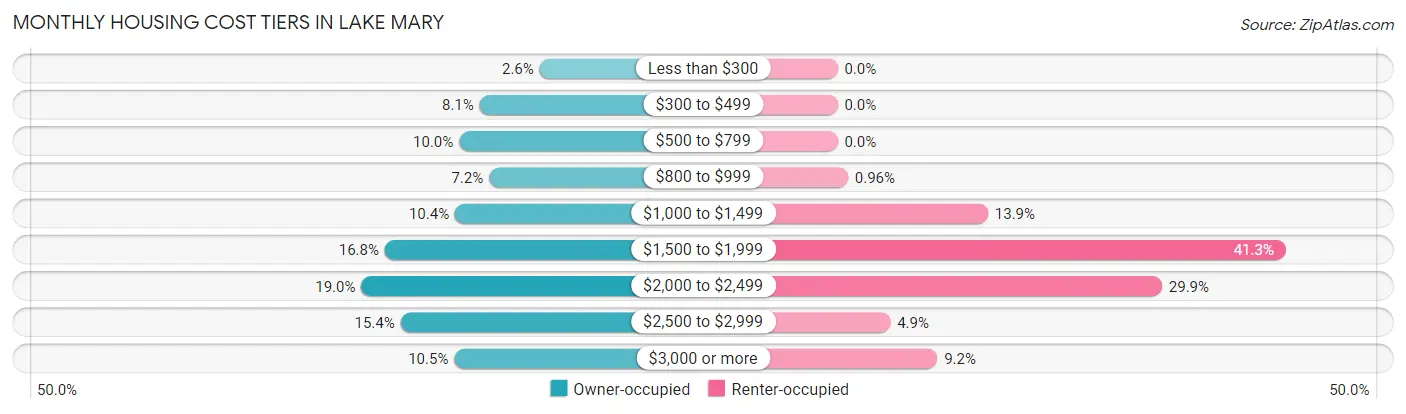
| Monthly Cost | Owner-occupied | Renter-occupied |
| Less than $300 | 116 (2.6%) | 0 (0.0%) |
| $300 to $499 | 363 (8.1%) | 0 (0.0%) |
| $500 to $799 | 448 (10.0%) | 0 (0.0%) |
| $800 to $999 | 324 (7.2%) | 20 (1.0%) |
| $1,000 to $1,499 | 465 (10.4%) | 288 (13.9%) |
| $1,500 to $1,999 | 754 (16.8%) | 858 (41.3%) |
| $2,000 to $2,499 | 851 (19.0%) | 621 (29.9%) |
| $2,500 to $2,999 | 689 (15.4%) | 101 (4.9%) |
| $3,000 or more | 468 (10.4%) | 191 (9.2%) |
| Total | 4,478 (100.0%) | 2,079 (100.0%) |
Physical Housing Characteristics in Lake Mary
Housing Structures in Lake Mary
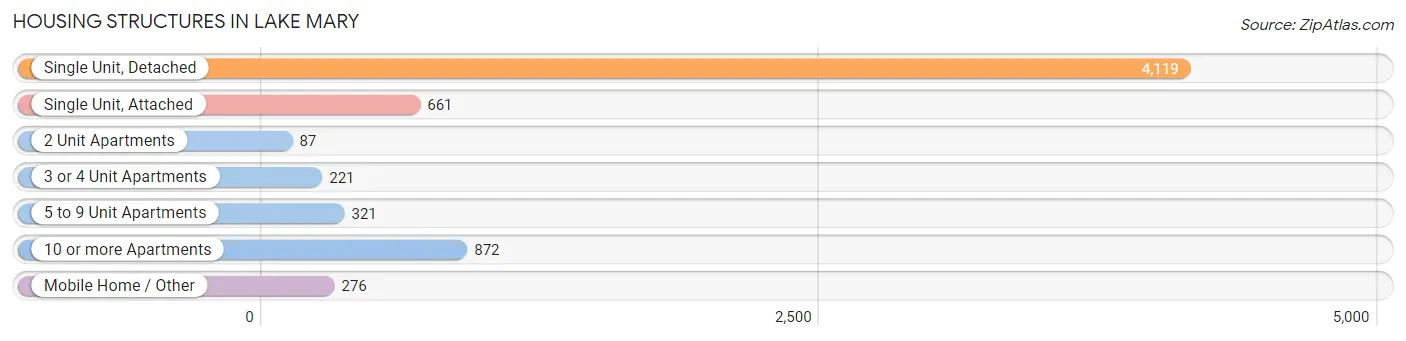
| Structure Type | # Housing Units | % Housing Units |
| Single Unit, Detached | 4,119 | 62.8% |
| Single Unit, Attached | 661 | 10.1% |
| 2 Unit Apartments | 87 | 1.3% |
| 3 or 4 Unit Apartments | 221 | 3.4% |
| 5 to 9 Unit Apartments | 321 | 4.9% |
| 10 or more Apartments | 872 | 13.3% |
| Mobile Home / Other | 276 | 4.2% |
| Total | 6,557 | 100.0% |
Housing Structures by Occupancy in Lake Mary
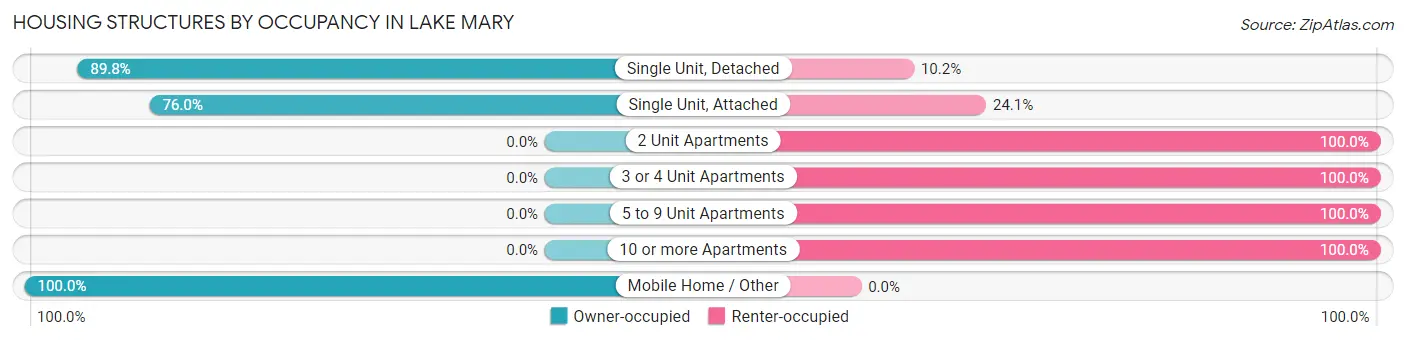
| Structure Type | Owner-occupied | Renter-occupied |
| Single Unit, Detached | 3,700 (89.8%) | 419 (10.2%) |
| Single Unit, Attached | 502 (75.9%) | 159 (24.0%) |
| 2 Unit Apartments | 0 (0.0%) | 87 (100.0%) |
| 3 or 4 Unit Apartments | 0 (0.0%) | 221 (100.0%) |
| 5 to 9 Unit Apartments | 0 (0.0%) | 321 (100.0%) |
| 10 or more Apartments | 0 (0.0%) | 872 (100.0%) |
| Mobile Home / Other | 276 (100.0%) | 0 (0.0%) |
| Total | 4,478 (68.3%) | 2,079 (31.7%) |
Housing Structures by Number of Rooms in Lake Mary
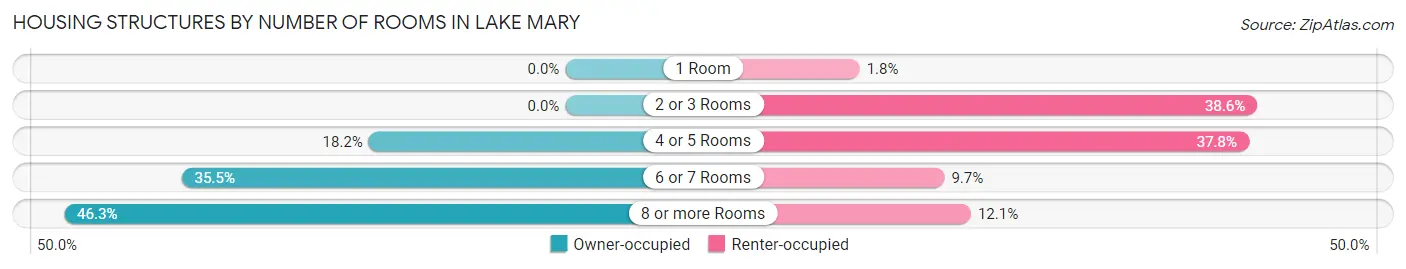
| Number of Rooms | Owner-occupied | Renter-occupied |
| 1 Room | 0 (0.0%) | 38 (1.8%) |
| 2 or 3 Rooms | 0 (0.0%) | 802 (38.6%) |
| 4 or 5 Rooms | 814 (18.2%) | 786 (37.8%) |
| 6 or 7 Rooms | 1,589 (35.5%) | 201 (9.7%) |
| 8 or more Rooms | 2,075 (46.3%) | 252 (12.1%) |
| Total | 4,478 (100.0%) | 2,079 (100.0%) |
Housing Structure by Heating Type in Lake Mary
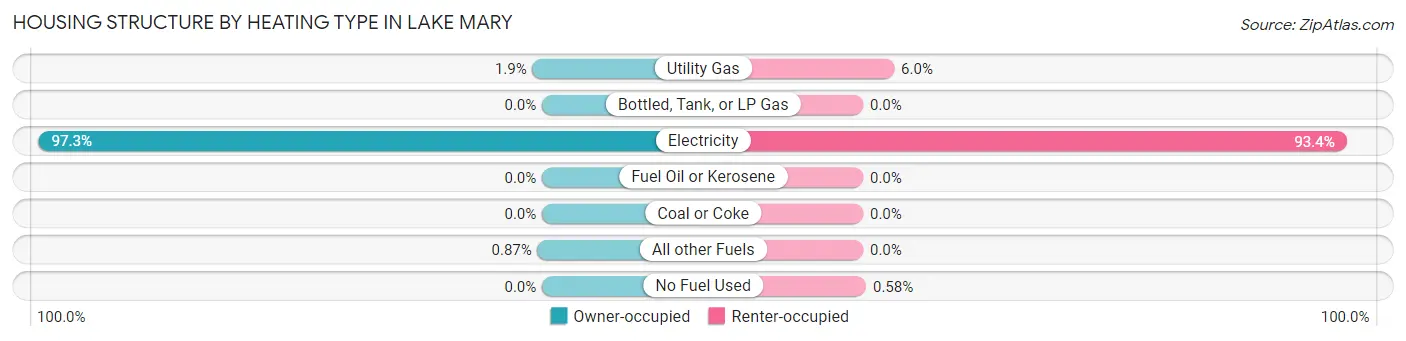
| Heating Type | Owner-occupied | Renter-occupied |
| Utility Gas | 83 (1.8%) | 125 (6.0%) |
| Bottled, Tank, or LP Gas | 0 (0.0%) | 0 (0.0%) |
| Electricity | 4,356 (97.3%) | 1,942 (93.4%) |
| Fuel Oil or Kerosene | 0 (0.0%) | 0 (0.0%) |
| Coal or Coke | 0 (0.0%) | 0 (0.0%) |
| All other Fuels | 39 (0.9%) | 0 (0.0%) |
| No Fuel Used | 0 (0.0%) | 12 (0.6%) |
| Total | 4,478 (100.0%) | 2,079 (100.0%) |
Household Vehicle Usage in Lake Mary
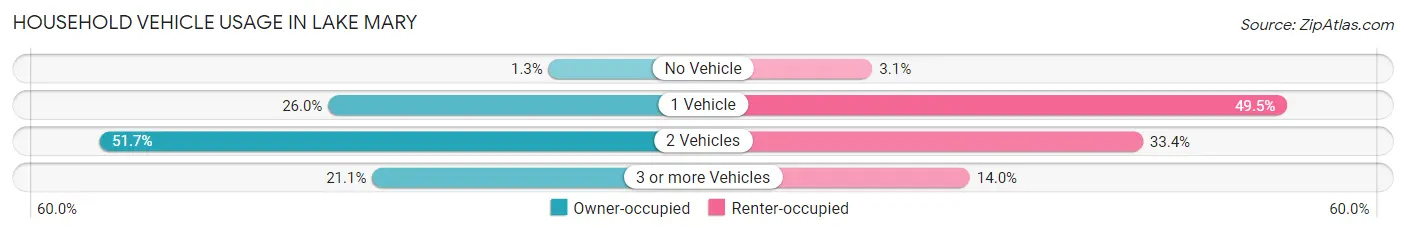
| Vehicles per Household | Owner-occupied | Renter-occupied |
| No Vehicle | 58 (1.3%) | 64 (3.1%) |
| 1 Vehicle | 1,164 (26.0%) | 1,030 (49.5%) |
| 2 Vehicles | 2,313 (51.6%) | 694 (33.4%) |
| 3 or more Vehicles | 943 (21.1%) | 291 (14.0%) |
| Total | 4,478 (100.0%) | 2,079 (100.0%) |
Real Estate & Mortgages in Lake Mary
Real Estate and Mortgage Overview in Lake Mary
| Characteristic | Without Mortgage | With Mortgage |
| Housing Units | 1,295 | 3,183 |
| Median Property Value | $398,700 | $406,000 |
| Median Household Income | $76,477 | $1,367 |
| Monthly Housing Costs | $628 | $468 |
| Real Estate Taxes | $2,679 | $69 |
Property Value by Mortgage Status in Lake Mary
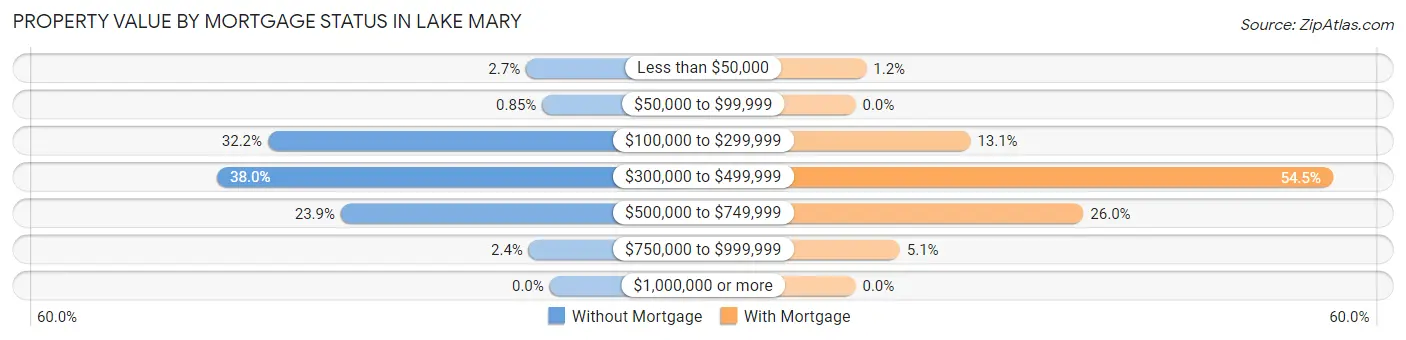
| Property Value | Without Mortgage | With Mortgage |
| Less than $50,000 | 35 (2.7%) | 39 (1.2%) |
| $50,000 to $99,999 | 11 (0.9%) | 0 (0.0%) |
| $100,000 to $299,999 | 417 (32.2%) | 418 (13.1%) |
| $300,000 to $499,999 | 492 (38.0%) | 1,736 (54.5%) |
| $500,000 to $749,999 | 309 (23.9%) | 829 (26.0%) |
| $750,000 to $999,999 | 31 (2.4%) | 161 (5.1%) |
| $1,000,000 or more | 0 (0.0%) | 0 (0.0%) |
| Total | 1,295 (100.0%) | 3,183 (100.0%) |
Household Income by Mortgage Status in Lake Mary
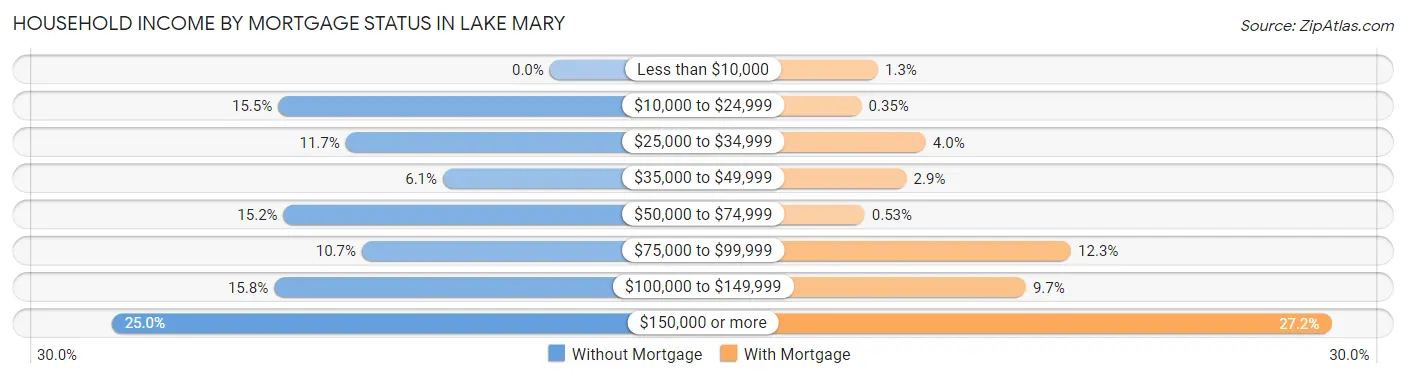
| Household Income | Without Mortgage | With Mortgage |
| Less than $10,000 | 0 (0.0%) | 41 (1.3%) |
| $10,000 to $24,999 | 201 (15.5%) | 11 (0.4%) |
| $25,000 to $34,999 | 151 (11.7%) | 128 (4.0%) |
| $35,000 to $49,999 | 79 (6.1%) | 93 (2.9%) |
| $50,000 to $74,999 | 197 (15.2%) | 17 (0.5%) |
| $75,000 to $99,999 | 139 (10.7%) | 392 (12.3%) |
| $100,000 to $149,999 | 204 (15.8%) | 310 (9.7%) |
| $150,000 or more | 324 (25.0%) | 865 (27.2%) |
| Total | 1,295 (100.0%) | 3,183 (100.0%) |
Property Value to Household Income Ratio in Lake Mary
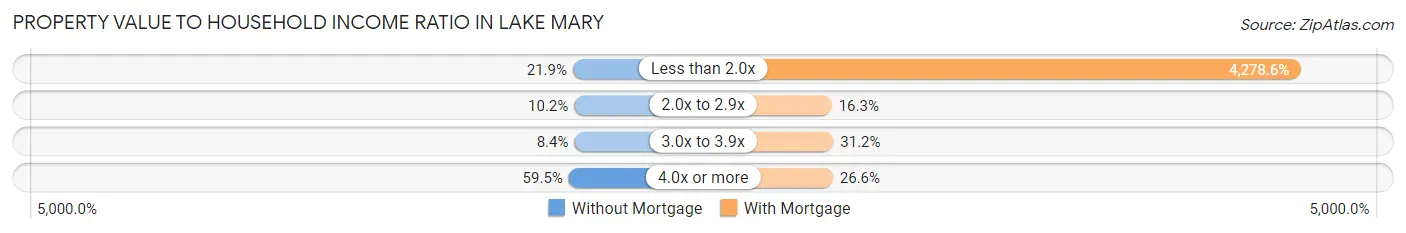
| Value-to-Income Ratio | Without Mortgage | With Mortgage |
| Less than 2.0x | 283 (21.8%) | 136,187 (4,278.6%) |
| 2.0x to 2.9x | 132 (10.2%) | 520 (16.3%) |
| 3.0x to 3.9x | 109 (8.4%) | 993 (31.2%) |
| 4.0x or more | 771 (59.5%) | 845 (26.6%) |
| Total | 1,295 (100.0%) | 3,183 (100.0%) |
Real Estate Taxes by Mortgage Status in Lake Mary
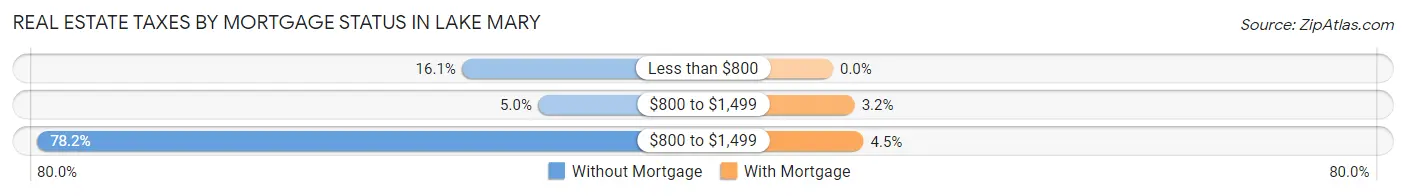
| Property Taxes | Without Mortgage | With Mortgage |
| Less than $800 | 209 (16.1%) | 0 (0.0%) |
| $800 to $1,499 | 65 (5.0%) | 101 (3.2%) |
| $800 to $1,499 | 1,012 (78.1%) | 142 (4.5%) |
| Total | 1,295 (100.0%) | 3,183 (100.0%) |
Health & Disability in Lake Mary
Health Insurance Coverage by Age in Lake Mary
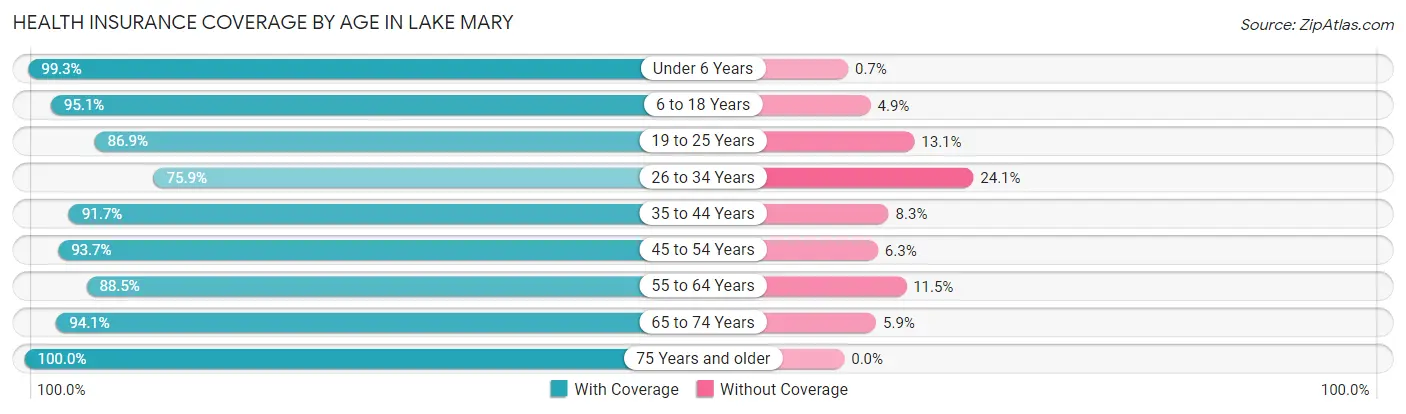
| Age Bracket | With Coverage | Without Coverage |
| Under 6 Years | 1,132 (99.3%) | 8 (0.7%) |
| 6 to 18 Years | 2,187 (95.1%) | 113 (4.9%) |
| 19 to 25 Years | 1,164 (86.9%) | 175 (13.1%) |
| 26 to 34 Years | 1,104 (75.9%) | 350 (24.1%) |
| 35 to 44 Years | 2,417 (91.7%) | 218 (8.3%) |
| 45 to 54 Years | 2,361 (93.7%) | 158 (6.3%) |
| 55 to 64 Years | 1,839 (88.5%) | 240 (11.5%) |
| 65 to 74 Years | 1,586 (94.1%) | 100 (5.9%) |
| 75 Years and older | 1,251 (100.0%) | 0 (0.0%) |
| Total | 15,041 (91.7%) | 1,362 (8.3%) |
Health Insurance Coverage by Citizenship Status in Lake Mary
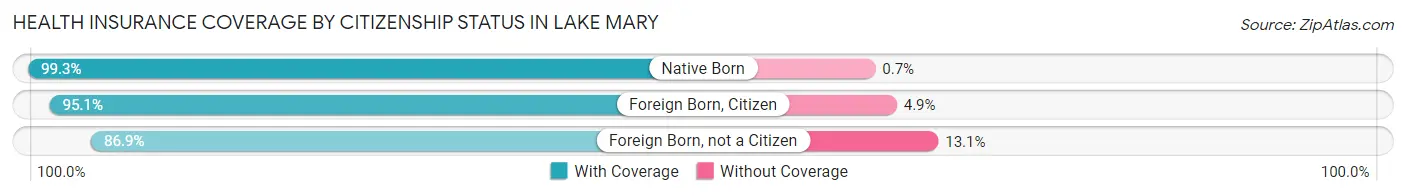
| Citizenship Status | With Coverage | Without Coverage |
| Native Born | 1,132 (99.3%) | 8 (0.7%) |
| Foreign Born, Citizen | 2,187 (95.1%) | 113 (4.9%) |
| Foreign Born, not a Citizen | 1,164 (86.9%) | 175 (13.1%) |
Health Insurance Coverage by Household Income in Lake Mary
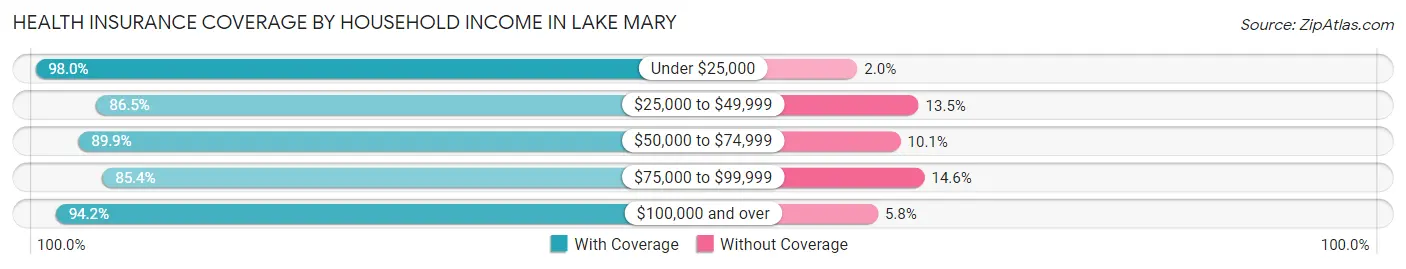
| Household Income | With Coverage | Without Coverage |
| Under $25,000 | 394 (98.0%) | 8 (2.0%) |
| $25,000 to $49,999 | 1,569 (86.5%) | 244 (13.5%) |
| $50,000 to $74,999 | 2,240 (89.9%) | 251 (10.1%) |
| $75,000 to $99,999 | 1,748 (85.4%) | 298 (14.6%) |
| $100,000 and over | 9,041 (94.2%) | 561 (5.8%) |
Public vs Private Health Insurance Coverage by Age in Lake Mary
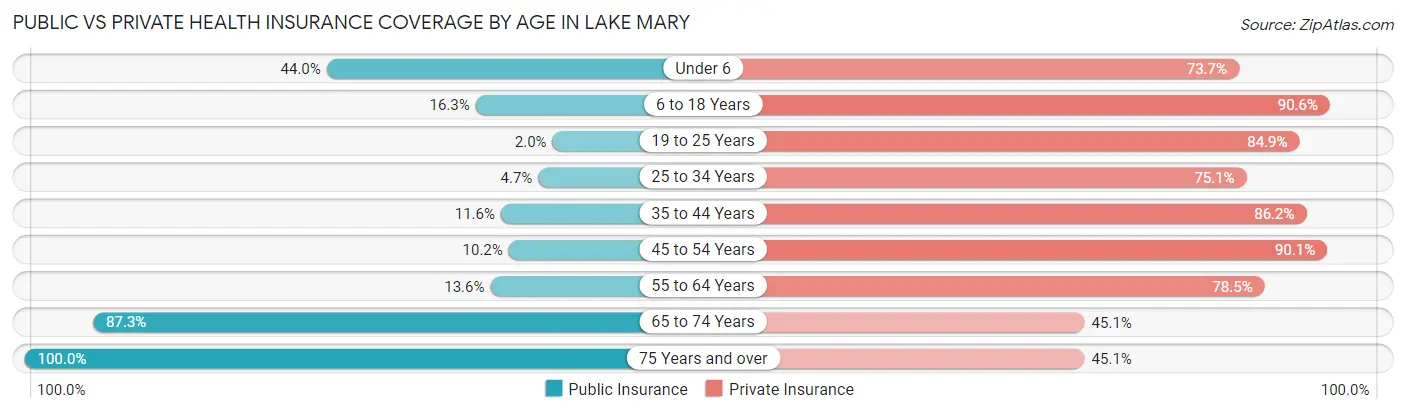
| Age Bracket | Public Insurance | Private Insurance |
| Under 6 | 501 (44.0%) | 840 (73.7%) |
| 6 to 18 Years | 375 (16.3%) | 2,083 (90.6%) |
| 19 to 25 Years | 27 (2.0%) | 1,137 (84.9%) |
| 25 to 34 Years | 68 (4.7%) | 1,092 (75.1%) |
| 35 to 44 Years | 306 (11.6%) | 2,272 (86.2%) |
| 45 to 54 Years | 256 (10.2%) | 2,269 (90.1%) |
| 55 to 64 Years | 282 (13.6%) | 1,631 (78.4%) |
| 65 to 74 Years | 1,472 (87.3%) | 760 (45.1%) |
| 75 Years and over | 1,251 (100.0%) | 564 (45.1%) |
| Total | 4,538 (27.7%) | 12,648 (77.1%) |
Disability Status by Sex by Age in Lake Mary
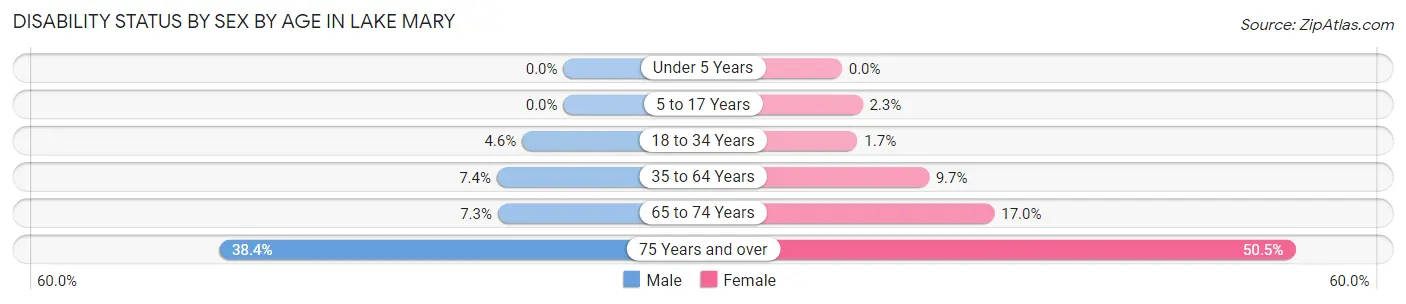
| Age Bracket | Male | Female |
| Under 5 Years | 0 (0.0%) | 0 (0.0%) |
| 5 to 17 Years | 0 (0.0%) | 30 (2.3%) |
| 18 to 34 Years | 68 (4.6%) | 25 (1.7%) |
| 35 to 64 Years | 223 (7.4%) | 409 (9.7%) |
| 65 to 74 Years | 50 (7.3%) | 170 (17.0%) |
| 75 Years and over | 242 (38.4%) | 313 (50.5%) |
Disability Class by Sex by Age in Lake Mary
Disability Class: Hearing Difficulty
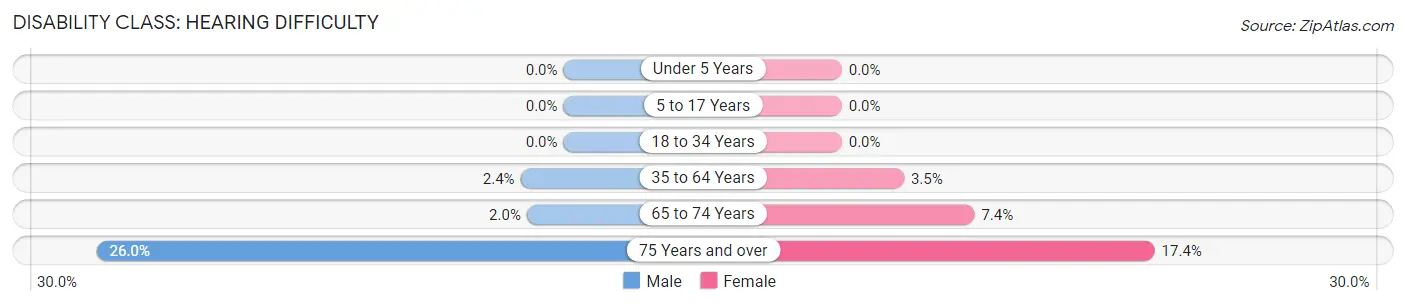
| Age Bracket | Male | Female |
| Under 5 Years | 0 (0.0%) | 0 (0.0%) |
| 5 to 17 Years | 0 (0.0%) | 0 (0.0%) |
| 18 to 34 Years | 0 (0.0%) | 0 (0.0%) |
| 35 to 64 Years | 72 (2.4%) | 146 (3.5%) |
| 65 to 74 Years | 14 (2.0%) | 74 (7.4%) |
| 75 Years and over | 164 (26.0%) | 108 (17.4%) |
Disability Class: Vision Difficulty
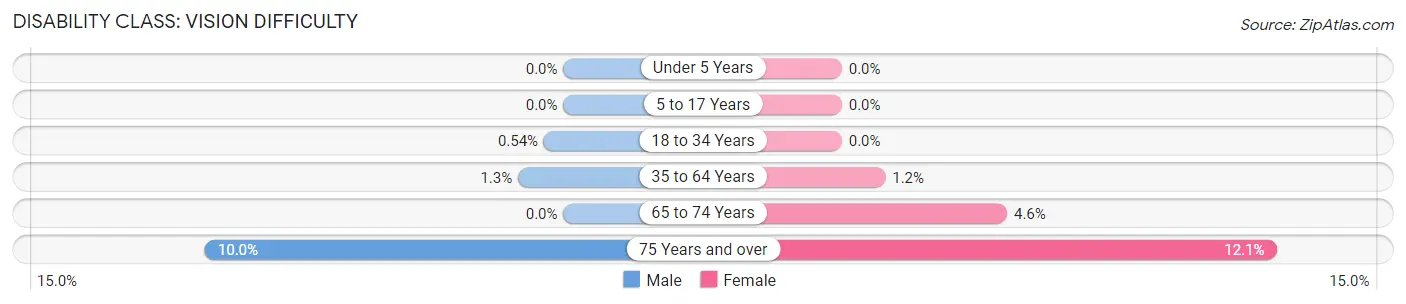
| Age Bracket | Male | Female |
| Under 5 Years | 0 (0.0%) | 0 (0.0%) |
| 5 to 17 Years | 0 (0.0%) | 0 (0.0%) |
| 18 to 34 Years | 8 (0.5%) | 0 (0.0%) |
| 35 to 64 Years | 38 (1.3%) | 51 (1.2%) |
| 65 to 74 Years | 0 (0.0%) | 46 (4.6%) |
| 75 Years and over | 63 (10.0%) | 75 (12.1%) |
Disability Class: Cognitive Difficulty
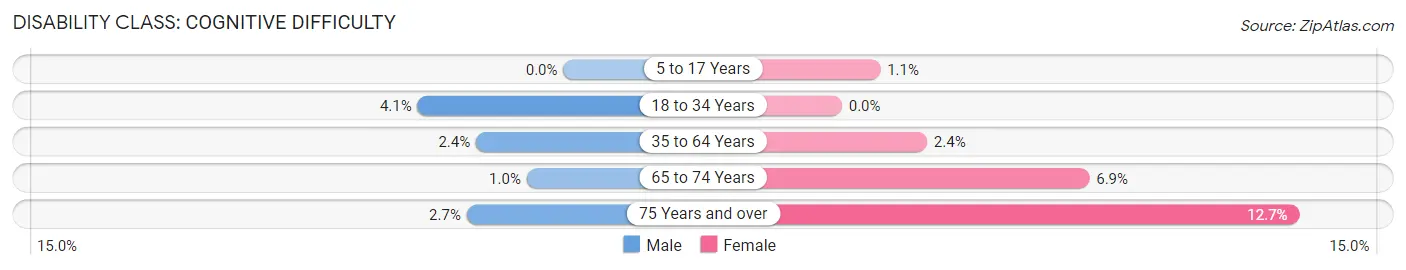
| Age Bracket | Male | Female |
| 5 to 17 Years | 0 (0.0%) | 14 (1.1%) |
| 18 to 34 Years | 60 (4.1%) | 0 (0.0%) |
| 35 to 64 Years | 73 (2.4%) | 100 (2.4%) |
| 65 to 74 Years | 7 (1.0%) | 69 (6.9%) |
| 75 Years and over | 17 (2.7%) | 79 (12.7%) |
Disability Class: Ambulatory Difficulty
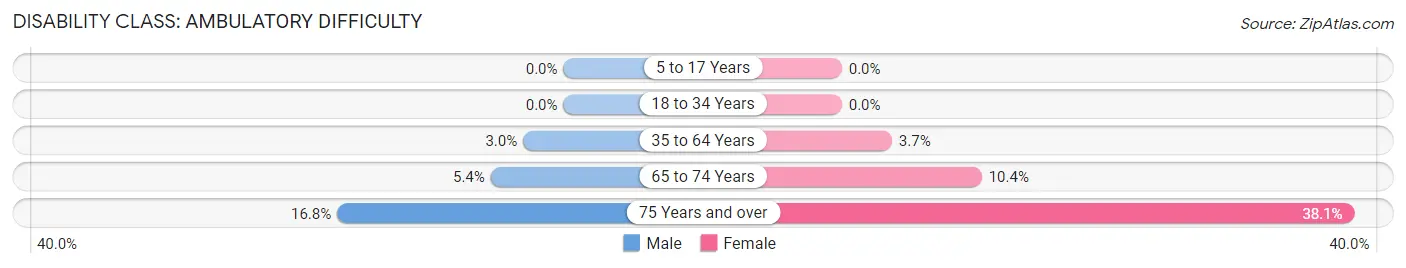
| Age Bracket | Male | Female |
| 5 to 17 Years | 0 (0.0%) | 0 (0.0%) |
| 18 to 34 Years | 0 (0.0%) | 0 (0.0%) |
| 35 to 64 Years | 90 (3.0%) | 157 (3.7%) |
| 65 to 74 Years | 37 (5.4%) | 104 (10.4%) |
| 75 Years and over | 106 (16.8%) | 236 (38.1%) |
Disability Class: Self-Care Difficulty
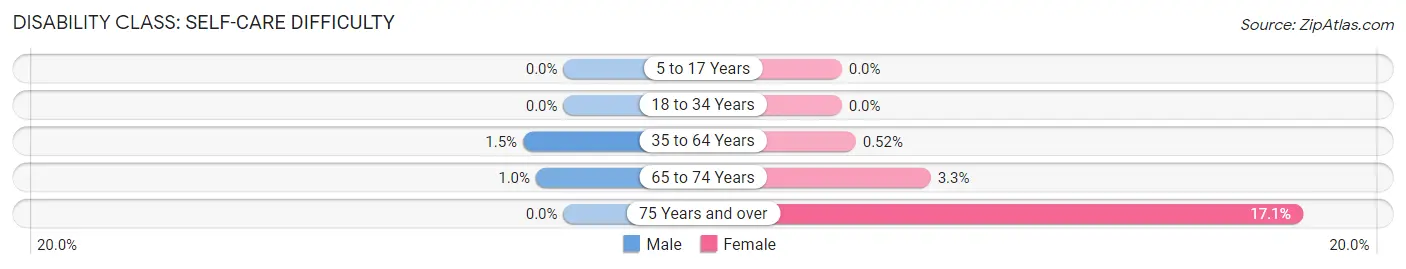
| Age Bracket | Male | Female |
| 5 to 17 Years | 0 (0.0%) | 0 (0.0%) |
| 18 to 34 Years | 0 (0.0%) | 0 (0.0%) |
| 35 to 64 Years | 45 (1.5%) | 22 (0.5%) |
| 65 to 74 Years | 7 (1.0%) | 33 (3.3%) |
| 75 Years and over | 0 (0.0%) | 106 (17.1%) |
Technology Access in Lake Mary
Computing Device Access in Lake Mary
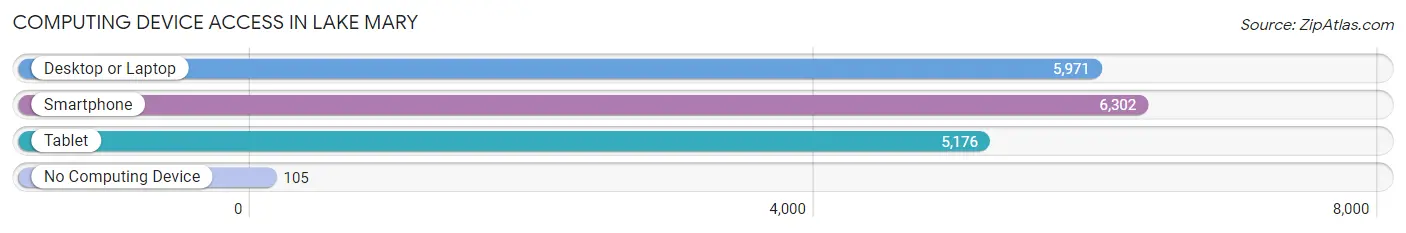
| Device Type | # Households | % Households |
| Desktop or Laptop | 5,971 | 91.1% |
| Smartphone | 6,302 | 96.1% |
| Tablet | 5,176 | 78.9% |
| No Computing Device | 105 | 1.6% |
| Total | 6,557 | 100.0% |
Internet Access in Lake Mary
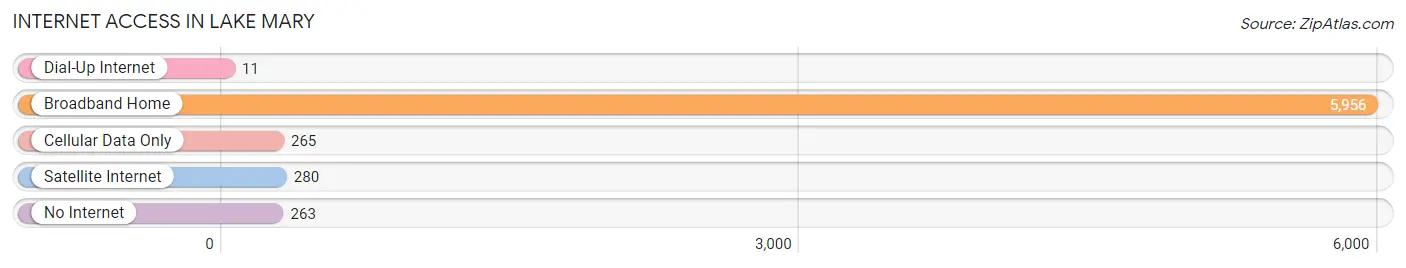
| Internet Type | # Households | % Households |
| Dial-Up Internet | 11 | 0.2% |
| Broadband Home | 5,956 | 90.8% |
| Cellular Data Only | 265 | 4.0% |
| Satellite Internet | 280 | 4.3% |
| No Internet | 263 | 4.0% |
| Total | 6,557 | 100.0% |
Lake Mary Summary
History
Lake Mary is a city located in Seminole County, Florida. It is part of the Orlando–Kissimmee–Sanford Metropolitan Statistical Area. The city was founded in 1873 by William Henry Stevens, who named it after his wife, Mary. The city was incorporated in 1973 and has grown rapidly since then.
The area was originally inhabited by the Timucua Indians, who were later displaced by the Seminole Indians. The first settlers in the area were cattle ranchers, who were attracted to the area by the abundance of natural resources. The first post office was established in 1877 and the first school was built in 1881.
The city experienced a period of growth in the early 1900s, when the railroad was extended to the area. This allowed for the development of the citrus industry, which was the main source of income for the area. The city also became a popular tourist destination, with the opening of the Lake Mary Hotel in 1912.
The city experienced a period of decline in the mid-1900s, as the citrus industry declined and the population decreased. However, the city experienced a resurgence in the late 1980s, when the population began to grow again. The city has since become a popular suburb of Orlando, with many businesses and residential developments.
Geography
Lake Mary is located in central Florida, approximately 20 miles north of Orlando. The city is situated on the northern shore of Lake Mary, a natural freshwater lake. The city is bordered by Sanford to the north, Longwood to the east, and Altamonte Springs to the south.
The city has a total area of 8.3 square miles, of which 8.2 square miles is land and 0.1 square miles is water. The terrain is mostly flat, with some rolling hills. The city is located in a humid subtropical climate zone, with hot, humid summers and mild winters.
Economy
The economy of Lake Mary is largely based on tourism and retail. The city is home to several large retail stores, including Walmart, Target, and Best Buy. The city is also home to several corporate headquarters, including Darden Restaurants, Inc., and AAA Auto Club South.
The city is also home to several technology companies, including Verizon Wireless, AT&T, and Microsoft. The city is also home to several medical centers, including Florida Hospital and Central Florida Regional Hospital.
Demographics
As of the 2010 census, the population of Lake Mary was 13,822. The racial makeup of the city was 79.2% White, 8.3% African American, 0.3% Native American, 5.2% Asian, 0.1% Pacific Islander, 4.2% from other races, and 2.8% from two or more races. Hispanic or Latino of any race were 11.3% of the population.
The median income for a household in the city was $60,945, and the median income for a family was $71,945. The per capita income for the city was $30,945. About 5.2% of families and 7.2% of the population were below the poverty line, including 8.2% of those under age 18 and 5.2% of those age 65 or over.
Common Questions
What is Per Capita Income in Lake Mary?
Per Capita income in Lake Mary is $54,399.
What is the Median Family Income in Lake Mary?
Median Family Income in Lake Mary is $130,094.
What is the Median Household income in Lake Mary?
Median Household Income in Lake Mary is $106,971.
What is Income or Wage Gap in Lake Mary?
Income or Wage Gap in Lake Mary is 36.9%.
Women in Lake Mary earn 63.1 cents for every dollar earned by a man.
What is Inequality or Gini Index in Lake Mary?
Inequality or Gini Index in Lake Mary is 0.42.
What is the Total Population of Lake Mary?
Total Population of Lake Mary is 16,636.
What is the Total Male Population of Lake Mary?
Total Male Population of Lake Mary is 7,348.
What is the Total Female Population of Lake Mary?
Total Female Population of Lake Mary is 9,288.
What is the Ratio of Males per 100 Females in Lake Mary?
There are 79.11 Males per 100 Females in Lake Mary.
What is the Ratio of Females per 100 Males in Lake Mary?
There are 126.40 Females per 100 Males in Lake Mary.
What is the Median Population Age in Lake Mary?
Median Population Age in Lake Mary is 41.9 Years.
What is the Average Family Size in Lake Mary
Average Family Size in Lake Mary is 2.9 People.
What is the Average Household Size in Lake Mary
Average Household Size in Lake Mary is 2.5 People.
How Large is the Labor Force in Lake Mary?
There are 9,173 People in the Labor Forcein in Lake Mary.
What is the Percentage of People in the Labor Force in Lake Mary?
66.4% of People are in the Labor Force in Lake Mary.
What is the Unemployment Rate in Lake Mary?
Unemployment Rate in Lake Mary is 1.7%.