Cumberland, IN Map & Demographics
Cumberland Map
Cumberland Overview
$43,766
PER CAPITA INCOME
$117,167
AVG FAMILY INCOME
$83,718
AVG HOUSEHOLD INCOME
15.5%
WAGE / INCOME GAP [ % ]
84.5¢/ $1
WAGE / INCOME GAP [ $ ]
0.36
INEQUALITY / GINI INDEX
5,991
TOTAL POPULATION
3,008
MALE POPULATION
2,983
FEMALE POPULATION
100.84
MALES / 100 FEMALES
99.17
FEMALES / 100 MALES
34.9
MEDIAN AGE
3.1
AVG FAMILY SIZE
2.4
AVG HOUSEHOLD SIZE
3,711
LABOR FORCE [ PEOPLE ]
78.1%
PERCENT IN LABOR FORCE
3.1%
UNEMPLOYMENT RATE
Cumberland Area Codes
Income in Cumberland
Income Overview in Cumberland
Per Capita Income in Cumberland is $43,766, while median incomes of families and households are $117,167 and $83,718 respectively.
| Characteristic | Number | Measure |
| Per Capita Income | 5,991 | $43,766 |
| Median Family Income | 1,514 | $117,167 |
| Mean Family Income | 1,514 | $129,102 |
| Median Household Income | 2,498 | $83,718 |
| Mean Household Income | 2,498 | $102,137 |
| Income Deficit | 1,514 | $0 |
| Wage / Income Gap (%) | 5,991 | 15.48% |
| Wage / Income Gap ($) | 5,991 | 84.52¢ per $1 |
| Gini / Inequality Index | 5,991 | 0.36 |
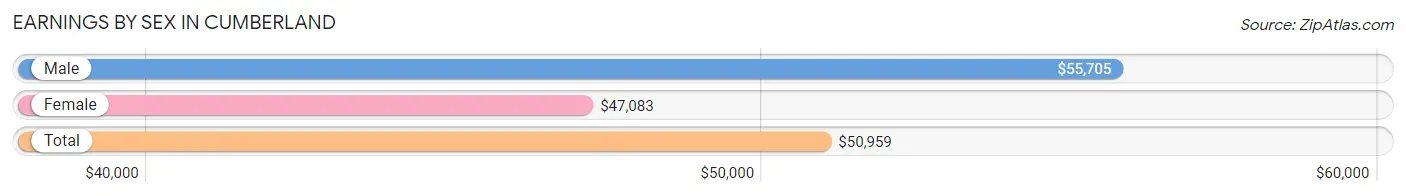
Earnings by Sex in Cumberland
Average Earnings in Cumberland are $50,959, $55,705 for men and $47,083 for women, a difference of 15.5%.
| Sex | Number | Average Earnings |
| Male | 1,874 (49.1%) | $55,705 |
| Female | 1,939 (50.8%) | $47,083 |
| Total | 3,813 (100.0%) | $50,959 |
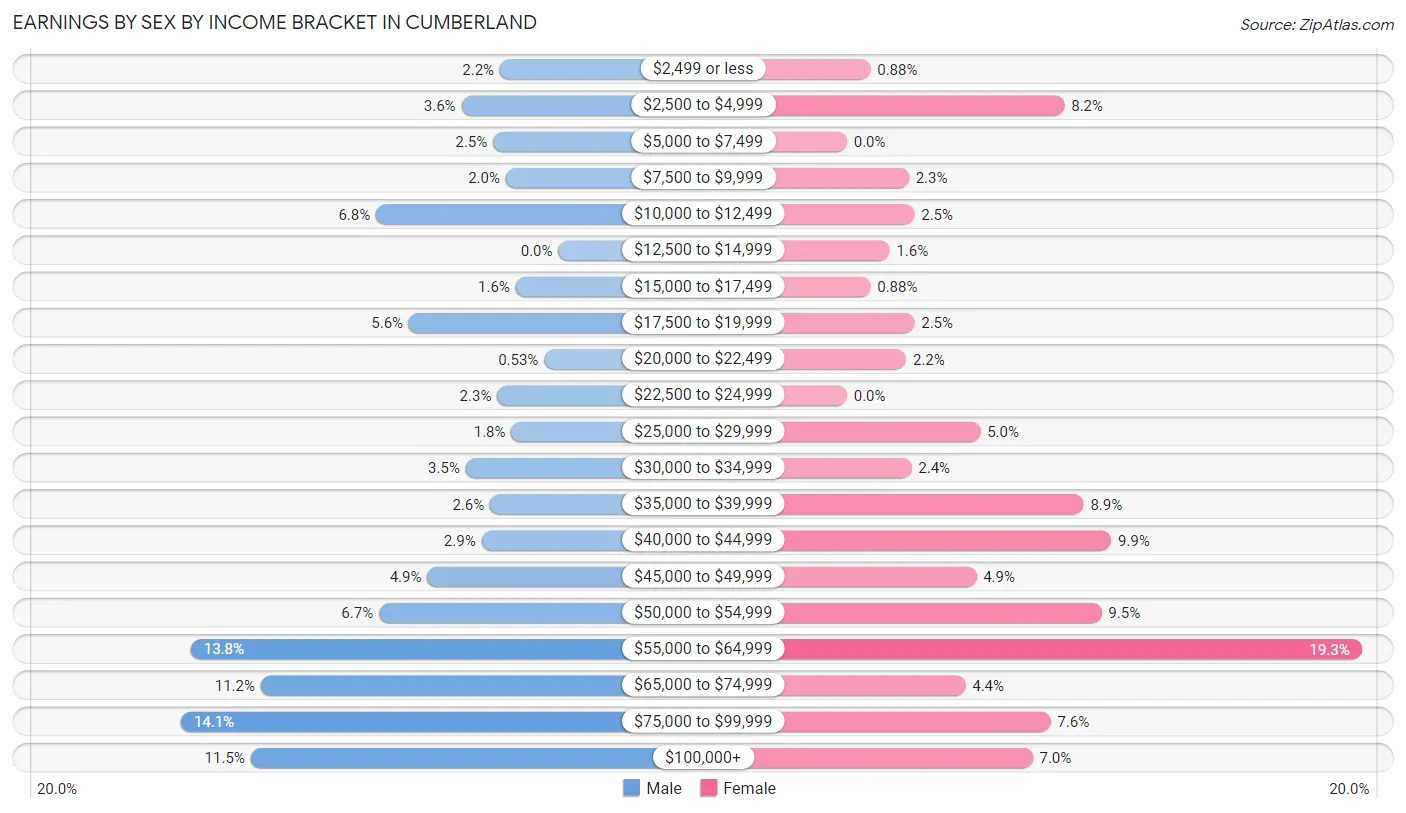
Earnings by Sex by Income Bracket in Cumberland
The most common earnings brackets in Cumberland are $75,000 to $99,999 for men (265 | 14.1%) and $55,000 to $64,999 for women (374 | 19.3%).
| Income | Male | Female |
| $2,499 or less | 41 (2.2%) | 17 (0.9%) |
| $2,500 to $4,999 | 68 (3.6%) | 158 (8.2%) |
| $5,000 to $7,499 | 46 (2.5%) | 0 (0.0%) |
| $7,500 to $9,999 | 37 (2.0%) | 45 (2.3%) |
| $10,000 to $12,499 | 128 (6.8%) | 49 (2.5%) |
| $12,500 to $14,999 | 0 (0.0%) | 31 (1.6%) |
| $15,000 to $17,499 | 30 (1.6%) | 17 (0.9%) |
| $17,500 to $19,999 | 105 (5.6%) | 49 (2.5%) |
| $20,000 to $22,499 | 10 (0.5%) | 43 (2.2%) |
| $22,500 to $24,999 | 43 (2.3%) | 0 (0.0%) |
| $25,000 to $29,999 | 33 (1.8%) | 97 (5.0%) |
| $30,000 to $34,999 | 65 (3.5%) | 47 (2.4%) |
| $35,000 to $39,999 | 48 (2.6%) | 172 (8.9%) |
| $40,000 to $44,999 | 54 (2.9%) | 192 (9.9%) |
| $45,000 to $49,999 | 92 (4.9%) | 94 (4.9%) |
| $50,000 to $54,999 | 126 (6.7%) | 185 (9.5%) |
| $55,000 to $64,999 | 258 (13.8%) | 374 (19.3%) |
| $65,000 to $74,999 | 209 (11.2%) | 86 (4.4%) |
| $75,000 to $99,999 | 265 (14.1%) | 148 (7.6%) |
| $100,000+ | 216 (11.5%) | 135 (7.0%) |
| Total | 1,874 (100.0%) | 1,939 (100.0%) |
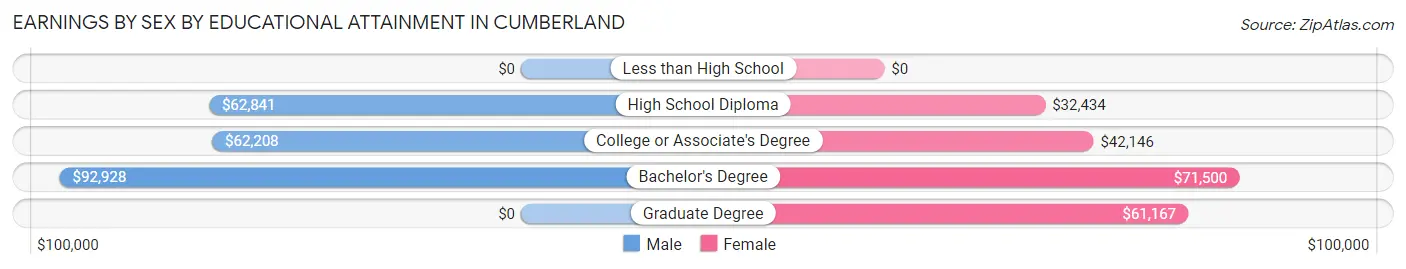
Earnings by Sex by Educational Attainment in Cumberland
Average earnings in Cumberland are $62,945 for men and $50,322 for women, a difference of 20.1%. Men with an educational attainment of bachelor's degree enjoy the highest average annual earnings of $92,928, while those with college or associate's degree education earn the least with $62,208. Women with an educational attainment of bachelor's degree earn the most with the average annual earnings of $71,500, while those with high school diploma education have the smallest earnings of $32,434.
| Educational Attainment | Male Income | Female Income |
| Less than High School | - | - |
| High School Diploma | $62,841 | $32,434 |
| College or Associate's Degree | $62,208 | $42,146 |
| Bachelor's Degree | $92,928 | $71,500 |
| Graduate Degree | - | - |
| Total | $62,945 | $50,322 |
Family Income in Cumberland
Family Income Brackets in Cumberland
According to the Cumberland family income data, there are 463 families falling into the $100,000 to $149,999 income range, which is the most common income bracket and makes up 30.6% of all families.
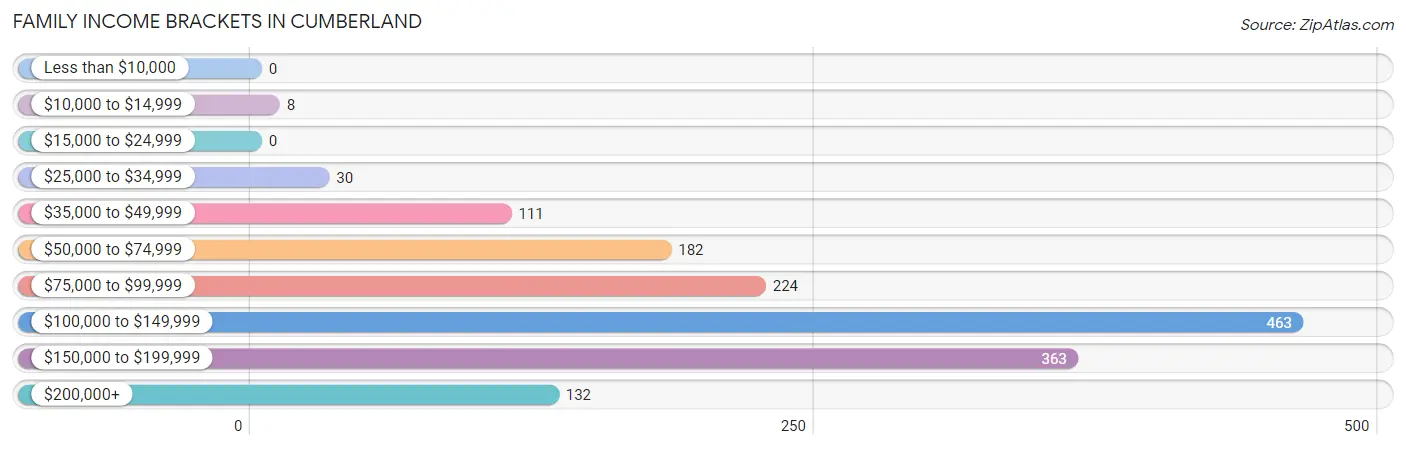
| Income Bracket | # Families | % Families |
| Less than $10,000 | 0 | 0.0% |
| $10,000 to $14,999 | 8 | 0.5% |
| $15,000 to $24,999 | 0 | 0.0% |
| $25,000 to $34,999 | 30 | 2.0% |
| $35,000 to $49,999 | 111 | 7.3% |
| $50,000 to $74,999 | 182 | 12.0% |
| $75,000 to $99,999 | 224 | 14.8% |
| $100,000 to $149,999 | 463 | 30.6% |
| $150,000 to $199,999 | 363 | 24.0% |
| $200,000+ | 132 | 8.7% |
Family Income by Famaliy Size in Cumberland
4-person families (304 | 20.1%) account for the highest median family income in Cumberland with $150,648 per family, while 2-person families (714 | 47.2%) have the highest median income of $56,538 per family member.
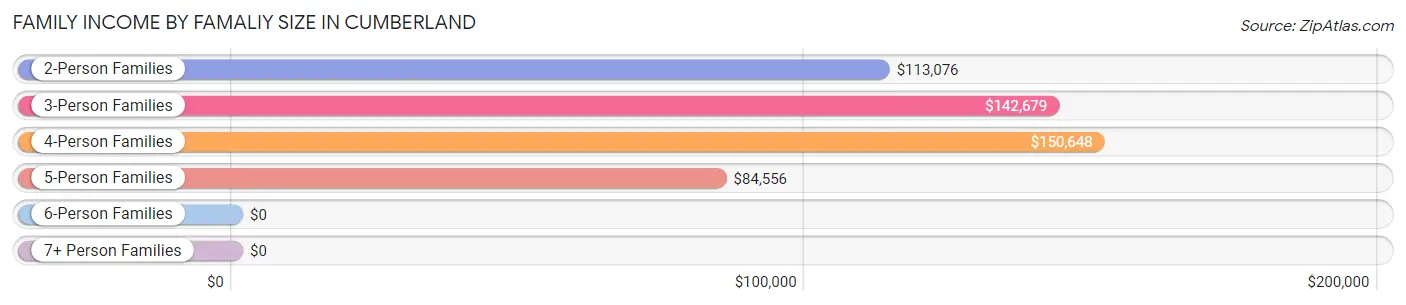
| Income Bracket | # Families | Median Income |
| 2-Person Families | 714 (47.2%) | $113,076 |
| 3-Person Families | 403 (26.6%) | $142,679 |
| 4-Person Families | 304 (20.1%) | $150,648 |
| 5-Person Families | 89 (5.9%) | $84,556 |
| 6-Person Families | 4 (0.3%) | $0 |
| 7+ Person Families | 0 (0.0%) | $0 |
| Total | 1,514 (100.0%) | $117,167 |
Family Income by Number of Earners in Cumberland
The median family income in Cumberland is $117,167, with families comprising 3+ earners (235) having the highest median family income of $152,476, while families with 1 earner (255) have the lowest median family income of $56,875, accounting for 15.5% and 16.8% of families, respectively.
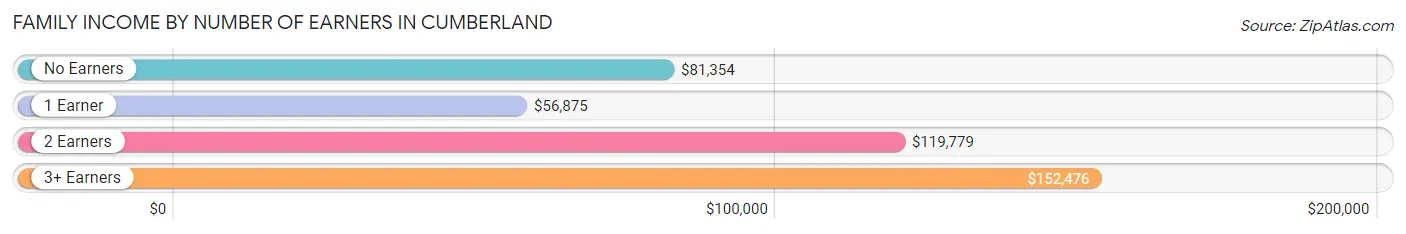
| Number of Earners | # Families | Median Income |
| No Earners | 185 (12.2%) | $81,354 |
| 1 Earner | 255 (16.8%) | $56,875 |
| 2 Earners | 839 (55.4%) | $119,779 |
| 3+ Earners | 235 (15.5%) | $152,476 |
| Total | 1,514 (100.0%) | $117,167 |
Household Income in Cumberland
Household Income Brackets in Cumberland
With 567 households falling in the category, the $100,000 to $149,999 income range is the most frequent in Cumberland, accounting for 22.7% of all households. In contrast, only 17 households (0.7%) fall into the $10,000 to $14,999 income bracket, making it the least populous group.
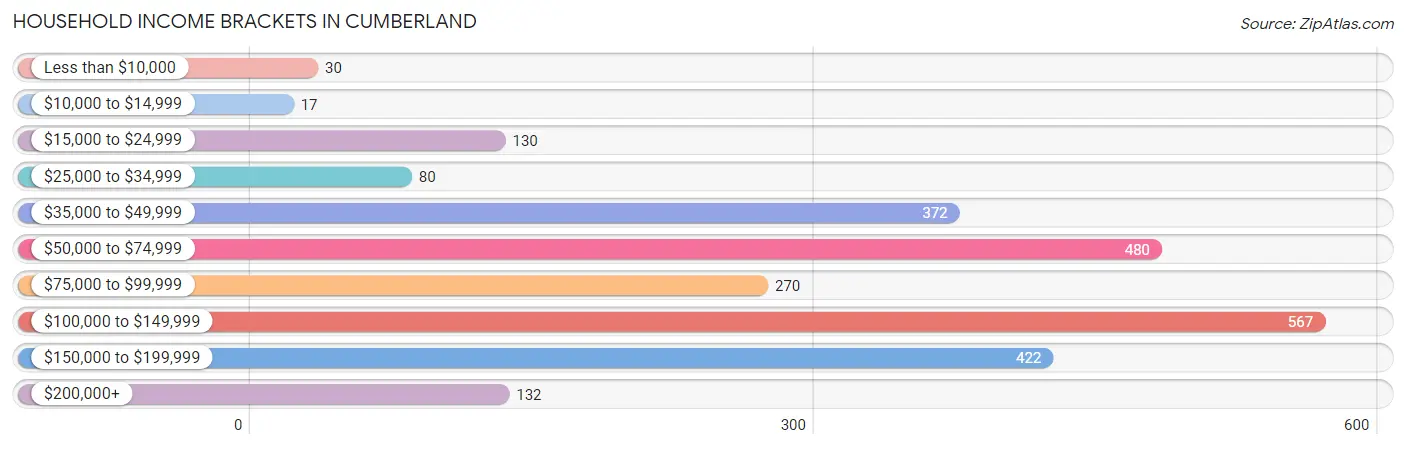
| Income Bracket | # Households | % Households |
| Less than $10,000 | 30 | 1.2% |
| $10,000 to $14,999 | 17 | 0.7% |
| $15,000 to $24,999 | 130 | 5.2% |
| $25,000 to $34,999 | 80 | 3.2% |
| $35,000 to $49,999 | 372 | 14.9% |
| $50,000 to $74,999 | 480 | 19.2% |
| $75,000 to $99,999 | 270 | 10.8% |
| $100,000 to $149,999 | 567 | 22.7% |
| $150,000 to $199,999 | 422 | 16.9% |
| $200,000+ | 132 | 5.3% |
Household Income by Householder Age in Cumberland
The median household income in Cumberland is $83,718, with the highest median household income of $113,394 found in the 45 to 64 years age bracket for the primary householder. A total of 925 households (37.0%) fall into this category. Meanwhile, the 15 to 24 years age bracket for the primary householder has the lowest median household income of $0, with 31 households (1.2%) in this group.
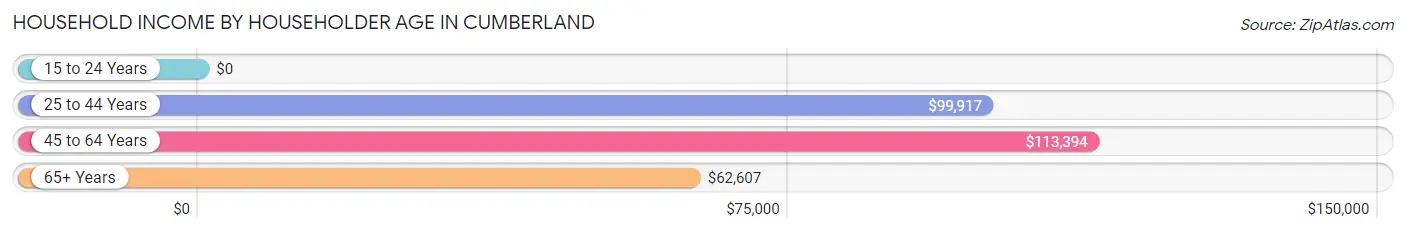
| Income Bracket | # Households | Median Income |
| 15 to 24 Years | 31 (1.2%) | $0 |
| 25 to 44 Years | 1,003 (40.2%) | $99,917 |
| 45 to 64 Years | 925 (37.0%) | $113,394 |
| 65+ Years | 539 (21.6%) | $62,607 |
| Total | 2,498 (100.0%) | $83,718 |
Poverty in Cumberland
Income Below Poverty by Sex and Age in Cumberland
With 4.8% poverty level for males and 2.8% for females among the residents of Cumberland, 25 to 34 year old males and 75 year old and over females are the most vulnerable to poverty, with 100 males (26.2%) and 15 females (17.4%) in their respective age groups living below the poverty level.
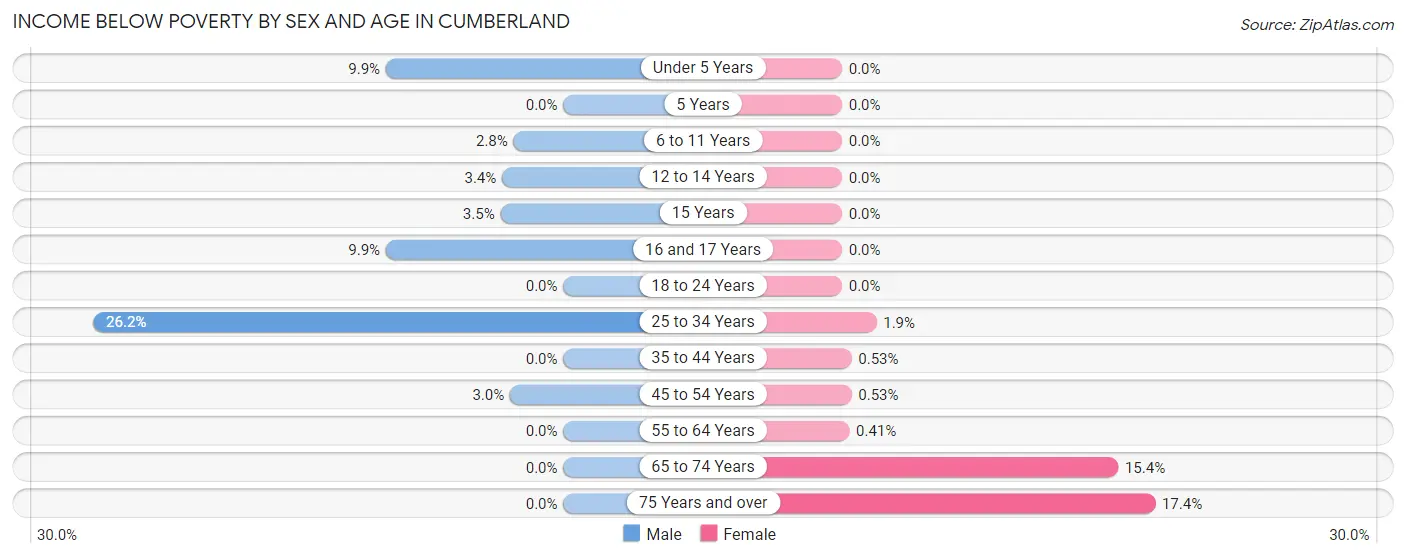
| Age Bracket | Male | Female |
| Under 5 Years | 8 (9.9%) | 0 (0.0%) |
| 5 Years | 0 (0.0%) | 0 (0.0%) |
| 6 to 11 Years | 7 (2.8%) | 0 (0.0%) |
| 12 to 14 Years | 7 (3.4%) | 0 (0.0%) |
| 15 Years | 5 (3.5%) | 0 (0.0%) |
| 16 and 17 Years | 8 (9.9%) | 0 (0.0%) |
| 18 to 24 Years | 0 (0.0%) | 0 (0.0%) |
| 25 to 34 Years | 100 (26.2%) | 17 (1.9%) |
| 35 to 44 Years | 0 (0.0%) | 2 (0.5%) |
| 45 to 54 Years | 9 (3.0%) | 2 (0.5%) |
| 55 to 64 Years | 0 (0.0%) | 1 (0.4%) |
| 65 to 74 Years | 0 (0.0%) | 46 (15.4%) |
| 75 Years and over | 0 (0.0%) | 15 (17.4%) |
| Total | 144 (4.8%) | 83 (2.8%) |
Income Above Poverty by Sex and Age in Cumberland
According to the poverty statistics in Cumberland, males aged 5 years and females aged under 5 years are the age groups that are most secure financially, with 100.0% of males and 100.0% of females in these age groups living above the poverty line.
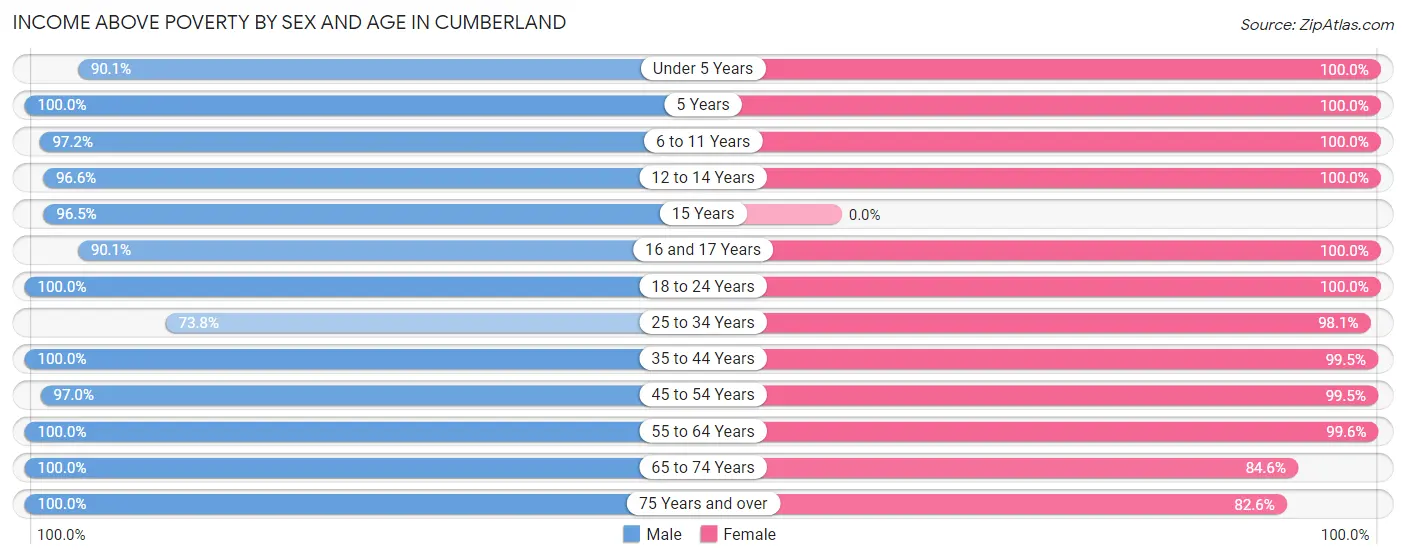
| Age Bracket | Male | Female |
| Under 5 Years | 73 (90.1%) | 29 (100.0%) |
| 5 Years | 25 (100.0%) | 58 (100.0%) |
| 6 to 11 Years | 246 (97.2%) | 304 (100.0%) |
| 12 to 14 Years | 198 (96.6%) | 132 (100.0%) |
| 15 Years | 138 (96.5%) | 0 (0.0%) |
| 16 and 17 Years | 73 (90.1%) | 109 (100.0%) |
| 18 to 24 Years | 226 (100.0%) | 77 (100.0%) |
| 25 to 34 Years | 282 (73.8%) | 868 (98.1%) |
| 35 to 44 Years | 502 (100.0%) | 374 (99.5%) |
| 45 to 54 Years | 294 (97.0%) | 374 (99.5%) |
| 55 to 64 Years | 431 (100.0%) | 241 (99.6%) |
| 65 to 74 Years | 174 (100.0%) | 253 (84.6%) |
| 75 Years and over | 202 (100.0%) | 71 (82.6%) |
| Total | 2,864 (95.2%) | 2,890 (97.2%) |
Income Below Poverty Among Married-Couple Families in Cumberland
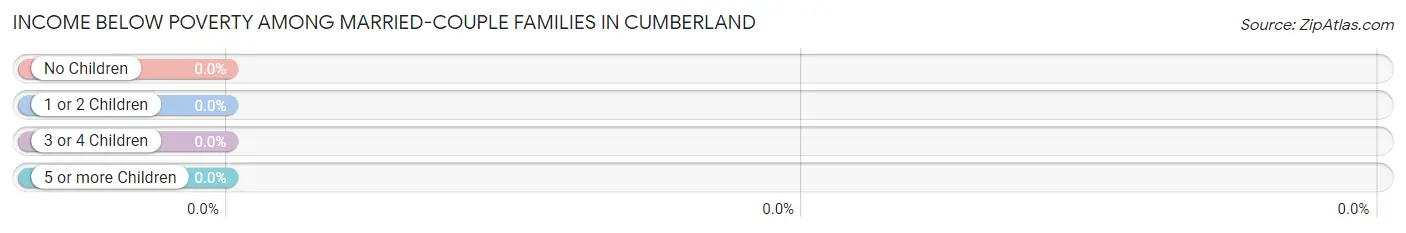
| Children | Above Poverty | Below Poverty |
| No Children | 601 (100.0%) | 0 (0.0%) |
| 1 or 2 Children | 395 (100.0%) | 0 (0.0%) |
| 3 or 4 Children | 60 (100.0%) | 0 (0.0%) |
| 5 or more Children | 0 (0.0%) | 0 (0.0%) |
| Total | 1,056 (100.0%) | 0 (0.0%) |
Income Below Poverty Among Single-Parent Households in Cumberland
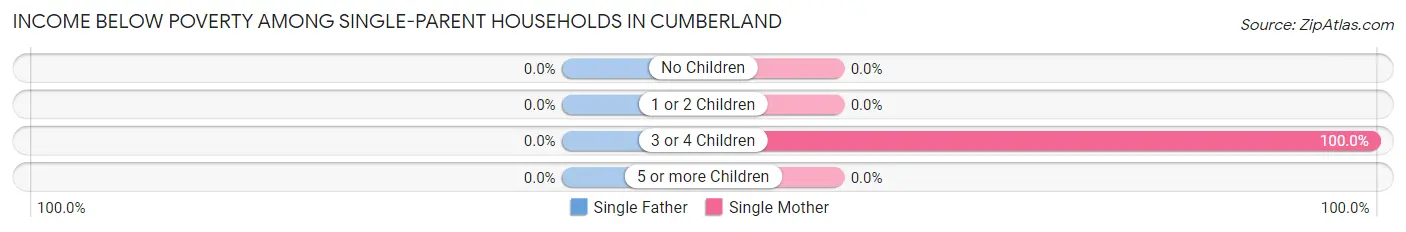
| Children | Single Father | Single Mother |
| No Children | 0 (0.0%) | 0 (0.0%) |
| 1 or 2 Children | 0 (0.0%) | 0 (0.0%) |
| 3 or 4 Children | 0 (0.0%) | 7 (100.0%) |
| 5 or more Children | 0 (0.0%) | 0 (0.0%) |
| Total | 0 (0.0%) | 7 (2.2%) |
Income Below Poverty Among Married-Couple vs Single-Parent Households in Cumberland
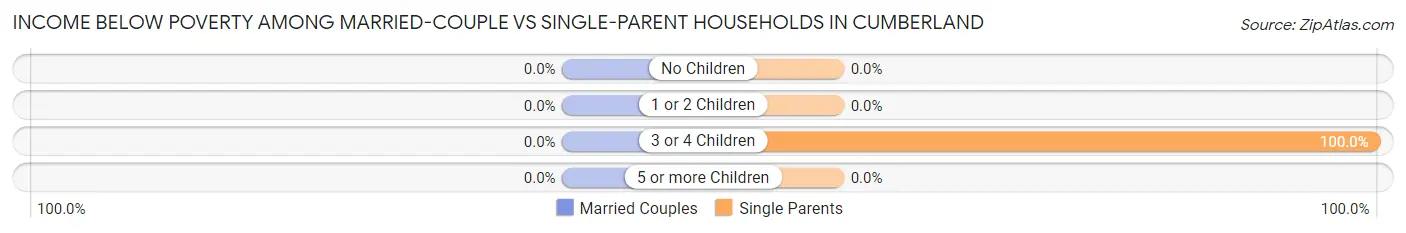
| Children | Married-Couple Families | Single-Parent Households |
| No Children | 0 (0.0%) | 0 (0.0%) |
| 1 or 2 Children | 0 (0.0%) | 0 (0.0%) |
| 3 or 4 Children | 0 (0.0%) | 7 (100.0%) |
| 5 or more Children | 0 (0.0%) | 0 (0.0%) |
| Total | 0 (0.0%) | 7 (1.5%) |
Race in Cumberland
The most populous races in Cumberland are White / Caucasian (4,770 | 79.6%), Black / African American (718 | 12.0%), and Hispanic or Latino (418 | 7.0%).
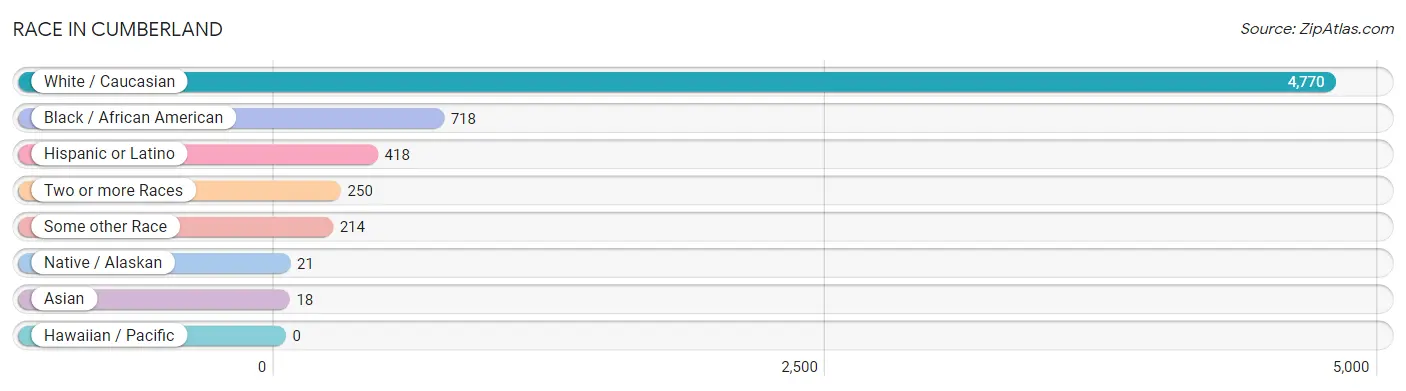
| Race | # Population | % Population |
| Asian | 18 | 0.3% |
| Black / African American | 718 | 12.0% |
| Hawaiian / Pacific | 0 | 0.0% |
| Hispanic or Latino | 418 | 7.0% |
| Native / Alaskan | 21 | 0.4% |
| White / Caucasian | 4,770 | 79.6% |
| Two or more Races | 250 | 4.2% |
| Some other Race | 214 | 3.6% |
| Total | 5,991 | 100.0% |
Ancestry in Cumberland
The most populous ancestries reported in Cumberland are German (1,667 | 27.8%), Irish (842 | 14.1%), English (554 | 9.2%), American (244 | 4.1%), and Mexican (209 | 3.5%), together accounting for 58.7% of all Cumberland residents.
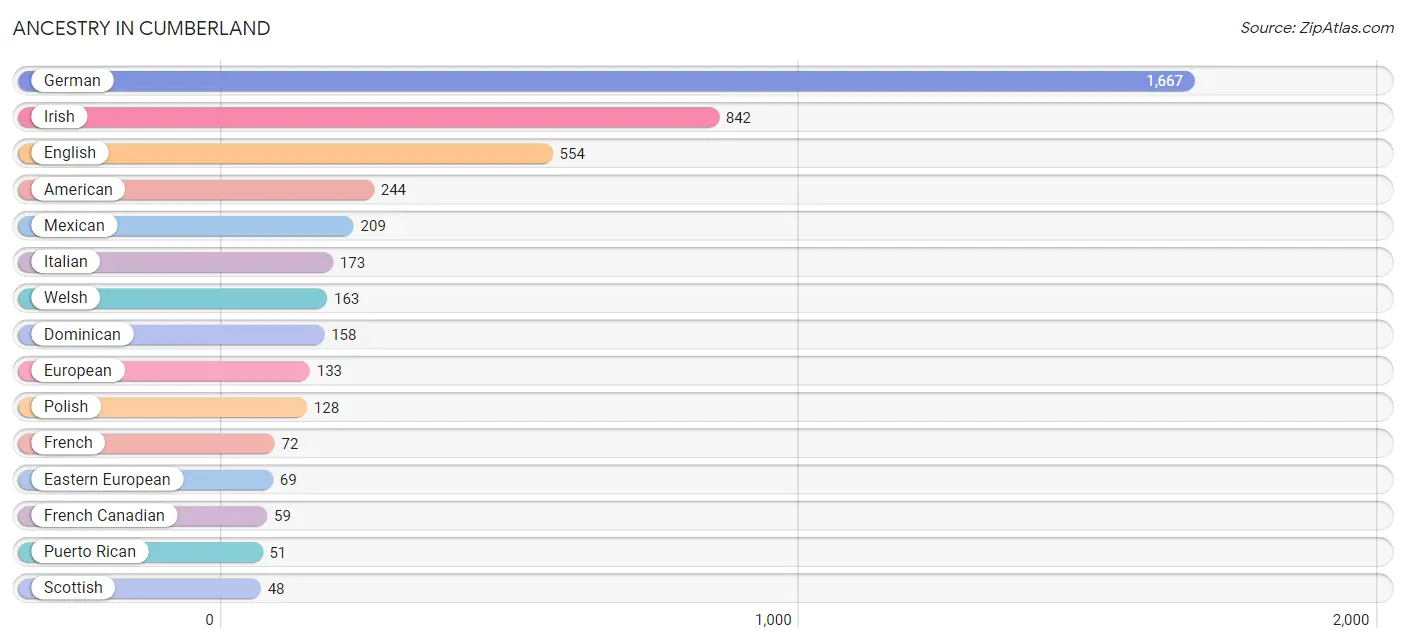
| Ancestry | # Population | % Population |
| American | 244 | 4.1% |
| Bhutanese | 21 | 0.4% |
| Celtic | 41 | 0.7% |
| Chippewa | 15 | 0.3% |
| Czechoslovakian | 20 | 0.3% |
| Danish | 30 | 0.5% |
| Dominican | 158 | 2.6% |
| Eastern European | 69 | 1.1% |
| English | 554 | 9.2% |
| European | 133 | 2.2% |
| French | 72 | 1.2% |
| French Canadian | 59 | 1.0% |
| German | 1,667 | 27.8% |
| Greek | 41 | 0.7% |
| Hungarian | 6 | 0.1% |
| Irish | 842 | 14.1% |
| Italian | 173 | 2.9% |
| Korean | 38 | 0.6% |
| Laotian | 1 | 0.0% |
| Mexican | 209 | 3.5% |
| Mexican American Indian | 10 | 0.2% |
| Polish | 128 | 2.1% |
| Puerto Rican | 51 | 0.9% |
| Russian | 20 | 0.3% |
| Scandinavian | 5 | 0.1% |
| Scotch-Irish | 21 | 0.4% |
| Scottish | 48 | 0.8% |
| Slovak | 6 | 0.1% |
| Swedish | 22 | 0.4% |
| Swiss | 15 | 0.3% |
| Thai | 7 | 0.1% |
| Welsh | 163 | 2.7% | View All 32 Rows |
Immigrants in Cumberland
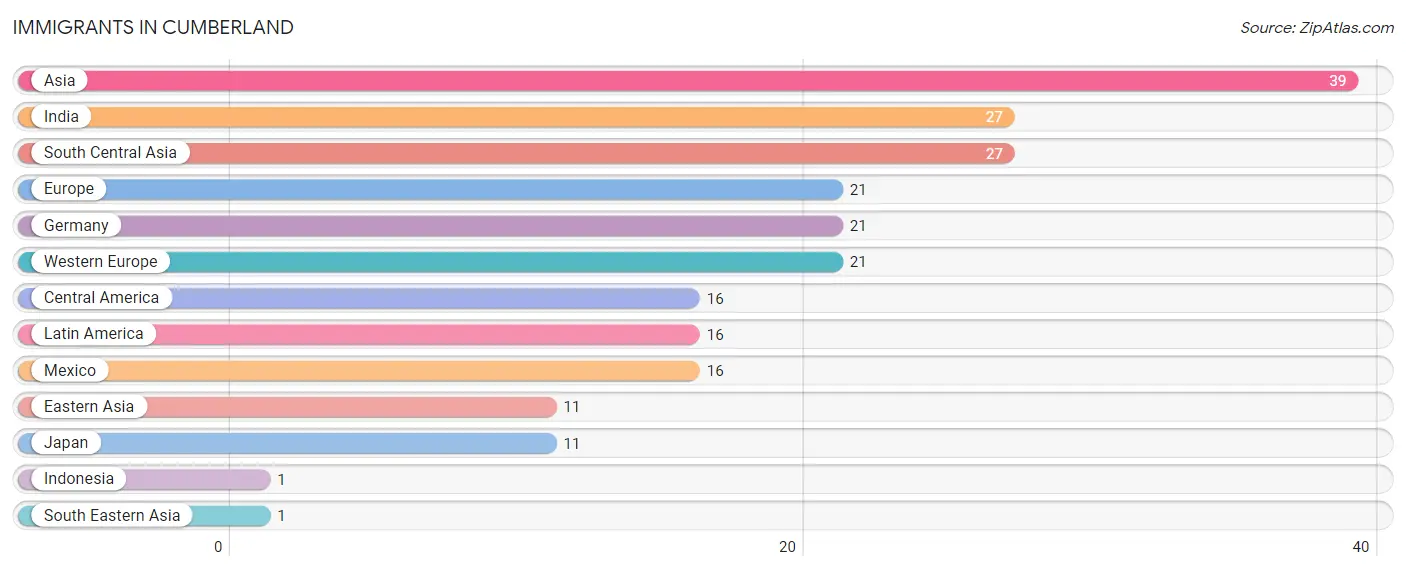
The most numerous immigrant groups reported in Cumberland came from Asia (39 | 0.6%), India (27 | 0.4%), South Central Asia (27 | 0.4%), Europe (21 | 0.4%), and Germany (21 | 0.4%), together accounting for 2.2% of all Cumberland residents.
| Immigration Origin | # Population | % Population |
| Asia | 39 | 0.6% |
| Central America | 16 | 0.3% |
| Eastern Asia | 11 | 0.2% |
| Europe | 21 | 0.4% |
| Germany | 21 | 0.4% |
| India | 27 | 0.4% |
| Indonesia | 1 | 0.0% |
| Japan | 11 | 0.2% |
| Latin America | 16 | 0.3% |
| Mexico | 16 | 0.3% |
| South Central Asia | 27 | 0.4% |
| South Eastern Asia | 1 | 0.0% |
| Western Europe | 21 | 0.4% | View All 13 Rows |
Sex and Age in Cumberland
Sex and Age in Cumberland
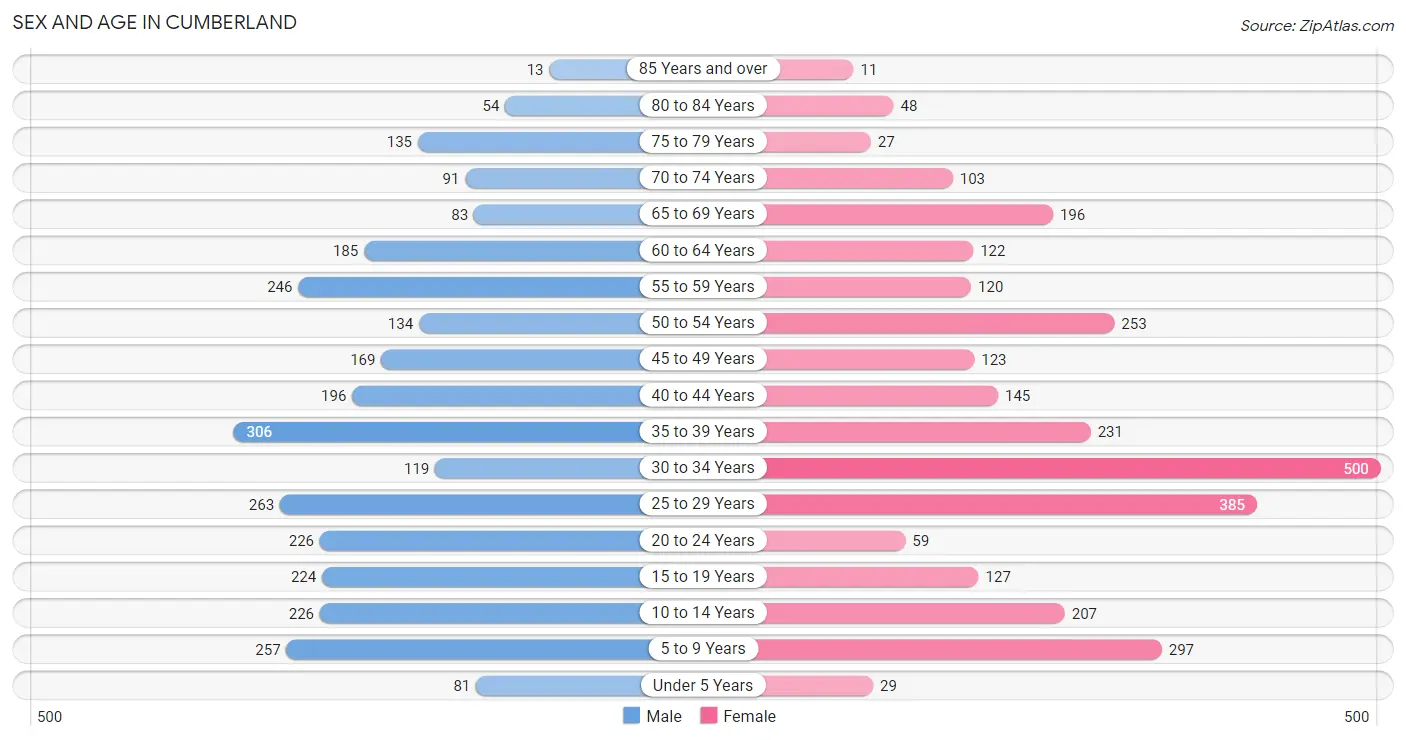
The most populous age groups in Cumberland are 35 to 39 Years (306 | 10.2%) for men and 30 to 34 Years (500 | 16.8%) for women.
| Age Bracket | Male | Female |
| Under 5 Years | 81 (2.7%) | 29 (1.0%) |
| 5 to 9 Years | 257 (8.5%) | 297 (10.0%) |
| 10 to 14 Years | 226 (7.5%) | 207 (6.9%) |
| 15 to 19 Years | 224 (7.4%) | 127 (4.3%) |
| 20 to 24 Years | 226 (7.5%) | 59 (2.0%) |
| 25 to 29 Years | 263 (8.7%) | 385 (12.9%) |
| 30 to 34 Years | 119 (4.0%) | 500 (16.8%) |
| 35 to 39 Years | 306 (10.2%) | 231 (7.7%) |
| 40 to 44 Years | 196 (6.5%) | 145 (4.9%) |
| 45 to 49 Years | 169 (5.6%) | 123 (4.1%) |
| 50 to 54 Years | 134 (4.4%) | 253 (8.5%) |
| 55 to 59 Years | 246 (8.2%) | 120 (4.0%) |
| 60 to 64 Years | 185 (6.1%) | 122 (4.1%) |
| 65 to 69 Years | 83 (2.8%) | 196 (6.6%) |
| 70 to 74 Years | 91 (3.0%) | 103 (3.5%) |
| 75 to 79 Years | 135 (4.5%) | 27 (0.9%) |
| 80 to 84 Years | 54 (1.8%) | 48 (1.6%) |
| 85 Years and over | 13 (0.4%) | 11 (0.4%) |
| Total | 3,008 (100.0%) | 2,983 (100.0%) |
Families and Households in Cumberland
Median Family Size in Cumberland
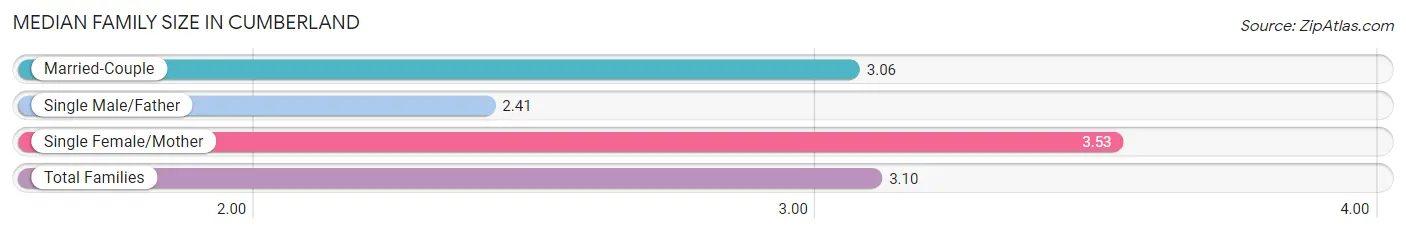
The median family size in Cumberland is 3.10 persons per family, with single female/mother families (315 | 20.8%) accounting for the largest median family size of 3.53 persons per family. On the other hand, single male/father families (143 | 9.5%) represent the smallest median family size with 2.41 persons per family.
| Family Type | # Families | Family Size |
| Married-Couple | 1,056 (69.8%) | 3.06 |
| Single Male/Father | 143 (9.5%) | 2.41 |
| Single Female/Mother | 315 (20.8%) | 3.53 |
| Total Families | 1,514 (100.0%) | 3.10 |
Median Household Size in Cumberland
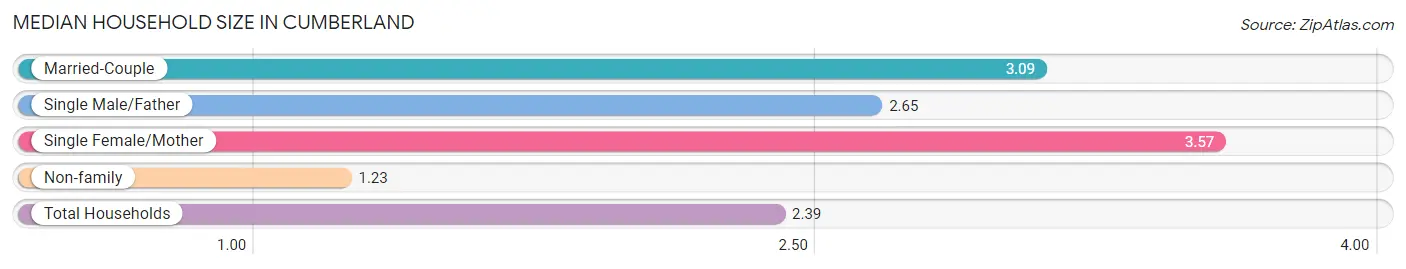
The median household size in Cumberland is 2.39 persons per household, with single female/mother households (315 | 12.6%) accounting for the largest median household size of 3.57 persons per household. non-family households (984 | 39.4%) represent the smallest median household size with 1.23 persons per household.
| Household Type | # Households | Household Size |
| Married-Couple | 1,056 (42.3%) | 3.09 |
| Single Male/Father | 143 (5.7%) | 2.65 |
| Single Female/Mother | 315 (12.6%) | 3.57 |
| Non-family | 984 (39.4%) | 1.23 |
| Total Households | 2,498 (100.0%) | 2.39 |
Household Size by Marriage Status in Cumberland
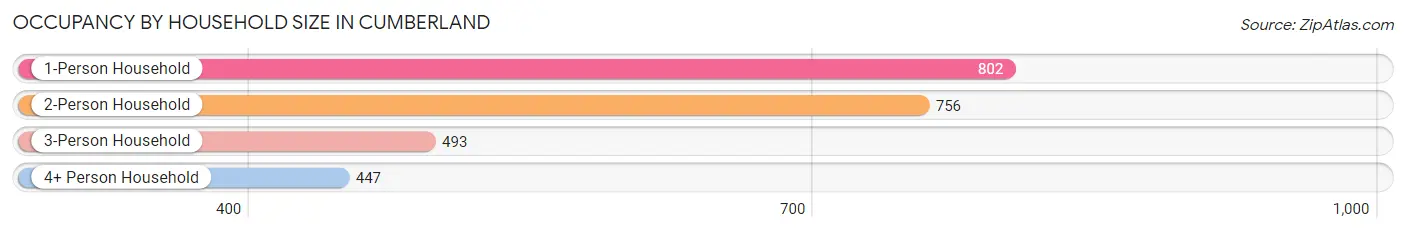
Out of a total of 2,498 households in Cumberland, 1,514 (60.6%) are family households, while 984 (39.4%) are nonfamily households. The most numerous type of family households are 2-person households, comprising 620, and the most common type of nonfamily households are 1-person households, comprising 802.
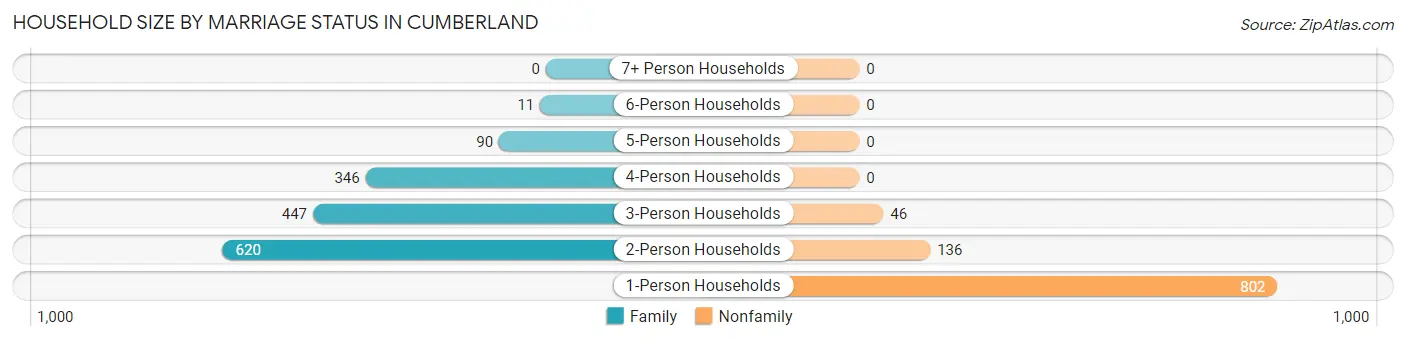
| Household Size | Family Households | Nonfamily Households |
| 1-Person Households | - | 802 (32.1%) |
| 2-Person Households | 620 (24.8%) | 136 (5.4%) |
| 3-Person Households | 447 (17.9%) | 46 (1.8%) |
| 4-Person Households | 346 (13.9%) | 0 (0.0%) |
| 5-Person Households | 90 (3.6%) | 0 (0.0%) |
| 6-Person Households | 11 (0.4%) | 0 (0.0%) |
| 7+ Person Households | 0 (0.0%) | 0 (0.0%) |
| Total | 1,514 (60.6%) | 984 (39.4%) |
Female Fertility in Cumberland
Fertility by Age in Cumberland
Average fertility rate in Cumberland is 4.0 births per 1,000 women. Women in the age bracket of 20 to 34 years have the highest fertility rate with 7.0 births per 1,000 women. Women in the age bracket of 20 to 34 years acount for 100.0% of all women with births.
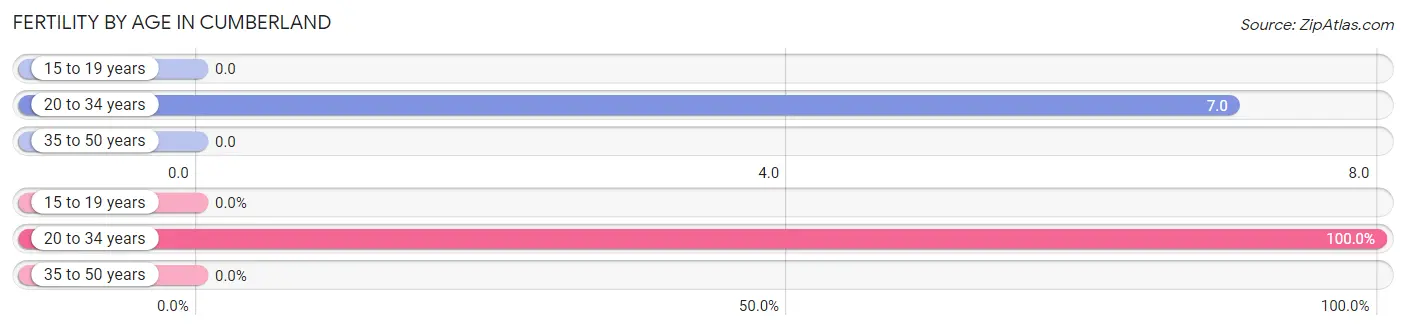
| Age Bracket | Women with Births | Births / 1,000 Women |
| 15 to 19 years | 0 (0.0%) | 0.0 |
| 20 to 34 years | 7 (100.0%) | 7.0 |
| 35 to 50 years | 0 (0.0%) | 0.0 |
| Total | 7 (100.0%) | 4.0 |
Fertility by Age by Marriage Status in Cumberland
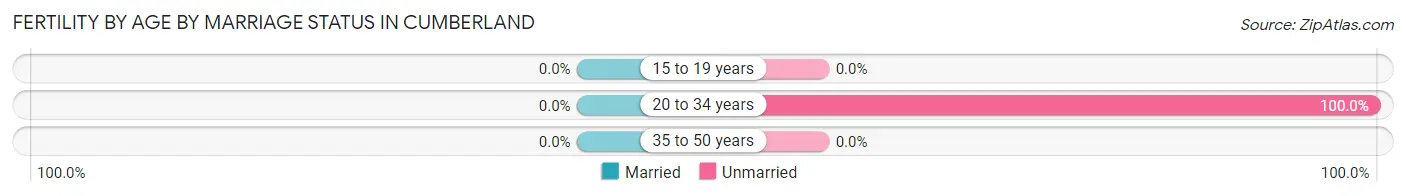
| Age Bracket | Married | Unmarried |
| 15 to 19 years | 0 (0.0%) | 0 (0.0%) |
| 20 to 34 years | 0 (0.0%) | 7 (100.0%) |
| 35 to 50 years | 0 (0.0%) | 0 (0.0%) |
| Total | 0 (0.0%) | 7 (100.0%) |
Fertility by Education in Cumberland
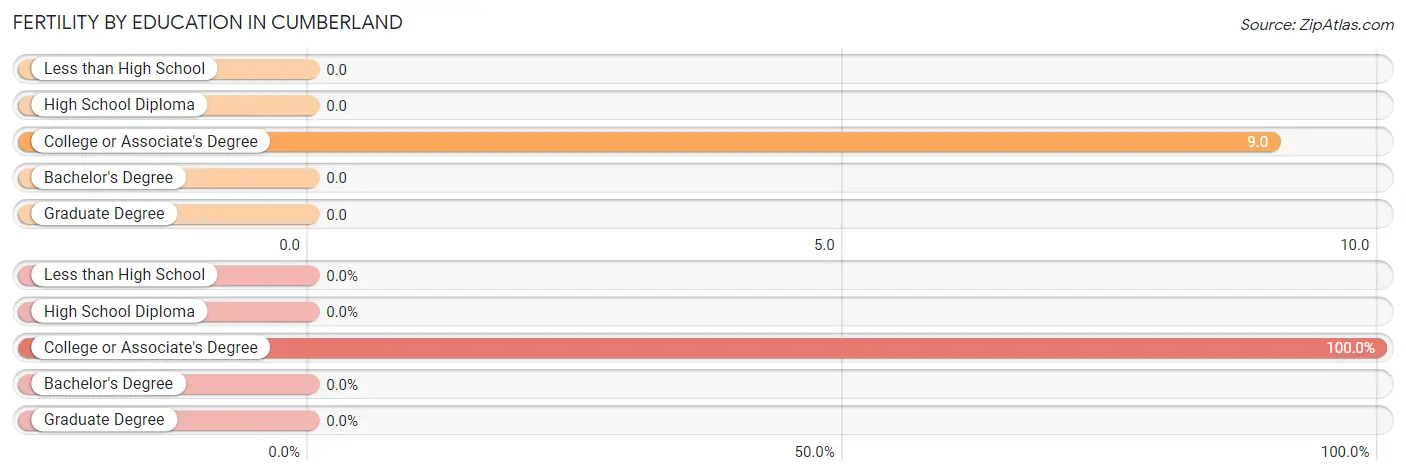
| Educational Attainment | Women with Births | Births / 1,000 Women |
| Less than High School | 0 (0.0%) | 0.0 |
| High School Diploma | 0 (0.0%) | 0.0 |
| College or Associate's Degree | 7 (100.0%) | 9.0 |
| Bachelor's Degree | 0 (0.0%) | 0.0 |
| Graduate Degree | 0 (0.0%) | 0.0 |
| Total | 7 (100.0%) | 4.0 |
Fertility by Education by Marriage Status in Cumberland
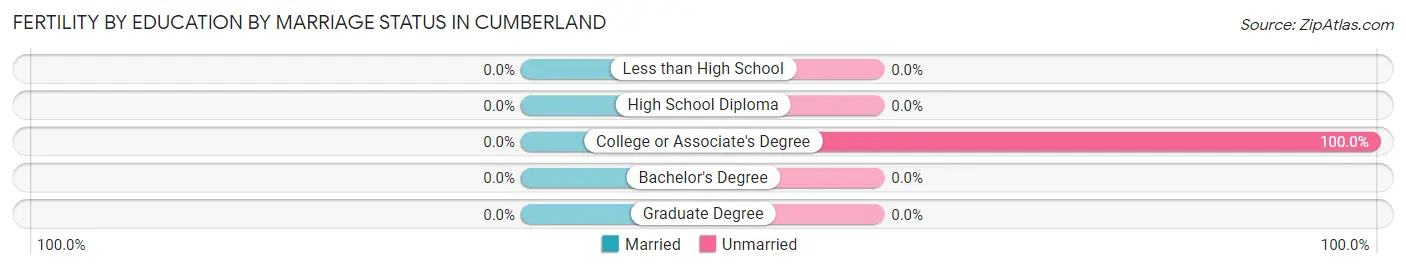
| Educational Attainment | Married | Unmarried |
| Less than High School | 0 (0.0%) | 0 (0.0%) |
| High School Diploma | 0 (0.0%) | 0 (0.0%) |
| College or Associate's Degree | 0 (0.0%) | 7 (100.0%) |
| Bachelor's Degree | 0 (0.0%) | 0 (0.0%) |
| Graduate Degree | 0 (0.0%) | 0 (0.0%) |
| Total | 0 (0.0%) | 7 (100.0%) |
Employment Characteristics in Cumberland
Employment by Class of Employer in Cumberland
Among the 3,548 employed individuals in Cumberland, private company employees (2,742 | 77.3%), local government employees (295 | 8.3%), and self-employed (not incorporated) (176 | 5.0%) make up the most common classes of employment.
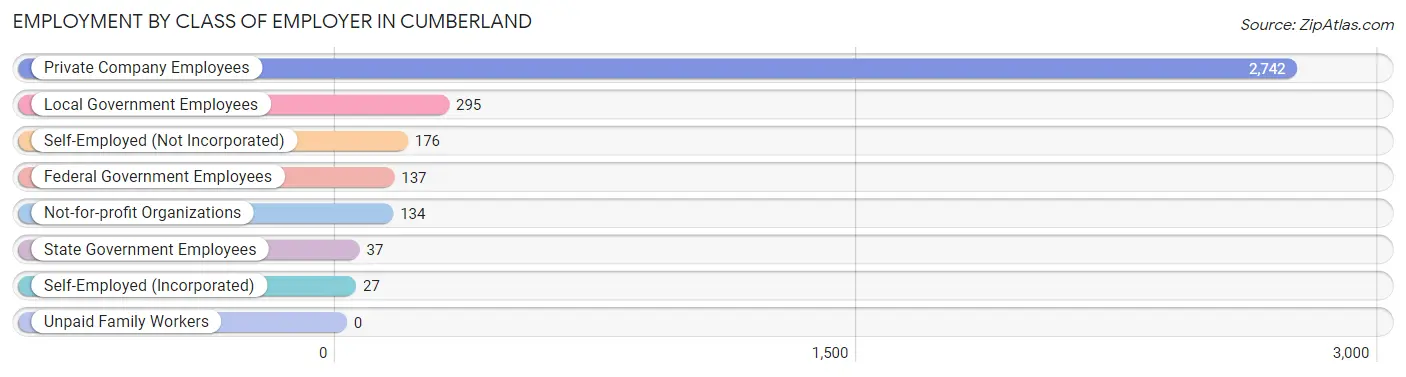
| Employer Class | # Employees | % Employees |
| Private Company Employees | 2,742 | 77.3% |
| Self-Employed (Incorporated) | 27 | 0.8% |
| Self-Employed (Not Incorporated) | 176 | 5.0% |
| Not-for-profit Organizations | 134 | 3.8% |
| Local Government Employees | 295 | 8.3% |
| State Government Employees | 37 | 1.0% |
| Federal Government Employees | 137 | 3.9% |
| Unpaid Family Workers | 0 | 0.0% |
| Total | 3,548 | 100.0% |
Employment Status by Age in Cumberland
According to the labor force statistics for Cumberland, out of the total population over 16 years of age (4,751), 78.1% or 3,711 individuals are in the labor force, with 3.1% or 115 of them unemployed. The age group with the highest labor force participation rate is 35 to 44 years, with 99.8% or 876 individuals in the labor force. Within the labor force, the 16 to 19 years age range has the highest percentage of unemployed individuals, with 17.7% or 25 of them being unemployed.
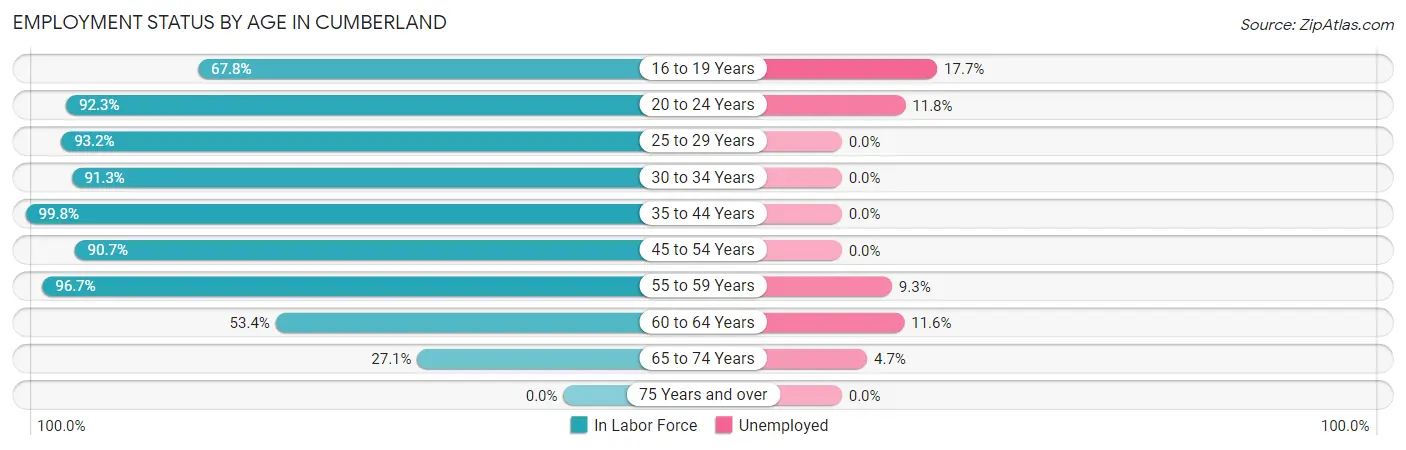
| Age Bracket | In Labor Force | Unemployed |
| 16 to 19 Years | 141 (67.8%) | 25 (17.7%) |
| 20 to 24 Years | 263 (92.3%) | 31 (11.8%) |
| 25 to 29 Years | 604 (93.2%) | 0 (0.0%) |
| 30 to 34 Years | 565 (91.3%) | 0 (0.0%) |
| 35 to 44 Years | 876 (99.8%) | 0 (0.0%) |
| 45 to 54 Years | 616 (90.7%) | 0 (0.0%) |
| 55 to 59 Years | 354 (96.7%) | 33 (9.3%) |
| 60 to 64 Years | 164 (53.4%) | 19 (11.6%) |
| 65 to 74 Years | 128 (27.1%) | 6 (4.7%) |
| 75 Years and over | 0 (0.0%) | 0 (0.0%) |
| Total | 3,711 (78.1%) | 115 (3.1%) |
Employment Status by Educational Attainment in Cumberland
According to labor force statistics for Cumberland, 90.9% of individuals (3,179) out of the total population between 25 and 64 years of age (3,497) are in the labor force, with 1.6% or 51 of them being unemployed. The group with the highest labor force participation rate are those with the educational attainment of college / associate degree, with 97.4% or 1,277 individuals in the labor force. Within the labor force, individuals with less than high school education have the highest percentage of unemployment, with 32.2% or 19 of them being unemployed.
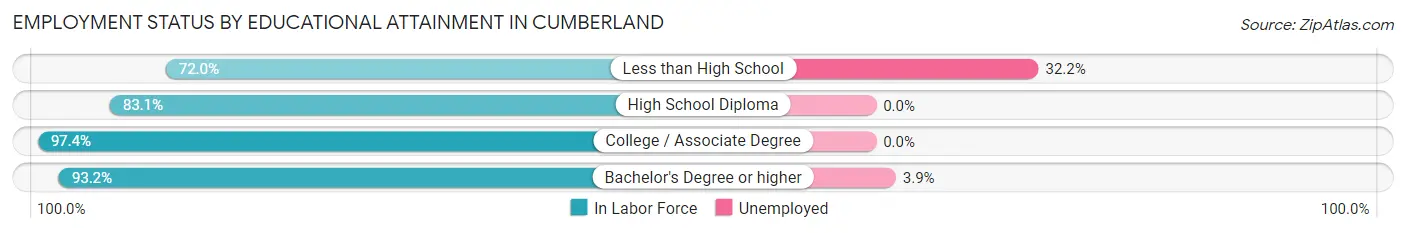
| Educational Attainment | In Labor Force | Unemployed |
| Less than High School | 59 (72.0%) | 26 (32.2%) |
| High School Diploma | 976 (83.1%) | 0 (0.0%) |
| College / Associate Degree | 1,277 (97.4%) | 0 (0.0%) |
| Bachelor's Degree or higher | 866 (93.2%) | 36 (3.9%) |
| Total | 3,179 (90.9%) | 56 (1.6%) |
Employment Occupations by Sex in Cumberland
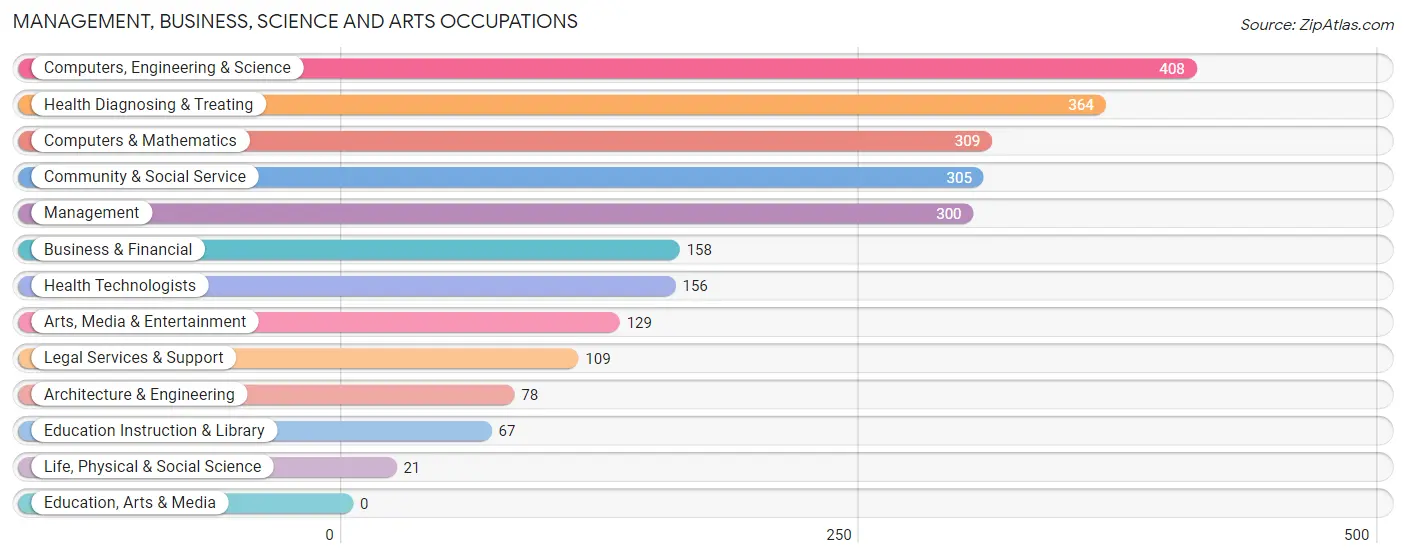
Management, Business, Science and Arts Occupations
The most common Management, Business, Science and Arts occupations in Cumberland are Computers, Engineering & Science (408 | 11.4%), Health Diagnosing & Treating (364 | 10.2%), Computers & Mathematics (309 | 8.6%), Community & Social Service (305 | 8.5%), and Management (300 | 8.4%).
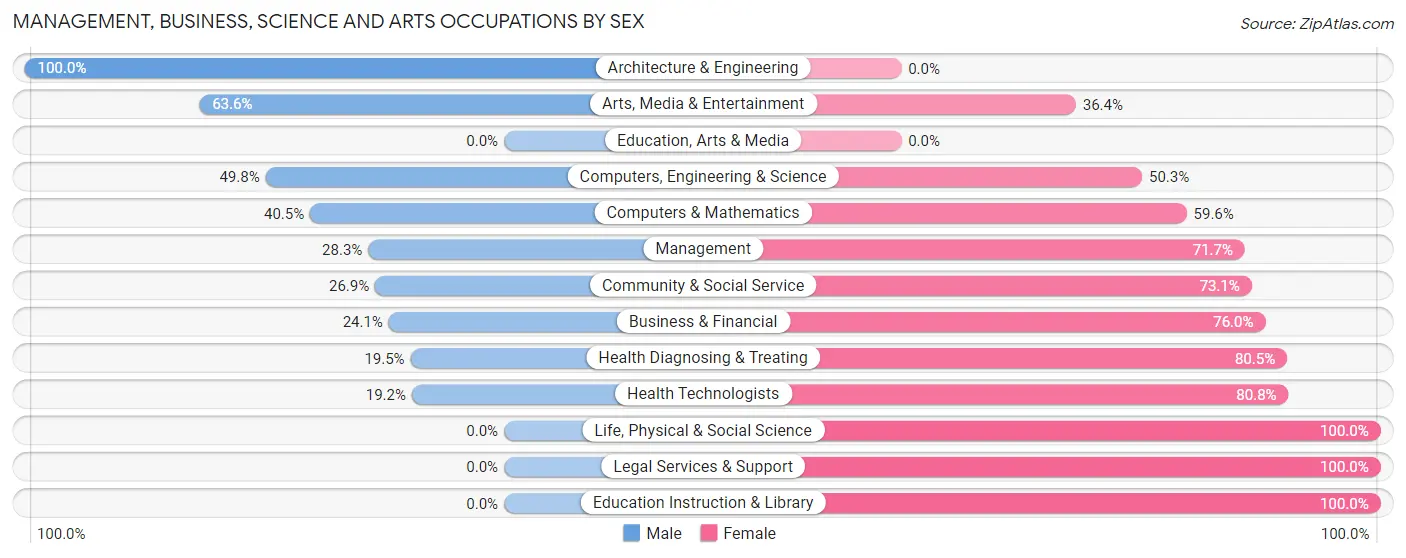
Management, Business, Science and Arts Occupations by Sex
Within the Management, Business, Science and Arts occupations in Cumberland, the most male-oriented occupations are Architecture & Engineering (100.0%), Arts, Media & Entertainment (63.6%), and Computers, Engineering & Science (49.7%), while the most female-oriented occupations are Life, Physical & Social Science (100.0%), Legal Services & Support (100.0%), and Education Instruction & Library (100.0%).
| Occupation | Male | Female |
| Management | 85 (28.3%) | 215 (71.7%) |
| Business & Financial | 38 (24.0%) | 120 (75.9%) |
| Computers, Engineering & Science | 203 (49.7%) | 205 (50.2%) |
| Computers & Mathematics | 125 (40.5%) | 184 (59.6%) |
| Architecture & Engineering | 78 (100.0%) | 0 (0.0%) |
| Life, Physical & Social Science | 0 (0.0%) | 21 (100.0%) |
| Community & Social Service | 82 (26.9%) | 223 (73.1%) |
| Education, Arts & Media | 0 (0.0%) | 0 (0.0%) |
| Legal Services & Support | 0 (0.0%) | 109 (100.0%) |
| Education Instruction & Library | 0 (0.0%) | 67 (100.0%) |
| Arts, Media & Entertainment | 82 (63.6%) | 47 (36.4%) |
| Health Diagnosing & Treating | 71 (19.5%) | 293 (80.5%) |
| Health Technologists | 30 (19.2%) | 126 (80.8%) |
| Total (Category) | 479 (31.2%) | 1,056 (68.8%) |
| Total (Overall) | 1,703 (47.5%) | 1,881 (52.5%) |
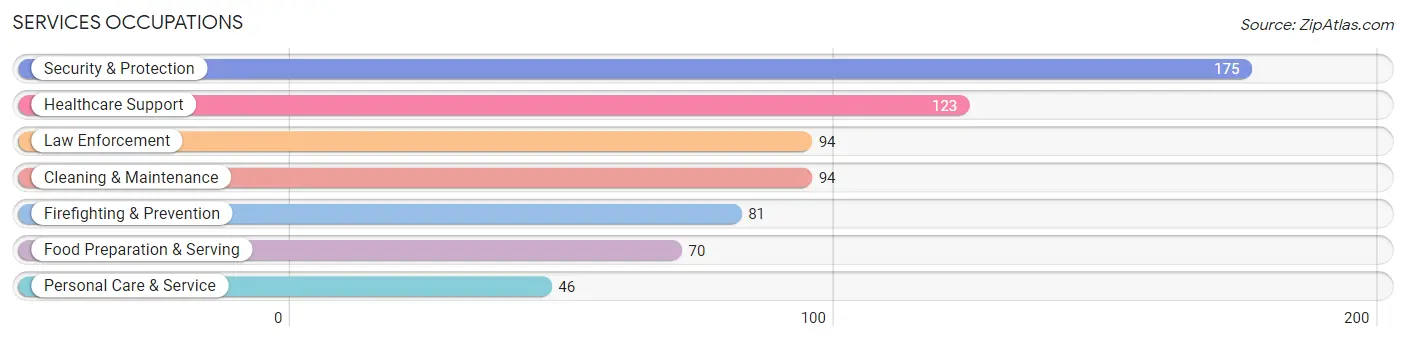
Services Occupations
The most common Services occupations in Cumberland are Security & Protection (175 | 4.9%), Healthcare Support (123 | 3.4%), Law Enforcement (94 | 2.6%), Cleaning & Maintenance (94 | 2.6%), and Firefighting & Prevention (81 | 2.3%).
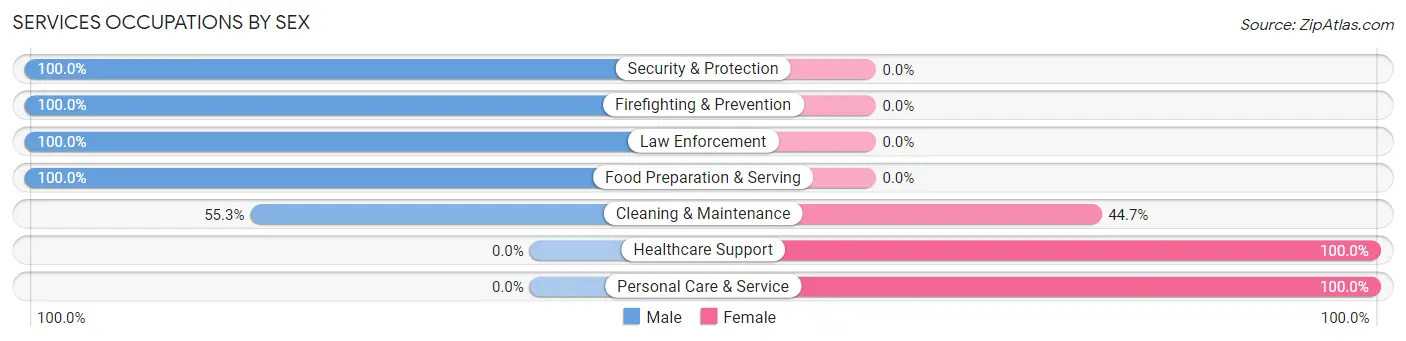
Services Occupations by Sex
Within the Services occupations in Cumberland, the most male-oriented occupations are Security & Protection (100.0%), Firefighting & Prevention (100.0%), and Law Enforcement (100.0%), while the most female-oriented occupations are Healthcare Support (100.0%), Personal Care & Service (100.0%), and Cleaning & Maintenance (44.7%).
| Occupation | Male | Female |
| Healthcare Support | 0 (0.0%) | 123 (100.0%) |
| Security & Protection | 175 (100.0%) | 0 (0.0%) |
| Firefighting & Prevention | 81 (100.0%) | 0 (0.0%) |
| Law Enforcement | 94 (100.0%) | 0 (0.0%) |
| Food Preparation & Serving | 70 (100.0%) | 0 (0.0%) |
| Cleaning & Maintenance | 52 (55.3%) | 42 (44.7%) |
| Personal Care & Service | 0 (0.0%) | 46 (100.0%) |
| Total (Category) | 297 (58.5%) | 211 (41.5%) |
| Total (Overall) | 1,703 (47.5%) | 1,881 (52.5%) |
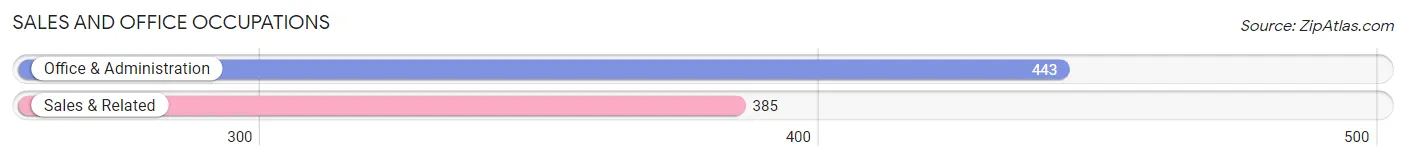
Sales and Office Occupations
The most common Sales and Office occupations in Cumberland are Office & Administration (443 | 12.4%), and Sales & Related (385 | 10.7%).
Sales and Office Occupations by Sex
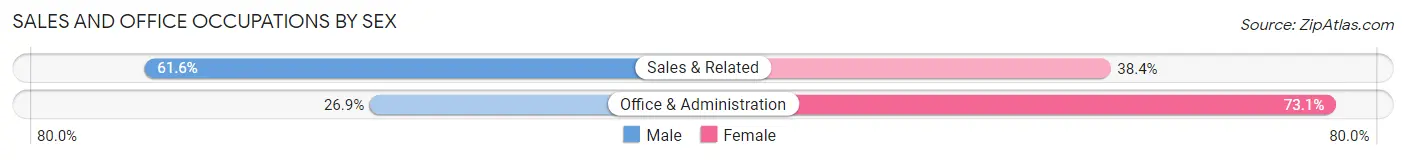
| Occupation | Male | Female |
| Sales & Related | 237 (61.6%) | 148 (38.4%) |
| Office & Administration | 119 (26.9%) | 324 (73.1%) |
| Total (Category) | 356 (43.0%) | 472 (57.0%) |
| Total (Overall) | 1,703 (47.5%) | 1,881 (52.5%) |
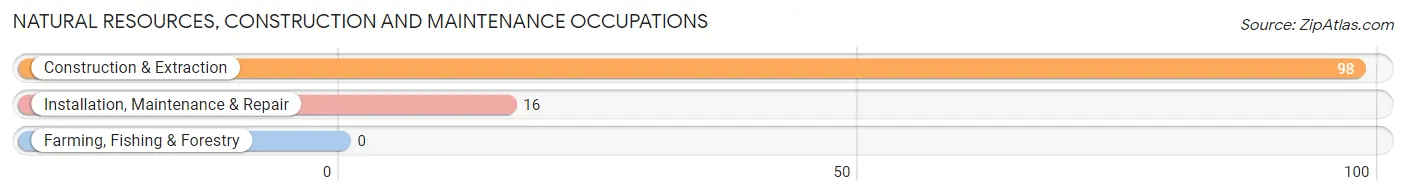
Natural Resources, Construction and Maintenance Occupations
The most common Natural Resources, Construction and Maintenance occupations in Cumberland are Construction & Extraction (98 | 2.7%), and Installation, Maintenance & Repair (16 | 0.4%).
Natural Resources, Construction and Maintenance Occupations by Sex
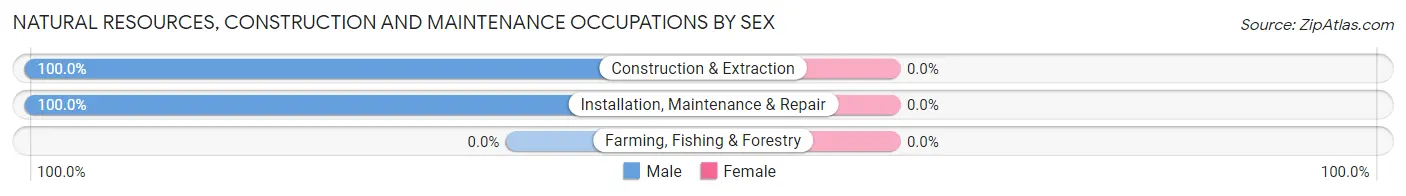
| Occupation | Male | Female |
| Farming, Fishing & Forestry | 0 (0.0%) | 0 (0.0%) |
| Construction & Extraction | 98 (100.0%) | 0 (0.0%) |
| Installation, Maintenance & Repair | 16 (100.0%) | 0 (0.0%) |
| Total (Category) | 114 (100.0%) | 0 (0.0%) |
| Total (Overall) | 1,703 (47.5%) | 1,881 (52.5%) |
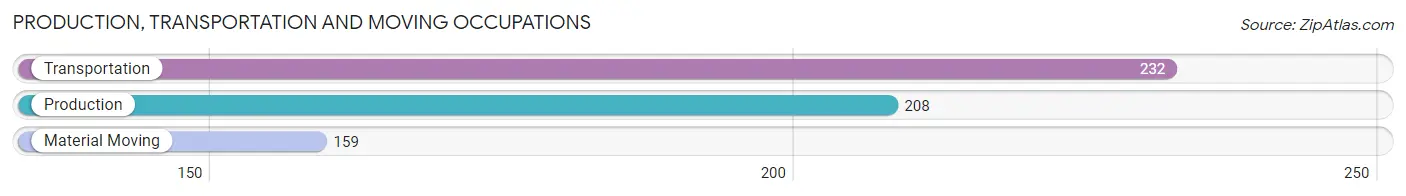
Production, Transportation and Moving Occupations
The most common Production, Transportation and Moving occupations in Cumberland are Transportation (232 | 6.5%), Production (208 | 5.8%), and Material Moving (159 | 4.4%).
Production, Transportation and Moving Occupations by Sex
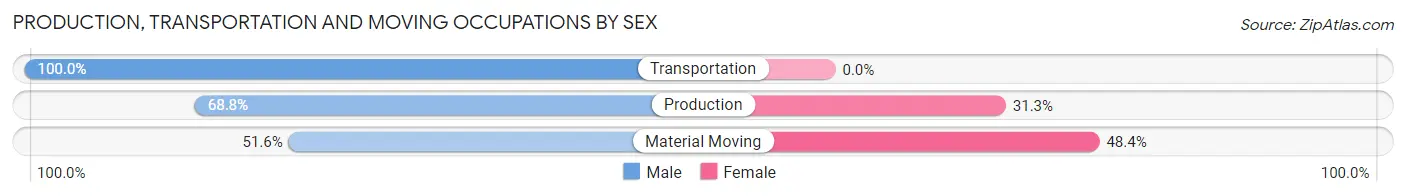
| Occupation | Male | Female |
| Production | 143 (68.8%) | 65 (31.2%) |
| Transportation | 232 (100.0%) | 0 (0.0%) |
| Material Moving | 82 (51.6%) | 77 (48.4%) |
| Total (Category) | 457 (76.3%) | 142 (23.7%) |
| Total (Overall) | 1,703 (47.5%) | 1,881 (52.5%) |
Employment Industries by Sex in Cumberland
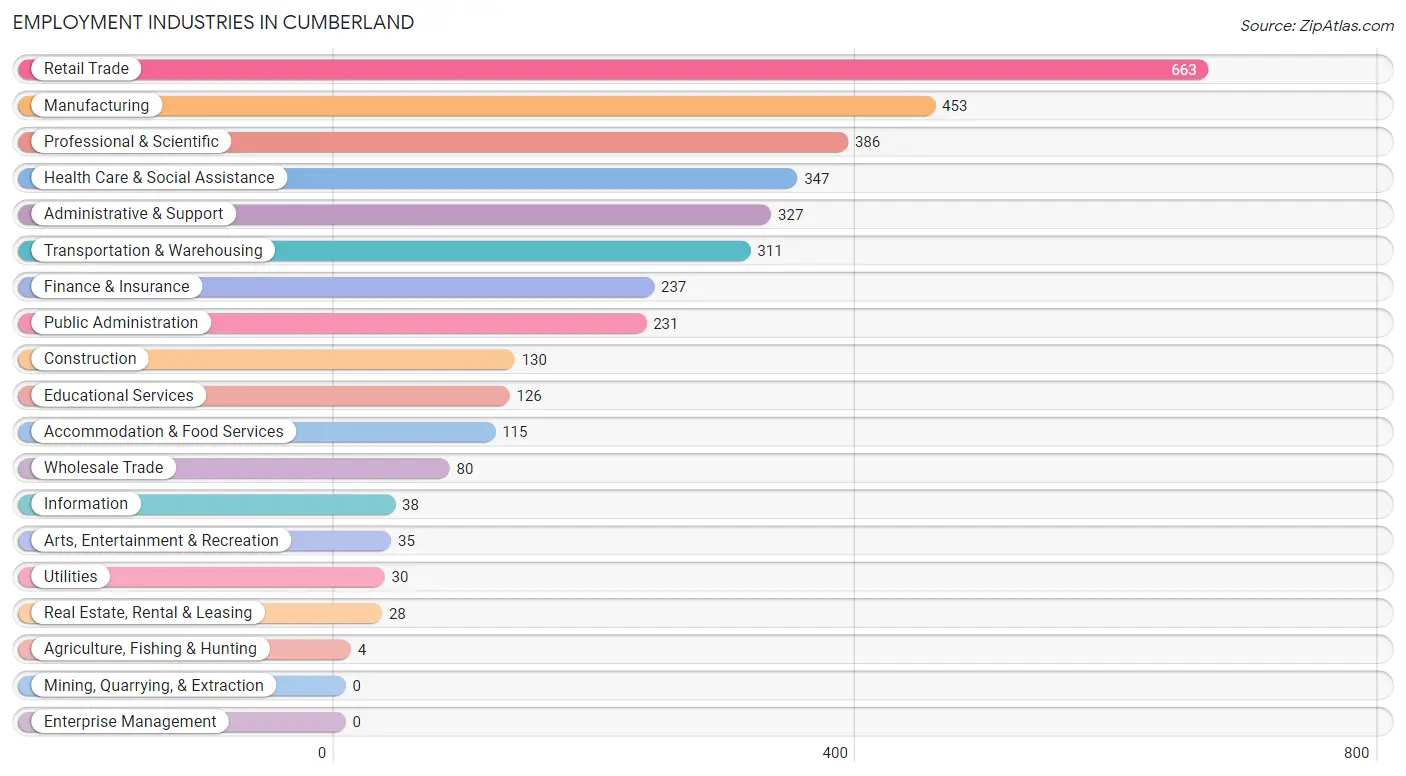
Employment Industries in Cumberland
The major employment industries in Cumberland include Retail Trade (663 | 18.5%), Manufacturing (453 | 12.6%), Professional & Scientific (386 | 10.8%), Health Care & Social Assistance (347 | 9.7%), and Administrative & Support (327 | 9.1%).
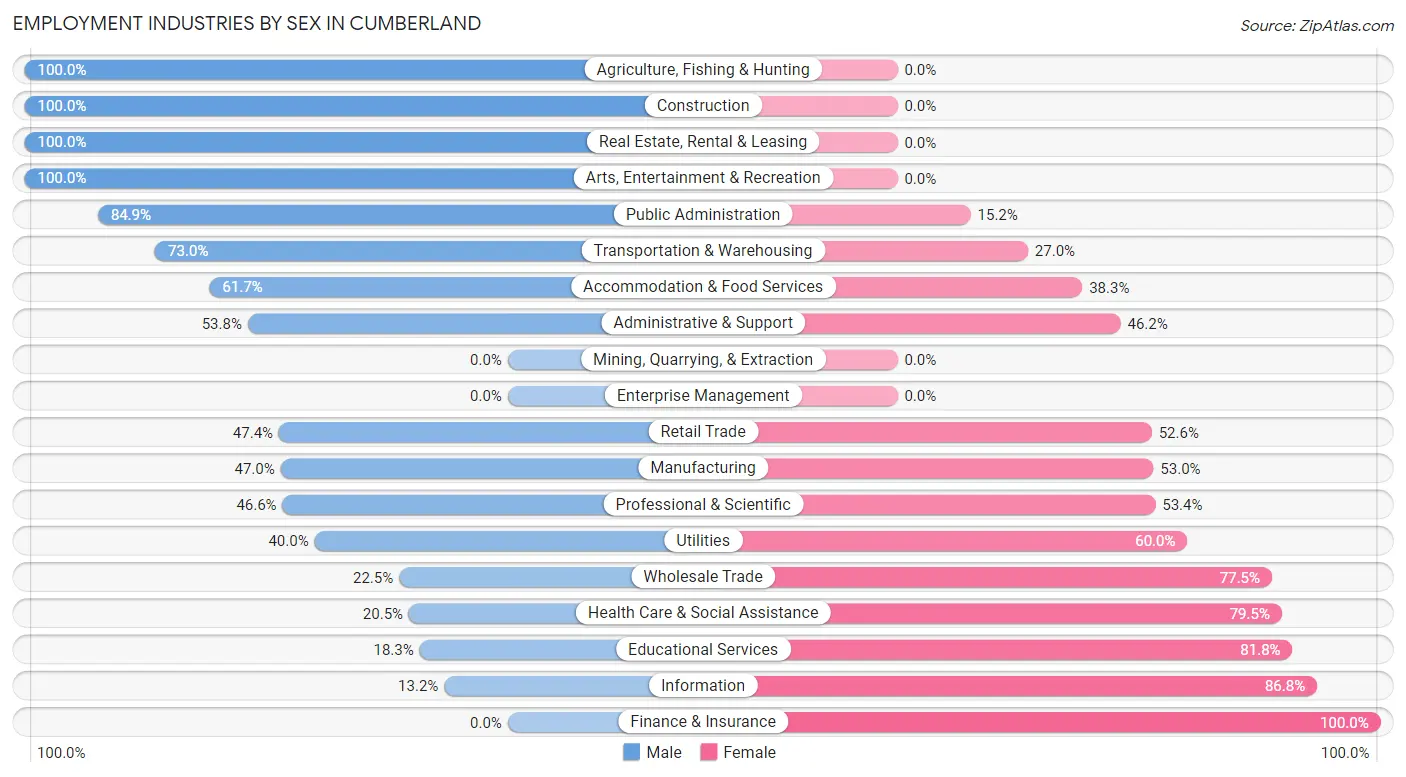
Employment Industries by Sex in Cumberland
The Cumberland industries that see more men than women are Agriculture, Fishing & Hunting (100.0%), Construction (100.0%), and Real Estate, Rental & Leasing (100.0%), whereas the industries that tend to have a higher number of women are Finance & Insurance (100.0%), Information (86.8%), and Educational Services (81.8%).
| Industry | Male | Female |
| Agriculture, Fishing & Hunting | 4 (100.0%) | 0 (0.0%) |
| Mining, Quarrying, & Extraction | 0 (0.0%) | 0 (0.0%) |
| Construction | 130 (100.0%) | 0 (0.0%) |
| Manufacturing | 213 (47.0%) | 240 (53.0%) |
| Wholesale Trade | 18 (22.5%) | 62 (77.5%) |
| Retail Trade | 314 (47.4%) | 349 (52.6%) |
| Transportation & Warehousing | 227 (73.0%) | 84 (27.0%) |
| Utilities | 12 (40.0%) | 18 (60.0%) |
| Information | 5 (13.2%) | 33 (86.8%) |
| Finance & Insurance | 0 (0.0%) | 237 (100.0%) |
| Real Estate, Rental & Leasing | 28 (100.0%) | 0 (0.0%) |
| Professional & Scientific | 180 (46.6%) | 206 (53.4%) |
| Enterprise Management | 0 (0.0%) | 0 (0.0%) |
| Administrative & Support | 176 (53.8%) | 151 (46.2%) |
| Educational Services | 23 (18.2%) | 103 (81.8%) |
| Health Care & Social Assistance | 71 (20.5%) | 276 (79.5%) |
| Arts, Entertainment & Recreation | 35 (100.0%) | 0 (0.0%) |
| Accommodation & Food Services | 71 (61.7%) | 44 (38.3%) |
| Public Administration | 196 (84.9%) | 35 (15.1%) |
| Total | 1,703 (47.5%) | 1,881 (52.5%) |
Education in Cumberland
School Enrollment in Cumberland
The most common levels of schooling among the 1,450 students in Cumberland are elementary school (469 | 32.3%), high school (463 | 31.9%), and middle school (232 | 16.0%).
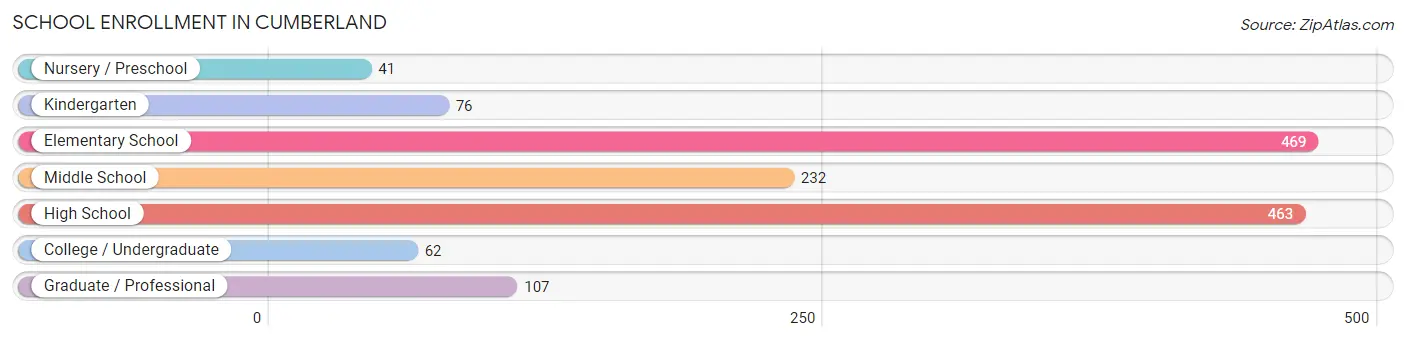
| School Level | # Students | % Students |
| Nursery / Preschool | 41 | 2.8% |
| Kindergarten | 76 | 5.2% |
| Elementary School | 469 | 32.3% |
| Middle School | 232 | 16.0% |
| High School | 463 | 31.9% |
| College / Undergraduate | 62 | 4.3% |
| Graduate / Professional | 107 | 7.4% |
| Total | 1,450 | 100.0% |
School Enrollment by Age by Funding Source in Cumberland
Out of a total of 1,450 students who are enrolled in schools in Cumberland, 45 (3.1%) attend a private institution, while the remaining 1,405 (96.9%) are enrolled in public schools. The age group of 5 to 9 year old has the highest likelihood of being enrolled in private schools, with 28 (5.1% in the age bracket) enrolled. Conversely, the age group of 18 to 19 year olds has the lowest likelihood of being enrolled in a private school, with 18 (100.0% in the age bracket) attending a public institution.
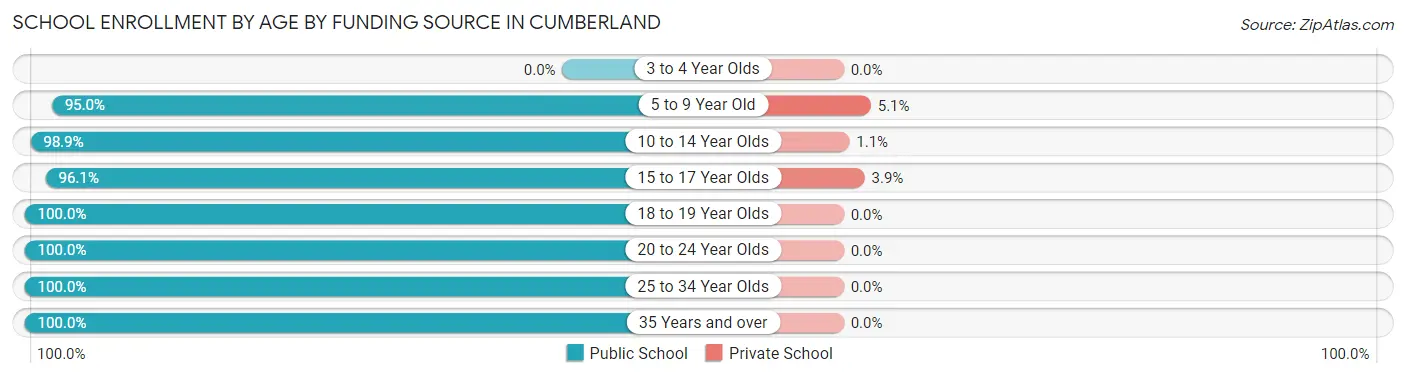
| Age Bracket | Public School | Private School |
| 3 to 4 Year Olds | 0 (0.0%) | 0 (0.0%) |
| 5 to 9 Year Old | 526 (95.0%) | 28 (5.1%) |
| 10 to 14 Year Olds | 372 (98.9%) | 4 (1.1%) |
| 15 to 17 Year Olds | 320 (96.1%) | 13 (3.9%) |
| 18 to 19 Year Olds | 18 (100.0%) | 0 (0.0%) |
| 20 to 24 Year Olds | 54 (100.0%) | 0 (0.0%) |
| 25 to 34 Year Olds | 88 (100.0%) | 0 (0.0%) |
| 35 Years and over | 27 (100.0%) | 0 (0.0%) |
| Total | 1,405 (96.9%) | 45 (3.1%) |
Educational Attainment by Field of Study in Cumberland
Business (434 | 33.0%), science & technology (196 | 14.9%), education (137 | 10.4%), arts & humanities (118 | 9.0%), and bio, nature & agricultural (114 | 8.7%) are the most common fields of study among 1,314 individuals in Cumberland who have obtained a bachelor's degree or higher.
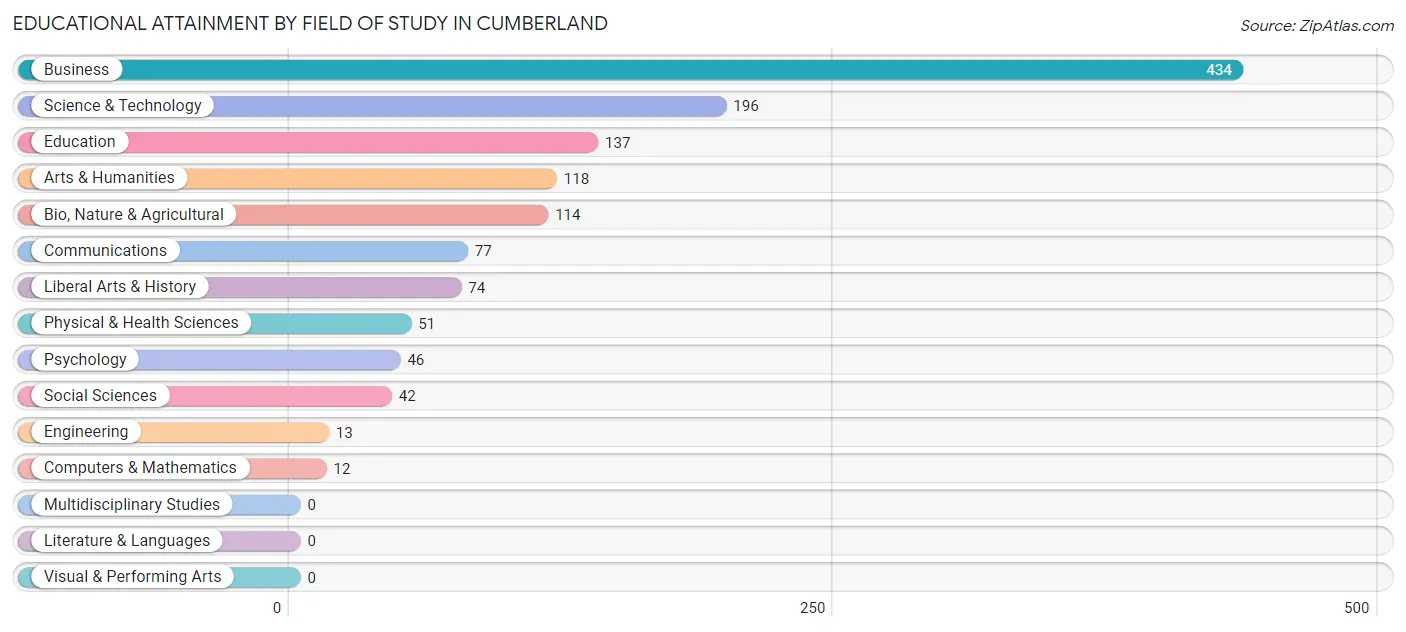
| Field of Study | # Graduates | % Graduates |
| Computers & Mathematics | 12 | 0.9% |
| Bio, Nature & Agricultural | 114 | 8.7% |
| Physical & Health Sciences | 51 | 3.9% |
| Psychology | 46 | 3.5% |
| Social Sciences | 42 | 3.2% |
| Engineering | 13 | 1.0% |
| Multidisciplinary Studies | 0 | 0.0% |
| Science & Technology | 196 | 14.9% |
| Business | 434 | 33.0% |
| Education | 137 | 10.4% |
| Literature & Languages | 0 | 0.0% |
| Liberal Arts & History | 74 | 5.6% |
| Visual & Performing Arts | 0 | 0.0% |
| Communications | 77 | 5.9% |
| Arts & Humanities | 118 | 9.0% |
| Total | 1,314 | 100.0% |
Transportation & Commute in Cumberland
Vehicle Availability by Sex in Cumberland
The most prevalent vehicle ownership categories in Cumberland are males with 2 vehicles (884, accounting for 51.5%) and females with 2 vehicles (977, making up 48.2%).
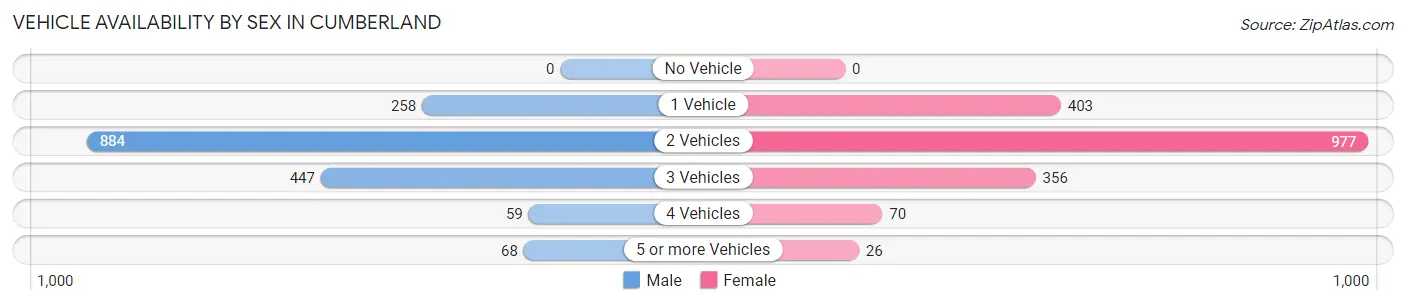
| Vehicles Available | Male | Female |
| No Vehicle | 0 (0.0%) | 0 (0.0%) |
| 1 Vehicle | 258 (15.0%) | 403 (22.0%) |
| 2 Vehicles | 884 (51.5%) | 977 (53.3%) |
| 3 Vehicles | 447 (26.1%) | 356 (19.4%) |
| 4 Vehicles | 59 (3.4%) | 70 (3.8%) |
| 5 or more Vehicles | 68 (4.0%) | 26 (1.4%) |
| Total | 1,716 (100.0%) | 1,832 (100.0%) |
Commute Time in Cumberland
The most frequently occuring commute durations in Cumberland are 30 to 34 minutes (739 commuters, 22.2%), 20 to 24 minutes (651 commuters, 19.5%), and 15 to 19 minutes (429 commuters, 12.9%).
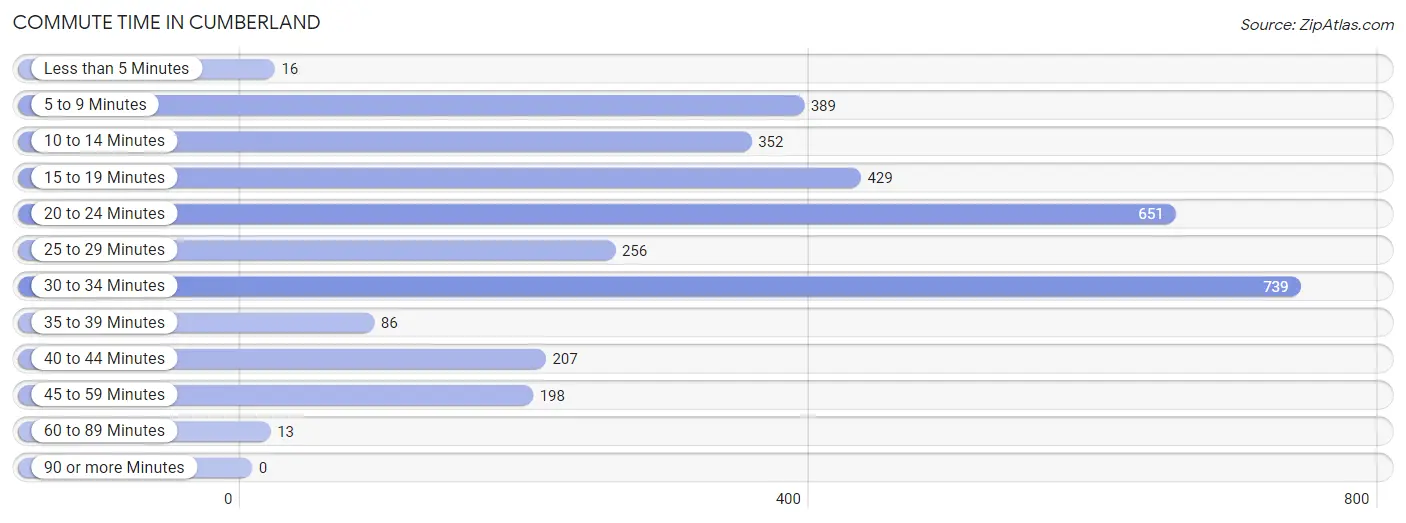
| Commute Time | # Commuters | % Commuters |
| Less than 5 Minutes | 16 | 0.5% |
| 5 to 9 Minutes | 389 | 11.7% |
| 10 to 14 Minutes | 352 | 10.5% |
| 15 to 19 Minutes | 429 | 12.9% |
| 20 to 24 Minutes | 651 | 19.5% |
| 25 to 29 Minutes | 256 | 7.7% |
| 30 to 34 Minutes | 739 | 22.2% |
| 35 to 39 Minutes | 86 | 2.6% |
| 40 to 44 Minutes | 207 | 6.2% |
| 45 to 59 Minutes | 198 | 5.9% |
| 60 to 89 Minutes | 13 | 0.4% |
| 90 or more Minutes | 0 | 0.0% |
Commute Time by Sex in Cumberland
The most common commute times in Cumberland are 30 to 34 minutes (357 commuters, 22.2%) for males and 30 to 34 minutes (382 commuters, 22.1%) for females.
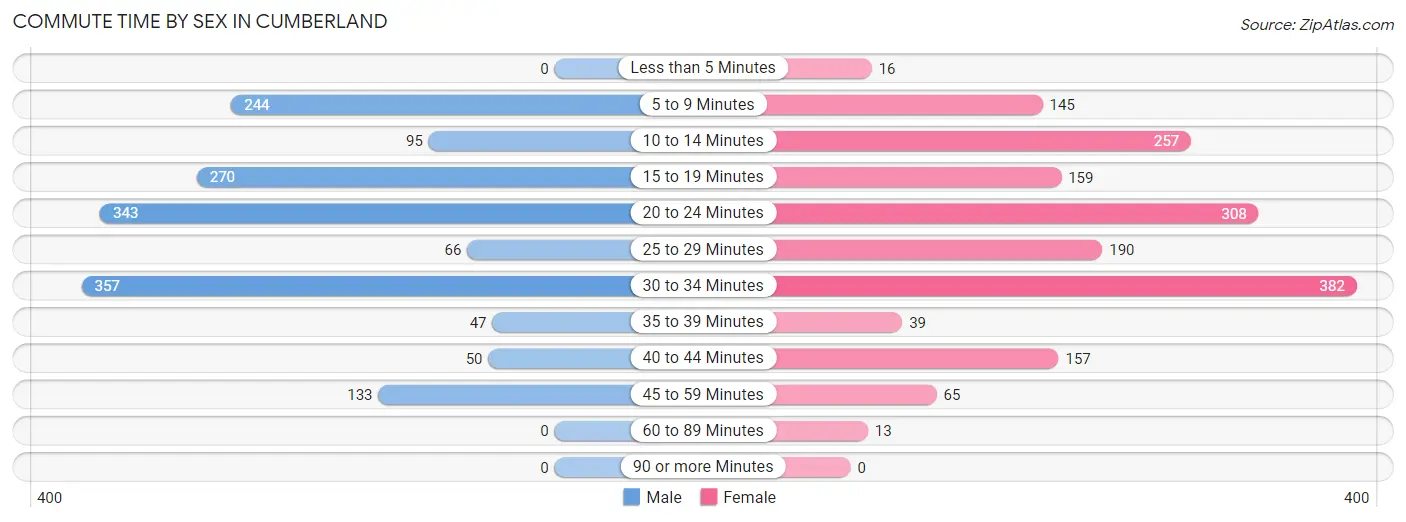
| Commute Time | Male | Female |
| Less than 5 Minutes | 0 (0.0%) | 16 (0.9%) |
| 5 to 9 Minutes | 244 (15.2%) | 145 (8.4%) |
| 10 to 14 Minutes | 95 (5.9%) | 257 (14.8%) |
| 15 to 19 Minutes | 270 (16.8%) | 159 (9.2%) |
| 20 to 24 Minutes | 343 (21.4%) | 308 (17.8%) |
| 25 to 29 Minutes | 66 (4.1%) | 190 (11.0%) |
| 30 to 34 Minutes | 357 (22.2%) | 382 (22.1%) |
| 35 to 39 Minutes | 47 (2.9%) | 39 (2.2%) |
| 40 to 44 Minutes | 50 (3.1%) | 157 (9.1%) |
| 45 to 59 Minutes | 133 (8.3%) | 65 (3.8%) |
| 60 to 89 Minutes | 0 (0.0%) | 13 (0.7%) |
| 90 or more Minutes | 0 (0.0%) | 0 (0.0%) |
Time of Departure to Work by Sex in Cumberland
The most frequent times of departure to work in Cumberland are 6:00 AM to 6:29 AM (253, 15.8%) for males and 7:00 AM to 7:29 AM (503, 29.1%) for females.
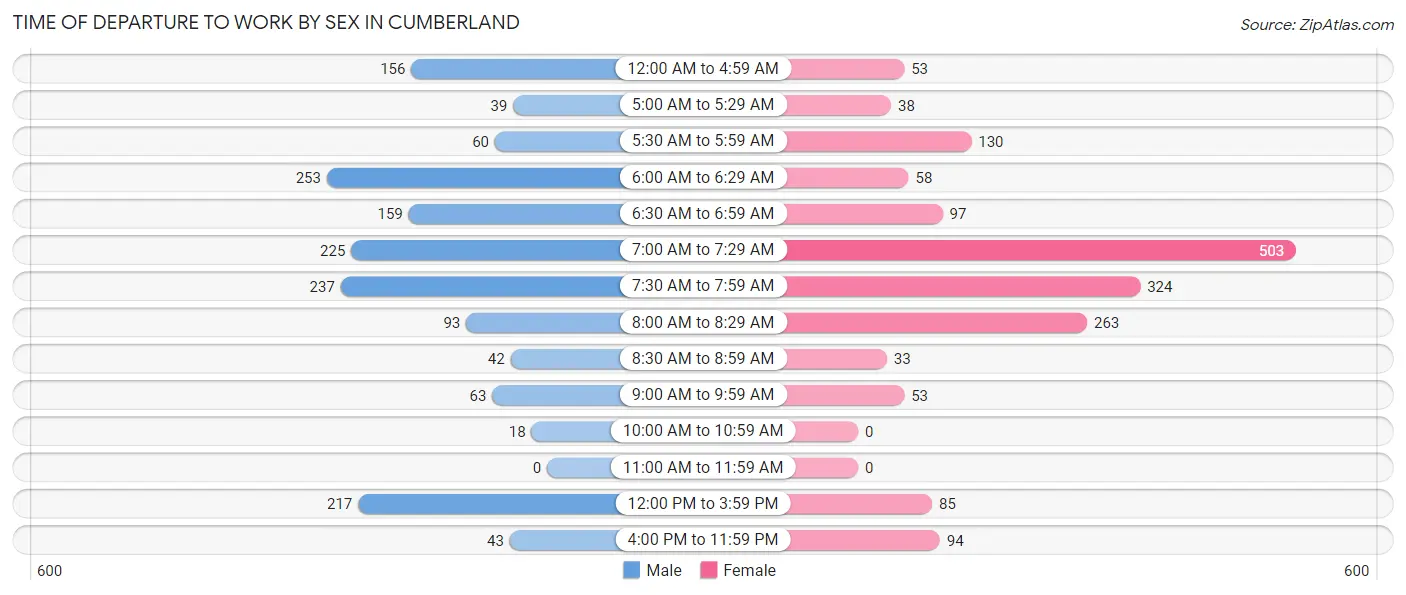
| Time of Departure | Male | Female |
| 12:00 AM to 4:59 AM | 156 (9.7%) | 53 (3.1%) |
| 5:00 AM to 5:29 AM | 39 (2.4%) | 38 (2.2%) |
| 5:30 AM to 5:59 AM | 60 (3.7%) | 130 (7.5%) |
| 6:00 AM to 6:29 AM | 253 (15.8%) | 58 (3.4%) |
| 6:30 AM to 6:59 AM | 159 (9.9%) | 97 (5.6%) |
| 7:00 AM to 7:29 AM | 225 (14.0%) | 503 (29.1%) |
| 7:30 AM to 7:59 AM | 237 (14.8%) | 324 (18.7%) |
| 8:00 AM to 8:29 AM | 93 (5.8%) | 263 (15.2%) |
| 8:30 AM to 8:59 AM | 42 (2.6%) | 33 (1.9%) |
| 9:00 AM to 9:59 AM | 63 (3.9%) | 53 (3.1%) |
| 10:00 AM to 10:59 AM | 18 (1.1%) | 0 (0.0%) |
| 11:00 AM to 11:59 AM | 0 (0.0%) | 0 (0.0%) |
| 12:00 PM to 3:59 PM | 217 (13.5%) | 85 (4.9%) |
| 4:00 PM to 11:59 PM | 43 (2.7%) | 94 (5.4%) |
| Total | 1,605 (100.0%) | 1,731 (100.0%) |
Housing Occupancy in Cumberland
Occupancy by Ownership in Cumberland
Of the total 2,498 dwellings in Cumberland, owner-occupied units account for 1,952 (78.1%), while renter-occupied units make up 546 (21.9%).
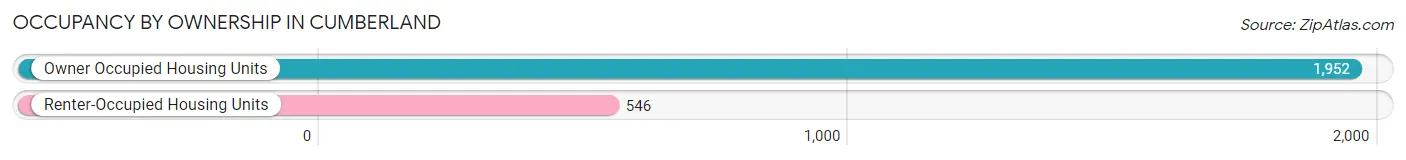
| Occupancy | # Housing Units | % Housing Units |
| Owner Occupied Housing Units | 1,952 | 78.1% |
| Renter-Occupied Housing Units | 546 | 21.9% |
| Total Occupied Housing Units | 2,498 | 100.0% |
Occupancy by Household Size in Cumberland
| Household Size | # Housing Units | % Housing Units |
| 1-Person Household | 802 | 32.1% |
| 2-Person Household | 756 | 30.3% |
| 3-Person Household | 493 | 19.7% |
| 4+ Person Household | 447 | 17.9% |
| Total Housing Units | 2,498 | 100.0% |
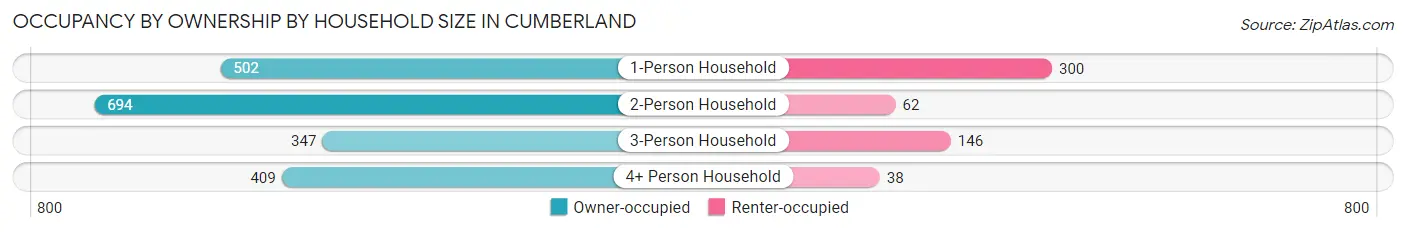
Occupancy by Ownership by Household Size in Cumberland
| Household Size | Owner-occupied | Renter-occupied |
| 1-Person Household | 502 (62.6%) | 300 (37.4%) |
| 2-Person Household | 694 (91.8%) | 62 (8.2%) |
| 3-Person Household | 347 (70.4%) | 146 (29.6%) |
| 4+ Person Household | 409 (91.5%) | 38 (8.5%) |
| Total Housing Units | 1,952 (78.1%) | 546 (21.9%) |
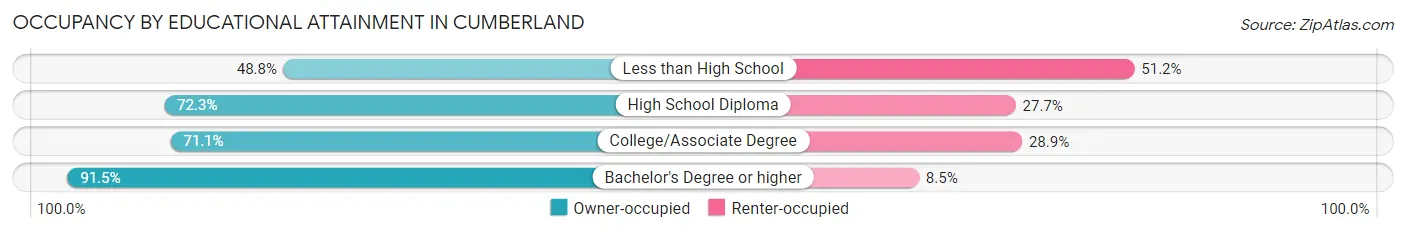
Occupancy by Educational Attainment in Cumberland
| Household Size | Owner-occupied | Renter-occupied |
| Less than High School | 41 (48.8%) | 43 (51.2%) |
| High School Diploma | 387 (72.3%) | 148 (27.7%) |
| College/Associate Degree | 681 (71.1%) | 277 (28.9%) |
| Bachelor's Degree or higher | 843 (91.5%) | 78 (8.5%) |
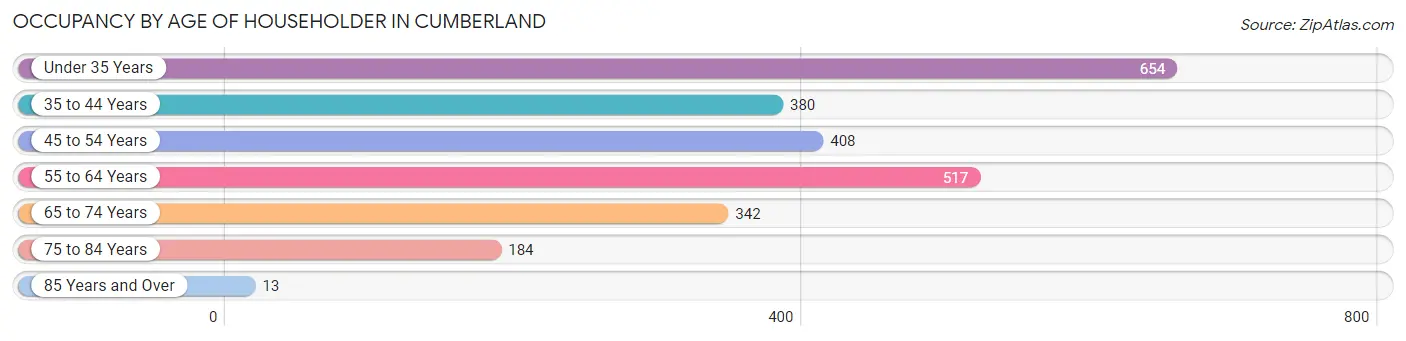
Occupancy by Age of Householder in Cumberland
| Age Bracket | # Households | % Households |
| Under 35 Years | 654 | 26.2% |
| 35 to 44 Years | 380 | 15.2% |
| 45 to 54 Years | 408 | 16.3% |
| 55 to 64 Years | 517 | 20.7% |
| 65 to 74 Years | 342 | 13.7% |
| 75 to 84 Years | 184 | 7.4% |
| 85 Years and Over | 13 | 0.5% |
| Total | 2,498 | 100.0% |
Housing Finances in Cumberland
Median Income by Occupancy in Cumberland
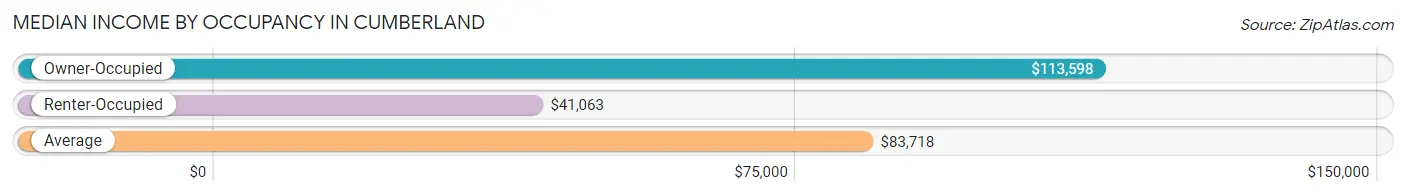
| Occupancy Type | # Households | Median Income |
| Owner-Occupied | 1,952 (78.1%) | $113,598 |
| Renter-Occupied | 546 (21.9%) | $41,063 |
| Average | 2,498 (100.0%) | $83,718 |
Occupancy by Householder Income Bracket in Cumberland
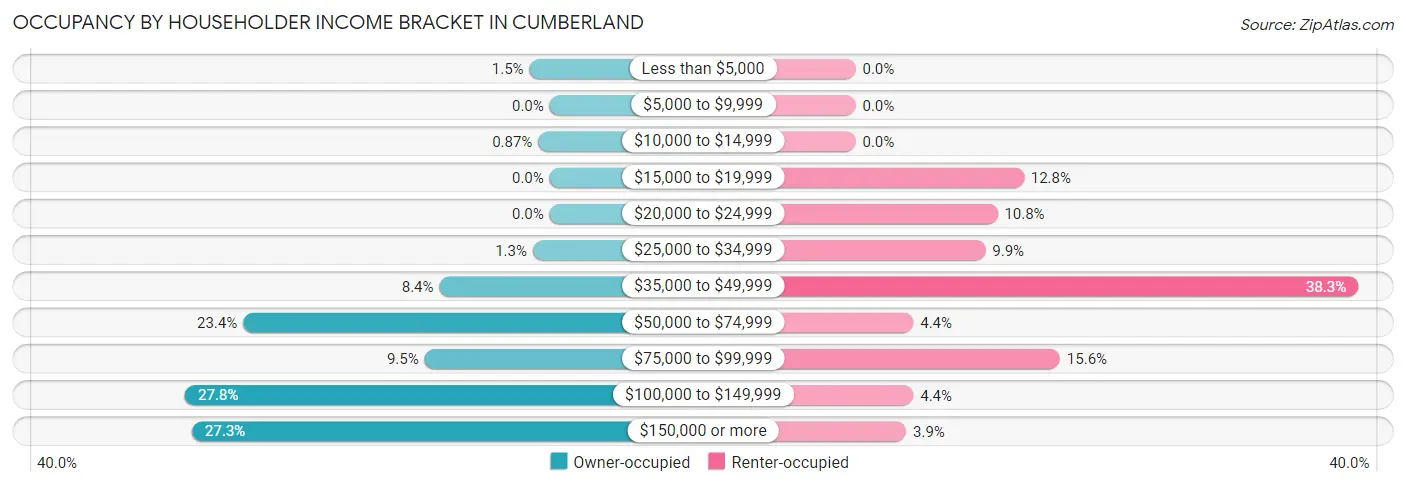
| Income Bracket | Owner-occupied | Renter-occupied |
| Less than $5,000 | 30 (1.5%) | 0 (0.0%) |
| $5,000 to $9,999 | 0 (0.0%) | 0 (0.0%) |
| $10,000 to $14,999 | 17 (0.9%) | 0 (0.0%) |
| $15,000 to $19,999 | 0 (0.0%) | 70 (12.8%) |
| $20,000 to $24,999 | 0 (0.0%) | 59 (10.8%) |
| $25,000 to $34,999 | 25 (1.3%) | 54 (9.9%) |
| $35,000 to $49,999 | 164 (8.4%) | 209 (38.3%) |
| $50,000 to $74,999 | 456 (23.4%) | 24 (4.4%) |
| $75,000 to $99,999 | 186 (9.5%) | 85 (15.6%) |
| $100,000 to $149,999 | 542 (27.8%) | 24 (4.4%) |
| $150,000 or more | 532 (27.3%) | 21 (3.8%) |
| Total | 1,952 (100.0%) | 546 (100.0%) |
Monthly Housing Cost Tiers in Cumberland
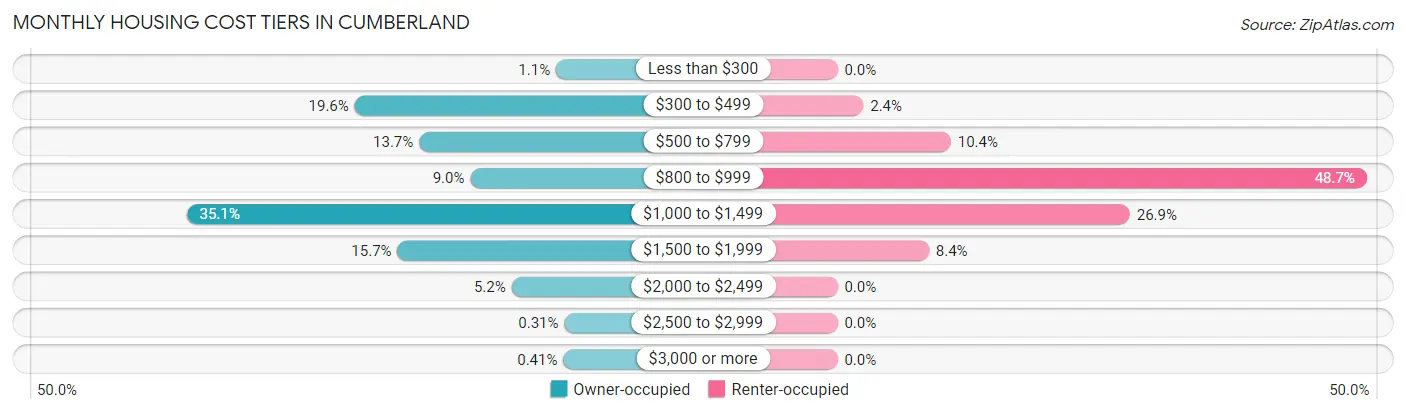
| Monthly Cost | Owner-occupied | Renter-occupied |
| Less than $300 | 21 (1.1%) | 0 (0.0%) |
| $300 to $499 | 383 (19.6%) | 13 (2.4%) |
| $500 to $799 | 267 (13.7%) | 57 (10.4%) |
| $800 to $999 | 175 (9.0%) | 266 (48.7%) |
| $1,000 to $1,499 | 685 (35.1%) | 147 (26.9%) |
| $1,500 to $1,999 | 306 (15.7%) | 46 (8.4%) |
| $2,000 to $2,499 | 101 (5.2%) | 0 (0.0%) |
| $2,500 to $2,999 | 6 (0.3%) | 0 (0.0%) |
| $3,000 or more | 8 (0.4%) | 0 (0.0%) |
| Total | 1,952 (100.0%) | 546 (100.0%) |
Physical Housing Characteristics in Cumberland
Housing Structures in Cumberland
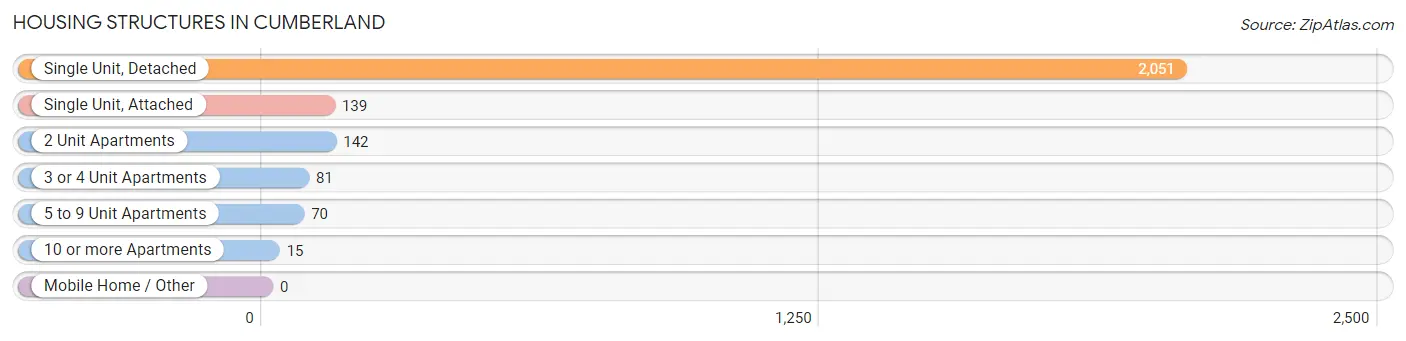
| Structure Type | # Housing Units | % Housing Units |
| Single Unit, Detached | 2,051 | 82.1% |
| Single Unit, Attached | 139 | 5.6% |
| 2 Unit Apartments | 142 | 5.7% |
| 3 or 4 Unit Apartments | 81 | 3.2% |
| 5 to 9 Unit Apartments | 70 | 2.8% |
| 10 or more Apartments | 15 | 0.6% |
| Mobile Home / Other | 0 | 0.0% |
| Total | 2,498 | 100.0% |
Housing Structures by Occupancy in Cumberland
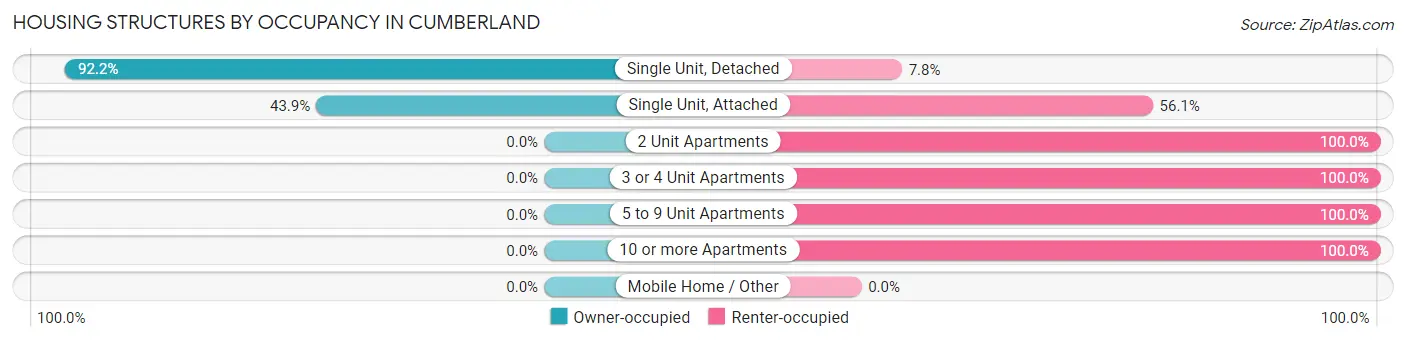
| Structure Type | Owner-occupied | Renter-occupied |
| Single Unit, Detached | 1,891 (92.2%) | 160 (7.8%) |
| Single Unit, Attached | 61 (43.9%) | 78 (56.1%) |
| 2 Unit Apartments | 0 (0.0%) | 142 (100.0%) |
| 3 or 4 Unit Apartments | 0 (0.0%) | 81 (100.0%) |
| 5 to 9 Unit Apartments | 0 (0.0%) | 70 (100.0%) |
| 10 or more Apartments | 0 (0.0%) | 15 (100.0%) |
| Mobile Home / Other | 0 (0.0%) | 0 (0.0%) |
| Total | 1,952 (78.1%) | 546 (21.9%) |
Housing Structures by Number of Rooms in Cumberland
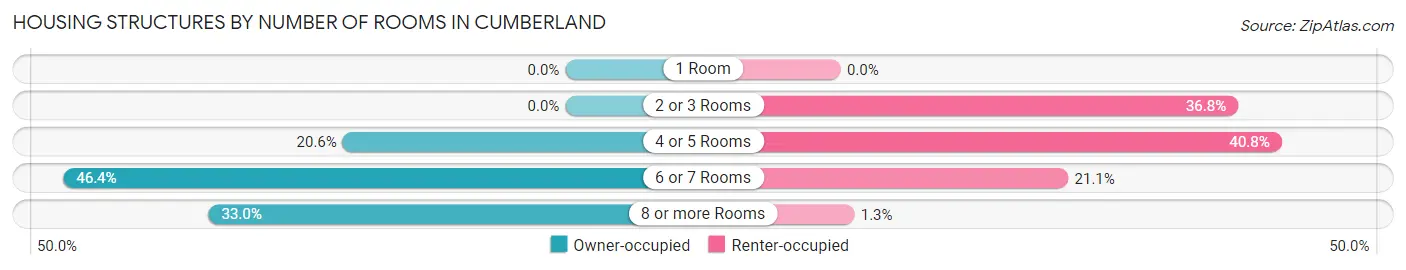
| Number of Rooms | Owner-occupied | Renter-occupied |
| 1 Room | 0 (0.0%) | 0 (0.0%) |
| 2 or 3 Rooms | 0 (0.0%) | 201 (36.8%) |
| 4 or 5 Rooms | 402 (20.6%) | 223 (40.8%) |
| 6 or 7 Rooms | 906 (46.4%) | 115 (21.1%) |
| 8 or more Rooms | 644 (33.0%) | 7 (1.3%) |
| Total | 1,952 (100.0%) | 546 (100.0%) |
Housing Structure by Heating Type in Cumberland
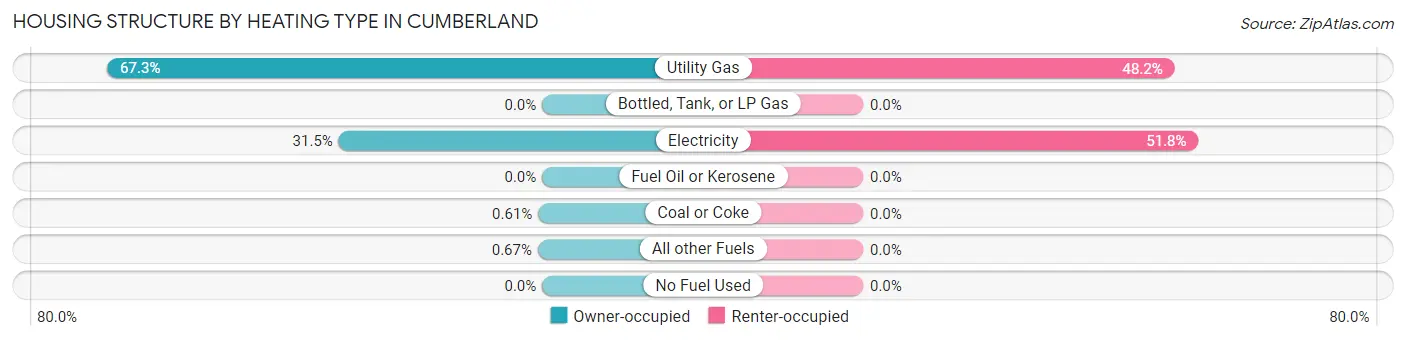
| Heating Type | Owner-occupied | Renter-occupied |
| Utility Gas | 1,313 (67.3%) | 263 (48.2%) |
| Bottled, Tank, or LP Gas | 0 (0.0%) | 0 (0.0%) |
| Electricity | 614 (31.5%) | 283 (51.8%) |
| Fuel Oil or Kerosene | 0 (0.0%) | 0 (0.0%) |
| Coal or Coke | 12 (0.6%) | 0 (0.0%) |
| All other Fuels | 13 (0.7%) | 0 (0.0%) |
| No Fuel Used | 0 (0.0%) | 0 (0.0%) |
| Total | 1,952 (100.0%) | 546 (100.0%) |
Household Vehicle Usage in Cumberland
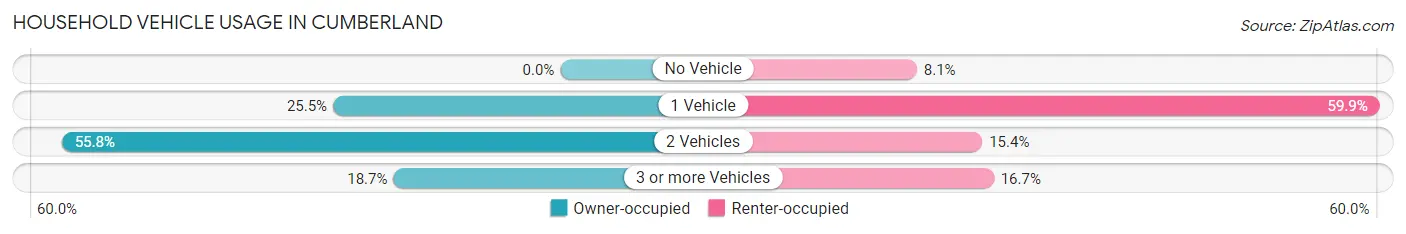
| Vehicles per Household | Owner-occupied | Renter-occupied |
| No Vehicle | 0 (0.0%) | 44 (8.1%) |
| 1 Vehicle | 497 (25.5%) | 327 (59.9%) |
| 2 Vehicles | 1,090 (55.8%) | 84 (15.4%) |
| 3 or more Vehicles | 365 (18.7%) | 91 (16.7%) |
| Total | 1,952 (100.0%) | 546 (100.0%) |
Real Estate & Mortgages in Cumberland
Real Estate and Mortgage Overview in Cumberland
| Characteristic | Without Mortgage | With Mortgage |
| Housing Units | 745 | 1,207 |
| Median Property Value | $220,500 | $178,400 |
| Median Household Income | $64,248 | $407 |
| Monthly Housing Costs | $489 | $8 |
| Real Estate Taxes | $2,084 | $40 |
Property Value by Mortgage Status in Cumberland
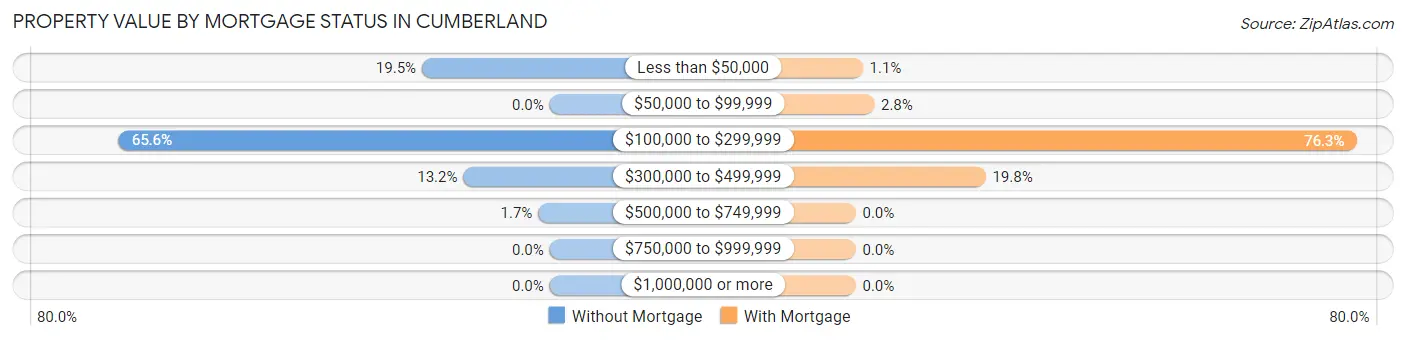
| Property Value | Without Mortgage | With Mortgage |
| Less than $50,000 | 145 (19.5%) | 13 (1.1%) |
| $50,000 to $99,999 | 0 (0.0%) | 34 (2.8%) |
| $100,000 to $299,999 | 489 (65.6%) | 921 (76.3%) |
| $300,000 to $499,999 | 98 (13.2%) | 239 (19.8%) |
| $500,000 to $749,999 | 13 (1.7%) | 0 (0.0%) |
| $750,000 to $999,999 | 0 (0.0%) | 0 (0.0%) |
| $1,000,000 or more | 0 (0.0%) | 0 (0.0%) |
| Total | 745 (100.0%) | 1,207 (100.0%) |
Household Income by Mortgage Status in Cumberland
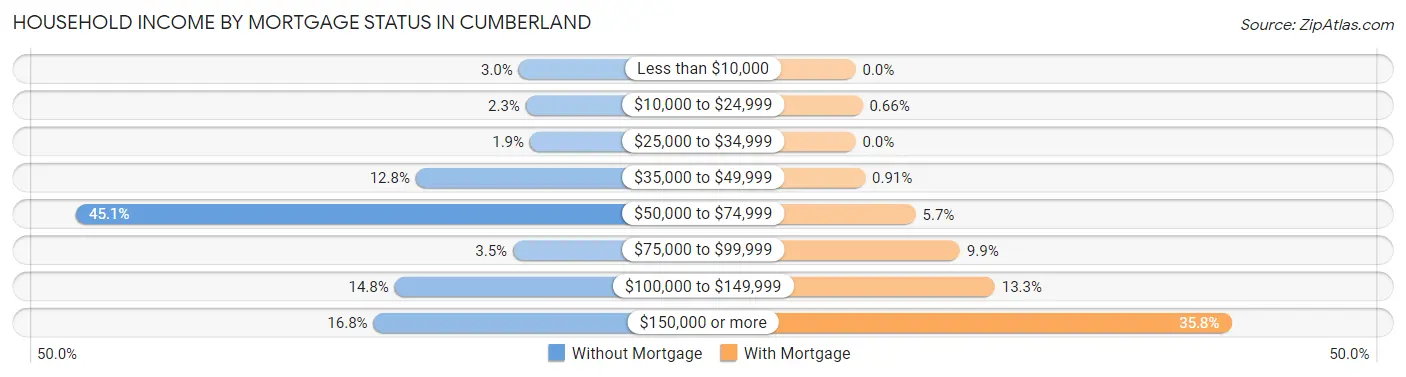
| Household Income | Without Mortgage | With Mortgage |
| Less than $10,000 | 22 (2.9%) | 0 (0.0%) |
| $10,000 to $24,999 | 17 (2.3%) | 8 (0.7%) |
| $25,000 to $34,999 | 14 (1.9%) | 0 (0.0%) |
| $35,000 to $49,999 | 95 (12.8%) | 11 (0.9%) |
| $50,000 to $74,999 | 336 (45.1%) | 69 (5.7%) |
| $75,000 to $99,999 | 26 (3.5%) | 120 (9.9%) |
| $100,000 to $149,999 | 110 (14.8%) | 160 (13.3%) |
| $150,000 or more | 125 (16.8%) | 432 (35.8%) |
| Total | 745 (100.0%) | 1,207 (100.0%) |
Property Value to Household Income Ratio in Cumberland
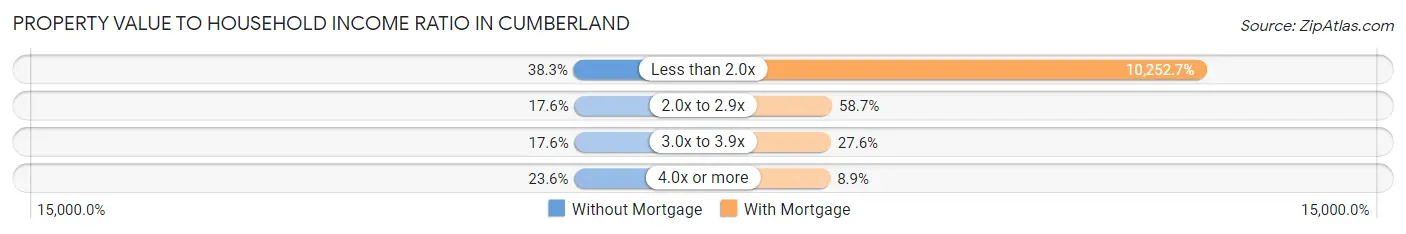
| Value-to-Income Ratio | Without Mortgage | With Mortgage |
| Less than 2.0x | 285 (38.3%) | 123,750 (10,252.7%) |
| 2.0x to 2.9x | 131 (17.6%) | 708 (58.7%) |
| 3.0x to 3.9x | 131 (17.6%) | 333 (27.6%) |
| 4.0x or more | 176 (23.6%) | 107 (8.9%) |
| Total | 745 (100.0%) | 1,207 (100.0%) |
Real Estate Taxes by Mortgage Status in Cumberland
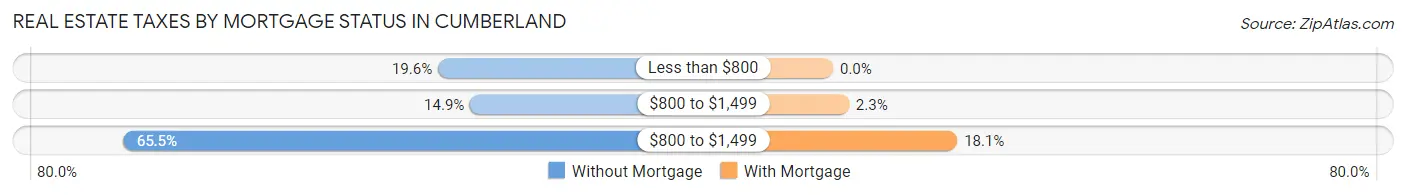
| Property Taxes | Without Mortgage | With Mortgage |
| Less than $800 | 146 (19.6%) | 0 (0.0%) |
| $800 to $1,499 | 111 (14.9%) | 28 (2.3%) |
| $800 to $1,499 | 488 (65.5%) | 219 (18.1%) |
| Total | 745 (100.0%) | 1,207 (100.0%) |
Health & Disability in Cumberland
Health Insurance Coverage by Age in Cumberland
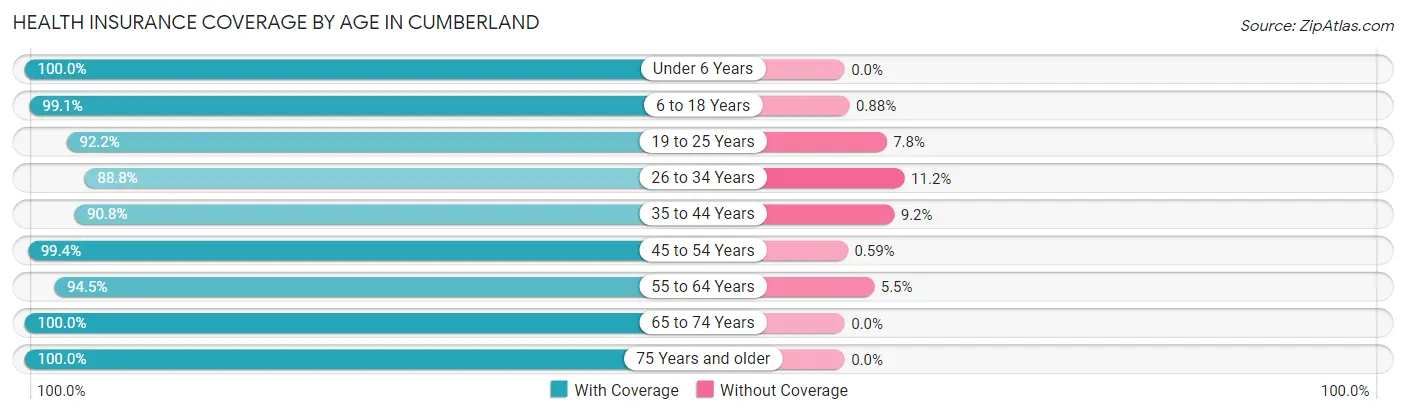
| Age Bracket | With Coverage | Without Coverage |
| Under 6 Years | 193 (100.0%) | 0 (0.0%) |
| 6 to 18 Years | 1,244 (99.1%) | 11 (0.9%) |
| 19 to 25 Years | 295 (92.2%) | 25 (7.8%) |
| 26 to 34 Years | 1,083 (88.8%) | 136 (11.2%) |
| 35 to 44 Years | 797 (90.8%) | 81 (9.2%) |
| 45 to 54 Years | 675 (99.4%) | 4 (0.6%) |
| 55 to 64 Years | 636 (94.5%) | 37 (5.5%) |
| 65 to 74 Years | 473 (100.0%) | 0 (0.0%) |
| 75 Years and older | 288 (100.0%) | 0 (0.0%) |
| Total | 5,684 (95.1%) | 294 (4.9%) |
Health Insurance Coverage by Citizenship Status in Cumberland
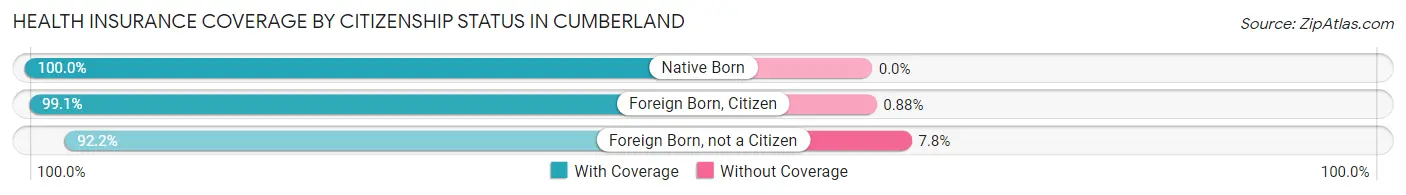
| Citizenship Status | With Coverage | Without Coverage |
| Native Born | 193 (100.0%) | 0 (0.0%) |
| Foreign Born, Citizen | 1,244 (99.1%) | 11 (0.9%) |
| Foreign Born, not a Citizen | 295 (92.2%) | 25 (7.8%) |
Health Insurance Coverage by Household Income in Cumberland
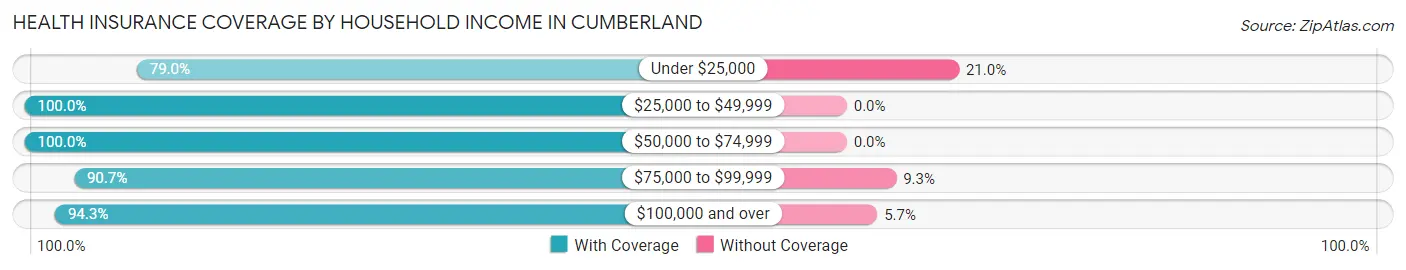
| Household Income | With Coverage | Without Coverage |
| Under $25,000 | 139 (79.0%) | 37 (21.0%) |
| $25,000 to $49,999 | 1,062 (100.0%) | 0 (0.0%) |
| $50,000 to $74,999 | 729 (100.0%) | 0 (0.0%) |
| $75,000 to $99,999 | 745 (90.7%) | 76 (9.3%) |
| $100,000 and over | 2,992 (94.3%) | 181 (5.7%) |
Public vs Private Health Insurance Coverage by Age in Cumberland
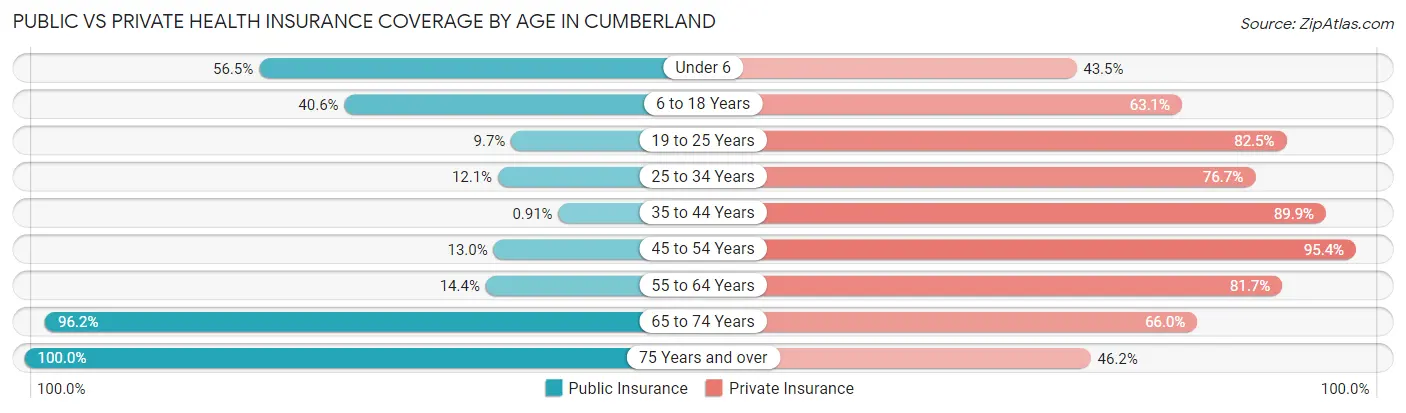
| Age Bracket | Public Insurance | Private Insurance |
| Under 6 | 109 (56.5%) | 84 (43.5%) |
| 6 to 18 Years | 510 (40.6%) | 792 (63.1%) |
| 19 to 25 Years | 31 (9.7%) | 264 (82.5%) |
| 25 to 34 Years | 148 (12.1%) | 935 (76.7%) |
| 35 to 44 Years | 8 (0.9%) | 789 (89.9%) |
| 45 to 54 Years | 88 (13.0%) | 648 (95.4%) |
| 55 to 64 Years | 97 (14.4%) | 550 (81.7%) |
| 65 to 74 Years | 455 (96.2%) | 312 (66.0%) |
| 75 Years and over | 288 (100.0%) | 133 (46.2%) |
| Total | 1,734 (29.0%) | 4,507 (75.4%) |
Disability Status by Sex by Age in Cumberland
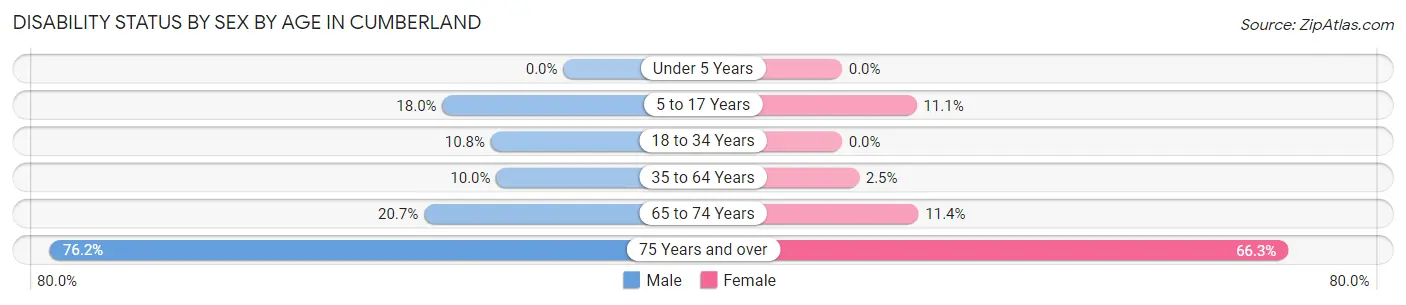
| Age Bracket | Male | Female |
| Under 5 Years | 0 (0.0%) | 0 (0.0%) |
| 5 to 17 Years | 127 (18.0%) | 68 (11.1%) |
| 18 to 34 Years | 64 (10.8%) | 0 (0.0%) |
| 35 to 64 Years | 123 (10.0%) | 25 (2.5%) |
| 65 to 74 Years | 36 (20.7%) | 34 (11.4%) |
| 75 Years and over | 154 (76.2%) | 57 (66.3%) |
Disability Class by Sex by Age in Cumberland
Disability Class: Hearing Difficulty
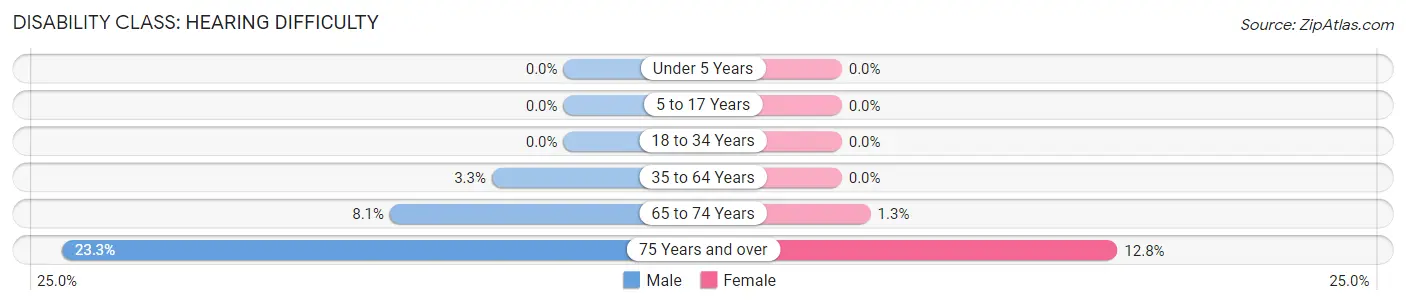
| Age Bracket | Male | Female |
| Under 5 Years | 0 (0.0%) | 0 (0.0%) |
| 5 to 17 Years | 0 (0.0%) | 0 (0.0%) |
| 18 to 34 Years | 0 (0.0%) | 0 (0.0%) |
| 35 to 64 Years | 41 (3.3%) | 0 (0.0%) |
| 65 to 74 Years | 14 (8.1%) | 4 (1.3%) |
| 75 Years and over | 47 (23.3%) | 11 (12.8%) |
Disability Class: Vision Difficulty
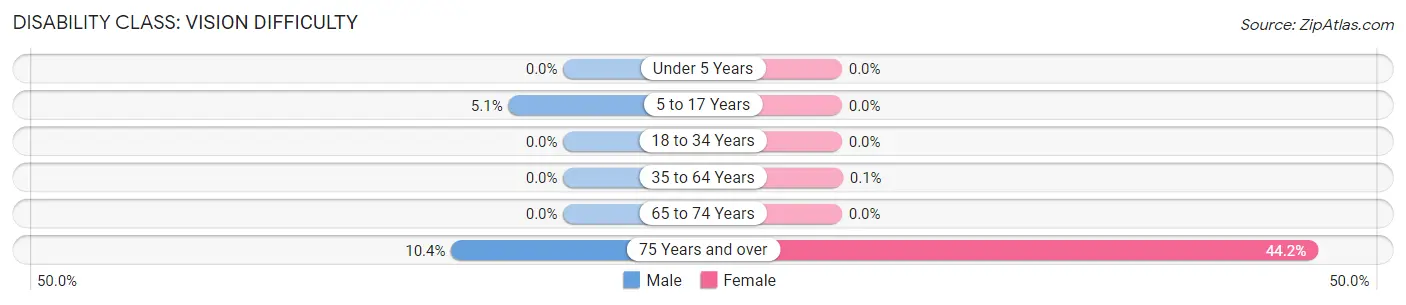
| Age Bracket | Male | Female |
| Under 5 Years | 0 (0.0%) | 0 (0.0%) |
| 5 to 17 Years | 36 (5.1%) | 0 (0.0%) |
| 18 to 34 Years | 0 (0.0%) | 0 (0.0%) |
| 35 to 64 Years | 0 (0.0%) | 1 (0.1%) |
| 65 to 74 Years | 0 (0.0%) | 0 (0.0%) |
| 75 Years and over | 21 (10.4%) | 38 (44.2%) |
Disability Class: Cognitive Difficulty
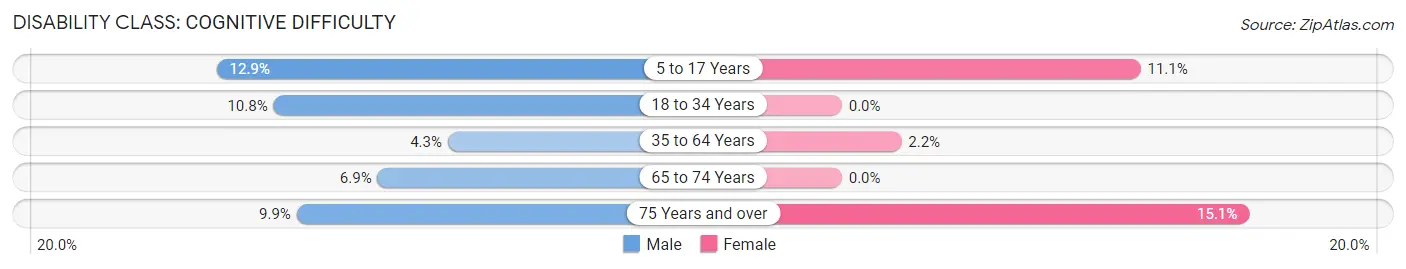
| Age Bracket | Male | Female |
| 5 to 17 Years | 91 (12.9%) | 68 (11.1%) |
| 18 to 34 Years | 64 (10.8%) | 0 (0.0%) |
| 35 to 64 Years | 53 (4.3%) | 22 (2.2%) |
| 65 to 74 Years | 12 (6.9%) | 0 (0.0%) |
| 75 Years and over | 20 (9.9%) | 13 (15.1%) |
Disability Class: Ambulatory Difficulty
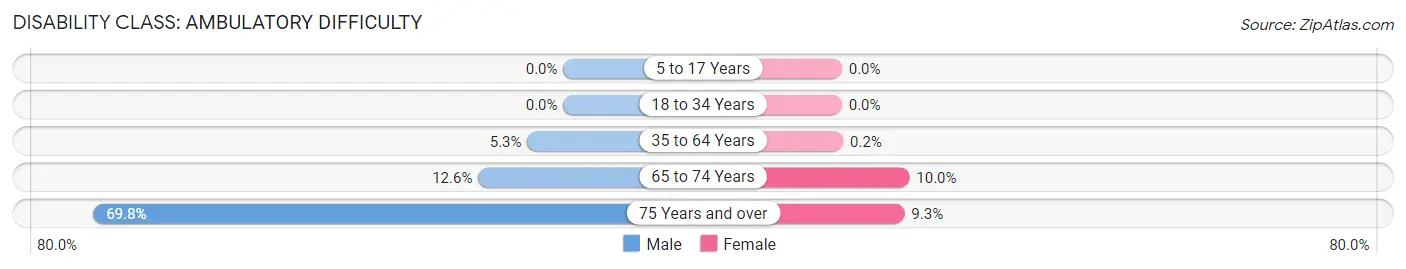
| Age Bracket | Male | Female |
| 5 to 17 Years | 0 (0.0%) | 0 (0.0%) |
| 18 to 34 Years | 0 (0.0%) | 0 (0.0%) |
| 35 to 64 Years | 66 (5.3%) | 2 (0.2%) |
| 65 to 74 Years | 22 (12.6%) | 30 (10.0%) |
| 75 Years and over | 141 (69.8%) | 8 (9.3%) |
Disability Class: Self-Care Difficulty
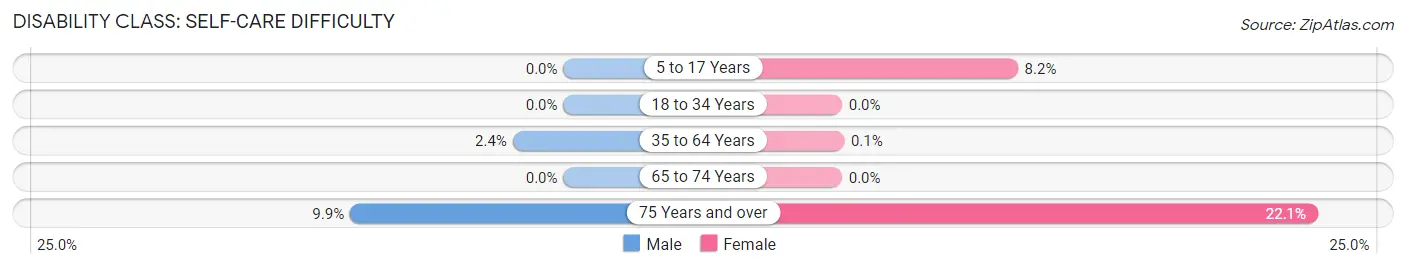
| Age Bracket | Male | Female |
| 5 to 17 Years | 0 (0.0%) | 50 (8.2%) |
| 18 to 34 Years | 0 (0.0%) | 0 (0.0%) |
| 35 to 64 Years | 29 (2.4%) | 1 (0.1%) |
| 65 to 74 Years | 0 (0.0%) | 0 (0.0%) |
| 75 Years and over | 20 (9.9%) | 19 (22.1%) |
Technology Access in Cumberland
Computing Device Access in Cumberland
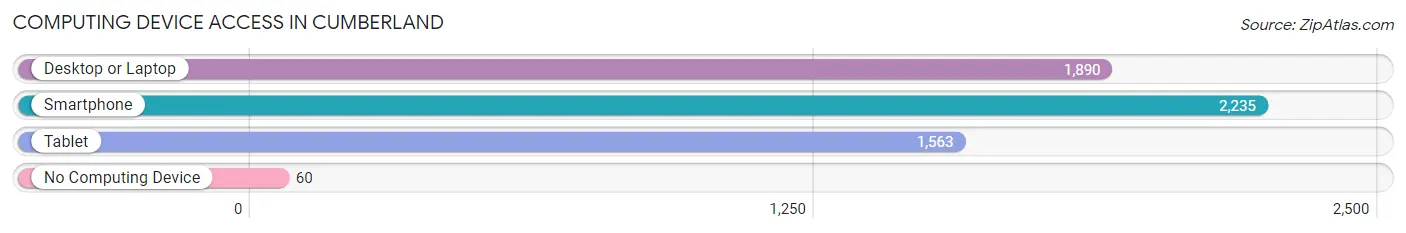
| Device Type | # Households | % Households |
| Desktop or Laptop | 1,890 | 75.7% |
| Smartphone | 2,235 | 89.5% |
| Tablet | 1,563 | 62.6% |
| No Computing Device | 60 | 2.4% |
| Total | 2,498 | 100.0% |
Internet Access in Cumberland
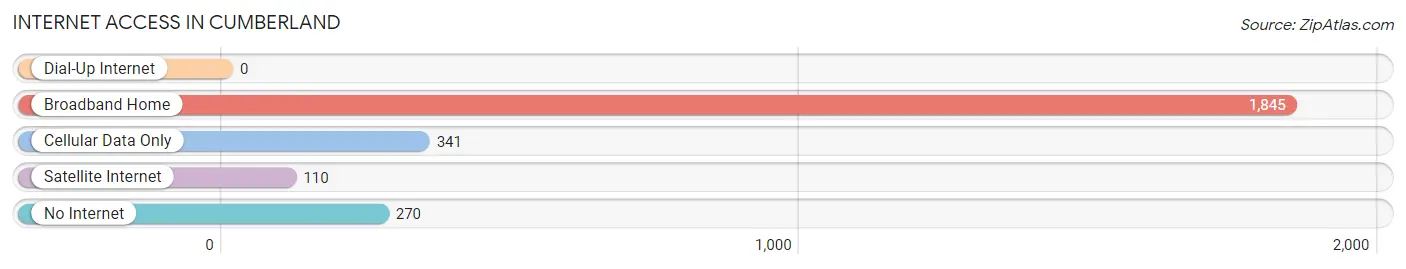
| Internet Type | # Households | % Households |
| Dial-Up Internet | 0 | 0.0% |
| Broadband Home | 1,845 | 73.9% |
| Cellular Data Only | 341 | 13.7% |
| Satellite Internet | 110 | 4.4% |
| No Internet | 270 | 10.8% |
| Total | 2,498 | 100.0% |
Cumberland Summary
Cumberland, Indiana is a small town located in Marion County, Indiana, United States. It is situated on the east side of Indianapolis, the state capital. The town was founded in 1851 and has a population of approximately 8,000 people.
History
Cumberland was founded in 1851 by a group of settlers from Cumberland County, Pennsylvania. The town was named after the county in Pennsylvania. The first settlers were mostly farmers and the town was a rural community for many years. In the late 19th century, the town began to grow and develop as a result of the railroad and the development of the Indianapolis and Cincinnati Railroad. The railroad brought new businesses and industries to the area, and the town began to grow and prosper.
In the early 20th century, Cumberland was a thriving community with a variety of businesses and industries. The town was home to a number of factories, including a flour mill, a furniture factory, a canning factory, and a brickyard. The town also had a number of stores, including a grocery store, a hardware store, and a drug store.
In the 1950s, the town began to decline as the railroad industry declined and the factories closed. The town was also affected by the decline of the steel industry in the area. In the late 20th century, the town began to experience a resurgence as new businesses and industries moved into the area.
Geography
Cumberland is located in Marion County, Indiana, on the east side of Indianapolis. The town is situated on the White River, which flows through the town. The town is located in a rural area and is surrounded by farmland. The town is located approximately 20 miles from downtown Indianapolis.
Economy
Cumberland is a small town with a population of approximately 8,000 people. The town has a variety of businesses and industries, including manufacturing, retail, and services. The town is home to a number of small businesses, including restaurants, shops, and other services. The town also has a number of larger businesses, including a hospital, a bank, and a grocery store.
Demographics
As of the 2010 census, the population of Cumberland was 8,000 people. The town has a population that is predominantly white, with a small percentage of African Americans, Hispanics, and Asians. The median household income in the town is $45,000, and the median home value is $150,000. The town has a high school graduation rate of 85%, and the unemployment rate is 4.5%.
Common Questions
What is Per Capita Income in Cumberland?
Per Capita income in Cumberland is $43,766.
What is the Median Family Income in Cumberland?
Median Family Income in Cumberland is $117,167.
What is the Median Household income in Cumberland?
Median Household Income in Cumberland is $83,718.
What is Income or Wage Gap in Cumberland?
Income or Wage Gap in Cumberland is 15.5%.
Women in Cumberland earn 84.5 cents for every dollar earned by a man.
What is Inequality or Gini Index in Cumberland?
Inequality or Gini Index in Cumberland is 0.36.
What is the Total Population of Cumberland?
Total Population of Cumberland is 5,991.
What is the Total Male Population of Cumberland?
Total Male Population of Cumberland is 3,008.
What is the Total Female Population of Cumberland?
Total Female Population of Cumberland is 2,983.
What is the Ratio of Males per 100 Females in Cumberland?
There are 100.84 Males per 100 Females in Cumberland.
What is the Ratio of Females per 100 Males in Cumberland?
There are 99.17 Females per 100 Males in Cumberland.
What is the Median Population Age in Cumberland?
Median Population Age in Cumberland is 34.9 Years.
What is the Average Family Size in Cumberland
Average Family Size in Cumberland is 3.1 People.
What is the Average Household Size in Cumberland
Average Household Size in Cumberland is 2.4 People.
How Large is the Labor Force in Cumberland?
There are 3,711 People in the Labor Forcein in Cumberland.
What is the Percentage of People in the Labor Force in Cumberland?
78.1% of People are in the Labor Force in Cumberland.
What is the Unemployment Rate in Cumberland?
Unemployment Rate in Cumberland is 3.1%.