Krugerville, TX Map & Demographics
Krugerville Map
Krugerville Overview
$50,048
PER CAPITA INCOME
$125,313
AVG FAMILY INCOME
$122,500
AVG HOUSEHOLD INCOME
51.2%
WAGE / INCOME GAP [ % ]
48.8¢/ $1
WAGE / INCOME GAP [ $ ]
0.34
INEQUALITY / GINI INDEX
2,024
TOTAL POPULATION
1,024
MALE POPULATION
1,000
FEMALE POPULATION
102.40
MALES / 100 FEMALES
97.66
FEMALES / 100 MALES
46.4
MEDIAN AGE
2.9
AVG FAMILY SIZE
2.7
AVG HOUSEHOLD SIZE
1,073
LABOR FORCE [ PEOPLE ]
64.0%
PERCENT IN LABOR FORCE
3.5%
UNEMPLOYMENT RATE
Krugerville Area Codes
Income in Krugerville
Income Overview in Krugerville
Per Capita Income in Krugerville is $50,048, while median incomes of families and households are $125,313 and $122,500 respectively.
| Characteristic | Number | Measure |
| Per Capita Income | 2,024 | $50,048 |
| Median Family Income | 661 | $125,313 |
| Mean Family Income | 661 | $141,313 |
| Median Household Income | 760 | $122,500 |
| Mean Household Income | 760 | $133,749 |
| Income Deficit | 661 | $0 |
| Wage / Income Gap (%) | 2,024 | 51.16% |
| Wage / Income Gap ($) | 2,024 | 48.84¢ per $1 |
| Gini / Inequality Index | 2,024 | 0.34 |
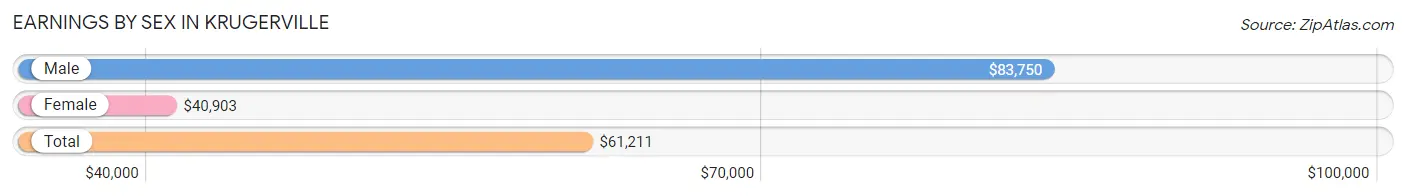
Earnings by Sex in Krugerville
Average Earnings in Krugerville are $61,211, $83,750 for men and $40,903 for women, a difference of 51.2%.
| Sex | Number | Average Earnings |
| Male | 596 (53.6%) | $83,750 |
| Female | 515 (46.4%) | $40,903 |
| Total | 1,111 (100.0%) | $61,211 |
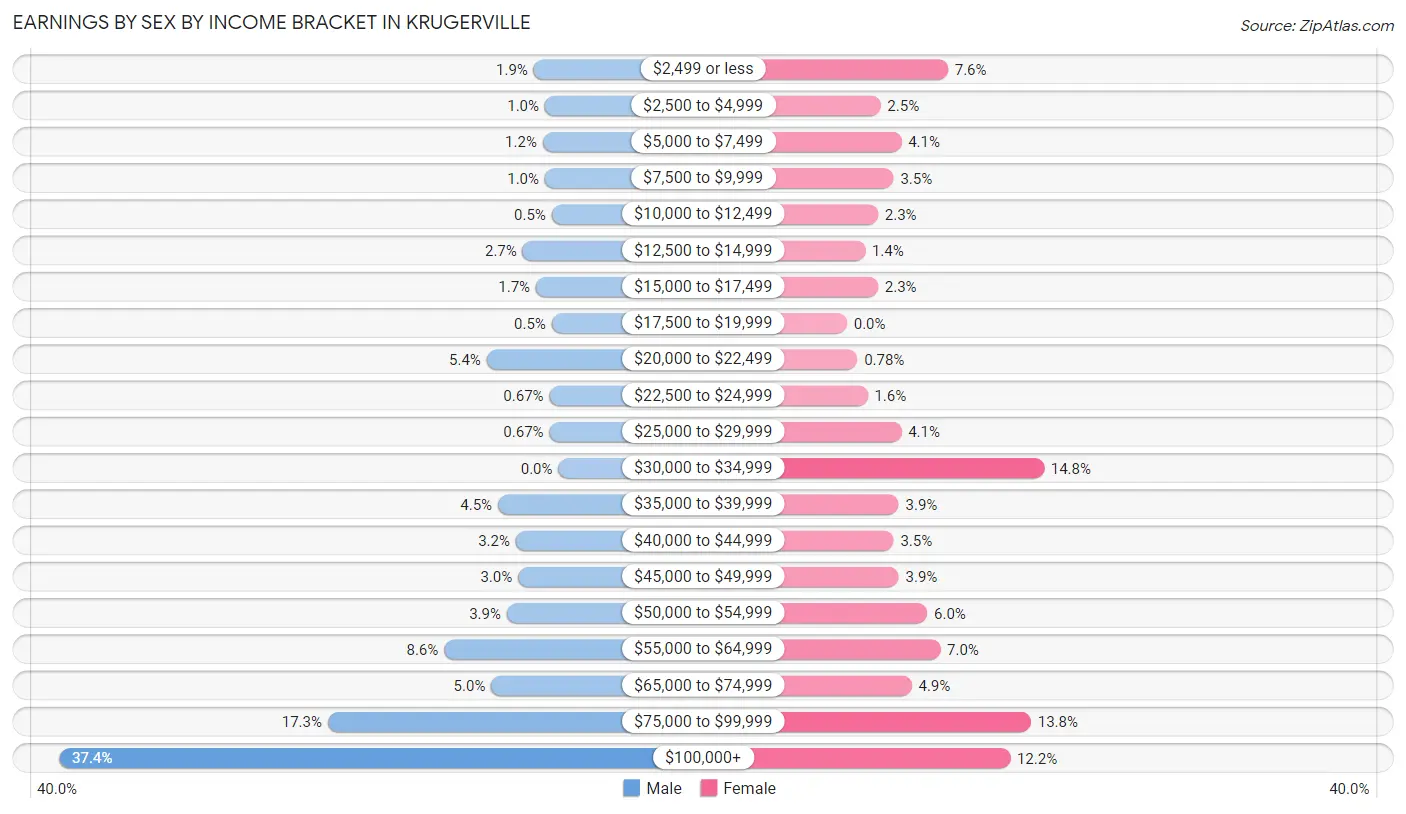
Earnings by Sex by Income Bracket in Krugerville
The most common earnings brackets in Krugerville are $100,000+ for men (223 | 37.4%) and $30,000 to $34,999 for women (76 | 14.8%).
| Income | Male | Female |
| $2,499 or less | 11 (1.8%) | 39 (7.6%) |
| $2,500 to $4,999 | 6 (1.0%) | 13 (2.5%) |
| $5,000 to $7,499 | 7 (1.2%) | 21 (4.1%) |
| $7,500 to $9,999 | 6 (1.0%) | 18 (3.5%) |
| $10,000 to $12,499 | 3 (0.5%) | 12 (2.3%) |
| $12,500 to $14,999 | 16 (2.7%) | 7 (1.4%) |
| $15,000 to $17,499 | 10 (1.7%) | 12 (2.3%) |
| $17,500 to $19,999 | 3 (0.5%) | 0 (0.0%) |
| $20,000 to $22,499 | 32 (5.4%) | 4 (0.8%) |
| $22,500 to $24,999 | 4 (0.7%) | 8 (1.5%) |
| $25,000 to $29,999 | 4 (0.7%) | 21 (4.1%) |
| $30,000 to $34,999 | 0 (0.0%) | 76 (14.8%) |
| $35,000 to $39,999 | 27 (4.5%) | 20 (3.9%) |
| $40,000 to $44,999 | 19 (3.2%) | 18 (3.5%) |
| $45,000 to $49,999 | 18 (3.0%) | 20 (3.9%) |
| $50,000 to $54,999 | 23 (3.9%) | 31 (6.0%) |
| $55,000 to $64,999 | 51 (8.6%) | 36 (7.0%) |
| $65,000 to $74,999 | 30 (5.0%) | 25 (4.9%) |
| $75,000 to $99,999 | 103 (17.3%) | 71 (13.8%) |
| $100,000+ | 223 (37.4%) | 63 (12.2%) |
| Total | 596 (100.0%) | 515 (100.0%) |
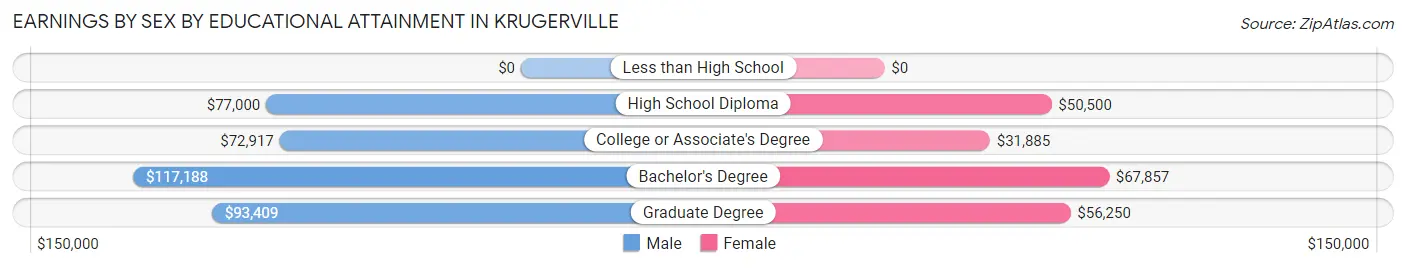
Earnings by Sex by Educational Attainment in Krugerville
Average earnings in Krugerville are $90,000 for men and $49,896 for women, a difference of 44.6%. Men with an educational attainment of bachelor's degree enjoy the highest average annual earnings of $117,188, while those with college or associate's degree education earn the least with $72,917. Women with an educational attainment of bachelor's degree earn the most with the average annual earnings of $67,857, while those with college or associate's degree education have the smallest earnings of $31,885.
| Educational Attainment | Male Income | Female Income |
| Less than High School | - | - |
| High School Diploma | $77,000 | $50,500 |
| College or Associate's Degree | $72,917 | $31,885 |
| Bachelor's Degree | $117,188 | $67,857 |
| Graduate Degree | $93,409 | $56,250 |
| Total | $90,000 | $49,896 |
Family Income in Krugerville
Family Income Brackets in Krugerville
According to the Krugerville family income data, there are 171 families falling into the $100,000 to $149,999 income range, which is the most common income bracket and makes up 25.9% of all families.
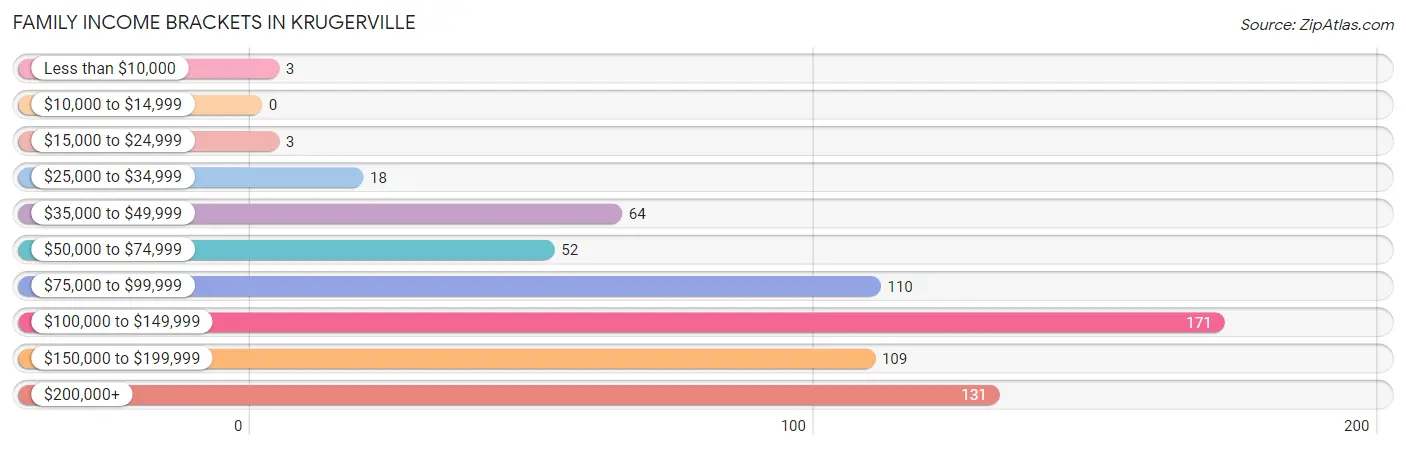
| Income Bracket | # Families | % Families |
| Less than $10,000 | 3 | 0.5% |
| $10,000 to $14,999 | 0 | 0.0% |
| $15,000 to $24,999 | 3 | 0.5% |
| $25,000 to $34,999 | 18 | 2.7% |
| $35,000 to $49,999 | 64 | 9.7% |
| $50,000 to $74,999 | 52 | 7.9% |
| $75,000 to $99,999 | 110 | 16.6% |
| $100,000 to $149,999 | 171 | 25.9% |
| $150,000 to $199,999 | 109 | 16.5% |
| $200,000+ | 131 | 19.8% |
Family Income by Famaliy Size in Krugerville
4-person families (104 | 15.7%) account for the highest median family income in Krugerville with $164,500 per family, while 2-person families (333 | 50.4%) have the highest median income of $51,094 per family member.
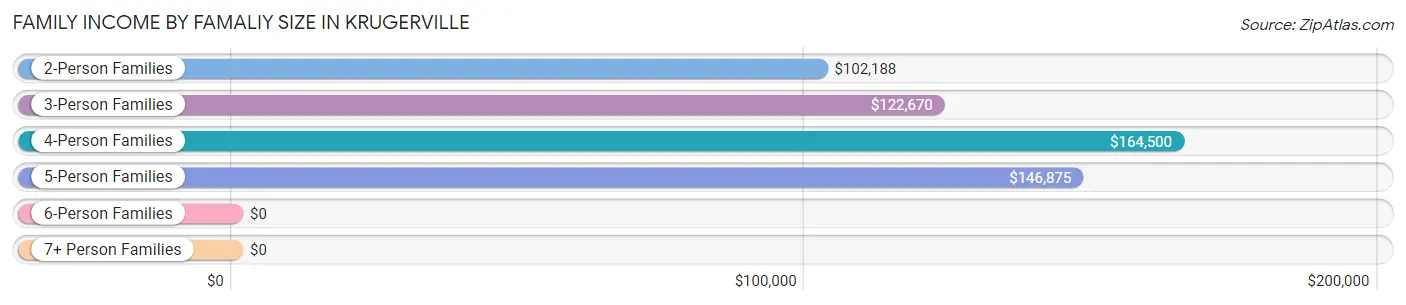
| Income Bracket | # Families | Median Income |
| 2-Person Families | 333 (50.4%) | $102,188 |
| 3-Person Families | 159 (24.0%) | $122,670 |
| 4-Person Families | 104 (15.7%) | $164,500 |
| 5-Person Families | 52 (7.9%) | $146,875 |
| 6-Person Families | 8 (1.2%) | $0 |
| 7+ Person Families | 5 (0.8%) | $0 |
| Total | 661 (100.0%) | $125,313 |
Family Income by Number of Earners in Krugerville
The median family income in Krugerville is $125,313, with families comprising 3+ earners (73) having the highest median family income of $188,281, while families with no earners (114) have the lowest median family income of $44,265, accounting for 11.0% and 17.2% of families, respectively.
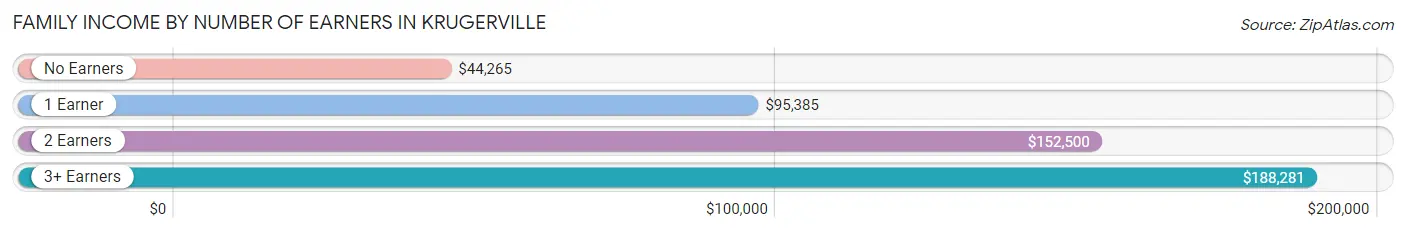
| Number of Earners | # Families | Median Income |
| No Earners | 114 (17.2%) | $44,265 |
| 1 Earner | 170 (25.7%) | $95,385 |
| 2 Earners | 304 (46.0%) | $152,500 |
| 3+ Earners | 73 (11.0%) | $188,281 |
| Total | 661 (100.0%) | $125,313 |
Household Income in Krugerville
Household Income Brackets in Krugerville
With 190 households falling in the category, the $100,000 to $149,999 income range is the most frequent in Krugerville, accounting for 25.0% of all households. In contrast, only 3 households (0.4%) fall into the less than $10,000 income bracket, making it the least populous group.
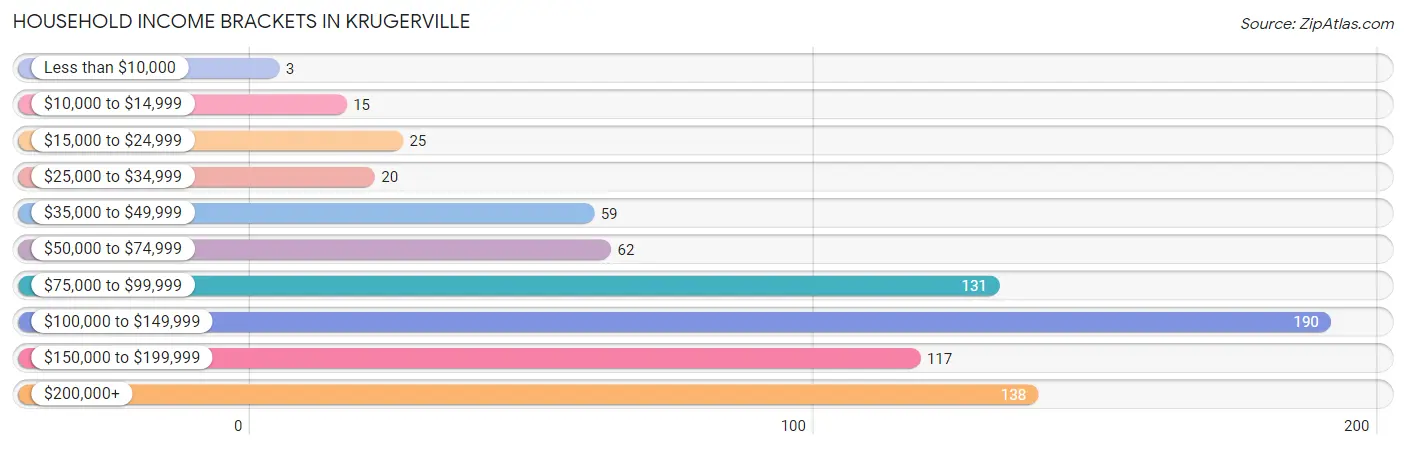
| Income Bracket | # Households | % Households |
| Less than $10,000 | 3 | 0.4% |
| $10,000 to $14,999 | 15 | 2.0% |
| $15,000 to $24,999 | 25 | 3.3% |
| $25,000 to $34,999 | 20 | 2.6% |
| $35,000 to $49,999 | 59 | 7.8% |
| $50,000 to $74,999 | 62 | 8.2% |
| $75,000 to $99,999 | 131 | 17.2% |
| $100,000 to $149,999 | 190 | 25.0% |
| $150,000 to $199,999 | 117 | 15.4% |
| $200,000+ | 138 | 18.2% |
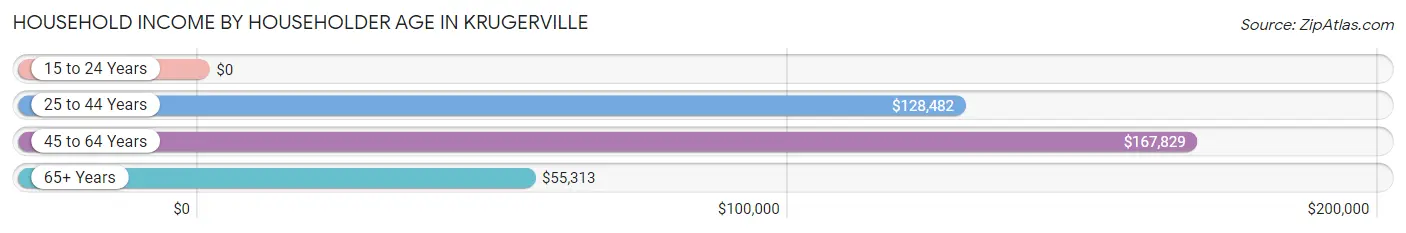
Household Income by Householder Age in Krugerville
The median household income in Krugerville is $122,500, with the highest median household income of $167,829 found in the 45 to 64 years age bracket for the primary householder. A total of 333 households (43.8%) fall into this category.
| Income Bracket | # Households | Median Income |
| 15 to 24 Years | 0 (0.0%) | $0 |
| 25 to 44 Years | 174 (22.9%) | $128,482 |
| 45 to 64 Years | 333 (43.8%) | $167,829 |
| 65+ Years | 253 (33.3%) | $55,313 |
| Total | 760 (100.0%) | $122,500 |
Poverty in Krugerville
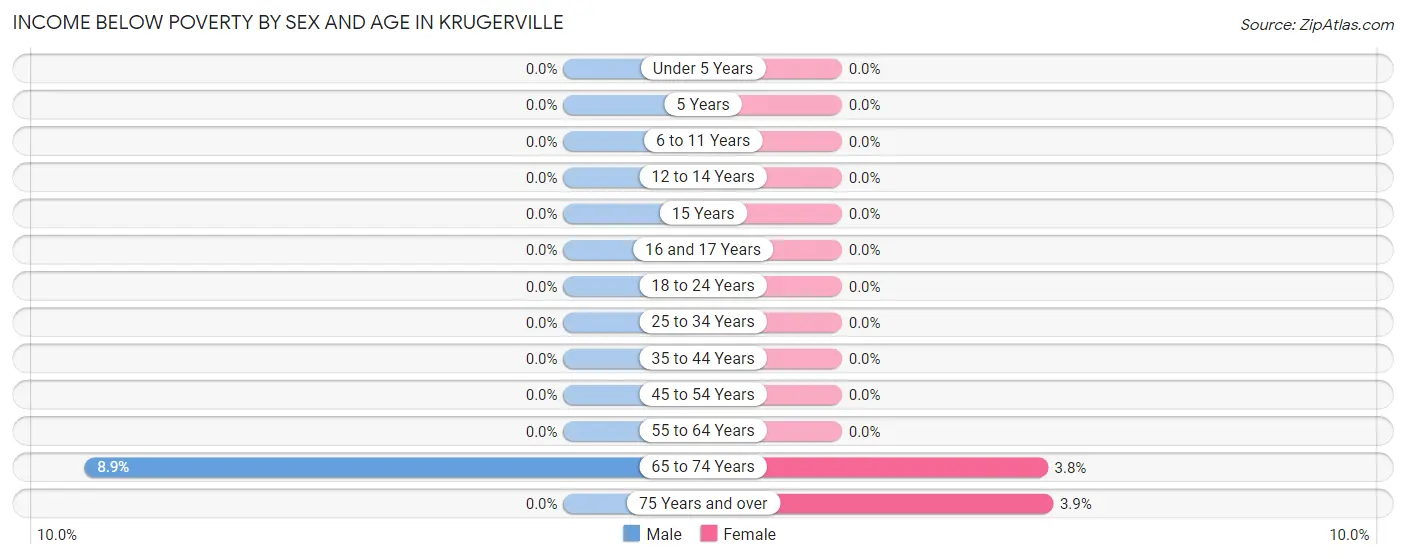
Income Below Poverty by Sex and Age in Krugerville
With 1.2% poverty level for males and 0.9% for females among the residents of Krugerville, 65 to 74 year old males and 75 year old and over females are the most vulnerable to poverty, with 12 males (8.9%) and 4 females (3.9%) in their respective age groups living below the poverty level.
| Age Bracket | Male | Female |
| Under 5 Years | 0 (0.0%) | 0 (0.0%) |
| 5 Years | 0 (0.0%) | 0 (0.0%) |
| 6 to 11 Years | 0 (0.0%) | 0 (0.0%) |
| 12 to 14 Years | 0 (0.0%) | 0 (0.0%) |
| 15 Years | 0 (0.0%) | 0 (0.0%) |
| 16 and 17 Years | 0 (0.0%) | 0 (0.0%) |
| 18 to 24 Years | 0 (0.0%) | 0 (0.0%) |
| 25 to 34 Years | 0 (0.0%) | 0 (0.0%) |
| 35 to 44 Years | 0 (0.0%) | 0 (0.0%) |
| 45 to 54 Years | 0 (0.0%) | 0 (0.0%) |
| 55 to 64 Years | 0 (0.0%) | 0 (0.0%) |
| 65 to 74 Years | 12 (8.9%) | 5 (3.8%) |
| 75 Years and over | 0 (0.0%) | 4 (3.9%) |
| Total | 12 (1.2%) | 9 (0.9%) |
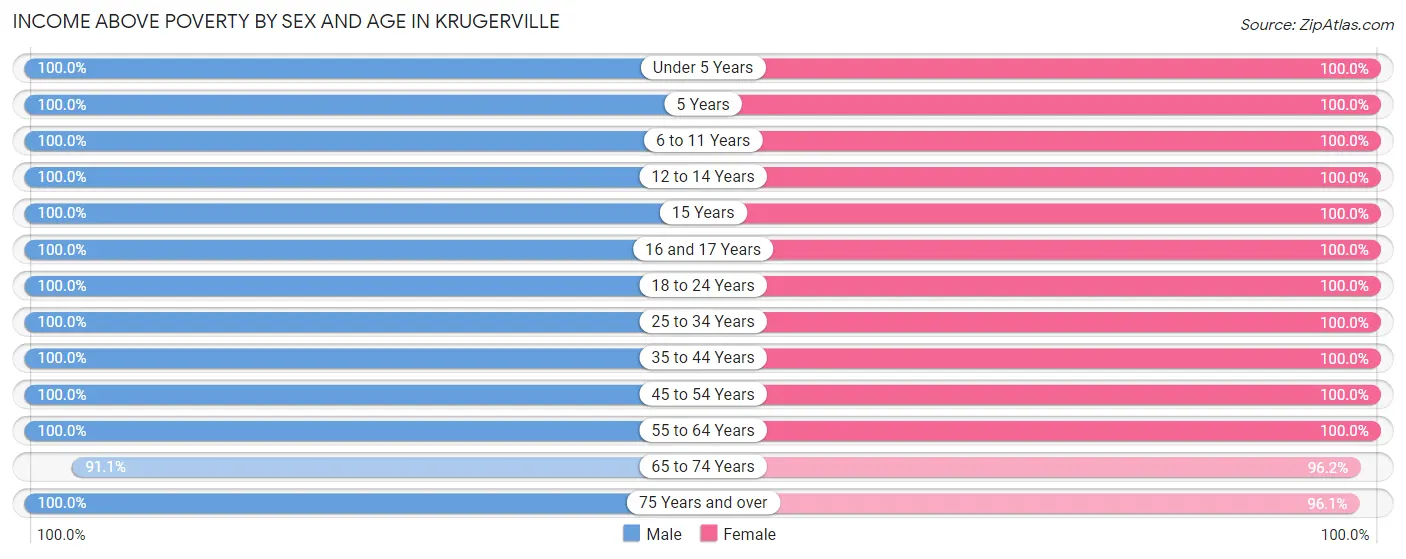
Income Above Poverty by Sex and Age in Krugerville
According to the poverty statistics in Krugerville, males aged under 5 years and females aged under 5 years are the age groups that are most secure financially, with 100.0% of males and 100.0% of females in these age groups living above the poverty line.
| Age Bracket | Male | Female |
| Under 5 Years | 19 (100.0%) | 10 (100.0%) |
| 5 Years | 23 (100.0%) | 22 (100.0%) |
| 6 to 11 Years | 65 (100.0%) | 66 (100.0%) |
| 12 to 14 Years | 61 (100.0%) | 57 (100.0%) |
| 15 Years | 5 (100.0%) | 19 (100.0%) |
| 16 and 17 Years | 23 (100.0%) | 27 (100.0%) |
| 18 to 24 Years | 100 (100.0%) | 50 (100.0%) |
| 25 to 34 Years | 69 (100.0%) | 69 (100.0%) |
| 35 to 44 Years | 109 (100.0%) | 158 (100.0%) |
| 45 to 54 Years | 188 (100.0%) | 192 (100.0%) |
| 55 to 64 Years | 156 (100.0%) | 97 (100.0%) |
| 65 to 74 Years | 123 (91.1%) | 126 (96.2%) |
| 75 Years and over | 71 (100.0%) | 98 (96.1%) |
| Total | 1,012 (98.8%) | 991 (99.1%) |
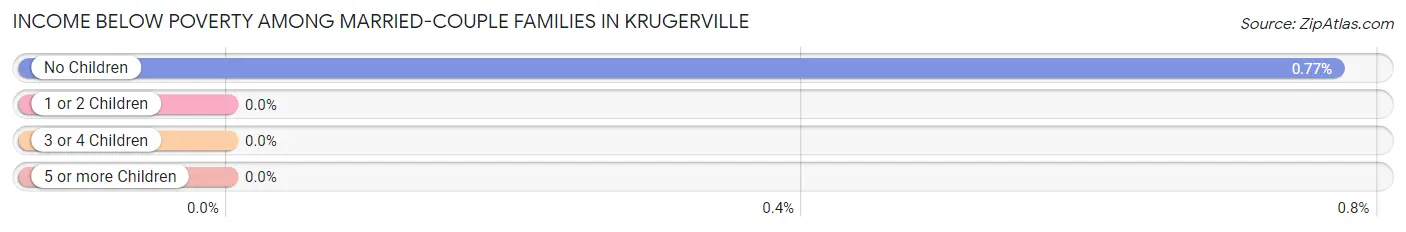
Income Below Poverty Among Married-Couple Families in Krugerville
The poverty statistics for married-couple families in Krugerville show that 0.5% or 3 of the total 594 families live below the poverty line. Families with no children have the highest poverty rate of 0.8%, comprising of 3 families. On the other hand, families with 1 or 2 children have the lowest poverty rate of 0.0%, which includes 0 families.
| Children | Above Poverty | Below Poverty |
| No Children | 386 (99.2%) | 3 (0.8%) |
| 1 or 2 Children | 159 (100.0%) | 0 (0.0%) |
| 3 or 4 Children | 41 (100.0%) | 0 (0.0%) |
| 5 or more Children | 5 (100.0%) | 0 (0.0%) |
| Total | 591 (99.5%) | 3 (0.5%) |
Income Below Poverty Among Single-Parent Households in Krugerville
| Children | Single Father | Single Mother |
| No Children | 0 (0.0%) | 0 (0.0%) |
| 1 or 2 Children | 0 (0.0%) | 0 (0.0%) |
| 3 or 4 Children | 0 (0.0%) | 0 (0.0%) |
| 5 or more Children | 0 (0.0%) | 0 (0.0%) |
| Total | 0 (0.0%) | 0 (0.0%) |
Income Below Poverty Among Married-Couple vs Single-Parent Households in Krugerville
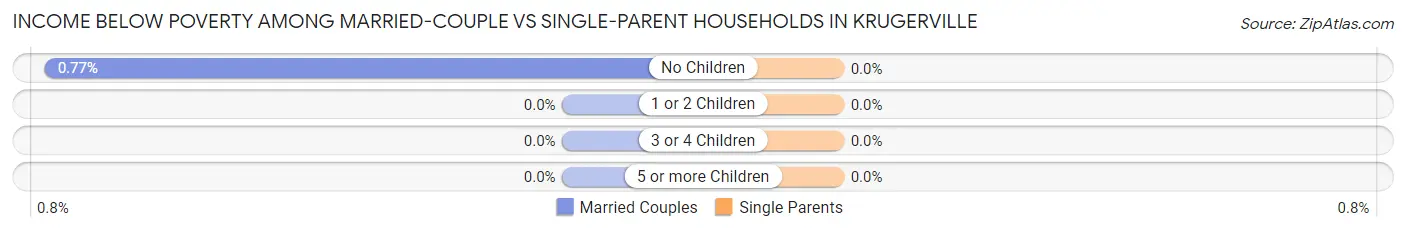
| Children | Married-Couple Families | Single-Parent Households |
| No Children | 3 (0.8%) | 0 (0.0%) |
| 1 or 2 Children | 0 (0.0%) | 0 (0.0%) |
| 3 or 4 Children | 0 (0.0%) | 0 (0.0%) |
| 5 or more Children | 0 (0.0%) | 0 (0.0%) |
| Total | 3 (0.5%) | 0 (0.0%) |
Race in Krugerville
The most populous races in Krugerville are White / Caucasian (1,729 | 85.4%), Hispanic or Latino (199 | 9.8%), and Two or more Races (174 | 8.6%).
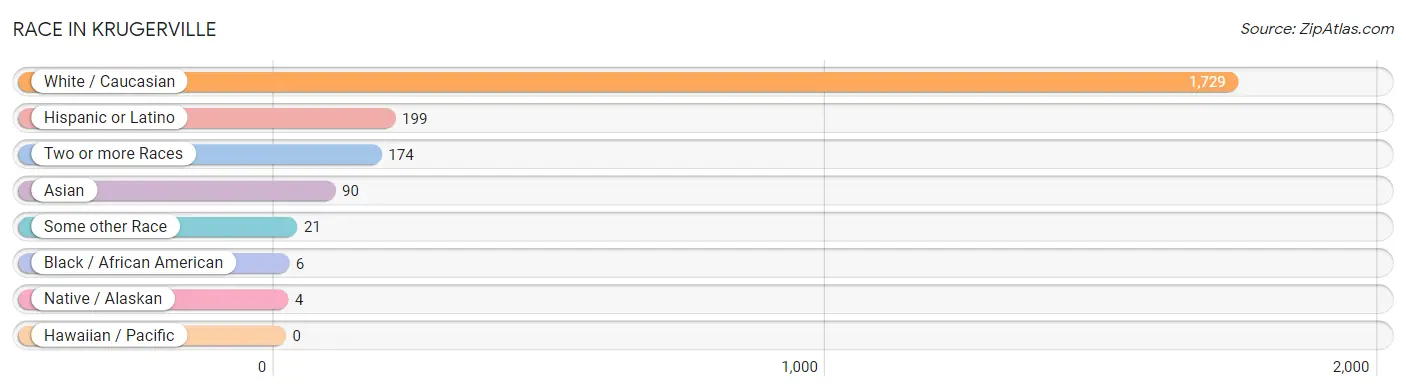
| Race | # Population | % Population |
| Asian | 90 | 4.4% |
| Black / African American | 6 | 0.3% |
| Hawaiian / Pacific | 0 | 0.0% |
| Hispanic or Latino | 199 | 9.8% |
| Native / Alaskan | 4 | 0.2% |
| White / Caucasian | 1,729 | 85.4% |
| Two or more Races | 174 | 8.6% |
| Some other Race | 21 | 1.0% |
| Total | 2,024 | 100.0% |
Ancestry in Krugerville
The most populous ancestries reported in Krugerville are English (386 | 19.1%), German (327 | 16.2%), Irish (251 | 12.4%), Mexican (175 | 8.6%), and American (164 | 8.1%), together accounting for 64.4% of all Krugerville residents.
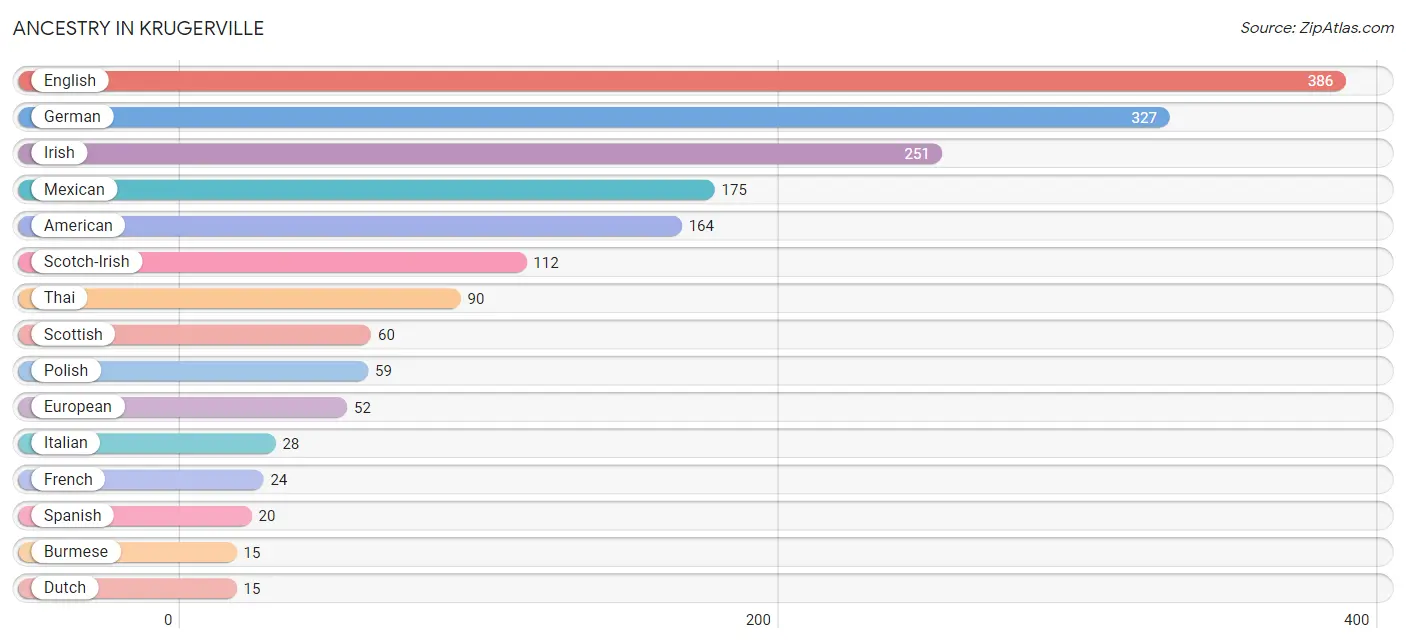
| Ancestry | # Population | % Population |
| American | 164 | 8.1% |
| British | 14 | 0.7% |
| Burmese | 15 | 0.7% |
| Canadian | 9 | 0.4% |
| Central American | 3 | 0.2% |
| Cherokee | 1 | 0.1% |
| Choctaw | 10 | 0.5% |
| Czech | 5 | 0.3% |
| Czechoslovakian | 2 | 0.1% |
| Danish | 13 | 0.6% |
| Dutch | 15 | 0.7% |
| English | 386 | 19.1% |
| European | 52 | 2.6% |
| French | 24 | 1.2% |
| French Canadian | 5 | 0.3% |
| German | 327 | 16.2% |
| Irish | 251 | 12.4% |
| Iroquois | 2 | 0.1% |
| Italian | 28 | 1.4% |
| Mexican | 175 | 8.6% |
| Norwegian | 6 | 0.3% |
| Pennsylvania German | 2 | 0.1% |
| Polish | 59 | 2.9% |
| Portuguese | 1 | 0.1% |
| Russian | 4 | 0.2% |
| Salvadoran | 3 | 0.2% |
| Scandinavian | 3 | 0.2% |
| Scotch-Irish | 112 | 5.5% |
| Scottish | 60 | 3.0% |
| Spaniard | 1 | 0.1% |
| Spanish | 20 | 1.0% |
| Swiss | 6 | 0.3% |
| Thai | 90 | 4.4% |
| Welsh | 7 | 0.4% | View All 34 Rows |
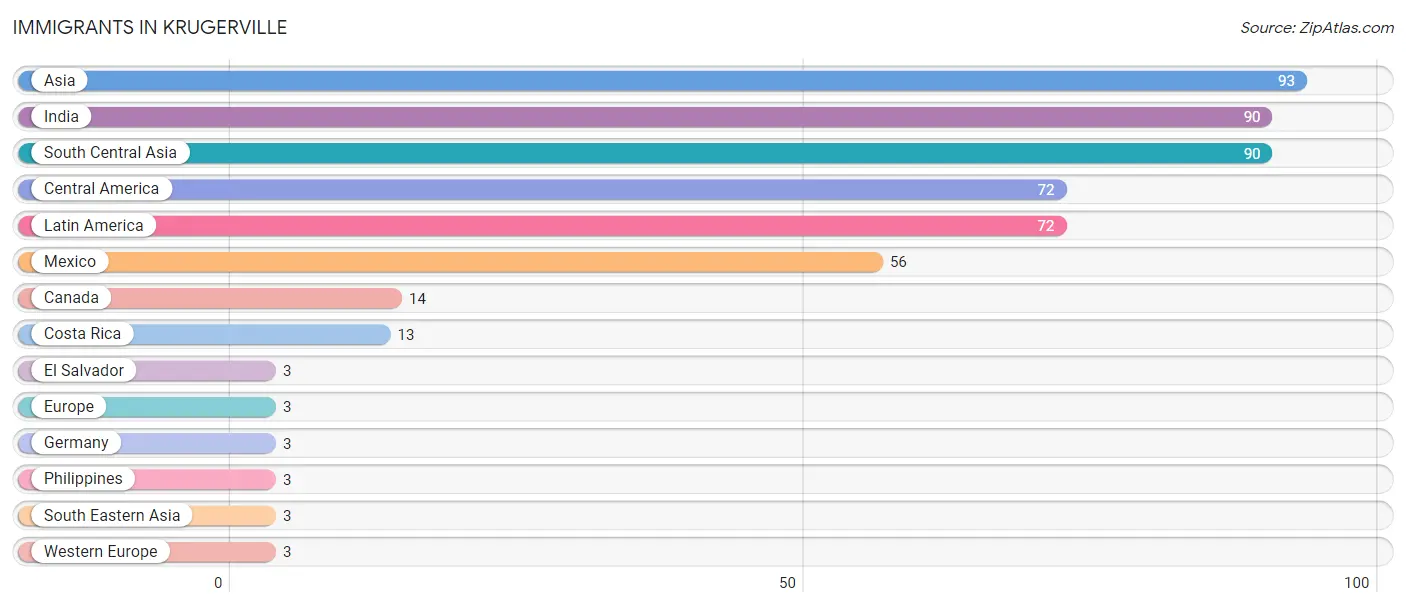
Immigrants in Krugerville
The most numerous immigrant groups reported in Krugerville came from Asia (93 | 4.6%), India (90 | 4.4%), South Central Asia (90 | 4.4%), Central America (72 | 3.6%), and Latin America (72 | 3.6%), together accounting for 20.6% of all Krugerville residents.
| Immigration Origin | # Population | % Population |
| Asia | 93 | 4.6% |
| Canada | 14 | 0.7% |
| Central America | 72 | 3.6% |
| Costa Rica | 13 | 0.6% |
| El Salvador | 3 | 0.2% |
| Europe | 3 | 0.2% |
| Germany | 3 | 0.2% |
| India | 90 | 4.4% |
| Latin America | 72 | 3.6% |
| Mexico | 56 | 2.8% |
| Philippines | 3 | 0.2% |
| South Central Asia | 90 | 4.4% |
| South Eastern Asia | 3 | 0.2% |
| Western Europe | 3 | 0.2% | View All 14 Rows |
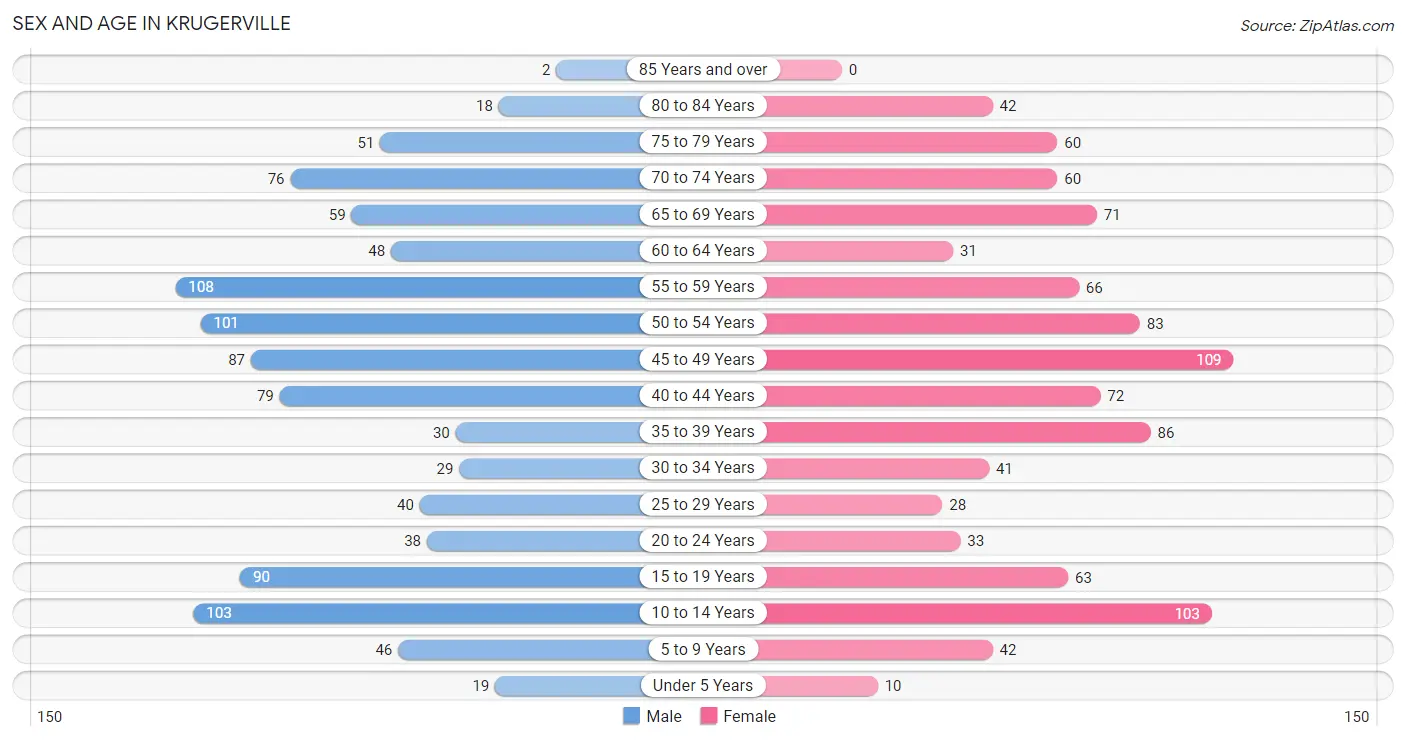
Sex and Age in Krugerville
Sex and Age in Krugerville
The most populous age groups in Krugerville are 55 to 59 Years (108 | 10.5%) for men and 45 to 49 Years (109 | 10.9%) for women.
| Age Bracket | Male | Female |
| Under 5 Years | 19 (1.9%) | 10 (1.0%) |
| 5 to 9 Years | 46 (4.5%) | 42 (4.2%) |
| 10 to 14 Years | 103 (10.1%) | 103 (10.3%) |
| 15 to 19 Years | 90 (8.8%) | 63 (6.3%) |
| 20 to 24 Years | 38 (3.7%) | 33 (3.3%) |
| 25 to 29 Years | 40 (3.9%) | 28 (2.8%) |
| 30 to 34 Years | 29 (2.8%) | 41 (4.1%) |
| 35 to 39 Years | 30 (2.9%) | 86 (8.6%) |
| 40 to 44 Years | 79 (7.7%) | 72 (7.2%) |
| 45 to 49 Years | 87 (8.5%) | 109 (10.9%) |
| 50 to 54 Years | 101 (9.9%) | 83 (8.3%) |
| 55 to 59 Years | 108 (10.5%) | 66 (6.6%) |
| 60 to 64 Years | 48 (4.7%) | 31 (3.1%) |
| 65 to 69 Years | 59 (5.8%) | 71 (7.1%) |
| 70 to 74 Years | 76 (7.4%) | 60 (6.0%) |
| 75 to 79 Years | 51 (5.0%) | 60 (6.0%) |
| 80 to 84 Years | 18 (1.8%) | 42 (4.2%) |
| 85 Years and over | 2 (0.2%) | 0 (0.0%) |
| Total | 1,024 (100.0%) | 1,000 (100.0%) |
Families and Households in Krugerville
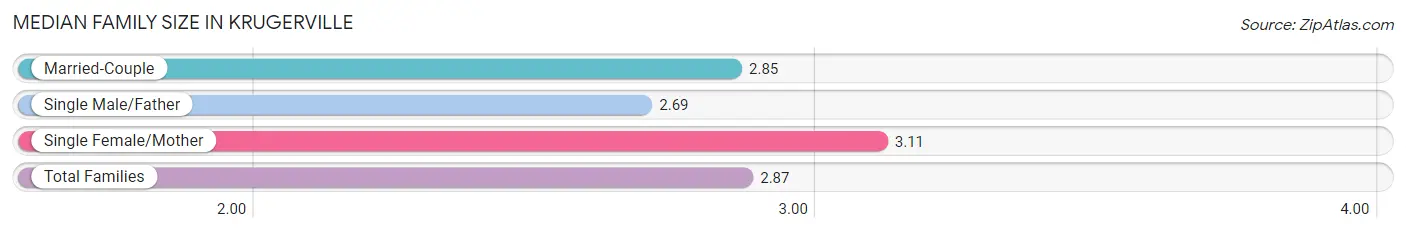
Median Family Size in Krugerville
The median family size in Krugerville is 2.87 persons per family, with single female/mother families (54 | 8.2%) accounting for the largest median family size of 3.11 persons per family. On the other hand, single male/father families (13 | 2.0%) represent the smallest median family size with 2.69 persons per family.
| Family Type | # Families | Family Size |
| Married-Couple | 594 (89.9%) | 2.85 |
| Single Male/Father | 13 (2.0%) | 2.69 |
| Single Female/Mother | 54 (8.2%) | 3.11 |
| Total Families | 661 (100.0%) | 2.87 |
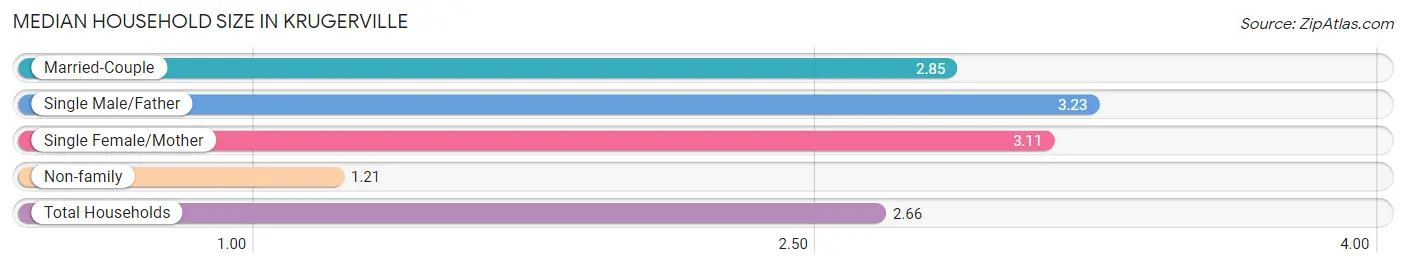
Median Household Size in Krugerville
The median household size in Krugerville is 2.66 persons per household, with single male/father households (13 | 1.7%) accounting for the largest median household size of 3.23 persons per household. non-family households (99 | 13.0%) represent the smallest median household size with 1.21 persons per household.
| Household Type | # Households | Household Size |
| Married-Couple | 594 (78.2%) | 2.85 |
| Single Male/Father | 13 (1.7%) | 3.23 |
| Single Female/Mother | 54 (7.1%) | 3.11 |
| Non-family | 99 (13.0%) | 1.21 |
| Total Households | 760 (100.0%) | 2.66 |
Household Size by Marriage Status in Krugerville
Out of a total of 760 households in Krugerville, 661 (87.0%) are family households, while 99 (13.0%) are nonfamily households. The most numerous type of family households are 2-person households, comprising 332, and the most common type of nonfamily households are 1-person households, comprising 79.
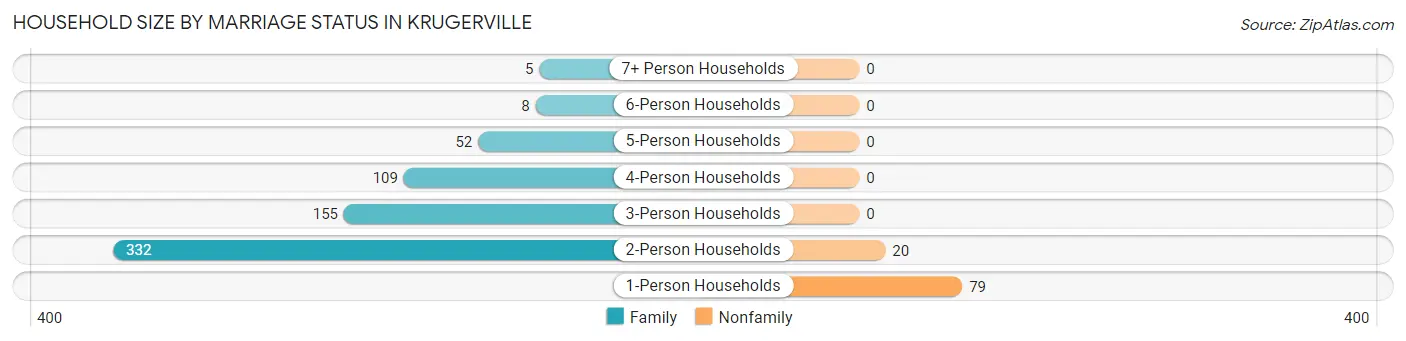
| Household Size | Family Households | Nonfamily Households |
| 1-Person Households | - | 79 (10.4%) |
| 2-Person Households | 332 (43.7%) | 20 (2.6%) |
| 3-Person Households | 155 (20.4%) | 0 (0.0%) |
| 4-Person Households | 109 (14.3%) | 0 (0.0%) |
| 5-Person Households | 52 (6.8%) | 0 (0.0%) |
| 6-Person Households | 8 (1.1%) | 0 (0.0%) |
| 7+ Person Households | 5 (0.7%) | 0 (0.0%) |
| Total | 661 (87.0%) | 99 (13.0%) |
Female Fertility in Krugerville
Fertility by Age in Krugerville
Average fertility rate in Krugerville is 19.0 births per 1,000 women. Women in the age bracket of 35 to 50 years have the highest fertility rate with 30.0 births per 1,000 women. Women in the age bracket of 35 to 50 years acount for 100.0% of all women with births.
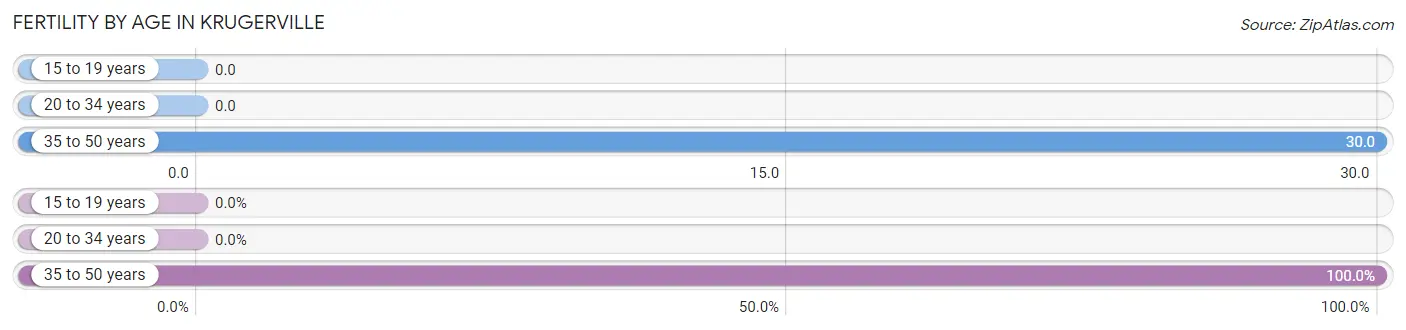
| Age Bracket | Women with Births | Births / 1,000 Women |
| 15 to 19 years | 0 (0.0%) | 0.0 |
| 20 to 34 years | 0 (0.0%) | 0.0 |
| 35 to 50 years | 8 (100.0%) | 30.0 |
| Total | 8 (100.0%) | 19.0 |
Fertility by Age by Marriage Status in Krugerville
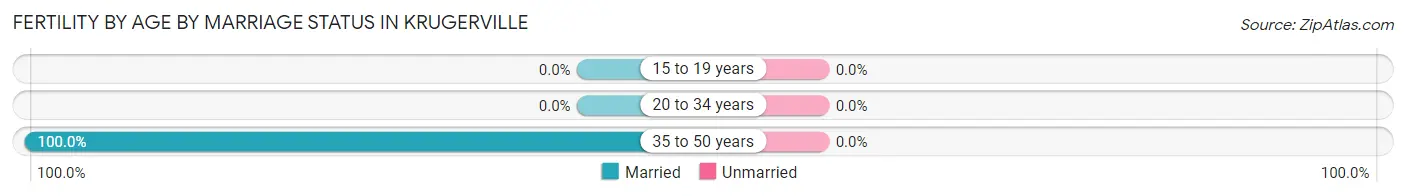
| Age Bracket | Married | Unmarried |
| 15 to 19 years | 0 (0.0%) | 0 (0.0%) |
| 20 to 34 years | 0 (0.0%) | 0 (0.0%) |
| 35 to 50 years | 8 (100.0%) | 0 (0.0%) |
| Total | 8 (100.0%) | 0 (0.0%) |
Fertility by Education in Krugerville
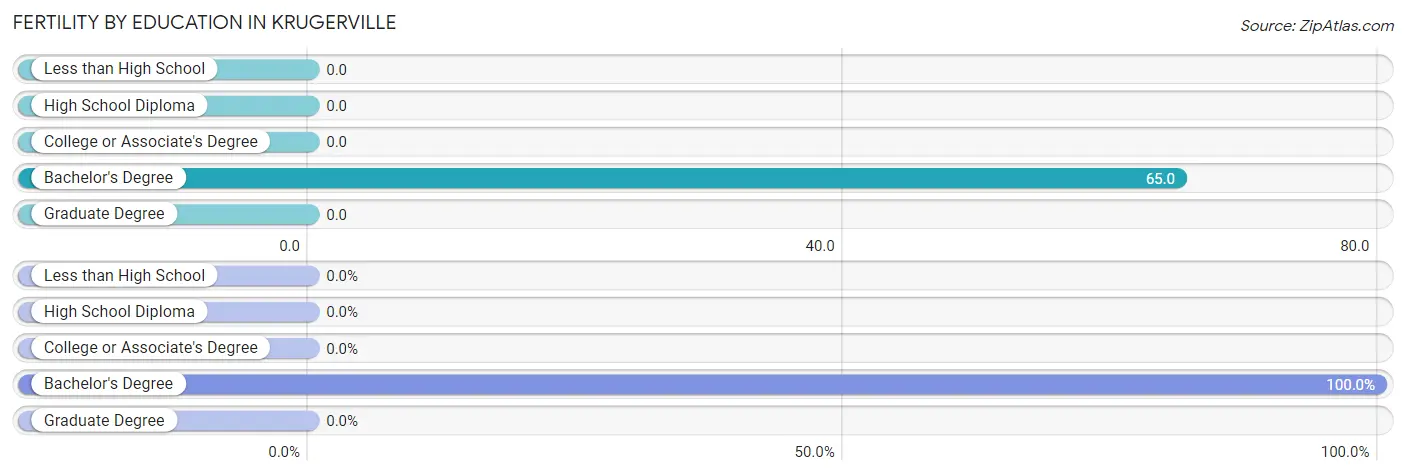
| Educational Attainment | Women with Births | Births / 1,000 Women |
| Less than High School | 0 (0.0%) | 0.0 |
| High School Diploma | 0 (0.0%) | 0.0 |
| College or Associate's Degree | 0 (0.0%) | 0.0 |
| Bachelor's Degree | 8 (100.0%) | 65.0 |
| Graduate Degree | 0 (0.0%) | 0.0 |
| Total | 8 (100.0%) | 19.0 |
Fertility by Education by Marriage Status in Krugerville
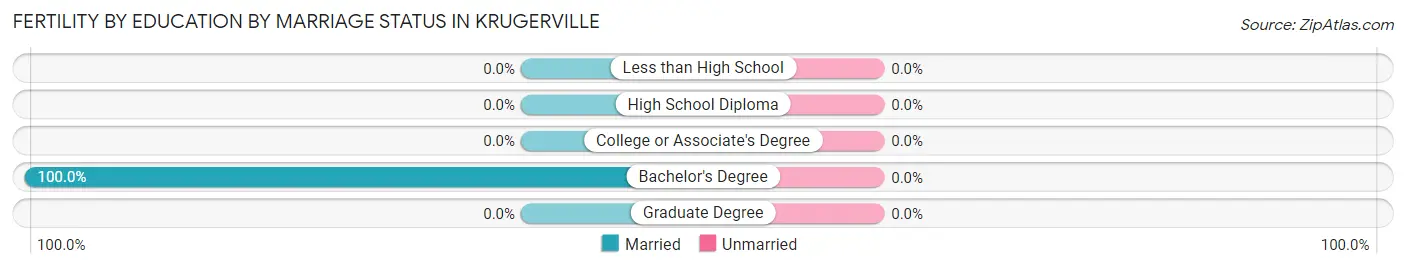
| Educational Attainment | Married | Unmarried |
| Less than High School | 0 (0.0%) | 0 (0.0%) |
| High School Diploma | 0 (0.0%) | 0 (0.0%) |
| College or Associate's Degree | 0 (0.0%) | 0 (0.0%) |
| Bachelor's Degree | 8 (100.0%) | 0 (0.0%) |
| Graduate Degree | 0 (0.0%) | 0 (0.0%) |
| Total | 8 (100.0%) | 0 (0.0%) |
Employment Characteristics in Krugerville
Employment by Class of Employer in Krugerville
Among the 1,027 employed individuals in Krugerville, private company employees (698 | 68.0%), self-employed (not incorporated) (90 | 8.8%), and local government employees (87 | 8.5%) make up the most common classes of employment.
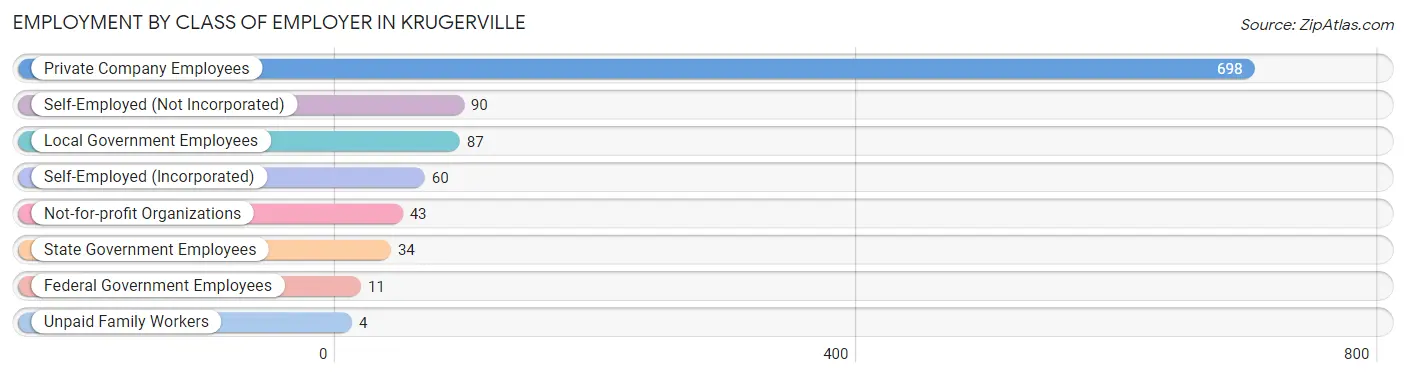
| Employer Class | # Employees | % Employees |
| Private Company Employees | 698 | 68.0% |
| Self-Employed (Incorporated) | 60 | 5.8% |
| Self-Employed (Not Incorporated) | 90 | 8.8% |
| Not-for-profit Organizations | 43 | 4.2% |
| Local Government Employees | 87 | 8.5% |
| State Government Employees | 34 | 3.3% |
| Federal Government Employees | 11 | 1.1% |
| Unpaid Family Workers | 4 | 0.4% |
| Total | 1,027 | 100.0% |
Employment Status by Age in Krugerville
According to the labor force statistics for Krugerville, out of the total population over 16 years of age (1,677), 64.0% or 1,073 individuals are in the labor force, with 3.5% or 38 of them unemployed. The age group with the highest labor force participation rate is 30 to 34 years, with 92.9% or 65 individuals in the labor force. Within the labor force, the 30 to 34 years age range has the highest percentage of unemployed individuals, with 21.5% or 14 of them being unemployed.
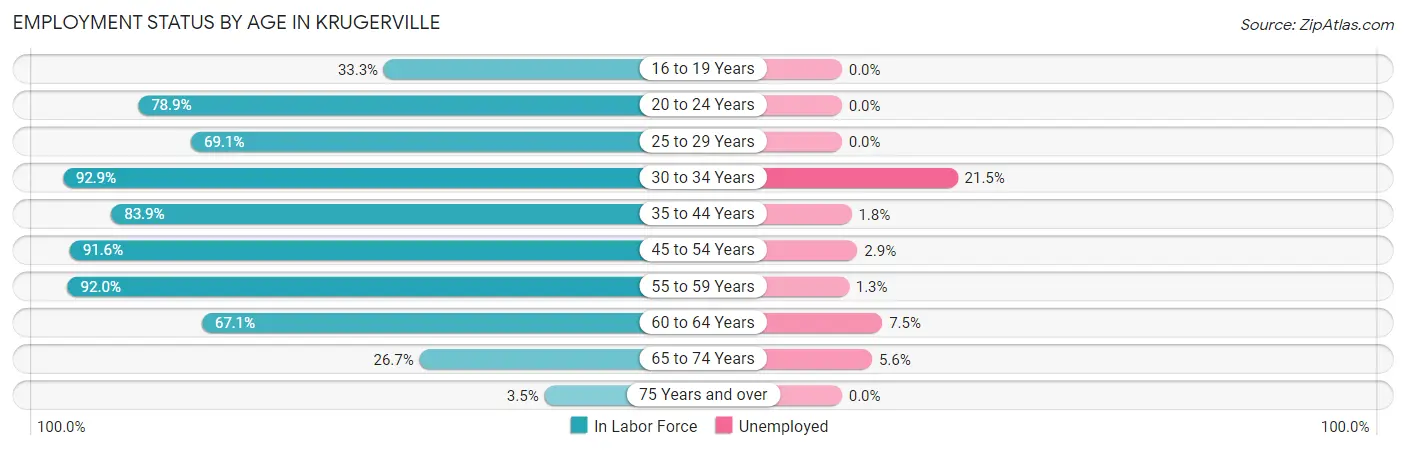
| Age Bracket | In Labor Force | Unemployed |
| 16 to 19 Years | 43 (33.3%) | 0 (0.0%) |
| 20 to 24 Years | 56 (78.9%) | 0 (0.0%) |
| 25 to 29 Years | 47 (69.1%) | 0 (0.0%) |
| 30 to 34 Years | 65 (92.9%) | 14 (21.5%) |
| 35 to 44 Years | 224 (83.9%) | 4 (1.8%) |
| 45 to 54 Years | 348 (91.6%) | 10 (2.9%) |
| 55 to 59 Years | 160 (92.0%) | 2 (1.3%) |
| 60 to 64 Years | 53 (67.1%) | 4 (7.5%) |
| 65 to 74 Years | 71 (26.7%) | 4 (5.6%) |
| 75 Years and over | 6 (3.5%) | 0 (0.0%) |
| Total | 1,073 (64.0%) | 38 (3.5%) |
Employment Status by Educational Attainment in Krugerville
According to labor force statistics for Krugerville, 86.4% of individuals (897) out of the total population between 25 and 64 years of age (1,038) are in the labor force, with 3.8% or 34 of them being unemployed. The group with the highest labor force participation rate are those with the educational attainment of less than high school, with 100.0% or 7 individuals in the labor force. Within the labor force, individuals with high school diploma education have the highest percentage of unemployment, with 7.1% or 10 of them being unemployed.
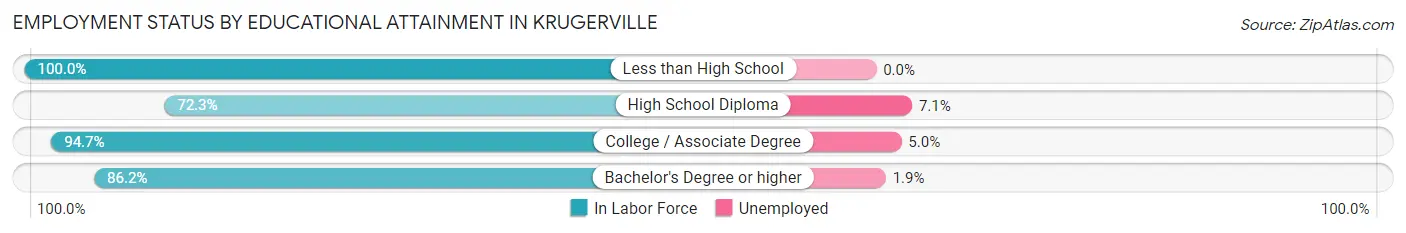
| Educational Attainment | In Labor Force | Unemployed |
| Less than High School | 7 (100.0%) | 0 (0.0%) |
| High School Diploma | 141 (72.3%) | 14 (7.1%) |
| College / Associate Degree | 319 (94.7%) | 17 (5.0%) |
| Bachelor's Degree or higher | 430 (86.2%) | 9 (1.9%) |
| Total | 897 (86.4%) | 39 (3.8%) |
Employment Occupations by Sex in Krugerville
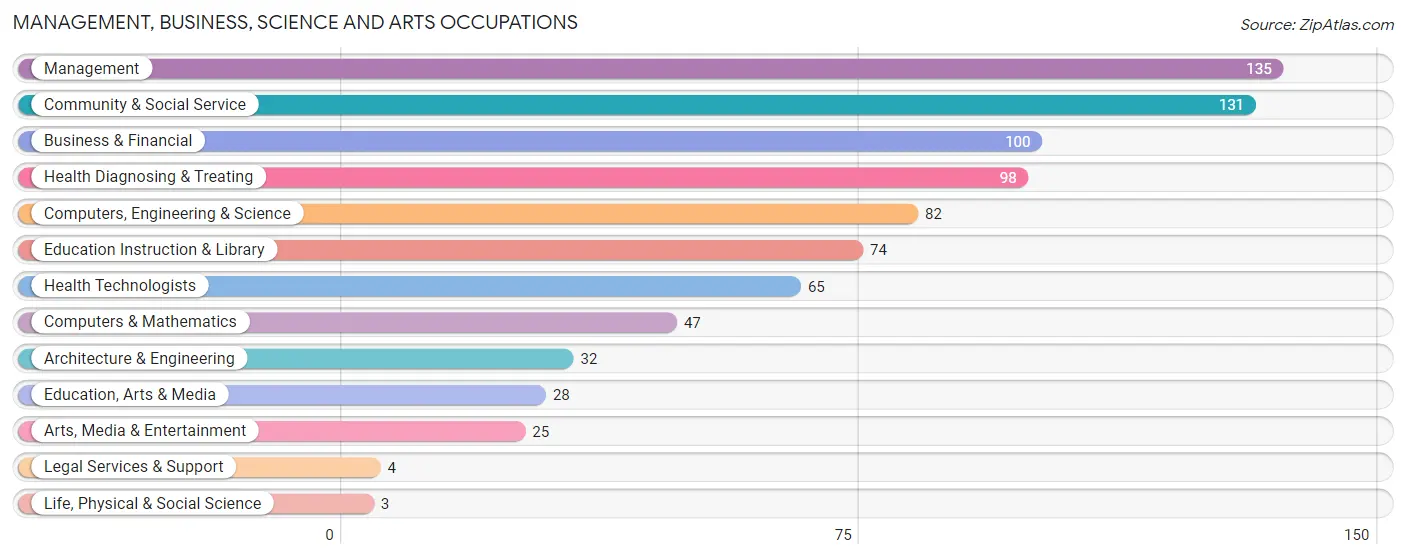
Management, Business, Science and Arts Occupations
The most common Management, Business, Science and Arts occupations in Krugerville are Management (135 | 13.0%), Community & Social Service (131 | 12.7%), Business & Financial (100 | 9.7%), Health Diagnosing & Treating (98 | 9.5%), and Computers, Engineering & Science (82 | 7.9%).
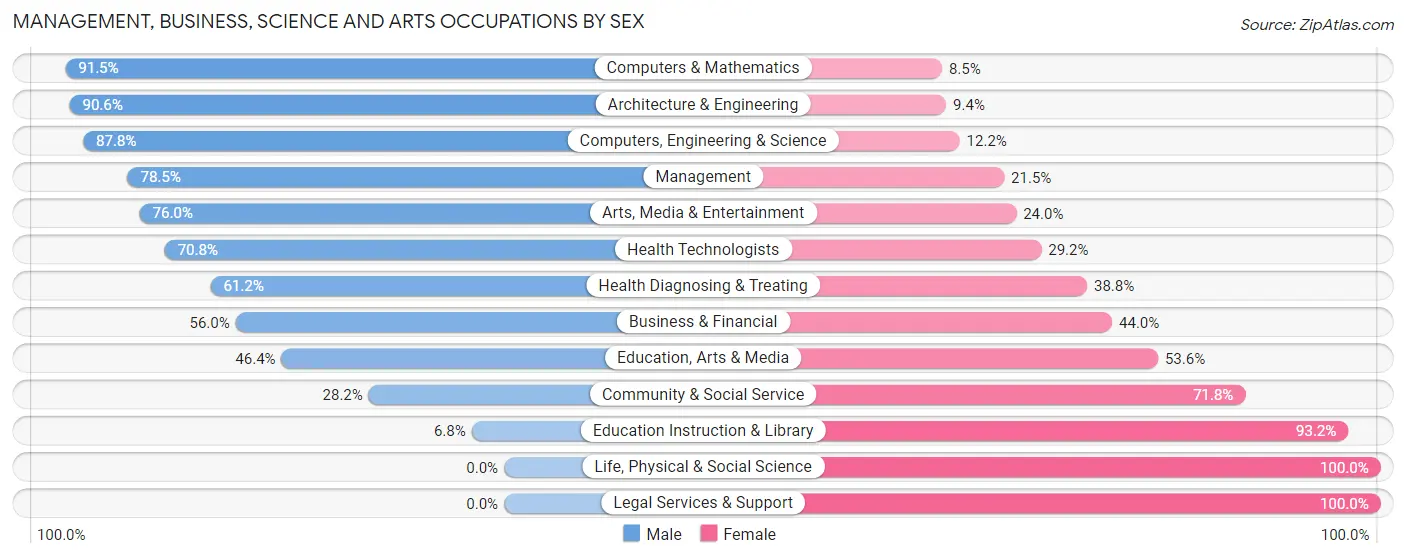
Management, Business, Science and Arts Occupations by Sex
Within the Management, Business, Science and Arts occupations in Krugerville, the most male-oriented occupations are Computers & Mathematics (91.5%), Architecture & Engineering (90.6%), and Computers, Engineering & Science (87.8%), while the most female-oriented occupations are Life, Physical & Social Science (100.0%), Legal Services & Support (100.0%), and Education Instruction & Library (93.2%).
| Occupation | Male | Female |
| Management | 106 (78.5%) | 29 (21.5%) |
| Business & Financial | 56 (56.0%) | 44 (44.0%) |
| Computers, Engineering & Science | 72 (87.8%) | 10 (12.2%) |
| Computers & Mathematics | 43 (91.5%) | 4 (8.5%) |
| Architecture & Engineering | 29 (90.6%) | 3 (9.4%) |
| Life, Physical & Social Science | 0 (0.0%) | 3 (100.0%) |
| Community & Social Service | 37 (28.2%) | 94 (71.8%) |
| Education, Arts & Media | 13 (46.4%) | 15 (53.6%) |
| Legal Services & Support | 0 (0.0%) | 4 (100.0%) |
| Education Instruction & Library | 5 (6.8%) | 69 (93.2%) |
| Arts, Media & Entertainment | 19 (76.0%) | 6 (24.0%) |
| Health Diagnosing & Treating | 60 (61.2%) | 38 (38.8%) |
| Health Technologists | 46 (70.8%) | 19 (29.2%) |
| Total (Category) | 331 (60.6%) | 215 (39.4%) |
| Total (Overall) | 577 (55.7%) | 458 (44.3%) |
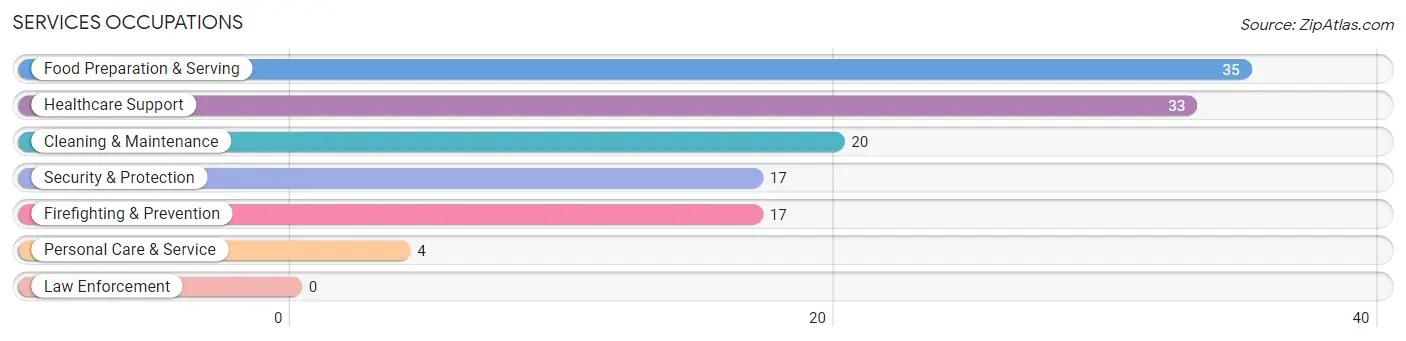
Services Occupations
The most common Services occupations in Krugerville are Food Preparation & Serving (35 | 3.4%), Healthcare Support (33 | 3.2%), Cleaning & Maintenance (20 | 1.9%), Security & Protection (17 | 1.6%), and Firefighting & Prevention (17 | 1.6%).
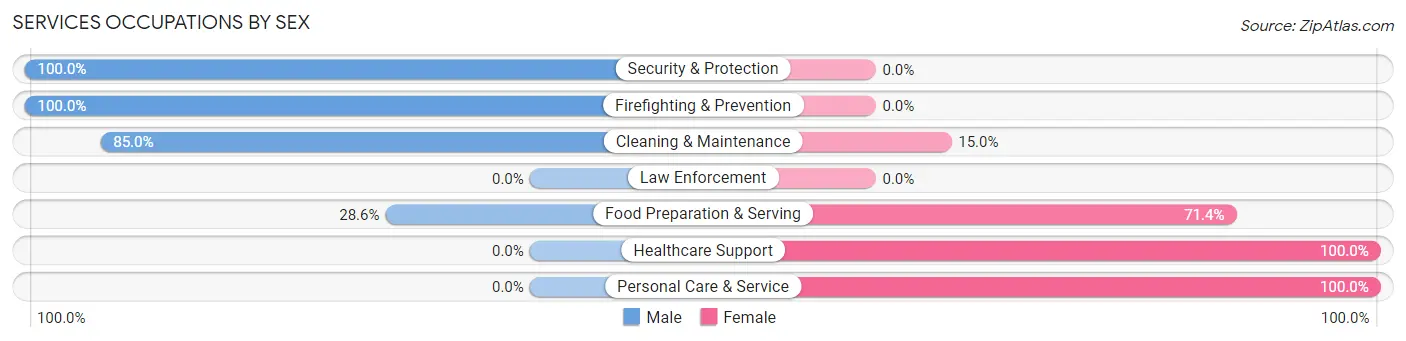
Services Occupations by Sex
Within the Services occupations in Krugerville, the most male-oriented occupations are Security & Protection (100.0%), Firefighting & Prevention (100.0%), and Cleaning & Maintenance (85.0%), while the most female-oriented occupations are Healthcare Support (100.0%), Personal Care & Service (100.0%), and Food Preparation & Serving (71.4%).
| Occupation | Male | Female |
| Healthcare Support | 0 (0.0%) | 33 (100.0%) |
| Security & Protection | 17 (100.0%) | 0 (0.0%) |
| Firefighting & Prevention | 17 (100.0%) | 0 (0.0%) |
| Law Enforcement | 0 (0.0%) | 0 (0.0%) |
| Food Preparation & Serving | 10 (28.6%) | 25 (71.4%) |
| Cleaning & Maintenance | 17 (85.0%) | 3 (15.0%) |
| Personal Care & Service | 0 (0.0%) | 4 (100.0%) |
| Total (Category) | 44 (40.4%) | 65 (59.6%) |
| Total (Overall) | 577 (55.7%) | 458 (44.3%) |
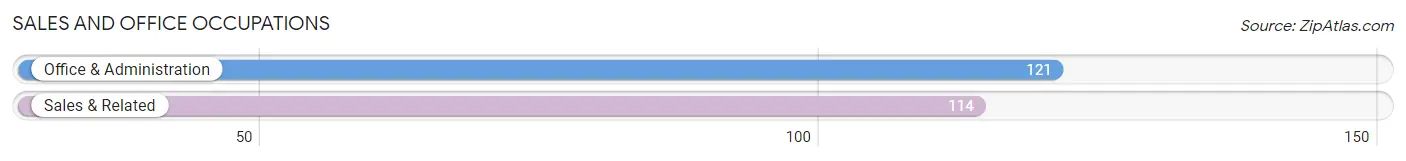
Sales and Office Occupations
The most common Sales and Office occupations in Krugerville are Office & Administration (121 | 11.7%), and Sales & Related (114 | 11.0%).
Sales and Office Occupations by Sex
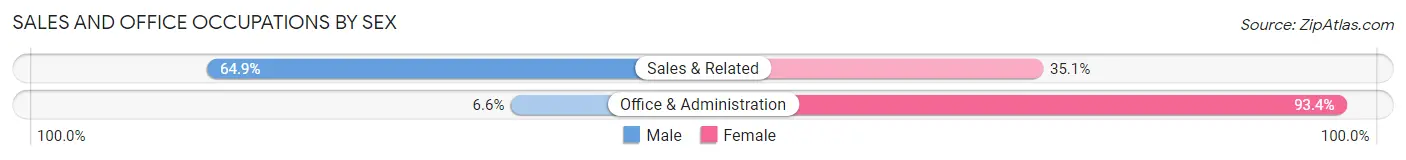
| Occupation | Male | Female |
| Sales & Related | 74 (64.9%) | 40 (35.1%) |
| Office & Administration | 8 (6.6%) | 113 (93.4%) |
| Total (Category) | 82 (34.9%) | 153 (65.1%) |
| Total (Overall) | 577 (55.7%) | 458 (44.3%) |
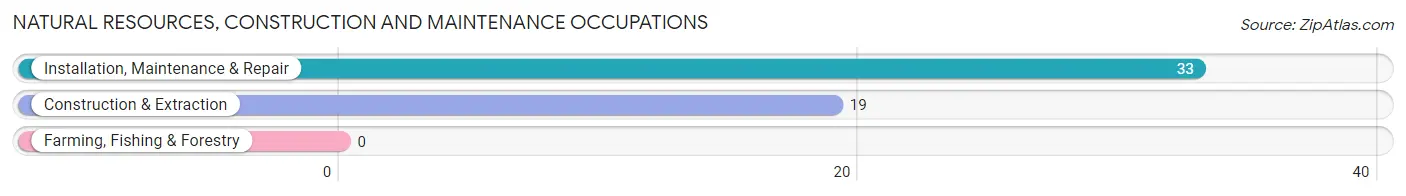
Natural Resources, Construction and Maintenance Occupations
The most common Natural Resources, Construction and Maintenance occupations in Krugerville are Installation, Maintenance & Repair (33 | 3.2%), and Construction & Extraction (19 | 1.8%).
Natural Resources, Construction and Maintenance Occupations by Sex
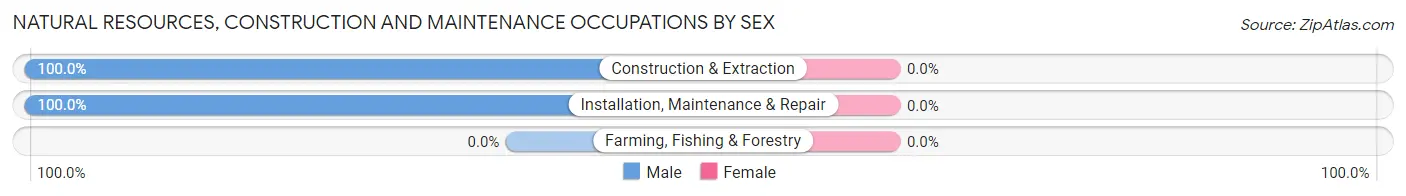
| Occupation | Male | Female |
| Farming, Fishing & Forestry | 0 (0.0%) | 0 (0.0%) |
| Construction & Extraction | 19 (100.0%) | 0 (0.0%) |
| Installation, Maintenance & Repair | 33 (100.0%) | 0 (0.0%) |
| Total (Category) | 52 (100.0%) | 0 (0.0%) |
| Total (Overall) | 577 (55.7%) | 458 (44.3%) |
Production, Transportation and Moving Occupations
The most common Production, Transportation and Moving occupations in Krugerville are Production (46 | 4.4%), Transportation (32 | 3.1%), and Material Moving (15 | 1.5%).
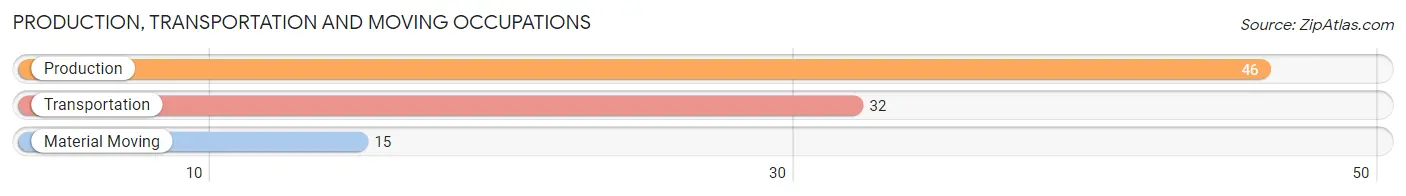
Production, Transportation and Moving Occupations by Sex
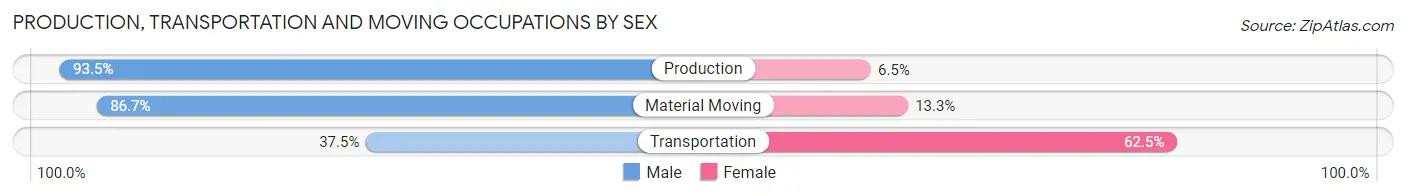
| Occupation | Male | Female |
| Production | 43 (93.5%) | 3 (6.5%) |
| Transportation | 12 (37.5%) | 20 (62.5%) |
| Material Moving | 13 (86.7%) | 2 (13.3%) |
| Total (Category) | 68 (73.1%) | 25 (26.9%) |
| Total (Overall) | 577 (55.7%) | 458 (44.3%) |
Employment Industries by Sex in Krugerville
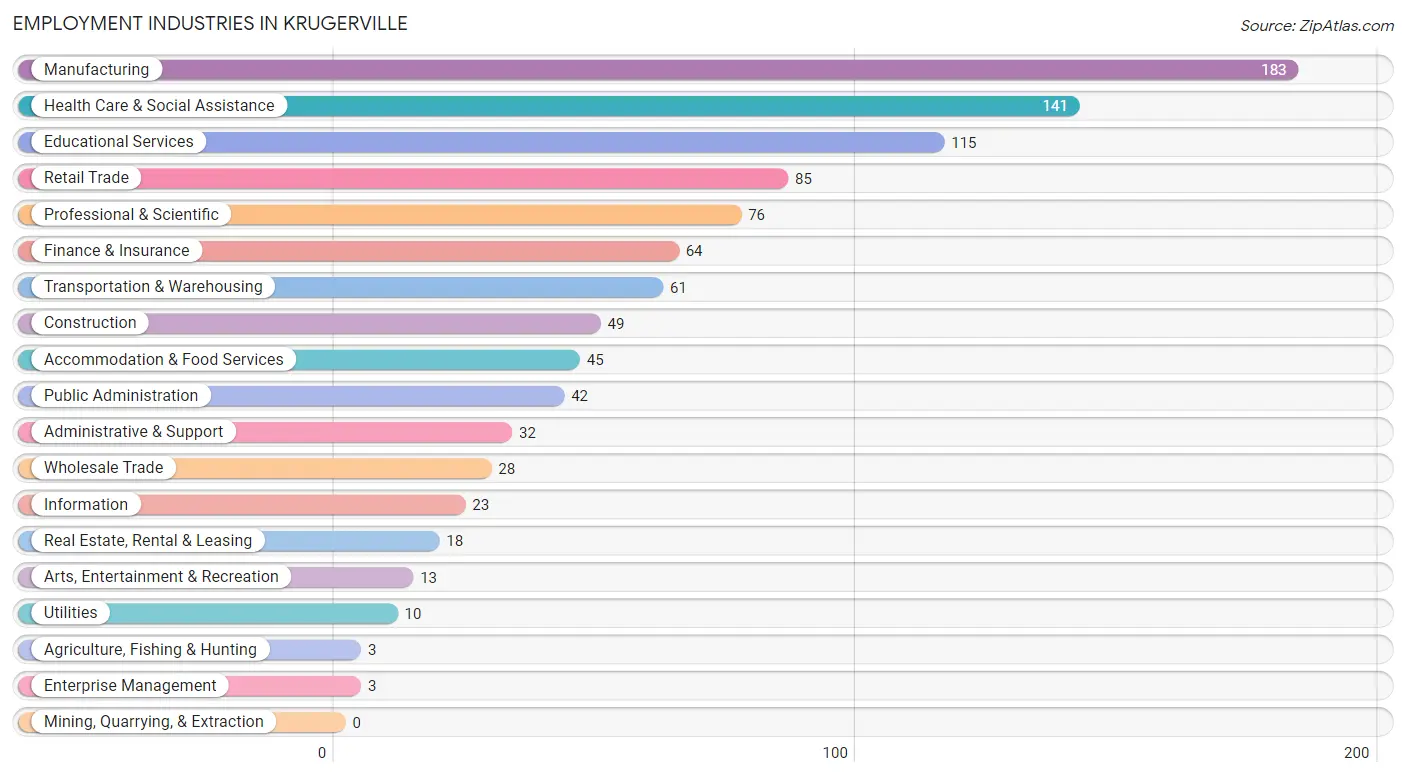
Employment Industries in Krugerville
The major employment industries in Krugerville include Manufacturing (183 | 17.7%), Health Care & Social Assistance (141 | 13.6%), Educational Services (115 | 11.1%), Retail Trade (85 | 8.2%), and Professional & Scientific (76 | 7.3%).
Employment Industries by Sex in Krugerville
The Krugerville industries that see more men than women are Agriculture, Fishing & Hunting (100.0%), Utilities (100.0%), and Information (100.0%), whereas the industries that tend to have a higher number of women are Enterprise Management (100.0%), Health Care & Social Assistance (69.5%), and Educational Services (67.8%).
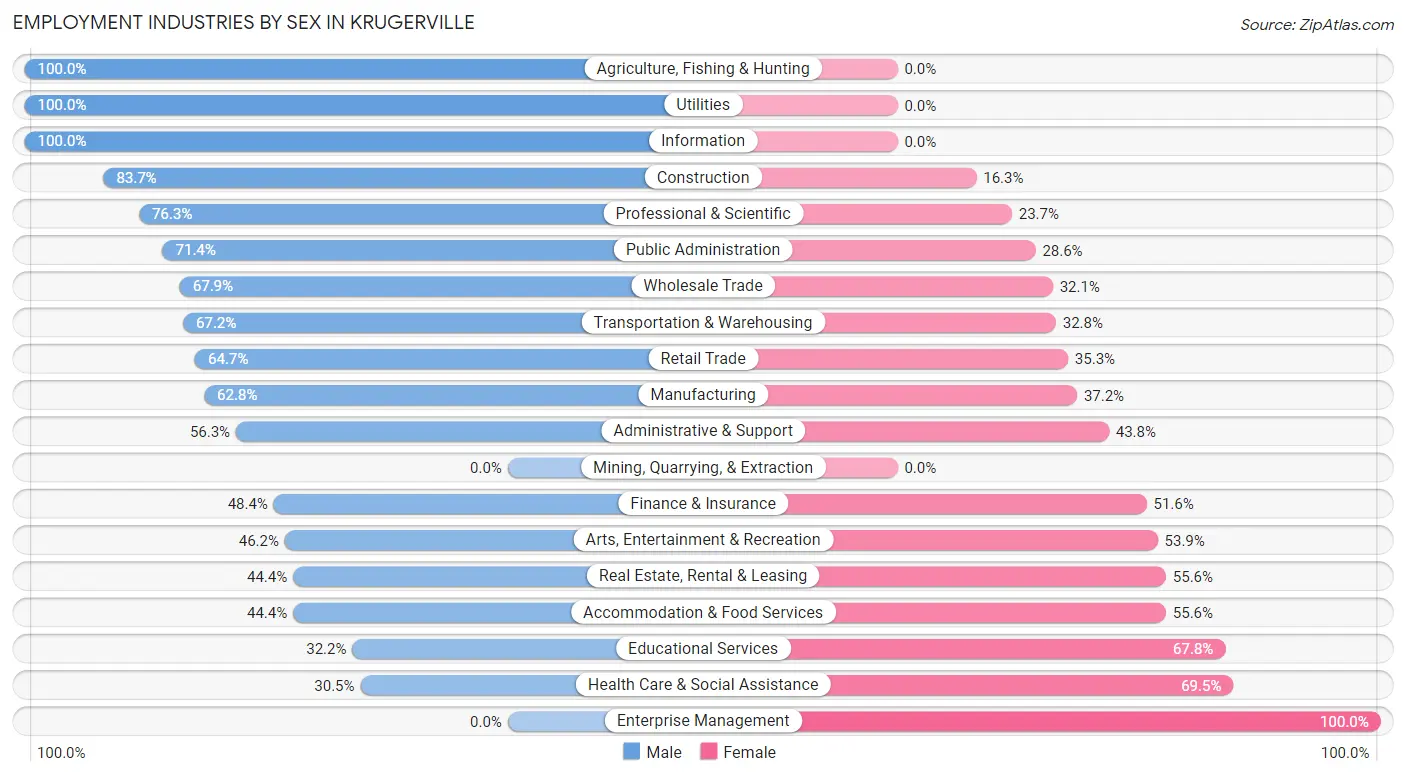
| Industry | Male | Female |
| Agriculture, Fishing & Hunting | 3 (100.0%) | 0 (0.0%) |
| Mining, Quarrying, & Extraction | 0 (0.0%) | 0 (0.0%) |
| Construction | 41 (83.7%) | 8 (16.3%) |
| Manufacturing | 115 (62.8%) | 68 (37.2%) |
| Wholesale Trade | 19 (67.9%) | 9 (32.1%) |
| Retail Trade | 55 (64.7%) | 30 (35.3%) |
| Transportation & Warehousing | 41 (67.2%) | 20 (32.8%) |
| Utilities | 10 (100.0%) | 0 (0.0%) |
| Information | 23 (100.0%) | 0 (0.0%) |
| Finance & Insurance | 31 (48.4%) | 33 (51.6%) |
| Real Estate, Rental & Leasing | 8 (44.4%) | 10 (55.6%) |
| Professional & Scientific | 58 (76.3%) | 18 (23.7%) |
| Enterprise Management | 0 (0.0%) | 3 (100.0%) |
| Administrative & Support | 18 (56.2%) | 14 (43.8%) |
| Educational Services | 37 (32.2%) | 78 (67.8%) |
| Health Care & Social Assistance | 43 (30.5%) | 98 (69.5%) |
| Arts, Entertainment & Recreation | 6 (46.2%) | 7 (53.8%) |
| Accommodation & Food Services | 20 (44.4%) | 25 (55.6%) |
| Public Administration | 30 (71.4%) | 12 (28.6%) |
| Total | 577 (55.7%) | 458 (44.3%) |
Education in Krugerville
School Enrollment in Krugerville
The most common levels of schooling among the 463 students in Krugerville are middle school (177 | 38.2%), high school (101 | 21.8%), and elementary school (57 | 12.3%).
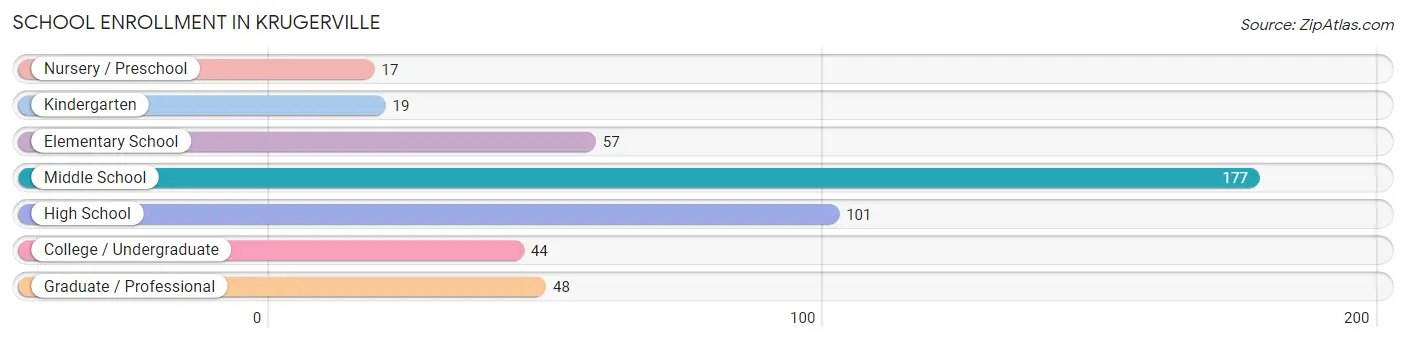
| School Level | # Students | % Students |
| Nursery / Preschool | 17 | 3.7% |
| Kindergarten | 19 | 4.1% |
| Elementary School | 57 | 12.3% |
| Middle School | 177 | 38.2% |
| High School | 101 | 21.8% |
| College / Undergraduate | 44 | 9.5% |
| Graduate / Professional | 48 | 10.4% |
| Total | 463 | 100.0% |
School Enrollment by Age by Funding Source in Krugerville
Out of a total of 463 students who are enrolled in schools in Krugerville, 88 (19.0%) attend a private institution, while the remaining 375 (81.0%) are enrolled in public schools. The age group of 5 to 9 year old has the highest likelihood of being enrolled in private schools, with 36 (50.0% in the age bracket) enrolled. Conversely, the age group of 18 to 19 year olds has the lowest likelihood of being enrolled in a private school, with 31 (91.2% in the age bracket) attending a public institution.
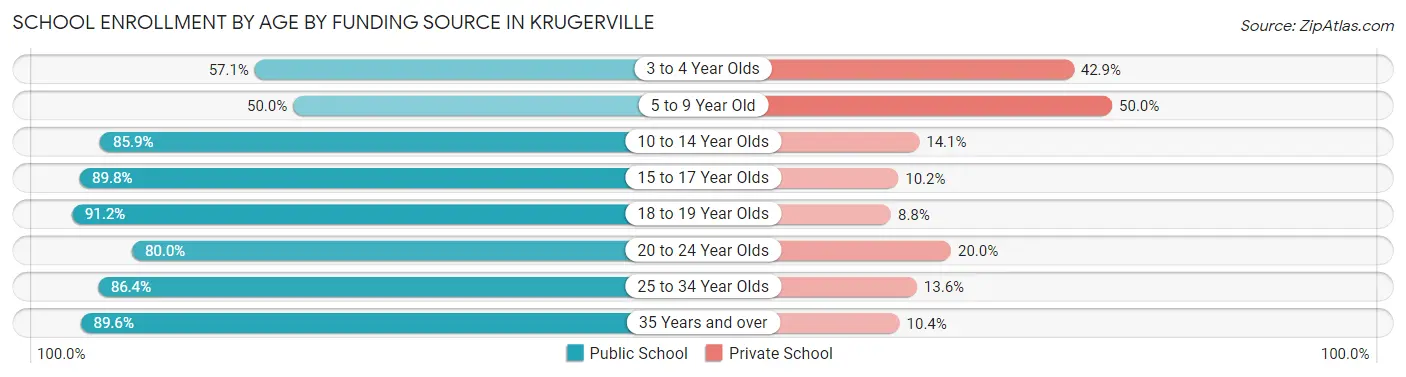
| Age Bracket | Public School | Private School |
| 3 to 4 Year Olds | 4 (57.1%) | 3 (42.9%) |
| 5 to 9 Year Old | 36 (50.0%) | 36 (50.0%) |
| 10 to 14 Year Olds | 177 (85.9%) | 29 (14.1%) |
| 15 to 17 Year Olds | 53 (89.8%) | 6 (10.2%) |
| 18 to 19 Year Olds | 31 (91.2%) | 3 (8.8%) |
| 20 to 24 Year Olds | 12 (80.0%) | 3 (20.0%) |
| 25 to 34 Year Olds | 19 (86.4%) | 3 (13.6%) |
| 35 Years and over | 43 (89.6%) | 5 (10.4%) |
| Total | 375 (81.0%) | 88 (19.0%) |
Educational Attainment by Field of Study in Krugerville
Business (205 | 32.2%), education (83 | 13.1%), arts & humanities (71 | 11.2%), engineering (51 | 8.0%), and computers & mathematics (46 | 7.2%) are the most common fields of study among 636 individuals in Krugerville who have obtained a bachelor's degree or higher.
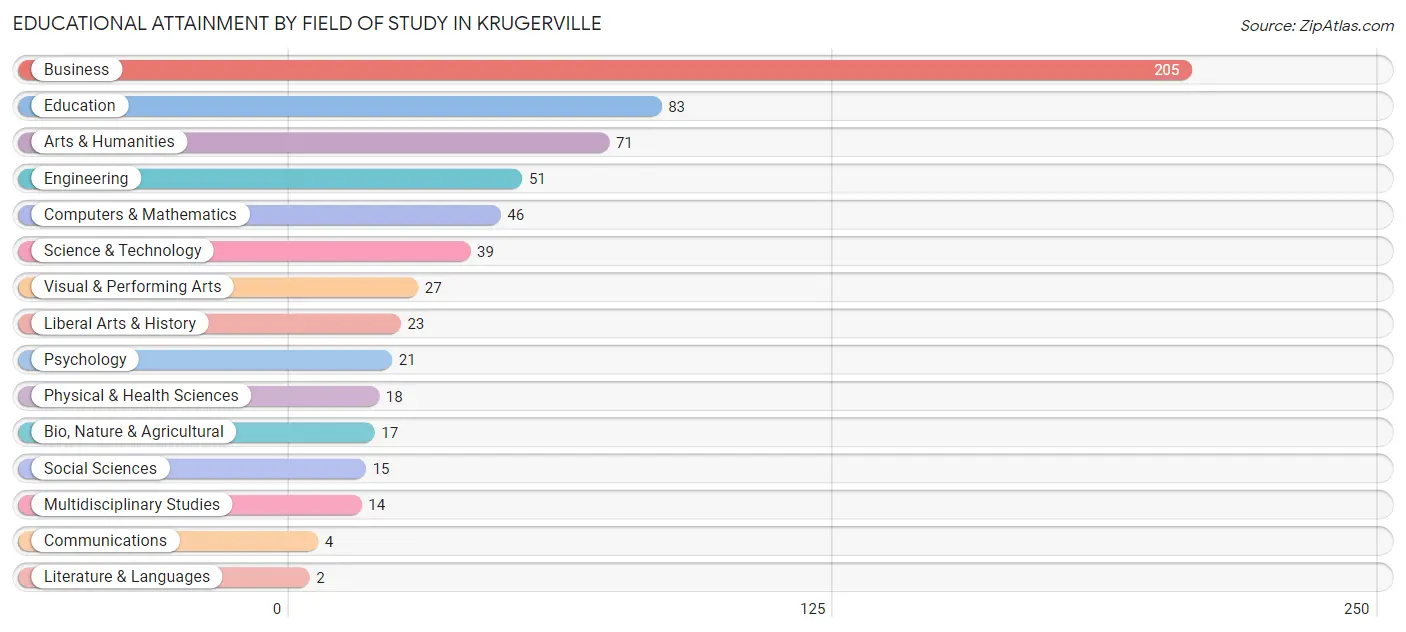
| Field of Study | # Graduates | % Graduates |
| Computers & Mathematics | 46 | 7.2% |
| Bio, Nature & Agricultural | 17 | 2.7% |
| Physical & Health Sciences | 18 | 2.8% |
| Psychology | 21 | 3.3% |
| Social Sciences | 15 | 2.4% |
| Engineering | 51 | 8.0% |
| Multidisciplinary Studies | 14 | 2.2% |
| Science & Technology | 39 | 6.1% |
| Business | 205 | 32.2% |
| Education | 83 | 13.1% |
| Literature & Languages | 2 | 0.3% |
| Liberal Arts & History | 23 | 3.6% |
| Visual & Performing Arts | 27 | 4.3% |
| Communications | 4 | 0.6% |
| Arts & Humanities | 71 | 11.2% |
| Total | 636 | 100.0% |
Transportation & Commute in Krugerville
Vehicle Availability by Sex in Krugerville
The most prevalent vehicle ownership categories in Krugerville are males with 2 vehicles (191, accounting for 33.1%) and females with 2 vehicles (133, making up 42.4%).
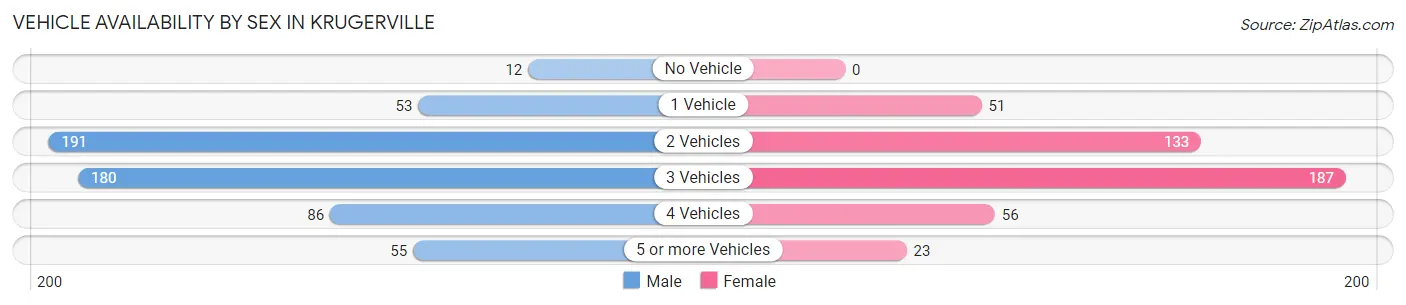
| Vehicles Available | Male | Female |
| No Vehicle | 12 (2.1%) | 0 (0.0%) |
| 1 Vehicle | 53 (9.2%) | 51 (11.3%) |
| 2 Vehicles | 191 (33.1%) | 133 (29.6%) |
| 3 Vehicles | 180 (31.2%) | 187 (41.6%) |
| 4 Vehicles | 86 (14.9%) | 56 (12.4%) |
| 5 or more Vehicles | 55 (9.5%) | 23 (5.1%) |
| Total | 577 (100.0%) | 450 (100.0%) |
Commute Time in Krugerville
The most frequently occuring commute durations in Krugerville are 45 to 59 minutes (163 commuters, 18.5%), 60 to 89 minutes (146 commuters, 16.6%), and 5 to 9 minutes (107 commuters, 12.2%).
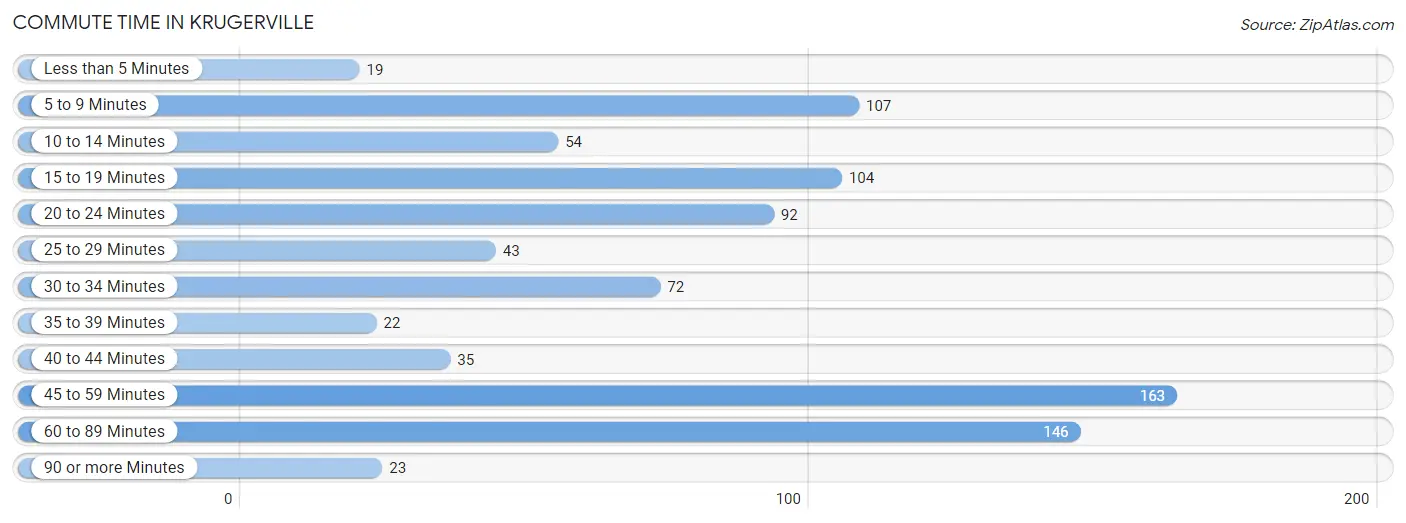
| Commute Time | # Commuters | % Commuters |
| Less than 5 Minutes | 19 | 2.2% |
| 5 to 9 Minutes | 107 | 12.2% |
| 10 to 14 Minutes | 54 | 6.1% |
| 15 to 19 Minutes | 104 | 11.8% |
| 20 to 24 Minutes | 92 | 10.4% |
| 25 to 29 Minutes | 43 | 4.9% |
| 30 to 34 Minutes | 72 | 8.2% |
| 35 to 39 Minutes | 22 | 2.5% |
| 40 to 44 Minutes | 35 | 4.0% |
| 45 to 59 Minutes | 163 | 18.5% |
| 60 to 89 Minutes | 146 | 16.6% |
| 90 or more Minutes | 23 | 2.6% |
Commute Time by Sex in Krugerville
The most common commute times in Krugerville are 45 to 59 minutes (110 commuters, 22.0%) for males and 5 to 9 minutes (75 commuters, 19.8%) for females.
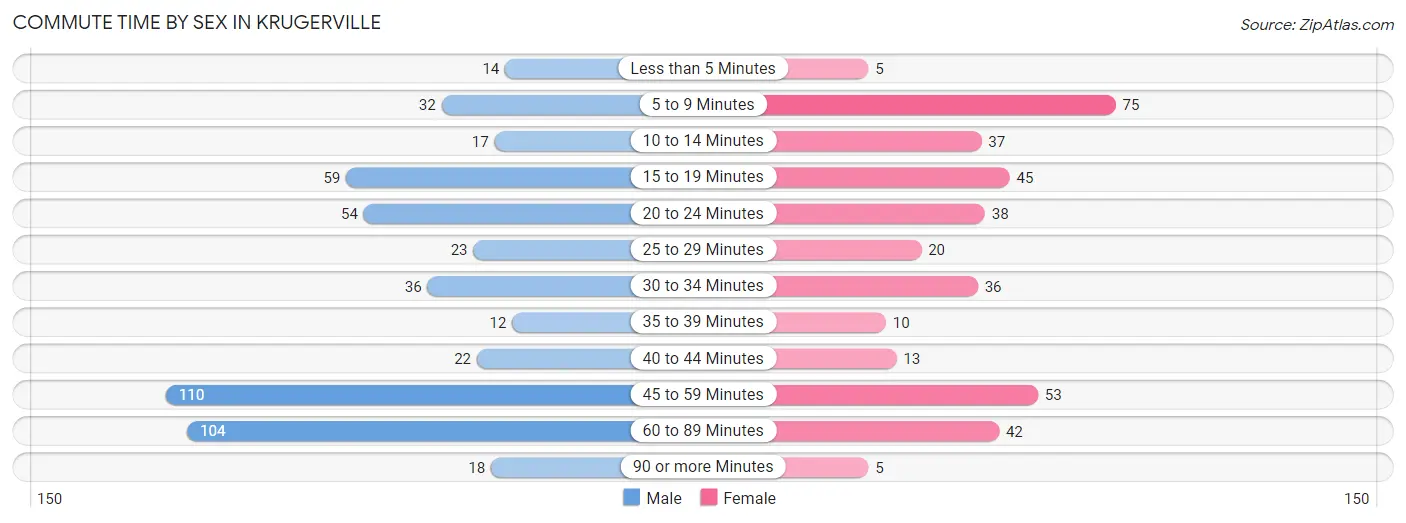
| Commute Time | Male | Female |
| Less than 5 Minutes | 14 (2.8%) | 5 (1.3%) |
| 5 to 9 Minutes | 32 (6.4%) | 75 (19.8%) |
| 10 to 14 Minutes | 17 (3.4%) | 37 (9.8%) |
| 15 to 19 Minutes | 59 (11.8%) | 45 (11.9%) |
| 20 to 24 Minutes | 54 (10.8%) | 38 (10.0%) |
| 25 to 29 Minutes | 23 (4.6%) | 20 (5.3%) |
| 30 to 34 Minutes | 36 (7.2%) | 36 (9.5%) |
| 35 to 39 Minutes | 12 (2.4%) | 10 (2.6%) |
| 40 to 44 Minutes | 22 (4.4%) | 13 (3.4%) |
| 45 to 59 Minutes | 110 (22.0%) | 53 (14.0%) |
| 60 to 89 Minutes | 104 (20.8%) | 42 (11.1%) |
| 90 or more Minutes | 18 (3.6%) | 5 (1.3%) |
Time of Departure to Work by Sex in Krugerville
The most frequent times of departure to work in Krugerville are 6:00 AM to 6:29 AM (96, 19.2%) for males and 8:00 AM to 8:29 AM (57, 15.0%) for females.
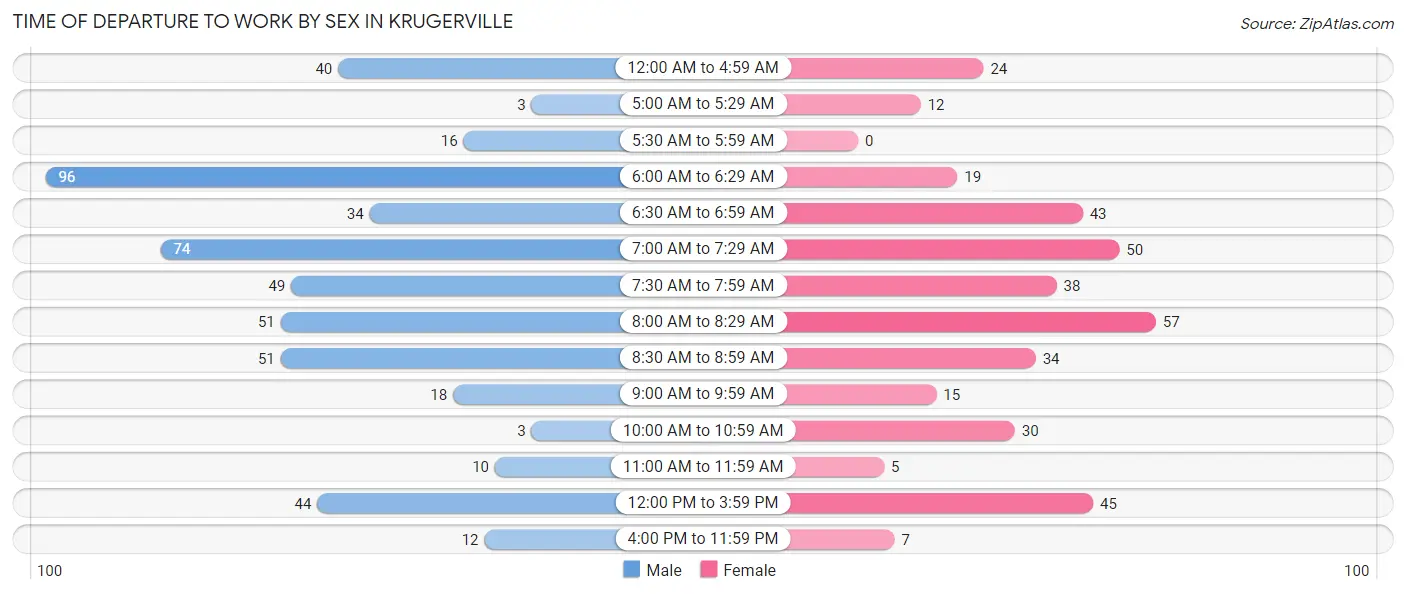
| Time of Departure | Male | Female |
| 12:00 AM to 4:59 AM | 40 (8.0%) | 24 (6.3%) |
| 5:00 AM to 5:29 AM | 3 (0.6%) | 12 (3.2%) |
| 5:30 AM to 5:59 AM | 16 (3.2%) | 0 (0.0%) |
| 6:00 AM to 6:29 AM | 96 (19.2%) | 19 (5.0%) |
| 6:30 AM to 6:59 AM | 34 (6.8%) | 43 (11.4%) |
| 7:00 AM to 7:29 AM | 74 (14.8%) | 50 (13.2%) |
| 7:30 AM to 7:59 AM | 49 (9.8%) | 38 (10.0%) |
| 8:00 AM to 8:29 AM | 51 (10.2%) | 57 (15.0%) |
| 8:30 AM to 8:59 AM | 51 (10.2%) | 34 (9.0%) |
| 9:00 AM to 9:59 AM | 18 (3.6%) | 15 (4.0%) |
| 10:00 AM to 10:59 AM | 3 (0.6%) | 30 (7.9%) |
| 11:00 AM to 11:59 AM | 10 (2.0%) | 5 (1.3%) |
| 12:00 PM to 3:59 PM | 44 (8.8%) | 45 (11.9%) |
| 4:00 PM to 11:59 PM | 12 (2.4%) | 7 (1.8%) |
| Total | 501 (100.0%) | 379 (100.0%) |
Housing Occupancy in Krugerville
Occupancy by Ownership in Krugerville
Of the total 760 dwellings in Krugerville, owner-occupied units account for 736 (96.8%), while renter-occupied units make up 24 (3.2%).
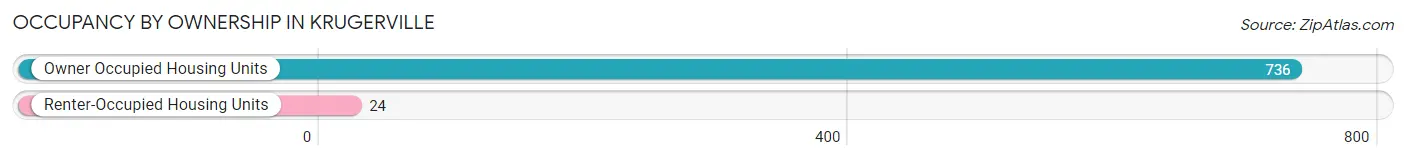
| Occupancy | # Housing Units | % Housing Units |
| Owner Occupied Housing Units | 736 | 96.8% |
| Renter-Occupied Housing Units | 24 | 3.2% |
| Total Occupied Housing Units | 760 | 100.0% |
Occupancy by Household Size in Krugerville
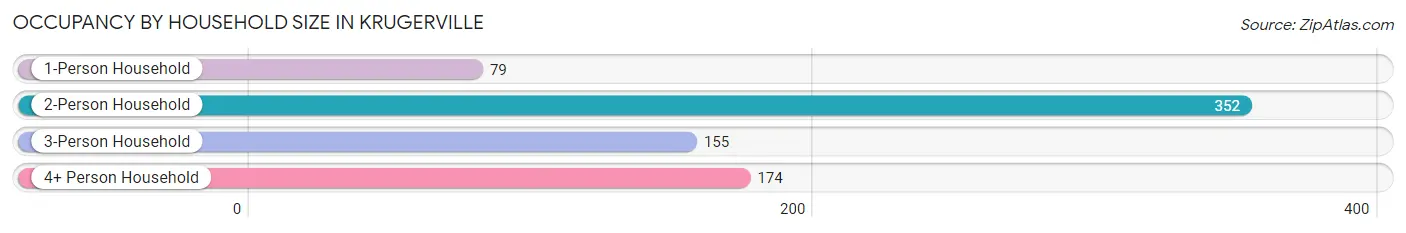
| Household Size | # Housing Units | % Housing Units |
| 1-Person Household | 79 | 10.4% |
| 2-Person Household | 352 | 46.3% |
| 3-Person Household | 155 | 20.4% |
| 4+ Person Household | 174 | 22.9% |
| Total Housing Units | 760 | 100.0% |
Occupancy by Ownership by Household Size in Krugerville
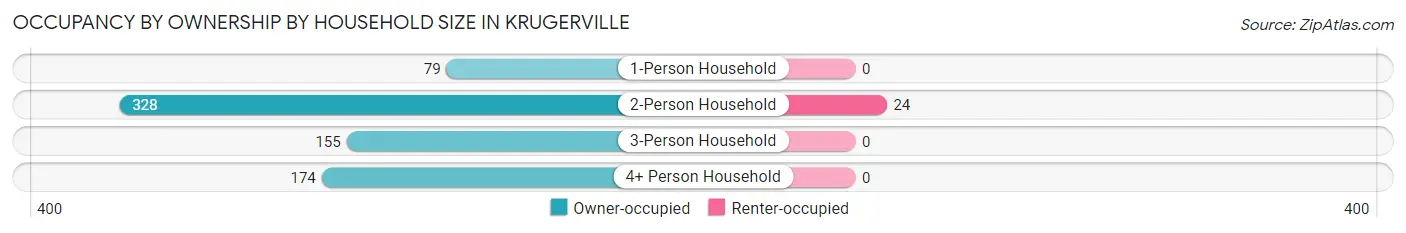
| Household Size | Owner-occupied | Renter-occupied |
| 1-Person Household | 79 (100.0%) | 0 (0.0%) |
| 2-Person Household | 328 (93.2%) | 24 (6.8%) |
| 3-Person Household | 155 (100.0%) | 0 (0.0%) |
| 4+ Person Household | 174 (100.0%) | 0 (0.0%) |
| Total Housing Units | 736 (96.8%) | 24 (3.2%) |
Occupancy by Educational Attainment in Krugerville
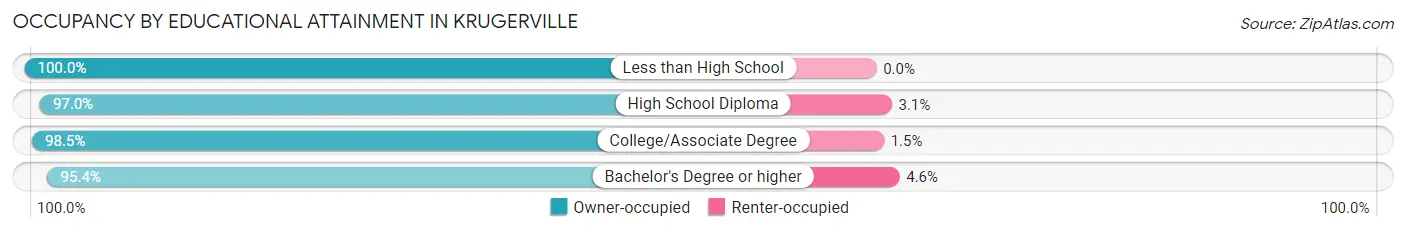
| Household Size | Owner-occupied | Renter-occupied |
| Less than High School | 13 (100.0%) | 0 (0.0%) |
| High School Diploma | 127 (97.0%) | 4 (3.0%) |
| College/Associate Degree | 263 (98.5%) | 4 (1.5%) |
| Bachelor's Degree or higher | 333 (95.4%) | 16 (4.6%) |
Occupancy by Age of Householder in Krugerville
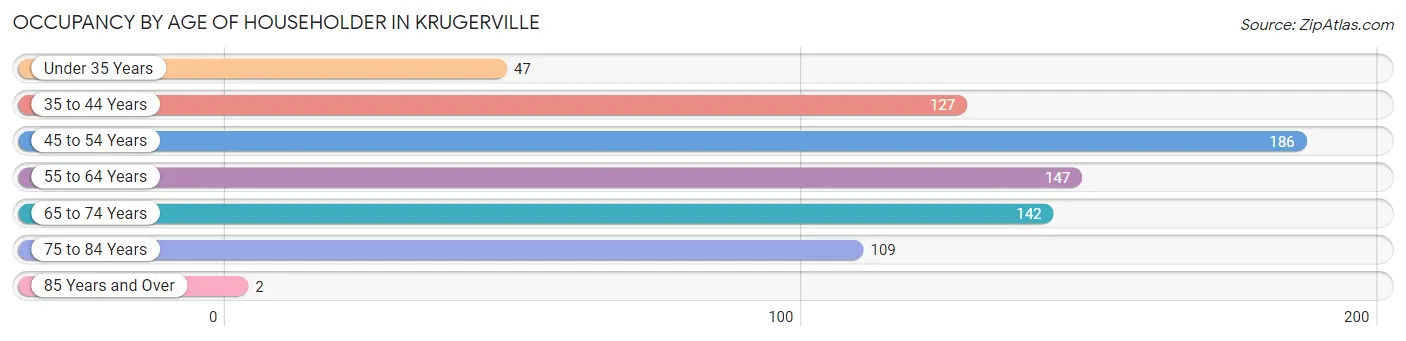
| Age Bracket | # Households | % Households |
| Under 35 Years | 47 | 6.2% |
| 35 to 44 Years | 127 | 16.7% |
| 45 to 54 Years | 186 | 24.5% |
| 55 to 64 Years | 147 | 19.3% |
| 65 to 74 Years | 142 | 18.7% |
| 75 to 84 Years | 109 | 14.3% |
| 85 Years and Over | 2 | 0.3% |
| Total | 760 | 100.0% |
Housing Finances in Krugerville
Median Income by Occupancy in Krugerville
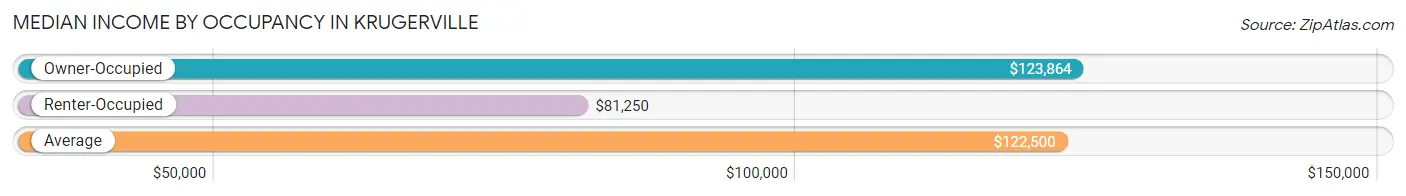
| Occupancy Type | # Households | Median Income |
| Owner-Occupied | 736 (96.8%) | $123,864 |
| Renter-Occupied | 24 (3.2%) | $81,250 |
| Average | 760 (100.0%) | $122,500 |
Occupancy by Householder Income Bracket in Krugerville
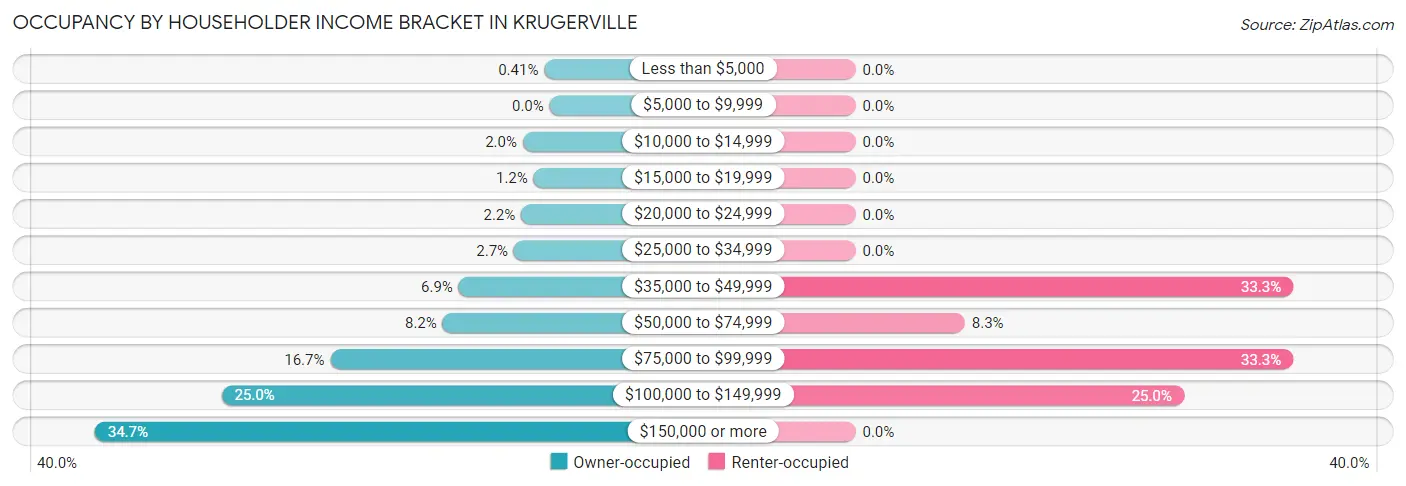
| Income Bracket | Owner-occupied | Renter-occupied |
| Less than $5,000 | 3 (0.4%) | 0 (0.0%) |
| $5,000 to $9,999 | 0 (0.0%) | 0 (0.0%) |
| $10,000 to $14,999 | 15 (2.0%) | 0 (0.0%) |
| $15,000 to $19,999 | 9 (1.2%) | 0 (0.0%) |
| $20,000 to $24,999 | 16 (2.2%) | 0 (0.0%) |
| $25,000 to $34,999 | 20 (2.7%) | 0 (0.0%) |
| $35,000 to $49,999 | 51 (6.9%) | 8 (33.3%) |
| $50,000 to $74,999 | 60 (8.2%) | 2 (8.3%) |
| $75,000 to $99,999 | 123 (16.7%) | 8 (33.3%) |
| $100,000 to $149,999 | 184 (25.0%) | 6 (25.0%) |
| $150,000 or more | 255 (34.6%) | 0 (0.0%) |
| Total | 736 (100.0%) | 24 (100.0%) |
Monthly Housing Cost Tiers in Krugerville
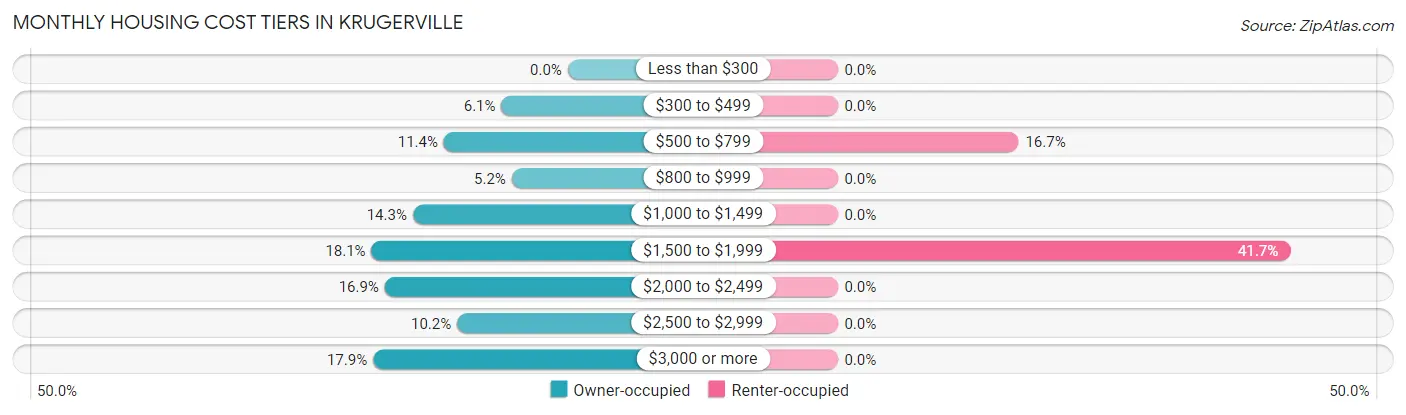
| Monthly Cost | Owner-occupied | Renter-occupied |
| Less than $300 | 0 (0.0%) | 0 (0.0%) |
| $300 to $499 | 45 (6.1%) | 0 (0.0%) |
| $500 to $799 | 84 (11.4%) | 4 (16.7%) |
| $800 to $999 | 38 (5.2%) | 0 (0.0%) |
| $1,000 to $1,499 | 105 (14.3%) | 0 (0.0%) |
| $1,500 to $1,999 | 133 (18.1%) | 10 (41.7%) |
| $2,000 to $2,499 | 124 (16.9%) | 0 (0.0%) |
| $2,500 to $2,999 | 75 (10.2%) | 0 (0.0%) |
| $3,000 or more | 132 (17.9%) | 0 (0.0%) |
| Total | 736 (100.0%) | 24 (100.0%) |
Physical Housing Characteristics in Krugerville
Housing Structures in Krugerville
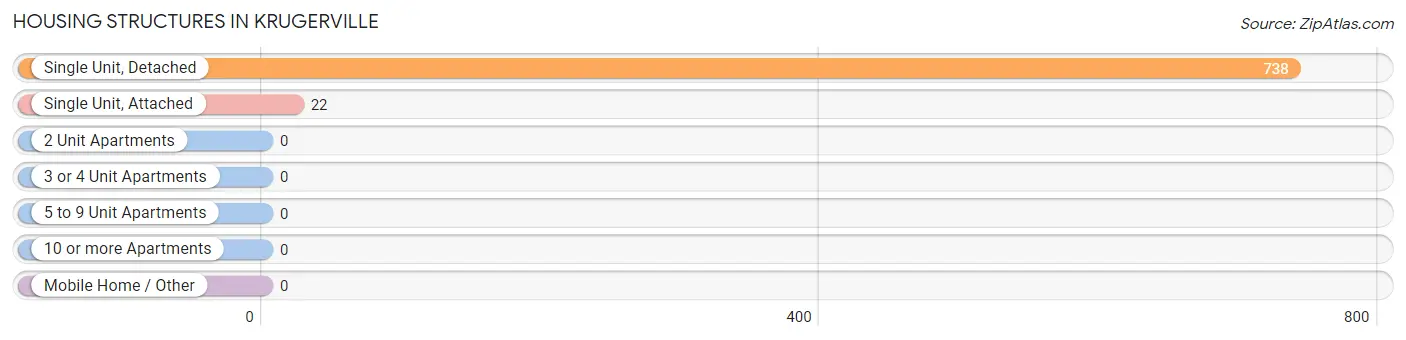
| Structure Type | # Housing Units | % Housing Units |
| Single Unit, Detached | 738 | 97.1% |
| Single Unit, Attached | 22 | 2.9% |
| 2 Unit Apartments | 0 | 0.0% |
| 3 or 4 Unit Apartments | 0 | 0.0% |
| 5 to 9 Unit Apartments | 0 | 0.0% |
| 10 or more Apartments | 0 | 0.0% |
| Mobile Home / Other | 0 | 0.0% |
| Total | 760 | 100.0% |
Housing Structures by Occupancy in Krugerville
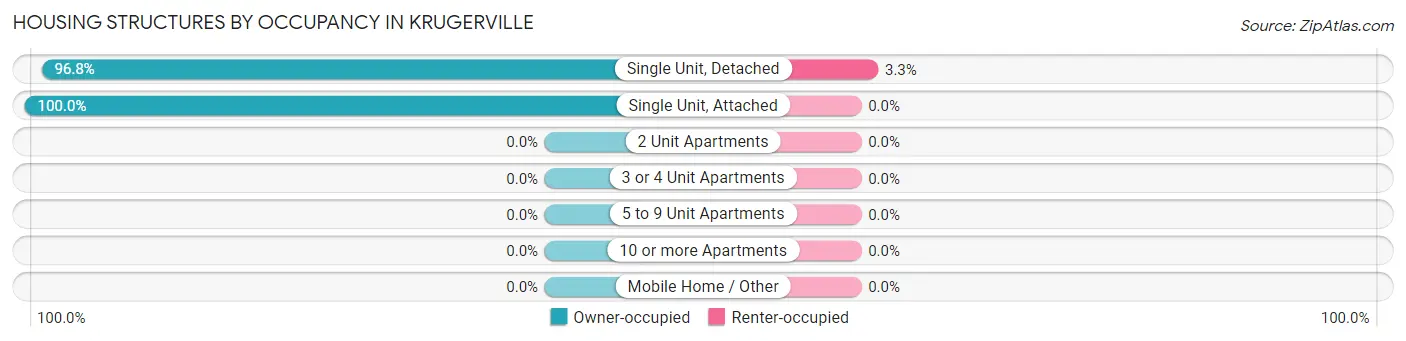
| Structure Type | Owner-occupied | Renter-occupied |
| Single Unit, Detached | 714 (96.8%) | 24 (3.3%) |
| Single Unit, Attached | 22 (100.0%) | 0 (0.0%) |
| 2 Unit Apartments | 0 (0.0%) | 0 (0.0%) |
| 3 or 4 Unit Apartments | 0 (0.0%) | 0 (0.0%) |
| 5 to 9 Unit Apartments | 0 (0.0%) | 0 (0.0%) |
| 10 or more Apartments | 0 (0.0%) | 0 (0.0%) |
| Mobile Home / Other | 0 (0.0%) | 0 (0.0%) |
| Total | 736 (96.8%) | 24 (3.2%) |
Housing Structures by Number of Rooms in Krugerville
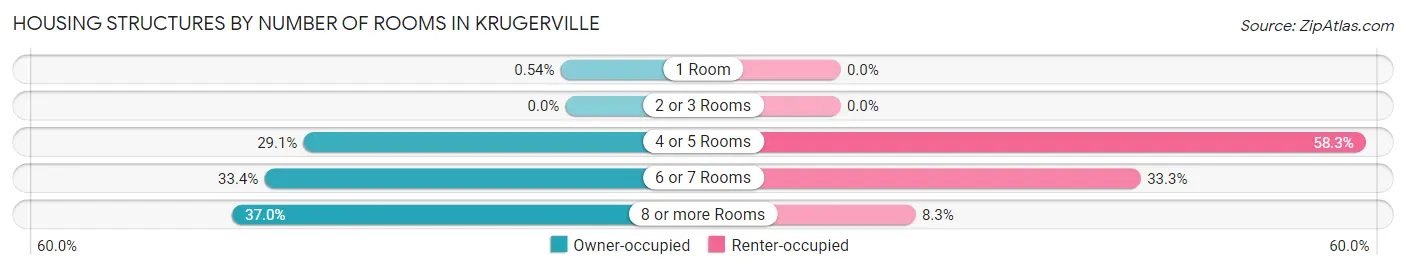
| Number of Rooms | Owner-occupied | Renter-occupied |
| 1 Room | 4 (0.5%) | 0 (0.0%) |
| 2 or 3 Rooms | 0 (0.0%) | 0 (0.0%) |
| 4 or 5 Rooms | 214 (29.1%) | 14 (58.3%) |
| 6 or 7 Rooms | 246 (33.4%) | 8 (33.3%) |
| 8 or more Rooms | 272 (37.0%) | 2 (8.3%) |
| Total | 736 (100.0%) | 24 (100.0%) |
Housing Structure by Heating Type in Krugerville
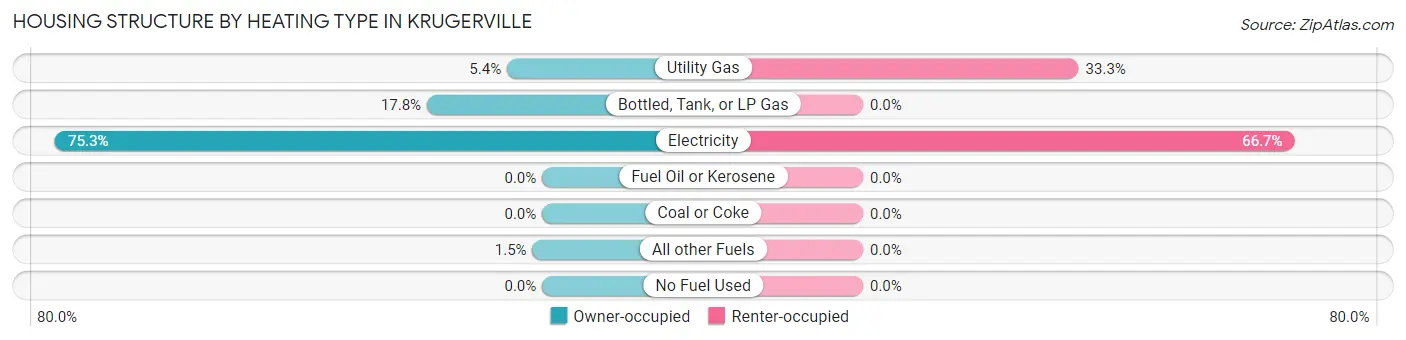
| Heating Type | Owner-occupied | Renter-occupied |
| Utility Gas | 40 (5.4%) | 8 (33.3%) |
| Bottled, Tank, or LP Gas | 131 (17.8%) | 0 (0.0%) |
| Electricity | 554 (75.3%) | 16 (66.7%) |
| Fuel Oil or Kerosene | 0 (0.0%) | 0 (0.0%) |
| Coal or Coke | 0 (0.0%) | 0 (0.0%) |
| All other Fuels | 11 (1.5%) | 0 (0.0%) |
| No Fuel Used | 0 (0.0%) | 0 (0.0%) |
| Total | 736 (100.0%) | 24 (100.0%) |
Household Vehicle Usage in Krugerville
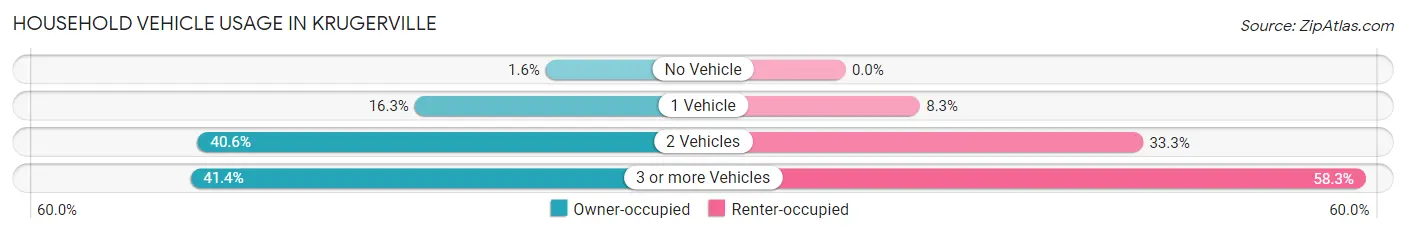
| Vehicles per Household | Owner-occupied | Renter-occupied |
| No Vehicle | 12 (1.6%) | 0 (0.0%) |
| 1 Vehicle | 120 (16.3%) | 2 (8.3%) |
| 2 Vehicles | 299 (40.6%) | 8 (33.3%) |
| 3 or more Vehicles | 305 (41.4%) | 14 (58.3%) |
| Total | 736 (100.0%) | 24 (100.0%) |
Real Estate & Mortgages in Krugerville
Real Estate and Mortgage Overview in Krugerville
| Characteristic | Without Mortgage | With Mortgage |
| Housing Units | 220 | 516 |
| Median Property Value | $315,500 | $362,300 |
| Median Household Income | $84,500 | $205 |
| Monthly Housing Costs | $740 | $132 |
| Real Estate Taxes | $2,985 | $7 |
Property Value by Mortgage Status in Krugerville
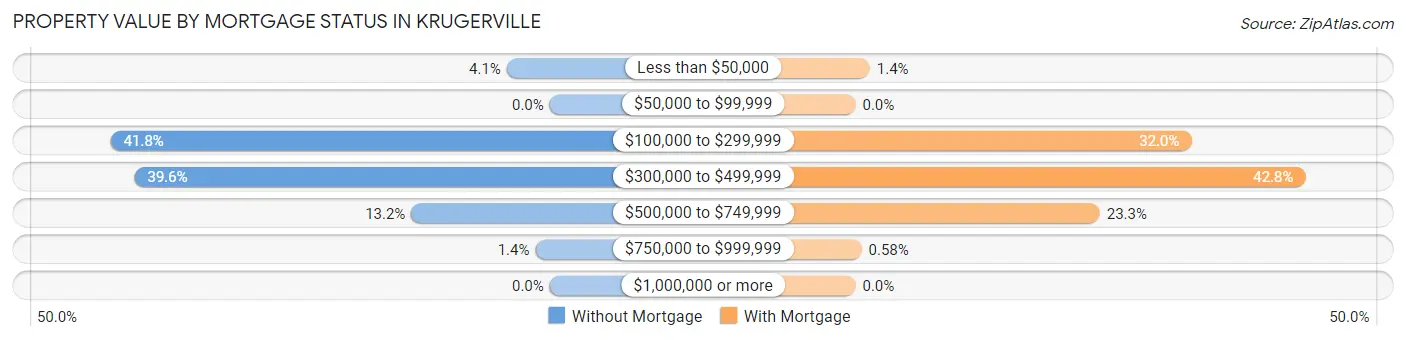
| Property Value | Without Mortgage | With Mortgage |
| Less than $50,000 | 9 (4.1%) | 7 (1.4%) |
| $50,000 to $99,999 | 0 (0.0%) | 0 (0.0%) |
| $100,000 to $299,999 | 92 (41.8%) | 165 (32.0%) |
| $300,000 to $499,999 | 87 (39.6%) | 221 (42.8%) |
| $500,000 to $749,999 | 29 (13.2%) | 120 (23.3%) |
| $750,000 to $999,999 | 3 (1.4%) | 3 (0.6%) |
| $1,000,000 or more | 0 (0.0%) | 0 (0.0%) |
| Total | 220 (100.0%) | 516 (100.0%) |
Household Income by Mortgage Status in Krugerville
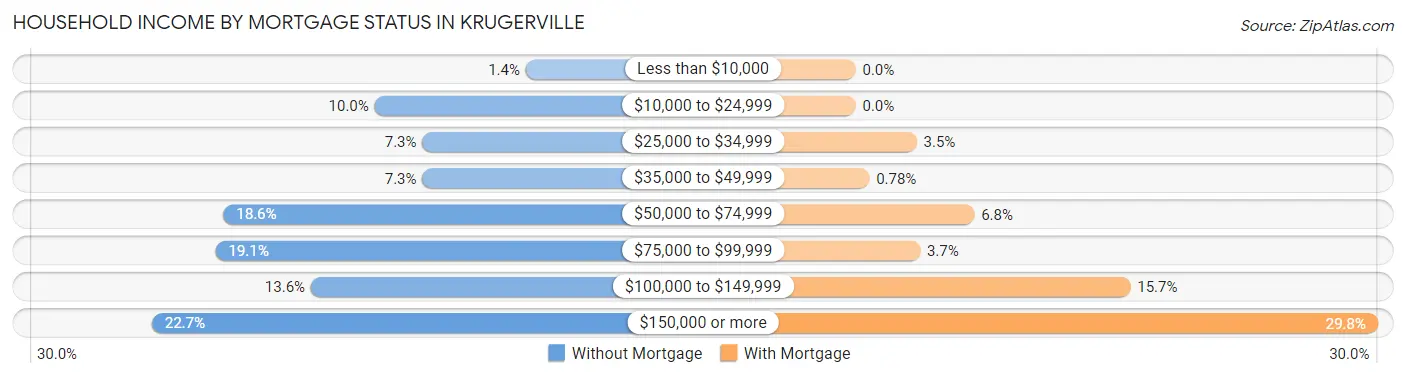
| Household Income | Without Mortgage | With Mortgage |
| Less than $10,000 | 3 (1.4%) | 0 (0.0%) |
| $10,000 to $24,999 | 22 (10.0%) | 0 (0.0%) |
| $25,000 to $34,999 | 16 (7.3%) | 18 (3.5%) |
| $35,000 to $49,999 | 16 (7.3%) | 4 (0.8%) |
| $50,000 to $74,999 | 41 (18.6%) | 35 (6.8%) |
| $75,000 to $99,999 | 42 (19.1%) | 19 (3.7%) |
| $100,000 to $149,999 | 30 (13.6%) | 81 (15.7%) |
| $150,000 or more | 50 (22.7%) | 154 (29.8%) |
| Total | 220 (100.0%) | 516 (100.0%) |
Property Value to Household Income Ratio in Krugerville
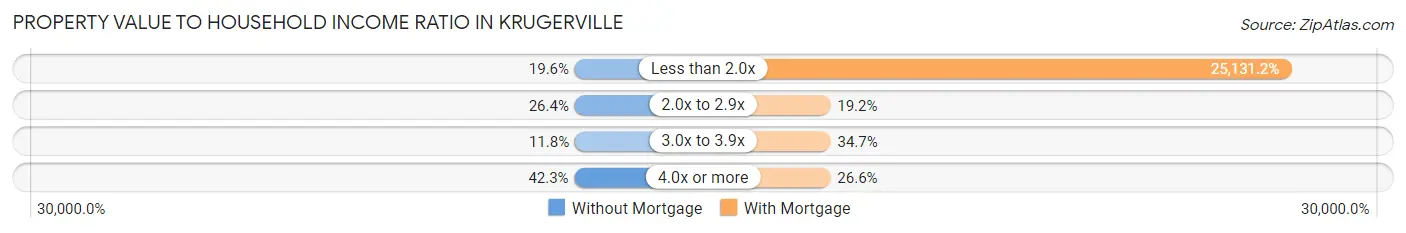
| Value-to-Income Ratio | Without Mortgage | With Mortgage |
| Less than 2.0x | 43 (19.6%) | 129,677 (25,131.2%) |
| 2.0x to 2.9x | 58 (26.4%) | 99 (19.2%) |
| 3.0x to 3.9x | 26 (11.8%) | 179 (34.7%) |
| 4.0x or more | 93 (42.3%) | 137 (26.6%) |
| Total | 220 (100.0%) | 516 (100.0%) |
Real Estate Taxes by Mortgage Status in Krugerville
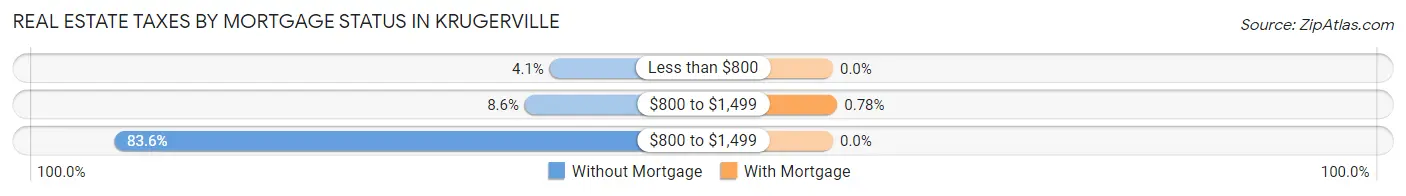
| Property Taxes | Without Mortgage | With Mortgage |
| Less than $800 | 9 (4.1%) | 0 (0.0%) |
| $800 to $1,499 | 19 (8.6%) | 4 (0.8%) |
| $800 to $1,499 | 184 (83.6%) | 0 (0.0%) |
| Total | 220 (100.0%) | 516 (100.0%) |
Health & Disability in Krugerville
Health Insurance Coverage by Age in Krugerville
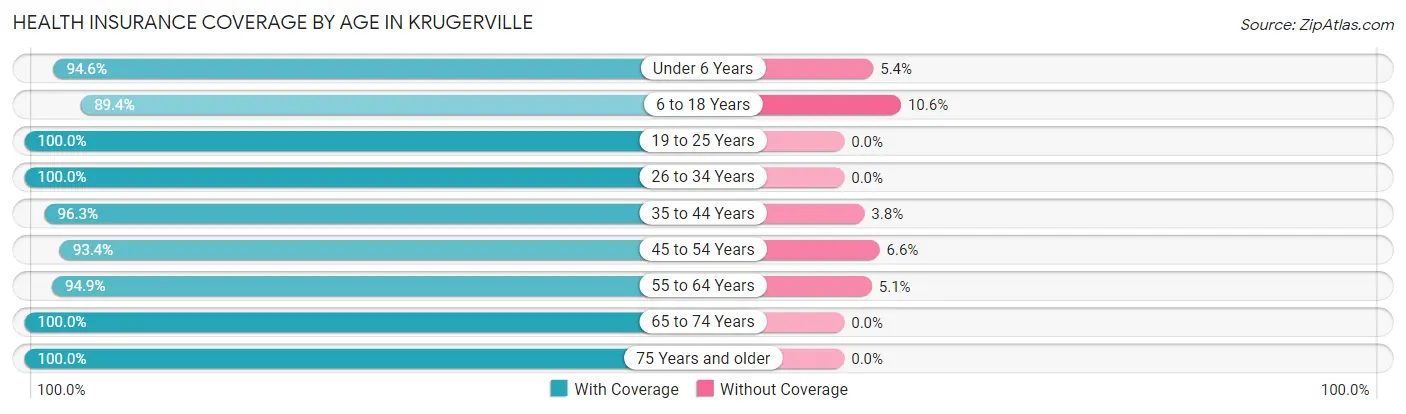
| Age Bracket | With Coverage | Without Coverage |
| Under 6 Years | 70 (94.6%) | 4 (5.4%) |
| 6 to 18 Years | 313 (89.4%) | 37 (10.6%) |
| 19 to 25 Years | 124 (100.0%) | 0 (0.0%) |
| 26 to 34 Years | 137 (100.0%) | 0 (0.0%) |
| 35 to 44 Years | 257 (96.3%) | 10 (3.7%) |
| 45 to 54 Years | 355 (93.4%) | 25 (6.6%) |
| 55 to 64 Years | 240 (94.9%) | 13 (5.1%) |
| 65 to 74 Years | 266 (100.0%) | 0 (0.0%) |
| 75 Years and older | 173 (100.0%) | 0 (0.0%) |
| Total | 1,935 (95.6%) | 89 (4.4%) |
Health Insurance Coverage by Citizenship Status in Krugerville
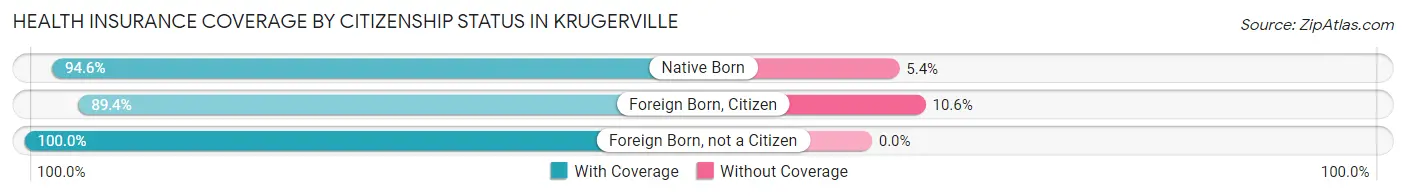
| Citizenship Status | With Coverage | Without Coverage |
| Native Born | 70 (94.6%) | 4 (5.4%) |
| Foreign Born, Citizen | 313 (89.4%) | 37 (10.6%) |
| Foreign Born, not a Citizen | 124 (100.0%) | 0 (0.0%) |
Health Insurance Coverage by Household Income in Krugerville
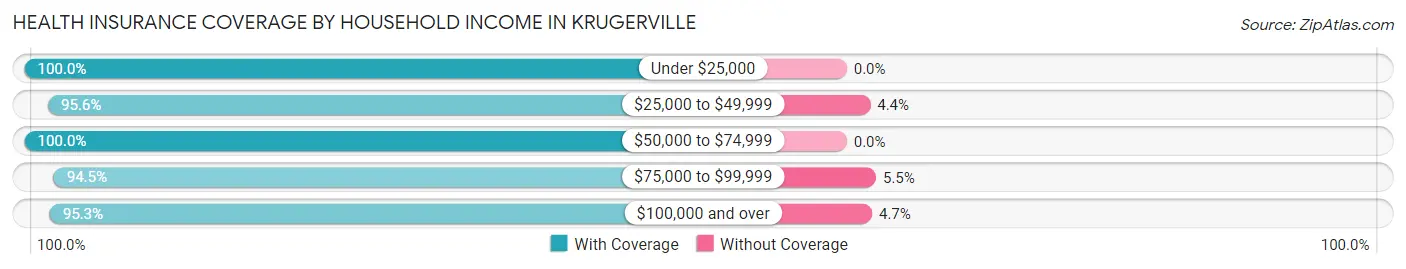
| Household Income | With Coverage | Without Coverage |
| Under $25,000 | 49 (100.0%) | 0 (0.0%) |
| $25,000 to $49,999 | 152 (95.6%) | 7 (4.4%) |
| $50,000 to $74,999 | 138 (100.0%) | 0 (0.0%) |
| $75,000 to $99,999 | 328 (94.5%) | 19 (5.5%) |
| $100,000 and over | 1,268 (95.3%) | 63 (4.7%) |
Public vs Private Health Insurance Coverage by Age in Krugerville
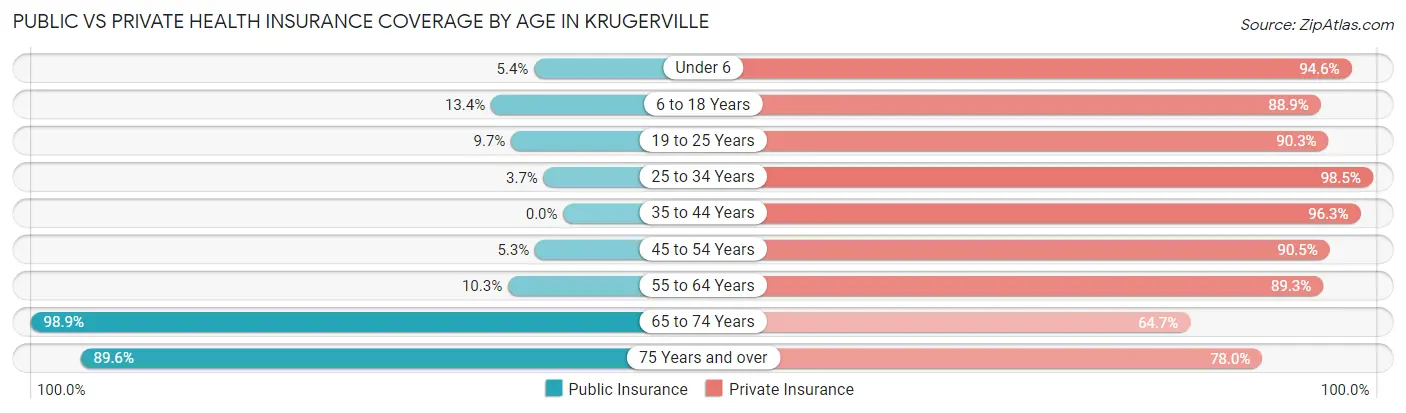
| Age Bracket | Public Insurance | Private Insurance |
| Under 6 | 4 (5.4%) | 70 (94.6%) |
| 6 to 18 Years | 47 (13.4%) | 311 (88.9%) |
| 19 to 25 Years | 12 (9.7%) | 112 (90.3%) |
| 25 to 34 Years | 5 (3.6%) | 135 (98.5%) |
| 35 to 44 Years | 0 (0.0%) | 257 (96.3%) |
| 45 to 54 Years | 20 (5.3%) | 344 (90.5%) |
| 55 to 64 Years | 26 (10.3%) | 226 (89.3%) |
| 65 to 74 Years | 263 (98.9%) | 172 (64.7%) |
| 75 Years and over | 155 (89.6%) | 135 (78.0%) |
| Total | 532 (26.3%) | 1,762 (87.1%) |
Disability Status by Sex by Age in Krugerville
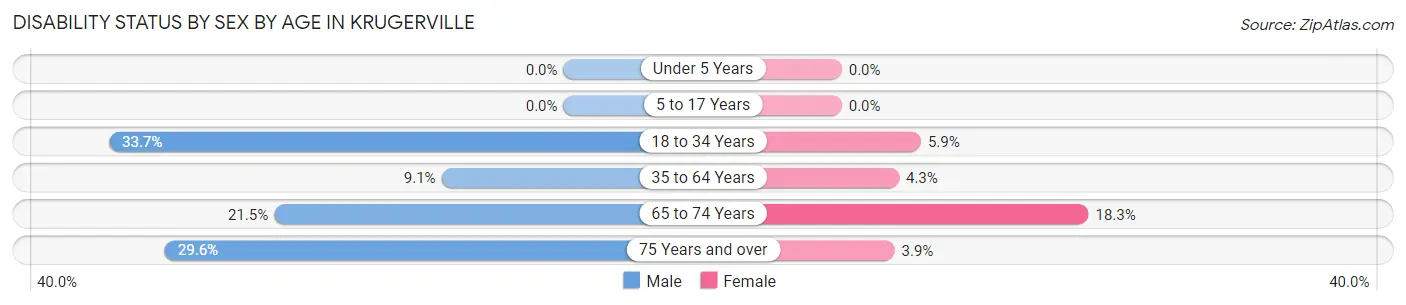
| Age Bracket | Male | Female |
| Under 5 Years | 0 (0.0%) | 0 (0.0%) |
| 5 to 17 Years | 0 (0.0%) | 0 (0.0%) |
| 18 to 34 Years | 57 (33.7%) | 7 (5.9%) |
| 35 to 64 Years | 41 (9.0%) | 19 (4.3%) |
| 65 to 74 Years | 29 (21.5%) | 24 (18.3%) |
| 75 Years and over | 21 (29.6%) | 4 (3.9%) |
Disability Class by Sex by Age in Krugerville
Disability Class: Hearing Difficulty
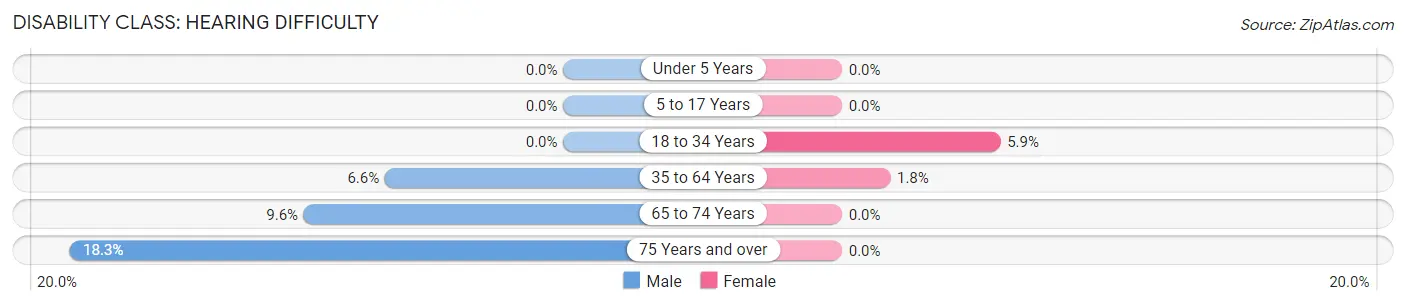
| Age Bracket | Male | Female |
| Under 5 Years | 0 (0.0%) | 0 (0.0%) |
| 5 to 17 Years | 0 (0.0%) | 0 (0.0%) |
| 18 to 34 Years | 0 (0.0%) | 7 (5.9%) |
| 35 to 64 Years | 30 (6.6%) | 8 (1.8%) |
| 65 to 74 Years | 13 (9.6%) | 0 (0.0%) |
| 75 Years and over | 13 (18.3%) | 0 (0.0%) |
Disability Class: Vision Difficulty
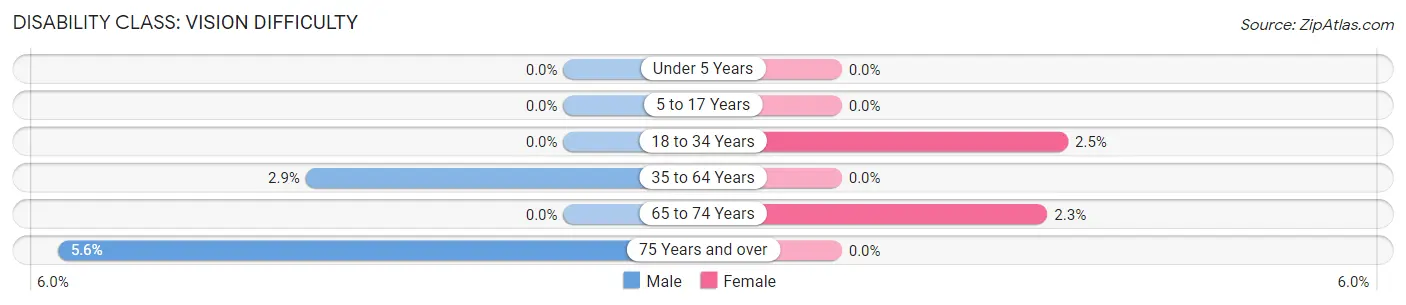
| Age Bracket | Male | Female |
| Under 5 Years | 0 (0.0%) | 0 (0.0%) |
| 5 to 17 Years | 0 (0.0%) | 0 (0.0%) |
| 18 to 34 Years | 0 (0.0%) | 3 (2.5%) |
| 35 to 64 Years | 13 (2.9%) | 0 (0.0%) |
| 65 to 74 Years | 0 (0.0%) | 3 (2.3%) |
| 75 Years and over | 4 (5.6%) | 0 (0.0%) |
Disability Class: Cognitive Difficulty
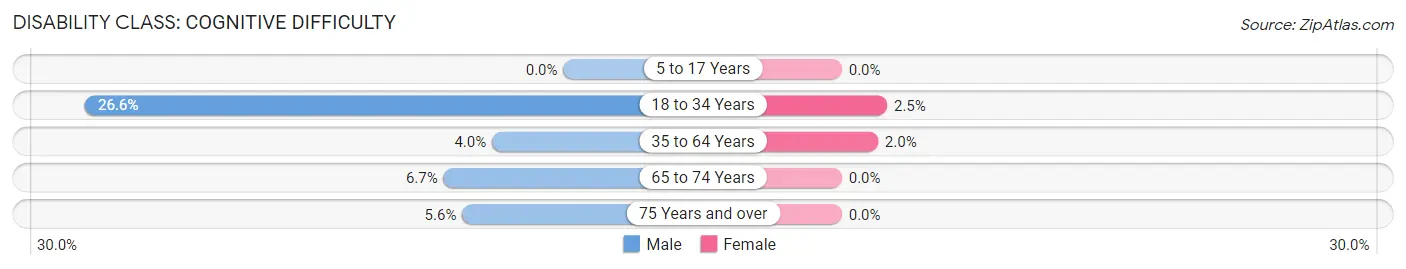
| Age Bracket | Male | Female |
| 5 to 17 Years | 0 (0.0%) | 0 (0.0%) |
| 18 to 34 Years | 45 (26.6%) | 3 (2.5%) |
| 35 to 64 Years | 18 (4.0%) | 9 (2.0%) |
| 65 to 74 Years | 9 (6.7%) | 0 (0.0%) |
| 75 Years and over | 4 (5.6%) | 0 (0.0%) |
Disability Class: Ambulatory Difficulty
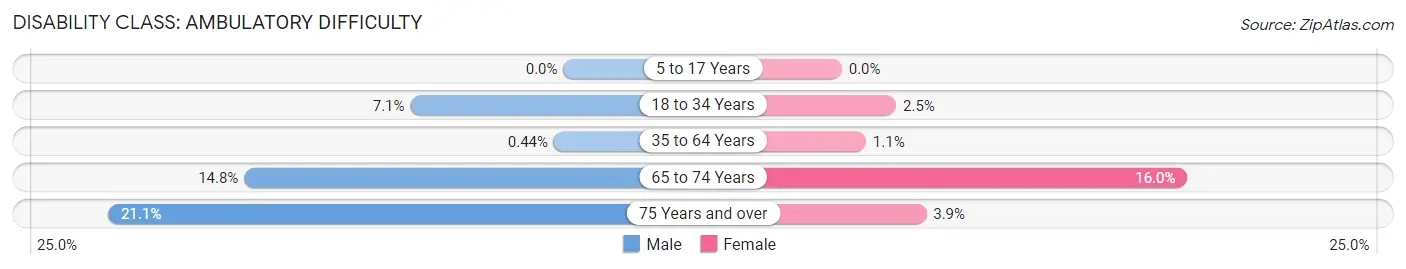
| Age Bracket | Male | Female |
| 5 to 17 Years | 0 (0.0%) | 0 (0.0%) |
| 18 to 34 Years | 12 (7.1%) | 3 (2.5%) |
| 35 to 64 Years | 2 (0.4%) | 5 (1.1%) |
| 65 to 74 Years | 20 (14.8%) | 21 (16.0%) |
| 75 Years and over | 15 (21.1%) | 4 (3.9%) |
Disability Class: Self-Care Difficulty
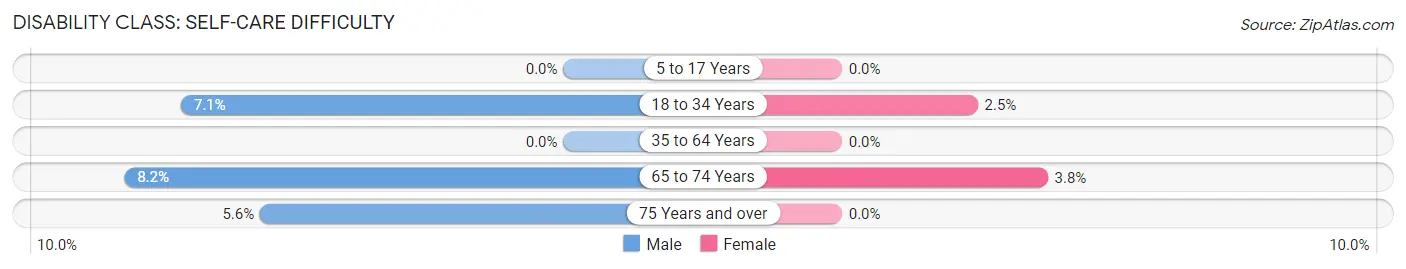
| Age Bracket | Male | Female |
| 5 to 17 Years | 0 (0.0%) | 0 (0.0%) |
| 18 to 34 Years | 12 (7.1%) | 3 (2.5%) |
| 35 to 64 Years | 0 (0.0%) | 0 (0.0%) |
| 65 to 74 Years | 11 (8.2%) | 5 (3.8%) |
| 75 Years and over | 4 (5.6%) | 0 (0.0%) |
Technology Access in Krugerville
Computing Device Access in Krugerville
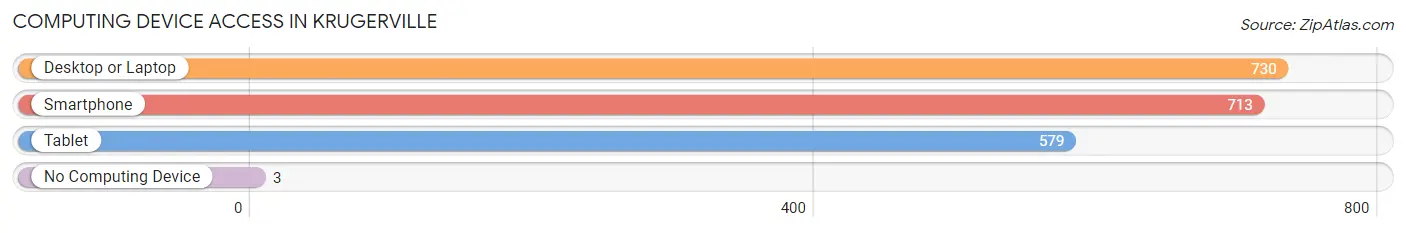
| Device Type | # Households | % Households |
| Desktop or Laptop | 730 | 96.1% |
| Smartphone | 713 | 93.8% |
| Tablet | 579 | 76.2% |
| No Computing Device | 3 | 0.4% |
| Total | 760 | 100.0% |
Internet Access in Krugerville
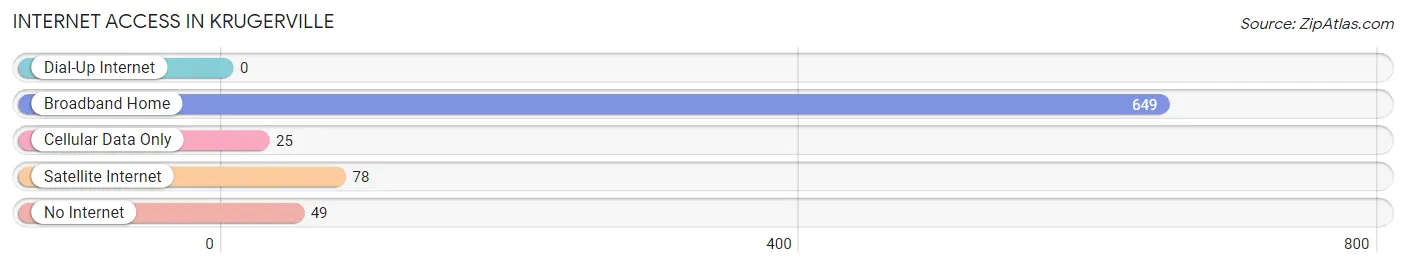
| Internet Type | # Households | % Households |
| Dial-Up Internet | 0 | 0.0% |
| Broadband Home | 649 | 85.4% |
| Cellular Data Only | 25 | 3.3% |
| Satellite Internet | 78 | 10.3% |
| No Internet | 49 | 6.5% |
| Total | 760 | 100.0% |
Krugerville Summary
Krugerville is a small town located in Denton County, Texas, United States. It is situated about 30 miles north of Dallas and is part of the Dallas-Fort Worth-Arlington metropolitan area. The population of Krugerville was 1,845 at the 2010 census.
History
Krugerville was founded in 1876 by German immigrant, John Krug. He purchased land in the area and built a general store, which became the center of the community. The town was named after him and was incorporated in 1882.
Krugerville was a farming community for many years, with cotton and corn being the main crops. In the early 1900s, the town began to grow as more people moved to the area. The population peaked in the 1940s, when it reached over 2,000 people.
In the 1950s, the town began to decline as people moved away to larger cities. By the 1970s, the population had dropped to just over 1,000. In recent years, the population has stabilized and the town has seen some growth.
Geography
Krugerville is located at 33°14'N 97°14'W (33.23, -97.23). It is situated in the northern part of Denton County, about 30 miles north of Dallas. The town is located on the banks of the Elm Fork of the Trinity River.
The terrain around Krugerville is mostly flat, with some rolling hills. The climate is humid subtropical, with hot summers and mild winters.
Economy
Krugerville is a small, rural town with a limited economy. The main industries in the area are agriculture and tourism.
Agriculture is the main economic activity in the area. The town is surrounded by farms, which produce cotton, corn, hay, and other crops. There are also several cattle ranches in the area.
Tourism is also an important part of the local economy. The town is home to several historic sites, including the Krugerville Cemetery and the Krugerville Museum. The town also hosts several festivals and events throughout the year, including the Krugerville Country Fair and the Krugerville Music Festival.
Demographics
As of the 2010 census, there were 1,845 people, 690 households, and 517 families living in Krugerville. The population density was 545.3 people per square mile (210.9/km2). The racial makeup of the town was 87.2% White, 5.2% African American, 0.3% Native American, 0.7% Asian, 4.2% from other races, and 2.5% from two or more races. Hispanic or Latino of any race were 8.7% of the population.
The median income for a household in Krugerville was $45,000, and the median income for a family was $50,000. Males had a median income of $35,000 versus $25,000 for females. The per capita income for the town was $19,000. About 8.2% of families and 10.2% of the population were below the poverty line, including 14.2% of those under age 18 and 8.3% of those age 65 or over.
Common Questions
What is Per Capita Income in Krugerville?
Per Capita income in Krugerville is $50,048.
What is the Median Family Income in Krugerville?
Median Family Income in Krugerville is $125,313.
What is the Median Household income in Krugerville?
Median Household Income in Krugerville is $122,500.
What is Income or Wage Gap in Krugerville?
Income or Wage Gap in Krugerville is 51.2%.
Women in Krugerville earn 48.8 cents for every dollar earned by a man.
What is Inequality or Gini Index in Krugerville?
Inequality or Gini Index in Krugerville is 0.34.
What is the Total Population of Krugerville?
Total Population of Krugerville is 2,024.
What is the Total Male Population of Krugerville?
Total Male Population of Krugerville is 1,024.
What is the Total Female Population of Krugerville?
Total Female Population of Krugerville is 1,000.
What is the Ratio of Males per 100 Females in Krugerville?
There are 102.40 Males per 100 Females in Krugerville.
What is the Ratio of Females per 100 Males in Krugerville?
There are 97.66 Females per 100 Males in Krugerville.
What is the Median Population Age in Krugerville?
Median Population Age in Krugerville is 46.4 Years.
What is the Average Family Size in Krugerville
Average Family Size in Krugerville is 2.9 People.
What is the Average Household Size in Krugerville
Average Household Size in Krugerville is 2.7 People.
How Large is the Labor Force in Krugerville?
There are 1,073 People in the Labor Forcein in Krugerville.
What is the Percentage of People in the Labor Force in Krugerville?
64.0% of People are in the Labor Force in Krugerville.
What is the Unemployment Rate in Krugerville?
Unemployment Rate in Krugerville is 3.5%.