Craigsville, VA Map & Demographics
Craigsville Map
Craigsville Overview
$25,918
PER CAPITA INCOME
$55,795
AVG FAMILY INCOME
$31,667
AVG HOUSEHOLD INCOME
33.1%
WAGE / INCOME GAP [ % ]
66.9¢/ $1
WAGE / INCOME GAP [ $ ]
$7,957
FAMILY INCOME DEFICIT
0.46
INEQUALITY / GINI INDEX
931
TOTAL POPULATION
396
MALE POPULATION
535
FEMALE POPULATION
74.02
MALES / 100 FEMALES
135.10
FEMALES / 100 MALES
43.0
MEDIAN AGE
2.9
AVG FAMILY SIZE
2.0
AVG HOUSEHOLD SIZE
362
LABOR FORCE [ PEOPLE ]
48.1%
PERCENT IN LABOR FORCE
5.2%
UNEMPLOYMENT RATE
Craigsville Zip Codes
Craigsville Area Codes
Income in Craigsville
Income Overview in Craigsville
Per Capita Income in Craigsville is $25,918, while median incomes of families and households are $55,795 and $31,667 respectively.
| Characteristic | Number | Measure |
| Per Capita Income | 931 | $25,918 |
| Median Family Income | 233 | $55,795 |
| Mean Family Income | 233 | $71,194 |
| Median Household Income | 458 | $31,667 |
| Mean Household Income | 458 | $51,579 |
| Income Deficit | 233 | $7,957 |
| Wage / Income Gap (%) | 931 | 33.11% |
| Wage / Income Gap ($) | 931 | 66.89¢ per $1 |
| Gini / Inequality Index | 931 | 0.46 |
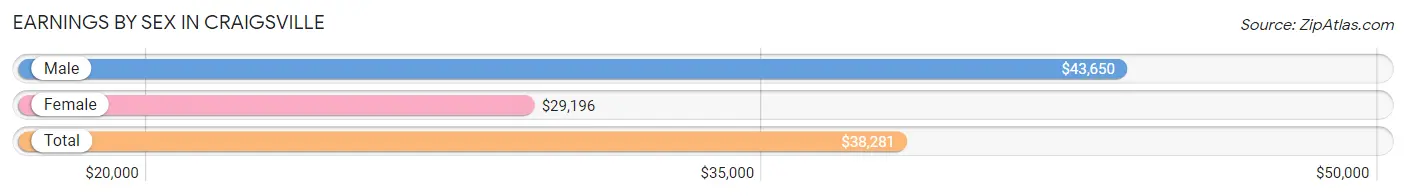
Earnings by Sex in Craigsville
Average Earnings in Craigsville are $38,281, $43,650 for men and $29,196 for women, a difference of 33.1%.
| Sex | Number | Average Earnings |
| Male | 205 (51.5%) | $43,650 |
| Female | 193 (48.5%) | $29,196 |
| Total | 398 (100.0%) | $38,281 |
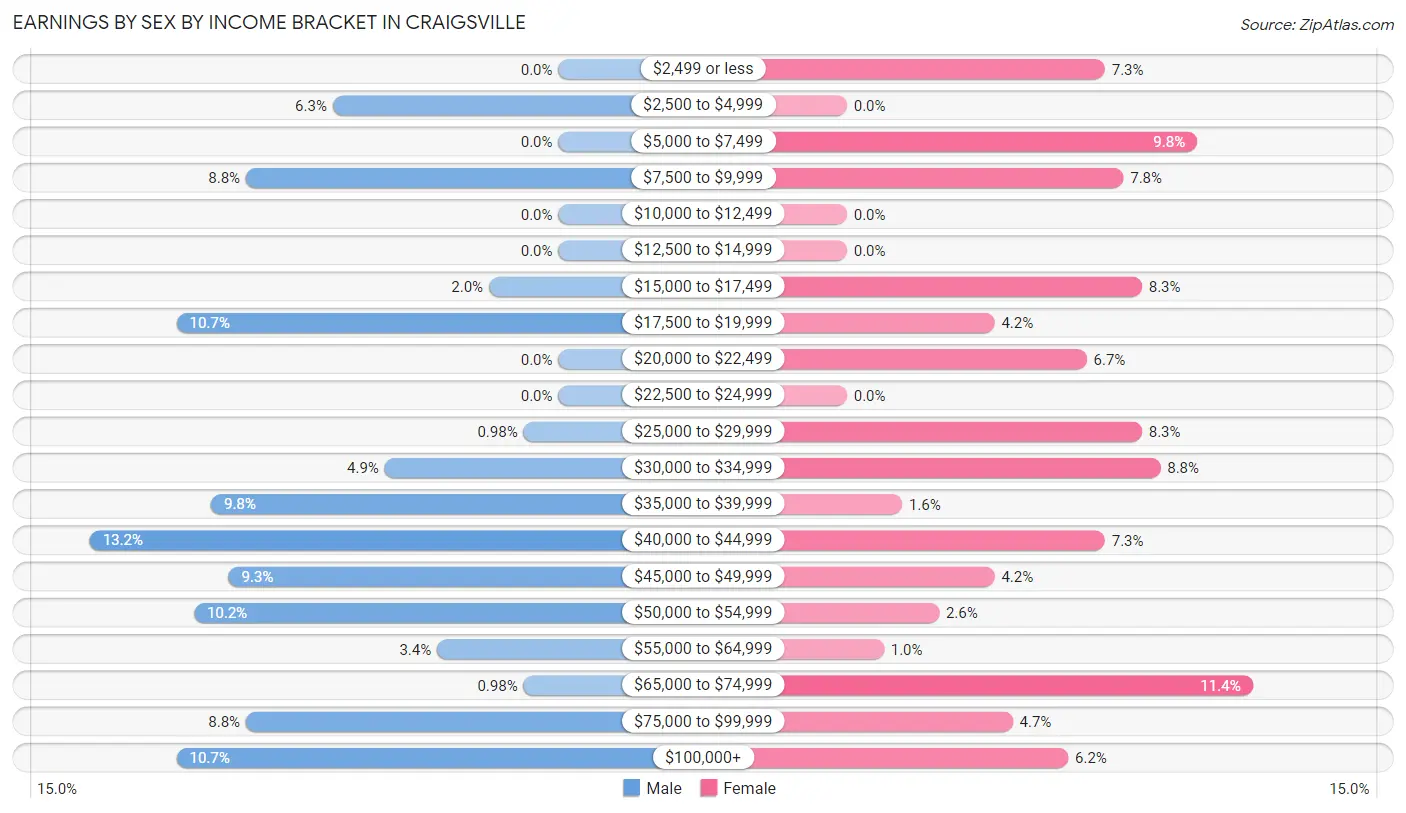
Earnings by Sex by Income Bracket in Craigsville
The most common earnings brackets in Craigsville are $40,000 to $44,999 for men (27 | 13.2%) and $65,000 to $74,999 for women (22 | 11.4%).
| Income | Male | Female |
| $2,499 or less | 0 (0.0%) | 14 (7.2%) |
| $2,500 to $4,999 | 13 (6.3%) | 0 (0.0%) |
| $5,000 to $7,499 | 0 (0.0%) | 19 (9.8%) |
| $7,500 to $9,999 | 18 (8.8%) | 15 (7.8%) |
| $10,000 to $12,499 | 0 (0.0%) | 0 (0.0%) |
| $12,500 to $14,999 | 0 (0.0%) | 0 (0.0%) |
| $15,000 to $17,499 | 4 (1.9%) | 16 (8.3%) |
| $17,500 to $19,999 | 22 (10.7%) | 8 (4.2%) |
| $20,000 to $22,499 | 0 (0.0%) | 13 (6.7%) |
| $22,500 to $24,999 | 0 (0.0%) | 0 (0.0%) |
| $25,000 to $29,999 | 2 (1.0%) | 16 (8.3%) |
| $30,000 to $34,999 | 10 (4.9%) | 17 (8.8%) |
| $35,000 to $39,999 | 20 (9.8%) | 3 (1.5%) |
| $40,000 to $44,999 | 27 (13.2%) | 14 (7.2%) |
| $45,000 to $49,999 | 19 (9.3%) | 8 (4.2%) |
| $50,000 to $54,999 | 21 (10.2%) | 5 (2.6%) |
| $55,000 to $64,999 | 7 (3.4%) | 2 (1.0%) |
| $65,000 to $74,999 | 2 (1.0%) | 22 (11.4%) |
| $75,000 to $99,999 | 18 (8.8%) | 9 (4.7%) |
| $100,000+ | 22 (10.7%) | 12 (6.2%) |
| Total | 205 (100.0%) | 193 (100.0%) |
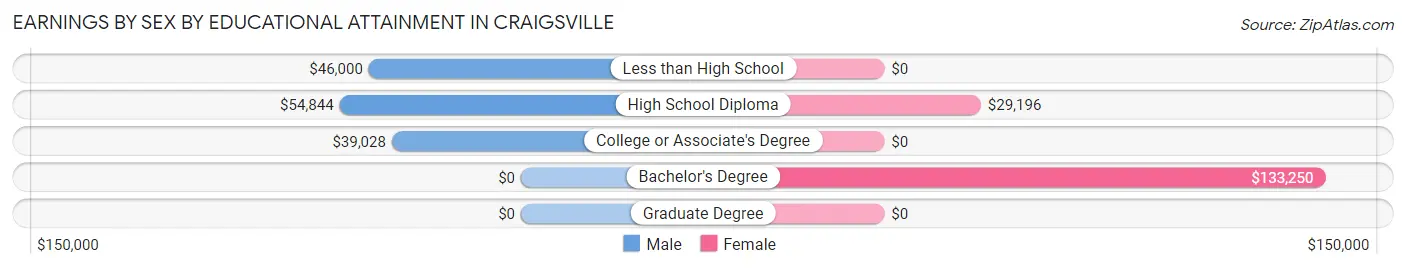
Earnings by Sex by Educational Attainment in Craigsville
Average earnings in Craigsville are $49,167 for men and $33,409 for women, a difference of 32.1%. Men with an educational attainment of high school diploma enjoy the highest average annual earnings of $54,844, while those with college or associate's degree education earn the least with $39,028. Women with an educational attainment of bachelor's degree earn the most with the average annual earnings of $133,250, while those with high school diploma education have the smallest earnings of $29,196.
| Educational Attainment | Male Income | Female Income |
| Less than High School | $46,000 | $0 |
| High School Diploma | $54,844 | $29,196 |
| College or Associate's Degree | $39,028 | $0 |
| Bachelor's Degree | - | - |
| Graduate Degree | - | - |
| Total | $49,167 | $33,409 |
Family Income in Craigsville
Family Income Brackets in Craigsville
According to the Craigsville family income data, there are 71 families falling into the $100,000 to $149,999 income range, which is the most common income bracket and makes up 30.5% of all families.
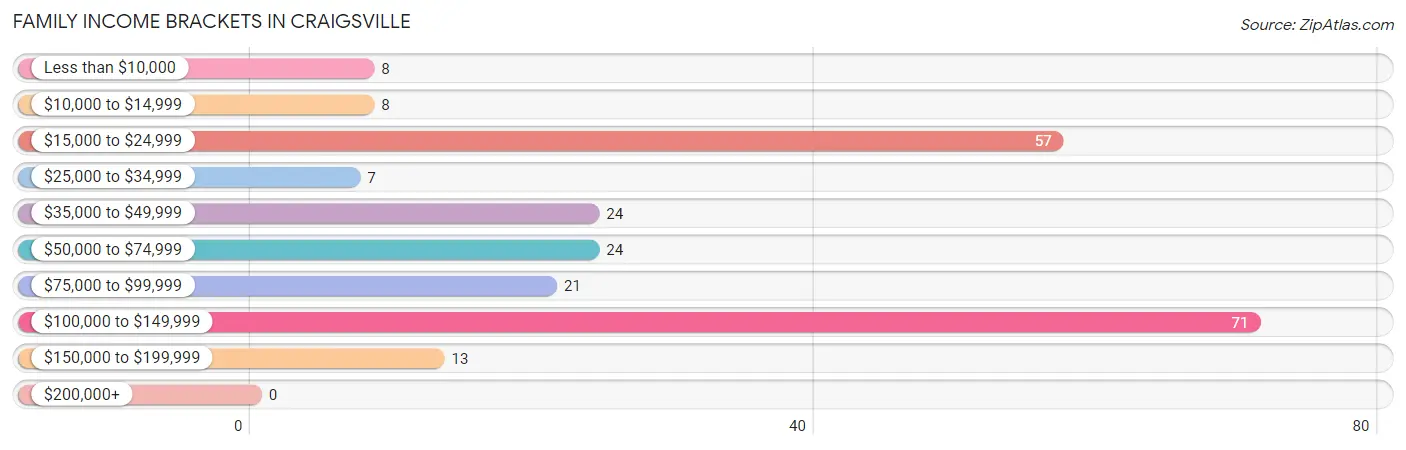
| Income Bracket | # Families | % Families |
| Less than $10,000 | 8 | 3.4% |
| $10,000 to $14,999 | 8 | 3.4% |
| $15,000 to $24,999 | 57 | 24.5% |
| $25,000 to $34,999 | 7 | 3.0% |
| $35,000 to $49,999 | 24 | 10.3% |
| $50,000 to $74,999 | 24 | 10.3% |
| $75,000 to $99,999 | 21 | 9.0% |
| $100,000 to $149,999 | 71 | 30.5% |
| $150,000 to $199,999 | 13 | 5.6% |
| $200,000+ | 0 | 0.0% |
Family Income by Famaliy Size in Craigsville
2-person families (119 | 51.1%) account for the highest median family income in Craigsville with $103,438 per family, while 2-person families (119 | 51.1%) have the highest median income of $51,719 per family member.
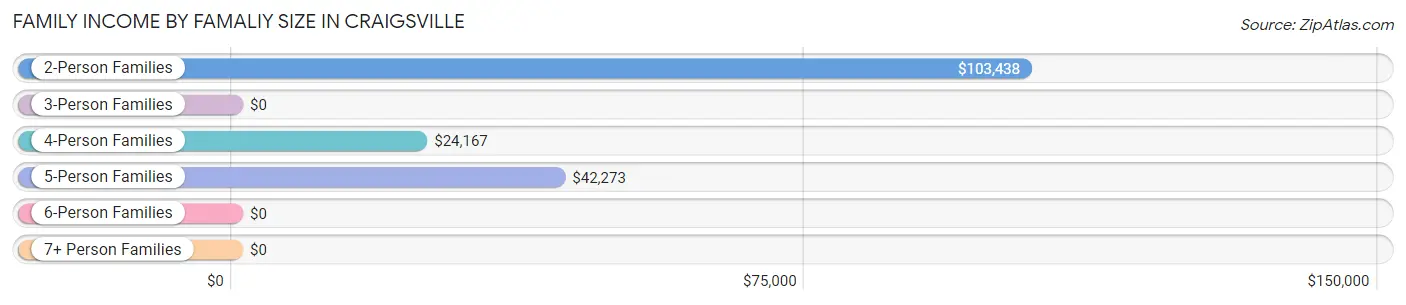
| Income Bracket | # Families | Median Income |
| 2-Person Families | 119 (51.1%) | $103,438 |
| 3-Person Families | 64 (27.5%) | $0 |
| 4-Person Families | 30 (12.9%) | $24,167 |
| 5-Person Families | 20 (8.6%) | $42,273 |
| 6-Person Families | 0 (0.0%) | $0 |
| 7+ Person Families | 0 (0.0%) | $0 |
| Total | 233 (100.0%) | $55,795 |
Family Income by Number of Earners in Craigsville
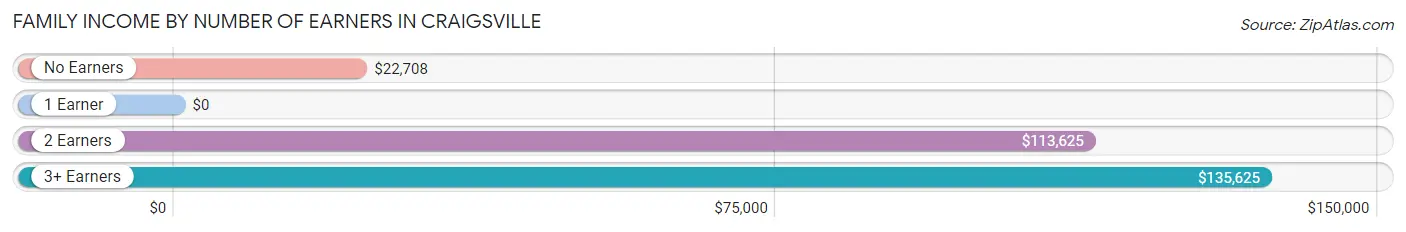
| Number of Earners | # Families | Median Income |
| No Earners | 37 (15.9%) | $22,708 |
| 1 Earner | 110 (47.2%) | $0 |
| 2 Earners | 79 (33.9%) | $113,625 |
| 3+ Earners | 7 (3.0%) | $135,625 |
| Total | 233 (100.0%) | $55,795 |
Household Income in Craigsville
Household Income Brackets in Craigsville
With 145 households falling in the category, the $15,000 to $24,999 income range is the most frequent in Craigsville, accounting for 31.7% of all households.
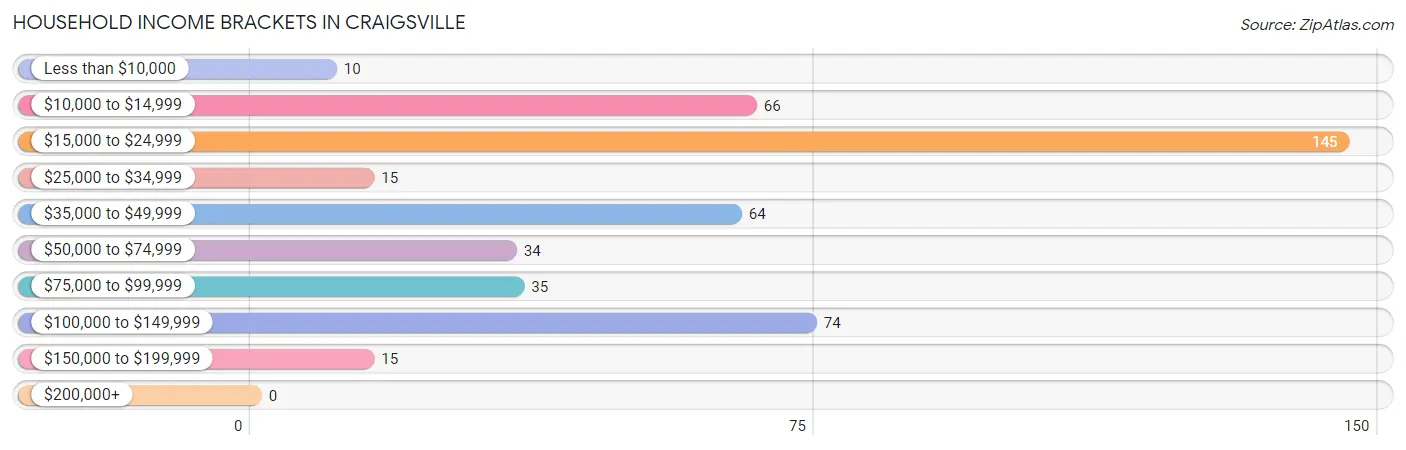
| Income Bracket | # Households | % Households |
| Less than $10,000 | 10 | 2.2% |
| $10,000 to $14,999 | 66 | 14.4% |
| $15,000 to $24,999 | 145 | 31.7% |
| $25,000 to $34,999 | 15 | 3.3% |
| $35,000 to $49,999 | 64 | 14.0% |
| $50,000 to $74,999 | 34 | 7.4% |
| $75,000 to $99,999 | 35 | 7.6% |
| $100,000 to $149,999 | 74 | 16.2% |
| $150,000 to $199,999 | 15 | 3.3% |
| $200,000+ | 0 | 0.0% |
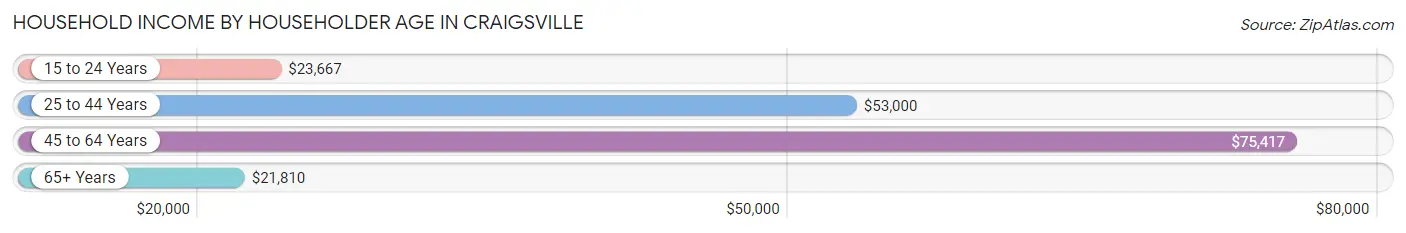
Household Income by Householder Age in Craigsville
The median household income in Craigsville is $31,667, with the highest median household income of $75,417 found in the 45 to 64 years age bracket for the primary householder. A total of 119 households (26.0%) fall into this category. Meanwhile, the 65+ years age bracket for the primary householder has the lowest median household income of $21,810, with 203 households (44.3%) in this group.
| Income Bracket | # Households | Median Income |
| 15 to 24 Years | 48 (10.5%) | $23,667 |
| 25 to 44 Years | 88 (19.2%) | $53,000 |
| 45 to 64 Years | 119 (26.0%) | $75,417 |
| 65+ Years | 203 (44.3%) | $21,810 |
| Total | 458 (100.0%) | $31,667 |
Poverty in Craigsville
Income Below Poverty by Sex and Age in Craigsville
With 26.5% poverty level for males and 34.0% for females among the residents of Craigsville, under 5 year old males and 16 and 17 year old females are the most vulnerable to poverty, with 30 males (88.2%) and 7 females (77.8%) in their respective age groups living below the poverty level.
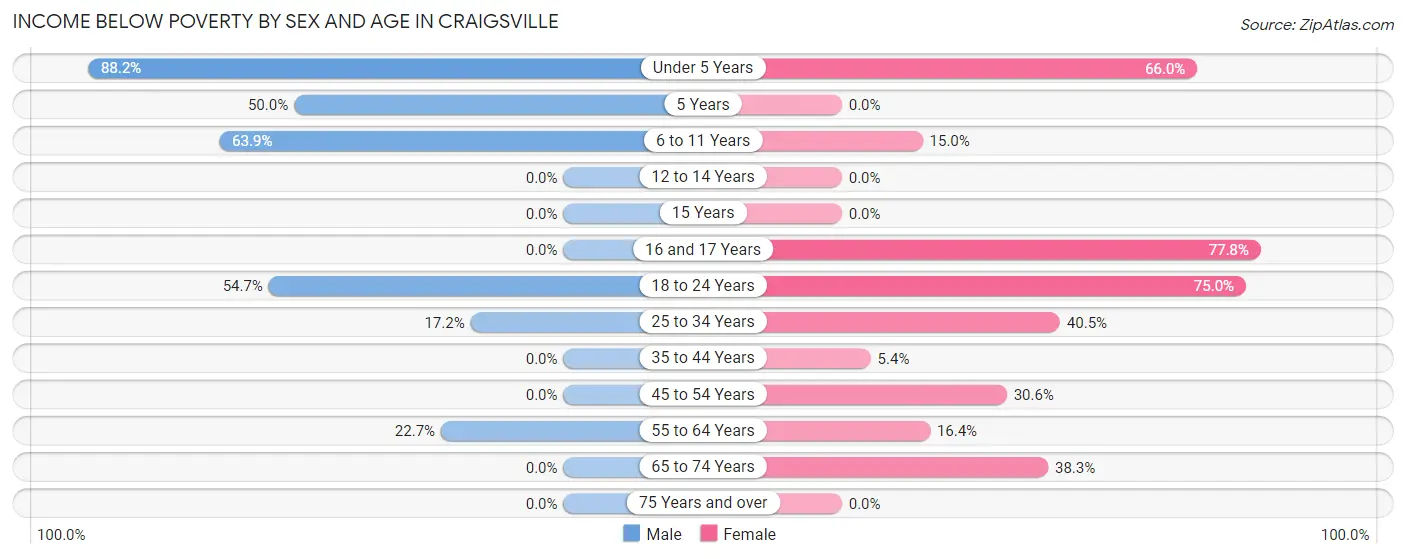
| Age Bracket | Male | Female |
| Under 5 Years | 30 (88.2%) | 31 (66.0%) |
| 5 Years | 2 (50.0%) | 0 (0.0%) |
| 6 to 11 Years | 23 (63.9%) | 3 (15.0%) |
| 12 to 14 Years | 0 (0.0%) | 0 (0.0%) |
| 15 Years | 0 (0.0%) | 0 (0.0%) |
| 16 and 17 Years | 0 (0.0%) | 7 (77.8%) |
| 18 to 24 Years | 35 (54.7%) | 48 (75.0%) |
| 25 to 34 Years | 5 (17.2%) | 17 (40.5%) |
| 35 to 44 Years | 0 (0.0%) | 3 (5.4%) |
| 45 to 54 Years | 0 (0.0%) | 15 (30.6%) |
| 55 to 64 Years | 10 (22.7%) | 9 (16.4%) |
| 65 to 74 Years | 0 (0.0%) | 49 (38.3%) |
| 75 Years and over | 0 (0.0%) | 0 (0.0%) |
| Total | 105 (26.5%) | 182 (34.0%) |
Income Above Poverty by Sex and Age in Craigsville
According to the poverty statistics in Craigsville, males aged 12 to 14 years and females aged 5 years are the age groups that are most secure financially, with 100.0% of males and 100.0% of females in these age groups living above the poverty line.
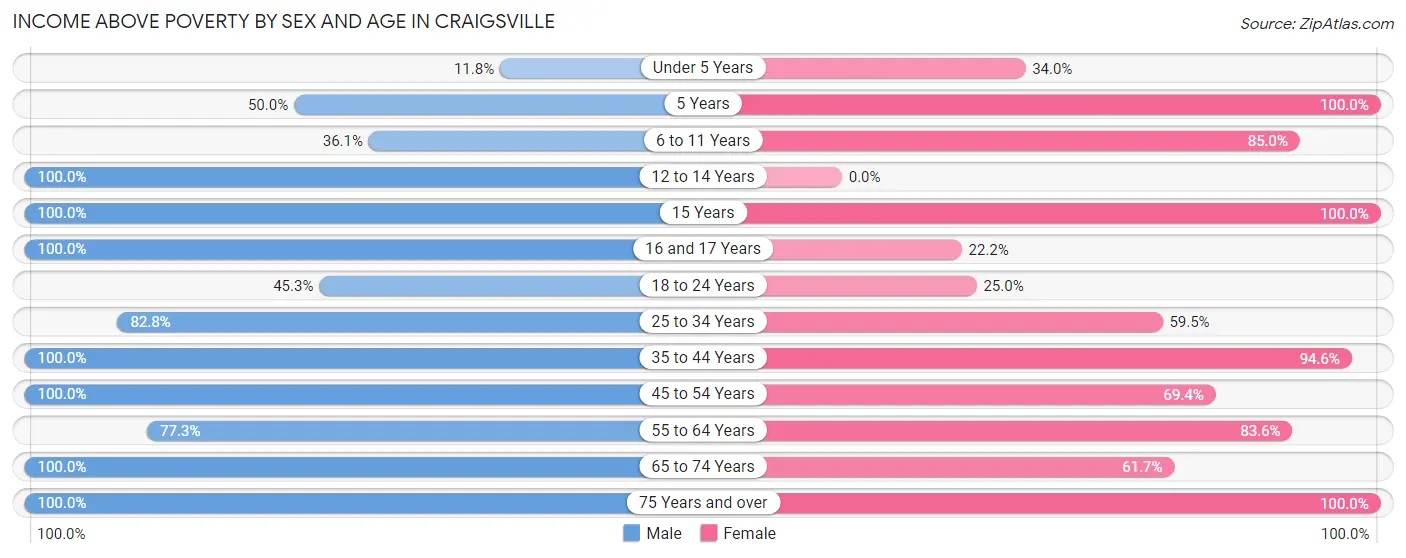
| Age Bracket | Male | Female |
| Under 5 Years | 4 (11.8%) | 16 (34.0%) |
| 5 Years | 2 (50.0%) | 1 (100.0%) |
| 6 to 11 Years | 13 (36.1%) | 17 (85.0%) |
| 12 to 14 Years | 16 (100.0%) | 0 (0.0%) |
| 15 Years | 10 (100.0%) | 11 (100.0%) |
| 16 and 17 Years | 29 (100.0%) | 2 (22.2%) |
| 18 to 24 Years | 29 (45.3%) | 16 (25.0%) |
| 25 to 34 Years | 24 (82.8%) | 25 (59.5%) |
| 35 to 44 Years | 27 (100.0%) | 53 (94.6%) |
| 45 to 54 Years | 37 (100.0%) | 34 (69.4%) |
| 55 to 64 Years | 34 (77.3%) | 46 (83.6%) |
| 65 to 74 Years | 45 (100.0%) | 79 (61.7%) |
| 75 Years and over | 21 (100.0%) | 53 (100.0%) |
| Total | 291 (73.5%) | 353 (66.0%) |
Income Below Poverty Among Married-Couple Families in Craigsville
The poverty statistics for married-couple families in Craigsville show that 20.3% or 28 of the total 138 families live below the poverty line. Families with 1 or 2 children have the highest poverty rate of 46.5%, comprising of 20 families. On the other hand, families with 3 or 4 children have the lowest poverty rate of 0.0%, which includes 0 families.
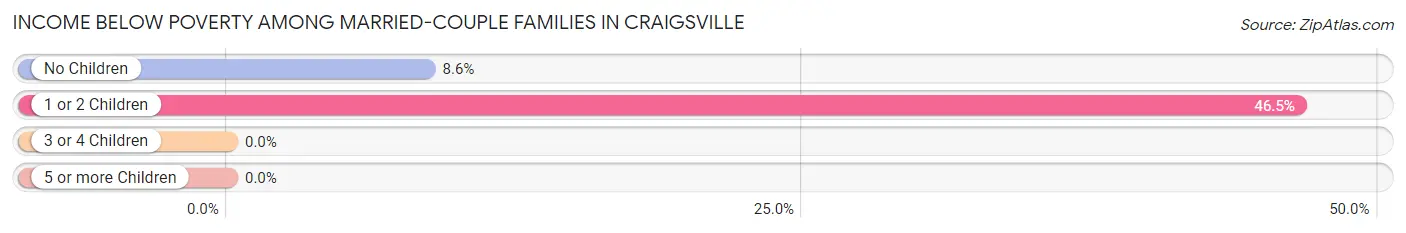
| Children | Above Poverty | Below Poverty |
| No Children | 85 (91.4%) | 8 (8.6%) |
| 1 or 2 Children | 23 (53.5%) | 20 (46.5%) |
| 3 or 4 Children | 2 (100.0%) | 0 (0.0%) |
| 5 or more Children | 0 (0.0%) | 0 (0.0%) |
| Total | 110 (79.7%) | 28 (20.3%) |
Income Below Poverty Among Single-Parent Households in Craigsville
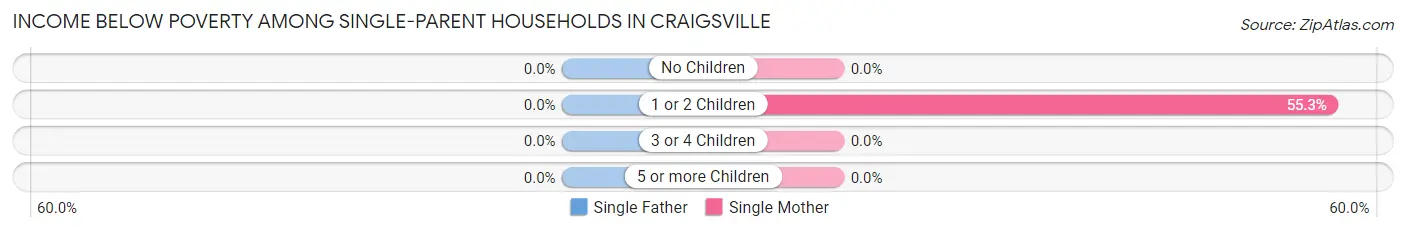
| Children | Single Father | Single Mother |
| No Children | 0 (0.0%) | 0 (0.0%) |
| 1 or 2 Children | 0 (0.0%) | 26 (55.3%) |
| 3 or 4 Children | 0 (0.0%) | 0 (0.0%) |
| 5 or more Children | 0 (0.0%) | 0 (0.0%) |
| Total | 0 (0.0%) | 26 (42.6%) |
Income Below Poverty Among Married-Couple vs Single-Parent Households in Craigsville
The poverty data for Craigsville shows that 28 of the married-couple family households (20.3%) and 26 of the single-parent households (27.4%) are living below the poverty level. Within the married-couple family households, those with 1 or 2 children have the highest poverty rate, with 20 households (46.5%) falling below the poverty line. Among the single-parent households, those with 1 or 2 children have the highest poverty rate, with 26 household (42.6%) living below poverty.
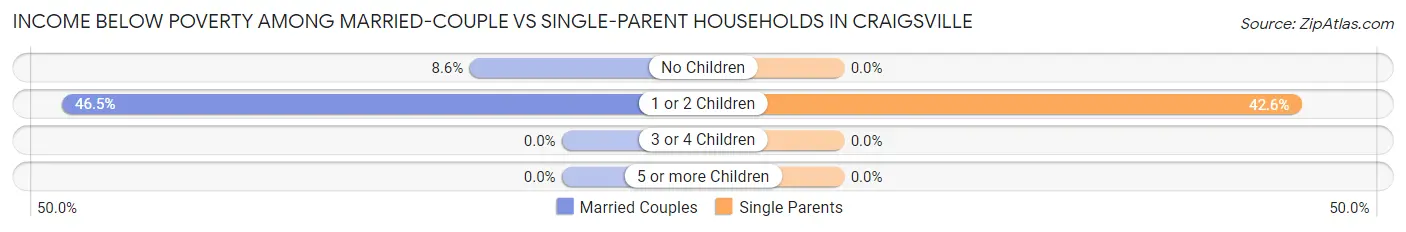
| Children | Married-Couple Families | Single-Parent Households |
| No Children | 8 (8.6%) | 0 (0.0%) |
| 1 or 2 Children | 20 (46.5%) | 26 (42.6%) |
| 3 or 4 Children | 0 (0.0%) | 0 (0.0%) |
| 5 or more Children | 0 (0.0%) | 0 (0.0%) |
| Total | 28 (20.3%) | 26 (27.4%) |
Race in Craigsville
The most populous races in Craigsville are White / Caucasian (921 | 98.9%), Two or more Races (7 | 0.7%), and Hispanic or Latino (3 | 0.3%).
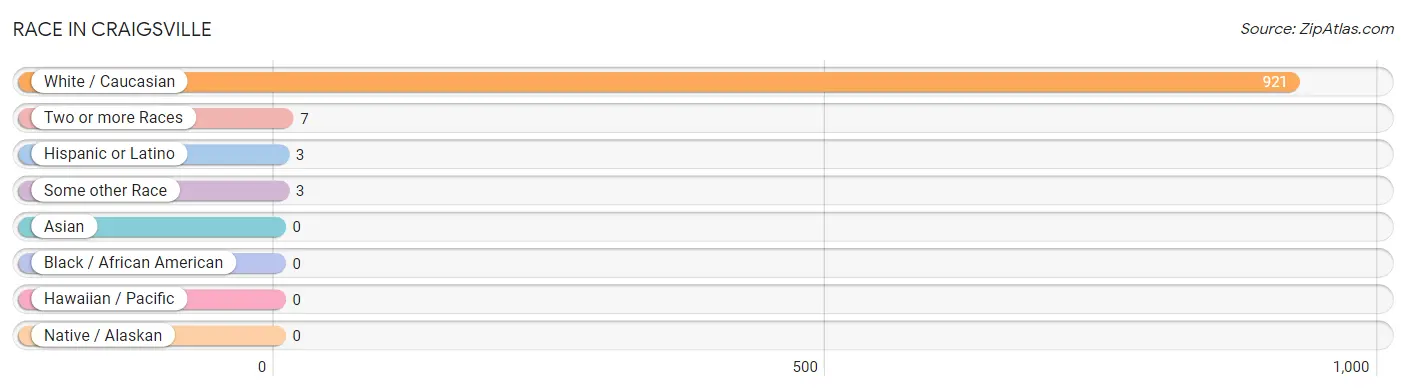
| Race | # Population | % Population |
| Asian | 0 | 0.0% |
| Black / African American | 0 | 0.0% |
| Hawaiian / Pacific | 0 | 0.0% |
| Hispanic or Latino | 3 | 0.3% |
| Native / Alaskan | 0 | 0.0% |
| White / Caucasian | 921 | 98.9% |
| Two or more Races | 7 | 0.7% |
| Some other Race | 3 | 0.3% |
| Total | 931 | 100.0% |
Ancestry in Craigsville
The most populous ancestries reported in Craigsville are German (139 | 14.9%), Irish (122 | 13.1%), English (63 | 6.8%), American (21 | 2.3%), and European (17 | 1.8%), together accounting for 38.9% of all Craigsville residents.
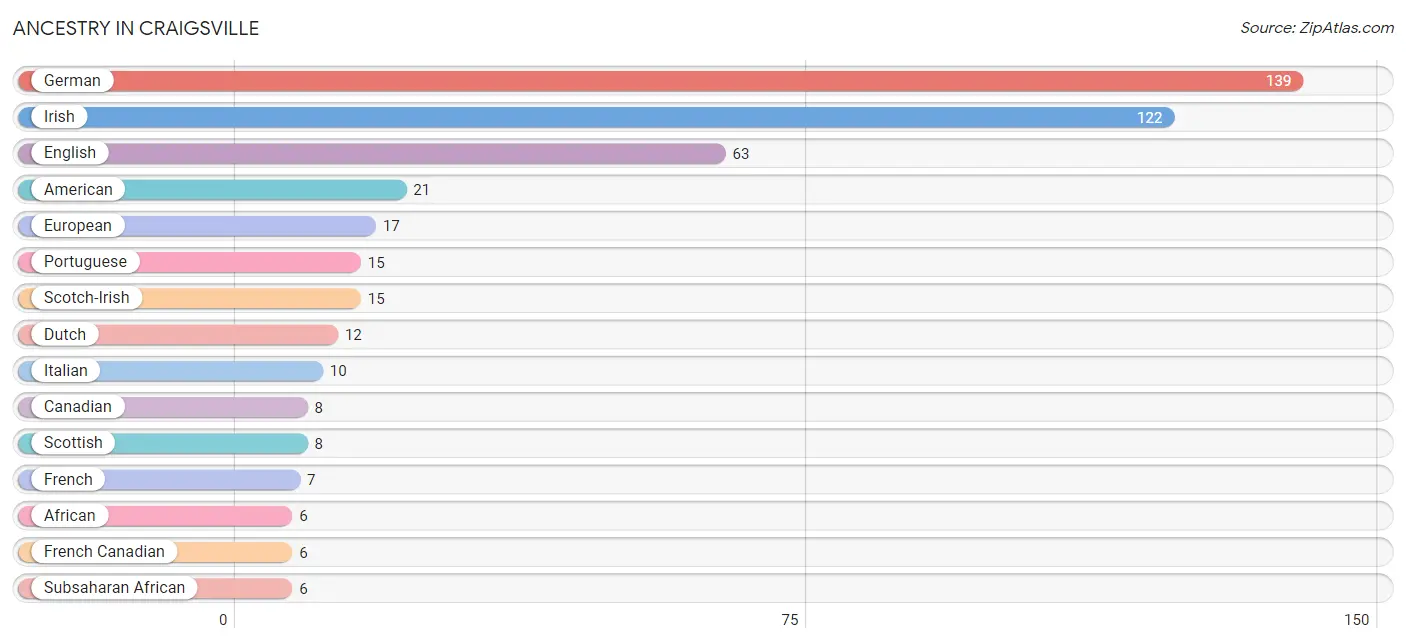
| Ancestry | # Population | % Population |
| African | 6 | 0.6% |
| American | 21 | 2.3% |
| Canadian | 8 | 0.9% |
| Cherokee | 1 | 0.1% |
| Dutch | 12 | 1.3% |
| English | 63 | 6.8% |
| European | 17 | 1.8% |
| French | 7 | 0.7% |
| French Canadian | 6 | 0.6% |
| German | 139 | 14.9% |
| Irish | 122 | 13.1% |
| Italian | 10 | 1.1% |
| Mexican | 3 | 0.3% |
| Norwegian | 2 | 0.2% |
| Portuguese | 15 | 1.6% |
| Scandinavian | 1 | 0.1% |
| Scotch-Irish | 15 | 1.6% |
| Scottish | 8 | 0.9% |
| Subsaharan African | 6 | 0.6% |
| Swiss | 4 | 0.4% | View All 20 Rows |
Immigrants in Craigsville

| Immigration Origin | # Population | % Population | View All 0 Rows |
Sex and Age in Craigsville
Sex and Age in Craigsville
The most populous age groups in Craigsville are 20 to 24 Years (64 | 16.2%) for men and 65 to 69 Years (77 | 14.4%) for women.
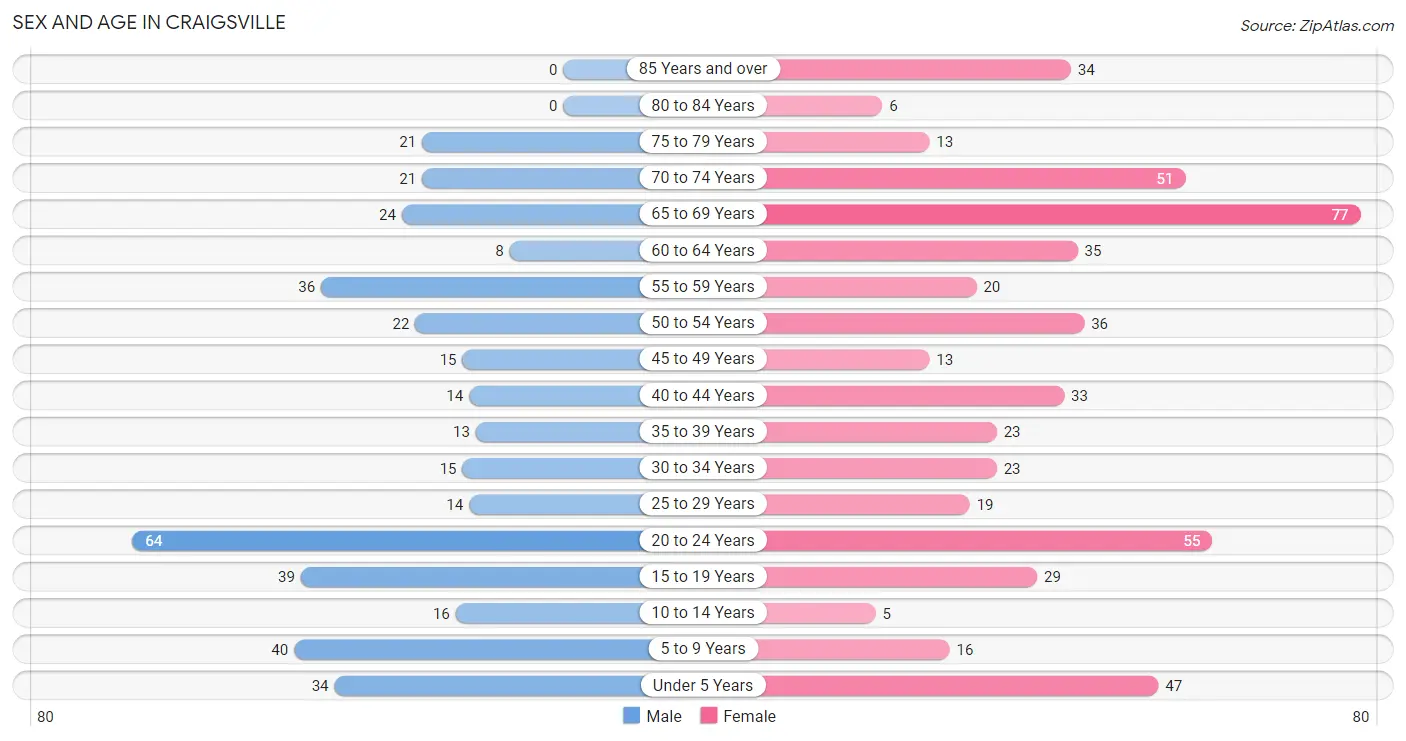
| Age Bracket | Male | Female |
| Under 5 Years | 34 (8.6%) | 47 (8.8%) |
| 5 to 9 Years | 40 (10.1%) | 16 (3.0%) |
| 10 to 14 Years | 16 (4.0%) | 5 (0.9%) |
| 15 to 19 Years | 39 (9.9%) | 29 (5.4%) |
| 20 to 24 Years | 64 (16.2%) | 55 (10.3%) |
| 25 to 29 Years | 14 (3.5%) | 19 (3.5%) |
| 30 to 34 Years | 15 (3.8%) | 23 (4.3%) |
| 35 to 39 Years | 13 (3.3%) | 23 (4.3%) |
| 40 to 44 Years | 14 (3.5%) | 33 (6.2%) |
| 45 to 49 Years | 15 (3.8%) | 13 (2.4%) |
| 50 to 54 Years | 22 (5.6%) | 36 (6.7%) |
| 55 to 59 Years | 36 (9.1%) | 20 (3.7%) |
| 60 to 64 Years | 8 (2.0%) | 35 (6.5%) |
| 65 to 69 Years | 24 (6.1%) | 77 (14.4%) |
| 70 to 74 Years | 21 (5.3%) | 51 (9.5%) |
| 75 to 79 Years | 21 (5.3%) | 13 (2.4%) |
| 80 to 84 Years | 0 (0.0%) | 6 (1.1%) |
| 85 Years and over | 0 (0.0%) | 34 (6.4%) |
| Total | 396 (100.0%) | 535 (100.0%) |
Families and Households in Craigsville
Median Family Size in Craigsville
The median family size in Craigsville is 2.90 persons per family, with married-couple families (138 | 59.2%) accounting for the largest median family size of 3.04 persons per family. On the other hand, single male/father families (34 | 14.6%) represent the smallest median family size with 2.41 persons per family.
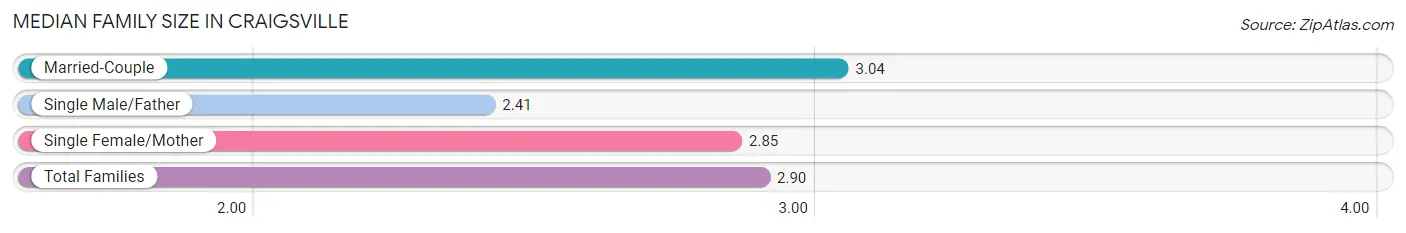
| Family Type | # Families | Family Size |
| Married-Couple | 138 (59.2%) | 3.04 |
| Single Male/Father | 34 (14.6%) | 2.41 |
| Single Female/Mother | 61 (26.2%) | 2.85 |
| Total Families | 233 (100.0%) | 2.90 |
Median Household Size in Craigsville
The median household size in Craigsville is 2.03 persons per household, with married-couple households (138 | 30.1%) accounting for the largest median household size of 3.08 persons per household. non-family households (225 | 49.1%) represent the smallest median household size with 1.06 persons per household.
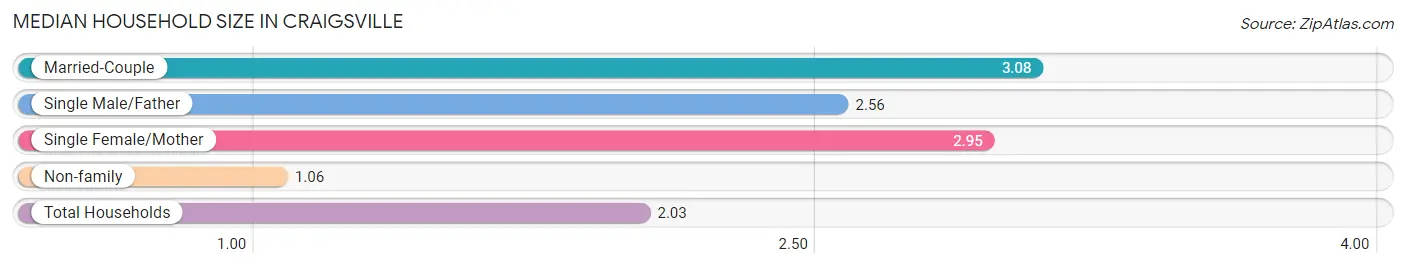
| Household Type | # Households | Household Size |
| Married-Couple | 138 (30.1%) | 3.08 |
| Single Male/Father | 34 (7.4%) | 2.56 |
| Single Female/Mother | 61 (13.3%) | 2.95 |
| Non-family | 225 (49.1%) | 1.06 |
| Total Households | 458 (100.0%) | 2.03 |
Household Size by Marriage Status in Craigsville
Out of a total of 458 households in Craigsville, 233 (50.9%) are family households, while 225 (49.1%) are nonfamily households. The most numerous type of family households are 2-person households, comprising 109, and the most common type of nonfamily households are 1-person households, comprising 211.
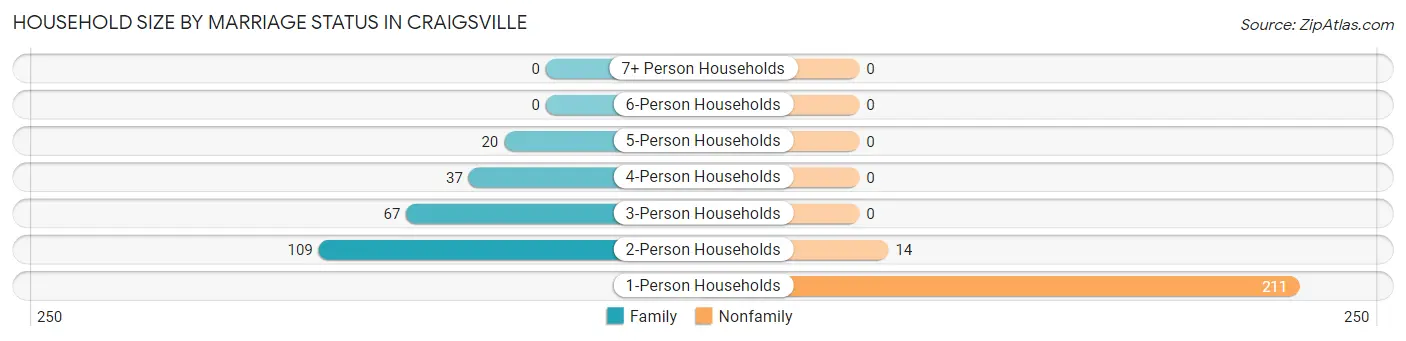
| Household Size | Family Households | Nonfamily Households |
| 1-Person Households | - | 211 (46.1%) |
| 2-Person Households | 109 (23.8%) | 14 (3.1%) |
| 3-Person Households | 67 (14.6%) | 0 (0.0%) |
| 4-Person Households | 37 (8.1%) | 0 (0.0%) |
| 5-Person Households | 20 (4.4%) | 0 (0.0%) |
| 6-Person Households | 0 (0.0%) | 0 (0.0%) |
| 7+ Person Households | 0 (0.0%) | 0 (0.0%) |
| Total | 233 (50.9%) | 225 (49.1%) |
Female Fertility in Craigsville
Fertility by Age in Craigsville
Average fertility rate in Craigsville is 30.0 births per 1,000 women. Women in the age bracket of 20 to 34 years have the highest fertility rate with 62.0 births per 1,000 women. Women in the age bracket of 20 to 34 years acount for 100.0% of all women with births.
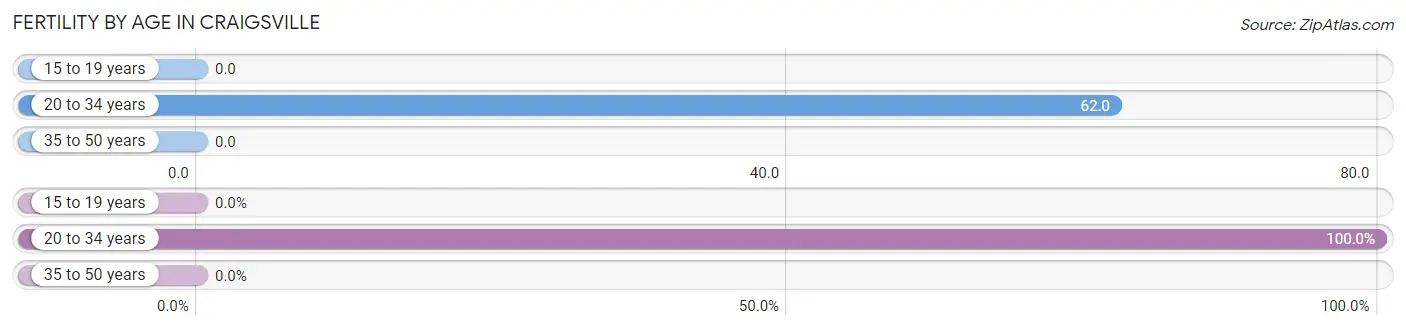
| Age Bracket | Women with Births | Births / 1,000 Women |
| 15 to 19 years | 0 (0.0%) | 0.0 |
| 20 to 34 years | 6 (100.0%) | 62.0 |
| 35 to 50 years | 0 (0.0%) | 0.0 |
| Total | 6 (100.0%) | 30.0 |
Fertility by Age by Marriage Status in Craigsville
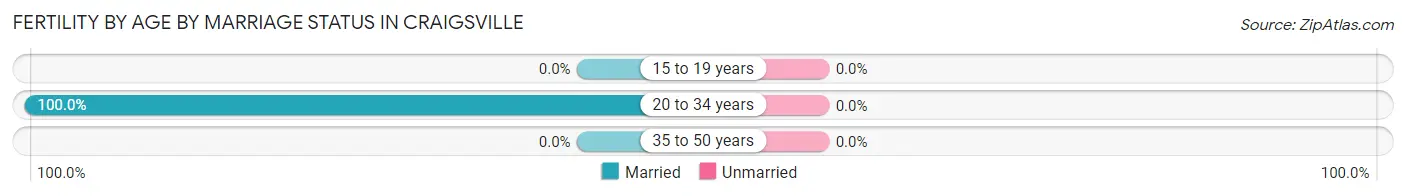
| Age Bracket | Married | Unmarried |
| 15 to 19 years | 0 (0.0%) | 0 (0.0%) |
| 20 to 34 years | 6 (100.0%) | 0 (0.0%) |
| 35 to 50 years | 0 (0.0%) | 0 (0.0%) |
| Total | 6 (100.0%) | 0 (0.0%) |
Fertility by Education in Craigsville
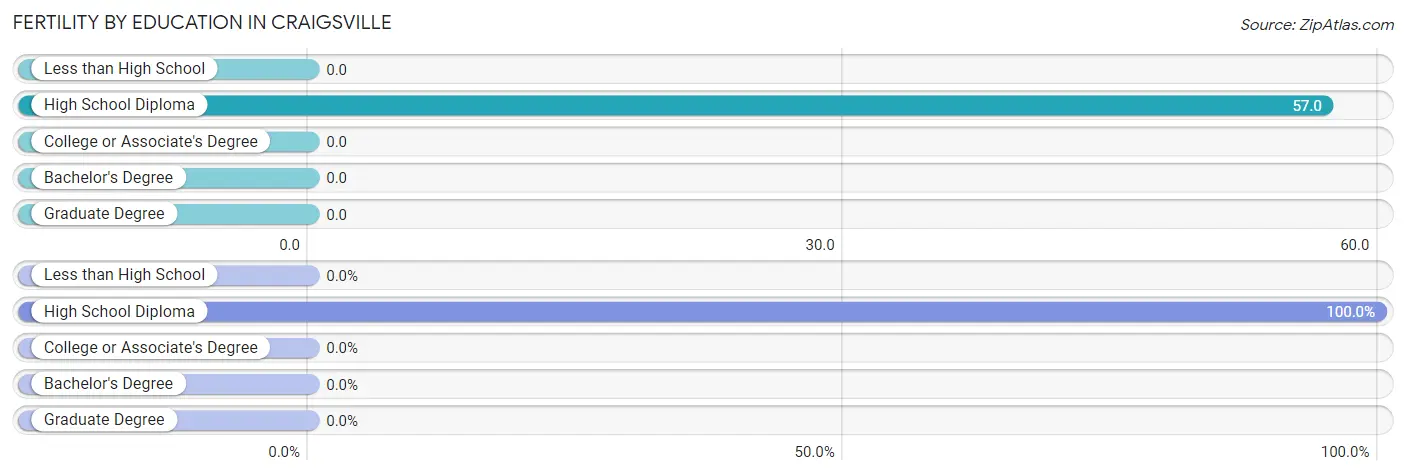
| Educational Attainment | Women with Births | Births / 1,000 Women |
| Less than High School | 0 (0.0%) | 0.0 |
| High School Diploma | 6 (100.0%) | 57.0 |
| College or Associate's Degree | 0 (0.0%) | 0.0 |
| Bachelor's Degree | 0 (0.0%) | 0.0 |
| Graduate Degree | 0 (0.0%) | 0.0 |
| Total | 6 (100.0%) | 30.0 |
Fertility by Education by Marriage Status in Craigsville
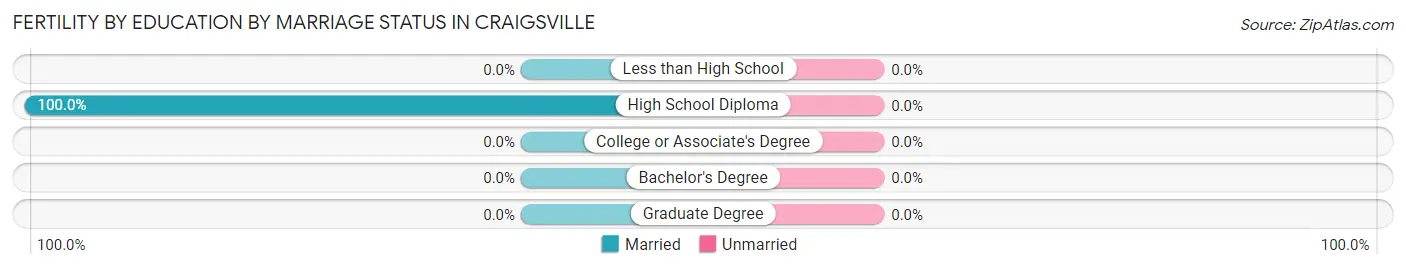
| Educational Attainment | Married | Unmarried |
| Less than High School | 0 (0.0%) | 0 (0.0%) |
| High School Diploma | 6 (100.0%) | 0 (0.0%) |
| College or Associate's Degree | 0 (0.0%) | 0 (0.0%) |
| Bachelor's Degree | 0 (0.0%) | 0 (0.0%) |
| Graduate Degree | 0 (0.0%) | 0 (0.0%) |
| Total | 6 (100.0%) | 0 (0.0%) |
Employment Characteristics in Craigsville
Employment by Class of Employer in Craigsville
Among the 343 employed individuals in Craigsville, private company employees (207 | 60.4%), local government employees (53 | 15.4%), and state government employees (45 | 13.1%) make up the most common classes of employment.
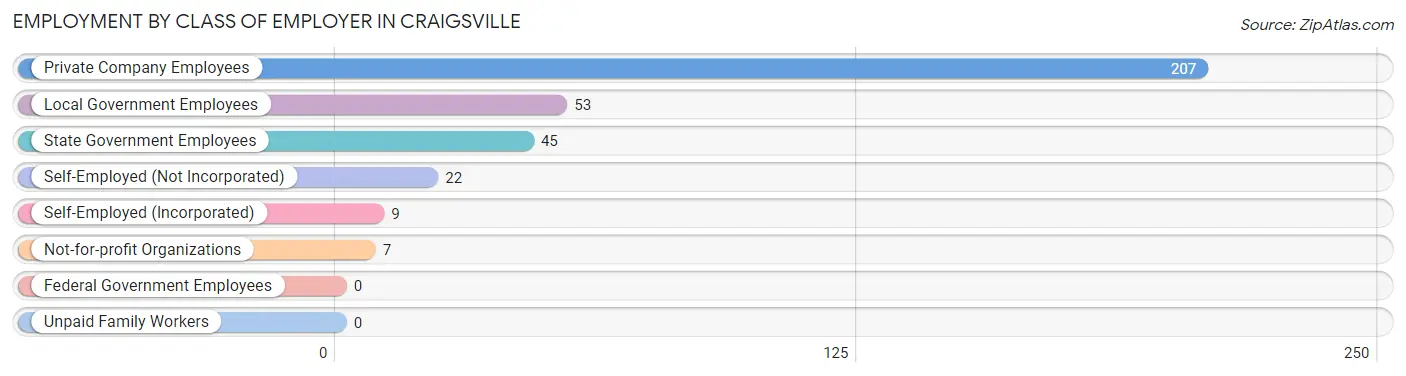
| Employer Class | # Employees | % Employees |
| Private Company Employees | 207 | 60.4% |
| Self-Employed (Incorporated) | 9 | 2.6% |
| Self-Employed (Not Incorporated) | 22 | 6.4% |
| Not-for-profit Organizations | 7 | 2.0% |
| Local Government Employees | 53 | 15.4% |
| State Government Employees | 45 | 13.1% |
| Federal Government Employees | 0 | 0.0% |
| Unpaid Family Workers | 0 | 0.0% |
| Total | 343 | 100.0% |
Employment Status by Age in Craigsville
According to the labor force statistics for Craigsville, out of the total population over 16 years of age (752), 48.1% or 362 individuals are in the labor force, with 5.2% or 19 of them unemployed. The age group with the highest labor force participation rate is 35 to 44 years, with 100.0% or 83 individuals in the labor force. Within the labor force, the 20 to 24 years age range has the highest percentage of unemployed individuals, with 16.0% or 16 of them being unemployed.
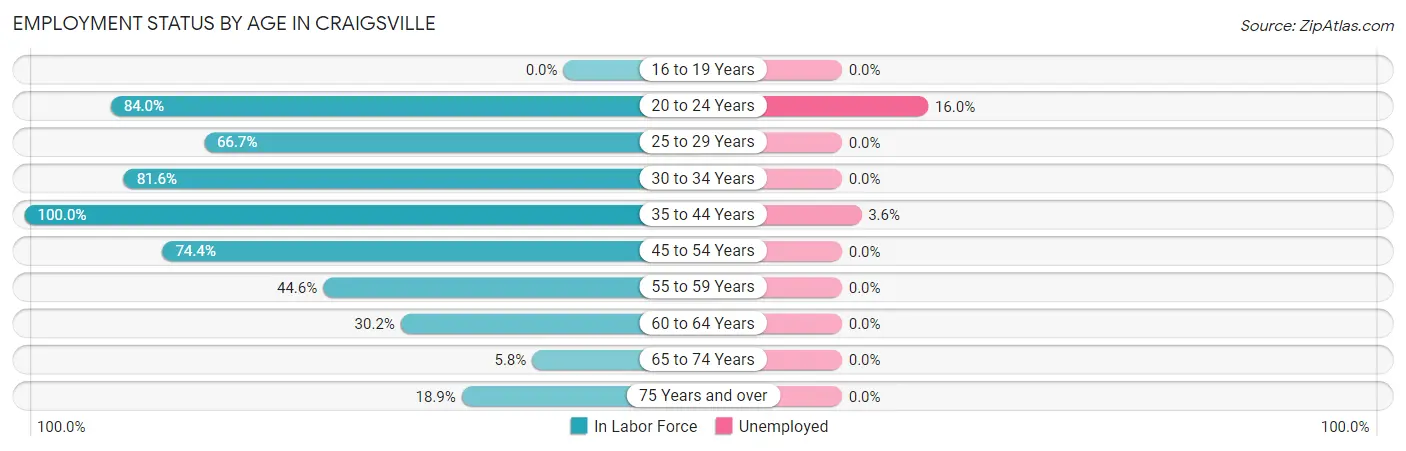
| Age Bracket | In Labor Force | Unemployed |
| 16 to 19 Years | 0 (0.0%) | 0 (0.0%) |
| 20 to 24 Years | 100 (84.0%) | 16 (16.0%) |
| 25 to 29 Years | 22 (66.7%) | 0 (0.0%) |
| 30 to 34 Years | 31 (81.6%) | 0 (0.0%) |
| 35 to 44 Years | 83 (100.0%) | 3 (3.6%) |
| 45 to 54 Years | 64 (74.4%) | 0 (0.0%) |
| 55 to 59 Years | 25 (44.6%) | 0 (0.0%) |
| 60 to 64 Years | 13 (30.2%) | 0 (0.0%) |
| 65 to 74 Years | 10 (5.8%) | 0 (0.0%) |
| 75 Years and over | 14 (18.9%) | 0 (0.0%) |
| Total | 362 (48.1%) | 19 (5.2%) |
Employment Status by Educational Attainment in Craigsville
According to labor force statistics for Craigsville, 70.2% of individuals (238) out of the total population between 25 and 64 years of age (339) are in the labor force, with 1.3% or 3 of them being unemployed. The group with the highest labor force participation rate are those with the educational attainment of bachelor's degree or higher, with 100.0% or 24 individuals in the labor force. Within the labor force, individuals with bachelor's degree or higher education have the highest percentage of unemployment, with 12.5% or 3 of them being unemployed.
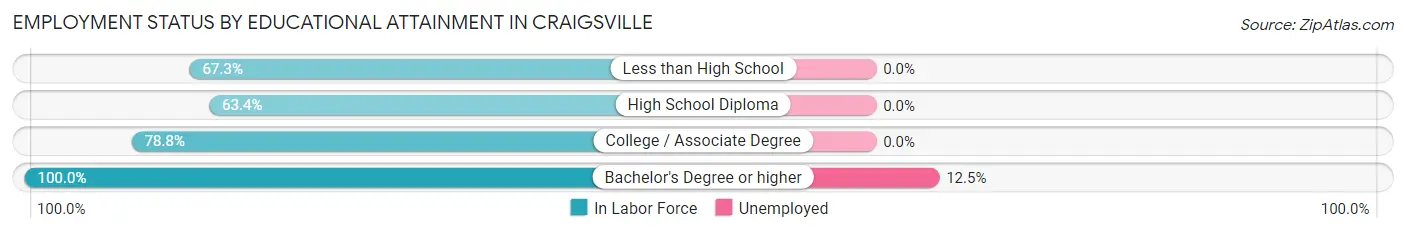
| Educational Attainment | In Labor Force | Unemployed |
| Less than High School | 33 (67.3%) | 0 (0.0%) |
| High School Diploma | 118 (63.4%) | 0 (0.0%) |
| College / Associate Degree | 63 (78.8%) | 0 (0.0%) |
| Bachelor's Degree or higher | 24 (100.0%) | 3 (12.5%) |
| Total | 238 (70.2%) | 4 (1.3%) |
Employment Occupations by Sex in Craigsville
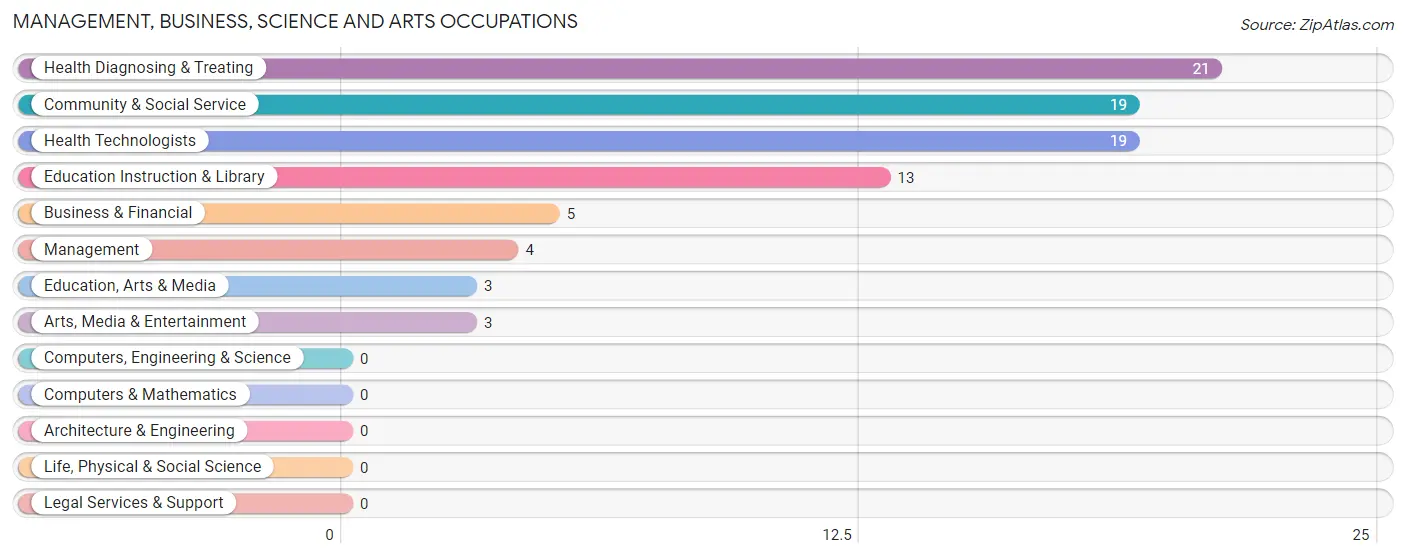
Management, Business, Science and Arts Occupations
The most common Management, Business, Science and Arts occupations in Craigsville are Health Diagnosing & Treating (21 | 6.1%), Community & Social Service (19 | 5.5%), Health Technologists (19 | 5.5%), Education Instruction & Library (13 | 3.8%), and Business & Financial (5 | 1.5%).
Management, Business, Science and Arts Occupations by Sex
Within the Management, Business, Science and Arts occupations in Craigsville, the most male-oriented occupations are Education, Arts & Media (100.0%), Arts, Media & Entertainment (100.0%), and Community & Social Service (47.4%), while the most female-oriented occupations are Business & Financial (100.0%), Health Diagnosing & Treating (100.0%), and Health Technologists (100.0%).
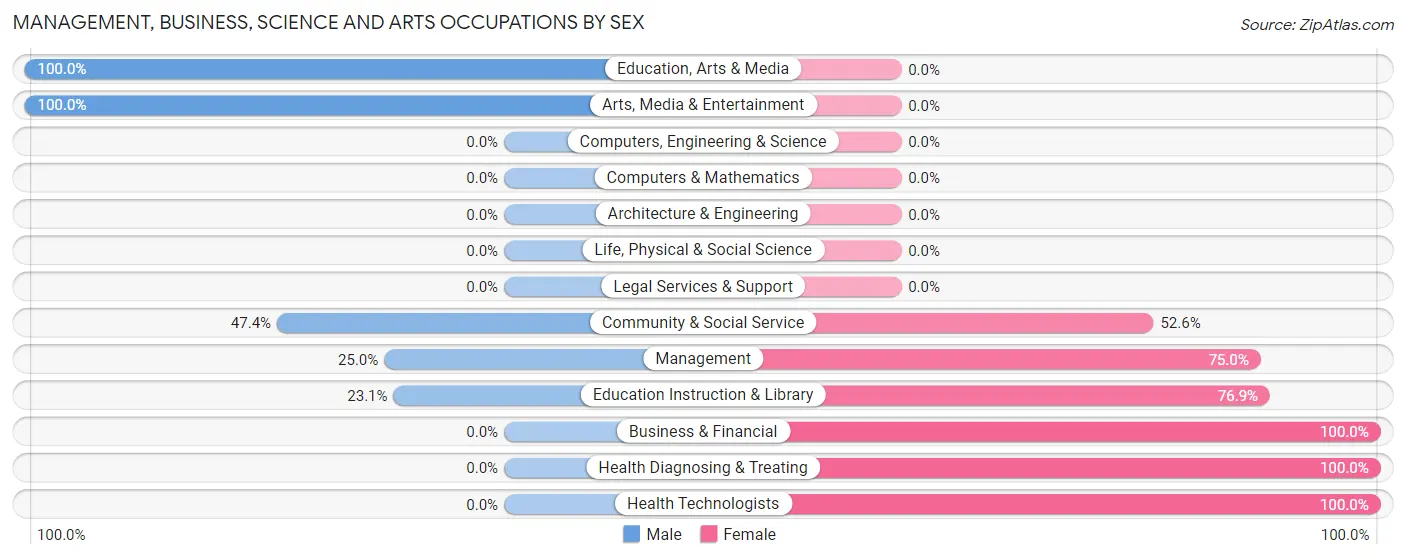
| Occupation | Male | Female |
| Management | 1 (25.0%) | 3 (75.0%) |
| Business & Financial | 0 (0.0%) | 5 (100.0%) |
| Computers, Engineering & Science | 0 (0.0%) | 0 (0.0%) |
| Computers & Mathematics | 0 (0.0%) | 0 (0.0%) |
| Architecture & Engineering | 0 (0.0%) | 0 (0.0%) |
| Life, Physical & Social Science | 0 (0.0%) | 0 (0.0%) |
| Community & Social Service | 9 (47.4%) | 10 (52.6%) |
| Education, Arts & Media | 3 (100.0%) | 0 (0.0%) |
| Legal Services & Support | 0 (0.0%) | 0 (0.0%) |
| Education Instruction & Library | 3 (23.1%) | 10 (76.9%) |
| Arts, Media & Entertainment | 3 (100.0%) | 0 (0.0%) |
| Health Diagnosing & Treating | 0 (0.0%) | 21 (100.0%) |
| Health Technologists | 0 (0.0%) | 19 (100.0%) |
| Total (Category) | 10 (20.4%) | 39 (79.6%) |
| Total (Overall) | 153 (44.6%) | 190 (55.4%) |
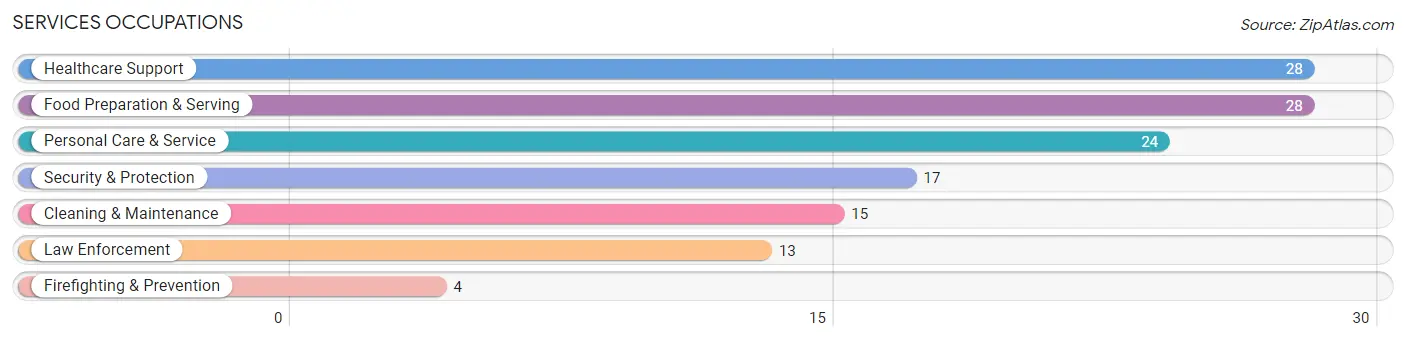
Services Occupations
The most common Services occupations in Craigsville are Healthcare Support (28 | 8.2%), Food Preparation & Serving (28 | 8.2%), Personal Care & Service (24 | 7.0%), Security & Protection (17 | 5.0%), and Cleaning & Maintenance (15 | 4.4%).
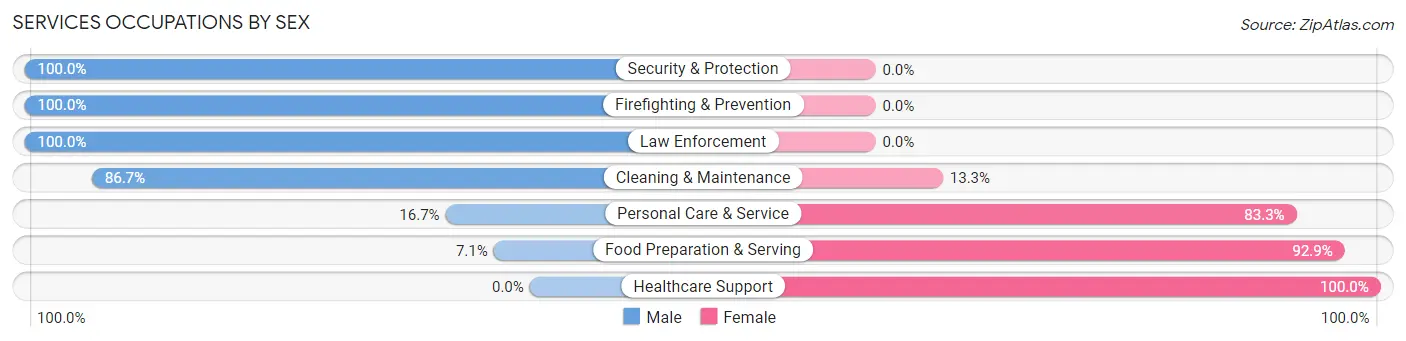
Services Occupations by Sex
Within the Services occupations in Craigsville, the most male-oriented occupations are Security & Protection (100.0%), Firefighting & Prevention (100.0%), and Law Enforcement (100.0%), while the most female-oriented occupations are Healthcare Support (100.0%), Food Preparation & Serving (92.9%), and Personal Care & Service (83.3%).
| Occupation | Male | Female |
| Healthcare Support | 0 (0.0%) | 28 (100.0%) |
| Security & Protection | 17 (100.0%) | 0 (0.0%) |
| Firefighting & Prevention | 4 (100.0%) | 0 (0.0%) |
| Law Enforcement | 13 (100.0%) | 0 (0.0%) |
| Food Preparation & Serving | 2 (7.1%) | 26 (92.9%) |
| Cleaning & Maintenance | 13 (86.7%) | 2 (13.3%) |
| Personal Care & Service | 4 (16.7%) | 20 (83.3%) |
| Total (Category) | 36 (32.1%) | 76 (67.9%) |
| Total (Overall) | 153 (44.6%) | 190 (55.4%) |
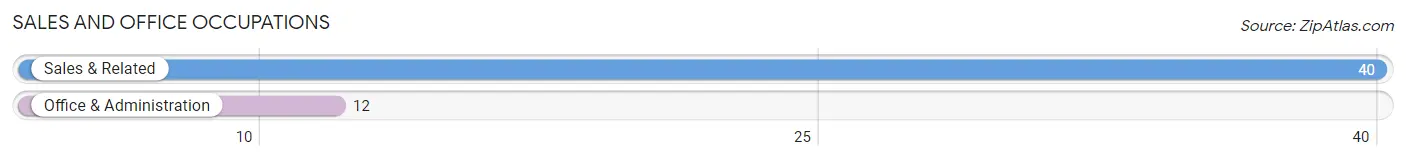
Sales and Office Occupations
The most common Sales and Office occupations in Craigsville are Sales & Related (40 | 11.7%), and Office & Administration (12 | 3.5%).
Sales and Office Occupations by Sex
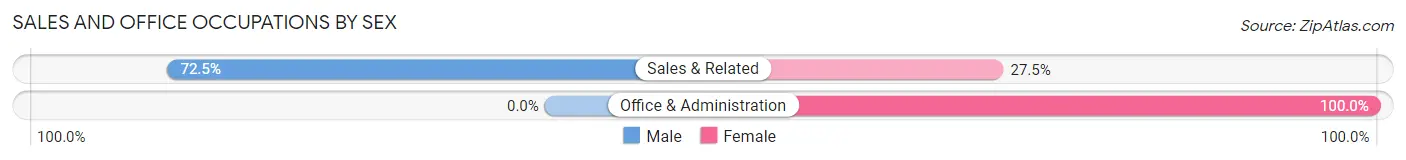
| Occupation | Male | Female |
| Sales & Related | 29 (72.5%) | 11 (27.5%) |
| Office & Administration | 0 (0.0%) | 12 (100.0%) |
| Total (Category) | 29 (55.8%) | 23 (44.2%) |
| Total (Overall) | 153 (44.6%) | 190 (55.4%) |
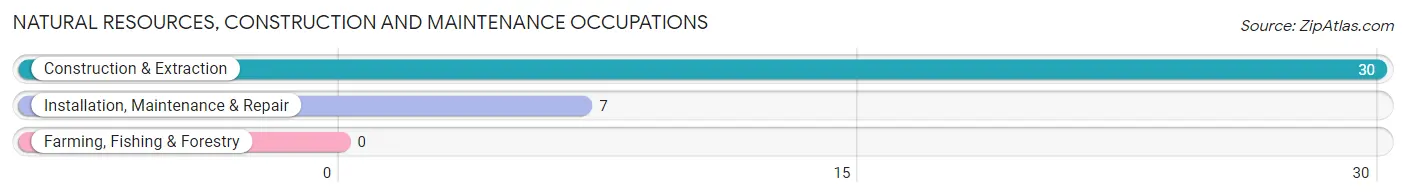
Natural Resources, Construction and Maintenance Occupations
The most common Natural Resources, Construction and Maintenance occupations in Craigsville are Construction & Extraction (30 | 8.7%), and Installation, Maintenance & Repair (7 | 2.0%).
Natural Resources, Construction and Maintenance Occupations by Sex
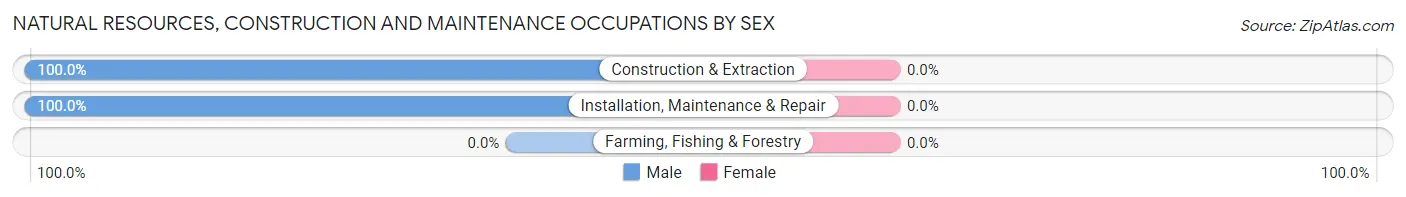
| Occupation | Male | Female |
| Farming, Fishing & Forestry | 0 (0.0%) | 0 (0.0%) |
| Construction & Extraction | 30 (100.0%) | 0 (0.0%) |
| Installation, Maintenance & Repair | 7 (100.0%) | 0 (0.0%) |
| Total (Category) | 37 (100.0%) | 0 (0.0%) |
| Total (Overall) | 153 (44.6%) | 190 (55.4%) |
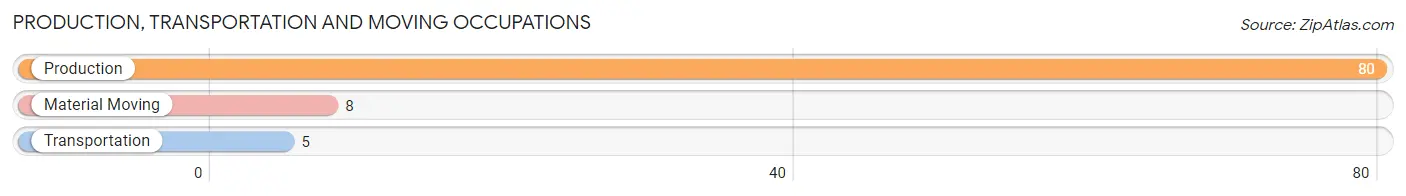
Production, Transportation and Moving Occupations
The most common Production, Transportation and Moving occupations in Craigsville are Production (80 | 23.3%), Material Moving (8 | 2.3%), and Transportation (5 | 1.5%).
Production, Transportation and Moving Occupations by Sex
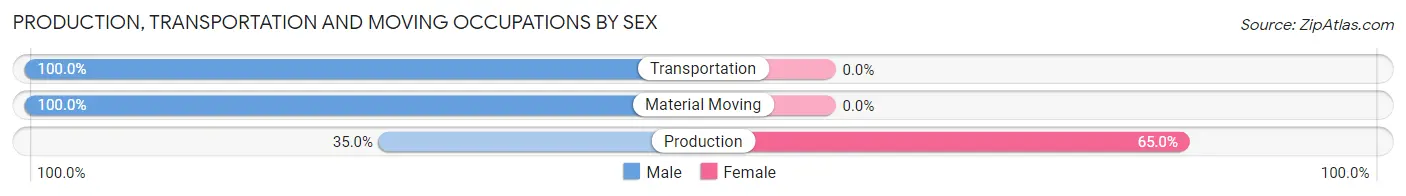
| Occupation | Male | Female |
| Production | 28 (35.0%) | 52 (65.0%) |
| Transportation | 5 (100.0%) | 0 (0.0%) |
| Material Moving | 8 (100.0%) | 0 (0.0%) |
| Total (Category) | 41 (44.1%) | 52 (55.9%) |
| Total (Overall) | 153 (44.6%) | 190 (55.4%) |
Employment Industries by Sex in Craigsville
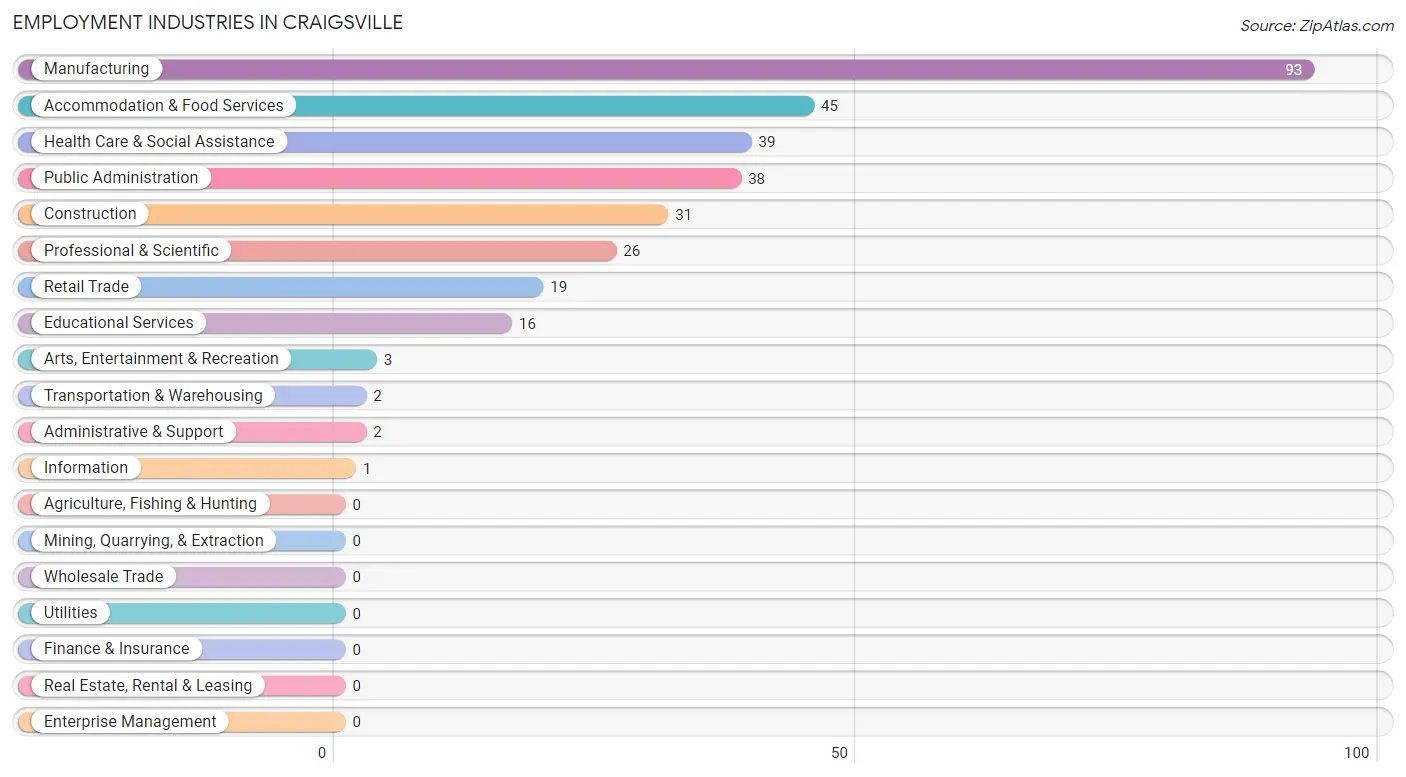
Employment Industries in Craigsville
The major employment industries in Craigsville include Manufacturing (93 | 27.1%), Accommodation & Food Services (45 | 13.1%), Health Care & Social Assistance (39 | 11.4%), Public Administration (38 | 11.1%), and Construction (31 | 9.0%).
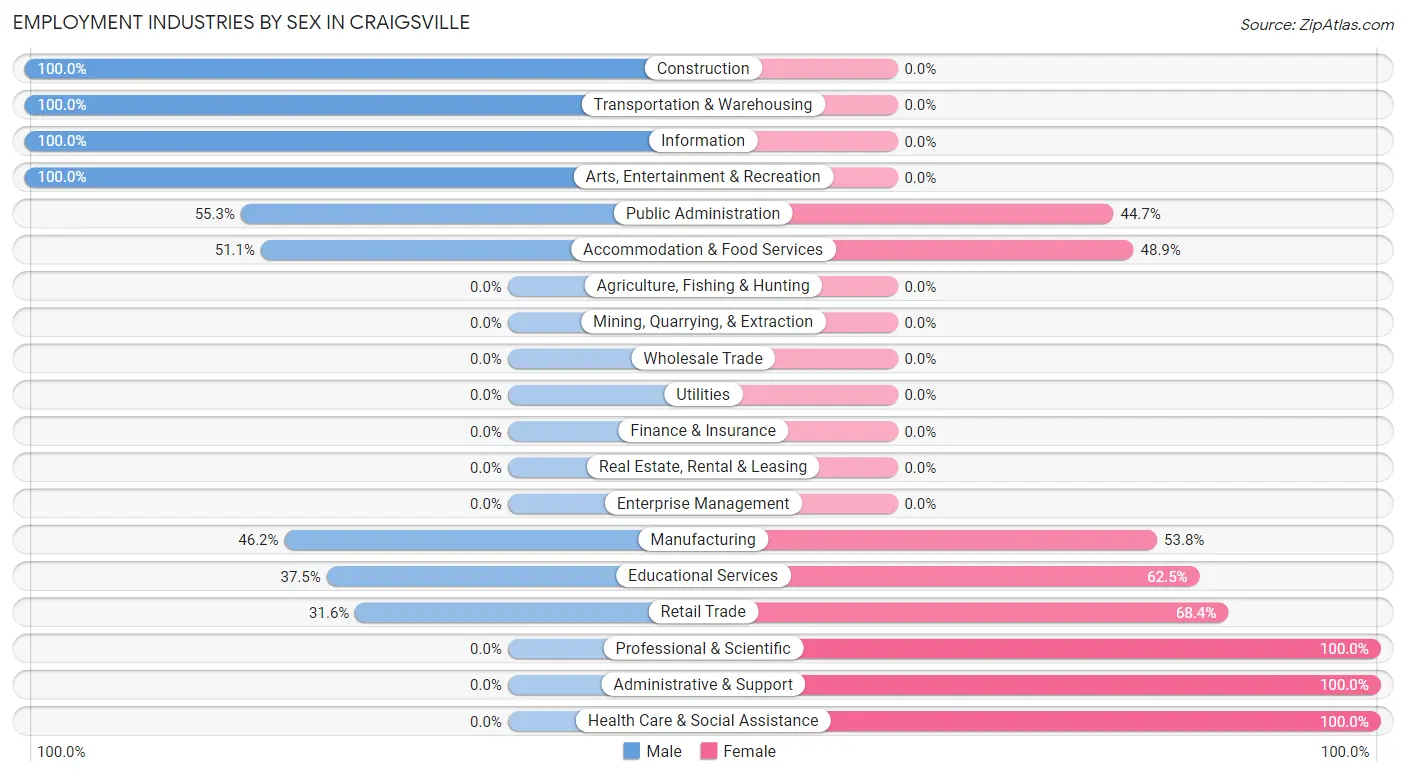
Employment Industries by Sex in Craigsville
The Craigsville industries that see more men than women are Construction (100.0%), Transportation & Warehousing (100.0%), and Information (100.0%), whereas the industries that tend to have a higher number of women are Professional & Scientific (100.0%), Administrative & Support (100.0%), and Health Care & Social Assistance (100.0%).
| Industry | Male | Female |
| Agriculture, Fishing & Hunting | 0 (0.0%) | 0 (0.0%) |
| Mining, Quarrying, & Extraction | 0 (0.0%) | 0 (0.0%) |
| Construction | 31 (100.0%) | 0 (0.0%) |
| Manufacturing | 43 (46.2%) | 50 (53.8%) |
| Wholesale Trade | 0 (0.0%) | 0 (0.0%) |
| Retail Trade | 6 (31.6%) | 13 (68.4%) |
| Transportation & Warehousing | 2 (100.0%) | 0 (0.0%) |
| Utilities | 0 (0.0%) | 0 (0.0%) |
| Information | 1 (100.0%) | 0 (0.0%) |
| Finance & Insurance | 0 (0.0%) | 0 (0.0%) |
| Real Estate, Rental & Leasing | 0 (0.0%) | 0 (0.0%) |
| Professional & Scientific | 0 (0.0%) | 26 (100.0%) |
| Enterprise Management | 0 (0.0%) | 0 (0.0%) |
| Administrative & Support | 0 (0.0%) | 2 (100.0%) |
| Educational Services | 6 (37.5%) | 10 (62.5%) |
| Health Care & Social Assistance | 0 (0.0%) | 39 (100.0%) |
| Arts, Entertainment & Recreation | 3 (100.0%) | 0 (0.0%) |
| Accommodation & Food Services | 23 (51.1%) | 22 (48.9%) |
| Public Administration | 21 (55.3%) | 17 (44.7%) |
| Total | 153 (44.6%) | 190 (55.4%) |
Education in Craigsville
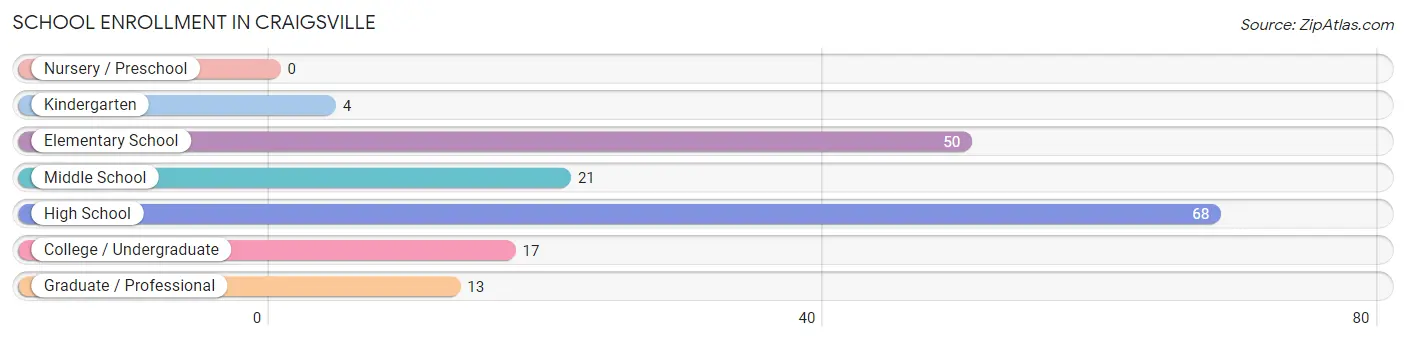
School Enrollment in Craigsville
The most common levels of schooling among the 173 students in Craigsville are high school (68 | 39.3%), elementary school (50 | 28.9%), and middle school (21 | 12.1%).
| School Level | # Students | % Students |
| Nursery / Preschool | 0 | 0.0% |
| Kindergarten | 4 | 2.3% |
| Elementary School | 50 | 28.9% |
| Middle School | 21 | 12.1% |
| High School | 68 | 39.3% |
| College / Undergraduate | 17 | 9.8% |
| Graduate / Professional | 13 | 7.5% |
| Total | 173 | 100.0% |
School Enrollment by Age by Funding Source in Craigsville
Out of a total of 173 students who are enrolled in schools in Craigsville, 62 (35.8%) attend a private institution, while the remaining 111 (64.2%) are enrolled in public schools. The age group of 35 years and over has the highest likelihood of being enrolled in private schools, with 21 (87.5% in the age bracket) enrolled. Conversely, the age group of 18 to 19 year olds has the lowest likelihood of being enrolled in a private school, with 9 (100.0% in the age bracket) attending a public institution.
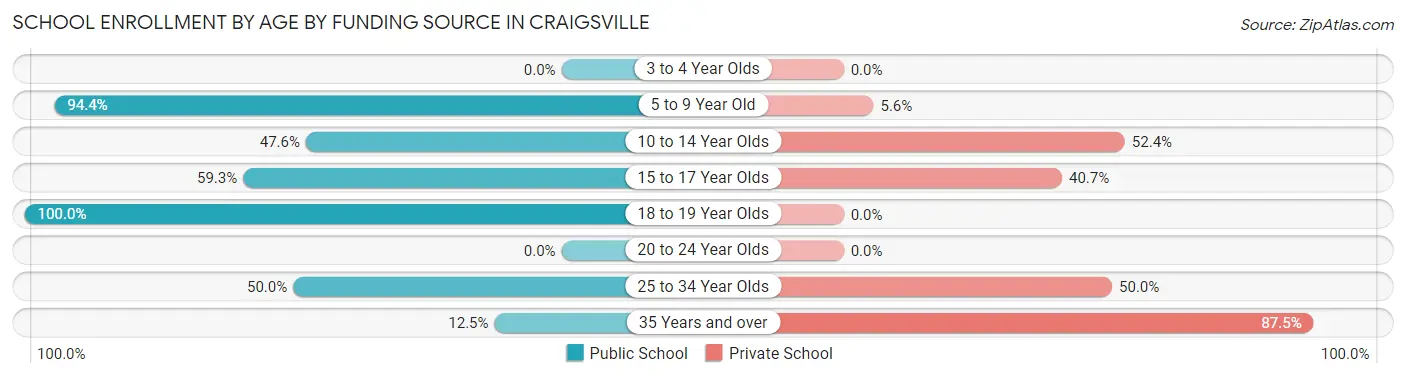
| Age Bracket | Public School | Private School |
| 3 to 4 Year Olds | 0 (0.0%) | 0 (0.0%) |
| 5 to 9 Year Old | 51 (94.4%) | 3 (5.6%) |
| 10 to 14 Year Olds | 10 (47.6%) | 11 (52.4%) |
| 15 to 17 Year Olds | 35 (59.3%) | 24 (40.7%) |
| 18 to 19 Year Olds | 9 (100.0%) | 0 (0.0%) |
| 20 to 24 Year Olds | 0 (0.0%) | 0 (0.0%) |
| 25 to 34 Year Olds | 3 (50.0%) | 3 (50.0%) |
| 35 Years and over | 3 (12.5%) | 21 (87.5%) |
| Total | 111 (64.2%) | 62 (35.8%) |
Educational Attainment by Field of Study in Craigsville
Social sciences (16 | 24.2%), literature & languages (13 | 19.7%), bio, nature & agricultural (11 | 16.7%), science & technology (10 | 15.1%), and education (5 | 7.6%) are the most common fields of study among 66 individuals in Craigsville who have obtained a bachelor's degree or higher.
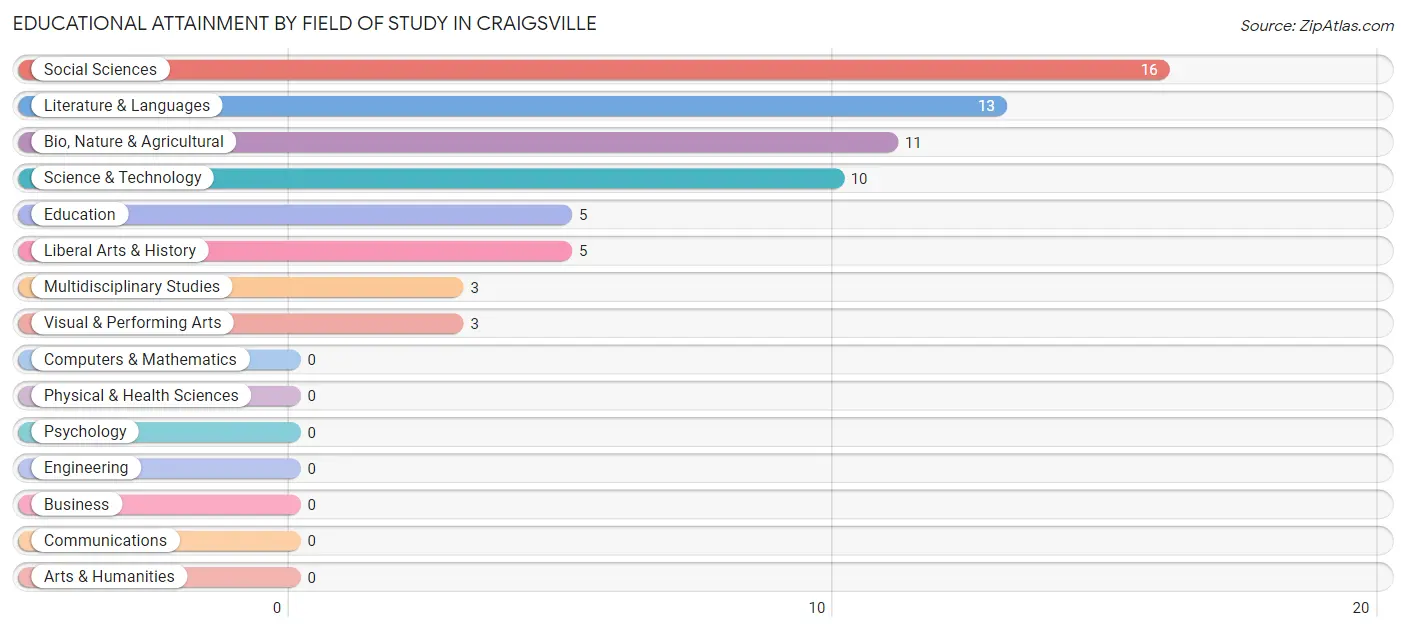
| Field of Study | # Graduates | % Graduates |
| Computers & Mathematics | 0 | 0.0% |
| Bio, Nature & Agricultural | 11 | 16.7% |
| Physical & Health Sciences | 0 | 0.0% |
| Psychology | 0 | 0.0% |
| Social Sciences | 16 | 24.2% |
| Engineering | 0 | 0.0% |
| Multidisciplinary Studies | 3 | 4.5% |
| Science & Technology | 10 | 15.1% |
| Business | 0 | 0.0% |
| Education | 5 | 7.6% |
| Literature & Languages | 13 | 19.7% |
| Liberal Arts & History | 5 | 7.6% |
| Visual & Performing Arts | 3 | 4.5% |
| Communications | 0 | 0.0% |
| Arts & Humanities | 0 | 0.0% |
| Total | 66 | 100.0% |
Transportation & Commute in Craigsville
Vehicle Availability by Sex in Craigsville
The most prevalent vehicle ownership categories in Craigsville are males with 4 vehicles (39, accounting for 25.5%) and females with 4 vehicles (40, making up 20.5%).
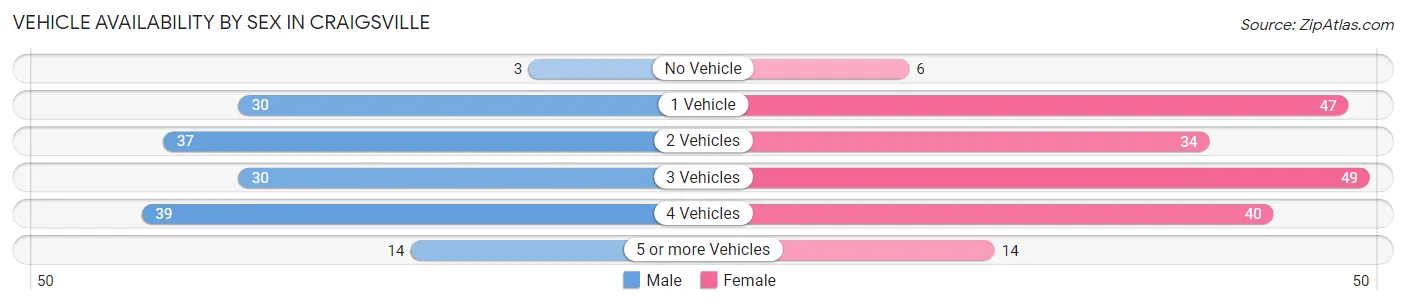
| Vehicles Available | Male | Female |
| No Vehicle | 3 (2.0%) | 6 (3.2%) |
| 1 Vehicle | 30 (19.6%) | 47 (24.7%) |
| 2 Vehicles | 37 (24.2%) | 34 (17.9%) |
| 3 Vehicles | 30 (19.6%) | 49 (25.8%) |
| 4 Vehicles | 39 (25.5%) | 40 (21.0%) |
| 5 or more Vehicles | 14 (9.1%) | 14 (7.4%) |
| Total | 153 (100.0%) | 190 (100.0%) |
Commute Time in Craigsville
The most frequently occuring commute durations in Craigsville are 45 to 59 minutes (115 commuters, 34.0%), 30 to 34 minutes (72 commuters, 21.3%), and less than 5 minutes (42 commuters, 12.4%).
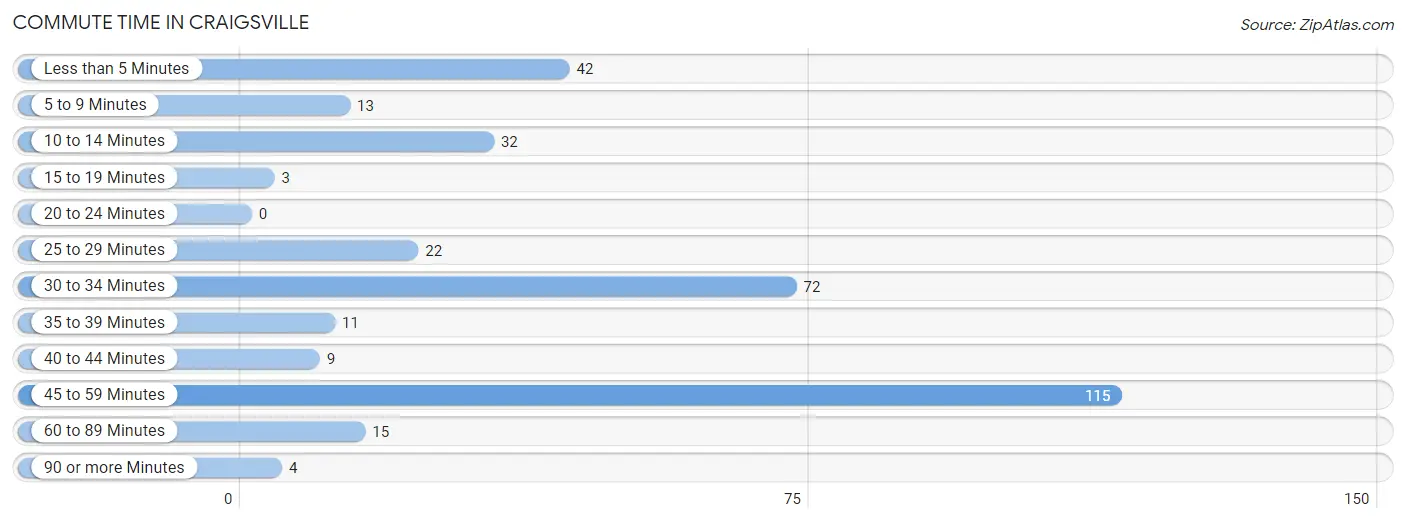
| Commute Time | # Commuters | % Commuters |
| Less than 5 Minutes | 42 | 12.4% |
| 5 to 9 Minutes | 13 | 3.8% |
| 10 to 14 Minutes | 32 | 9.5% |
| 15 to 19 Minutes | 3 | 0.9% |
| 20 to 24 Minutes | 0 | 0.0% |
| 25 to 29 Minutes | 22 | 6.5% |
| 30 to 34 Minutes | 72 | 21.3% |
| 35 to 39 Minutes | 11 | 3.3% |
| 40 to 44 Minutes | 9 | 2.7% |
| 45 to 59 Minutes | 115 | 34.0% |
| 60 to 89 Minutes | 15 | 4.4% |
| 90 or more Minutes | 4 | 1.2% |
Commute Time by Sex in Craigsville
The most common commute times in Craigsville are 30 to 34 minutes (43 commuters, 28.3%) for males and 45 to 59 minutes (78 commuters, 41.9%) for females.
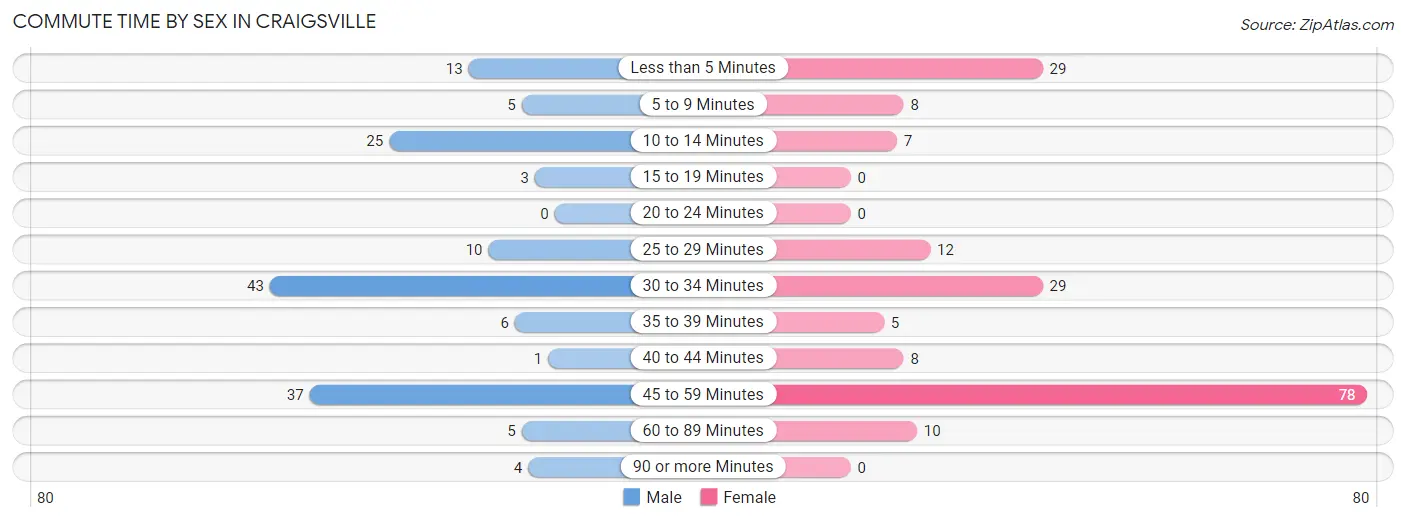
| Commute Time | Male | Female |
| Less than 5 Minutes | 13 (8.6%) | 29 (15.6%) |
| 5 to 9 Minutes | 5 (3.3%) | 8 (4.3%) |
| 10 to 14 Minutes | 25 (16.5%) | 7 (3.8%) |
| 15 to 19 Minutes | 3 (2.0%) | 0 (0.0%) |
| 20 to 24 Minutes | 0 (0.0%) | 0 (0.0%) |
| 25 to 29 Minutes | 10 (6.6%) | 12 (6.5%) |
| 30 to 34 Minutes | 43 (28.3%) | 29 (15.6%) |
| 35 to 39 Minutes | 6 (4.0%) | 5 (2.7%) |
| 40 to 44 Minutes | 1 (0.7%) | 8 (4.3%) |
| 45 to 59 Minutes | 37 (24.3%) | 78 (41.9%) |
| 60 to 89 Minutes | 5 (3.3%) | 10 (5.4%) |
| 90 or more Minutes | 4 (2.6%) | 0 (0.0%) |
Time of Departure to Work by Sex in Craigsville
The most frequent times of departure to work in Craigsville are 12:00 PM to 3:59 PM (43, 28.3%) for males and 8:30 AM to 8:59 AM (33, 17.7%) for females.
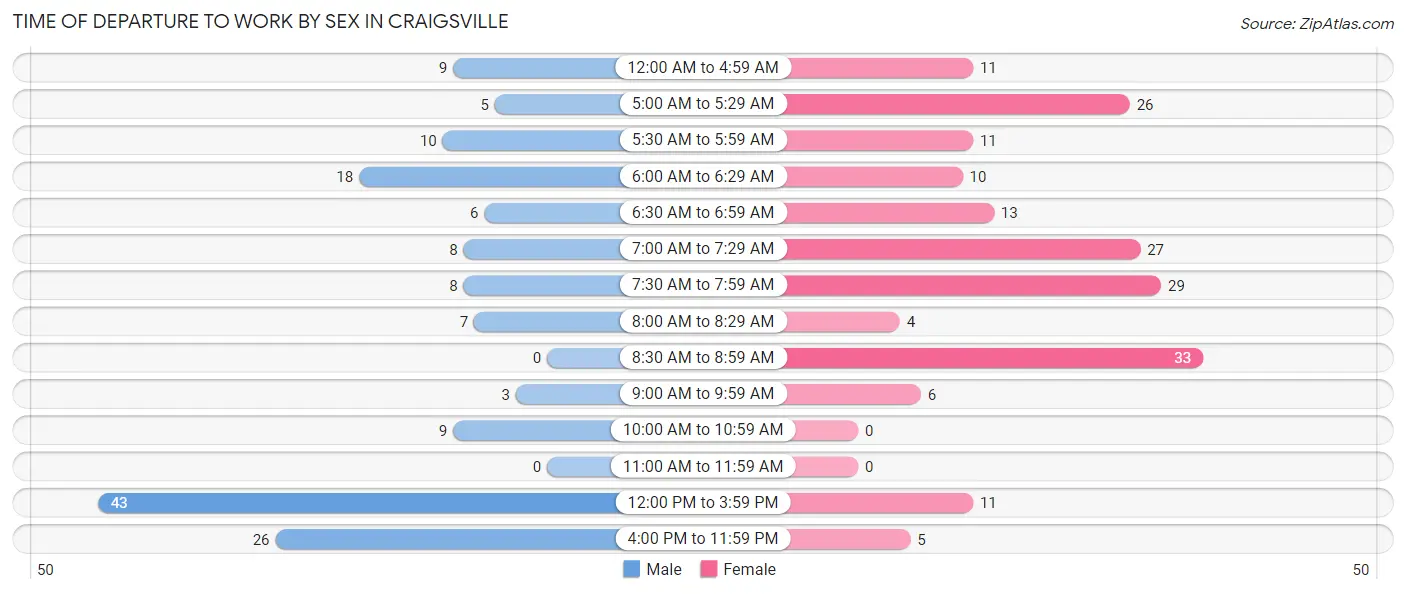
| Time of Departure | Male | Female |
| 12:00 AM to 4:59 AM | 9 (5.9%) | 11 (5.9%) |
| 5:00 AM to 5:29 AM | 5 (3.3%) | 26 (14.0%) |
| 5:30 AM to 5:59 AM | 10 (6.6%) | 11 (5.9%) |
| 6:00 AM to 6:29 AM | 18 (11.8%) | 10 (5.4%) |
| 6:30 AM to 6:59 AM | 6 (4.0%) | 13 (7.0%) |
| 7:00 AM to 7:29 AM | 8 (5.3%) | 27 (14.5%) |
| 7:30 AM to 7:59 AM | 8 (5.3%) | 29 (15.6%) |
| 8:00 AM to 8:29 AM | 7 (4.6%) | 4 (2.1%) |
| 8:30 AM to 8:59 AM | 0 (0.0%) | 33 (17.7%) |
| 9:00 AM to 9:59 AM | 3 (2.0%) | 6 (3.2%) |
| 10:00 AM to 10:59 AM | 9 (5.9%) | 0 (0.0%) |
| 11:00 AM to 11:59 AM | 0 (0.0%) | 0 (0.0%) |
| 12:00 PM to 3:59 PM | 43 (28.3%) | 11 (5.9%) |
| 4:00 PM to 11:59 PM | 26 (17.1%) | 5 (2.7%) |
| Total | 152 (100.0%) | 186 (100.0%) |
Housing Occupancy in Craigsville
Occupancy by Ownership in Craigsville
Of the total 458 dwellings in Craigsville, owner-occupied units account for 214 (46.7%), while renter-occupied units make up 244 (53.3%).
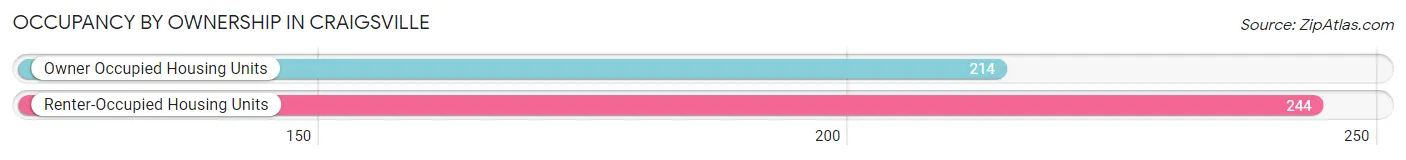
| Occupancy | # Housing Units | % Housing Units |
| Owner Occupied Housing Units | 214 | 46.7% |
| Renter-Occupied Housing Units | 244 | 53.3% |
| Total Occupied Housing Units | 458 | 100.0% |
Occupancy by Household Size in Craigsville
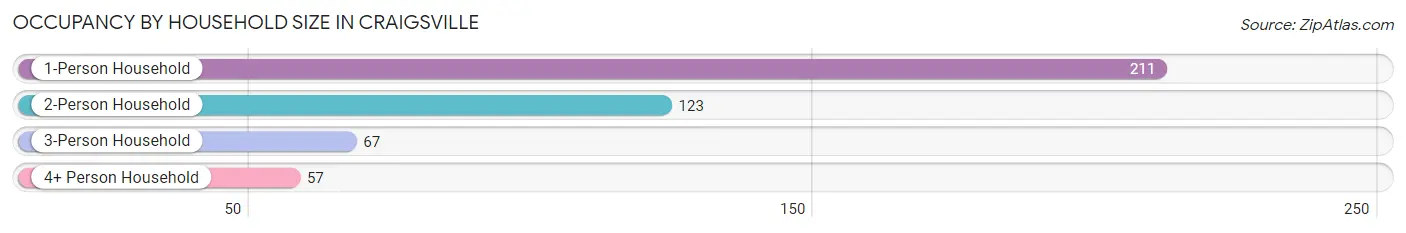
| Household Size | # Housing Units | % Housing Units |
| 1-Person Household | 211 | 46.1% |
| 2-Person Household | 123 | 26.9% |
| 3-Person Household | 67 | 14.6% |
| 4+ Person Household | 57 | 12.4% |
| Total Housing Units | 458 | 100.0% |
Occupancy by Ownership by Household Size in Craigsville
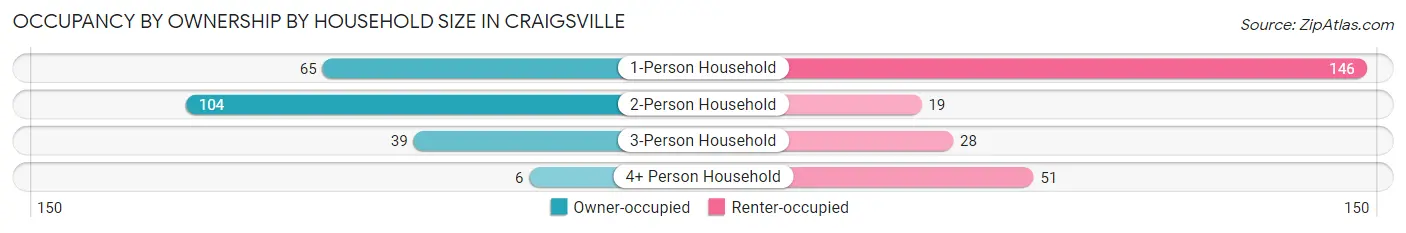
| Household Size | Owner-occupied | Renter-occupied |
| 1-Person Household | 65 (30.8%) | 146 (69.2%) |
| 2-Person Household | 104 (84.6%) | 19 (15.4%) |
| 3-Person Household | 39 (58.2%) | 28 (41.8%) |
| 4+ Person Household | 6 (10.5%) | 51 (89.5%) |
| Total Housing Units | 214 (46.7%) | 244 (53.3%) |
Occupancy by Educational Attainment in Craigsville
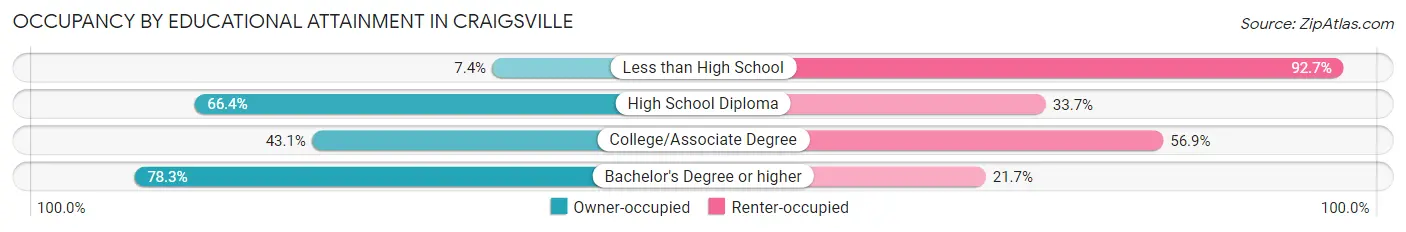
| Household Size | Owner-occupied | Renter-occupied |
| Less than High School | 10 (7.3%) | 126 (92.6%) |
| High School Diploma | 140 (66.3%) | 71 (33.7%) |
| College/Associate Degree | 28 (43.1%) | 37 (56.9%) |
| Bachelor's Degree or higher | 36 (78.3%) | 10 (21.7%) |
Occupancy by Age of Householder in Craigsville
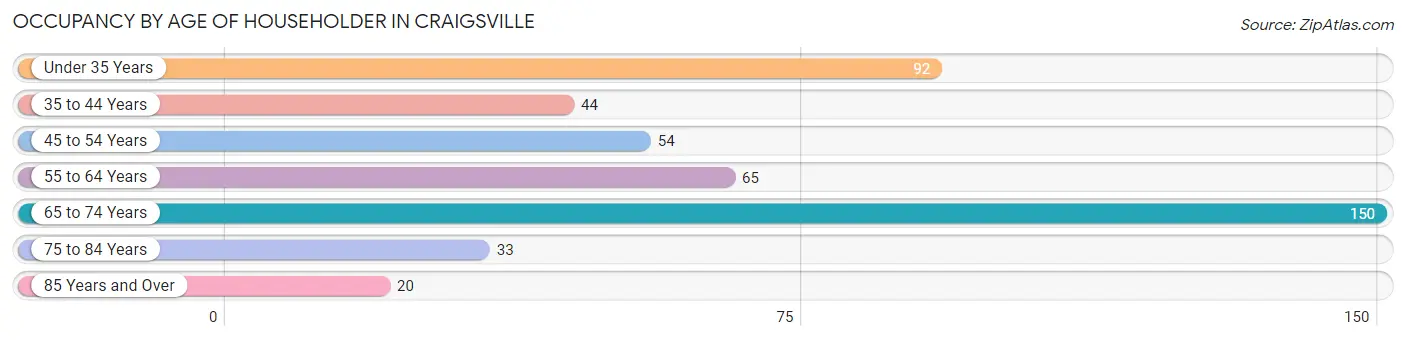
| Age Bracket | # Households | % Households |
| Under 35 Years | 92 | 20.1% |
| 35 to 44 Years | 44 | 9.6% |
| 45 to 54 Years | 54 | 11.8% |
| 55 to 64 Years | 65 | 14.2% |
| 65 to 74 Years | 150 | 32.8% |
| 75 to 84 Years | 33 | 7.2% |
| 85 Years and Over | 20 | 4.4% |
| Total | 458 | 100.0% |
Housing Finances in Craigsville
Median Income by Occupancy in Craigsville
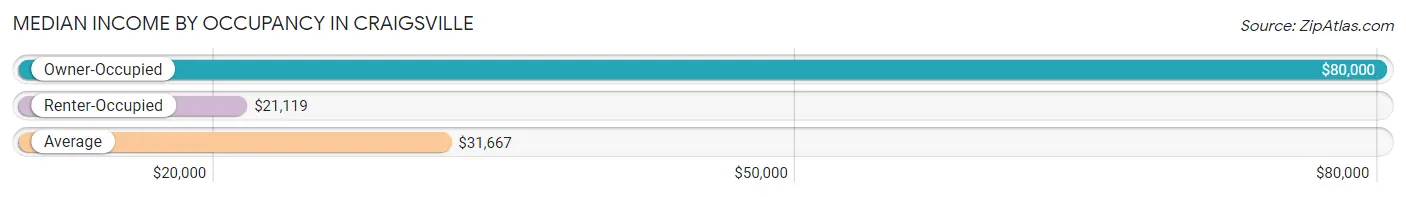
| Occupancy Type | # Households | Median Income |
| Owner-Occupied | 214 (46.7%) | $80,000 |
| Renter-Occupied | 244 (53.3%) | $21,119 |
| Average | 458 (100.0%) | $31,667 |
Occupancy by Householder Income Bracket in Craigsville
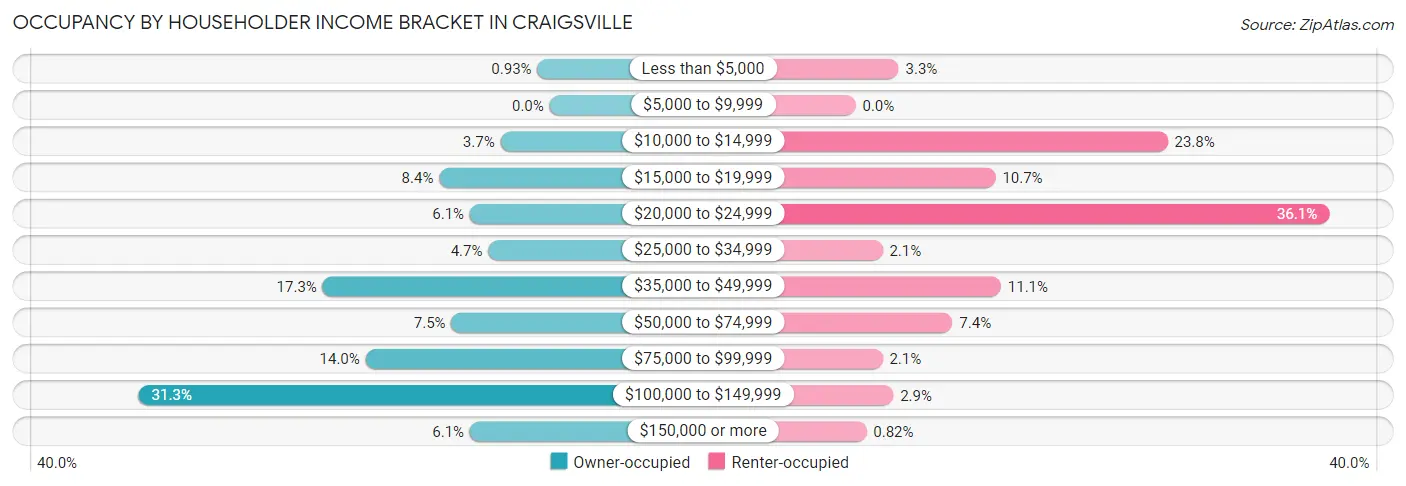
| Income Bracket | Owner-occupied | Renter-occupied |
| Less than $5,000 | 2 (0.9%) | 8 (3.3%) |
| $5,000 to $9,999 | 0 (0.0%) | 0 (0.0%) |
| $10,000 to $14,999 | 8 (3.7%) | 58 (23.8%) |
| $15,000 to $19,999 | 18 (8.4%) | 26 (10.7%) |
| $20,000 to $24,999 | 13 (6.1%) | 88 (36.1%) |
| $25,000 to $34,999 | 10 (4.7%) | 5 (2.1%) |
| $35,000 to $49,999 | 37 (17.3%) | 27 (11.1%) |
| $50,000 to $74,999 | 16 (7.5%) | 18 (7.4%) |
| $75,000 to $99,999 | 30 (14.0%) | 5 (2.1%) |
| $100,000 to $149,999 | 67 (31.3%) | 7 (2.9%) |
| $150,000 or more | 13 (6.1%) | 2 (0.8%) |
| Total | 214 (100.0%) | 244 (100.0%) |
Monthly Housing Cost Tiers in Craigsville
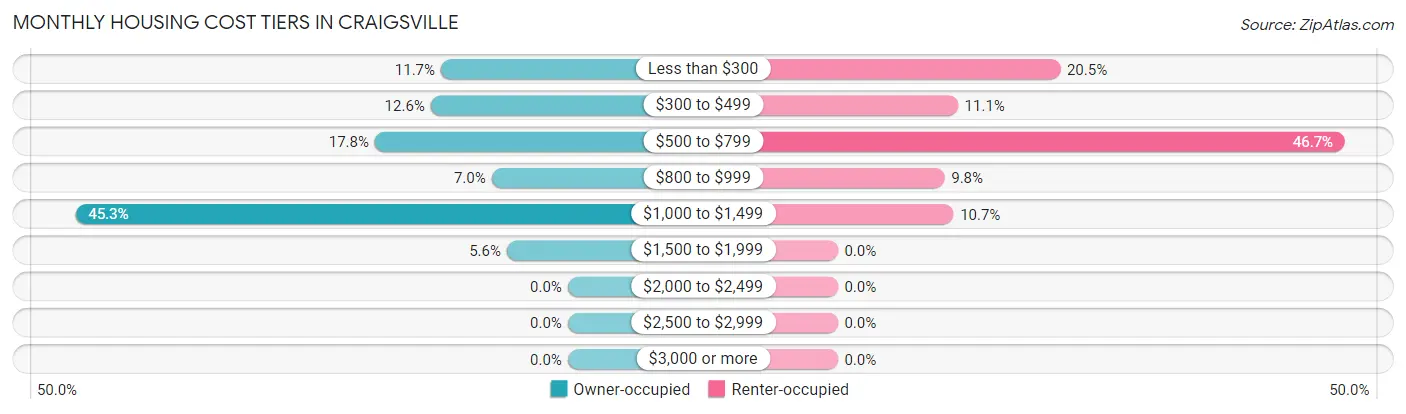
| Monthly Cost | Owner-occupied | Renter-occupied |
| Less than $300 | 25 (11.7%) | 50 (20.5%) |
| $300 to $499 | 27 (12.6%) | 27 (11.1%) |
| $500 to $799 | 38 (17.8%) | 114 (46.7%) |
| $800 to $999 | 15 (7.0%) | 24 (9.8%) |
| $1,000 to $1,499 | 97 (45.3%) | 26 (10.7%) |
| $1,500 to $1,999 | 12 (5.6%) | 0 (0.0%) |
| $2,000 to $2,499 | 0 (0.0%) | 0 (0.0%) |
| $2,500 to $2,999 | 0 (0.0%) | 0 (0.0%) |
| $3,000 or more | 0 (0.0%) | 0 (0.0%) |
| Total | 214 (100.0%) | 244 (100.0%) |
Physical Housing Characteristics in Craigsville
Housing Structures in Craigsville
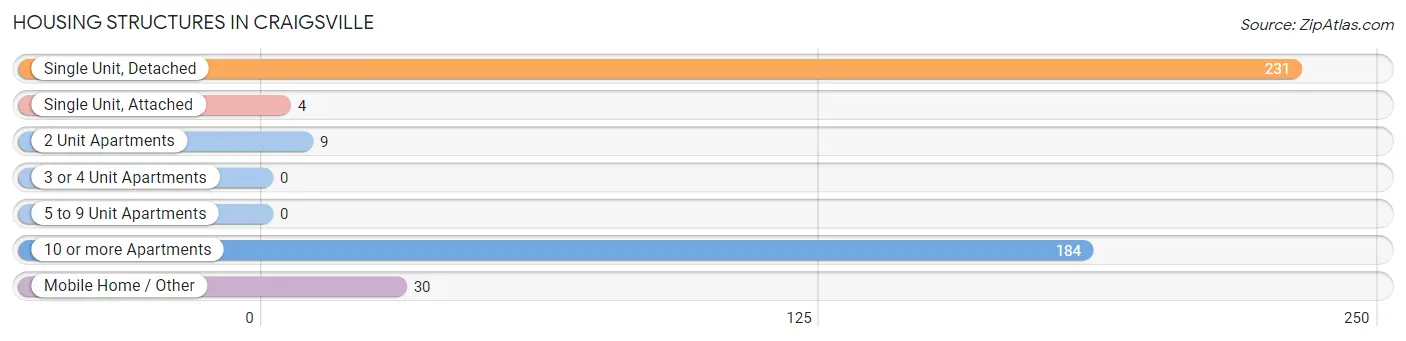
| Structure Type | # Housing Units | % Housing Units |
| Single Unit, Detached | 231 | 50.4% |
| Single Unit, Attached | 4 | 0.9% |
| 2 Unit Apartments | 9 | 2.0% |
| 3 or 4 Unit Apartments | 0 | 0.0% |
| 5 to 9 Unit Apartments | 0 | 0.0% |
| 10 or more Apartments | 184 | 40.2% |
| Mobile Home / Other | 30 | 6.6% |
| Total | 458 | 100.0% |
Housing Structures by Occupancy in Craigsville
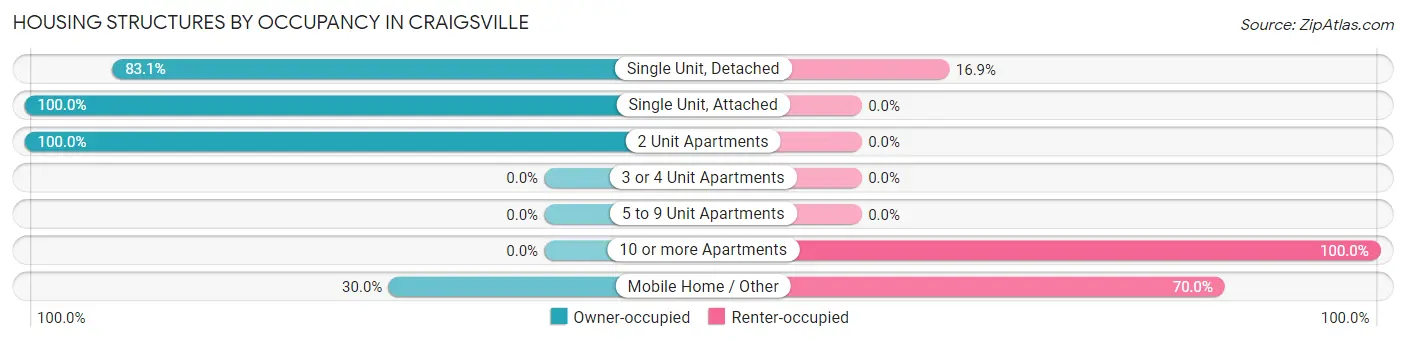
| Structure Type | Owner-occupied | Renter-occupied |
| Single Unit, Detached | 192 (83.1%) | 39 (16.9%) |
| Single Unit, Attached | 4 (100.0%) | 0 (0.0%) |
| 2 Unit Apartments | 9 (100.0%) | 0 (0.0%) |
| 3 or 4 Unit Apartments | 0 (0.0%) | 0 (0.0%) |
| 5 to 9 Unit Apartments | 0 (0.0%) | 0 (0.0%) |
| 10 or more Apartments | 0 (0.0%) | 184 (100.0%) |
| Mobile Home / Other | 9 (30.0%) | 21 (70.0%) |
| Total | 214 (46.7%) | 244 (53.3%) |
Housing Structures by Number of Rooms in Craigsville
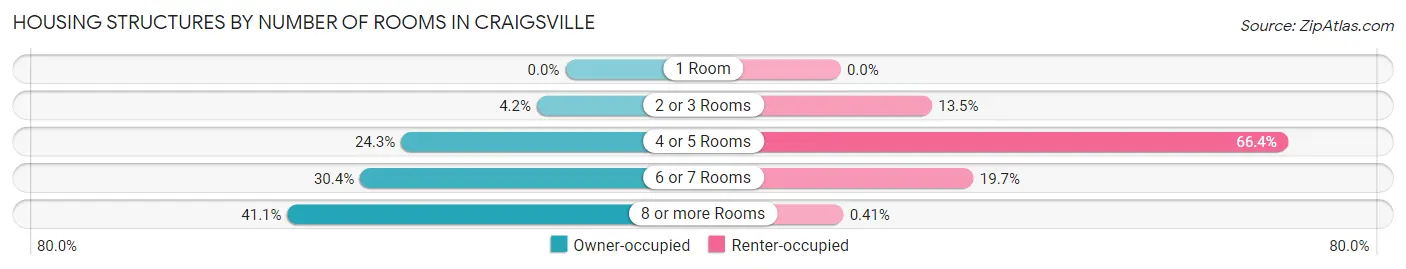
| Number of Rooms | Owner-occupied | Renter-occupied |
| 1 Room | 0 (0.0%) | 0 (0.0%) |
| 2 or 3 Rooms | 9 (4.2%) | 33 (13.5%) |
| 4 or 5 Rooms | 52 (24.3%) | 162 (66.4%) |
| 6 or 7 Rooms | 65 (30.4%) | 48 (19.7%) |
| 8 or more Rooms | 88 (41.1%) | 1 (0.4%) |
| Total | 214 (100.0%) | 244 (100.0%) |
Housing Structure by Heating Type in Craigsville
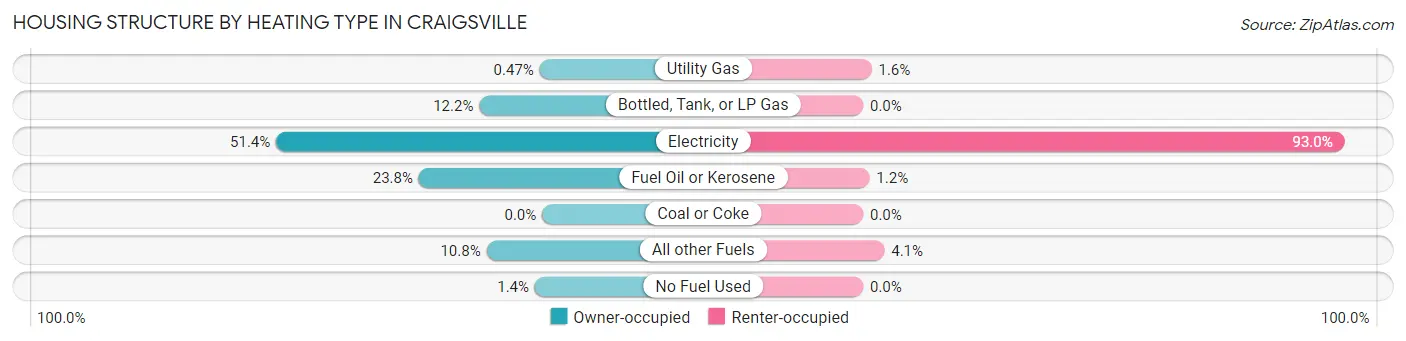
| Heating Type | Owner-occupied | Renter-occupied |
| Utility Gas | 1 (0.5%) | 4 (1.6%) |
| Bottled, Tank, or LP Gas | 26 (12.1%) | 0 (0.0%) |
| Electricity | 110 (51.4%) | 227 (93.0%) |
| Fuel Oil or Kerosene | 51 (23.8%) | 3 (1.2%) |
| Coal or Coke | 0 (0.0%) | 0 (0.0%) |
| All other Fuels | 23 (10.7%) | 10 (4.1%) |
| No Fuel Used | 3 (1.4%) | 0 (0.0%) |
| Total | 214 (100.0%) | 244 (100.0%) |
Household Vehicle Usage in Craigsville
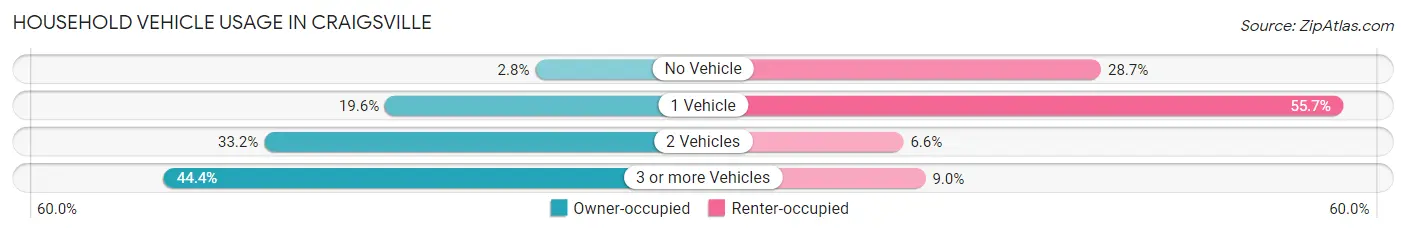
| Vehicles per Household | Owner-occupied | Renter-occupied |
| No Vehicle | 6 (2.8%) | 70 (28.7%) |
| 1 Vehicle | 42 (19.6%) | 136 (55.7%) |
| 2 Vehicles | 71 (33.2%) | 16 (6.6%) |
| 3 or more Vehicles | 95 (44.4%) | 22 (9.0%) |
| Total | 214 (100.0%) | 244 (100.0%) |
Real Estate & Mortgages in Craigsville
Real Estate and Mortgage Overview in Craigsville
| Characteristic | Without Mortgage | With Mortgage |
| Housing Units | 73 | 141 |
| Median Property Value | $196,300 | $147,600 |
| Median Household Income | - | - |
| Monthly Housing Costs | $409 | $0 |
| Real Estate Taxes | $1,180 | $5 |
Property Value by Mortgage Status in Craigsville
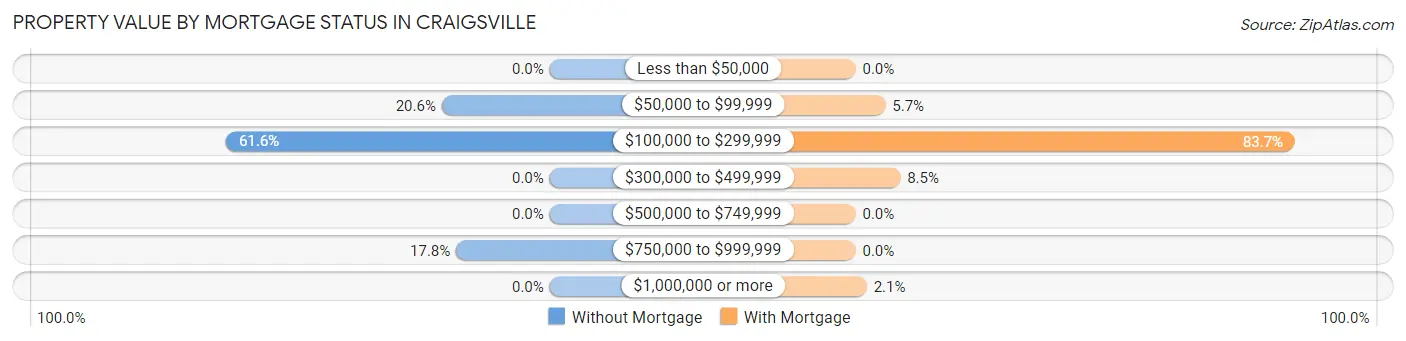
| Property Value | Without Mortgage | With Mortgage |
| Less than $50,000 | 0 (0.0%) | 0 (0.0%) |
| $50,000 to $99,999 | 15 (20.5%) | 8 (5.7%) |
| $100,000 to $299,999 | 45 (61.6%) | 118 (83.7%) |
| $300,000 to $499,999 | 0 (0.0%) | 12 (8.5%) |
| $500,000 to $749,999 | 0 (0.0%) | 0 (0.0%) |
| $750,000 to $999,999 | 13 (17.8%) | 0 (0.0%) |
| $1,000,000 or more | 0 (0.0%) | 3 (2.1%) |
| Total | 73 (100.0%) | 141 (100.0%) |
Household Income by Mortgage Status in Craigsville
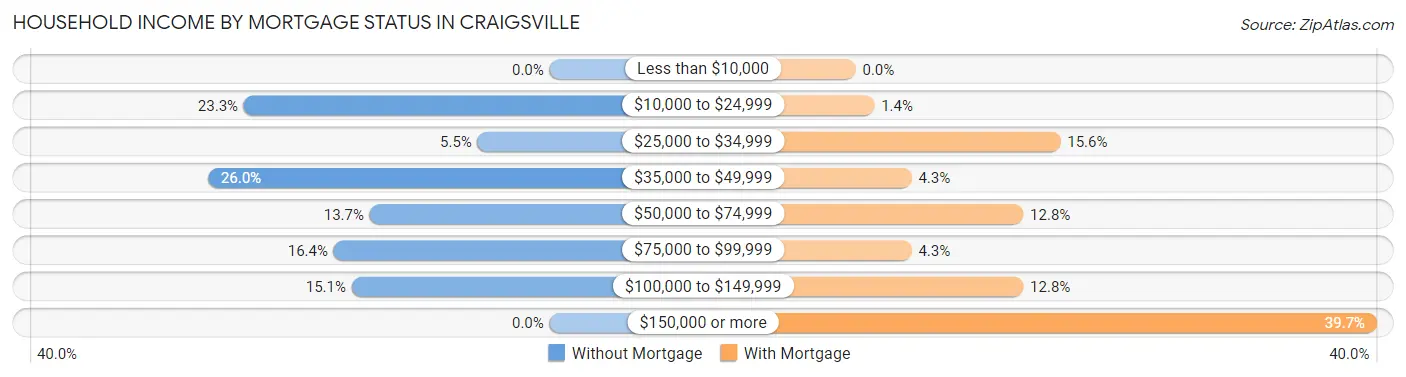
| Household Income | Without Mortgage | With Mortgage |
| Less than $10,000 | 0 (0.0%) | 0 (0.0%) |
| $10,000 to $24,999 | 17 (23.3%) | 2 (1.4%) |
| $25,000 to $34,999 | 4 (5.5%) | 22 (15.6%) |
| $35,000 to $49,999 | 19 (26.0%) | 6 (4.3%) |
| $50,000 to $74,999 | 10 (13.7%) | 18 (12.8%) |
| $75,000 to $99,999 | 12 (16.4%) | 6 (4.3%) |
| $100,000 to $149,999 | 11 (15.1%) | 18 (12.8%) |
| $150,000 or more | 0 (0.0%) | 56 (39.7%) |
| Total | 73 (100.0%) | 141 (100.0%) |
Property Value to Household Income Ratio in Craigsville
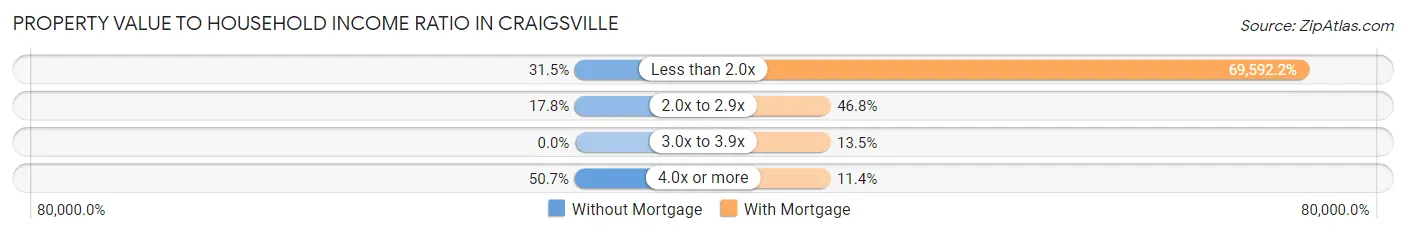
| Value-to-Income Ratio | Without Mortgage | With Mortgage |
| Less than 2.0x | 23 (31.5%) | 98,125 (69,592.2%) |
| 2.0x to 2.9x | 13 (17.8%) | 66 (46.8%) |
| 3.0x to 3.9x | 0 (0.0%) | 19 (13.5%) |
| 4.0x or more | 37 (50.7%) | 16 (11.4%) |
| Total | 73 (100.0%) | 141 (100.0%) |
Real Estate Taxes by Mortgage Status in Craigsville
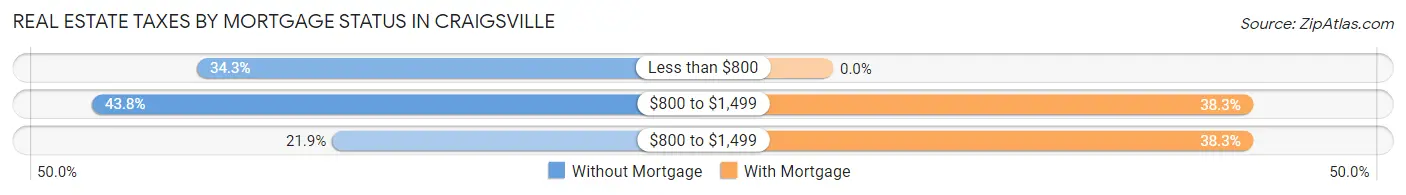
| Property Taxes | Without Mortgage | With Mortgage |
| Less than $800 | 25 (34.3%) | 0 (0.0%) |
| $800 to $1,499 | 32 (43.8%) | 54 (38.3%) |
| $800 to $1,499 | 16 (21.9%) | 54 (38.3%) |
| Total | 73 (100.0%) | 141 (100.0%) |
Health & Disability in Craigsville
Health Insurance Coverage by Age in Craigsville
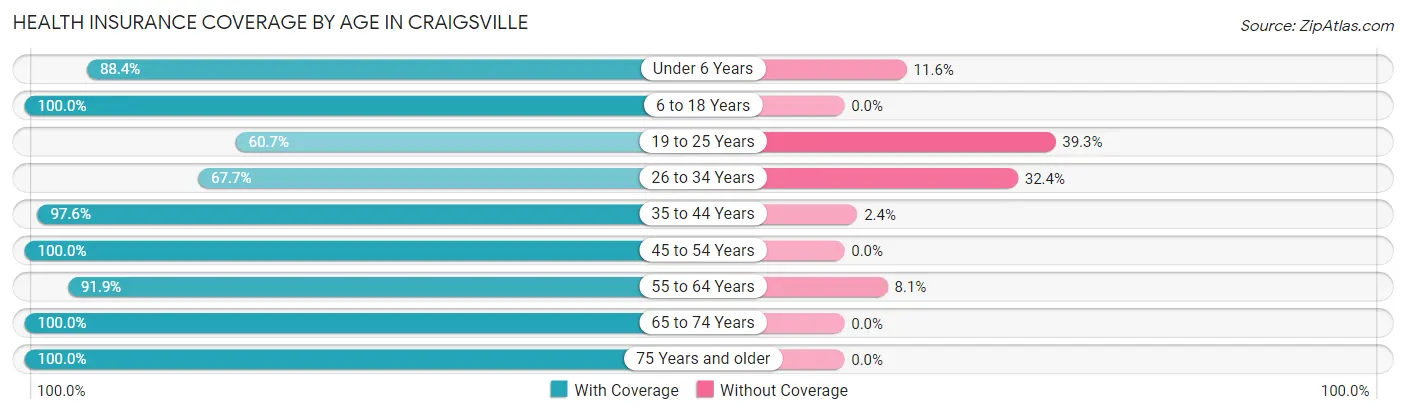
| Age Bracket | With Coverage | Without Coverage |
| Under 6 Years | 76 (88.4%) | 10 (11.6%) |
| 6 to 18 Years | 140 (100.0%) | 0 (0.0%) |
| 19 to 25 Years | 74 (60.7%) | 48 (39.3%) |
| 26 to 34 Years | 46 (67.6%) | 22 (32.4%) |
| 35 to 44 Years | 81 (97.6%) | 2 (2.4%) |
| 45 to 54 Years | 86 (100.0%) | 0 (0.0%) |
| 55 to 64 Years | 91 (91.9%) | 8 (8.1%) |
| 65 to 74 Years | 173 (100.0%) | 0 (0.0%) |
| 75 Years and older | 74 (100.0%) | 0 (0.0%) |
| Total | 841 (90.3%) | 90 (9.7%) |
Health Insurance Coverage by Citizenship Status in Craigsville
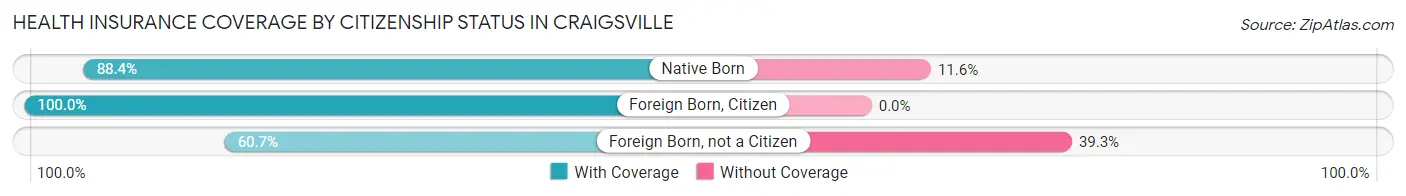
| Citizenship Status | With Coverage | Without Coverage |
| Native Born | 76 (88.4%) | 10 (11.6%) |
| Foreign Born, Citizen | 140 (100.0%) | 0 (0.0%) |
| Foreign Born, not a Citizen | 74 (60.7%) | 48 (39.3%) |
Health Insurance Coverage by Household Income in Craigsville
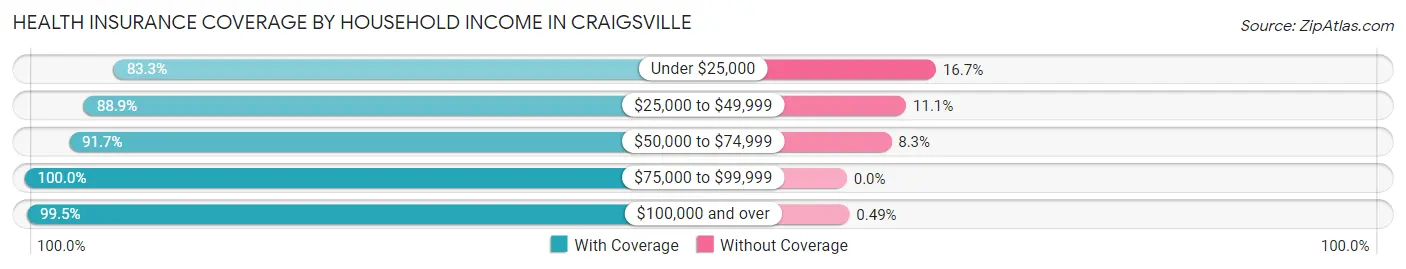
| Household Income | With Coverage | Without Coverage |
| Under $25,000 | 329 (83.3%) | 66 (16.7%) |
| $25,000 to $49,999 | 128 (88.9%) | 16 (11.1%) |
| $50,000 to $74,999 | 77 (91.7%) | 7 (8.3%) |
| $75,000 to $99,999 | 102 (100.0%) | 0 (0.0%) |
| $100,000 and over | 205 (99.5%) | 1 (0.5%) |
Public vs Private Health Insurance Coverage by Age in Craigsville
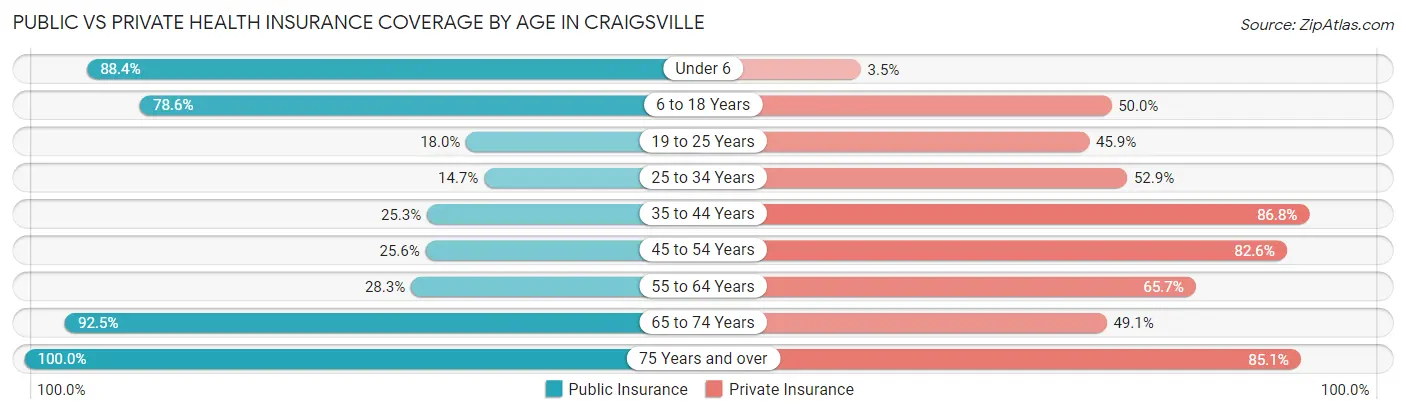
| Age Bracket | Public Insurance | Private Insurance |
| Under 6 | 76 (88.4%) | 3 (3.5%) |
| 6 to 18 Years | 110 (78.6%) | 70 (50.0%) |
| 19 to 25 Years | 22 (18.0%) | 56 (45.9%) |
| 25 to 34 Years | 10 (14.7%) | 36 (52.9%) |
| 35 to 44 Years | 21 (25.3%) | 72 (86.8%) |
| 45 to 54 Years | 22 (25.6%) | 71 (82.6%) |
| 55 to 64 Years | 28 (28.3%) | 65 (65.7%) |
| 65 to 74 Years | 160 (92.5%) | 85 (49.1%) |
| 75 Years and over | 74 (100.0%) | 63 (85.1%) |
| Total | 523 (56.2%) | 521 (56.0%) |
Disability Status by Sex by Age in Craigsville
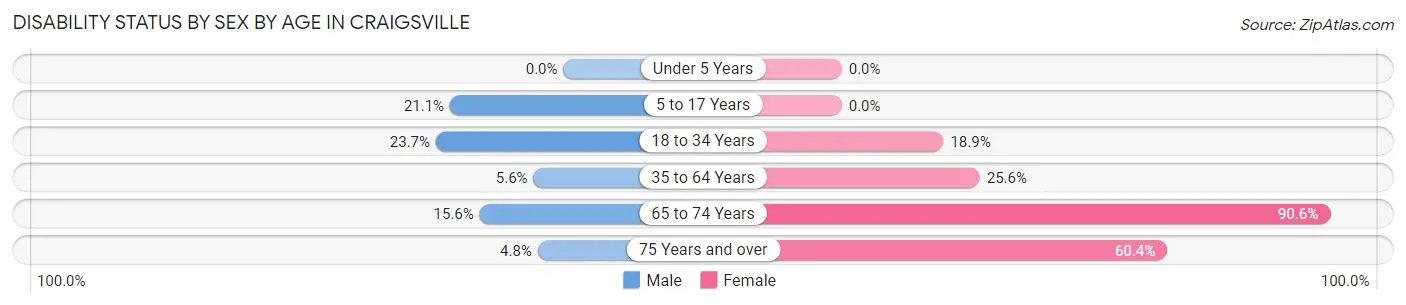
| Age Bracket | Male | Female |
| Under 5 Years | 0 (0.0%) | 0 (0.0%) |
| 5 to 17 Years | 20 (21.0%) | 0 (0.0%) |
| 18 to 34 Years | 22 (23.7%) | 20 (18.9%) |
| 35 to 64 Years | 6 (5.6%) | 41 (25.6%) |
| 65 to 74 Years | 7 (15.6%) | 116 (90.6%) |
| 75 Years and over | 1 (4.8%) | 32 (60.4%) |
Disability Class by Sex by Age in Craigsville
Disability Class: Hearing Difficulty
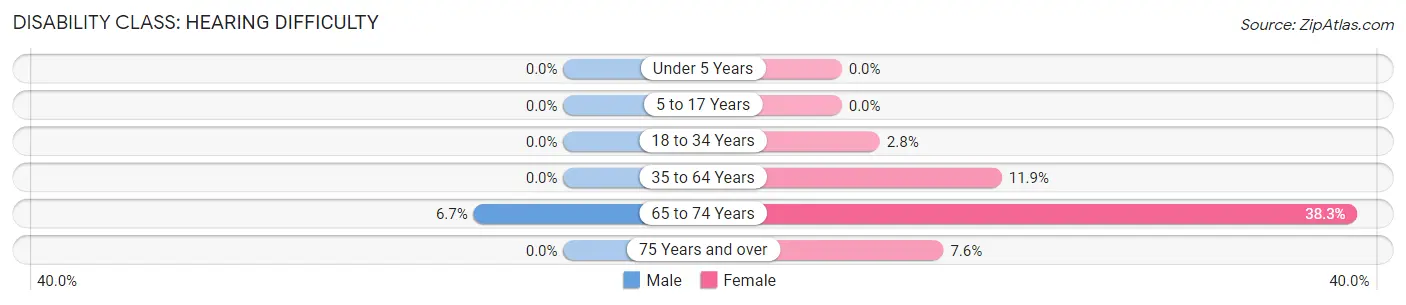
| Age Bracket | Male | Female |
| Under 5 Years | 0 (0.0%) | 0 (0.0%) |
| 5 to 17 Years | 0 (0.0%) | 0 (0.0%) |
| 18 to 34 Years | 0 (0.0%) | 3 (2.8%) |
| 35 to 64 Years | 0 (0.0%) | 19 (11.9%) |
| 65 to 74 Years | 3 (6.7%) | 49 (38.3%) |
| 75 Years and over | 0 (0.0%) | 4 (7.5%) |
Disability Class: Vision Difficulty
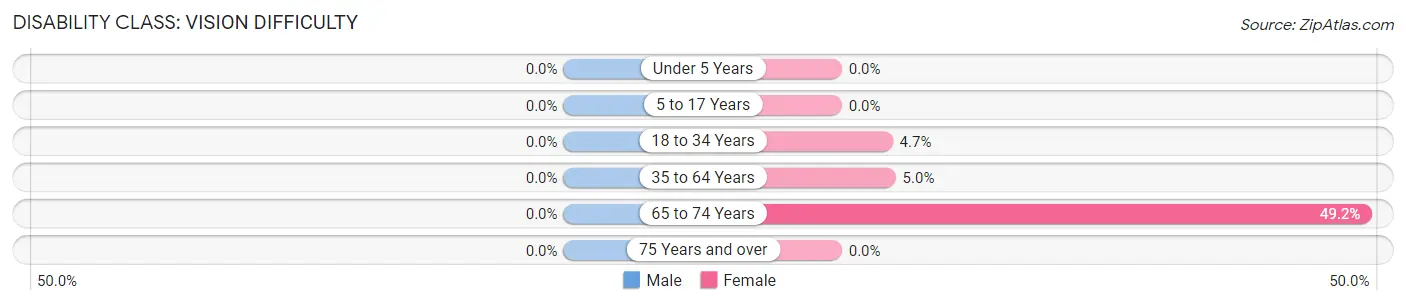
| Age Bracket | Male | Female |
| Under 5 Years | 0 (0.0%) | 0 (0.0%) |
| 5 to 17 Years | 0 (0.0%) | 0 (0.0%) |
| 18 to 34 Years | 0 (0.0%) | 5 (4.7%) |
| 35 to 64 Years | 0 (0.0%) | 8 (5.0%) |
| 65 to 74 Years | 0 (0.0%) | 63 (49.2%) |
| 75 Years and over | 0 (0.0%) | 0 (0.0%) |
Disability Class: Cognitive Difficulty
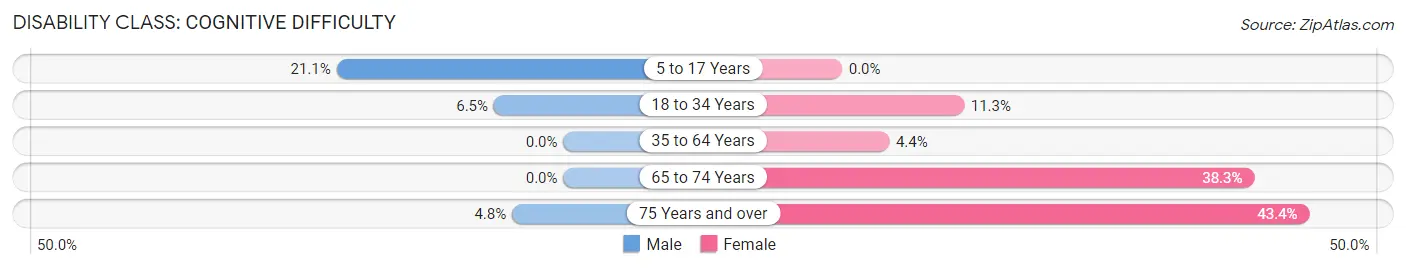
| Age Bracket | Male | Female |
| 5 to 17 Years | 20 (21.0%) | 0 (0.0%) |
| 18 to 34 Years | 6 (6.5%) | 12 (11.3%) |
| 35 to 64 Years | 0 (0.0%) | 7 (4.4%) |
| 65 to 74 Years | 0 (0.0%) | 49 (38.3%) |
| 75 Years and over | 1 (4.8%) | 23 (43.4%) |
Disability Class: Ambulatory Difficulty
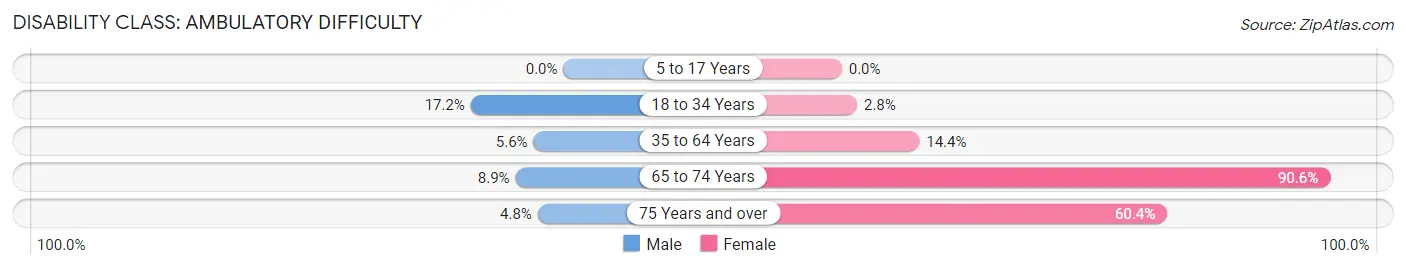
| Age Bracket | Male | Female |
| 5 to 17 Years | 0 (0.0%) | 0 (0.0%) |
| 18 to 34 Years | 16 (17.2%) | 3 (2.8%) |
| 35 to 64 Years | 6 (5.6%) | 23 (14.4%) |
| 65 to 74 Years | 4 (8.9%) | 116 (90.6%) |
| 75 Years and over | 1 (4.8%) | 32 (60.4%) |
Disability Class: Self-Care Difficulty
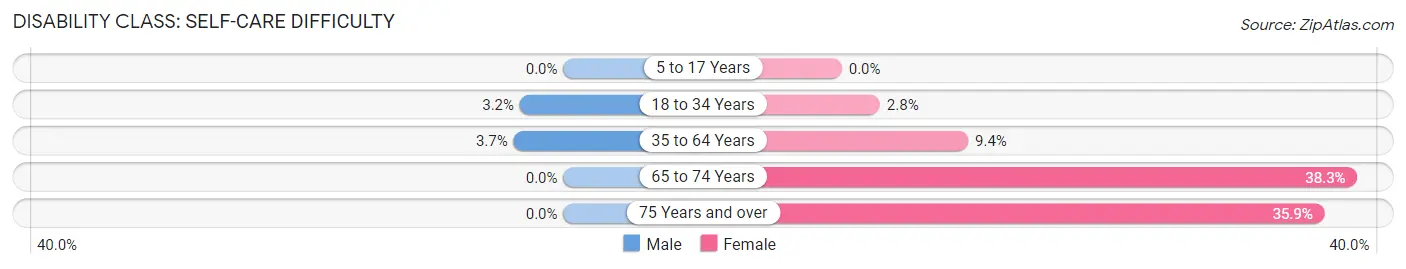
| Age Bracket | Male | Female |
| 5 to 17 Years | 0 (0.0%) | 0 (0.0%) |
| 18 to 34 Years | 3 (3.2%) | 3 (2.8%) |
| 35 to 64 Years | 4 (3.7%) | 15 (9.4%) |
| 65 to 74 Years | 0 (0.0%) | 49 (38.3%) |
| 75 Years and over | 0 (0.0%) | 19 (35.8%) |
Technology Access in Craigsville
Computing Device Access in Craigsville
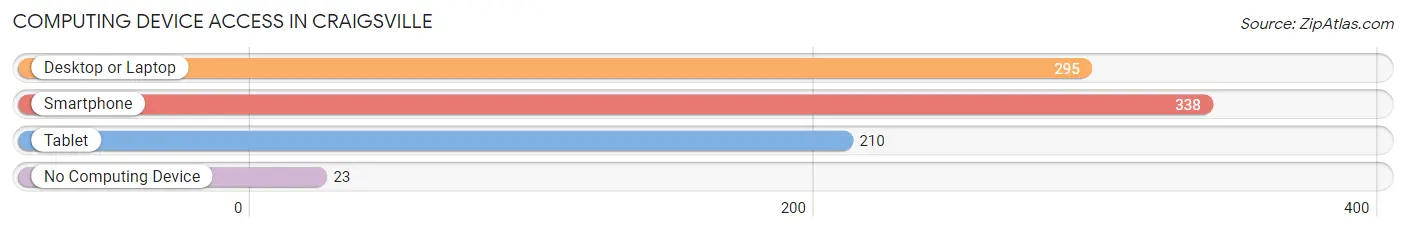
| Device Type | # Households | % Households |
| Desktop or Laptop | 295 | 64.4% |
| Smartphone | 338 | 73.8% |
| Tablet | 210 | 45.9% |
| No Computing Device | 23 | 5.0% |
| Total | 458 | 100.0% |
Internet Access in Craigsville
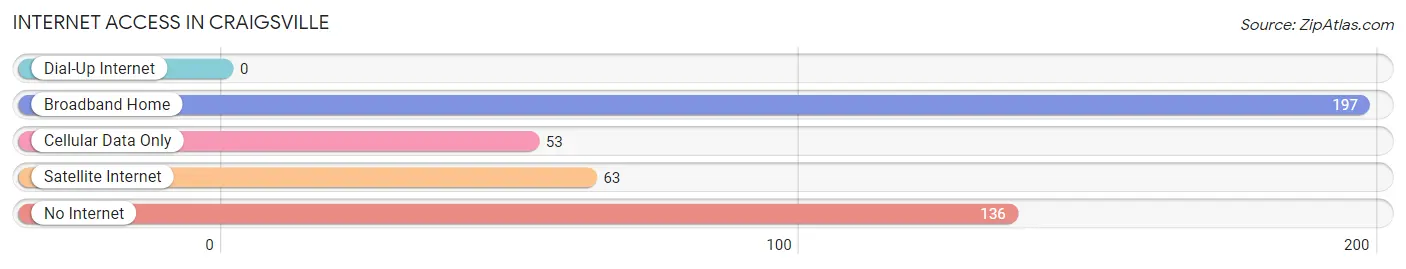
| Internet Type | # Households | % Households |
| Dial-Up Internet | 0 | 0.0% |
| Broadband Home | 197 | 43.0% |
| Cellular Data Only | 53 | 11.6% |
| Satellite Internet | 63 | 13.8% |
| No Internet | 136 | 29.7% |
| Total | 458 | 100.0% |
Craigsville Summary
Craigesville is a small town located in Augusta County, Virginia. It is situated in the Shenandoah Valley, approximately 10 miles south of Staunton and 25 miles north of Harrisonburg. The town is home to a population of approximately 1,000 people and is part of the Staunton-Waynesboro Metropolitan Statistical Area.
History
Craigesville was founded in 1790 by William Craig, a Revolutionary War veteran. The town was originally known as Craig’s Store, and was the first settlement in Augusta County. Craigesville was officially incorporated in 1832.
The town was an important stop on the Staunton-Parkersburg Turnpike, which was a major transportation route in the 19th century. The turnpike connected the Shenandoah Valley to the Ohio River Valley, and was used by settlers, traders, and military personnel.
Craigesville was also an important stop on the Virginia Central Railroad, which was built in the 1850s. The railroad connected the Shenandoah Valley to Richmond, and was a major factor in the town’s growth.
Geography
Craigesville is located in the Shenandoah Valley, in the foothills of the Blue Ridge Mountains. The town is situated at the intersection of US Route 11 and State Route 42.
The town is surrounded by rolling hills and farmland, and is located near several natural attractions, including the Shenandoah National Park and the George Washington National Forest.
Economy
The economy of Craigesville is largely based on agriculture and tourism. The town is home to several farms, which produce a variety of crops, including corn, soybeans, and hay.
Tourism is also an important part of the local economy. Craigesville is home to several historic sites, including the Craig House, which was built in 1790 and is listed on the National Register of Historic Places. The town is also home to several wineries, which attract visitors from all over the region.
Demographics
As of the 2010 census, Craigesville had a population of 1,000 people. The racial makeup of the town was 95.2% White, 2.2% African American, 0.2% Native American, 0.4% Asian, 0.2% from other races, and 1.9% from two or more races.
The median household income in Craigesville was $41,250, and the median family income was $50,000. The per capita income was $20,000. Approximately 10.2% of the population was below the poverty line.
Conclusion
Craigesville is a small town located in Augusta County, Virginia. It is situated in the Shenandoah Valley, and is home to a population of approximately 1,000 people. The town was founded in 1790 and was an important stop on the Staunton-Parkersburg Turnpike and the Virginia Central Railroad. The economy of Craigesville is largely based on agriculture and tourism, and the town is home to several historic sites and wineries. As of the 2010 census, the population of Craigesville was 95.2% White, 2.2% African American, 0.2% Native American, 0.4% Asian, and 1.9% from two or more races. The median household income in Craigesville was $41,250, and the median family income was $50,000.
Common Questions
What is Per Capita Income in Craigsville?
Per Capita income in Craigsville is $25,918.
What is the Median Family Income in Craigsville?
Median Family Income in Craigsville is $55,795.
What is the Median Household income in Craigsville?
Median Household Income in Craigsville is $31,667.
What is Income or Wage Gap in Craigsville?
Income or Wage Gap in Craigsville is 33.1%.
Women in Craigsville earn 66.9 cents for every dollar earned by a man.
What is Family Income Deficit in Craigsville?
Family Income Deficit in Craigsville is $7,957.
Families that are below poverty line in Craigsville earn $7,957 less on average than the poverty threshold level.
What is Inequality or Gini Index in Craigsville?
Inequality or Gini Index in Craigsville is 0.46.
What is the Total Population of Craigsville?
Total Population of Craigsville is 931.
What is the Total Male Population of Craigsville?
Total Male Population of Craigsville is 396.
What is the Total Female Population of Craigsville?
Total Female Population of Craigsville is 535.
What is the Ratio of Males per 100 Females in Craigsville?
There are 74.02 Males per 100 Females in Craigsville.
What is the Ratio of Females per 100 Males in Craigsville?
There are 135.10 Females per 100 Males in Craigsville.
What is the Median Population Age in Craigsville?
Median Population Age in Craigsville is 43.0 Years.
What is the Average Family Size in Craigsville
Average Family Size in Craigsville is 2.9 People.
What is the Average Household Size in Craigsville
Average Household Size in Craigsville is 2.0 People.
How Large is the Labor Force in Craigsville?
There are 362 People in the Labor Forcein in Craigsville.
What is the Percentage of People in the Labor Force in Craigsville?
48.1% of People are in the Labor Force in Craigsville.
What is the Unemployment Rate in Craigsville?
Unemployment Rate in Craigsville is 5.2%.