Montvale, VA Map & Demographics
Montvale Map
Montvale Overview
$29,739
PER CAPITA INCOME
$82,841
AVG FAMILY INCOME
$39,331
AVG HOUSEHOLD INCOME
13.1%
WAGE / INCOME GAP [ % ]
86.9¢/ $1
WAGE / INCOME GAP [ $ ]
0.37
INEQUALITY / GINI INDEX
424
TOTAL POPULATION
204
MALE POPULATION
220
FEMALE POPULATION
92.73
MALES / 100 FEMALES
107.84
FEMALES / 100 MALES
40.6
MEDIAN AGE
2.6
AVG FAMILY SIZE
1.9
AVG HOUSEHOLD SIZE
226
LABOR FORCE [ PEOPLE ]
58.7%
PERCENT IN LABOR FORCE
10.2%
UNEMPLOYMENT RATE
Montvale Zip Codes
Income in Montvale
Income Overview in Montvale
Per Capita Income in Montvale is $29,739, while median incomes of families and households are $82,841 and $39,331 respectively.
| Characteristic | Number | Measure |
| Per Capita Income | 424 | $29,739 |
| Median Family Income | 95 | $82,841 |
| Mean Family Income | 95 | $84,871 |
| Median Household Income | 220 | $39,331 |
| Mean Household Income | 220 | $54,238 |
| Income Deficit | 95 | $0 |
| Wage / Income Gap (%) | 424 | 13.08% |
| Wage / Income Gap ($) | 424 | 86.92¢ per $1 |
| Gini / Inequality Index | 424 | 0.37 |
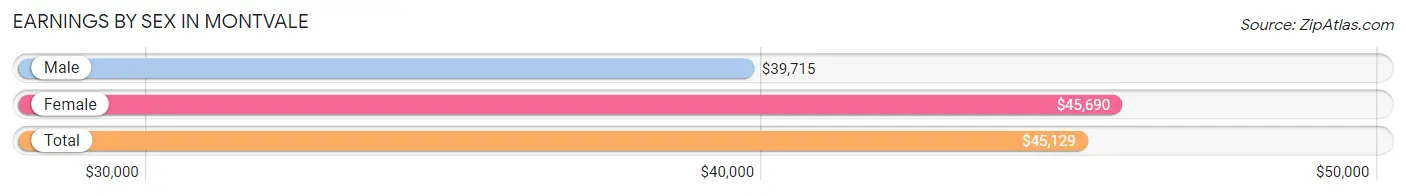
Earnings by Sex in Montvale
Average Earnings in Montvale are $45,129, $39,715 for men and $45,690 for women, a difference of 13.1%.
| Sex | Number | Average Earnings |
| Male | 129 (57.9%) | $39,715 |
| Female | 94 (42.1%) | $45,690 |
| Total | 223 (100.0%) | $45,129 |
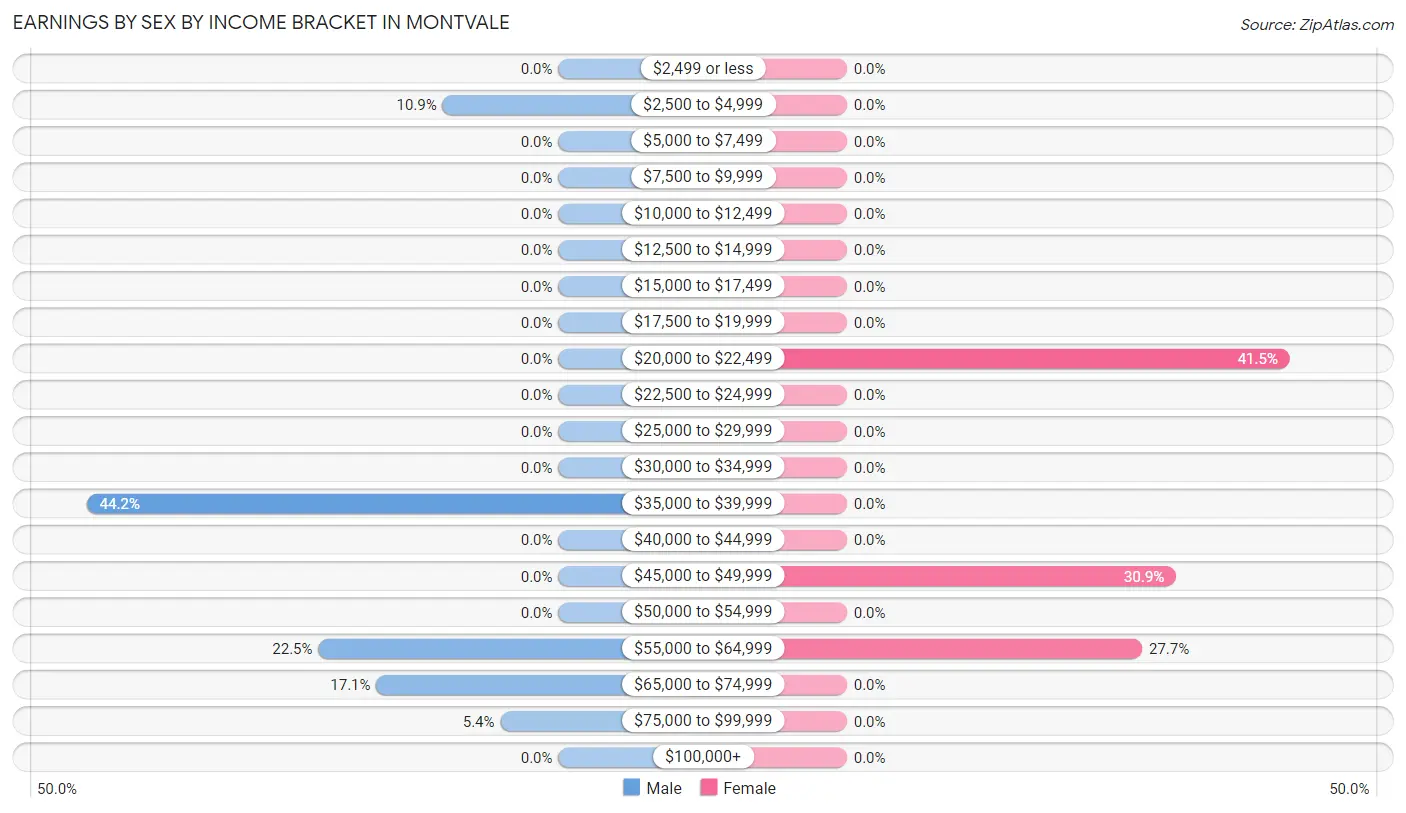
Earnings by Sex by Income Bracket in Montvale
The most common earnings brackets in Montvale are $35,000 to $39,999 for men (57 | 44.2%) and $20,000 to $22,499 for women (39 | 41.5%).
| Income | Male | Female |
| $2,499 or less | 0 (0.0%) | 0 (0.0%) |
| $2,500 to $4,999 | 14 (10.8%) | 0 (0.0%) |
| $5,000 to $7,499 | 0 (0.0%) | 0 (0.0%) |
| $7,500 to $9,999 | 0 (0.0%) | 0 (0.0%) |
| $10,000 to $12,499 | 0 (0.0%) | 0 (0.0%) |
| $12,500 to $14,999 | 0 (0.0%) | 0 (0.0%) |
| $15,000 to $17,499 | 0 (0.0%) | 0 (0.0%) |
| $17,500 to $19,999 | 0 (0.0%) | 0 (0.0%) |
| $20,000 to $22,499 | 0 (0.0%) | 39 (41.5%) |
| $22,500 to $24,999 | 0 (0.0%) | 0 (0.0%) |
| $25,000 to $29,999 | 0 (0.0%) | 0 (0.0%) |
| $30,000 to $34,999 | 0 (0.0%) | 0 (0.0%) |
| $35,000 to $39,999 | 57 (44.2%) | 0 (0.0%) |
| $40,000 to $44,999 | 0 (0.0%) | 0 (0.0%) |
| $45,000 to $49,999 | 0 (0.0%) | 29 (30.8%) |
| $50,000 to $54,999 | 0 (0.0%) | 0 (0.0%) |
| $55,000 to $64,999 | 29 (22.5%) | 26 (27.7%) |
| $65,000 to $74,999 | 22 (17.1%) | 0 (0.0%) |
| $75,000 to $99,999 | 7 (5.4%) | 0 (0.0%) |
| $100,000+ | 0 (0.0%) | 0 (0.0%) |
| Total | 129 (100.0%) | 94 (100.0%) |
Earnings by Sex by Educational Attainment in Montvale
| Educational Attainment | Male Income | Female Income |
| Less than High School | - | - |
| High School Diploma | - | - |
| College or Associate's Degree | - | - |
| Bachelor's Degree | - | - |
| Graduate Degree | - | - |
| Total | $62,986 | $47,371 |
Family Income in Montvale
Family Income Brackets in Montvale
According to the Montvale family income data, there are 38 families falling into the $100,000 to $149,999 income range, which is the most common income bracket and makes up 40.0% of all families.
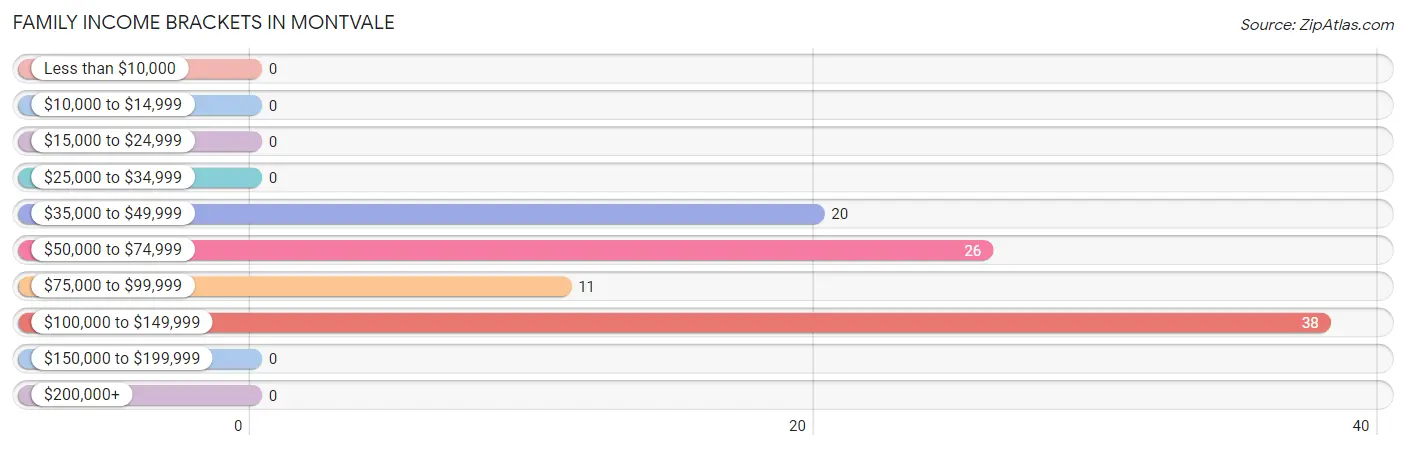
| Income Bracket | # Families | % Families |
| Less than $10,000 | 0 | 0.0% |
| $10,000 to $14,999 | 0 | 0.0% |
| $15,000 to $24,999 | 0 | 0.0% |
| $25,000 to $34,999 | 0 | 0.0% |
| $35,000 to $49,999 | 20 | 21.1% |
| $50,000 to $74,999 | 26 | 27.4% |
| $75,000 to $99,999 | 11 | 11.6% |
| $100,000 to $149,999 | 38 | 40.0% |
| $150,000 to $199,999 | 0 | 0.0% |
| $200,000+ | 0 | 0.0% |
Family Income by Famaliy Size in Montvale
2-person families (50 | 52.6%) account for the highest median family income in Montvale with $59,904 per family, while 2-person families (50 | 52.6%) have the highest median income of $29,952 per family member.
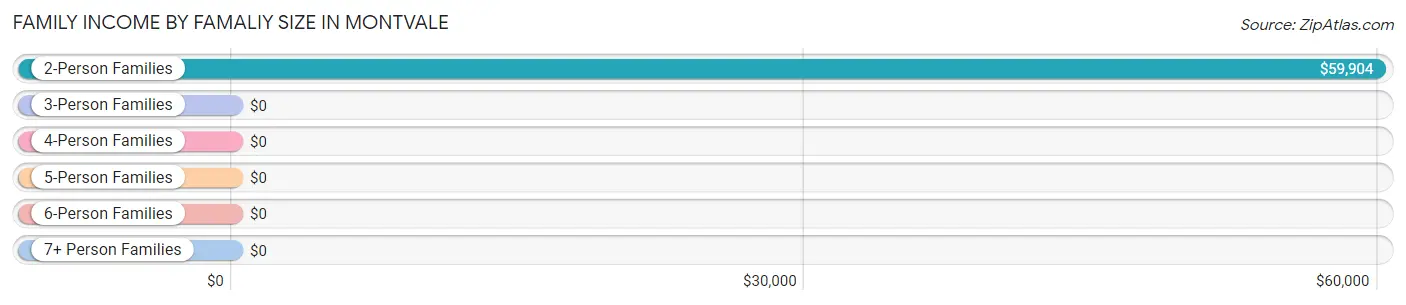
| Income Bracket | # Families | Median Income |
| 2-Person Families | 50 (52.6%) | $59,904 |
| 3-Person Families | 27 (28.4%) | $0 |
| 4-Person Families | 18 (19.0%) | $0 |
| 5-Person Families | 0 (0.0%) | $0 |
| 6-Person Families | 0 (0.0%) | $0 |
| 7+ Person Families | 0 (0.0%) | $0 |
| Total | 95 (100.0%) | $82,841 |
Family Income by Number of Earners in Montvale
| Number of Earners | # Families | Median Income |
| No Earners | 20 (21.0%) | $0 |
| 1 Earner | 37 (39.0%) | $0 |
| 2 Earners | 20 (21.0%) | $0 |
| 3+ Earners | 18 (19.0%) | $0 |
| Total | 95 (100.0%) | $82,841 |
Household Income in Montvale
Household Income Brackets in Montvale
With 86 households falling in the category, the $35,000 to $49,999 income range is the most frequent in Montvale, accounting for 39.1% of all households.
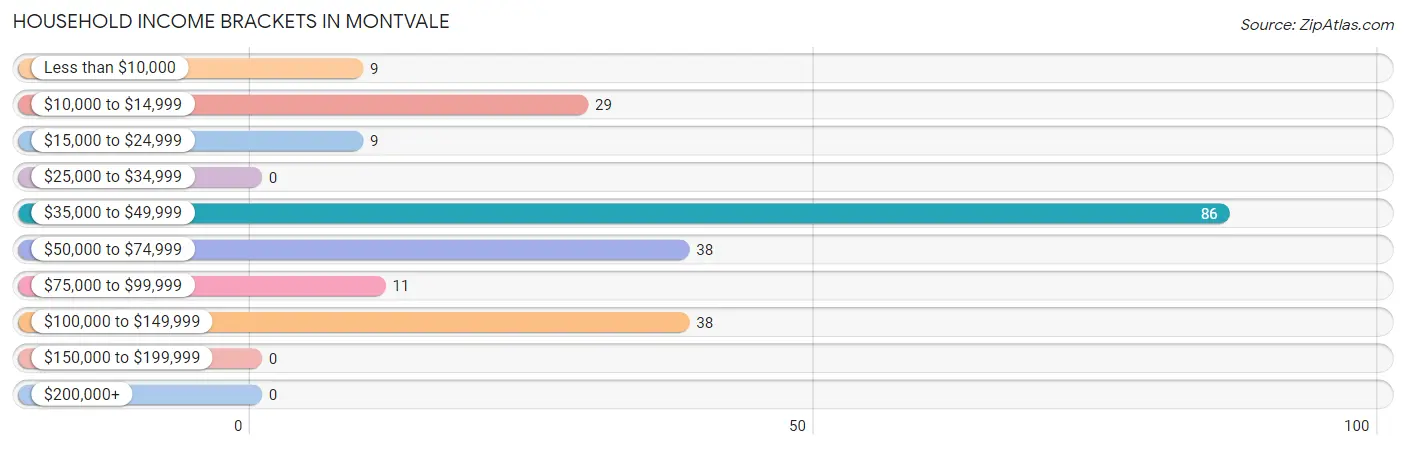
| Income Bracket | # Households | % Households |
| Less than $10,000 | 9 | 4.1% |
| $10,000 to $14,999 | 29 | 13.2% |
| $15,000 to $24,999 | 9 | 4.1% |
| $25,000 to $34,999 | 0 | 0.0% |
| $35,000 to $49,999 | 86 | 39.1% |
| $50,000 to $74,999 | 38 | 17.3% |
| $75,000 to $99,999 | 11 | 5.0% |
| $100,000 to $149,999 | 38 | 17.3% |
| $150,000 to $199,999 | 0 | 0.0% |
| $200,000+ | 0 | 0.0% |
Household Income by Householder Age in Montvale
| Income Bracket | # Households | Median Income |
| 15 to 24 Years | 49 (22.3%) | $0 |
| 25 to 44 Years | 44 (20.0%) | $0 |
| 45 to 64 Years | 49 (22.3%) | $0 |
| 65+ Years | 78 (35.4%) | $0 |
| Total | 220 (100.0%) | $39,331 |
Poverty in Montvale
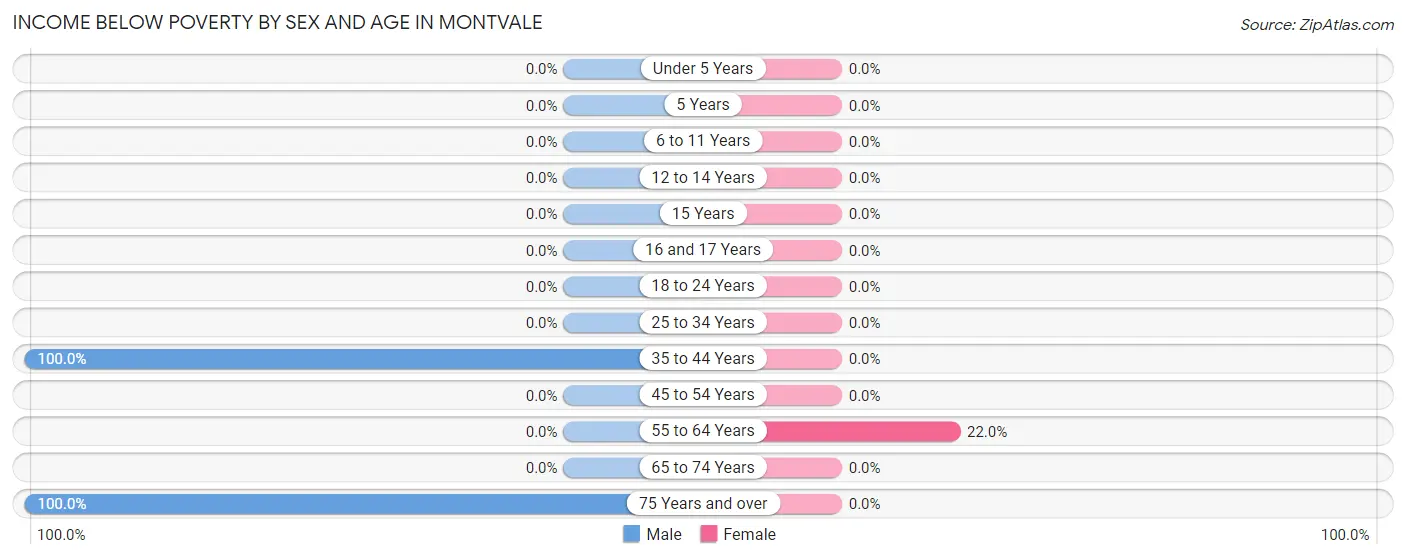
Income Below Poverty by Sex and Age in Montvale
With 25.5% poverty level for males and 4.1% for females among the residents of Montvale, 35 to 44 year old males and 55 to 64 year old females are the most vulnerable to poverty, with 23 males (100.0%) and 9 females (22.0%) in their respective age groups living below the poverty level.
| Age Bracket | Male | Female |
| Under 5 Years | 0 (0.0%) | 0 (0.0%) |
| 5 Years | 0 (0.0%) | 0 (0.0%) |
| 6 to 11 Years | 0 (0.0%) | 0 (0.0%) |
| 12 to 14 Years | 0 (0.0%) | 0 (0.0%) |
| 15 Years | 0 (0.0%) | 0 (0.0%) |
| 16 and 17 Years | 0 (0.0%) | 0 (0.0%) |
| 18 to 24 Years | 0 (0.0%) | 0 (0.0%) |
| 25 to 34 Years | 0 (0.0%) | 0 (0.0%) |
| 35 to 44 Years | 23 (100.0%) | 0 (0.0%) |
| 45 to 54 Years | 0 (0.0%) | 0 (0.0%) |
| 55 to 64 Years | 0 (0.0%) | 9 (22.0%) |
| 65 to 74 Years | 0 (0.0%) | 0 (0.0%) |
| 75 Years and over | 29 (100.0%) | 0 (0.0%) |
| Total | 52 (25.5%) | 9 (4.1%) |
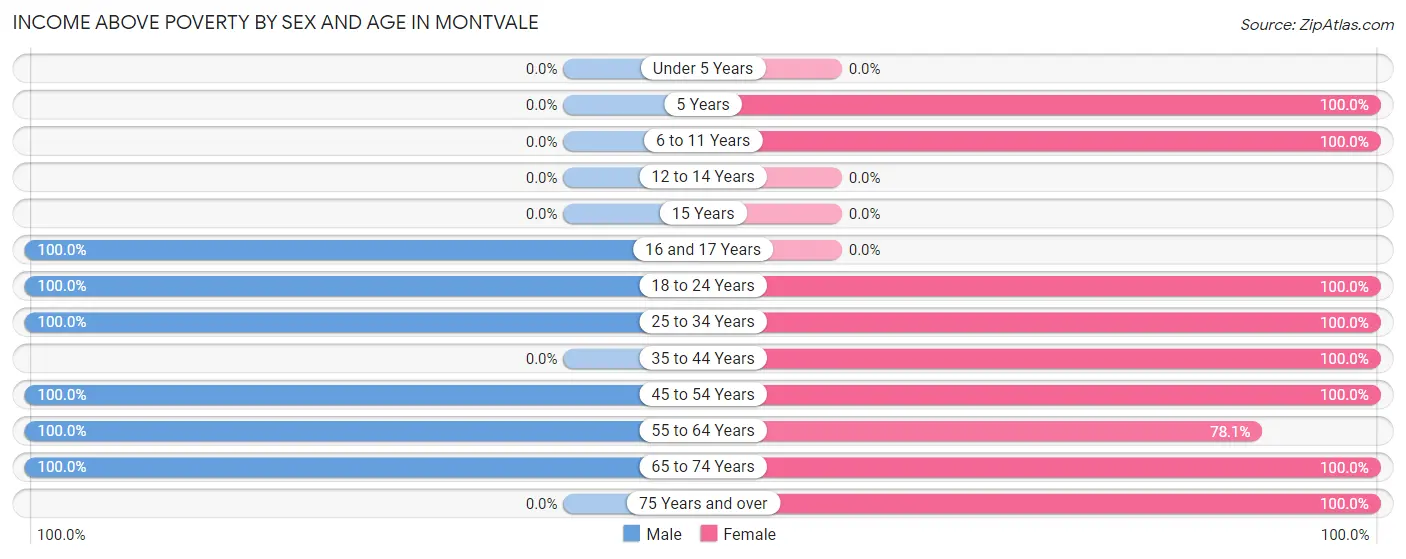
Income Above Poverty by Sex and Age in Montvale
According to the poverty statistics in Montvale, males aged 16 and 17 years and females aged 5 years are the age groups that are most secure financially, with 100.0% of males and 100.0% of females in these age groups living above the poverty line.
| Age Bracket | Male | Female |
| Under 5 Years | 0 (0.0%) | 0 (0.0%) |
| 5 Years | 0 (0.0%) | 14 (100.0%) |
| 6 to 11 Years | 0 (0.0%) | 25 (100.0%) |
| 12 to 14 Years | 0 (0.0%) | 0 (0.0%) |
| 15 Years | 0 (0.0%) | 0 (0.0%) |
| 16 and 17 Years | 14 (100.0%) | 0 (0.0%) |
| 18 to 24 Years | 46 (100.0%) | 39 (100.0%) |
| 25 to 34 Years | 18 (100.0%) | 16 (100.0%) |
| 35 to 44 Years | 0 (0.0%) | 26 (100.0%) |
| 45 to 54 Years | 20 (100.0%) | 21 (100.0%) |
| 55 to 64 Years | 43 (100.0%) | 32 (78.0%) |
| 65 to 74 Years | 11 (100.0%) | 9 (100.0%) |
| 75 Years and over | 0 (0.0%) | 29 (100.0%) |
| Total | 152 (74.5%) | 211 (95.9%) |
Income Below Poverty Among Married-Couple Families in Montvale
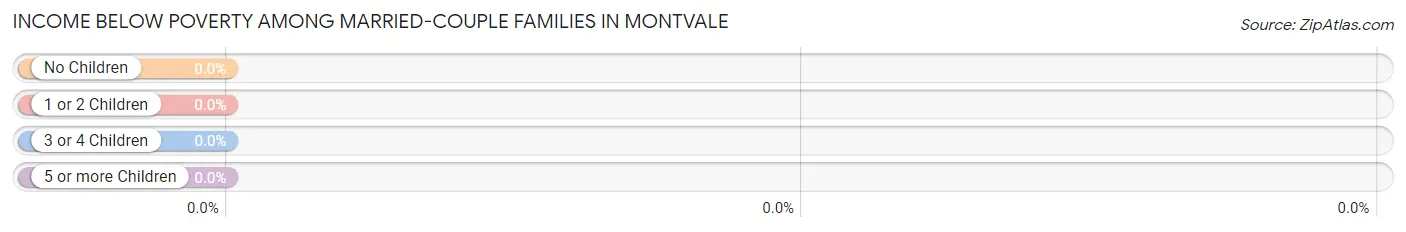
| Children | Above Poverty | Below Poverty |
| No Children | 31 (100.0%) | 0 (0.0%) |
| 1 or 2 Children | 18 (100.0%) | 0 (0.0%) |
| 3 or 4 Children | 0 (0.0%) | 0 (0.0%) |
| 5 or more Children | 0 (0.0%) | 0 (0.0%) |
| Total | 49 (100.0%) | 0 (0.0%) |
Income Below Poverty Among Single-Parent Households in Montvale
| Children | Single Father | Single Mother |
| No Children | 0 (0.0%) | 0 (0.0%) |
| 1 or 2 Children | 0 (0.0%) | 0 (0.0%) |
| 3 or 4 Children | 0 (0.0%) | 0 (0.0%) |
| 5 or more Children | 0 (0.0%) | 0 (0.0%) |
| Total | 0 (0.0%) | 0 (0.0%) |
Income Below Poverty Among Married-Couple vs Single-Parent Households in Montvale
| Children | Married-Couple Families | Single-Parent Households |
| No Children | 0 (0.0%) | 0 (0.0%) |
| 1 or 2 Children | 0 (0.0%) | 0 (0.0%) |
| 3 or 4 Children | 0 (0.0%) | 0 (0.0%) |
| 5 or more Children | 0 (0.0%) | 0 (0.0%) |
| Total | 0 (0.0%) | 0 (0.0%) |
Race in Montvale
The most populous races in Montvale are White / Caucasian (412 | 97.2%), and Two or more Races (12 | 2.8%).
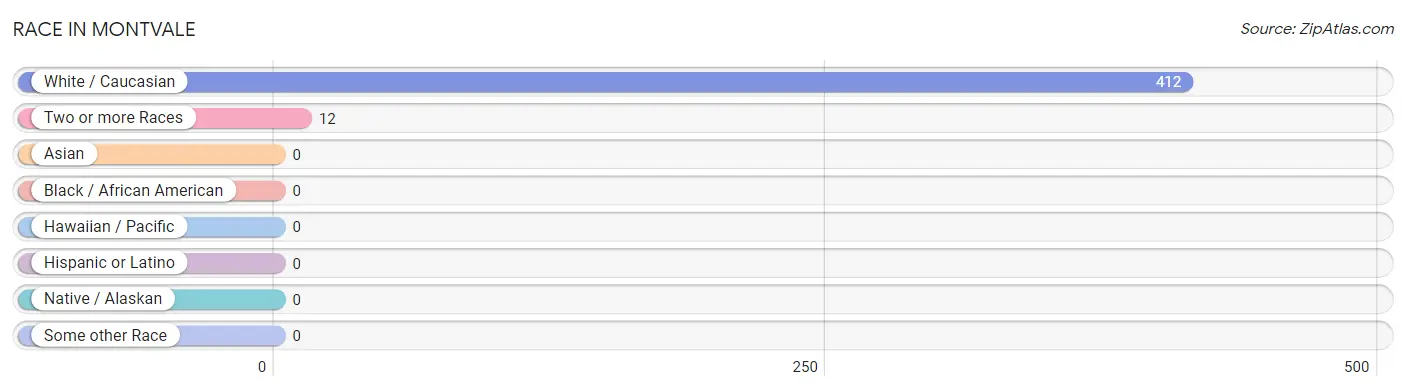
| Race | # Population | % Population |
| Asian | 0 | 0.0% |
| Black / African American | 0 | 0.0% |
| Hawaiian / Pacific | 0 | 0.0% |
| Hispanic or Latino | 0 | 0.0% |
| Native / Alaskan | 0 | 0.0% |
| White / Caucasian | 412 | 97.2% |
| Two or more Races | 12 | 2.8% |
| Some other Race | 0 | 0.0% |
| Total | 424 | 100.0% |
Ancestry in Montvale
The most populous ancestries reported in Montvale are American (144 | 34.0%), European (29 | 6.8%), German (23 | 5.4%), Cherokee (12 | 2.8%), and French (9 | 2.1%), together accounting for 51.2% of all Montvale residents.
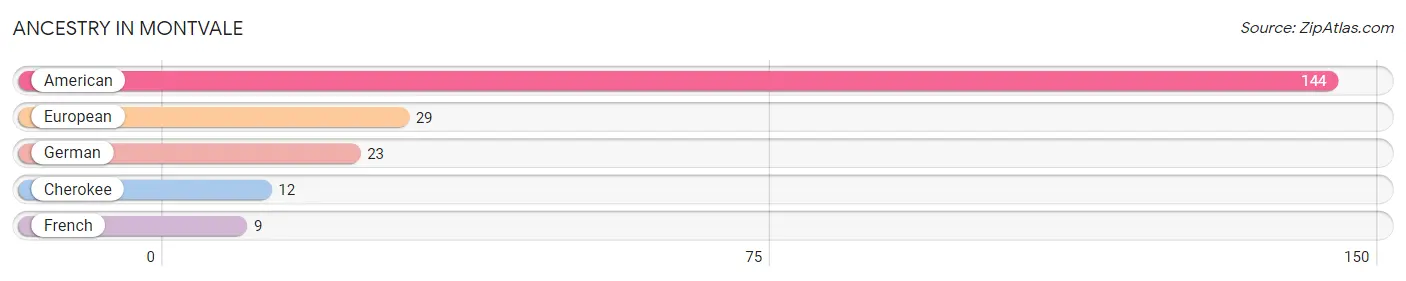
| Ancestry | # Population | % Population |
| American | 144 | 34.0% |
| Cherokee | 12 | 2.8% |
| European | 29 | 6.8% |
| French | 9 | 2.1% |
| German | 23 | 5.4% | View All 5 Rows |
Immigrants in Montvale

| Immigration Origin | # Population | % Population | View All 0 Rows |
Sex and Age in Montvale
Sex and Age in Montvale
The most populous age groups in Montvale are 20 to 24 Years (46 | 22.6%) for men and 5 to 9 Years (39 | 17.7%) for women.
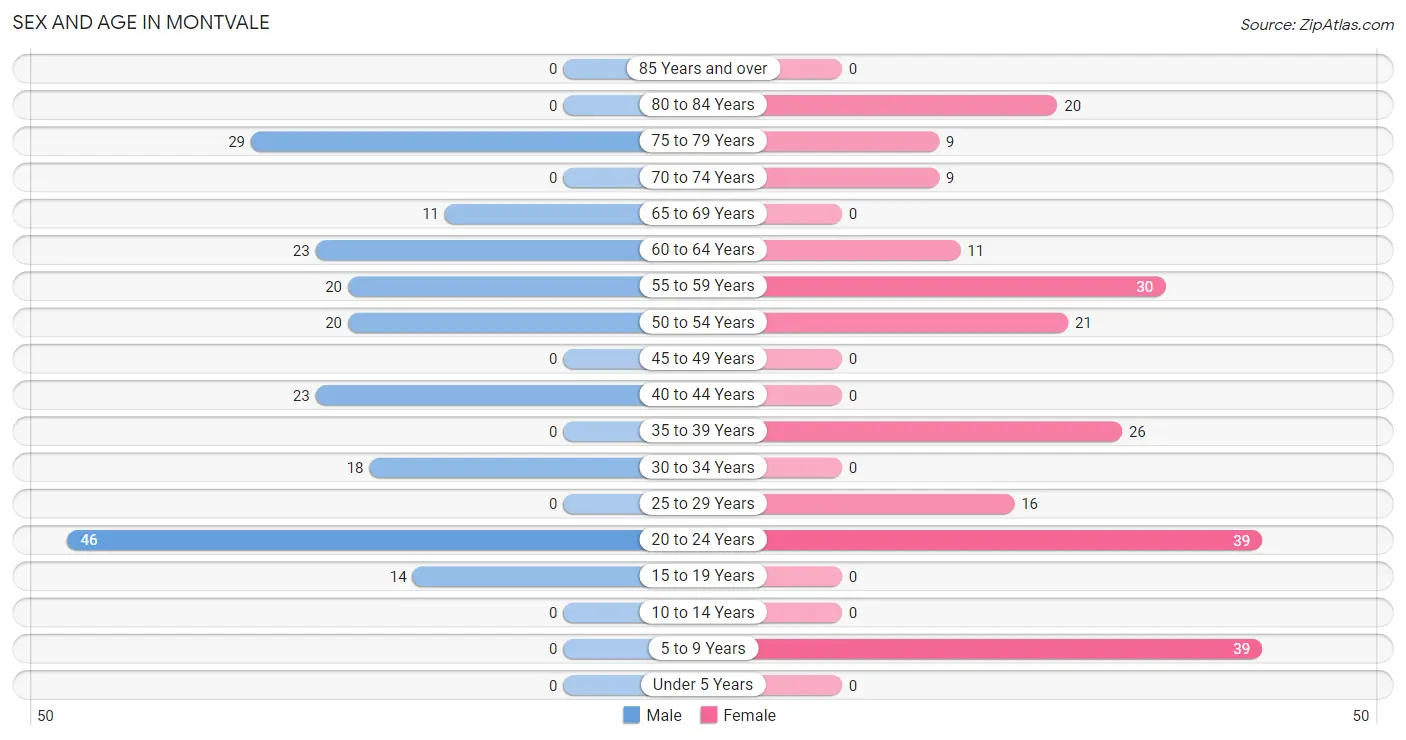
| Age Bracket | Male | Female |
| Under 5 Years | 0 (0.0%) | 0 (0.0%) |
| 5 to 9 Years | 0 (0.0%) | 39 (17.7%) |
| 10 to 14 Years | 0 (0.0%) | 0 (0.0%) |
| 15 to 19 Years | 14 (6.9%) | 0 (0.0%) |
| 20 to 24 Years | 46 (22.6%) | 39 (17.7%) |
| 25 to 29 Years | 0 (0.0%) | 16 (7.3%) |
| 30 to 34 Years | 18 (8.8%) | 0 (0.0%) |
| 35 to 39 Years | 0 (0.0%) | 26 (11.8%) |
| 40 to 44 Years | 23 (11.3%) | 0 (0.0%) |
| 45 to 49 Years | 0 (0.0%) | 0 (0.0%) |
| 50 to 54 Years | 20 (9.8%) | 21 (9.6%) |
| 55 to 59 Years | 20 (9.8%) | 30 (13.6%) |
| 60 to 64 Years | 23 (11.3%) | 11 (5.0%) |
| 65 to 69 Years | 11 (5.4%) | 0 (0.0%) |
| 70 to 74 Years | 0 (0.0%) | 9 (4.1%) |
| 75 to 79 Years | 29 (14.2%) | 9 (4.1%) |
| 80 to 84 Years | 0 (0.0%) | 20 (9.1%) |
| 85 Years and over | 0 (0.0%) | 0 (0.0%) |
| Total | 204 (100.0%) | 220 (100.0%) |
Families and Households in Montvale
Median Family Size in Montvale
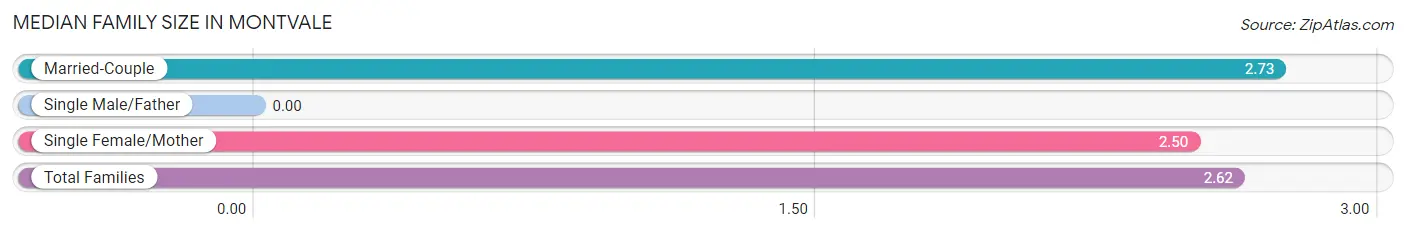
| Family Type | # Families | Family Size |
| Married-Couple | 49 (51.6%) | 2.73 |
| Single Male/Father | 0 (0.0%) | - |
| Single Female/Mother | 46 (48.4%) | 2.50 |
| Total Families | 95 (100.0%) | 2.62 |
Median Household Size in Montvale
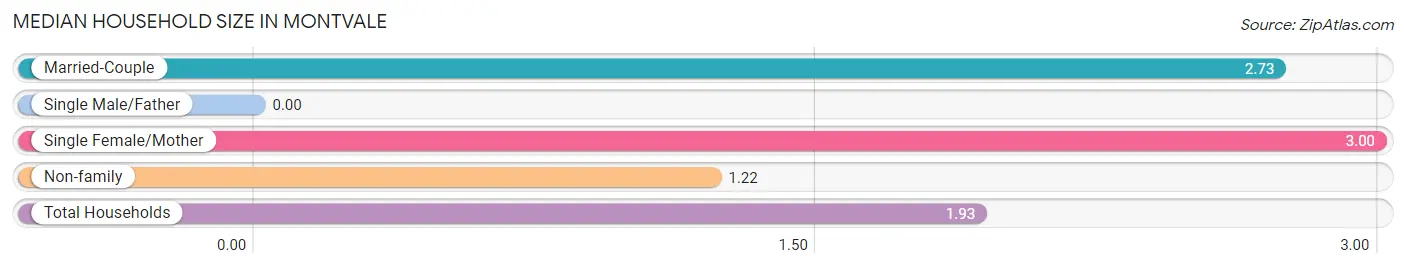
| Household Type | # Households | Household Size |
| Married-Couple | 49 (22.3%) | 2.73 |
| Single Male/Father | 0 (0.0%) | - |
| Single Female/Mother | 46 (20.9%) | 3.00 |
| Non-family | 125 (56.8%) | 1.22 |
| Total Households | 220 (100.0%) | 1.93 |
Household Size by Marriage Status in Montvale
Out of a total of 220 households in Montvale, 95 (43.2%) are family households, while 125 (56.8%) are nonfamily households. The most numerous type of family households are 3-person households, comprising 53, and the most common type of nonfamily households are 1-person households, comprising 113.
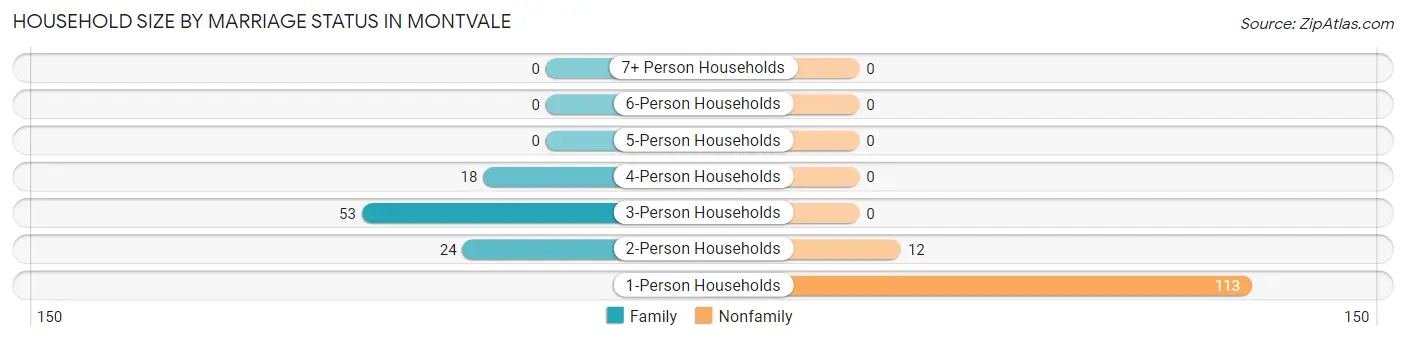
| Household Size | Family Households | Nonfamily Households |
| 1-Person Households | - | 113 (51.4%) |
| 2-Person Households | 24 (10.9%) | 12 (5.4%) |
| 3-Person Households | 53 (24.1%) | 0 (0.0%) |
| 4-Person Households | 18 (8.2%) | 0 (0.0%) |
| 5-Person Households | 0 (0.0%) | 0 (0.0%) |
| 6-Person Households | 0 (0.0%) | 0 (0.0%) |
| 7+ Person Households | 0 (0.0%) | 0 (0.0%) |
| Total | 95 (43.2%) | 125 (56.8%) |
Female Fertility in Montvale
Fertility by Age in Montvale
| Age Bracket | Women with Births | Births / 1,000 Women |
| 15 to 19 years | 0 (0.0%) | 0.0 |
| 20 to 34 years | 0 (0.0%) | 0.0 |
| 35 to 50 years | 0 (0.0%) | 0.0 |
| Total | 0 (0.0%) | 0.0 |
Fertility by Age by Marriage Status in Montvale
| Age Bracket | Married | Unmarried |
| 15 to 19 years | 0 (0.0%) | 0 (0.0%) |
| 20 to 34 years | 0 (0.0%) | 0 (0.0%) |
| 35 to 50 years | 0 (0.0%) | 0 (0.0%) |
| Total | 0 (0.0%) | 0 (0.0%) |
Fertility by Education in Montvale
| Educational Attainment | Women with Births | Births / 1,000 Women |
| Less than High School | 0 (0.0%) | 0.0 |
| High School Diploma | 0 (0.0%) | 0.0 |
| College or Associate's Degree | 0 (0.0%) | 0.0 |
| Bachelor's Degree | 0 (0.0%) | 0.0 |
| Graduate Degree | 0 (0.0%) | 0.0 |
| Total | 0 (0.0%) | 0.0 |
Fertility by Education by Marriage Status in Montvale
| Educational Attainment | Married | Unmarried |
| Less than High School | 0 (0.0%) | 0 (0.0%) |
| High School Diploma | 0 (0.0%) | 0 (0.0%) |
| College or Associate's Degree | 0 (0.0%) | 0 (0.0%) |
| Bachelor's Degree | 0 (0.0%) | 0 (0.0%) |
| Graduate Degree | 0 (0.0%) | 0 (0.0%) |
| Total | 0 (0.0%) | 0 (0.0%) |
Employment Characteristics in Montvale
Employment by Class of Employer in Montvale
Among the 203 employed individuals in Montvale, private company employees (177 | 87.2%), and local government employees (26 | 12.8%) make up the most common classes of employment.
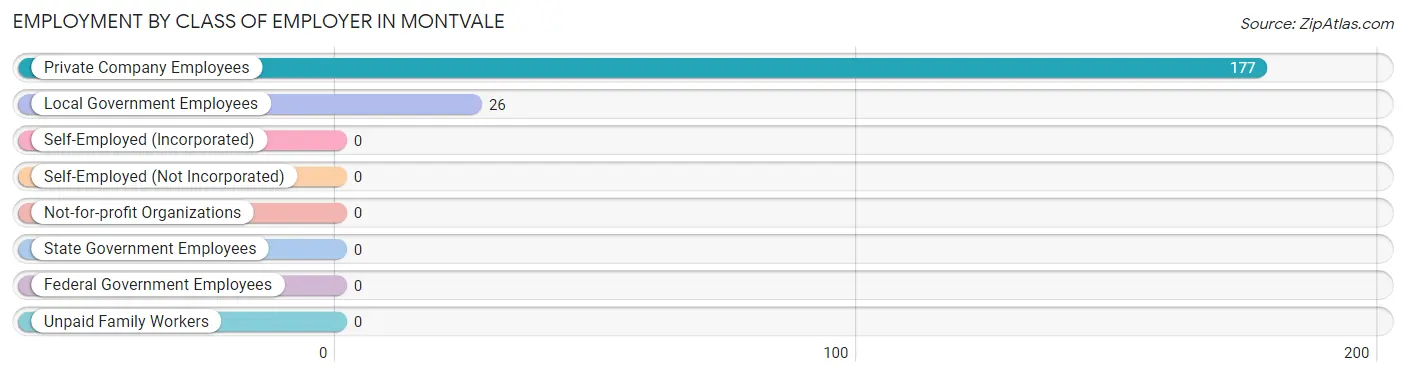
| Employer Class | # Employees | % Employees |
| Private Company Employees | 177 | 87.2% |
| Self-Employed (Incorporated) | 0 | 0.0% |
| Self-Employed (Not Incorporated) | 0 | 0.0% |
| Not-for-profit Organizations | 0 | 0.0% |
| Local Government Employees | 26 | 12.8% |
| State Government Employees | 0 | 0.0% |
| Federal Government Employees | 0 | 0.0% |
| Unpaid Family Workers | 0 | 0.0% |
| Total | 203 | 100.0% |
Employment Status by Age in Montvale
According to the labor force statistics for Montvale, out of the total population over 16 years of age (385), 58.7% or 226 individuals are in the labor force, with 10.2% or 23 of them unemployed. The age group with the highest labor force participation rate is 16 to 19 years, with 100.0% or 14 individuals in the labor force. Within the labor force, the 35 to 44 years age range has the highest percentage of unemployed individuals, with 46.9% or 23 of them being unemployed.
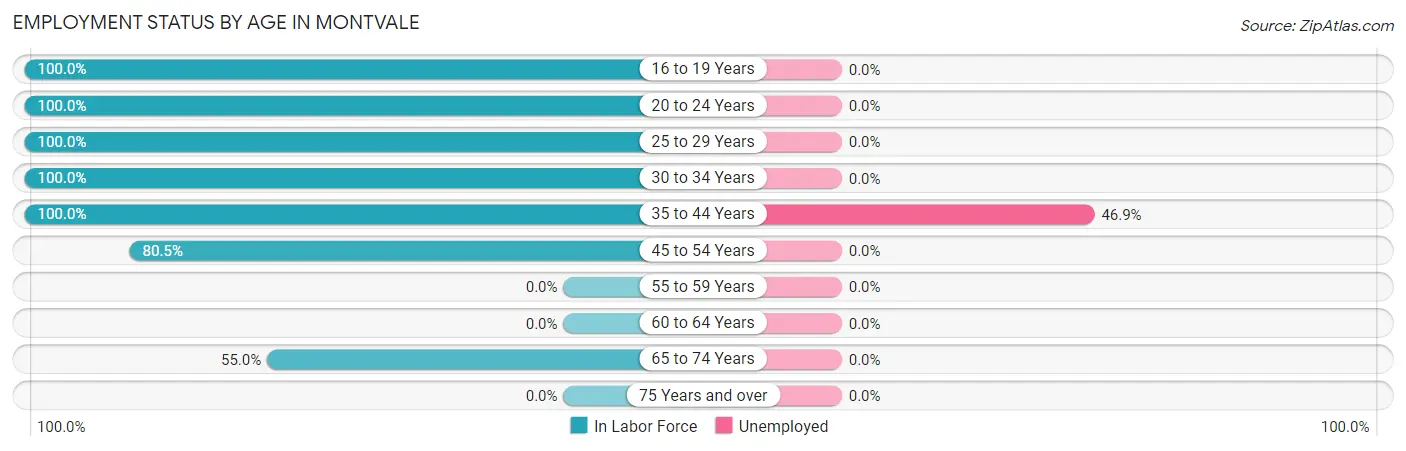
| Age Bracket | In Labor Force | Unemployed |
| 16 to 19 Years | 14 (100.0%) | 0 (0.0%) |
| 20 to 24 Years | 85 (100.0%) | 0 (0.0%) |
| 25 to 29 Years | 16 (100.0%) | 0 (0.0%) |
| 30 to 34 Years | 18 (100.0%) | 0 (0.0%) |
| 35 to 44 Years | 49 (100.0%) | 23 (46.9%) |
| 45 to 54 Years | 33 (80.5%) | 0 (0.0%) |
| 55 to 59 Years | 0 (0.0%) | 0 (0.0%) |
| 60 to 64 Years | 0 (0.0%) | 0 (0.0%) |
| 65 to 74 Years | 11 (55.0%) | 0 (0.0%) |
| 75 Years and over | 0 (0.0%) | 0 (0.0%) |
| Total | 226 (58.7%) | 23 (10.2%) |
Employment Status by Educational Attainment in Montvale
According to labor force statistics for Montvale, 55.8% of individuals (116) out of the total population between 25 and 64 years of age (208) are in the labor force, with 19.8% or 23 of them being unemployed. The group with the highest labor force participation rate are those with the educational attainment of college / associate degree, with 100.0% or 47 individuals in the labor force. Within the labor force, individuals with less than high school education have the highest percentage of unemployment, with 63.9% or 23 of them being unemployed.
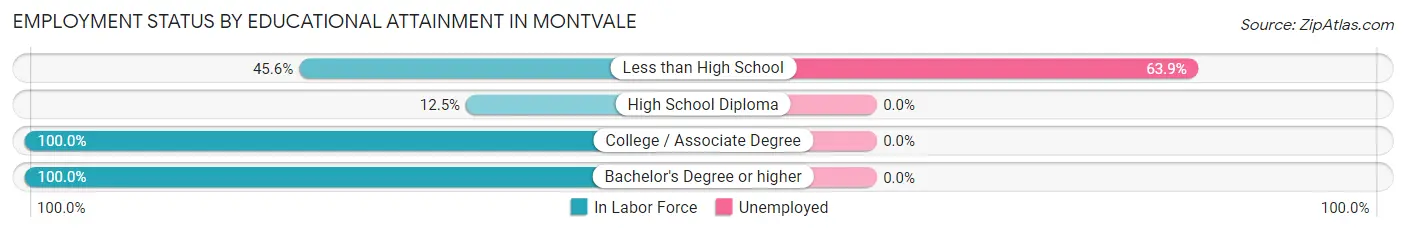
| Educational Attainment | In Labor Force | Unemployed |
| Less than High School | 36 (45.6%) | 50 (63.9%) |
| High School Diploma | 7 (12.5%) | 0 (0.0%) |
| College / Associate Degree | 47 (100.0%) | 0 (0.0%) |
| Bachelor's Degree or higher | 26 (100.0%) | 0 (0.0%) |
| Total | 116 (55.8%) | 41 (19.8%) |
Employment Occupations by Sex in Montvale
Management, Business, Science and Arts Occupations
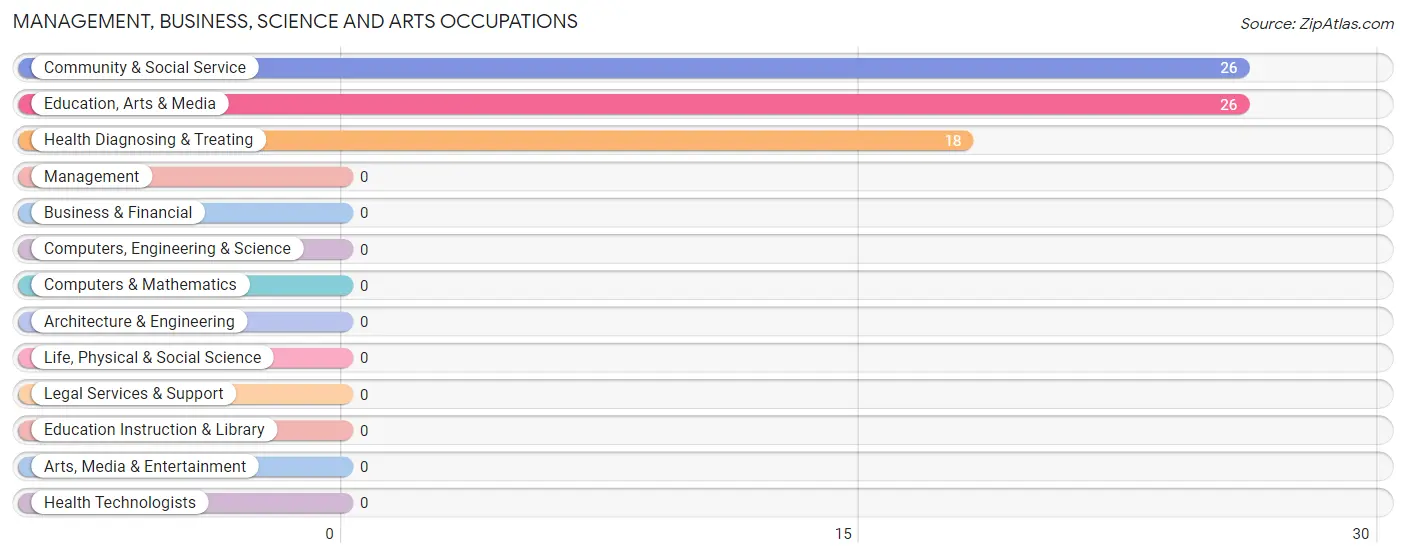
The most common Management, Business, Science and Arts occupations in Montvale are Community & Social Service (26 | 12.8%), Education, Arts & Media (26 | 12.8%), and Health Diagnosing & Treating (18 | 8.9%).
Management, Business, Science and Arts Occupations by Sex
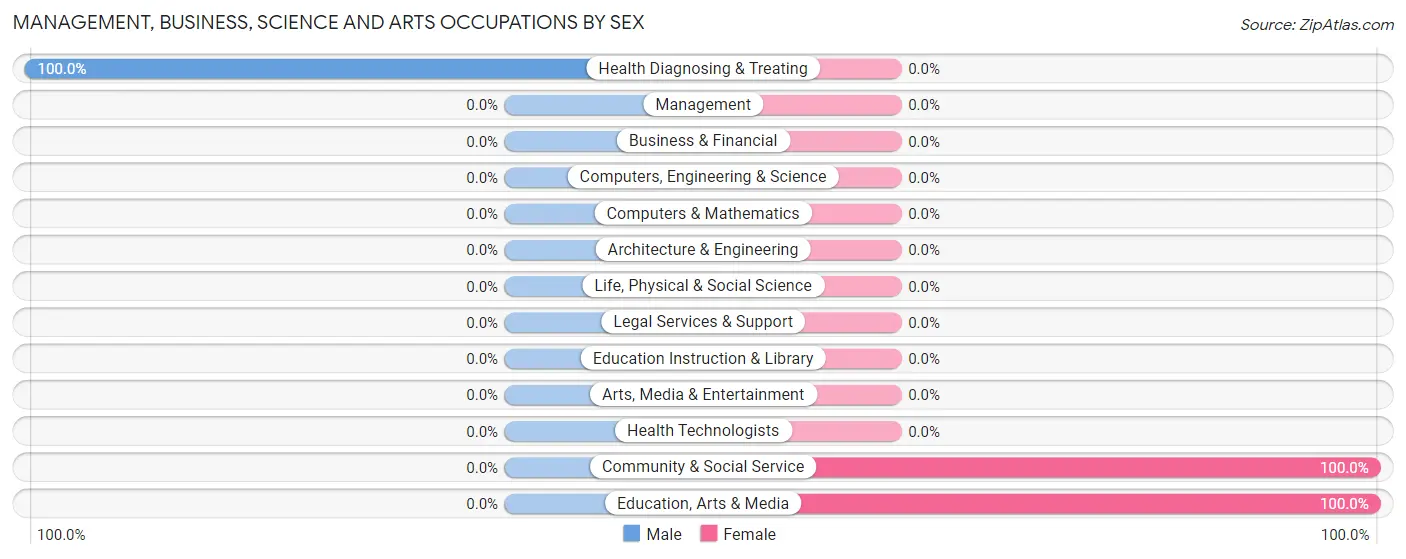
| Occupation | Male | Female |
| Management | 0 (0.0%) | 0 (0.0%) |
| Business & Financial | 0 (0.0%) | 0 (0.0%) |
| Computers, Engineering & Science | 0 (0.0%) | 0 (0.0%) |
| Computers & Mathematics | 0 (0.0%) | 0 (0.0%) |
| Architecture & Engineering | 0 (0.0%) | 0 (0.0%) |
| Life, Physical & Social Science | 0 (0.0%) | 0 (0.0%) |
| Community & Social Service | 0 (0.0%) | 26 (100.0%) |
| Education, Arts & Media | 0 (0.0%) | 26 (100.0%) |
| Legal Services & Support | 0 (0.0%) | 0 (0.0%) |
| Education Instruction & Library | 0 (0.0%) | 0 (0.0%) |
| Arts, Media & Entertainment | 0 (0.0%) | 0 (0.0%) |
| Health Diagnosing & Treating | 18 (100.0%) | 0 (0.0%) |
| Health Technologists | 0 (0.0%) | 0 (0.0%) |
| Total (Category) | 18 (40.9%) | 26 (59.1%) |
| Total (Overall) | 109 (53.7%) | 94 (46.3%) |
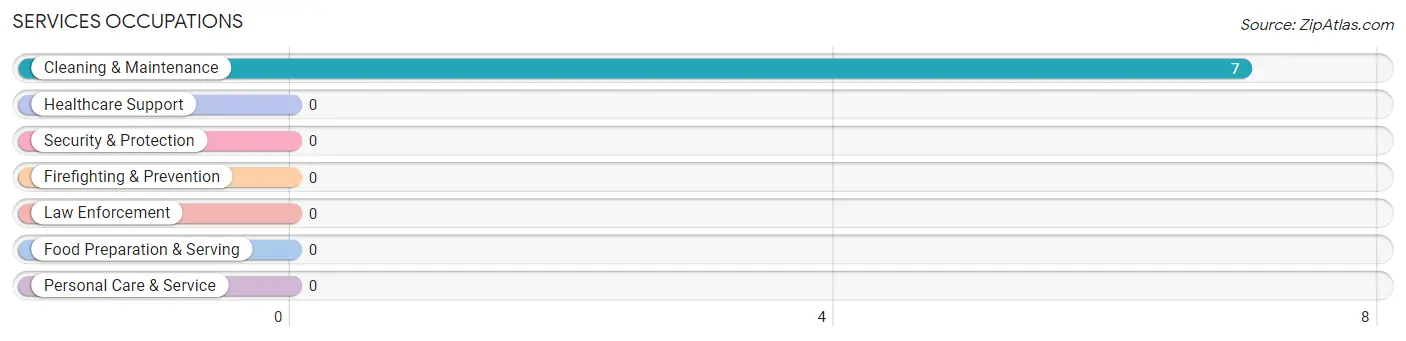
Services Occupations
The most common Services occupations in Montvale are , and Cleaning & Maintenance (7 | 3.5%).
Services Occupations by Sex
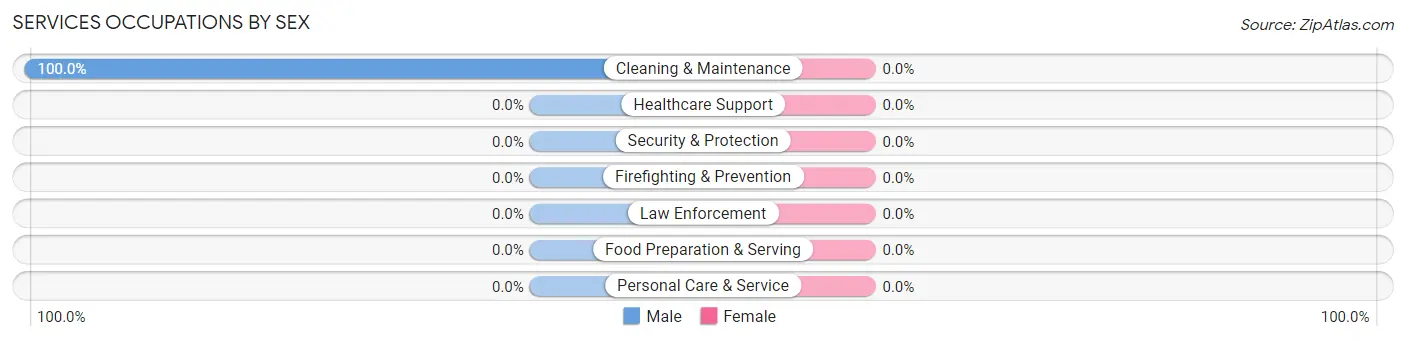
| Occupation | Male | Female |
| Healthcare Support | 0 (0.0%) | 0 (0.0%) |
| Security & Protection | 0 (0.0%) | 0 (0.0%) |
| Firefighting & Prevention | 0 (0.0%) | 0 (0.0%) |
| Law Enforcement | 0 (0.0%) | 0 (0.0%) |
| Food Preparation & Serving | 0 (0.0%) | 0 (0.0%) |
| Cleaning & Maintenance | 7 (100.0%) | 0 (0.0%) |
| Personal Care & Service | 0 (0.0%) | 0 (0.0%) |
| Total (Category) | 7 (100.0%) | 0 (0.0%) |
| Total (Overall) | 109 (53.7%) | 94 (46.3%) |
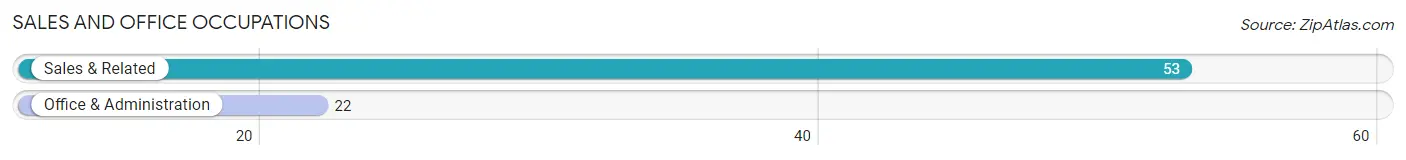
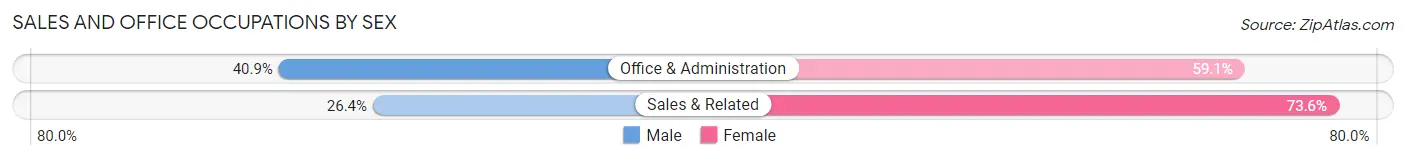
Sales and Office Occupations
The most common Sales and Office occupations in Montvale are Sales & Related (53 | 26.1%), and Office & Administration (22 | 10.8%).
Sales and Office Occupations by Sex
| Occupation | Male | Female |
| Sales & Related | 14 (26.4%) | 39 (73.6%) |
| Office & Administration | 9 (40.9%) | 13 (59.1%) |
| Total (Category) | 23 (30.7%) | 52 (69.3%) |
| Total (Overall) | 109 (53.7%) | 94 (46.3%) |
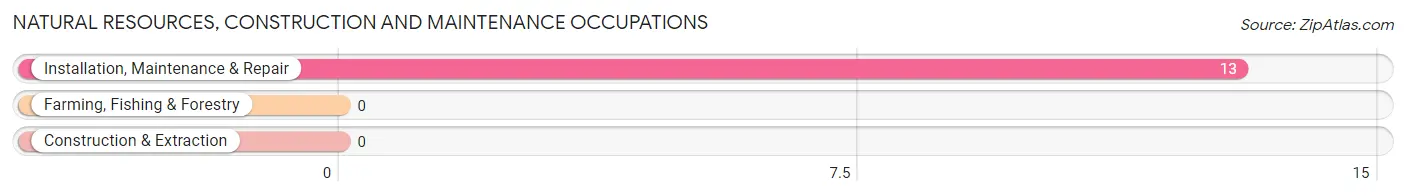
Natural Resources, Construction and Maintenance Occupations
The most common Natural Resources, Construction and Maintenance occupations in Montvale are , and Installation, Maintenance & Repair (13 | 6.4%).
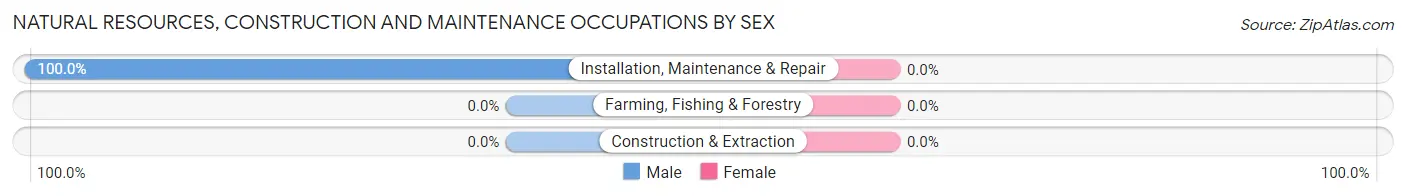
Natural Resources, Construction and Maintenance Occupations by Sex
| Occupation | Male | Female |
| Farming, Fishing & Forestry | 0 (0.0%) | 0 (0.0%) |
| Construction & Extraction | 0 (0.0%) | 0 (0.0%) |
| Installation, Maintenance & Repair | 13 (100.0%) | 0 (0.0%) |
| Total (Category) | 13 (100.0%) | 0 (0.0%) |
| Total (Overall) | 109 (53.7%) | 94 (46.3%) |
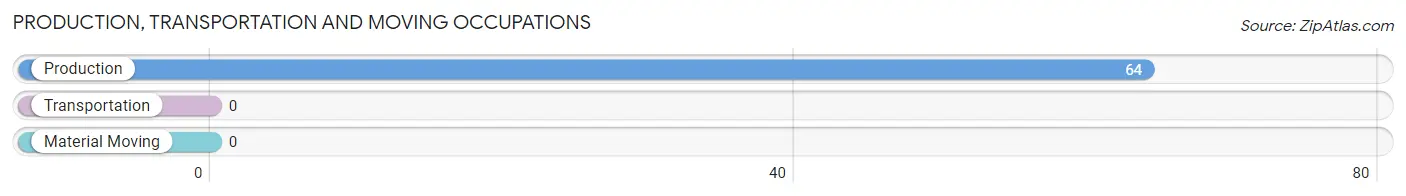
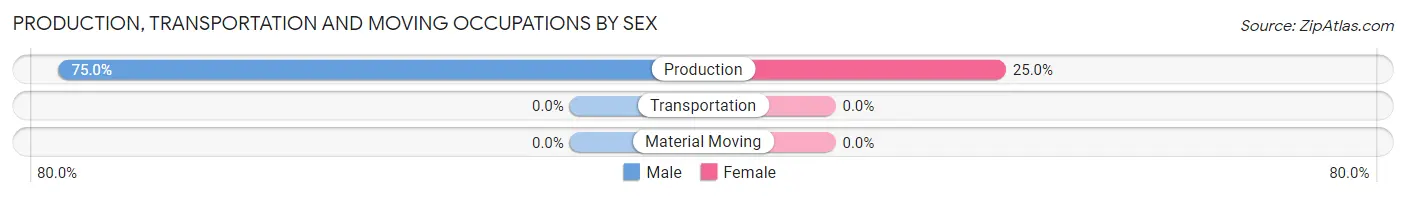
Production, Transportation and Moving Occupations
The most common Production, Transportation and Moving occupations in Montvale are , and Production (64 | 31.5%).
Production, Transportation and Moving Occupations by Sex
| Occupation | Male | Female |
| Production | 48 (75.0%) | 16 (25.0%) |
| Transportation | 0 (0.0%) | 0 (0.0%) |
| Material Moving | 0 (0.0%) | 0 (0.0%) |
| Total (Category) | 48 (75.0%) | 16 (25.0%) |
| Total (Overall) | 109 (53.7%) | 94 (46.3%) |
Employment Industries by Sex in Montvale
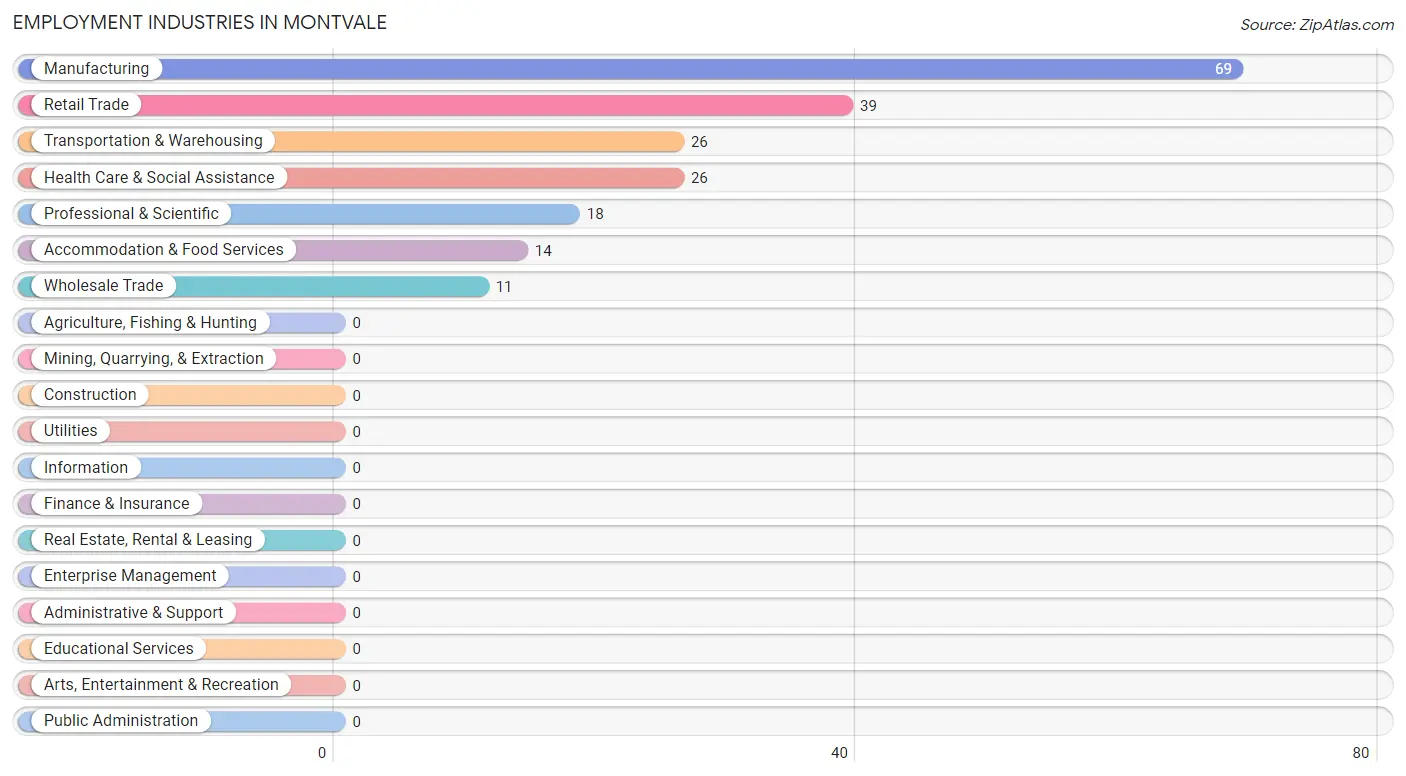
Employment Industries in Montvale
The major employment industries in Montvale include Manufacturing (69 | 34.0%), Retail Trade (39 | 19.2%), Transportation & Warehousing (26 | 12.8%), Health Care & Social Assistance (26 | 12.8%), and Professional & Scientific (18 | 8.9%).
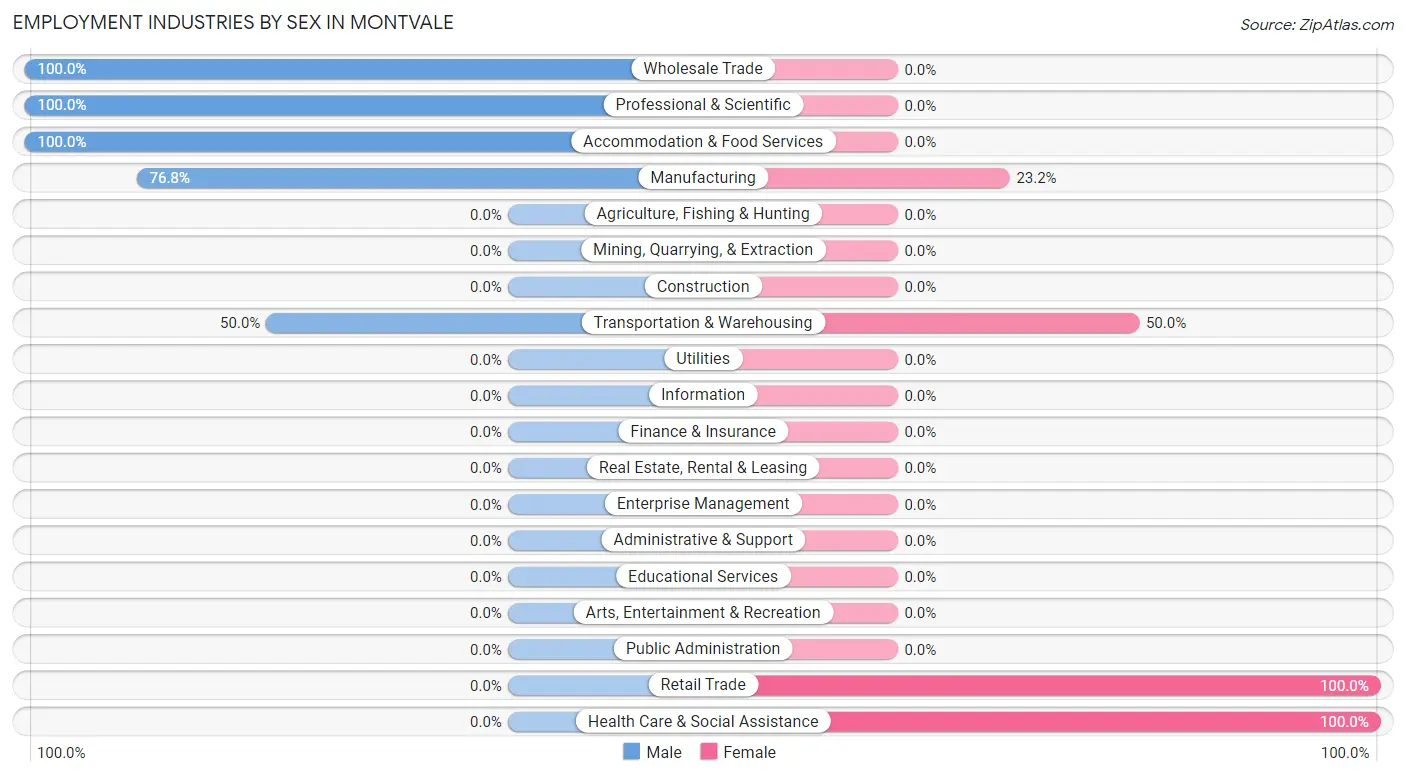
Employment Industries by Sex in Montvale
The Montvale industries that see more men than women are Wholesale Trade (100.0%), Professional & Scientific (100.0%), and Accommodation & Food Services (100.0%), whereas the industries that tend to have a higher number of women are Retail Trade (100.0%), Health Care & Social Assistance (100.0%), and Transportation & Warehousing (50.0%).
| Industry | Male | Female |
| Agriculture, Fishing & Hunting | 0 (0.0%) | 0 (0.0%) |
| Mining, Quarrying, & Extraction | 0 (0.0%) | 0 (0.0%) |
| Construction | 0 (0.0%) | 0 (0.0%) |
| Manufacturing | 53 (76.8%) | 16 (23.2%) |
| Wholesale Trade | 11 (100.0%) | 0 (0.0%) |
| Retail Trade | 0 (0.0%) | 39 (100.0%) |
| Transportation & Warehousing | 13 (50.0%) | 13 (50.0%) |
| Utilities | 0 (0.0%) | 0 (0.0%) |
| Information | 0 (0.0%) | 0 (0.0%) |
| Finance & Insurance | 0 (0.0%) | 0 (0.0%) |
| Real Estate, Rental & Leasing | 0 (0.0%) | 0 (0.0%) |
| Professional & Scientific | 18 (100.0%) | 0 (0.0%) |
| Enterprise Management | 0 (0.0%) | 0 (0.0%) |
| Administrative & Support | 0 (0.0%) | 0 (0.0%) |
| Educational Services | 0 (0.0%) | 0 (0.0%) |
| Health Care & Social Assistance | 0 (0.0%) | 26 (100.0%) |
| Arts, Entertainment & Recreation | 0 (0.0%) | 0 (0.0%) |
| Accommodation & Food Services | 14 (100.0%) | 0 (0.0%) |
| Public Administration | 0 (0.0%) | 0 (0.0%) |
| Total | 109 (53.7%) | 94 (46.3%) |
Education in Montvale
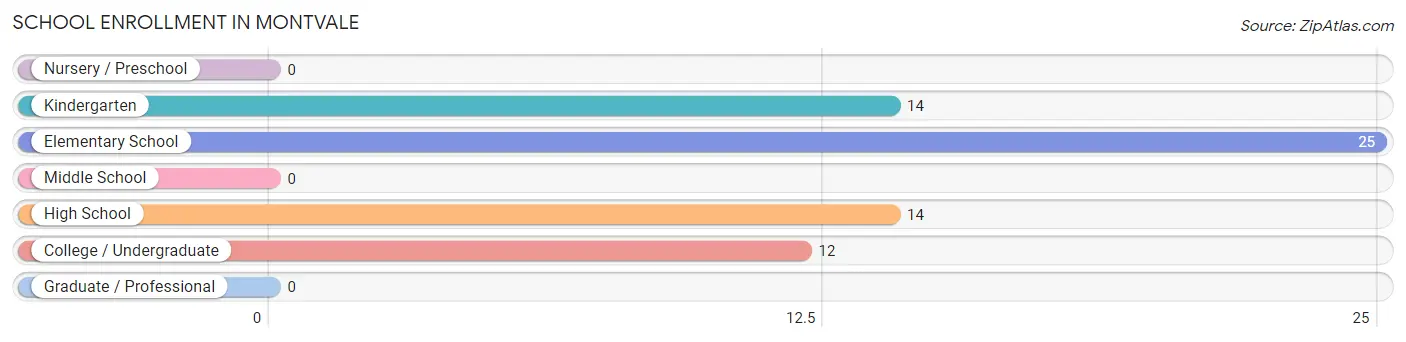
School Enrollment in Montvale
The most common levels of schooling among the 65 students in Montvale are elementary school (25 | 38.5%), kindergarten (14 | 21.5%), and high school (14 | 21.5%).
| School Level | # Students | % Students |
| Nursery / Preschool | 0 | 0.0% |
| Kindergarten | 14 | 21.5% |
| Elementary School | 25 | 38.5% |
| Middle School | 0 | 0.0% |
| High School | 14 | 21.5% |
| College / Undergraduate | 12 | 18.5% |
| Graduate / Professional | 0 | 0.0% |
| Total | 65 | 100.0% |
School Enrollment by Age by Funding Source in Montvale
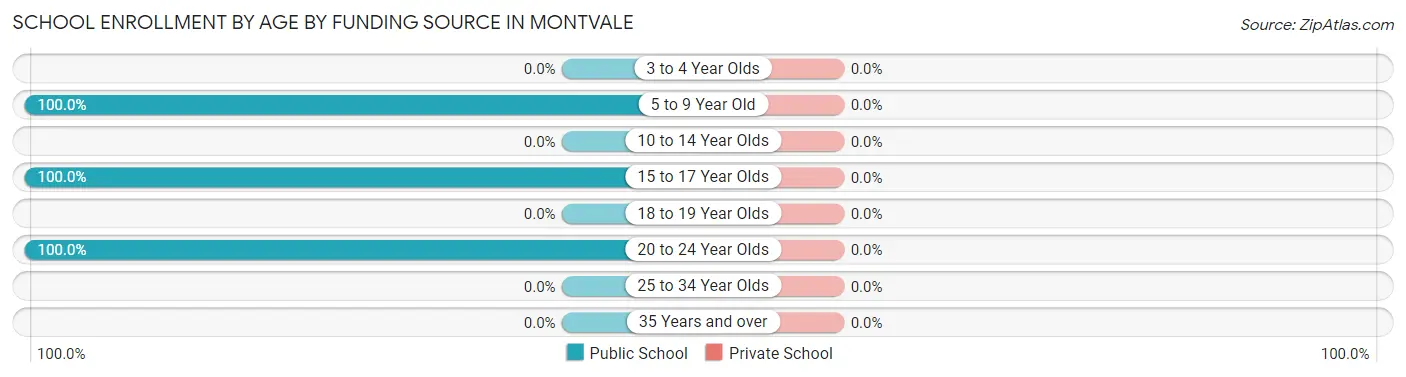
| Age Bracket | Public School | Private School |
| 3 to 4 Year Olds | 0 (0.0%) | 0 (0.0%) |
| 5 to 9 Year Old | 39 (100.0%) | 0 (0.0%) |
| 10 to 14 Year Olds | 0 (0.0%) | 0 (0.0%) |
| 15 to 17 Year Olds | 14 (100.0%) | 0 (0.0%) |
| 18 to 19 Year Olds | 0 (0.0%) | 0 (0.0%) |
| 20 to 24 Year Olds | 12 (100.0%) | 0 (0.0%) |
| 25 to 34 Year Olds | 0 (0.0%) | 0 (0.0%) |
| 35 Years and over | 0 (0.0%) | 0 (0.0%) |
| Total | 65 (100.0%) | 0 (0.0%) |
Educational Attainment by Field of Study in Montvale
, and psychology (26 | 100.0%) are the most common fields of study among 26 individuals in Montvale who have obtained a bachelor's degree or higher.
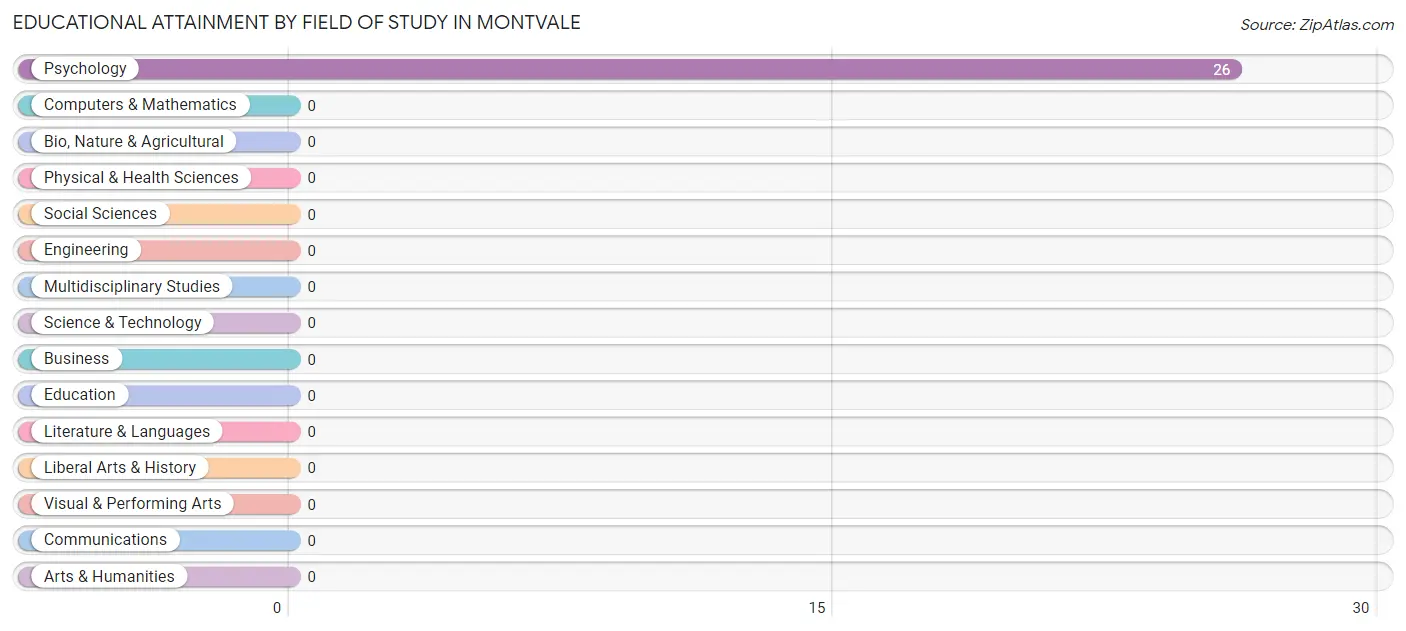
| Field of Study | # Graduates | % Graduates |
| Computers & Mathematics | 0 | 0.0% |
| Bio, Nature & Agricultural | 0 | 0.0% |
| Physical & Health Sciences | 0 | 0.0% |
| Psychology | 26 | 100.0% |
| Social Sciences | 0 | 0.0% |
| Engineering | 0 | 0.0% |
| Multidisciplinary Studies | 0 | 0.0% |
| Science & Technology | 0 | 0.0% |
| Business | 0 | 0.0% |
| Education | 0 | 0.0% |
| Literature & Languages | 0 | 0.0% |
| Liberal Arts & History | 0 | 0.0% |
| Visual & Performing Arts | 0 | 0.0% |
| Communications | 0 | 0.0% |
| Arts & Humanities | 0 | 0.0% |
| Total | 26 | 100.0% |
Transportation & Commute in Montvale
Vehicle Availability by Sex in Montvale
The most prevalent vehicle ownership categories in Montvale are males with 5 or more vehicles (48, accounting for 44.0%) and females with 5 or more vehicles (16, making up 51.1%).
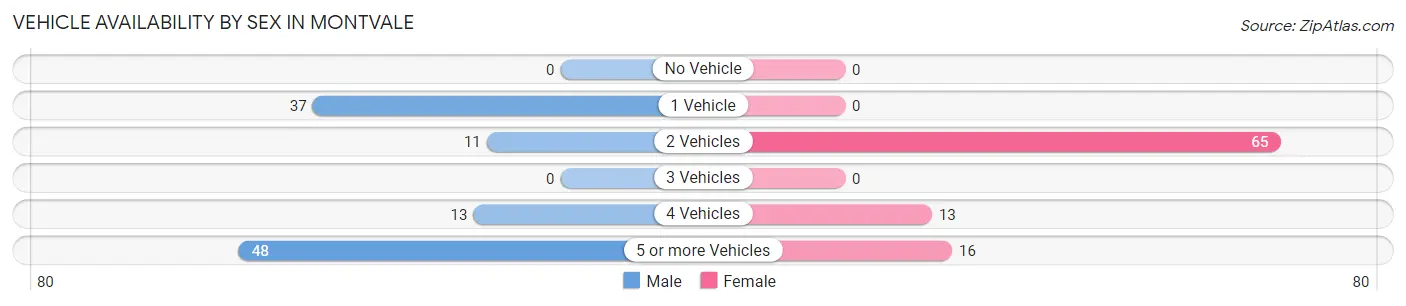
| Vehicles Available | Male | Female |
| No Vehicle | 0 (0.0%) | 0 (0.0%) |
| 1 Vehicle | 37 (33.9%) | 0 (0.0%) |
| 2 Vehicles | 11 (10.1%) | 65 (69.2%) |
| 3 Vehicles | 0 (0.0%) | 0 (0.0%) |
| 4 Vehicles | 13 (11.9%) | 13 (13.8%) |
| 5 or more Vehicles | 48 (44.0%) | 16 (17.0%) |
| Total | 109 (100.0%) | 94 (100.0%) |
Commute Time in Montvale
The most frequently occuring commute durations in Montvale are 20 to 24 minutes (45 commuters, 22.2%), 5 to 9 minutes (39 commuters, 19.2%), and 45 to 59 minutes (37 commuters, 18.2%).
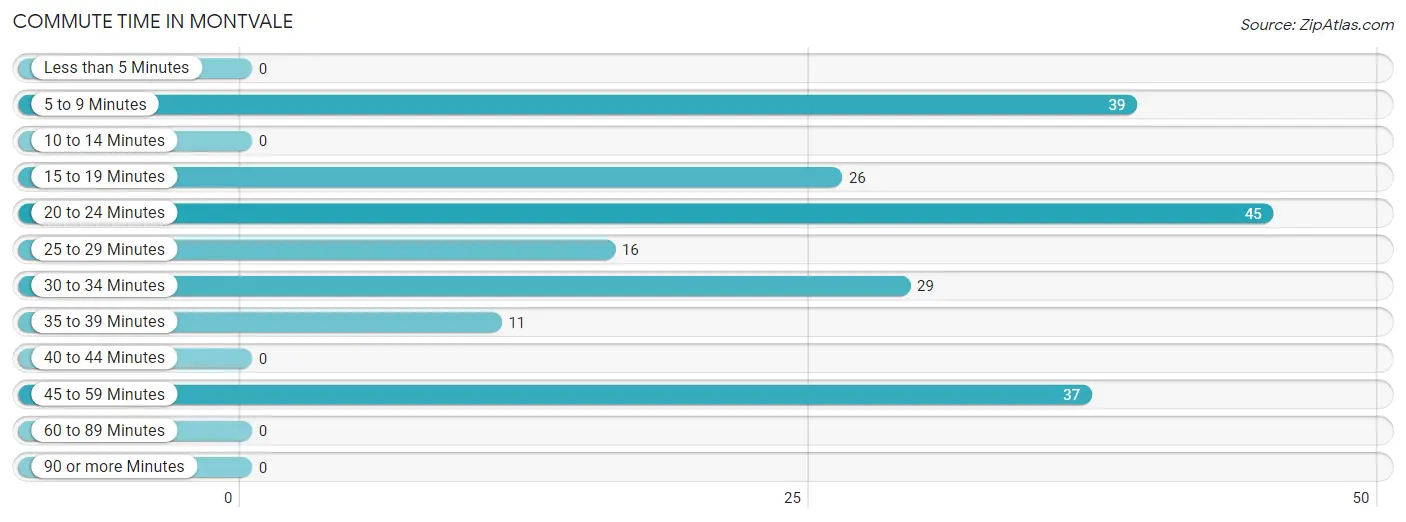
| Commute Time | # Commuters | % Commuters |
| Less than 5 Minutes | 0 | 0.0% |
| 5 to 9 Minutes | 39 | 19.2% |
| 10 to 14 Minutes | 0 | 0.0% |
| 15 to 19 Minutes | 26 | 12.8% |
| 20 to 24 Minutes | 45 | 22.2% |
| 25 to 29 Minutes | 16 | 7.9% |
| 30 to 34 Minutes | 29 | 14.3% |
| 35 to 39 Minutes | 11 | 5.4% |
| 40 to 44 Minutes | 0 | 0.0% |
| 45 to 59 Minutes | 37 | 18.2% |
| 60 to 89 Minutes | 0 | 0.0% |
| 90 or more Minutes | 0 | 0.0% |
Commute Time by Sex in Montvale
The most common commute times in Montvale are 45 to 59 minutes (37 commuters, 33.9%) for males and 5 to 9 minutes (39 commuters, 41.5%) for females.
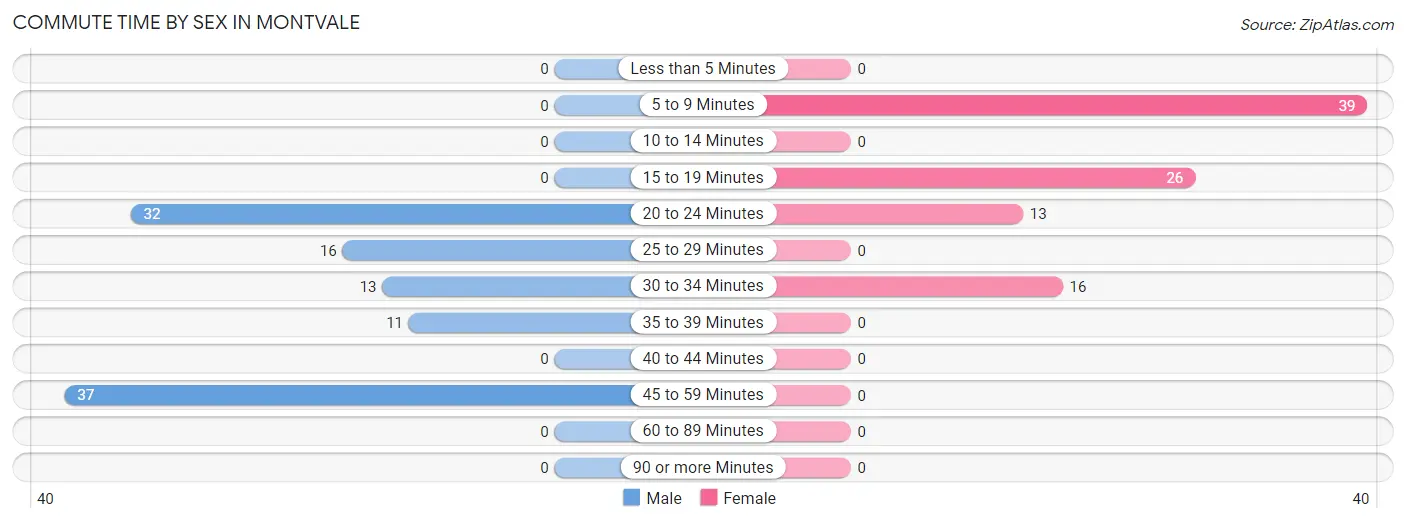
| Commute Time | Male | Female |
| Less than 5 Minutes | 0 (0.0%) | 0 (0.0%) |
| 5 to 9 Minutes | 0 (0.0%) | 39 (41.5%) |
| 10 to 14 Minutes | 0 (0.0%) | 0 (0.0%) |
| 15 to 19 Minutes | 0 (0.0%) | 26 (27.7%) |
| 20 to 24 Minutes | 32 (29.4%) | 13 (13.8%) |
| 25 to 29 Minutes | 16 (14.7%) | 0 (0.0%) |
| 30 to 34 Minutes | 13 (11.9%) | 16 (17.0%) |
| 35 to 39 Minutes | 11 (10.1%) | 0 (0.0%) |
| 40 to 44 Minutes | 0 (0.0%) | 0 (0.0%) |
| 45 to 59 Minutes | 37 (33.9%) | 0 (0.0%) |
| 60 to 89 Minutes | 0 (0.0%) | 0 (0.0%) |
| 90 or more Minutes | 0 (0.0%) | 0 (0.0%) |
Time of Departure to Work by Sex in Montvale
The most frequent times of departure to work in Montvale are 5:30 AM to 5:59 AM (44, 40.4%) for males and 5:30 AM to 5:59 AM (55, 58.5%) for females.
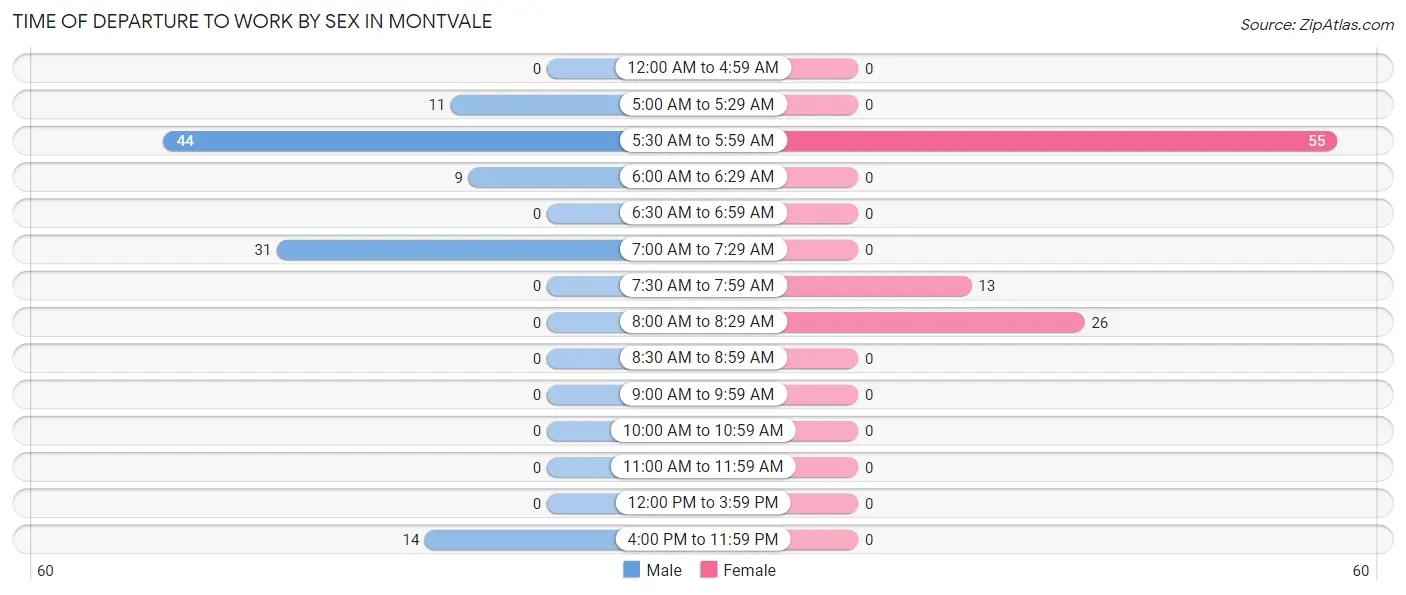
| Time of Departure | Male | Female |
| 12:00 AM to 4:59 AM | 0 (0.0%) | 0 (0.0%) |
| 5:00 AM to 5:29 AM | 11 (10.1%) | 0 (0.0%) |
| 5:30 AM to 5:59 AM | 44 (40.4%) | 55 (58.5%) |
| 6:00 AM to 6:29 AM | 9 (8.3%) | 0 (0.0%) |
| 6:30 AM to 6:59 AM | 0 (0.0%) | 0 (0.0%) |
| 7:00 AM to 7:29 AM | 31 (28.4%) | 0 (0.0%) |
| 7:30 AM to 7:59 AM | 0 (0.0%) | 13 (13.8%) |
| 8:00 AM to 8:29 AM | 0 (0.0%) | 26 (27.7%) |
| 8:30 AM to 8:59 AM | 0 (0.0%) | 0 (0.0%) |
| 9:00 AM to 9:59 AM | 0 (0.0%) | 0 (0.0%) |
| 10:00 AM to 10:59 AM | 0 (0.0%) | 0 (0.0%) |
| 11:00 AM to 11:59 AM | 0 (0.0%) | 0 (0.0%) |
| 12:00 PM to 3:59 PM | 0 (0.0%) | 0 (0.0%) |
| 4:00 PM to 11:59 PM | 14 (12.8%) | 0 (0.0%) |
| Total | 109 (100.0%) | 94 (100.0%) |
Housing Occupancy in Montvale
Occupancy by Ownership in Montvale
Of the total 220 dwellings in Montvale, owner-occupied units account for 162 (73.6%), while renter-occupied units make up 58 (26.4%).
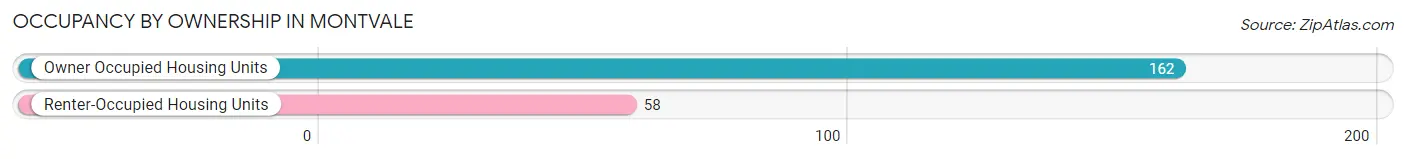
| Occupancy | # Housing Units | % Housing Units |
| Owner Occupied Housing Units | 162 | 73.6% |
| Renter-Occupied Housing Units | 58 | 26.4% |
| Total Occupied Housing Units | 220 | 100.0% |
Occupancy by Household Size in Montvale
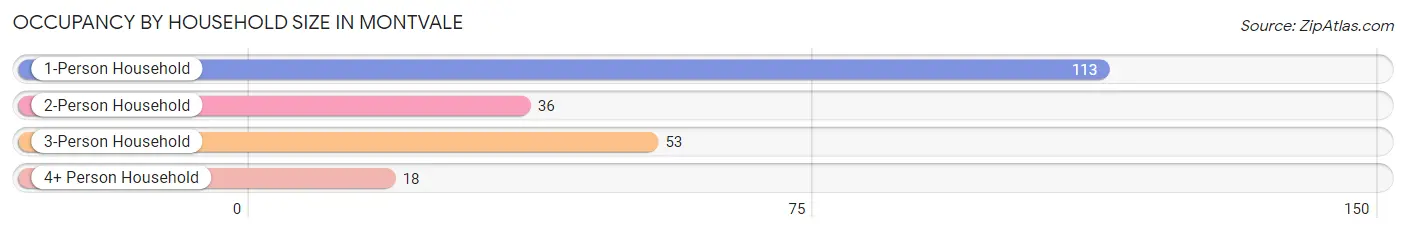
| Household Size | # Housing Units | % Housing Units |
| 1-Person Household | 113 | 51.4% |
| 2-Person Household | 36 | 16.4% |
| 3-Person Household | 53 | 24.1% |
| 4+ Person Household | 18 | 8.2% |
| Total Housing Units | 220 | 100.0% |
Occupancy by Ownership by Household Size in Montvale
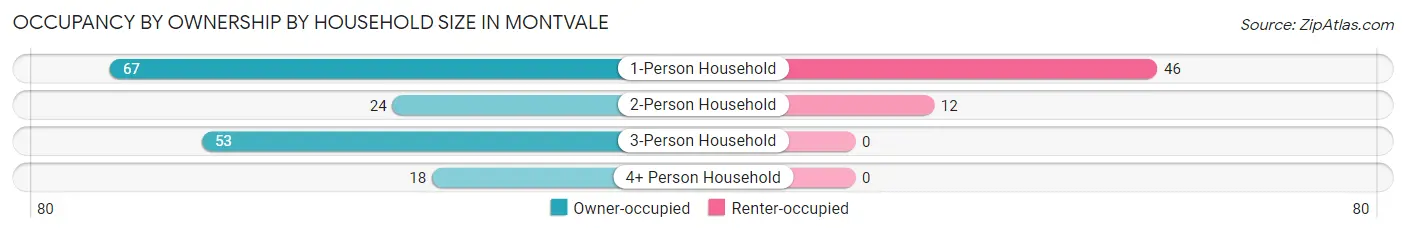
| Household Size | Owner-occupied | Renter-occupied |
| 1-Person Household | 67 (59.3%) | 46 (40.7%) |
| 2-Person Household | 24 (66.7%) | 12 (33.3%) |
| 3-Person Household | 53 (100.0%) | 0 (0.0%) |
| 4+ Person Household | 18 (100.0%) | 0 (0.0%) |
| Total Housing Units | 162 (73.6%) | 58 (26.4%) |
Occupancy by Educational Attainment in Montvale
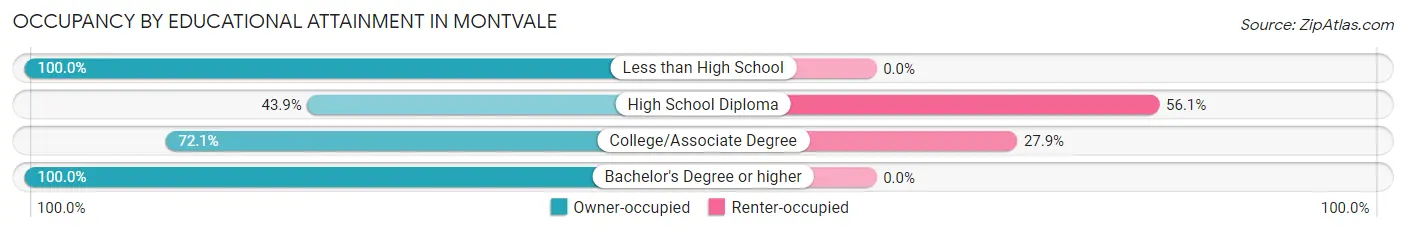
| Household Size | Owner-occupied | Renter-occupied |
| Less than High School | 69 (100.0%) | 0 (0.0%) |
| High School Diploma | 36 (43.9%) | 46 (56.1%) |
| College/Associate Degree | 31 (72.1%) | 12 (27.9%) |
| Bachelor's Degree or higher | 26 (100.0%) | 0 (0.0%) |
Occupancy by Age of Householder in Montvale
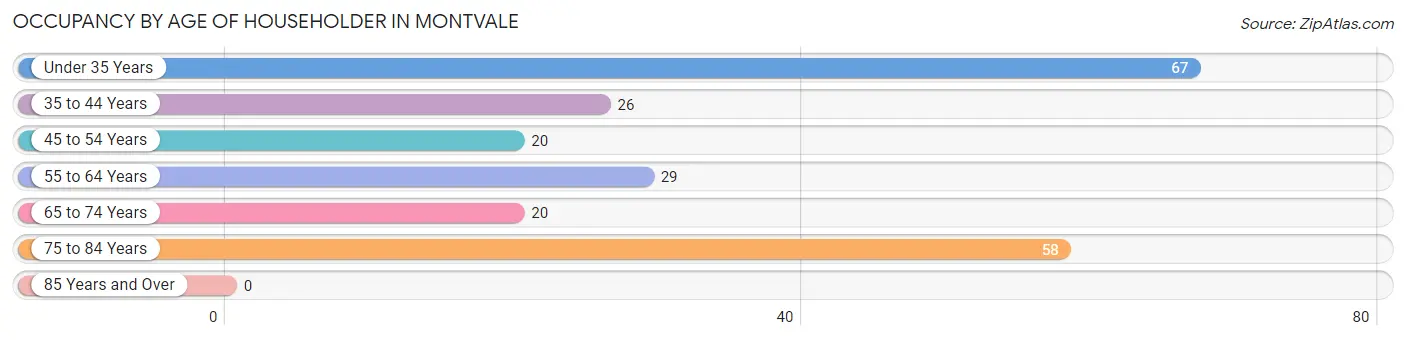
| Age Bracket | # Households | % Households |
| Under 35 Years | 67 | 30.4% |
| 35 to 44 Years | 26 | 11.8% |
| 45 to 54 Years | 20 | 9.1% |
| 55 to 64 Years | 29 | 13.2% |
| 65 to 74 Years | 20 | 9.1% |
| 75 to 84 Years | 58 | 26.4% |
| 85 Years and Over | 0 | 0.0% |
| Total | 220 | 100.0% |
Housing Finances in Montvale
Median Income by Occupancy in Montvale
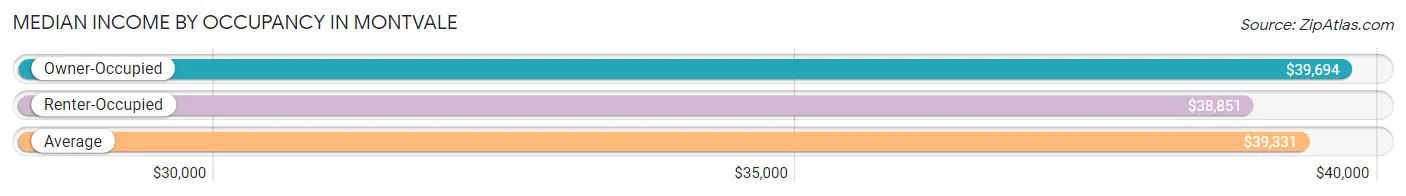
| Occupancy Type | # Households | Median Income |
| Owner-Occupied | 162 (73.6%) | $39,694 |
| Renter-Occupied | 58 (26.4%) | $38,851 |
| Average | 220 (100.0%) | $39,331 |
Occupancy by Householder Income Bracket in Montvale
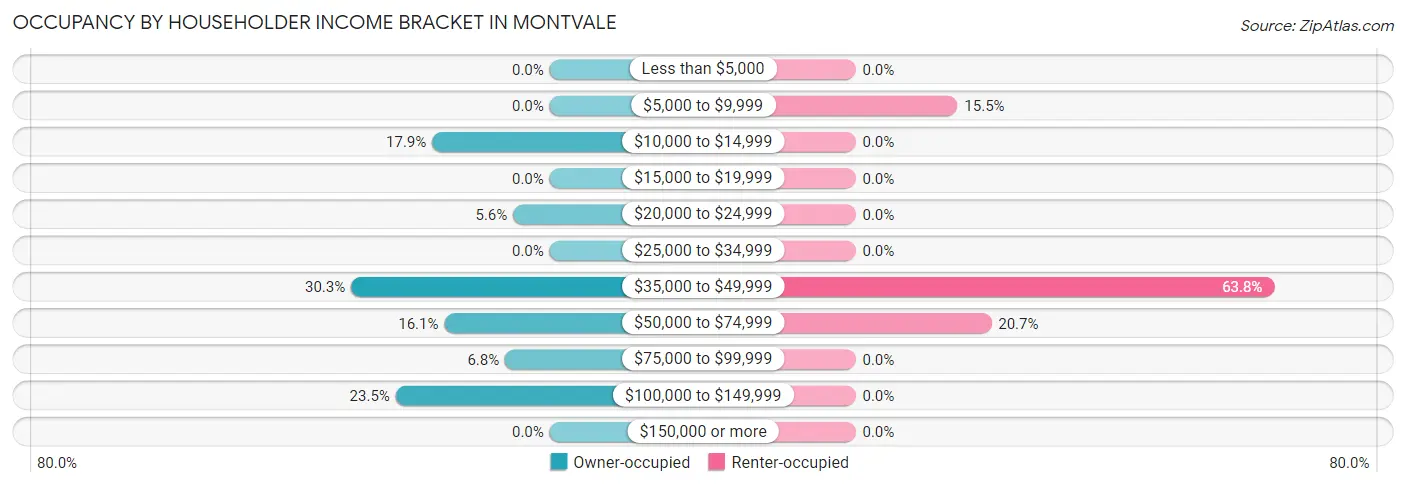
| Income Bracket | Owner-occupied | Renter-occupied |
| Less than $5,000 | 0 (0.0%) | 0 (0.0%) |
| $5,000 to $9,999 | 0 (0.0%) | 9 (15.5%) |
| $10,000 to $14,999 | 29 (17.9%) | 0 (0.0%) |
| $15,000 to $19,999 | 0 (0.0%) | 0 (0.0%) |
| $20,000 to $24,999 | 9 (5.6%) | 0 (0.0%) |
| $25,000 to $34,999 | 0 (0.0%) | 0 (0.0%) |
| $35,000 to $49,999 | 49 (30.2%) | 37 (63.8%) |
| $50,000 to $74,999 | 26 (16.1%) | 12 (20.7%) |
| $75,000 to $99,999 | 11 (6.8%) | 0 (0.0%) |
| $100,000 to $149,999 | 38 (23.5%) | 0 (0.0%) |
| $150,000 or more | 0 (0.0%) | 0 (0.0%) |
| Total | 162 (100.0%) | 58 (100.0%) |
Monthly Housing Cost Tiers in Montvale
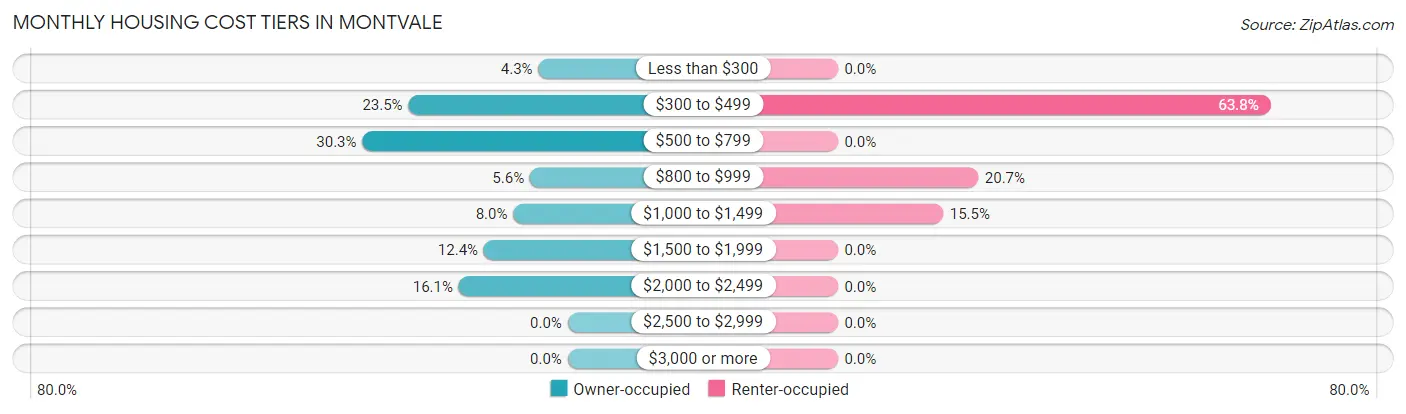
| Monthly Cost | Owner-occupied | Renter-occupied |
| Less than $300 | 7 (4.3%) | 0 (0.0%) |
| $300 to $499 | 38 (23.5%) | 37 (63.8%) |
| $500 to $799 | 49 (30.2%) | 0 (0.0%) |
| $800 to $999 | 9 (5.6%) | 12 (20.7%) |
| $1,000 to $1,499 | 13 (8.0%) | 9 (15.5%) |
| $1,500 to $1,999 | 20 (12.3%) | 0 (0.0%) |
| $2,000 to $2,499 | 26 (16.1%) | 0 (0.0%) |
| $2,500 to $2,999 | 0 (0.0%) | 0 (0.0%) |
| $3,000 or more | 0 (0.0%) | 0 (0.0%) |
| Total | 162 (100.0%) | 58 (100.0%) |
Physical Housing Characteristics in Montvale
Housing Structures in Montvale
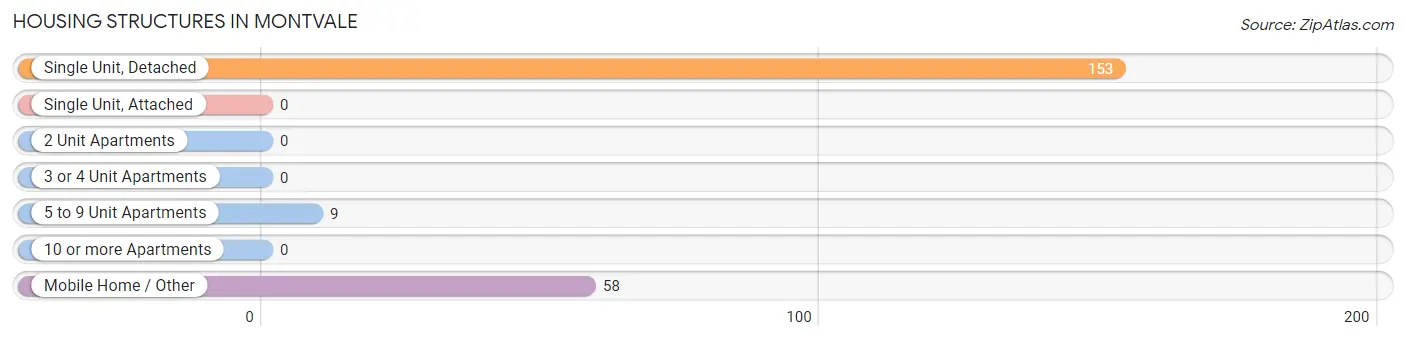
| Structure Type | # Housing Units | % Housing Units |
| Single Unit, Detached | 153 | 69.6% |
| Single Unit, Attached | 0 | 0.0% |
| 2 Unit Apartments | 0 | 0.0% |
| 3 or 4 Unit Apartments | 0 | 0.0% |
| 5 to 9 Unit Apartments | 9 | 4.1% |
| 10 or more Apartments | 0 | 0.0% |
| Mobile Home / Other | 58 | 26.4% |
| Total | 220 | 100.0% |
Housing Structures by Occupancy in Montvale
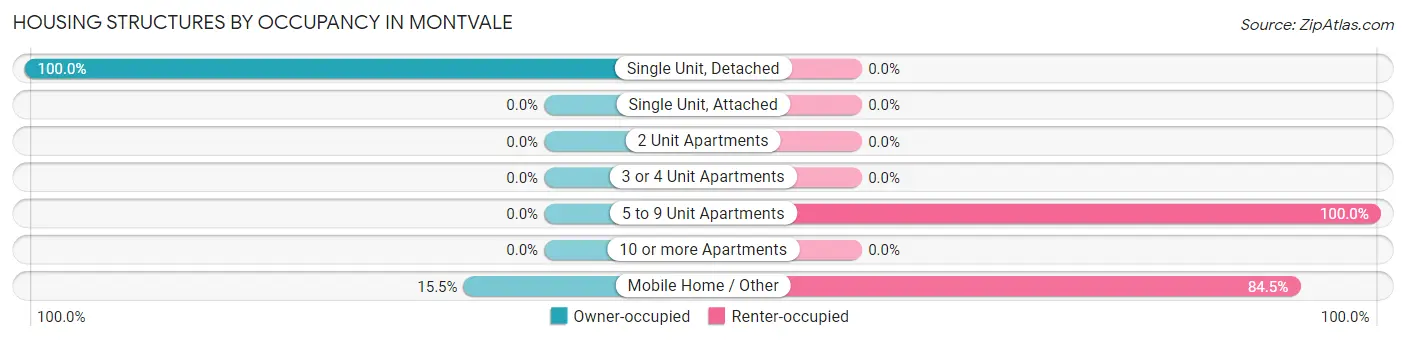
| Structure Type | Owner-occupied | Renter-occupied |
| Single Unit, Detached | 153 (100.0%) | 0 (0.0%) |
| Single Unit, Attached | 0 (0.0%) | 0 (0.0%) |
| 2 Unit Apartments | 0 (0.0%) | 0 (0.0%) |
| 3 or 4 Unit Apartments | 0 (0.0%) | 0 (0.0%) |
| 5 to 9 Unit Apartments | 0 (0.0%) | 9 (100.0%) |
| 10 or more Apartments | 0 (0.0%) | 0 (0.0%) |
| Mobile Home / Other | 9 (15.5%) | 49 (84.5%) |
| Total | 162 (73.6%) | 58 (26.4%) |
Housing Structures by Number of Rooms in Montvale
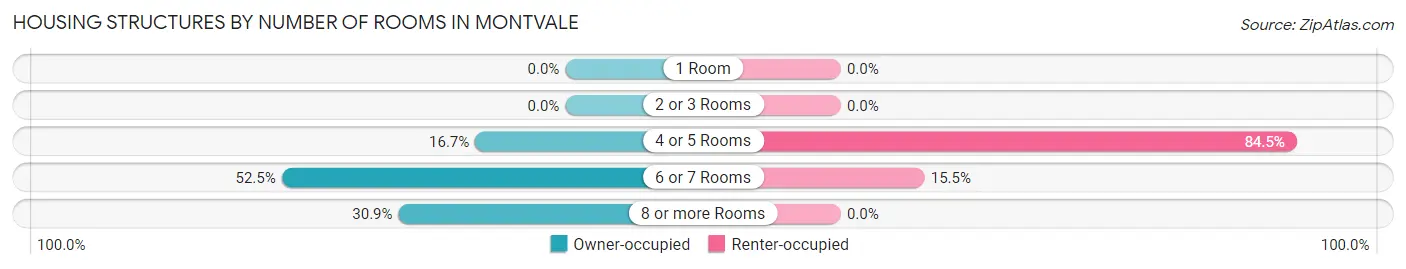
| Number of Rooms | Owner-occupied | Renter-occupied |
| 1 Room | 0 (0.0%) | 0 (0.0%) |
| 2 or 3 Rooms | 0 (0.0%) | 0 (0.0%) |
| 4 or 5 Rooms | 27 (16.7%) | 49 (84.5%) |
| 6 or 7 Rooms | 85 (52.5%) | 9 (15.5%) |
| 8 or more Rooms | 50 (30.9%) | 0 (0.0%) |
| Total | 162 (100.0%) | 58 (100.0%) |
Housing Structure by Heating Type in Montvale
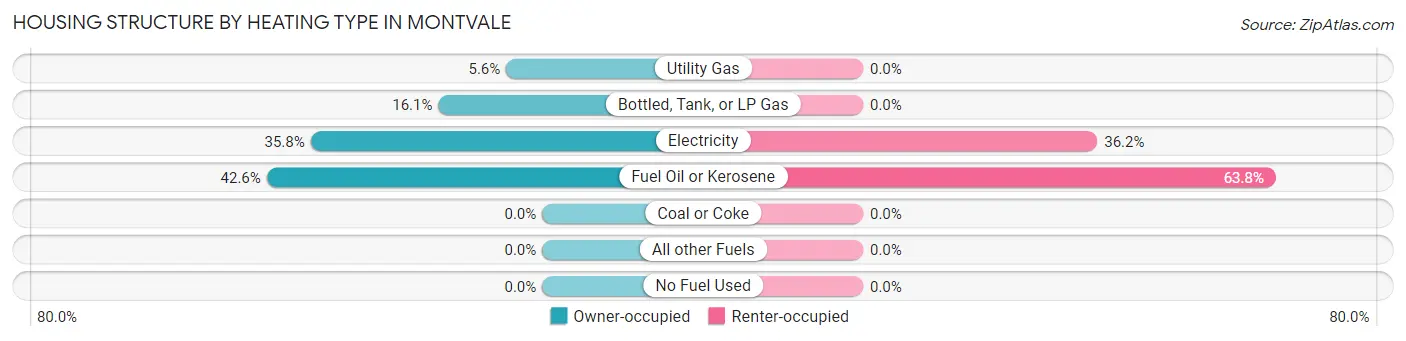
| Heating Type | Owner-occupied | Renter-occupied |
| Utility Gas | 9 (5.6%) | 0 (0.0%) |
| Bottled, Tank, or LP Gas | 26 (16.1%) | 0 (0.0%) |
| Electricity | 58 (35.8%) | 21 (36.2%) |
| Fuel Oil or Kerosene | 69 (42.6%) | 37 (63.8%) |
| Coal or Coke | 0 (0.0%) | 0 (0.0%) |
| All other Fuels | 0 (0.0%) | 0 (0.0%) |
| No Fuel Used | 0 (0.0%) | 0 (0.0%) |
| Total | 162 (100.0%) | 58 (100.0%) |
Household Vehicle Usage in Montvale
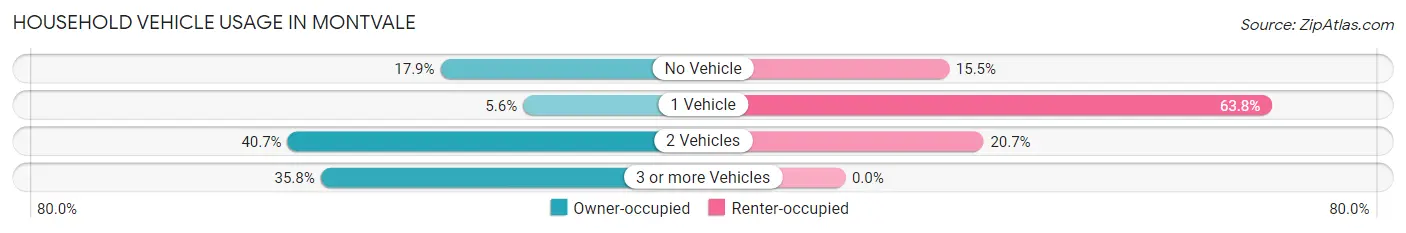
| Vehicles per Household | Owner-occupied | Renter-occupied |
| No Vehicle | 29 (17.9%) | 9 (15.5%) |
| 1 Vehicle | 9 (5.6%) | 37 (63.8%) |
| 2 Vehicles | 66 (40.7%) | 12 (20.7%) |
| 3 or more Vehicles | 58 (35.8%) | 0 (0.0%) |
| Total | 162 (100.0%) | 58 (100.0%) |
Real Estate & Mortgages in Montvale
Real Estate and Mortgage Overview in Montvale
| Characteristic | Without Mortgage | With Mortgage |
| Housing Units | 63 | 99 |
| Median Property Value | $197,700 | $119,700 |
| Median Household Income | - | - |
| Monthly Housing Costs | - | - |
| Real Estate Taxes | - | - |
Property Value by Mortgage Status in Montvale
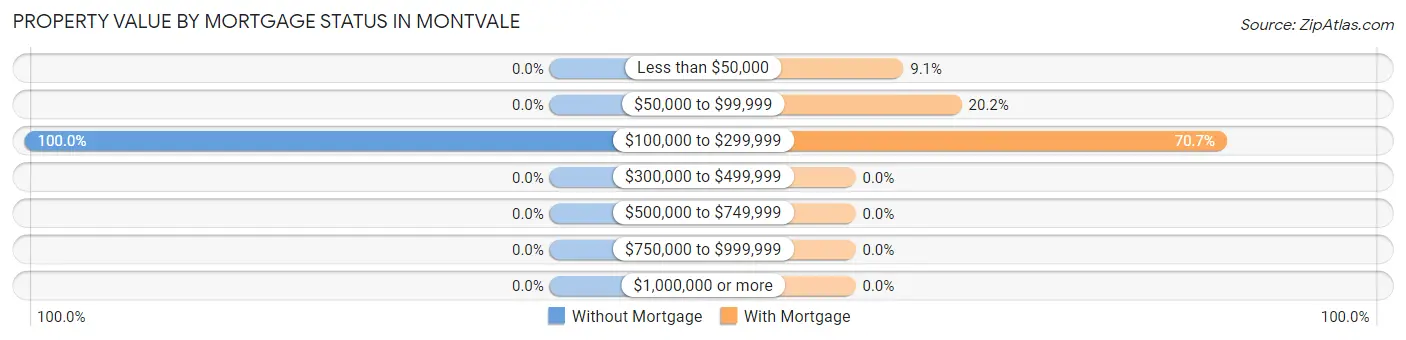
| Property Value | Without Mortgage | With Mortgage |
| Less than $50,000 | 0 (0.0%) | 9 (9.1%) |
| $50,000 to $99,999 | 0 (0.0%) | 20 (20.2%) |
| $100,000 to $299,999 | 63 (100.0%) | 70 (70.7%) |
| $300,000 to $499,999 | 0 (0.0%) | 0 (0.0%) |
| $500,000 to $749,999 | 0 (0.0%) | 0 (0.0%) |
| $750,000 to $999,999 | 0 (0.0%) | 0 (0.0%) |
| $1,000,000 or more | 0 (0.0%) | 0 (0.0%) |
| Total | 63 (100.0%) | 99 (100.0%) |
Household Income by Mortgage Status in Montvale
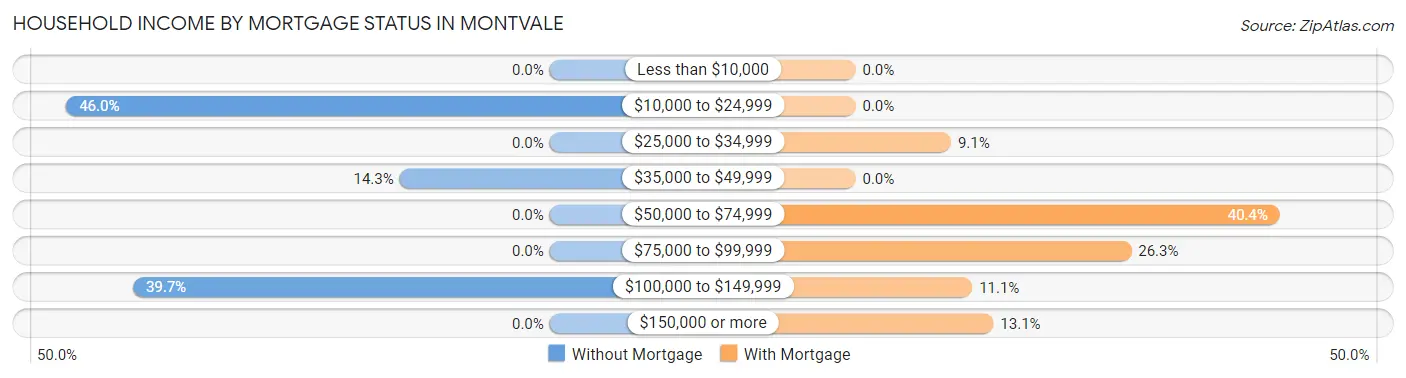
| Household Income | Without Mortgage | With Mortgage |
| Less than $10,000 | 0 (0.0%) | 0 (0.0%) |
| $10,000 to $24,999 | 29 (46.0%) | 0 (0.0%) |
| $25,000 to $34,999 | 0 (0.0%) | 9 (9.1%) |
| $35,000 to $49,999 | 9 (14.3%) | 0 (0.0%) |
| $50,000 to $74,999 | 0 (0.0%) | 40 (40.4%) |
| $75,000 to $99,999 | 0 (0.0%) | 26 (26.3%) |
| $100,000 to $149,999 | 25 (39.7%) | 11 (11.1%) |
| $150,000 or more | 0 (0.0%) | 13 (13.1%) |
| Total | 63 (100.0%) | 99 (100.0%) |
Property Value to Household Income Ratio in Montvale
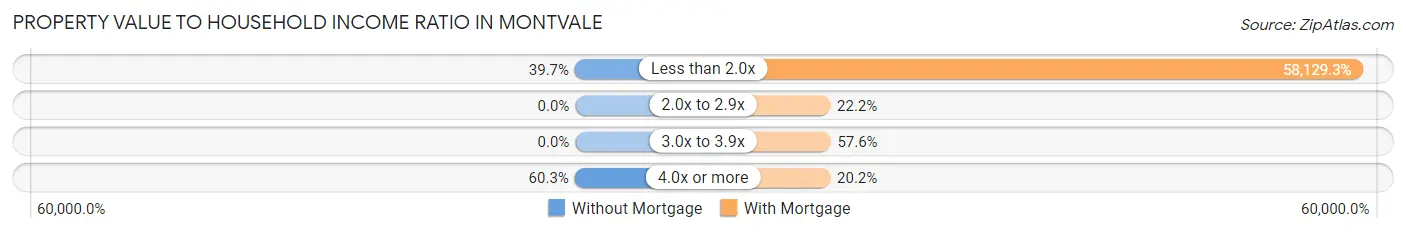
| Value-to-Income Ratio | Without Mortgage | With Mortgage |
| Less than 2.0x | 25 (39.7%) | 57,548 (58,129.3%) |
| 2.0x to 2.9x | 0 (0.0%) | 22 (22.2%) |
| 3.0x to 3.9x | 0 (0.0%) | 57 (57.6%) |
| 4.0x or more | 38 (60.3%) | 20 (20.2%) |
| Total | 63 (100.0%) | 99 (100.0%) |
Real Estate Taxes by Mortgage Status in Montvale
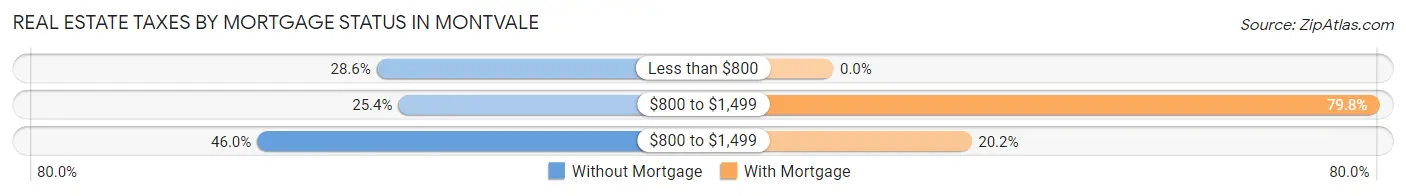
| Property Taxes | Without Mortgage | With Mortgage |
| Less than $800 | 18 (28.6%) | 0 (0.0%) |
| $800 to $1,499 | 16 (25.4%) | 79 (79.8%) |
| $800 to $1,499 | 29 (46.0%) | 20 (20.2%) |
| Total | 63 (100.0%) | 99 (100.0%) |
Health & Disability in Montvale
Health Insurance Coverage by Age in Montvale
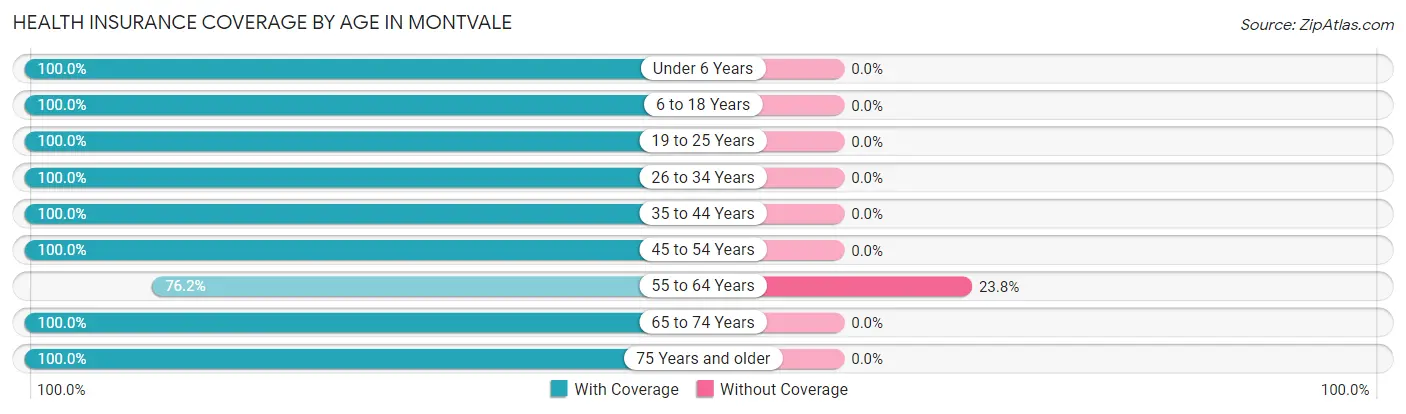
| Age Bracket | With Coverage | Without Coverage |
| Under 6 Years | 14 (100.0%) | 0 (0.0%) |
| 6 to 18 Years | 39 (100.0%) | 0 (0.0%) |
| 19 to 25 Years | 85 (100.0%) | 0 (0.0%) |
| 26 to 34 Years | 34 (100.0%) | 0 (0.0%) |
| 35 to 44 Years | 49 (100.0%) | 0 (0.0%) |
| 45 to 54 Years | 41 (100.0%) | 0 (0.0%) |
| 55 to 64 Years | 64 (76.2%) | 20 (23.8%) |
| 65 to 74 Years | 20 (100.0%) | 0 (0.0%) |
| 75 Years and older | 58 (100.0%) | 0 (0.0%) |
| Total | 404 (95.3%) | 20 (4.7%) |
Health Insurance Coverage by Citizenship Status in Montvale
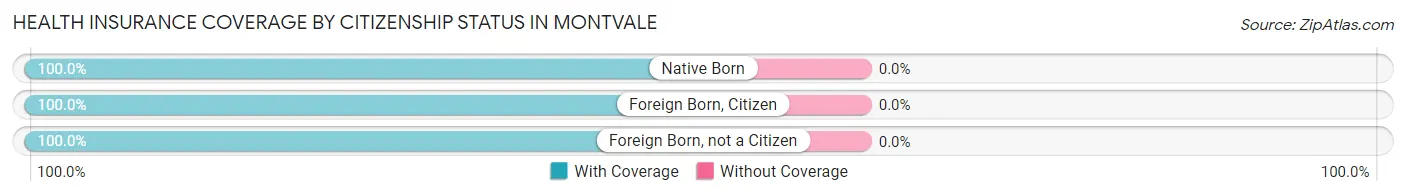
| Citizenship Status | With Coverage | Without Coverage |
| Native Born | 14 (100.0%) | 0 (0.0%) |
| Foreign Born, Citizen | 39 (100.0%) | 0 (0.0%) |
| Foreign Born, not a Citizen | 85 (100.0%) | 0 (0.0%) |
Health Insurance Coverage by Household Income in Montvale
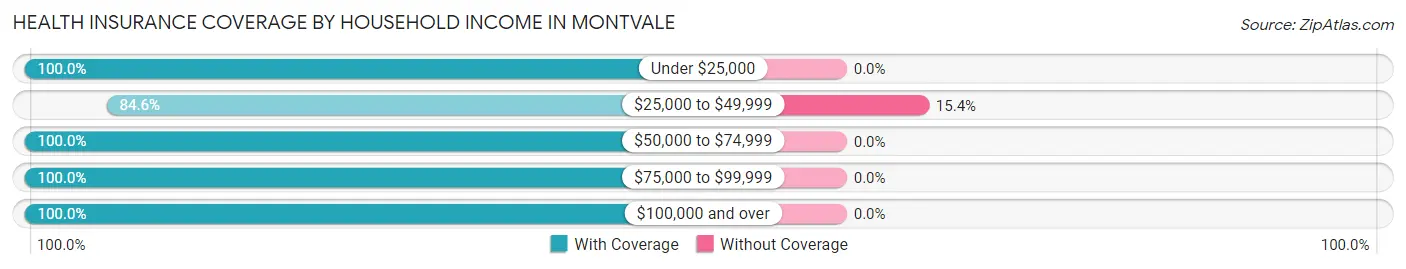
| Household Income | With Coverage | Without Coverage |
| Under $25,000 | 47 (100.0%) | 0 (0.0%) |
| $25,000 to $49,999 | 110 (84.6%) | 20 (15.4%) |
| $50,000 to $74,999 | 113 (100.0%) | 0 (0.0%) |
| $75,000 to $99,999 | 22 (100.0%) | 0 (0.0%) |
| $100,000 and over | 112 (100.0%) | 0 (0.0%) |
Public vs Private Health Insurance Coverage by Age in Montvale
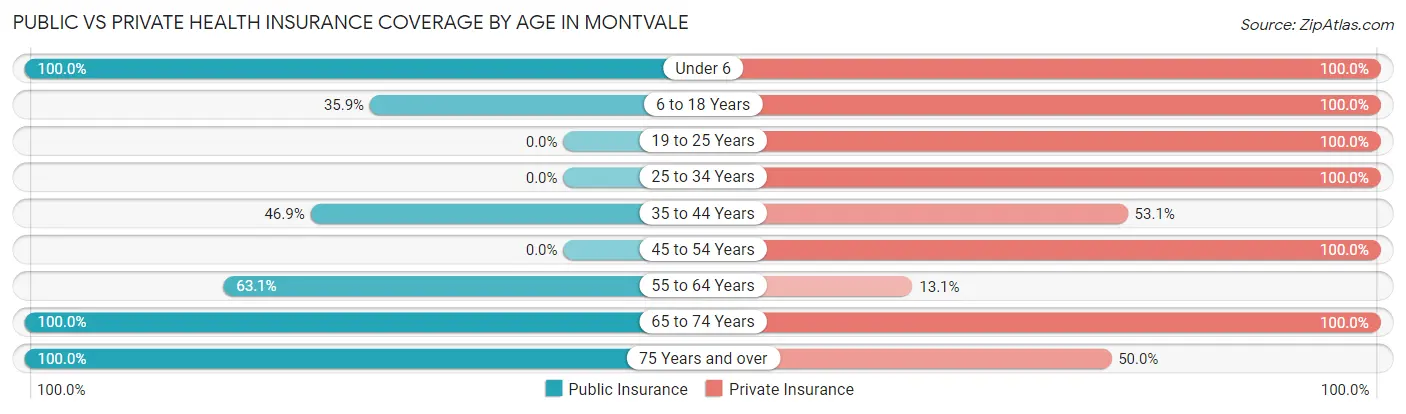
| Age Bracket | Public Insurance | Private Insurance |
| Under 6 | 14 (100.0%) | 14 (100.0%) |
| 6 to 18 Years | 14 (35.9%) | 39 (100.0%) |
| 19 to 25 Years | 0 (0.0%) | 85 (100.0%) |
| 25 to 34 Years | 0 (0.0%) | 34 (100.0%) |
| 35 to 44 Years | 23 (46.9%) | 26 (53.1%) |
| 45 to 54 Years | 0 (0.0%) | 41 (100.0%) |
| 55 to 64 Years | 53 (63.1%) | 11 (13.1%) |
| 65 to 74 Years | 20 (100.0%) | 20 (100.0%) |
| 75 Years and over | 58 (100.0%) | 29 (50.0%) |
| Total | 182 (42.9%) | 299 (70.5%) |
Disability Status by Sex by Age in Montvale
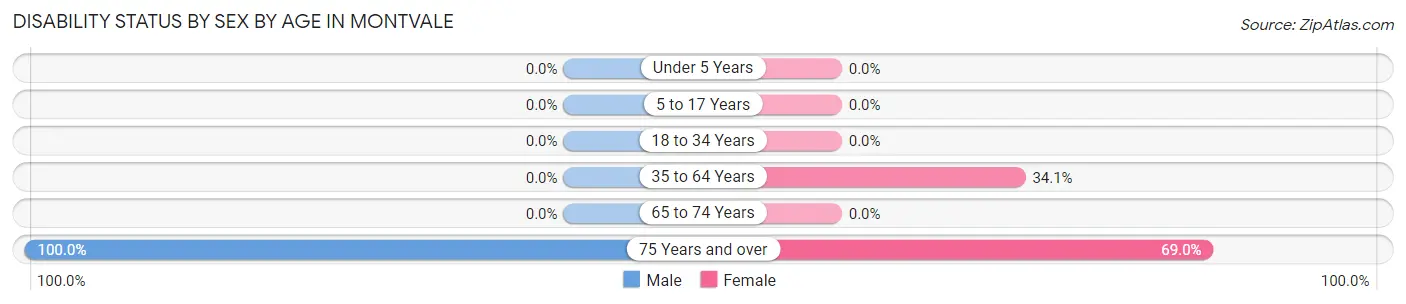
| Age Bracket | Male | Female |
| Under 5 Years | 0 (0.0%) | 0 (0.0%) |
| 5 to 17 Years | 0 (0.0%) | 0 (0.0%) |
| 18 to 34 Years | 0 (0.0%) | 0 (0.0%) |
| 35 to 64 Years | 0 (0.0%) | 30 (34.1%) |
| 65 to 74 Years | 0 (0.0%) | 0 (0.0%) |
| 75 Years and over | 29 (100.0%) | 20 (69.0%) |
Disability Class by Sex by Age in Montvale
Disability Class: Hearing Difficulty
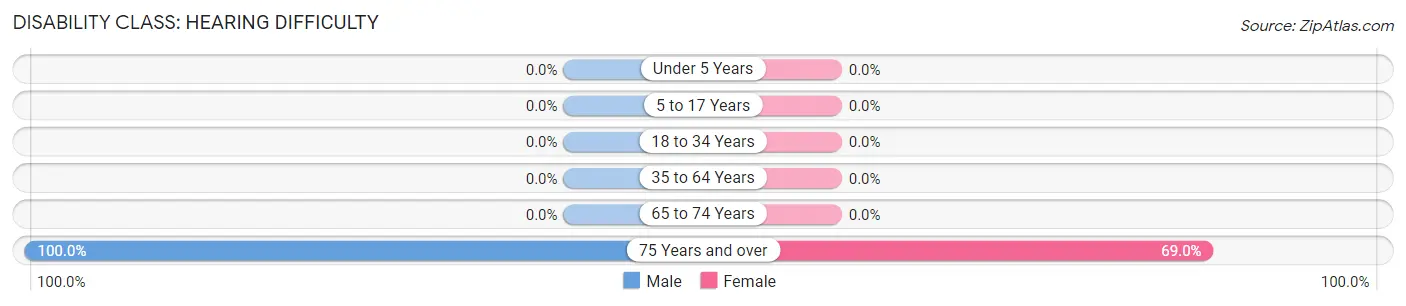
| Age Bracket | Male | Female |
| Under 5 Years | 0 (0.0%) | 0 (0.0%) |
| 5 to 17 Years | 0 (0.0%) | 0 (0.0%) |
| 18 to 34 Years | 0 (0.0%) | 0 (0.0%) |
| 35 to 64 Years | 0 (0.0%) | 0 (0.0%) |
| 65 to 74 Years | 0 (0.0%) | 0 (0.0%) |
| 75 Years and over | 29 (100.0%) | 20 (69.0%) |
Disability Class: Vision Difficulty
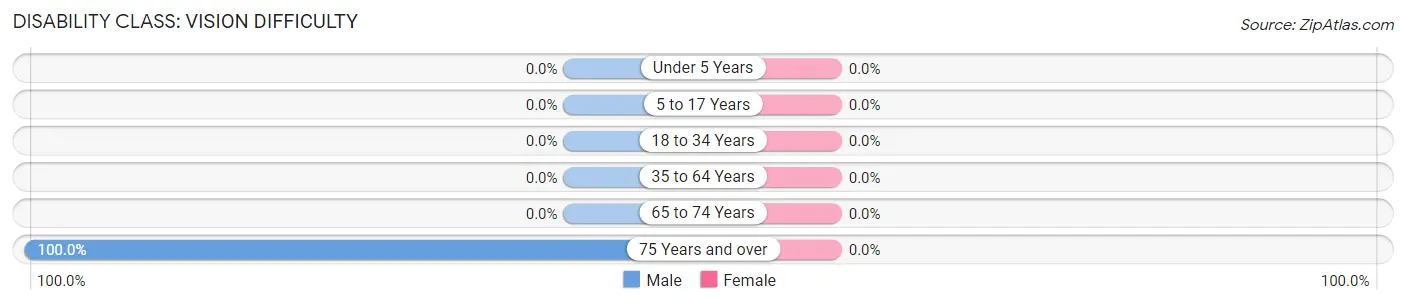
| Age Bracket | Male | Female |
| Under 5 Years | 0 (0.0%) | 0 (0.0%) |
| 5 to 17 Years | 0 (0.0%) | 0 (0.0%) |
| 18 to 34 Years | 0 (0.0%) | 0 (0.0%) |
| 35 to 64 Years | 0 (0.0%) | 0 (0.0%) |
| 65 to 74 Years | 0 (0.0%) | 0 (0.0%) |
| 75 Years and over | 29 (100.0%) | 0 (0.0%) |
Disability Class: Cognitive Difficulty
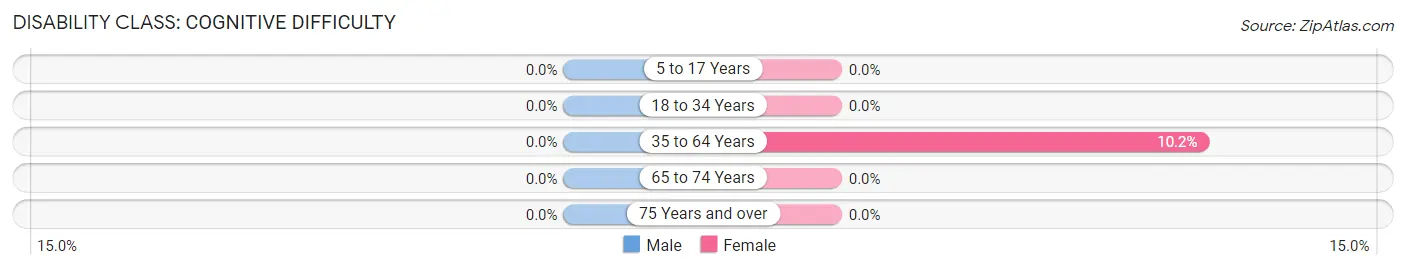
| Age Bracket | Male | Female |
| 5 to 17 Years | 0 (0.0%) | 0 (0.0%) |
| 18 to 34 Years | 0 (0.0%) | 0 (0.0%) |
| 35 to 64 Years | 0 (0.0%) | 9 (10.2%) |
| 65 to 74 Years | 0 (0.0%) | 0 (0.0%) |
| 75 Years and over | 0 (0.0%) | 0 (0.0%) |
Disability Class: Ambulatory Difficulty
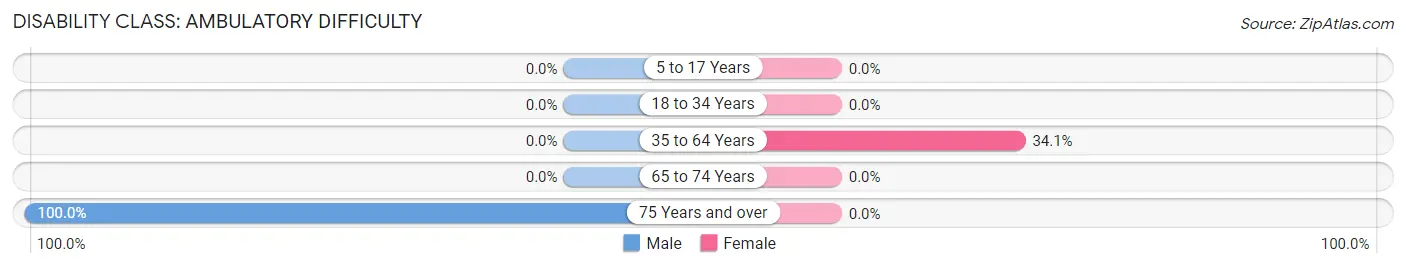
| Age Bracket | Male | Female |
| 5 to 17 Years | 0 (0.0%) | 0 (0.0%) |
| 18 to 34 Years | 0 (0.0%) | 0 (0.0%) |
| 35 to 64 Years | 0 (0.0%) | 30 (34.1%) |
| 65 to 74 Years | 0 (0.0%) | 0 (0.0%) |
| 75 Years and over | 29 (100.0%) | 0 (0.0%) |
Disability Class: Self-Care Difficulty
| Age Bracket | Male | Female |
| 5 to 17 Years | 0 (0.0%) | 0 (0.0%) |
| 18 to 34 Years | 0 (0.0%) | 0 (0.0%) |
| 35 to 64 Years | 0 (0.0%) | 0 (0.0%) |
| 65 to 74 Years | 0 (0.0%) | 0 (0.0%) |
| 75 Years and over | 0 (0.0%) | 0 (0.0%) |
Technology Access in Montvale
Computing Device Access in Montvale
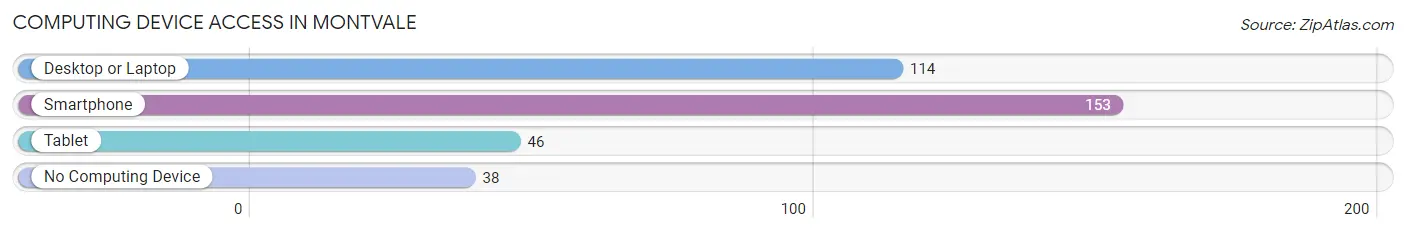
| Device Type | # Households | % Households |
| Desktop or Laptop | 114 | 51.8% |
| Smartphone | 153 | 69.6% |
| Tablet | 46 | 20.9% |
| No Computing Device | 38 | 17.3% |
| Total | 220 | 100.0% |
Internet Access in Montvale
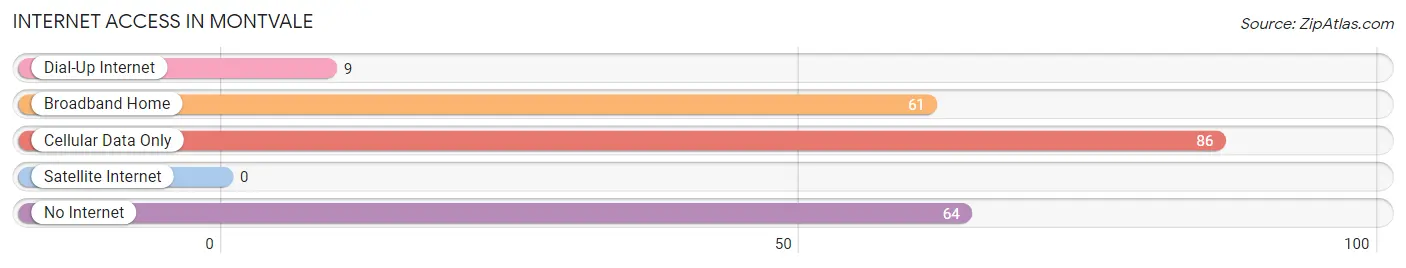
| Internet Type | # Households | % Households |
| Dial-Up Internet | 9 | 4.1% |
| Broadband Home | 61 | 27.7% |
| Cellular Data Only | 86 | 39.1% |
| Satellite Internet | 0 | 0.0% |
| No Internet | 64 | 29.1% |
| Total | 220 | 100.0% |
Montvale Summary
Montvale is a small town located in Bedford County, Virginia. It is situated in the foothills of the Blue Ridge Mountains and is part of the Roanoke Metropolitan Statistical Area. The town has a population of approximately 1,000 people and is known for its rural charm and small-town atmosphere.
History
Montvale was first settled in the late 1700s by a group of settlers from Pennsylvania. The town was originally known as “Montvale Station” and was a stop on the Virginia and Tennessee Railroad. The town was officially incorporated in 1891 and was named after the nearby mountain, Montvale.
In the early 1900s, Montvale was a thriving agricultural community. The town was home to several farms, a grist mill, and a sawmill. The town also had a post office, a general store, and a blacksmith shop.
In the 1950s, the town began to experience a decline in population as many of the residents moved away in search of better job opportunities. However, in the late 1970s, the town began to experience a resurgence in population as people began to move back to the area.
Geography
Montvale is located in the foothills of the Blue Ridge Mountains in Bedford County, Virginia. The town is situated at an elevation of 1,400 feet and is surrounded by rolling hills and lush forests. The town is located approximately 25 miles from Roanoke and is accessible via Interstate 81.
The town is located in a humid subtropical climate zone and experiences hot, humid summers and mild winters. The average annual temperature is around 57 degrees Fahrenheit and the average annual precipitation is around 43 inches.
Economy
Montvale’s economy is largely based on agriculture and tourism. The town is home to several farms that produce a variety of crops, including corn, soybeans, and hay. The town is also home to several wineries and vineyards, which attract tourists from all over the region.
The town is also home to several small businesses, including restaurants, antique stores, and gift shops. The town is also home to a few manufacturing companies, which produce a variety of products, including furniture and textiles.
Demographics
As of the 2010 census, the population of Montvale was 1,000 people. The racial makeup of the town was 97.2% White, 0.7% African American, 0.3% Native American, 0.3% Asian, and 1.5% from other races. The median household income was $41,250 and the median family income was $50,000.
The town is home to a variety of religious denominations, including Baptist, Methodist, and Presbyterian. The town is also home to a variety of cultural and recreational activities, including festivals, concerts, and sporting events.
Conclusion
Montvale is a small town located in Bedford County, Virginia. It is situated in the foothills of the Blue Ridge Mountains and is part of the Roanoke Metropolitan Statistical Area. The town has a population of approximately 1,000 people and is known for its rural charm and small-town atmosphere. The town’s economy is largely based on agriculture and tourism and the town is home to a variety of religious denominations and cultural and recreational activities.
Common Questions
What is Per Capita Income in Montvale?
Per Capita income in Montvale is $29,739.
What is the Median Family Income in Montvale?
Median Family Income in Montvale is $82,841.
What is the Median Household income in Montvale?
Median Household Income in Montvale is $39,331.
What is Income or Wage Gap in Montvale?
Income or Wage Gap in Montvale is 13.1%.
Women in Montvale earn 86.9 cents for every dollar earned by a man.
What is Inequality or Gini Index in Montvale?
Inequality or Gini Index in Montvale is 0.37.
What is the Total Population of Montvale?
Total Population of Montvale is 424.
What is the Total Male Population of Montvale?
Total Male Population of Montvale is 204.
What is the Total Female Population of Montvale?
Total Female Population of Montvale is 220.
What is the Ratio of Males per 100 Females in Montvale?
There are 92.73 Males per 100 Females in Montvale.
What is the Ratio of Females per 100 Males in Montvale?
There are 107.84 Females per 100 Males in Montvale.
What is the Median Population Age in Montvale?
Median Population Age in Montvale is 40.6 Years.
What is the Average Family Size in Montvale
Average Family Size in Montvale is 2.6 People.
What is the Average Household Size in Montvale
Average Household Size in Montvale is 1.9 People.
How Large is the Labor Force in Montvale?
There are 226 People in the Labor Forcein in Montvale.
What is the Percentage of People in the Labor Force in Montvale?
58.7% of People are in the Labor Force in Montvale.
What is the Unemployment Rate in Montvale?
Unemployment Rate in Montvale is 10.2%.