Spring Arbor, MI Map & Demographics
Spring Arbor Map
Spring Arbor Overview
$23,226
PER CAPITA INCOME
$91,346
AVG FAMILY INCOME
$78,393
AVG HOUSEHOLD INCOME
81.2%
WAGE / INCOME GAP [ % ]
18.8¢/ $1
WAGE / INCOME GAP [ $ ]
0.44
INEQUALITY / GINI INDEX
2,410
TOTAL POPULATION
911
MALE POPULATION
1,499
FEMALE POPULATION
60.77
MALES / 100 FEMALES
164.54
FEMALES / 100 MALES
22.2
MEDIAN AGE
3.1
AVG FAMILY SIZE
2.7
AVG HOUSEHOLD SIZE
1,342
LABOR FORCE [ PEOPLE ]
62.6%
PERCENT IN LABOR FORCE
4.1%
UNEMPLOYMENT RATE
Spring Arbor Zip Codes
Spring Arbor Area Codes
Income in Spring Arbor
Income Overview in Spring Arbor
Per Capita Income in Spring Arbor is $23,226, while median incomes of families and households are $91,346 and $78,393 respectively.
| Characteristic | Number | Measure |
| Per Capita Income | 2,410 | $23,226 |
| Median Family Income | 394 | $91,346 |
| Mean Family Income | 394 | $112,445 |
| Median Household Income | 479 | $78,393 |
| Mean Household Income | 479 | $96,370 |
| Income Deficit | 394 | $0 |
| Wage / Income Gap (%) | 2,410 | 81.20% |
| Wage / Income Gap ($) | 2,410 | 18.80¢ per $1 |
| Gini / Inequality Index | 2,410 | 0.44 |
Earnings by Sex in Spring Arbor
Average Earnings in Spring Arbor are $8,988, $33,636 for men and $6,322 for women, a difference of 81.2%.
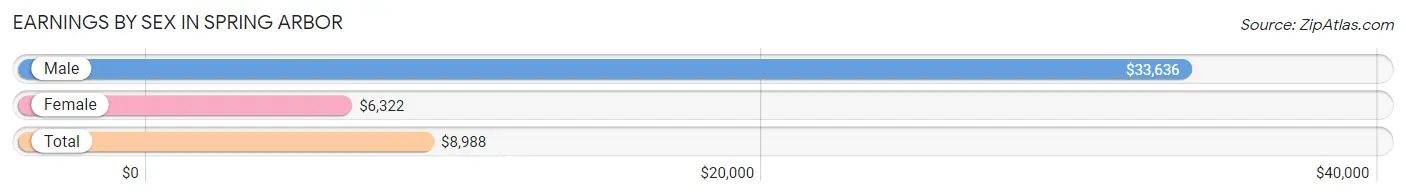
| Sex | Number | Average Earnings |
| Male | 598 (38.1%) | $33,636 |
| Female | 973 (61.9%) | $6,322 |
| Total | 1,571 (100.0%) | $8,988 |
Earnings by Sex by Income Bracket in Spring Arbor
The most common earnings brackets in Spring Arbor are $2,499 or less for men (68 | 11.4%) and $2,500 to $4,999 for women (236 | 24.2%).
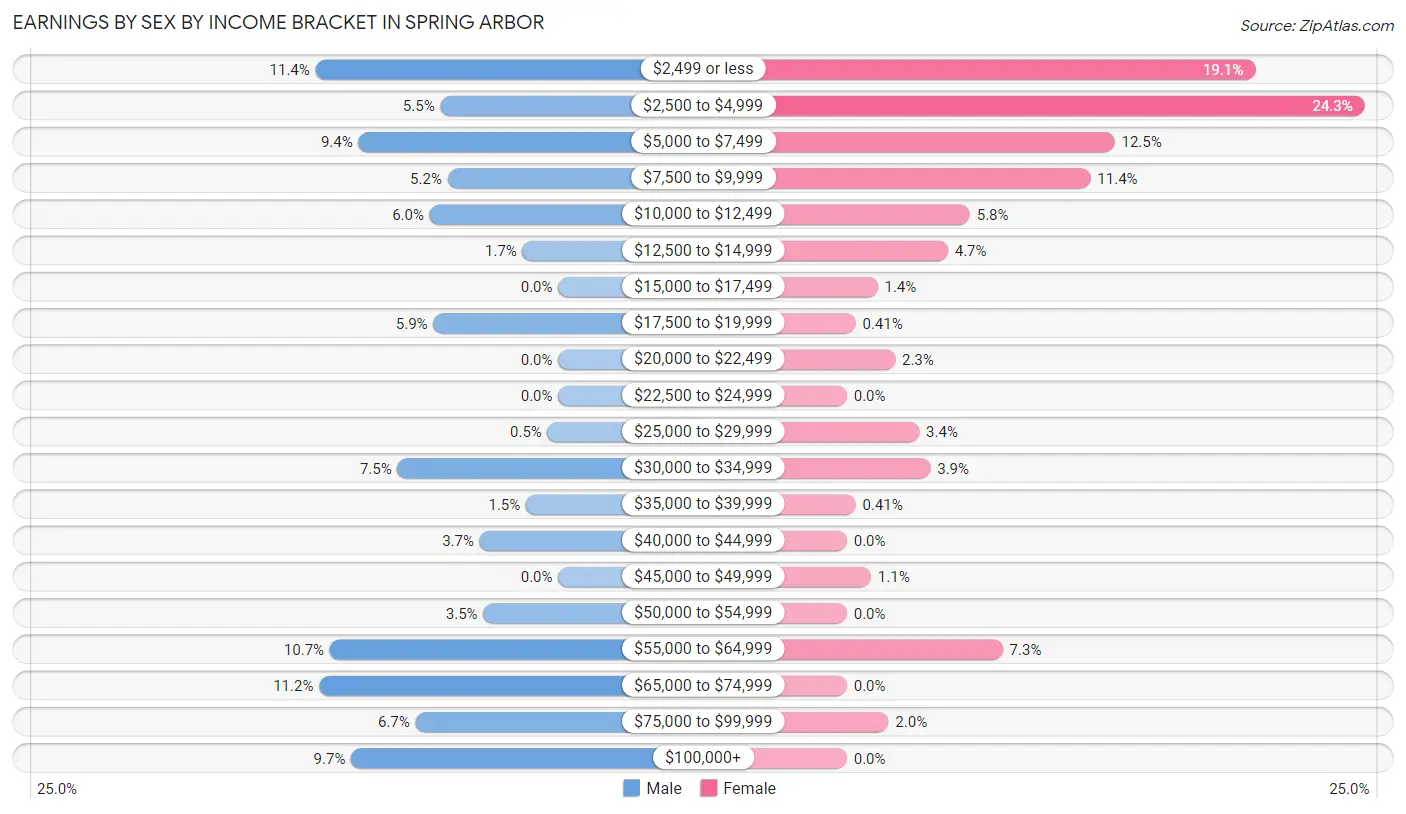
| Income | Male | Female |
| $2,499 or less | 68 (11.4%) | 186 (19.1%) |
| $2,500 to $4,999 | 33 (5.5%) | 236 (24.2%) |
| $5,000 to $7,499 | 56 (9.4%) | 122 (12.5%) |
| $7,500 to $9,999 | 31 (5.2%) | 111 (11.4%) |
| $10,000 to $12,499 | 36 (6.0%) | 56 (5.8%) |
| $12,500 to $14,999 | 10 (1.7%) | 46 (4.7%) |
| $15,000 to $17,499 | 0 (0.0%) | 14 (1.4%) |
| $17,500 to $19,999 | 35 (5.9%) | 4 (0.4%) |
| $20,000 to $22,499 | 0 (0.0%) | 22 (2.3%) |
| $22,500 to $24,999 | 0 (0.0%) | 0 (0.0%) |
| $25,000 to $29,999 | 3 (0.5%) | 33 (3.4%) |
| $30,000 to $34,999 | 45 (7.5%) | 38 (3.9%) |
| $35,000 to $39,999 | 9 (1.5%) | 4 (0.4%) |
| $40,000 to $44,999 | 22 (3.7%) | 0 (0.0%) |
| $45,000 to $49,999 | 0 (0.0%) | 11 (1.1%) |
| $50,000 to $54,999 | 21 (3.5%) | 0 (0.0%) |
| $55,000 to $64,999 | 64 (10.7%) | 71 (7.3%) |
| $65,000 to $74,999 | 67 (11.2%) | 0 (0.0%) |
| $75,000 to $99,999 | 40 (6.7%) | 19 (1.9%) |
| $100,000+ | 58 (9.7%) | 0 (0.0%) |
| Total | 598 (100.0%) | 973 (100.0%) |
Earnings by Sex by Educational Attainment in Spring Arbor
Average earnings in Spring Arbor are $67,708 for men and $32,961 for women, a difference of 51.3%. Men with an educational attainment of bachelor's degree enjoy the highest average annual earnings of $72,250, while those with college or associate's degree education earn the least with $68,229. Women with an educational attainment of college or associate's degree earn the most with the average annual earnings of $20,667, while those with college or associate's degree education have the smallest earnings of $20,667.
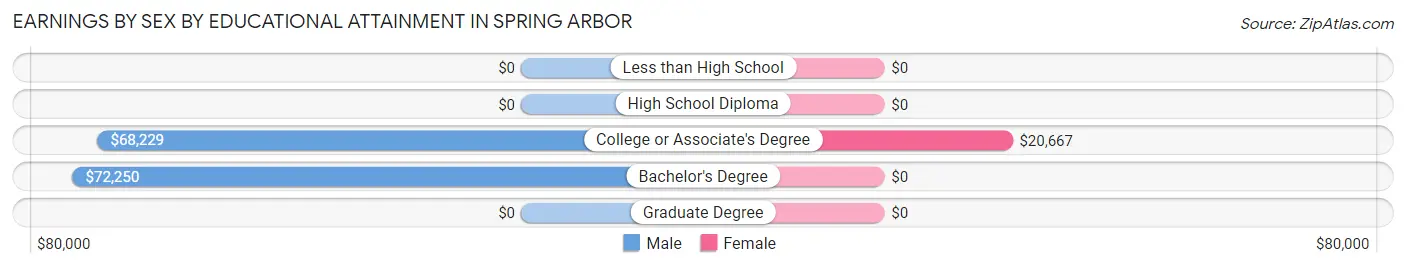
| Educational Attainment | Male Income | Female Income |
| Less than High School | - | - |
| High School Diploma | - | - |
| College or Associate's Degree | $68,229 | $20,667 |
| Bachelor's Degree | $72,250 | $0 |
| Graduate Degree | - | - |
| Total | $67,708 | $32,961 |
Family Income in Spring Arbor
Family Income Brackets in Spring Arbor
According to the Spring Arbor family income data, there are 109 families falling into the $100,000 to $149,999 income range, which is the most common income bracket and makes up 27.7% of all families.
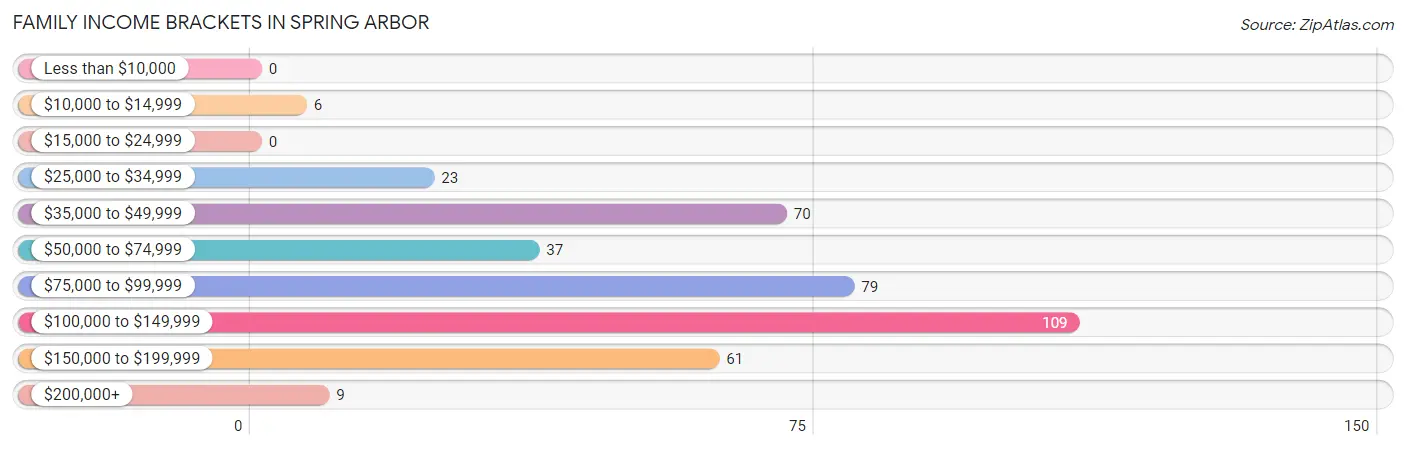
| Income Bracket | # Families | % Families |
| Less than $10,000 | 0 | 0.0% |
| $10,000 to $14,999 | 6 | 1.5% |
| $15,000 to $24,999 | 0 | 0.0% |
| $25,000 to $34,999 | 23 | 5.8% |
| $35,000 to $49,999 | 70 | 17.8% |
| $50,000 to $74,999 | 37 | 9.4% |
| $75,000 to $99,999 | 79 | 20.1% |
| $100,000 to $149,999 | 109 | 27.7% |
| $150,000 to $199,999 | 61 | 15.5% |
| $200,000+ | 9 | 2.3% |
Family Income by Famaliy Size in Spring Arbor
3-person families (75 | 19.0%) account for the highest median family income in Spring Arbor with $158,274 per family, while 3-person families (75 | 19.0%) have the highest median income of $52,758 per family member.
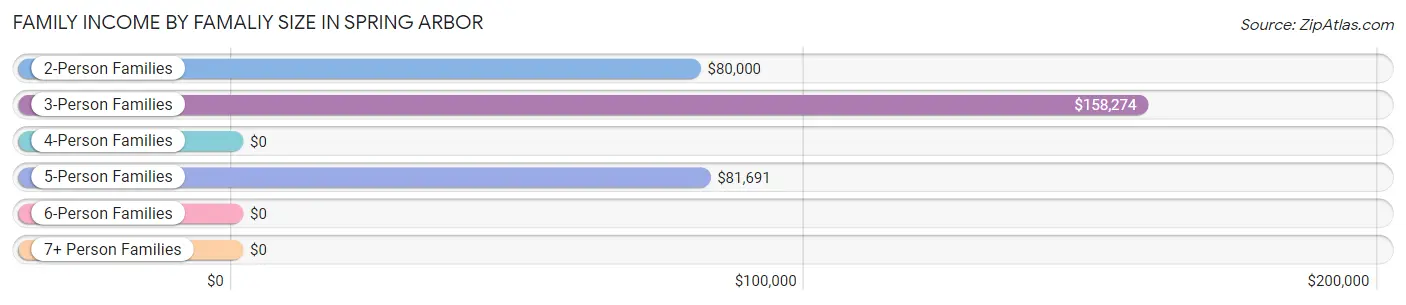
| Income Bracket | # Families | Median Income |
| 2-Person Families | 244 (61.9%) | $80,000 |
| 3-Person Families | 75 (19.0%) | $158,274 |
| 4-Person Families | 42 (10.7%) | $0 |
| 5-Person Families | 33 (8.4%) | $81,691 |
| 6-Person Families | 0 (0.0%) | $0 |
| 7+ Person Families | 0 (0.0%) | $0 |
| Total | 394 (100.0%) | $91,346 |
Family Income by Number of Earners in Spring Arbor
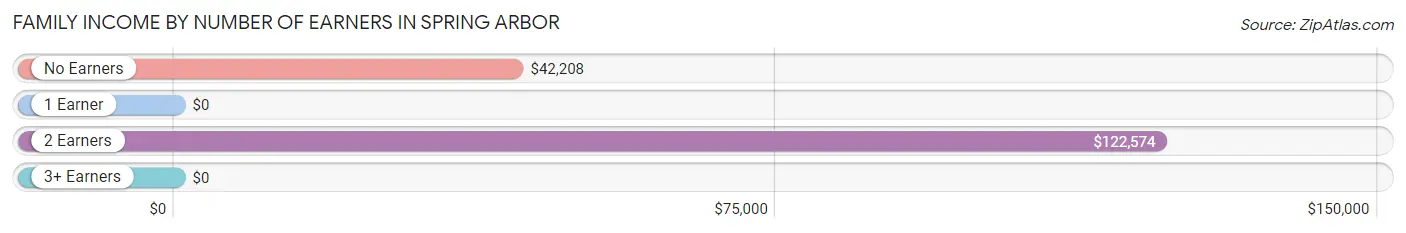
| Number of Earners | # Families | Median Income |
| No Earners | 75 (19.0%) | $42,208 |
| 1 Earner | 78 (19.8%) | $0 |
| 2 Earners | 193 (49.0%) | $122,574 |
| 3+ Earners | 48 (12.2%) | $0 |
| Total | 394 (100.0%) | $91,346 |
Household Income in Spring Arbor
Household Income Brackets in Spring Arbor
With 109 households falling in the category, the $100,000 to $149,999 income range is the most frequent in Spring Arbor, accounting for 22.8% of all households. In contrast, only 9 households (1.9%) fall into the $15,000 to $24,999 income bracket, making it the least populous group.
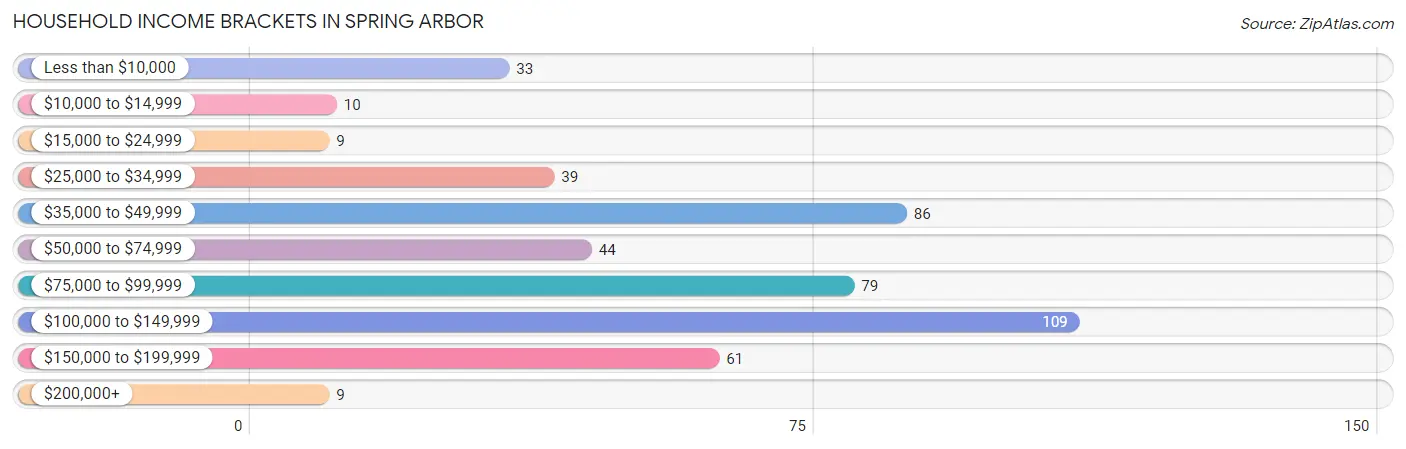
| Income Bracket | # Households | % Households |
| Less than $10,000 | 33 | 6.9% |
| $10,000 to $14,999 | 10 | 2.1% |
| $15,000 to $24,999 | 9 | 1.9% |
| $25,000 to $34,999 | 39 | 8.1% |
| $35,000 to $49,999 | 86 | 18.0% |
| $50,000 to $74,999 | 44 | 9.2% |
| $75,000 to $99,999 | 79 | 16.5% |
| $100,000 to $149,999 | 109 | 22.8% |
| $150,000 to $199,999 | 61 | 12.7% |
| $200,000+ | 9 | 1.9% |
Household Income by Householder Age in Spring Arbor
The median household income in Spring Arbor is $78,393, with the highest median household income of $123,309 found in the 25 to 44 years age bracket for the primary householder. A total of 113 households (23.6%) fall into this category.
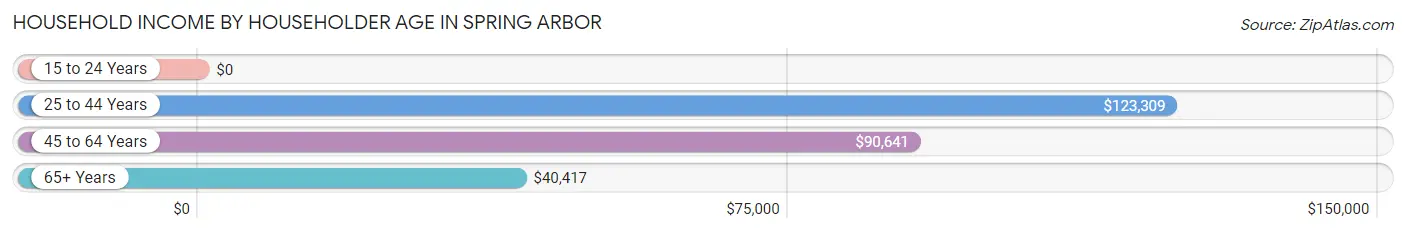
| Income Bracket | # Households | Median Income |
| 15 to 24 Years | 0 (0.0%) | $0 |
| 25 to 44 Years | 113 (23.6%) | $123,309 |
| 45 to 64 Years | 216 (45.1%) | $90,641 |
| 65+ Years | 150 (31.3%) | $40,417 |
| Total | 479 (100.0%) | $78,393 |
Poverty in Spring Arbor
Income Below Poverty by Sex and Age in Spring Arbor
With 0.2% poverty level for males and 8.0% for females among the residents of Spring Arbor, 45 to 54 year old males and 75 year old and over females are the most vulnerable to poverty, with 1 males (1.9%) and 20 females (19.8%) in their respective age groups living below the poverty level.
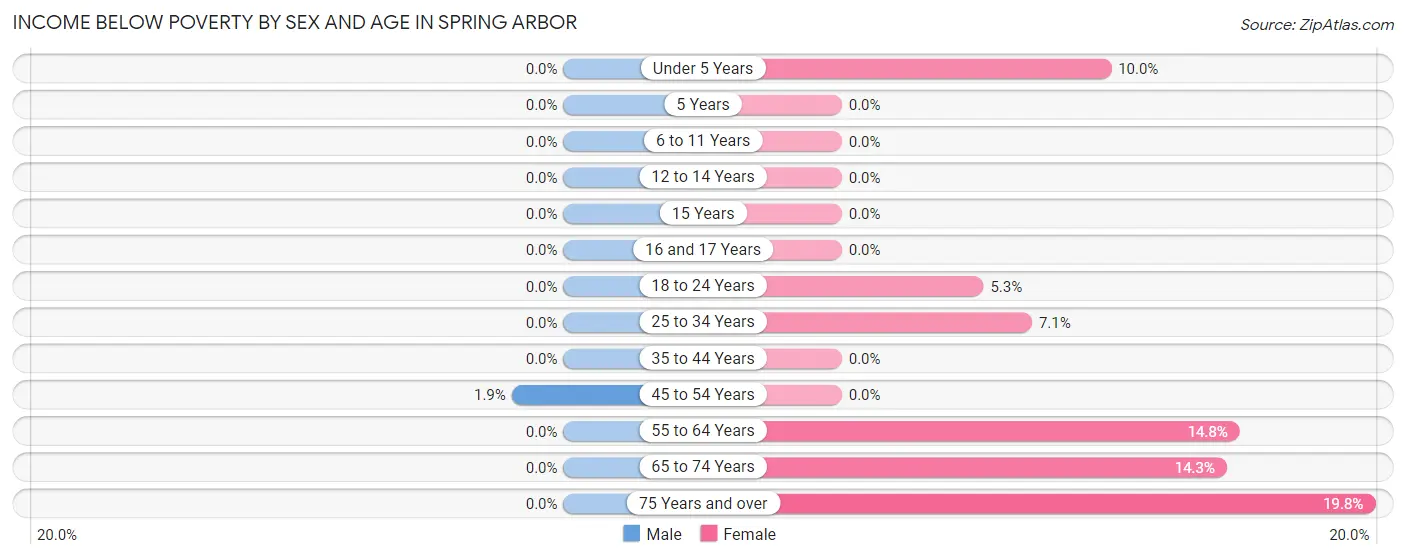
| Age Bracket | Male | Female |
| Under 5 Years | 0 (0.0%) | 6 (10.0%) |
| 5 Years | 0 (0.0%) | 0 (0.0%) |
| 6 to 11 Years | 0 (0.0%) | 0 (0.0%) |
| 12 to 14 Years | 0 (0.0%) | 0 (0.0%) |
| 15 Years | 0 (0.0%) | 0 (0.0%) |
| 16 and 17 Years | 0 (0.0%) | 0 (0.0%) |
| 18 to 24 Years | 0 (0.0%) | 2 (5.3%) |
| 25 to 34 Years | 0 (0.0%) | 6 (7.1%) |
| 35 to 44 Years | 0 (0.0%) | 0 (0.0%) |
| 45 to 54 Years | 1 (1.9%) | 0 (0.0%) |
| 55 to 64 Years | 0 (0.0%) | 13 (14.8%) |
| 65 to 74 Years | 0 (0.0%) | 12 (14.3%) |
| 75 Years and over | 0 (0.0%) | 20 (19.8%) |
| Total | 1 (0.2%) | 59 (8.0%) |
Income Above Poverty by Sex and Age in Spring Arbor
According to the poverty statistics in Spring Arbor, males aged 6 to 11 years and females aged 6 to 11 years are the age groups that are most secure financially, with 100.0% of males and 100.0% of females in these age groups living above the poverty line.
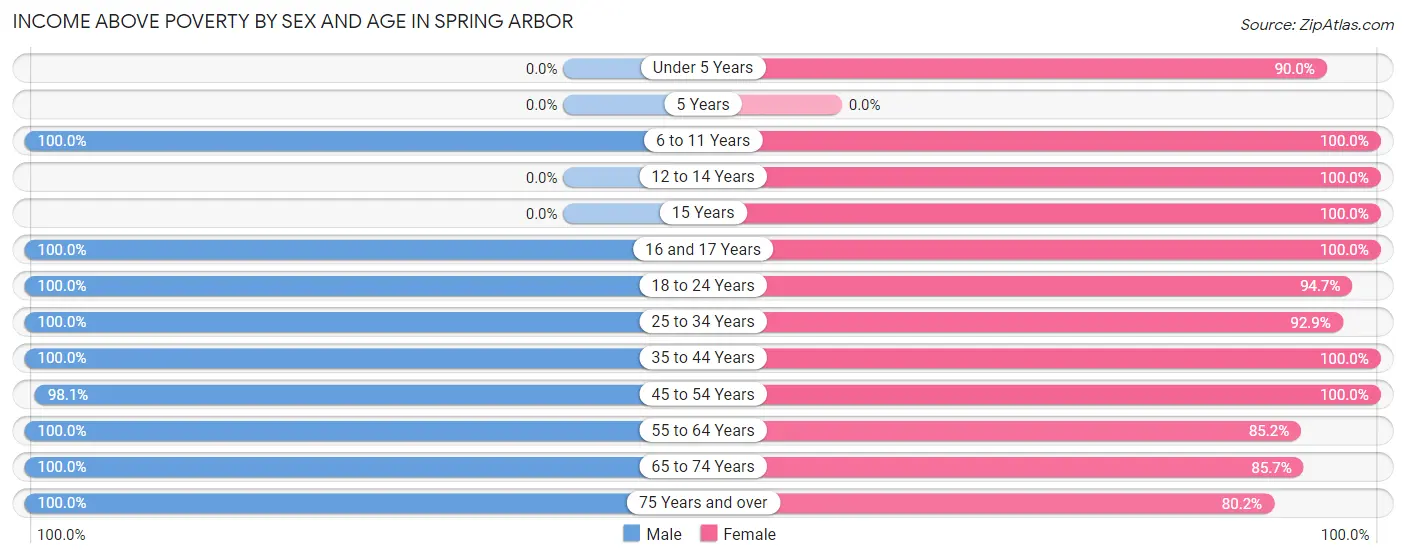
| Age Bracket | Male | Female |
| Under 5 Years | 0 (0.0%) | 54 (90.0%) |
| 5 Years | 0 (0.0%) | 0 (0.0%) |
| 6 to 11 Years | 83 (100.0%) | 77 (100.0%) |
| 12 to 14 Years | 0 (0.0%) | 38 (100.0%) |
| 15 Years | 0 (0.0%) | 8 (100.0%) |
| 16 and 17 Years | 18 (100.0%) | 13 (100.0%) |
| 18 to 24 Years | 33 (100.0%) | 36 (94.7%) |
| 25 to 34 Years | 45 (100.0%) | 79 (92.9%) |
| 35 to 44 Years | 100 (100.0%) | 102 (100.0%) |
| 45 to 54 Years | 51 (98.1%) | 40 (100.0%) |
| 55 to 64 Years | 147 (100.0%) | 75 (85.2%) |
| 65 to 74 Years | 34 (100.0%) | 72 (85.7%) |
| 75 Years and over | 70 (100.0%) | 81 (80.2%) |
| Total | 581 (99.8%) | 675 (92.0%) |
Income Below Poverty Among Married-Couple Families in Spring Arbor
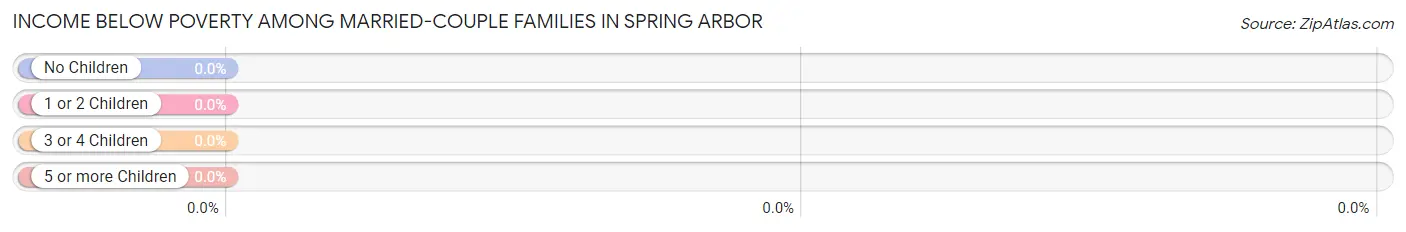
| Children | Above Poverty | Below Poverty |
| No Children | 262 (100.0%) | 0 (0.0%) |
| 1 or 2 Children | 49 (100.0%) | 0 (0.0%) |
| 3 or 4 Children | 28 (100.0%) | 0 (0.0%) |
| 5 or more Children | 0 (0.0%) | 0 (0.0%) |
| Total | 339 (100.0%) | 0 (0.0%) |
Income Below Poverty Among Single-Parent Households in Spring Arbor
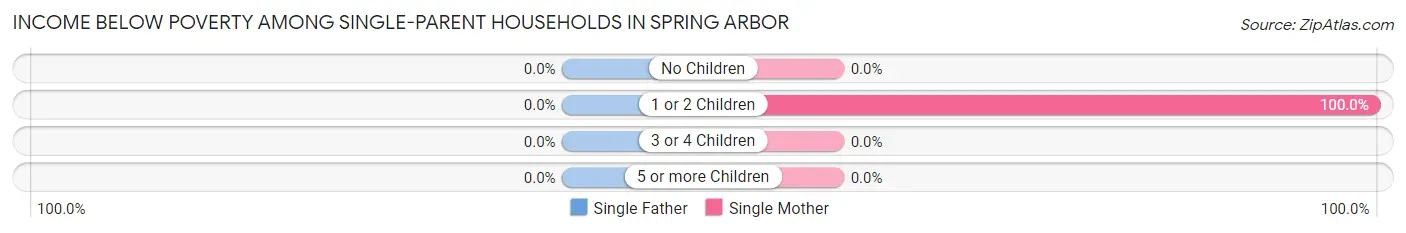
| Children | Single Father | Single Mother |
| No Children | 0 (0.0%) | 0 (0.0%) |
| 1 or 2 Children | 0 (0.0%) | 6 (100.0%) |
| 3 or 4 Children | 0 (0.0%) | 0 (0.0%) |
| 5 or more Children | 0 (0.0%) | 0 (0.0%) |
| Total | 0 (0.0%) | 6 (20.7%) |
Income Below Poverty Among Married-Couple vs Single-Parent Households in Spring Arbor
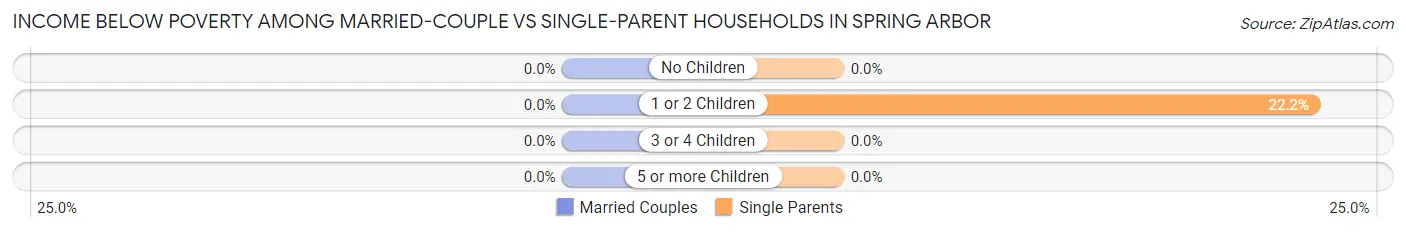
| Children | Married-Couple Families | Single-Parent Households |
| No Children | 0 (0.0%) | 0 (0.0%) |
| 1 or 2 Children | 0 (0.0%) | 6 (22.2%) |
| 3 or 4 Children | 0 (0.0%) | 0 (0.0%) |
| 5 or more Children | 0 (0.0%) | 0 (0.0%) |
| Total | 0 (0.0%) | 6 (10.9%) |
Race in Spring Arbor
The most populous races in Spring Arbor are White / Caucasian (2,041 | 84.7%), Asian (196 | 8.1%), and Two or more Races (98 | 4.1%).
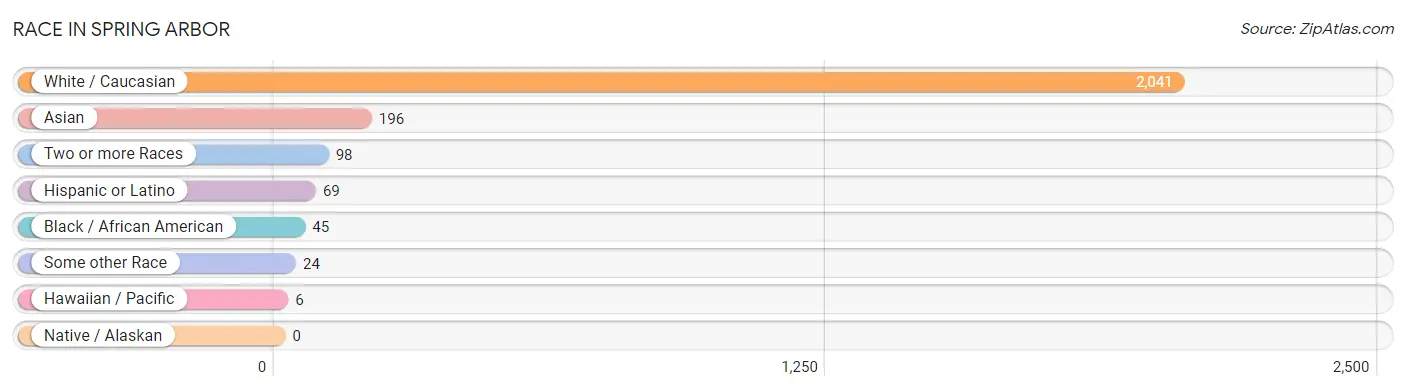
| Race | # Population | % Population |
| Asian | 196 | 8.1% |
| Black / African American | 45 | 1.9% |
| Hawaiian / Pacific | 6 | 0.3% |
| Hispanic or Latino | 69 | 2.9% |
| Native / Alaskan | 0 | 0.0% |
| White / Caucasian | 2,041 | 84.7% |
| Two or more Races | 98 | 4.1% |
| Some other Race | 24 | 1.0% |
| Total | 2,410 | 100.0% |
Ancestry in Spring Arbor
The most populous ancestries reported in Spring Arbor are German (582 | 24.1%), English (453 | 18.8%), Irish (251 | 10.4%), Burmese (198 | 8.2%), and Polish (169 | 7.0%), together accounting for 68.6% of all Spring Arbor residents.
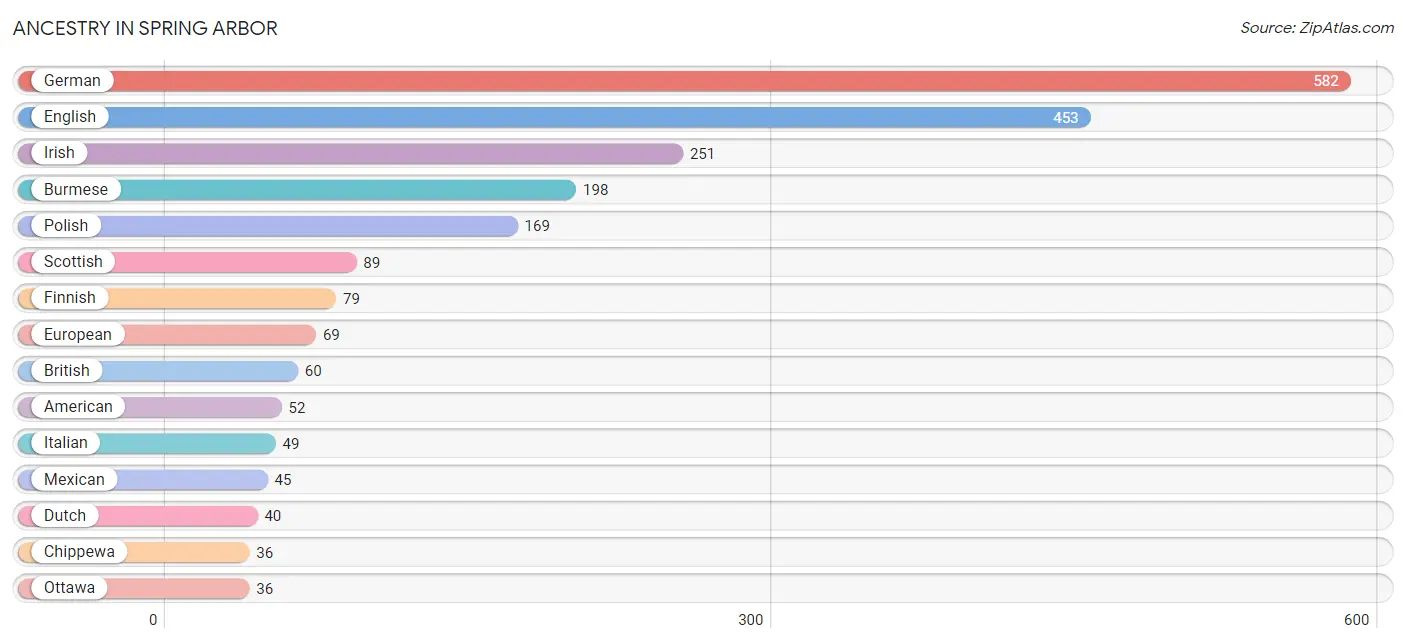
| Ancestry | # Population | % Population |
| American | 52 | 2.2% |
| Arab | 3 | 0.1% |
| Austrian | 1 | 0.0% |
| Bahamian | 10 | 0.4% |
| British | 60 | 2.5% |
| Burmese | 198 | 8.2% |
| Canadian | 12 | 0.5% |
| Chippewa | 36 | 1.5% |
| Choctaw | 3 | 0.1% |
| Colombian | 4 | 0.2% |
| Dutch | 40 | 1.7% |
| English | 453 | 18.8% |
| European | 69 | 2.9% |
| Finnish | 79 | 3.3% |
| French | 23 | 0.9% |
| French Canadian | 10 | 0.4% |
| German | 582 | 24.1% |
| Greek | 14 | 0.6% |
| Haitian | 10 | 0.4% |
| Indian (Asian) | 12 | 0.5% |
| Irish | 251 | 10.4% |
| Italian | 49 | 2.0% |
| Lebanese | 3 | 0.1% |
| Mexican | 45 | 1.9% |
| Ottawa | 36 | 1.5% |
| Polish | 169 | 7.0% |
| Puerto Rican | 5 | 0.2% |
| Romanian | 14 | 0.6% |
| Samoan | 28 | 1.2% |
| Scandinavian | 10 | 0.4% |
| Scotch-Irish | 8 | 0.3% |
| Scottish | 89 | 3.7% |
| South American | 12 | 0.5% |
| Swedish | 27 | 1.1% |
| Swiss | 25 | 1.0% |
| Venezuelan | 8 | 0.3% | View All 36 Rows |
Immigrants in Spring Arbor
The most numerous immigrant groups reported in Spring Arbor came from Asia (152 | 6.3%), Eastern Asia (152 | 6.3%), Korea (140 | 5.8%), Canada (16 | 0.7%), and Europe (14 | 0.6%), together accounting for 19.7% of all Spring Arbor residents.
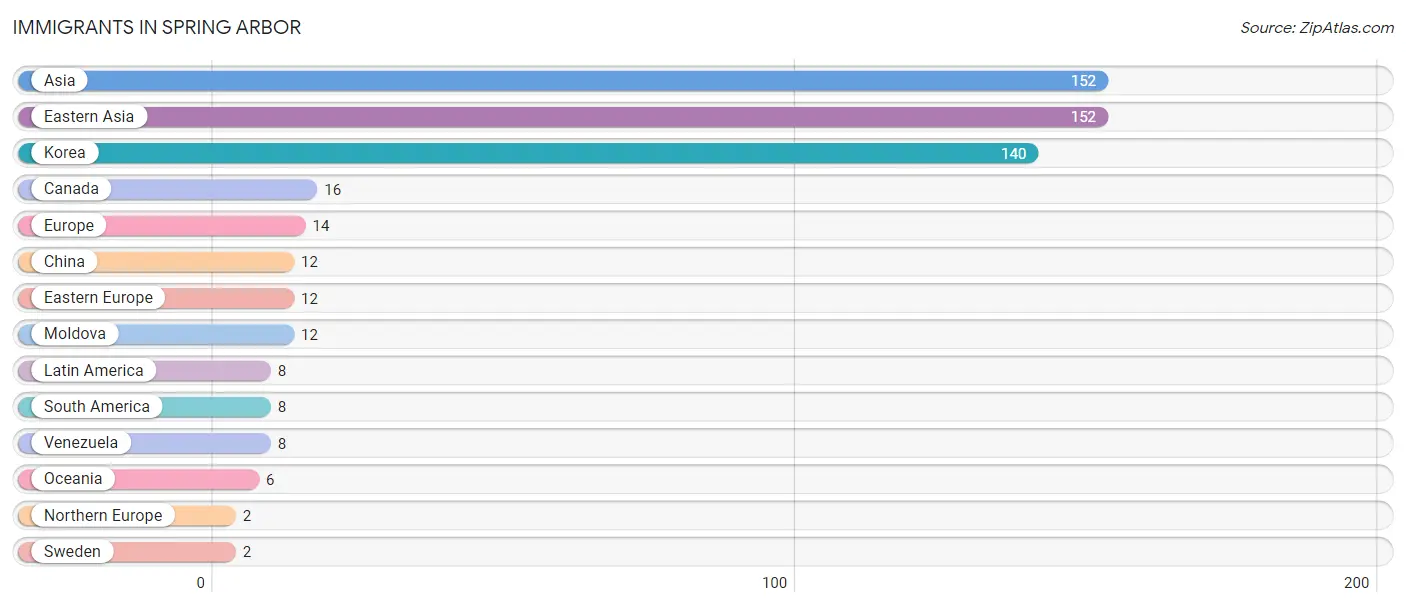
| Immigration Origin | # Population | % Population |
| Asia | 152 | 6.3% |
| Canada | 16 | 0.7% |
| China | 12 | 0.5% |
| Eastern Asia | 152 | 6.3% |
| Eastern Europe | 12 | 0.5% |
| Europe | 14 | 0.6% |
| Korea | 140 | 5.8% |
| Latin America | 8 | 0.3% |
| Moldova | 12 | 0.5% |
| Northern Europe | 2 | 0.1% |
| Oceania | 6 | 0.3% |
| South America | 8 | 0.3% |
| Sweden | 2 | 0.1% |
| Venezuela | 8 | 0.3% | View All 14 Rows |
Sex and Age in Spring Arbor
Sex and Age in Spring Arbor
The most populous age groups in Spring Arbor are 15 to 19 Years (207 | 22.7%) for men and 15 to 19 Years (394 | 26.3%) for women.
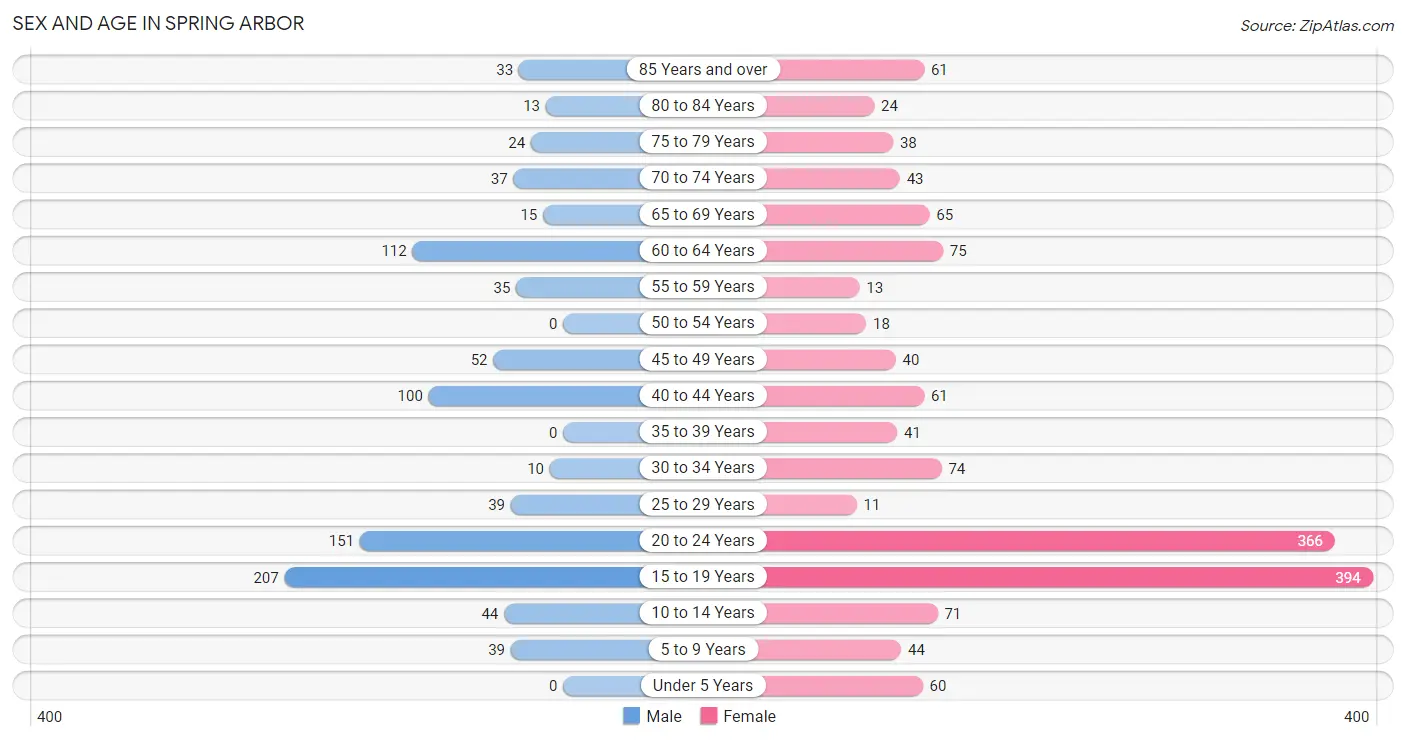
| Age Bracket | Male | Female |
| Under 5 Years | 0 (0.0%) | 60 (4.0%) |
| 5 to 9 Years | 39 (4.3%) | 44 (2.9%) |
| 10 to 14 Years | 44 (4.8%) | 71 (4.7%) |
| 15 to 19 Years | 207 (22.7%) | 394 (26.3%) |
| 20 to 24 Years | 151 (16.6%) | 366 (24.4%) |
| 25 to 29 Years | 39 (4.3%) | 11 (0.7%) |
| 30 to 34 Years | 10 (1.1%) | 74 (4.9%) |
| 35 to 39 Years | 0 (0.0%) | 41 (2.7%) |
| 40 to 44 Years | 100 (11.0%) | 61 (4.1%) |
| 45 to 49 Years | 52 (5.7%) | 40 (2.7%) |
| 50 to 54 Years | 0 (0.0%) | 18 (1.2%) |
| 55 to 59 Years | 35 (3.8%) | 13 (0.9%) |
| 60 to 64 Years | 112 (12.3%) | 75 (5.0%) |
| 65 to 69 Years | 15 (1.7%) | 65 (4.3%) |
| 70 to 74 Years | 37 (4.1%) | 43 (2.9%) |
| 75 to 79 Years | 24 (2.6%) | 38 (2.5%) |
| 80 to 84 Years | 13 (1.4%) | 24 (1.6%) |
| 85 Years and over | 33 (3.6%) | 61 (4.1%) |
| Total | 911 (100.0%) | 1,499 (100.0%) |
Families and Households in Spring Arbor
Median Family Size in Spring Arbor
The median family size in Spring Arbor is 3.09 persons per family, with single male/father families (26 | 6.6%) accounting for the largest median family size of 4.42 persons per family. On the other hand, single female/mother families (29 | 7.4%) represent the smallest median family size with 2.10 persons per family.
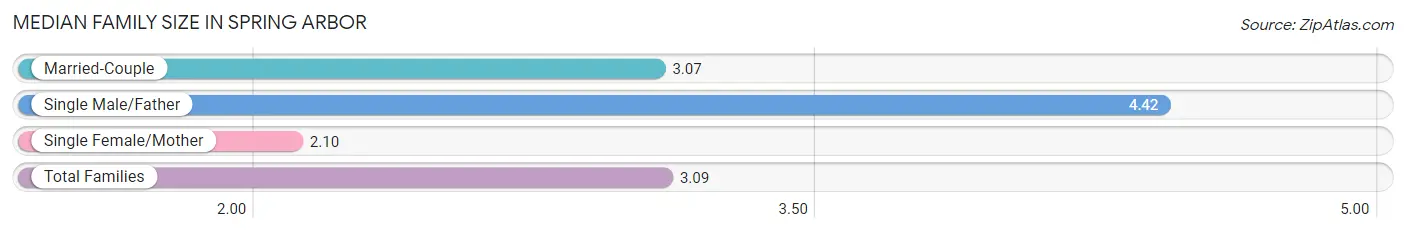
| Family Type | # Families | Family Size |
| Married-Couple | 339 (86.0%) | 3.07 |
| Single Male/Father | 26 (6.6%) | 4.42 |
| Single Female/Mother | 29 (7.4%) | 2.10 |
| Total Families | 394 (100.0%) | 3.09 |
Median Household Size in Spring Arbor
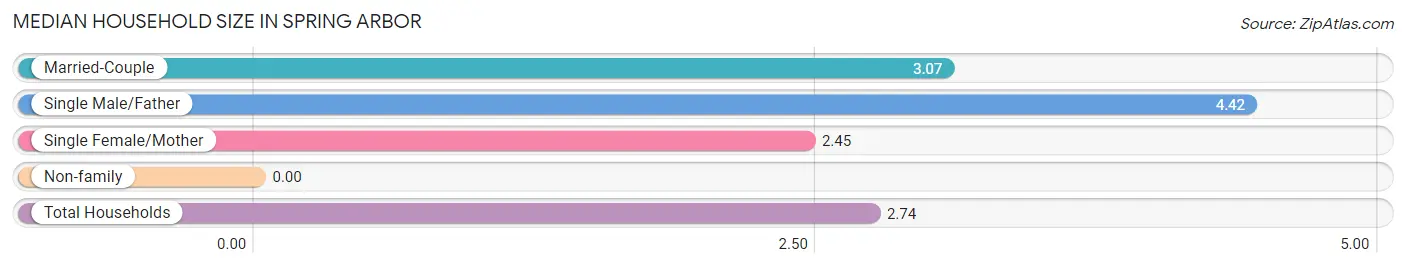
| Household Type | # Households | Household Size |
| Married-Couple | 339 (70.8%) | 3.07 |
| Single Male/Father | 26 (5.4%) | 4.42 |
| Single Female/Mother | 29 (6.0%) | 2.45 |
| Non-family | 85 (17.7%) | - |
| Total Households | 479 (100.0%) | 2.74 |
Household Size by Marriage Status in Spring Arbor
Out of a total of 479 households in Spring Arbor, 394 (82.3%) are family households, while 85 (17.7%) are nonfamily households. The most numerous type of family households are 2-person households, comprising 238, and the most common type of nonfamily households are 1-person households, comprising 85.
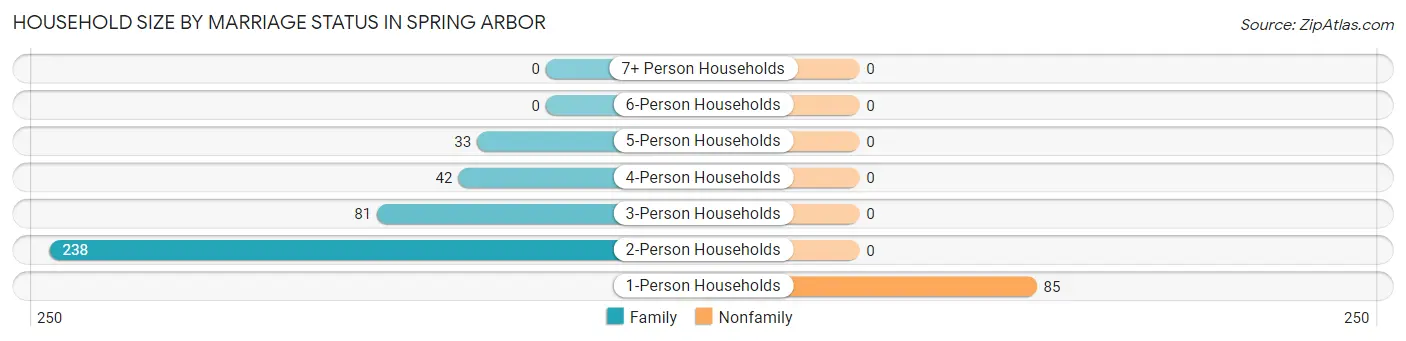
| Household Size | Family Households | Nonfamily Households |
| 1-Person Households | - | 85 (17.7%) |
| 2-Person Households | 238 (49.7%) | 0 (0.0%) |
| 3-Person Households | 81 (16.9%) | 0 (0.0%) |
| 4-Person Households | 42 (8.8%) | 0 (0.0%) |
| 5-Person Households | 33 (6.9%) | 0 (0.0%) |
| 6-Person Households | 0 (0.0%) | 0 (0.0%) |
| 7+ Person Households | 0 (0.0%) | 0 (0.0%) |
| Total | 394 (82.3%) | 85 (17.7%) |
Female Fertility in Spring Arbor
Fertility by Age in Spring Arbor
Average fertility rate in Spring Arbor is 12.0 births per 1,000 women. Women in the age bracket of 20 to 34 years have the highest fertility rate with 27.0 births per 1,000 women. Women in the age bracket of 20 to 34 years acount for 100.0% of all women with births.
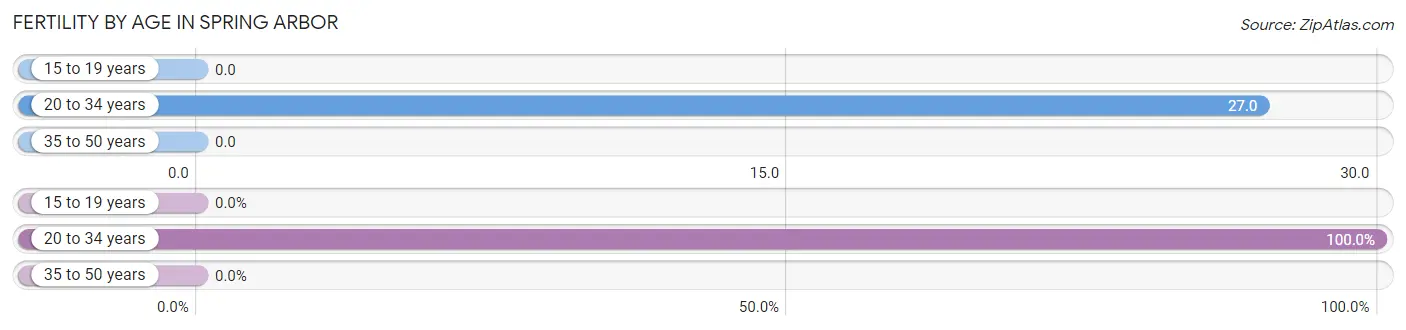
| Age Bracket | Women with Births | Births / 1,000 Women |
| 15 to 19 years | 0 (0.0%) | 0.0 |
| 20 to 34 years | 12 (100.0%) | 27.0 |
| 35 to 50 years | 0 (0.0%) | 0.0 |
| Total | 12 (100.0%) | 12.0 |
Fertility by Age by Marriage Status in Spring Arbor

| Age Bracket | Married | Unmarried |
| 15 to 19 years | 0 (0.0%) | 0 (0.0%) |
| 20 to 34 years | 0 (0.0%) | 12 (100.0%) |
| 35 to 50 years | 0 (0.0%) | 0 (0.0%) |
| Total | 0 (0.0%) | 12 (100.0%) |
Fertility by Education in Spring Arbor
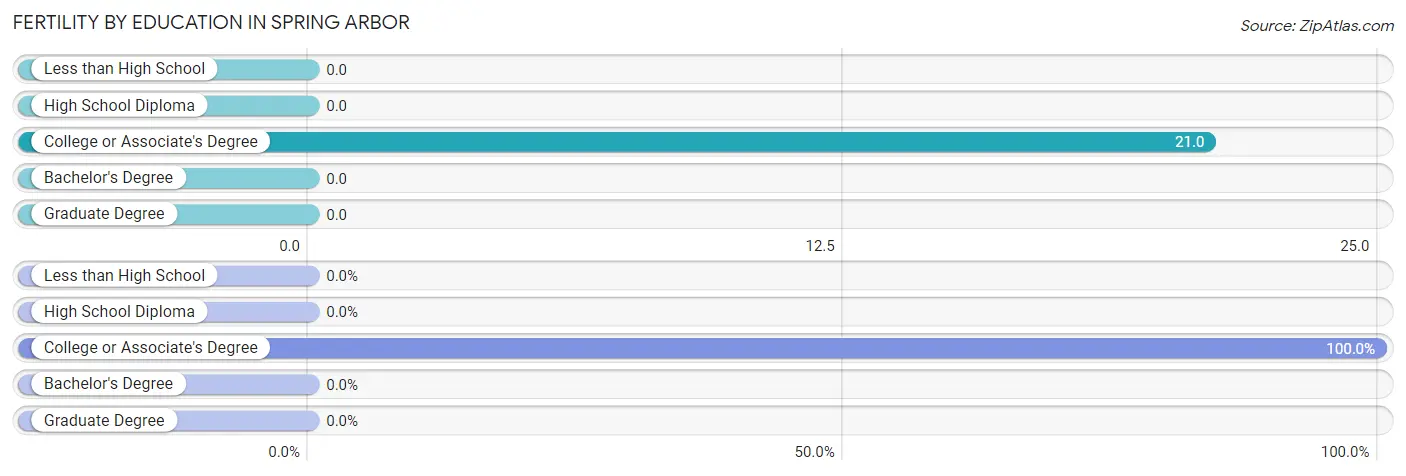
| Educational Attainment | Women with Births | Births / 1,000 Women |
| Less than High School | 0 (0.0%) | 0.0 |
| High School Diploma | 0 (0.0%) | 0.0 |
| College or Associate's Degree | 12 (100.0%) | 21.0 |
| Bachelor's Degree | 0 (0.0%) | 0.0 |
| Graduate Degree | 0 (0.0%) | 0.0 |
| Total | 12 (100.0%) | 12.0 |
Fertility by Education by Marriage Status in Spring Arbor
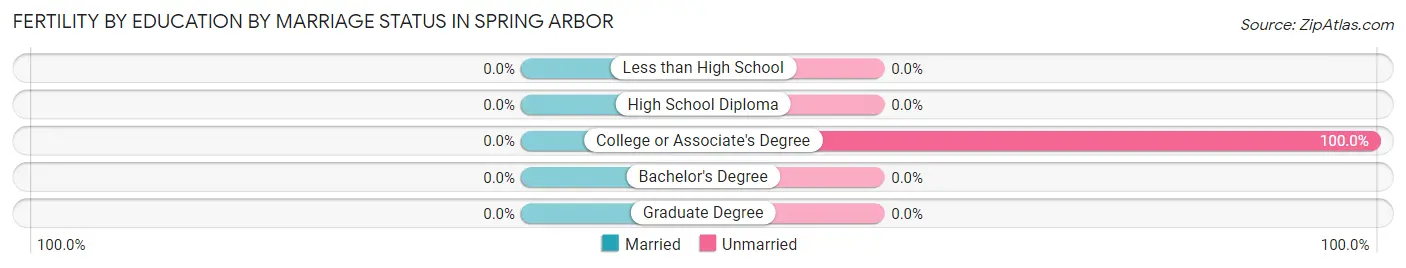
| Educational Attainment | Married | Unmarried |
| Less than High School | 0 (0.0%) | 0 (0.0%) |
| High School Diploma | 0 (0.0%) | 0 (0.0%) |
| College or Associate's Degree | 0 (0.0%) | 12 (100.0%) |
| Bachelor's Degree | 0 (0.0%) | 0 (0.0%) |
| Graduate Degree | 0 (0.0%) | 0 (0.0%) |
| Total | 0 (0.0%) | 12 (100.0%) |
Employment Characteristics in Spring Arbor
Employment by Class of Employer in Spring Arbor
Among the 1,224 employed individuals in Spring Arbor, private company employees (660 | 53.9%), not-for-profit organizations (392 | 32.0%), and state government employees (107 | 8.7%) make up the most common classes of employment.
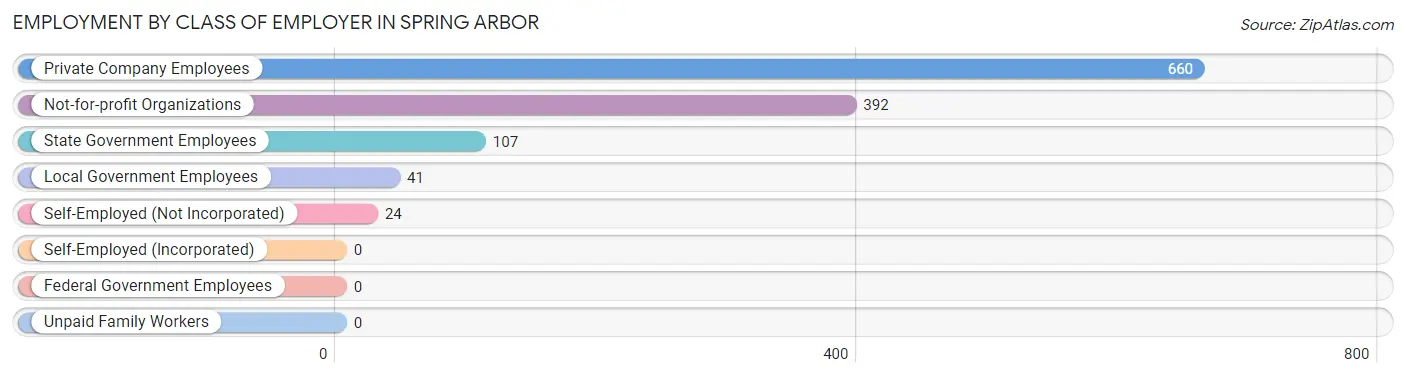
| Employer Class | # Employees | % Employees |
| Private Company Employees | 660 | 53.9% |
| Self-Employed (Incorporated) | 0 | 0.0% |
| Self-Employed (Not Incorporated) | 24 | 2.0% |
| Not-for-profit Organizations | 392 | 32.0% |
| Local Government Employees | 41 | 3.4% |
| State Government Employees | 107 | 8.7% |
| Federal Government Employees | 0 | 0.0% |
| Unpaid Family Workers | 0 | 0.0% |
| Total | 1,224 | 100.0% |
Employment Status by Age in Spring Arbor
According to the labor force statistics for Spring Arbor, out of the total population over 16 years of age (2,144), 62.6% or 1,342 individuals are in the labor force, with 4.1% or 55 of them unemployed. The age group with the highest labor force participation rate is 25 to 29 years, with 100.0% or 50 individuals in the labor force. Within the labor force, the 16 to 19 years age range has the highest percentage of unemployed individuals, with 11.2% or 35 of them being unemployed.
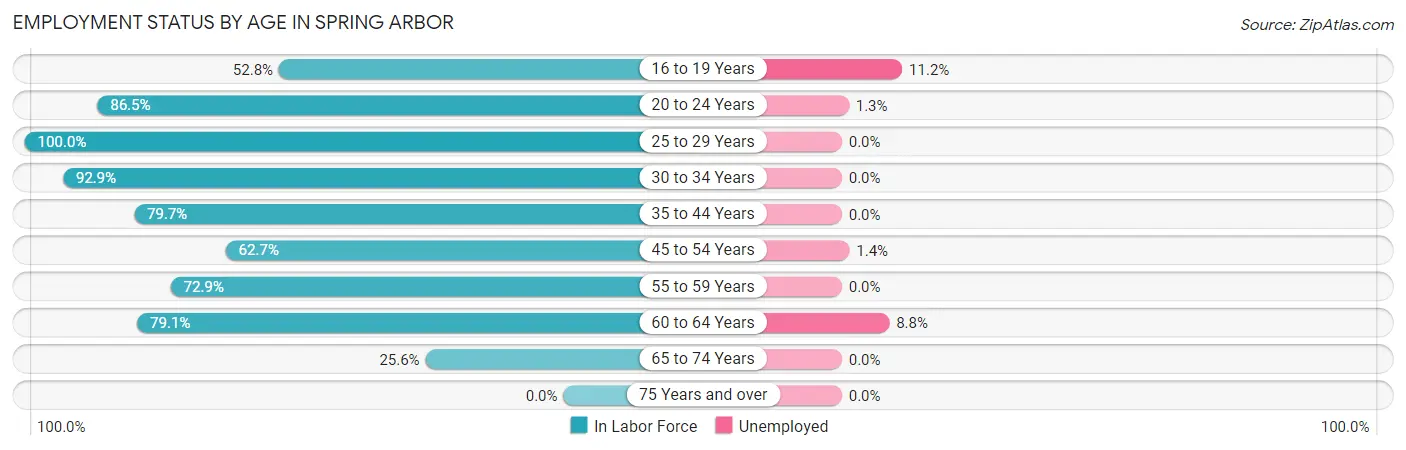
| Age Bracket | In Labor Force | Unemployed |
| 16 to 19 Years | 313 (52.8%) | 35 (11.2%) |
| 20 to 24 Years | 447 (86.5%) | 6 (1.3%) |
| 25 to 29 Years | 50 (100.0%) | 0 (0.0%) |
| 30 to 34 Years | 78 (92.9%) | 0 (0.0%) |
| 35 to 44 Years | 161 (79.7%) | 0 (0.0%) |
| 45 to 54 Years | 69 (62.7%) | 1 (1.4%) |
| 55 to 59 Years | 35 (72.9%) | 0 (0.0%) |
| 60 to 64 Years | 148 (79.1%) | 13 (8.8%) |
| 65 to 74 Years | 41 (25.6%) | 0 (0.0%) |
| 75 Years and over | 0 (0.0%) | 0 (0.0%) |
| Total | 1,342 (62.6%) | 55 (4.1%) |
Employment Status by Educational Attainment in Spring Arbor
According to labor force statistics for Spring Arbor, 79.4% of individuals (541) out of the total population between 25 and 64 years of age (681) are in the labor force, with 2.6% or 14 of them being unemployed. The group with the highest labor force participation rate are those with the educational attainment of bachelor's degree or higher, with 84.2% or 342 individuals in the labor force. Within the labor force, individuals with high school diploma education have the highest percentage of unemployment, with 50.0% or 13 of them being unemployed.
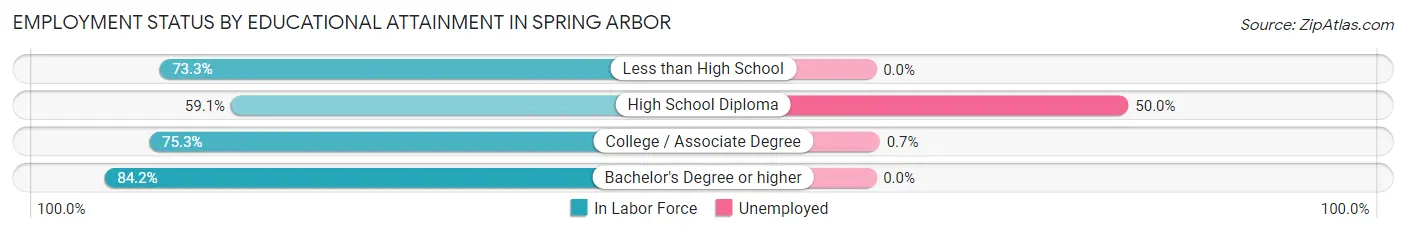
| Educational Attainment | In Labor Force | Unemployed |
| Less than High School | 33 (73.3%) | 0 (0.0%) |
| High School Diploma | 26 (59.1%) | 22 (50.0%) |
| College / Associate Degree | 140 (75.3%) | 1 (0.7%) |
| Bachelor's Degree or higher | 342 (84.2%) | 0 (0.0%) |
| Total | 541 (79.4%) | 18 (2.6%) |
Employment Occupations by Sex in Spring Arbor
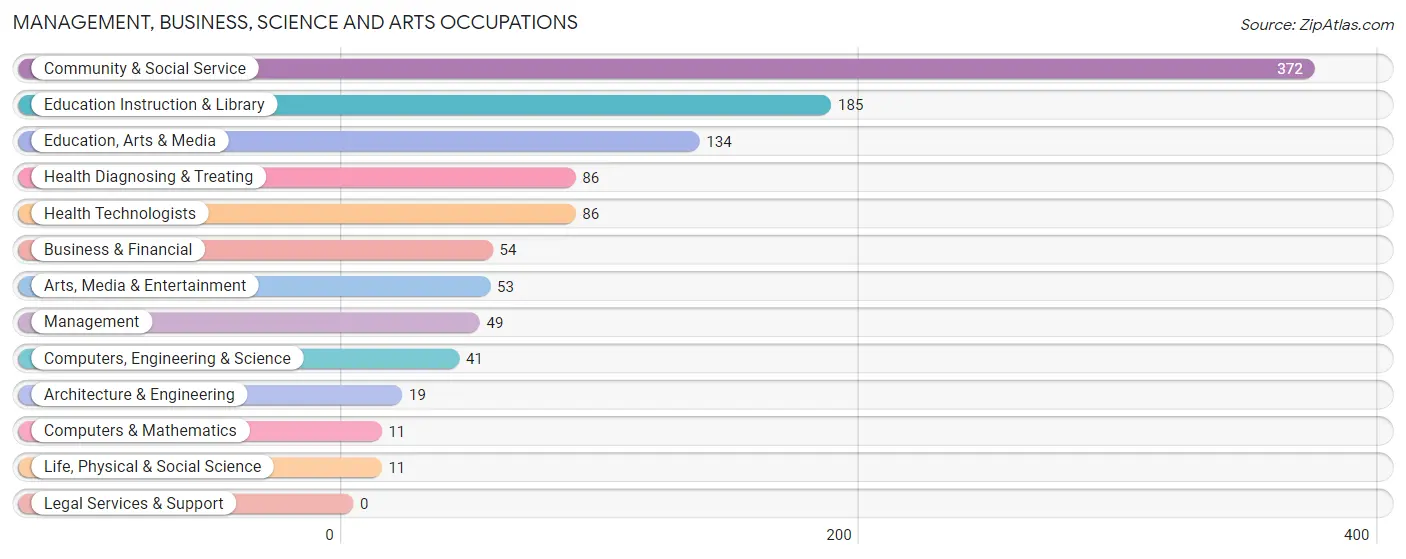
Management, Business, Science and Arts Occupations
The most common Management, Business, Science and Arts occupations in Spring Arbor are Community & Social Service (372 | 28.9%), Education Instruction & Library (185 | 14.4%), Education, Arts & Media (134 | 10.4%), Health Diagnosing & Treating (86 | 6.7%), and Health Technologists (86 | 6.7%).
Management, Business, Science and Arts Occupations by Sex
Within the Management, Business, Science and Arts occupations in Spring Arbor, the most male-oriented occupations are Business & Financial (100.0%), Computers & Mathematics (100.0%), and Architecture & Engineering (57.9%), while the most female-oriented occupations are Life, Physical & Social Science (100.0%), Arts, Media & Entertainment (100.0%), and Community & Social Service (70.2%).
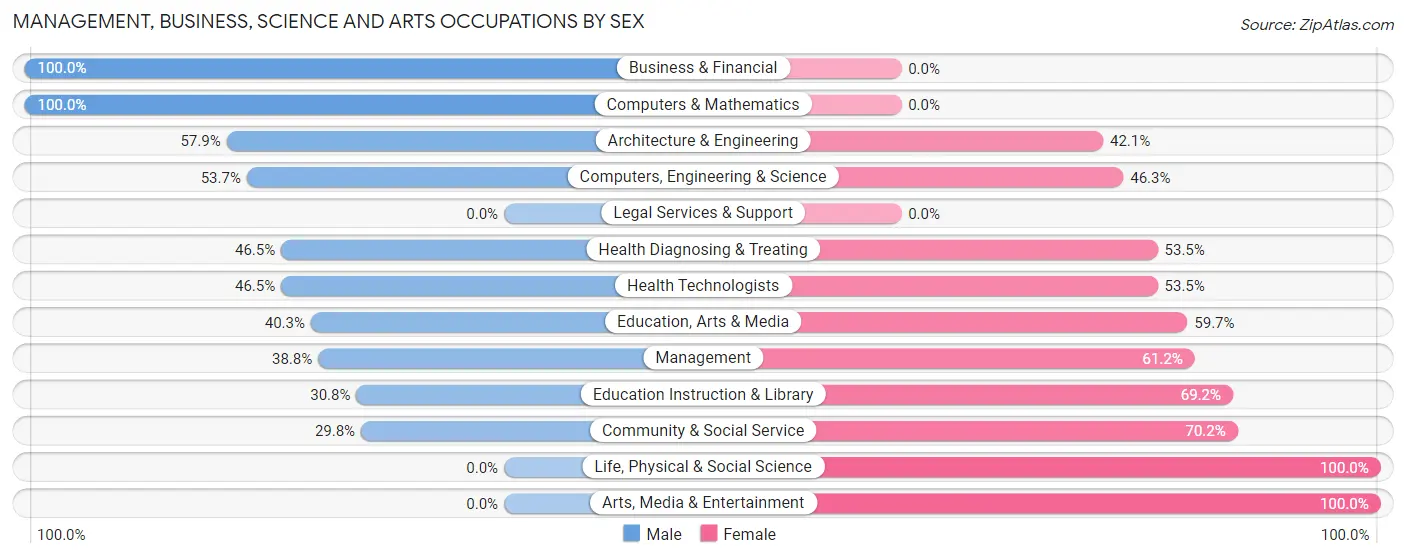
| Occupation | Male | Female |
| Management | 19 (38.8%) | 30 (61.2%) |
| Business & Financial | 54 (100.0%) | 0 (0.0%) |
| Computers, Engineering & Science | 22 (53.7%) | 19 (46.3%) |
| Computers & Mathematics | 11 (100.0%) | 0 (0.0%) |
| Architecture & Engineering | 11 (57.9%) | 8 (42.1%) |
| Life, Physical & Social Science | 0 (0.0%) | 11 (100.0%) |
| Community & Social Service | 111 (29.8%) | 261 (70.2%) |
| Education, Arts & Media | 54 (40.3%) | 80 (59.7%) |
| Legal Services & Support | 0 (0.0%) | 0 (0.0%) |
| Education Instruction & Library | 57 (30.8%) | 128 (69.2%) |
| Arts, Media & Entertainment | 0 (0.0%) | 53 (100.0%) |
| Health Diagnosing & Treating | 40 (46.5%) | 46 (53.5%) |
| Health Technologists | 40 (46.5%) | 46 (53.5%) |
| Total (Category) | 246 (40.9%) | 356 (59.1%) |
| Total (Overall) | 487 (37.8%) | 800 (62.2%) |
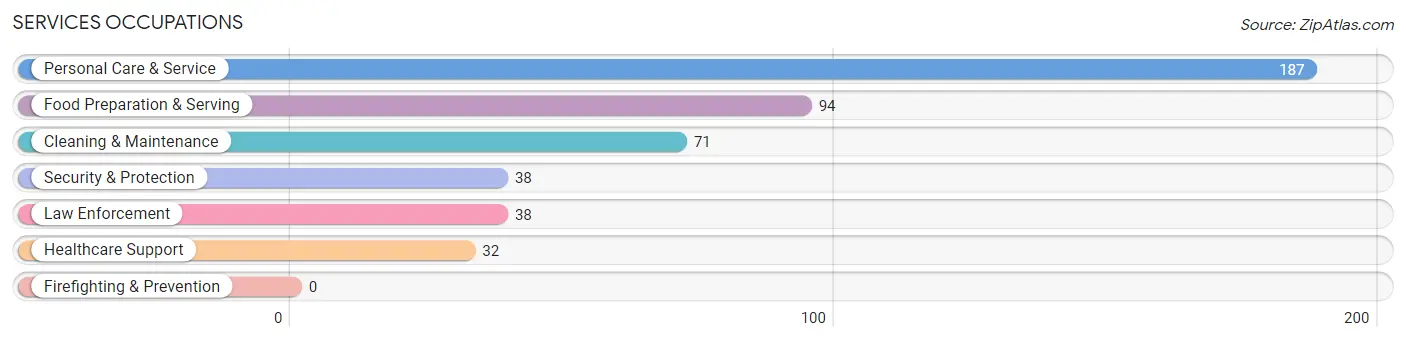
Services Occupations
The most common Services occupations in Spring Arbor are Personal Care & Service (187 | 14.5%), Food Preparation & Serving (94 | 7.3%), Cleaning & Maintenance (71 | 5.5%), Security & Protection (38 | 2.9%), and Law Enforcement (38 | 2.9%).
Services Occupations by Sex
Within the Services occupations in Spring Arbor, the most male-oriented occupations are Security & Protection (100.0%), Law Enforcement (100.0%), and Cleaning & Maintenance (80.3%), while the most female-oriented occupations are Healthcare Support (100.0%), Personal Care & Service (88.8%), and Food Preparation & Serving (78.7%).
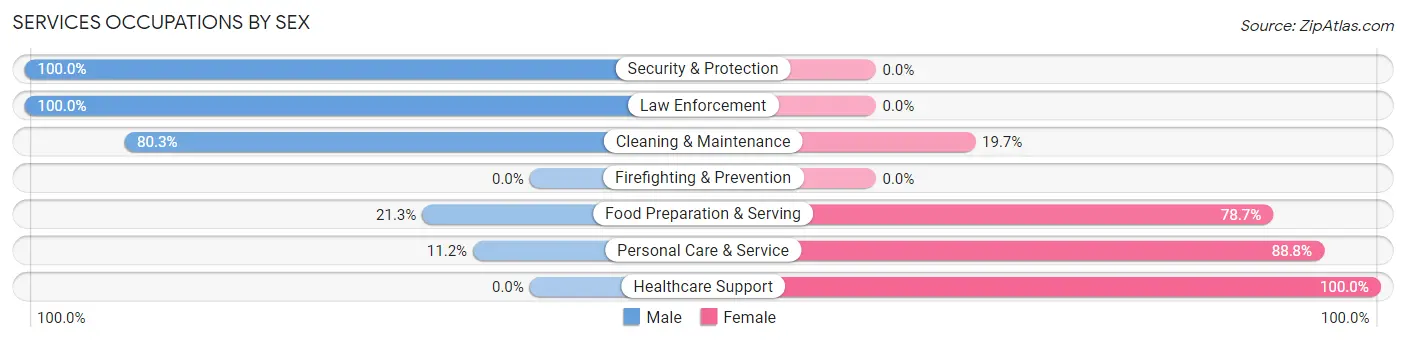
| Occupation | Male | Female |
| Healthcare Support | 0 (0.0%) | 32 (100.0%) |
| Security & Protection | 38 (100.0%) | 0 (0.0%) |
| Firefighting & Prevention | 0 (0.0%) | 0 (0.0%) |
| Law Enforcement | 38 (100.0%) | 0 (0.0%) |
| Food Preparation & Serving | 20 (21.3%) | 74 (78.7%) |
| Cleaning & Maintenance | 57 (80.3%) | 14 (19.7%) |
| Personal Care & Service | 21 (11.2%) | 166 (88.8%) |
| Total (Category) | 136 (32.2%) | 286 (67.8%) |
| Total (Overall) | 487 (37.8%) | 800 (62.2%) |
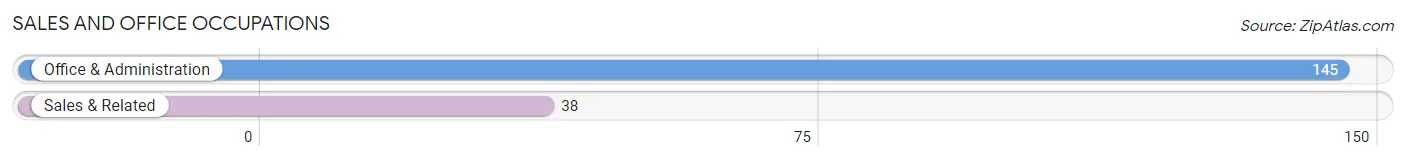
Sales and Office Occupations
The most common Sales and Office occupations in Spring Arbor are Office & Administration (145 | 11.3%), and Sales & Related (38 | 2.9%).
Sales and Office Occupations by Sex
| Occupation | Male | Female |
| Sales & Related | 13 (34.2%) | 25 (65.8%) |
| Office & Administration | 38 (26.2%) | 107 (73.8%) |
| Total (Category) | 51 (27.9%) | 132 (72.1%) |
| Total (Overall) | 487 (37.8%) | 800 (62.2%) |
Natural Resources, Construction and Maintenance Occupations
The most common Natural Resources, Construction and Maintenance occupations in Spring Arbor are , and Installation, Maintenance & Repair (38 | 2.9%).
Natural Resources, Construction and Maintenance Occupations by Sex
| Occupation | Male | Female |
| Farming, Fishing & Forestry | 0 (0.0%) | 0 (0.0%) |
| Construction & Extraction | 0 (0.0%) | 0 (0.0%) |
| Installation, Maintenance & Repair | 38 (100.0%) | 0 (0.0%) |
| Total (Category) | 38 (100.0%) | 0 (0.0%) |
| Total (Overall) | 487 (37.8%) | 800 (62.2%) |
Production, Transportation and Moving Occupations
The most common Production, Transportation and Moving occupations in Spring Arbor are Production (26 | 2.0%), Material Moving (10 | 0.8%), and Transportation (6 | 0.5%).
Production, Transportation and Moving Occupations by Sex
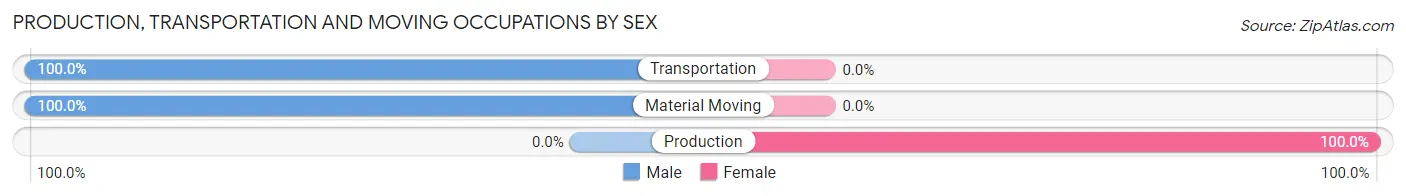
| Occupation | Male | Female |
| Production | 0 (0.0%) | 26 (100.0%) |
| Transportation | 6 (100.0%) | 0 (0.0%) |
| Material Moving | 10 (100.0%) | 0 (0.0%) |
| Total (Category) | 16 (38.1%) | 26 (61.9%) |
| Total (Overall) | 487 (37.8%) | 800 (62.2%) |
Employment Industries by Sex in Spring Arbor
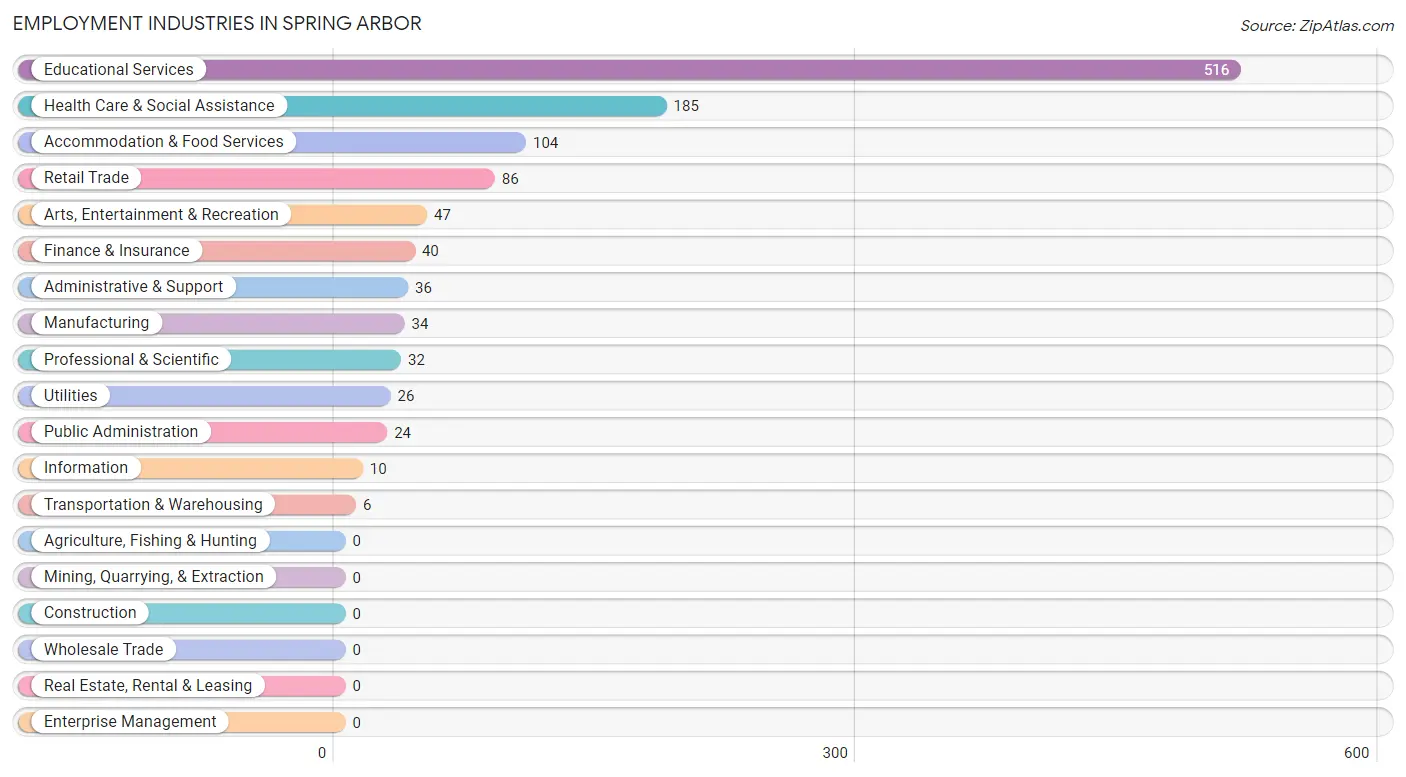
Employment Industries in Spring Arbor
The major employment industries in Spring Arbor include Educational Services (516 | 40.1%), Health Care & Social Assistance (185 | 14.4%), Accommodation & Food Services (104 | 8.1%), Retail Trade (86 | 6.7%), and Arts, Entertainment & Recreation (47 | 3.6%).
Employment Industries by Sex in Spring Arbor
The Spring Arbor industries that see more men than women are Public Administration (100.0%), Administrative & Support (94.4%), and Manufacturing (94.1%), whereas the industries that tend to have a higher number of women are Transportation & Warehousing (100.0%), Utilities (100.0%), and Information (100.0%).
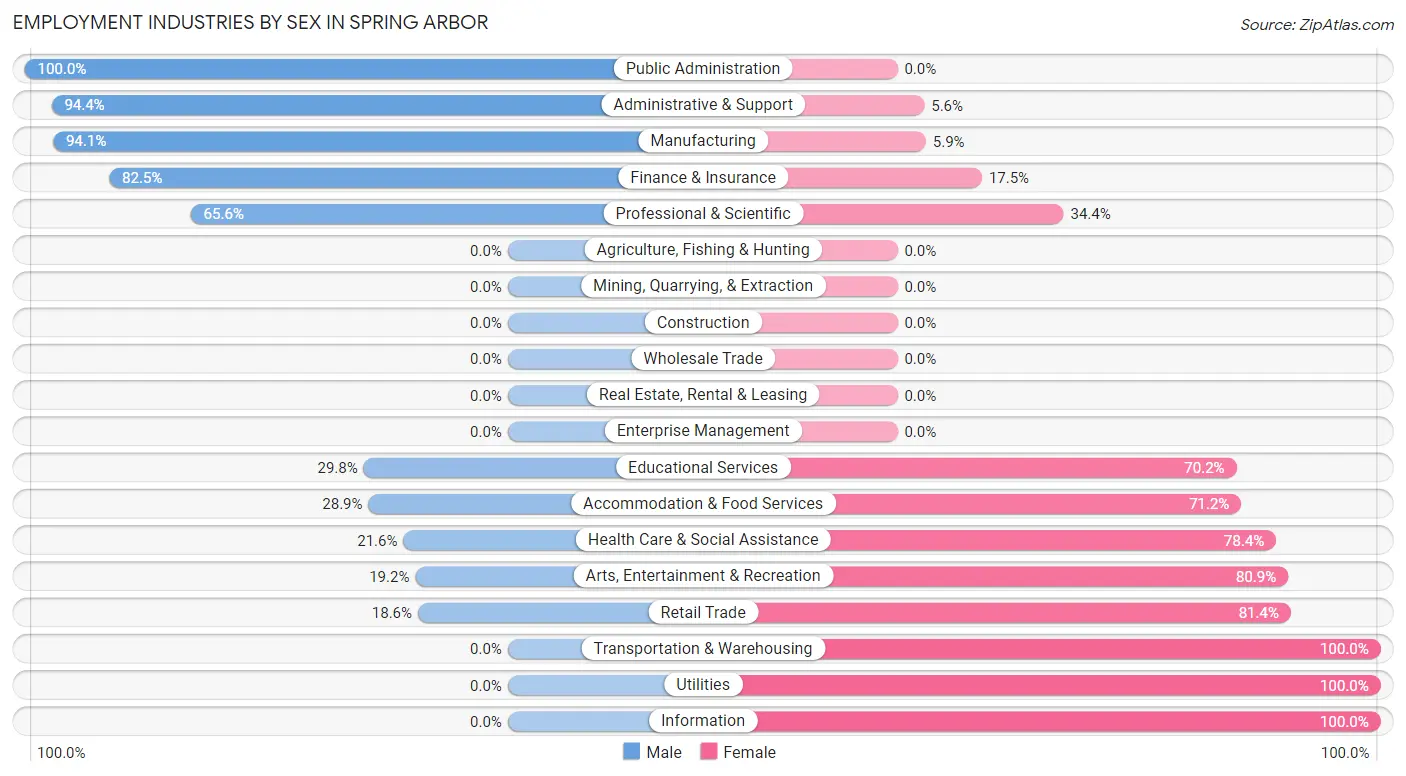
| Industry | Male | Female |
| Agriculture, Fishing & Hunting | 0 (0.0%) | 0 (0.0%) |
| Mining, Quarrying, & Extraction | 0 (0.0%) | 0 (0.0%) |
| Construction | 0 (0.0%) | 0 (0.0%) |
| Manufacturing | 32 (94.1%) | 2 (5.9%) |
| Wholesale Trade | 0 (0.0%) | 0 (0.0%) |
| Retail Trade | 16 (18.6%) | 70 (81.4%) |
| Transportation & Warehousing | 0 (0.0%) | 6 (100.0%) |
| Utilities | 0 (0.0%) | 26 (100.0%) |
| Information | 0 (0.0%) | 10 (100.0%) |
| Finance & Insurance | 33 (82.5%) | 7 (17.5%) |
| Real Estate, Rental & Leasing | 0 (0.0%) | 0 (0.0%) |
| Professional & Scientific | 21 (65.6%) | 11 (34.4%) |
| Enterprise Management | 0 (0.0%) | 0 (0.0%) |
| Administrative & Support | 34 (94.4%) | 2 (5.6%) |
| Educational Services | 154 (29.8%) | 362 (70.2%) |
| Health Care & Social Assistance | 40 (21.6%) | 145 (78.4%) |
| Arts, Entertainment & Recreation | 9 (19.2%) | 38 (80.8%) |
| Accommodation & Food Services | 30 (28.8%) | 74 (71.2%) |
| Public Administration | 24 (100.0%) | 0 (0.0%) |
| Total | 487 (37.8%) | 800 (62.2%) |
Education in Spring Arbor
School Enrollment in Spring Arbor
The most common levels of schooling among the 1,309 students in Spring Arbor are college / undergraduate (1,008 | 77.0%), middle school (99 | 7.6%), and elementary school (85 | 6.5%).
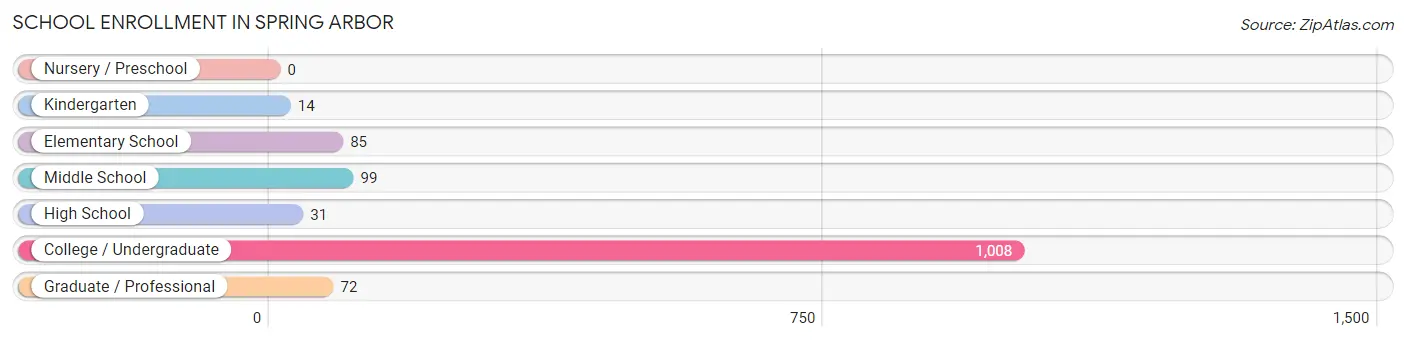
| School Level | # Students | % Students |
| Nursery / Preschool | 0 | 0.0% |
| Kindergarten | 14 | 1.1% |
| Elementary School | 85 | 6.5% |
| Middle School | 99 | 7.6% |
| High School | 31 | 2.4% |
| College / Undergraduate | 1,008 | 77.0% |
| Graduate / Professional | 72 | 5.5% |
| Total | 1,309 | 100.0% |
School Enrollment by Age by Funding Source in Spring Arbor
Out of a total of 1,309 students who are enrolled in schools in Spring Arbor, 874 (66.8%) attend a private institution, while the remaining 435 (33.2%) are enrolled in public schools. The age group of 25 to 34 year olds has the highest likelihood of being enrolled in private schools, with 35 (89.7% in the age bracket) enrolled. Conversely, the age group of 5 to 9 year old has the lowest likelihood of being enrolled in a private school, with 83 (100.0% in the age bracket) attending a public institution.
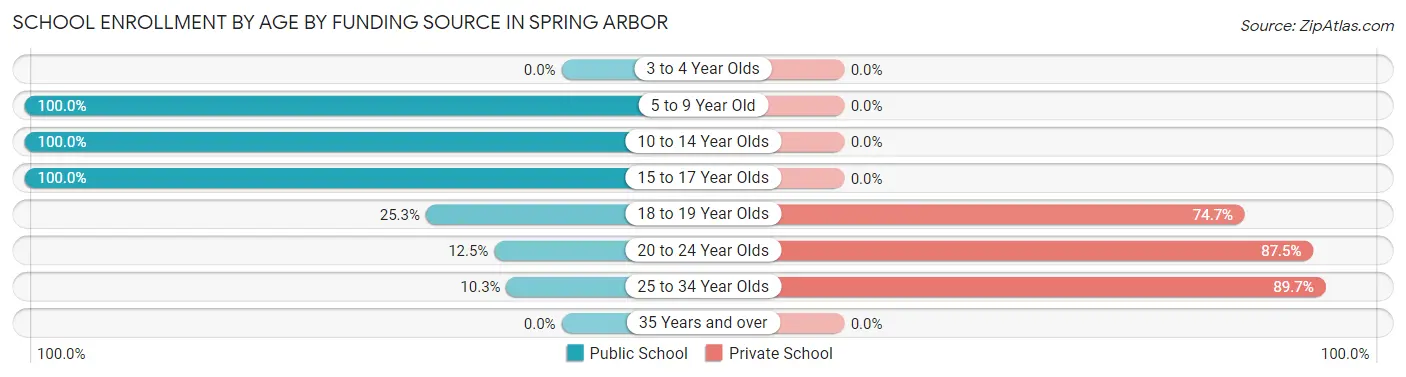
| Age Bracket | Public School | Private School |
| 3 to 4 Year Olds | 0 (0.0%) | 0 (0.0%) |
| 5 to 9 Year Old | 83 (100.0%) | 0 (0.0%) |
| 10 to 14 Year Olds | 115 (100.0%) | 0 (0.0%) |
| 15 to 17 Year Olds | 31 (100.0%) | 0 (0.0%) |
| 18 to 19 Year Olds | 142 (25.3%) | 420 (74.7%) |
| 20 to 24 Year Olds | 60 (12.5%) | 419 (87.5%) |
| 25 to 34 Year Olds | 4 (10.3%) | 35 (89.7%) |
| 35 Years and over | 0 (0.0%) | 0 (0.0%) |
| Total | 435 (33.2%) | 874 (66.8%) |
Educational Attainment by Field of Study in Spring Arbor
Education (96 | 18.2%), science & technology (80 | 15.2%), engineering (73 | 13.9%), business (72 | 13.7%), and visual & performing arts (71 | 13.5%) are the most common fields of study among 527 individuals in Spring Arbor who have obtained a bachelor's degree or higher.
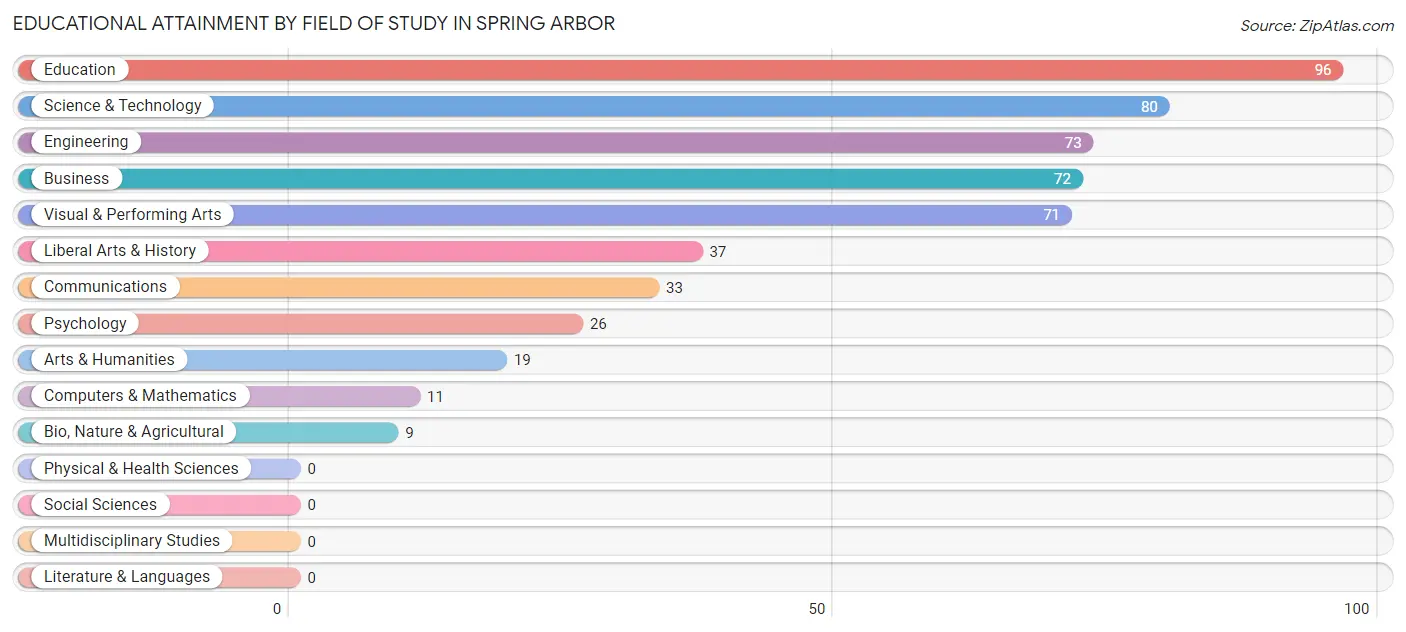
| Field of Study | # Graduates | % Graduates |
| Computers & Mathematics | 11 | 2.1% |
| Bio, Nature & Agricultural | 9 | 1.7% |
| Physical & Health Sciences | 0 | 0.0% |
| Psychology | 26 | 4.9% |
| Social Sciences | 0 | 0.0% |
| Engineering | 73 | 13.9% |
| Multidisciplinary Studies | 0 | 0.0% |
| Science & Technology | 80 | 15.2% |
| Business | 72 | 13.7% |
| Education | 96 | 18.2% |
| Literature & Languages | 0 | 0.0% |
| Liberal Arts & History | 37 | 7.0% |
| Visual & Performing Arts | 71 | 13.5% |
| Communications | 33 | 6.3% |
| Arts & Humanities | 19 | 3.6% |
| Total | 527 | 100.0% |
Transportation & Commute in Spring Arbor
Vehicle Availability by Sex in Spring Arbor
The most prevalent vehicle ownership categories in Spring Arbor are males with 2 vehicles (245, accounting for 73.6%) and females with 2 vehicles (213, making up 82.2%).
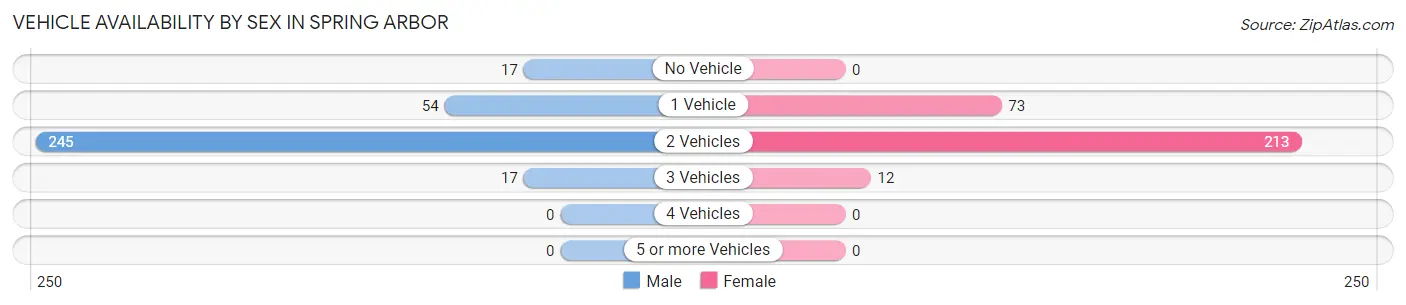
| Vehicles Available | Male | Female |
| No Vehicle | 17 (5.1%) | 0 (0.0%) |
| 1 Vehicle | 54 (16.2%) | 73 (24.5%) |
| 2 Vehicles | 245 (73.6%) | 213 (71.5%) |
| 3 Vehicles | 17 (5.1%) | 12 (4.0%) |
| 4 Vehicles | 0 (0.0%) | 0 (0.0%) |
| 5 or more Vehicles | 0 (0.0%) | 0 (0.0%) |
| Total | 333 (100.0%) | 298 (100.0%) |
Commute Time in Spring Arbor
The most frequently occuring commute durations in Spring Arbor are 5 to 9 minutes (281 commuters, 27.3%), 15 to 19 minutes (163 commuters, 15.9%), and 10 to 14 minutes (134 commuters, 13.0%).
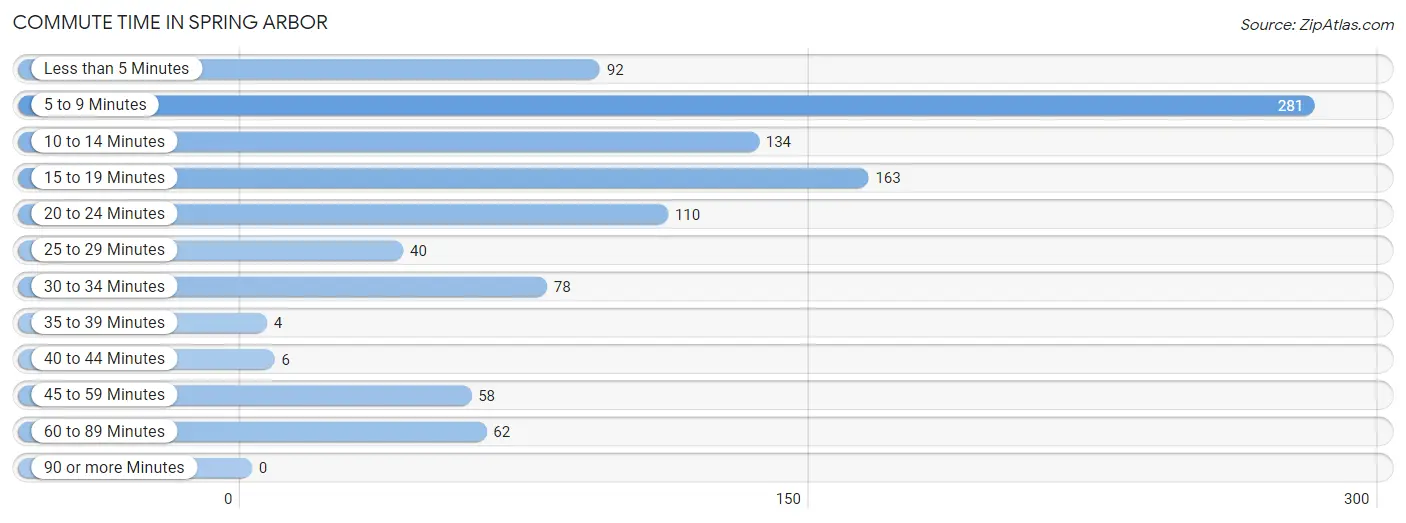
| Commute Time | # Commuters | % Commuters |
| Less than 5 Minutes | 92 | 8.9% |
| 5 to 9 Minutes | 281 | 27.3% |
| 10 to 14 Minutes | 134 | 13.0% |
| 15 to 19 Minutes | 163 | 15.9% |
| 20 to 24 Minutes | 110 | 10.7% |
| 25 to 29 Minutes | 40 | 3.9% |
| 30 to 34 Minutes | 78 | 7.6% |
| 35 to 39 Minutes | 4 | 0.4% |
| 40 to 44 Minutes | 6 | 0.6% |
| 45 to 59 Minutes | 58 | 5.6% |
| 60 to 89 Minutes | 62 | 6.0% |
| 90 or more Minutes | 0 | 0.0% |
Commute Time by Sex in Spring Arbor
The most common commute times in Spring Arbor are 15 to 19 minutes (122 commuters, 28.8%) for males and 5 to 9 minutes (199 commuters, 33.0%) for females.
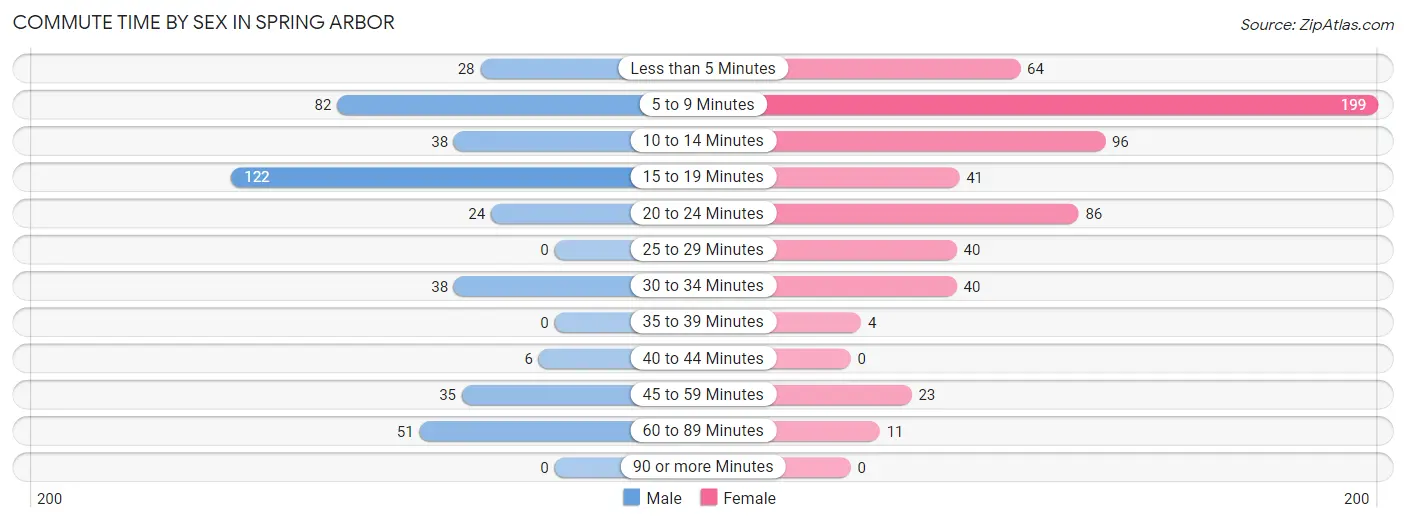
| Commute Time | Male | Female |
| Less than 5 Minutes | 28 (6.6%) | 64 (10.6%) |
| 5 to 9 Minutes | 82 (19.3%) | 199 (33.0%) |
| 10 to 14 Minutes | 38 (9.0%) | 96 (15.9%) |
| 15 to 19 Minutes | 122 (28.8%) | 41 (6.8%) |
| 20 to 24 Minutes | 24 (5.7%) | 86 (14.2%) |
| 25 to 29 Minutes | 0 (0.0%) | 40 (6.6%) |
| 30 to 34 Minutes | 38 (9.0%) | 40 (6.6%) |
| 35 to 39 Minutes | 0 (0.0%) | 4 (0.7%) |
| 40 to 44 Minutes | 6 (1.4%) | 0 (0.0%) |
| 45 to 59 Minutes | 35 (8.3%) | 23 (3.8%) |
| 60 to 89 Minutes | 51 (12.0%) | 11 (1.8%) |
| 90 or more Minutes | 0 (0.0%) | 0 (0.0%) |
Time of Departure to Work by Sex in Spring Arbor
The most frequent times of departure to work in Spring Arbor are 7:30 AM to 7:59 AM (160, 37.7%) for males and 7:30 AM to 7:59 AM (131, 21.7%) for females.
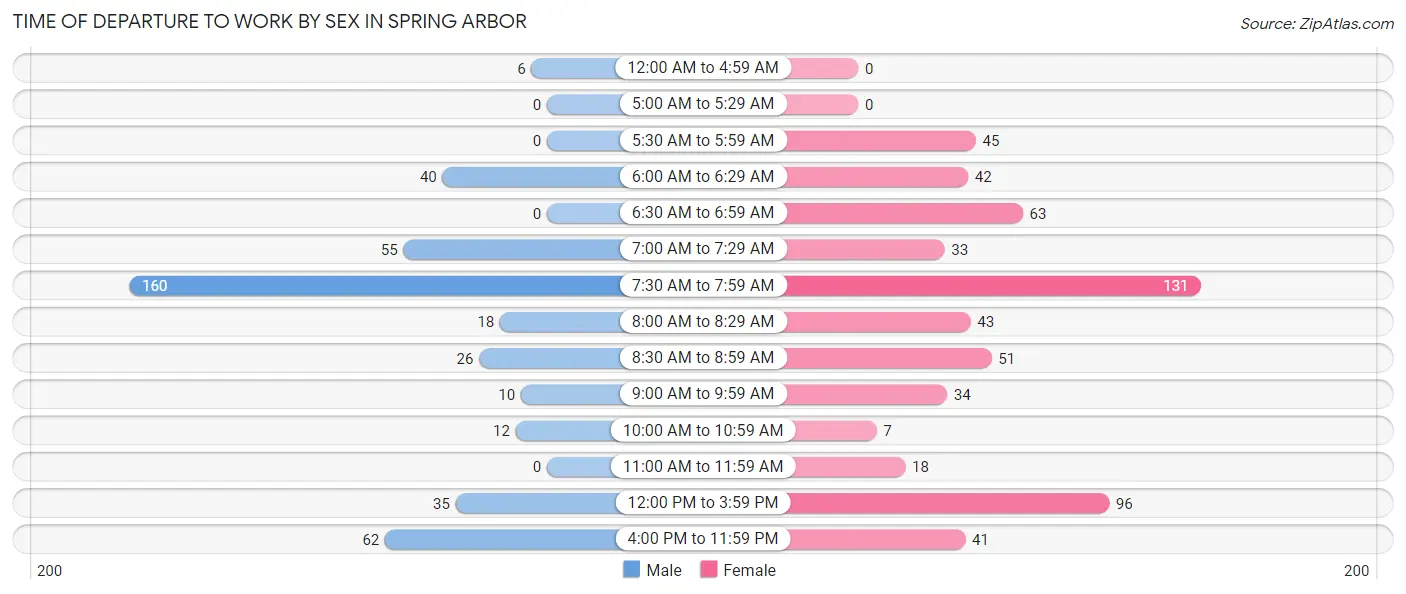
| Time of Departure | Male | Female |
| 12:00 AM to 4:59 AM | 6 (1.4%) | 0 (0.0%) |
| 5:00 AM to 5:29 AM | 0 (0.0%) | 0 (0.0%) |
| 5:30 AM to 5:59 AM | 0 (0.0%) | 45 (7.4%) |
| 6:00 AM to 6:29 AM | 40 (9.4%) | 42 (7.0%) |
| 6:30 AM to 6:59 AM | 0 (0.0%) | 63 (10.4%) |
| 7:00 AM to 7:29 AM | 55 (13.0%) | 33 (5.5%) |
| 7:30 AM to 7:59 AM | 160 (37.7%) | 131 (21.7%) |
| 8:00 AM to 8:29 AM | 18 (4.3%) | 43 (7.1%) |
| 8:30 AM to 8:59 AM | 26 (6.1%) | 51 (8.4%) |
| 9:00 AM to 9:59 AM | 10 (2.4%) | 34 (5.6%) |
| 10:00 AM to 10:59 AM | 12 (2.8%) | 7 (1.2%) |
| 11:00 AM to 11:59 AM | 0 (0.0%) | 18 (3.0%) |
| 12:00 PM to 3:59 PM | 35 (8.3%) | 96 (15.9%) |
| 4:00 PM to 11:59 PM | 62 (14.6%) | 41 (6.8%) |
| Total | 424 (100.0%) | 604 (100.0%) |
Housing Occupancy in Spring Arbor
Occupancy by Ownership in Spring Arbor
Of the total 479 dwellings in Spring Arbor, owner-occupied units account for 302 (63.0%), while renter-occupied units make up 177 (36.9%).
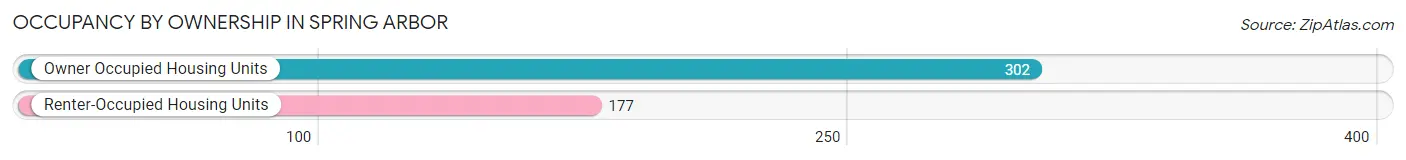
| Occupancy | # Housing Units | % Housing Units |
| Owner Occupied Housing Units | 302 | 63.0% |
| Renter-Occupied Housing Units | 177 | 36.9% |
| Total Occupied Housing Units | 479 | 100.0% |
Occupancy by Household Size in Spring Arbor
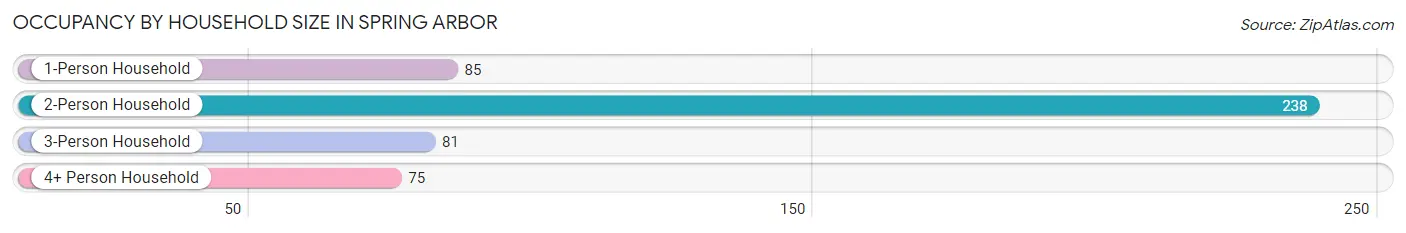
| Household Size | # Housing Units | % Housing Units |
| 1-Person Household | 85 | 17.7% |
| 2-Person Household | 238 | 49.7% |
| 3-Person Household | 81 | 16.9% |
| 4+ Person Household | 75 | 15.7% |
| Total Housing Units | 479 | 100.0% |
Occupancy by Ownership by Household Size in Spring Arbor
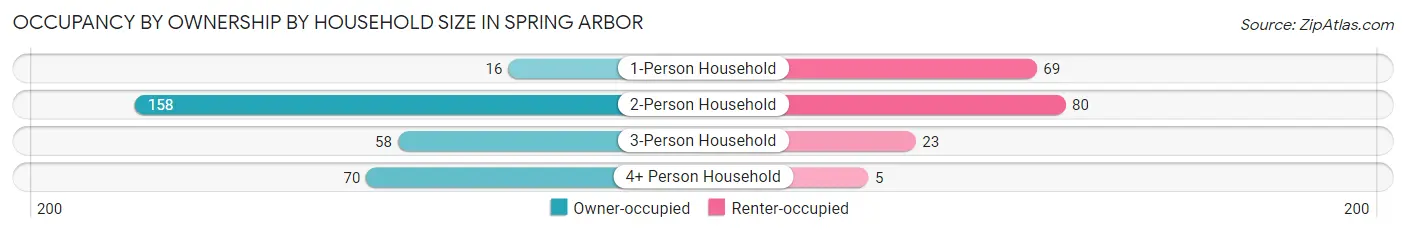
| Household Size | Owner-occupied | Renter-occupied |
| 1-Person Household | 16 (18.8%) | 69 (81.2%) |
| 2-Person Household | 158 (66.4%) | 80 (33.6%) |
| 3-Person Household | 58 (71.6%) | 23 (28.4%) |
| 4+ Person Household | 70 (93.3%) | 5 (6.7%) |
| Total Housing Units | 302 (63.0%) | 177 (36.9%) |
Occupancy by Educational Attainment in Spring Arbor
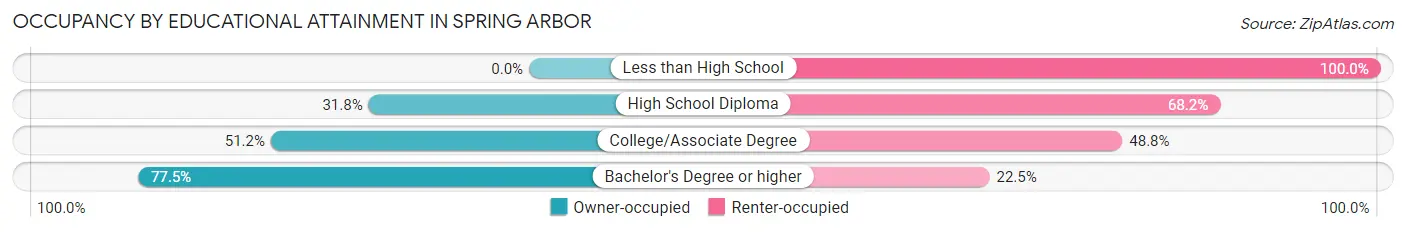
| Household Size | Owner-occupied | Renter-occupied |
| Less than High School | 0 (0.0%) | 9 (100.0%) |
| High School Diploma | 28 (31.8%) | 60 (68.2%) |
| College/Associate Degree | 43 (51.2%) | 41 (48.8%) |
| Bachelor's Degree or higher | 231 (77.5%) | 67 (22.5%) |
Occupancy by Age of Householder in Spring Arbor
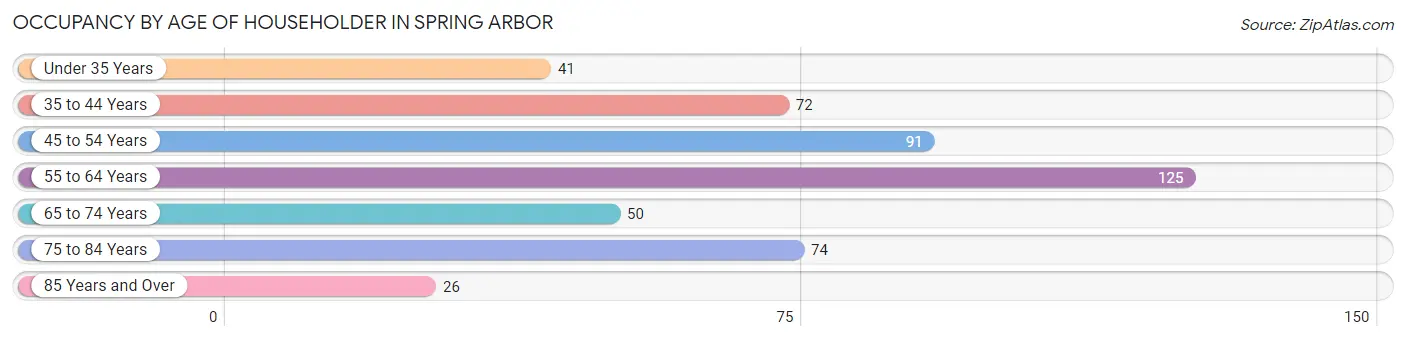
| Age Bracket | # Households | % Households |
| Under 35 Years | 41 | 8.6% |
| 35 to 44 Years | 72 | 15.0% |
| 45 to 54 Years | 91 | 19.0% |
| 55 to 64 Years | 125 | 26.1% |
| 65 to 74 Years | 50 | 10.4% |
| 75 to 84 Years | 74 | 15.4% |
| 85 Years and Over | 26 | 5.4% |
| Total | 479 | 100.0% |
Housing Finances in Spring Arbor
Median Income by Occupancy in Spring Arbor
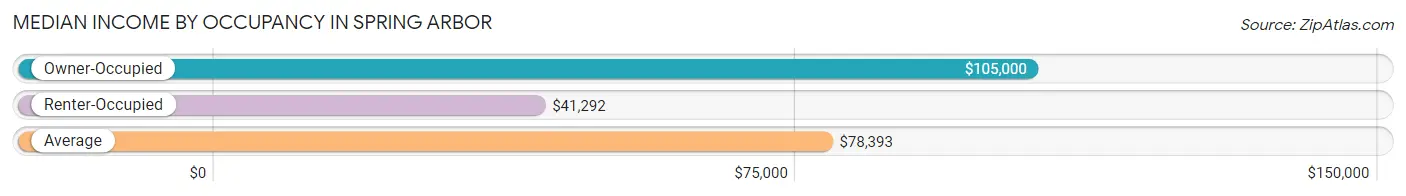
| Occupancy Type | # Households | Median Income |
| Owner-Occupied | 302 (63.0%) | $105,000 |
| Renter-Occupied | 177 (36.9%) | $41,292 |
| Average | 479 (100.0%) | $78,393 |
Occupancy by Householder Income Bracket in Spring Arbor
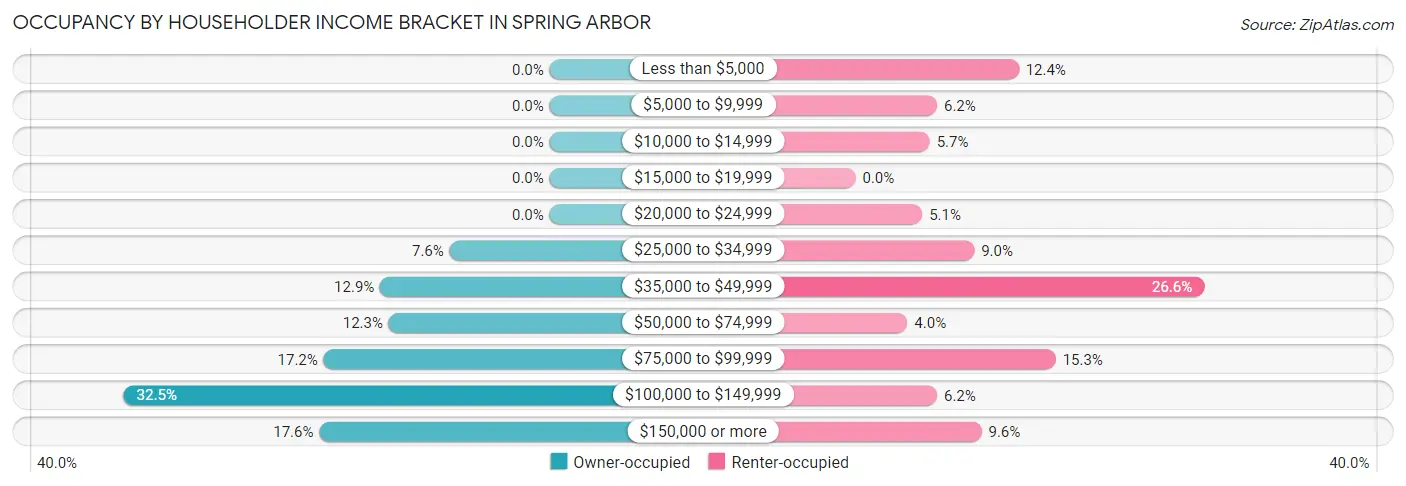
| Income Bracket | Owner-occupied | Renter-occupied |
| Less than $5,000 | 0 (0.0%) | 22 (12.4%) |
| $5,000 to $9,999 | 0 (0.0%) | 11 (6.2%) |
| $10,000 to $14,999 | 0 (0.0%) | 10 (5.7%) |
| $15,000 to $19,999 | 0 (0.0%) | 0 (0.0%) |
| $20,000 to $24,999 | 0 (0.0%) | 9 (5.1%) |
| $25,000 to $34,999 | 23 (7.6%) | 16 (9.0%) |
| $35,000 to $49,999 | 39 (12.9%) | 47 (26.6%) |
| $50,000 to $74,999 | 37 (12.2%) | 7 (4.0%) |
| $75,000 to $99,999 | 52 (17.2%) | 27 (15.2%) |
| $100,000 to $149,999 | 98 (32.5%) | 11 (6.2%) |
| $150,000 or more | 53 (17.5%) | 17 (9.6%) |
| Total | 302 (100.0%) | 177 (100.0%) |
Monthly Housing Cost Tiers in Spring Arbor
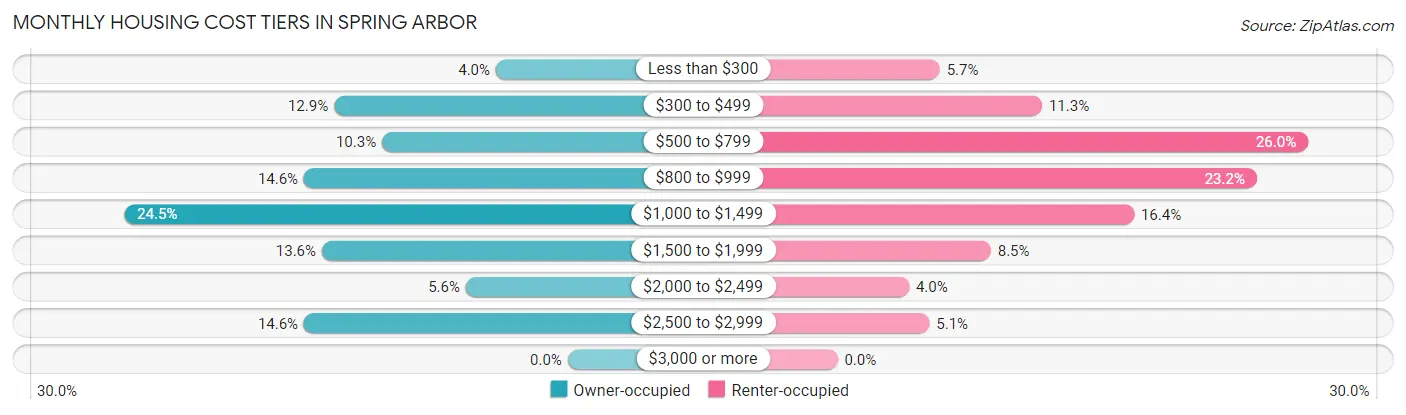
| Monthly Cost | Owner-occupied | Renter-occupied |
| Less than $300 | 12 (4.0%) | 10 (5.7%) |
| $300 to $499 | 39 (12.9%) | 20 (11.3%) |
| $500 to $799 | 31 (10.3%) | 46 (26.0%) |
| $800 to $999 | 44 (14.6%) | 41 (23.2%) |
| $1,000 to $1,499 | 74 (24.5%) | 29 (16.4%) |
| $1,500 to $1,999 | 41 (13.6%) | 15 (8.5%) |
| $2,000 to $2,499 | 17 (5.6%) | 7 (4.0%) |
| $2,500 to $2,999 | 44 (14.6%) | 9 (5.1%) |
| $3,000 or more | 0 (0.0%) | 0 (0.0%) |
| Total | 302 (100.0%) | 177 (100.0%) |
Physical Housing Characteristics in Spring Arbor
Housing Structures in Spring Arbor
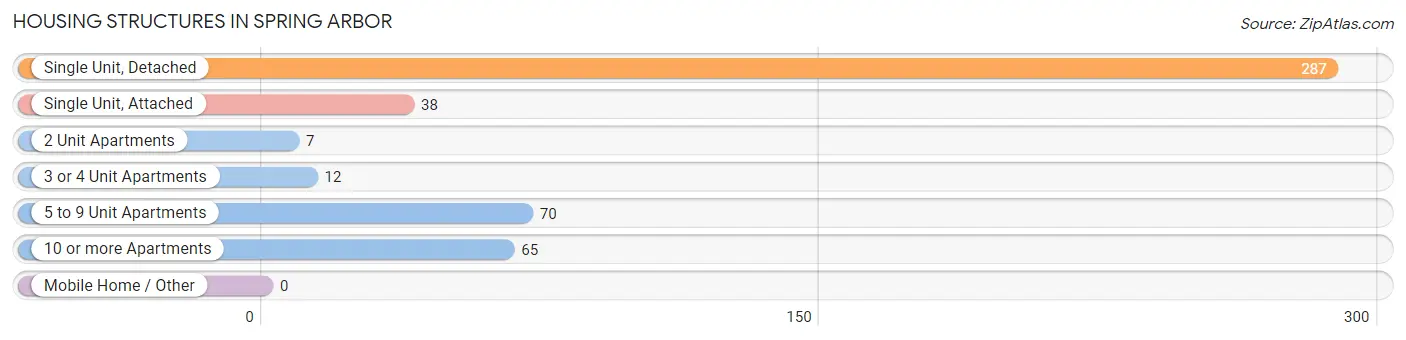
| Structure Type | # Housing Units | % Housing Units |
| Single Unit, Detached | 287 | 59.9% |
| Single Unit, Attached | 38 | 7.9% |
| 2 Unit Apartments | 7 | 1.5% |
| 3 or 4 Unit Apartments | 12 | 2.5% |
| 5 to 9 Unit Apartments | 70 | 14.6% |
| 10 or more Apartments | 65 | 13.6% |
| Mobile Home / Other | 0 | 0.0% |
| Total | 479 | 100.0% |
Housing Structures by Occupancy in Spring Arbor
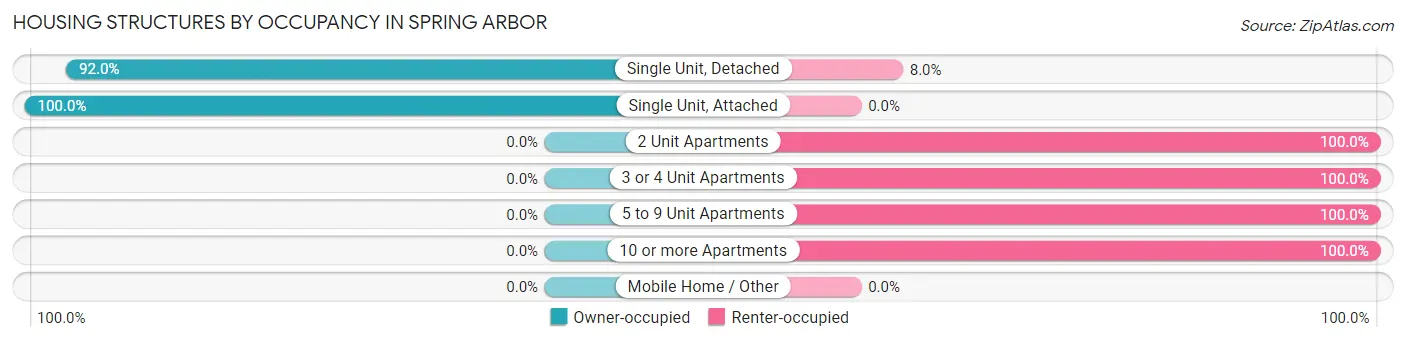
| Structure Type | Owner-occupied | Renter-occupied |
| Single Unit, Detached | 264 (92.0%) | 23 (8.0%) |
| Single Unit, Attached | 38 (100.0%) | 0 (0.0%) |
| 2 Unit Apartments | 0 (0.0%) | 7 (100.0%) |
| 3 or 4 Unit Apartments | 0 (0.0%) | 12 (100.0%) |
| 5 to 9 Unit Apartments | 0 (0.0%) | 70 (100.0%) |
| 10 or more Apartments | 0 (0.0%) | 65 (100.0%) |
| Mobile Home / Other | 0 (0.0%) | 0 (0.0%) |
| Total | 302 (63.0%) | 177 (36.9%) |
Housing Structures by Number of Rooms in Spring Arbor
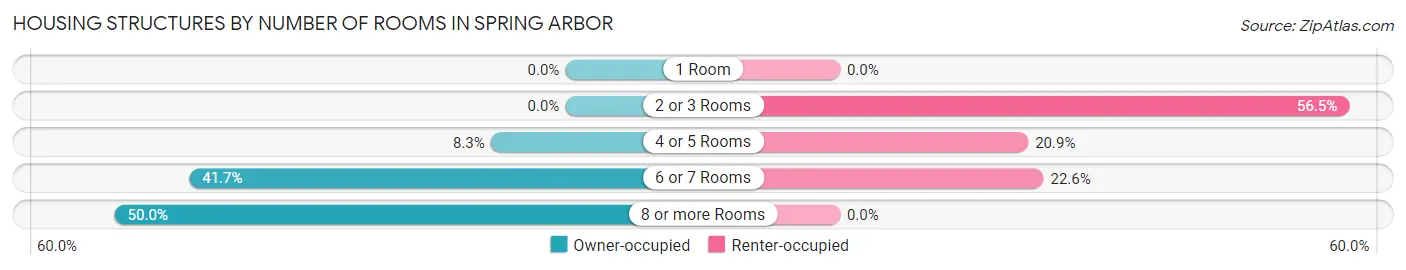
| Number of Rooms | Owner-occupied | Renter-occupied |
| 1 Room | 0 (0.0%) | 0 (0.0%) |
| 2 or 3 Rooms | 0 (0.0%) | 100 (56.5%) |
| 4 or 5 Rooms | 25 (8.3%) | 37 (20.9%) |
| 6 or 7 Rooms | 126 (41.7%) | 40 (22.6%) |
| 8 or more Rooms | 151 (50.0%) | 0 (0.0%) |
| Total | 302 (100.0%) | 177 (100.0%) |
Housing Structure by Heating Type in Spring Arbor
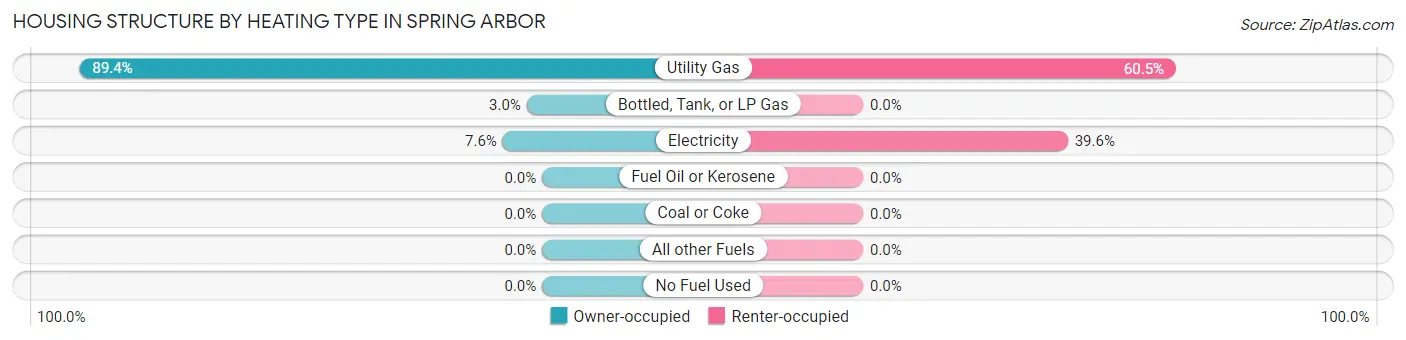
| Heating Type | Owner-occupied | Renter-occupied |
| Utility Gas | 270 (89.4%) | 107 (60.5%) |
| Bottled, Tank, or LP Gas | 9 (3.0%) | 0 (0.0%) |
| Electricity | 23 (7.6%) | 70 (39.6%) |
| Fuel Oil or Kerosene | 0 (0.0%) | 0 (0.0%) |
| Coal or Coke | 0 (0.0%) | 0 (0.0%) |
| All other Fuels | 0 (0.0%) | 0 (0.0%) |
| No Fuel Used | 0 (0.0%) | 0 (0.0%) |
| Total | 302 (100.0%) | 177 (100.0%) |
Household Vehicle Usage in Spring Arbor
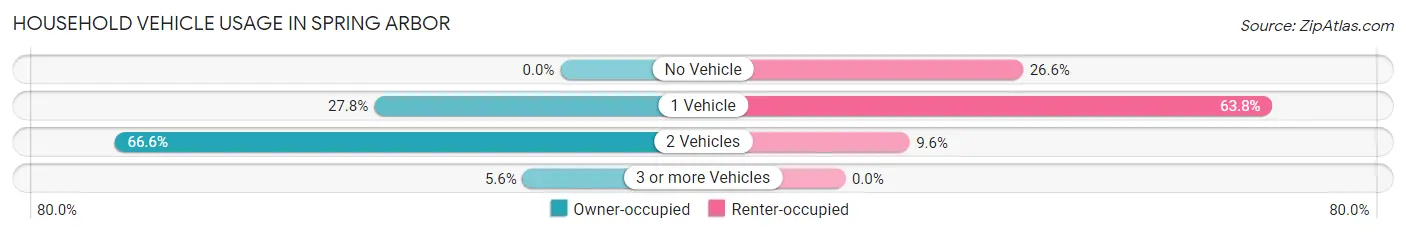
| Vehicles per Household | Owner-occupied | Renter-occupied |
| No Vehicle | 0 (0.0%) | 47 (26.6%) |
| 1 Vehicle | 84 (27.8%) | 113 (63.8%) |
| 2 Vehicles | 201 (66.6%) | 17 (9.6%) |
| 3 or more Vehicles | 17 (5.6%) | 0 (0.0%) |
| Total | 302 (100.0%) | 177 (100.0%) |
Real Estate & Mortgages in Spring Arbor
Real Estate and Mortgage Overview in Spring Arbor
| Characteristic | Without Mortgage | With Mortgage |
| Housing Units | 112 | 190 |
| Median Property Value | $196,600 | $225,000 |
| Median Household Income | $68,409 | $30 |
| Monthly Housing Costs | $516 | $0 |
| Real Estate Taxes | $2,912 | $0 |
Property Value by Mortgage Status in Spring Arbor
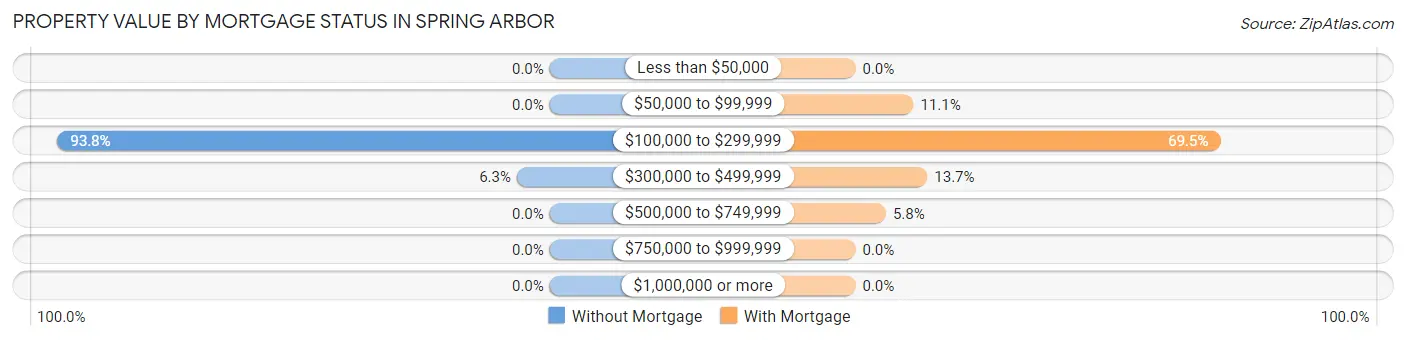
| Property Value | Without Mortgage | With Mortgage |
| Less than $50,000 | 0 (0.0%) | 0 (0.0%) |
| $50,000 to $99,999 | 0 (0.0%) | 21 (11.1%) |
| $100,000 to $299,999 | 105 (93.8%) | 132 (69.5%) |
| $300,000 to $499,999 | 7 (6.2%) | 26 (13.7%) |
| $500,000 to $749,999 | 0 (0.0%) | 11 (5.8%) |
| $750,000 to $999,999 | 0 (0.0%) | 0 (0.0%) |
| $1,000,000 or more | 0 (0.0%) | 0 (0.0%) |
| Total | 112 (100.0%) | 190 (100.0%) |
Household Income by Mortgage Status in Spring Arbor
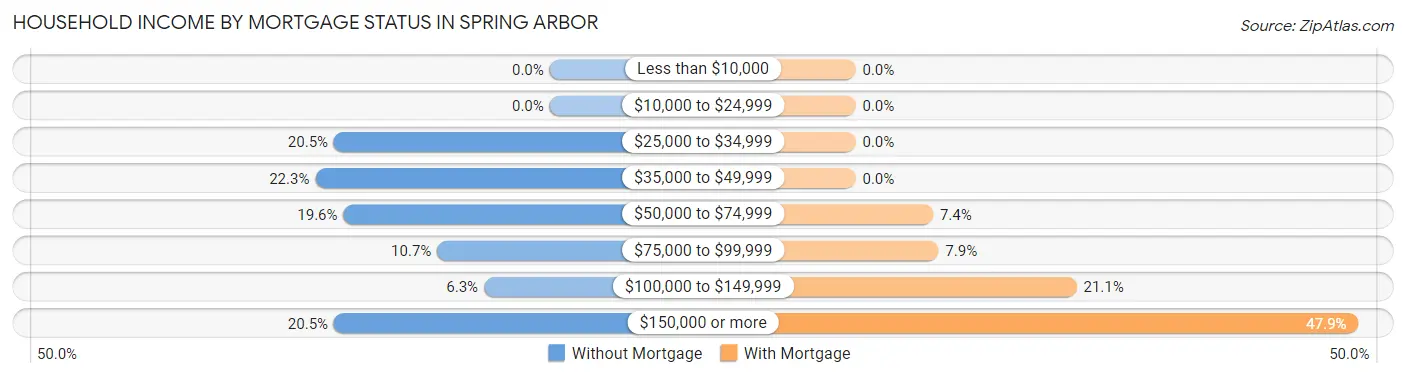
| Household Income | Without Mortgage | With Mortgage |
| Less than $10,000 | 0 (0.0%) | 0 (0.0%) |
| $10,000 to $24,999 | 0 (0.0%) | 0 (0.0%) |
| $25,000 to $34,999 | 23 (20.5%) | 0 (0.0%) |
| $35,000 to $49,999 | 25 (22.3%) | 0 (0.0%) |
| $50,000 to $74,999 | 22 (19.6%) | 14 (7.4%) |
| $75,000 to $99,999 | 12 (10.7%) | 15 (7.9%) |
| $100,000 to $149,999 | 7 (6.2%) | 40 (21.0%) |
| $150,000 or more | 23 (20.5%) | 91 (47.9%) |
| Total | 112 (100.0%) | 190 (100.0%) |
Property Value to Household Income Ratio in Spring Arbor
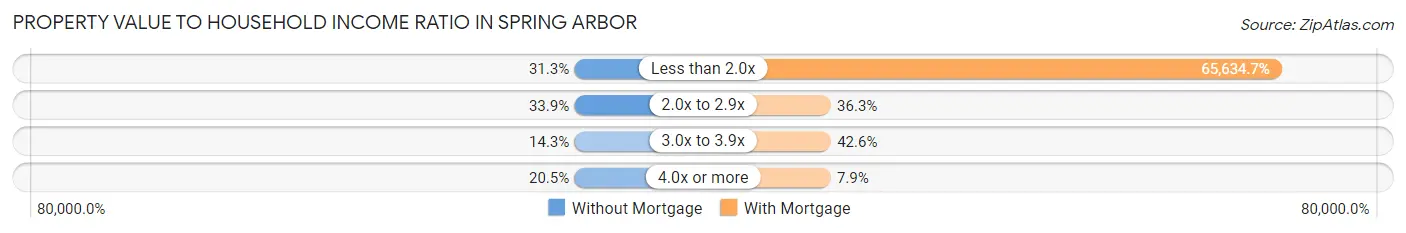
| Value-to-Income Ratio | Without Mortgage | With Mortgage |
| Less than 2.0x | 35 (31.2%) | 124,706 (65,634.7%) |
| 2.0x to 2.9x | 38 (33.9%) | 69 (36.3%) |
| 3.0x to 3.9x | 16 (14.3%) | 81 (42.6%) |
| 4.0x or more | 23 (20.5%) | 15 (7.9%) |
| Total | 112 (100.0%) | 190 (100.0%) |
Real Estate Taxes by Mortgage Status in Spring Arbor
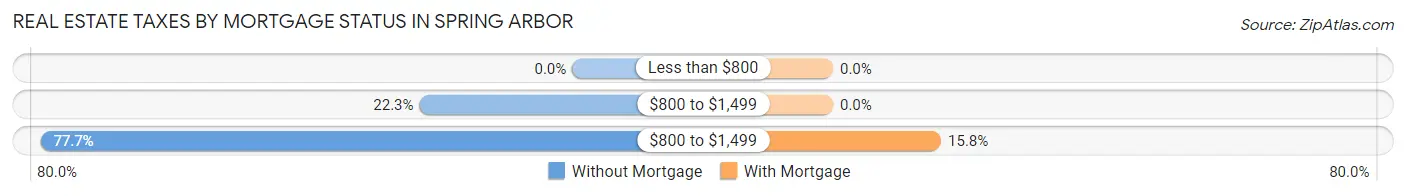
| Property Taxes | Without Mortgage | With Mortgage |
| Less than $800 | 0 (0.0%) | 0 (0.0%) |
| $800 to $1,499 | 25 (22.3%) | 0 (0.0%) |
| $800 to $1,499 | 87 (77.7%) | 30 (15.8%) |
| Total | 112 (100.0%) | 190 (100.0%) |
Health & Disability in Spring Arbor
Health Insurance Coverage by Age in Spring Arbor
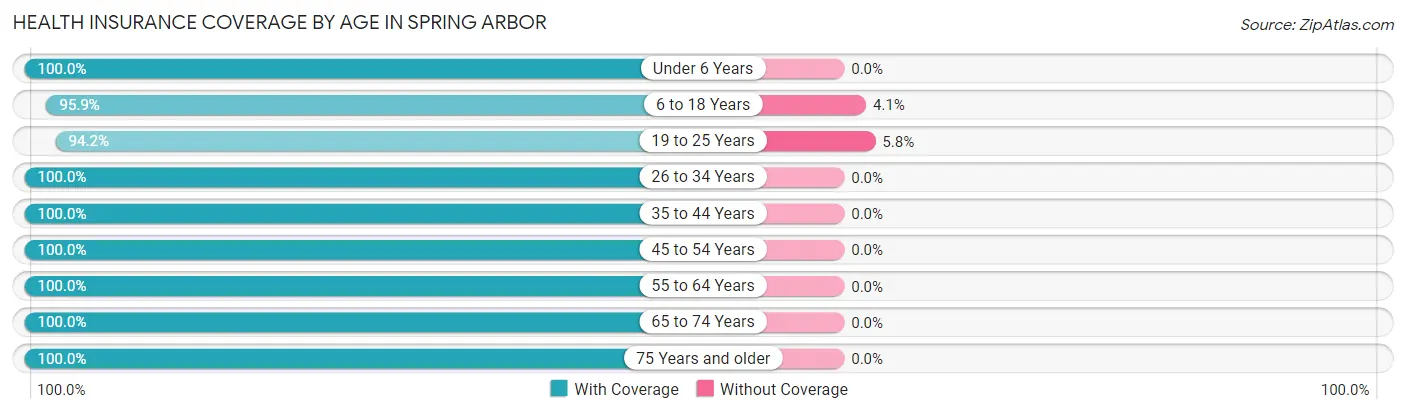
| Age Bracket | With Coverage | Without Coverage |
| Under 6 Years | 60 (100.0%) | 0 (0.0%) |
| 6 to 18 Years | 518 (95.9%) | 22 (4.1%) |
| 19 to 25 Years | 731 (94.2%) | 45 (5.8%) |
| 26 to 34 Years | 134 (100.0%) | 0 (0.0%) |
| 35 to 44 Years | 202 (100.0%) | 0 (0.0%) |
| 45 to 54 Years | 92 (100.0%) | 0 (0.0%) |
| 55 to 64 Years | 235 (100.0%) | 0 (0.0%) |
| 65 to 74 Years | 118 (100.0%) | 0 (0.0%) |
| 75 Years and older | 171 (100.0%) | 0 (0.0%) |
| Total | 2,261 (97.1%) | 67 (2.9%) |
Health Insurance Coverage by Citizenship Status in Spring Arbor
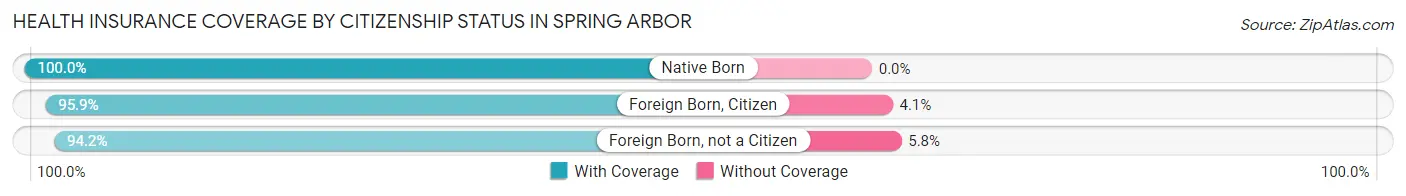
| Citizenship Status | With Coverage | Without Coverage |
| Native Born | 60 (100.0%) | 0 (0.0%) |
| Foreign Born, Citizen | 518 (95.9%) | 22 (4.1%) |
| Foreign Born, not a Citizen | 731 (94.2%) | 45 (5.8%) |
Health Insurance Coverage by Household Income in Spring Arbor
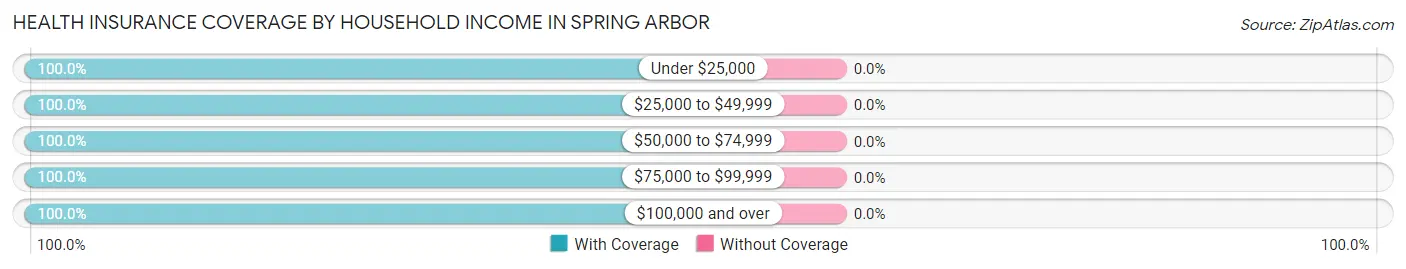
| Household Income | With Coverage | Without Coverage |
| Under $25,000 | 52 (100.0%) | 0 (0.0%) |
| $25,000 to $49,999 | 292 (100.0%) | 0 (0.0%) |
| $50,000 to $74,999 | 81 (100.0%) | 0 (0.0%) |
| $75,000 to $99,999 | 264 (100.0%) | 0 (0.0%) |
| $100,000 and over | 622 (100.0%) | 0 (0.0%) |
Public vs Private Health Insurance Coverage by Age in Spring Arbor
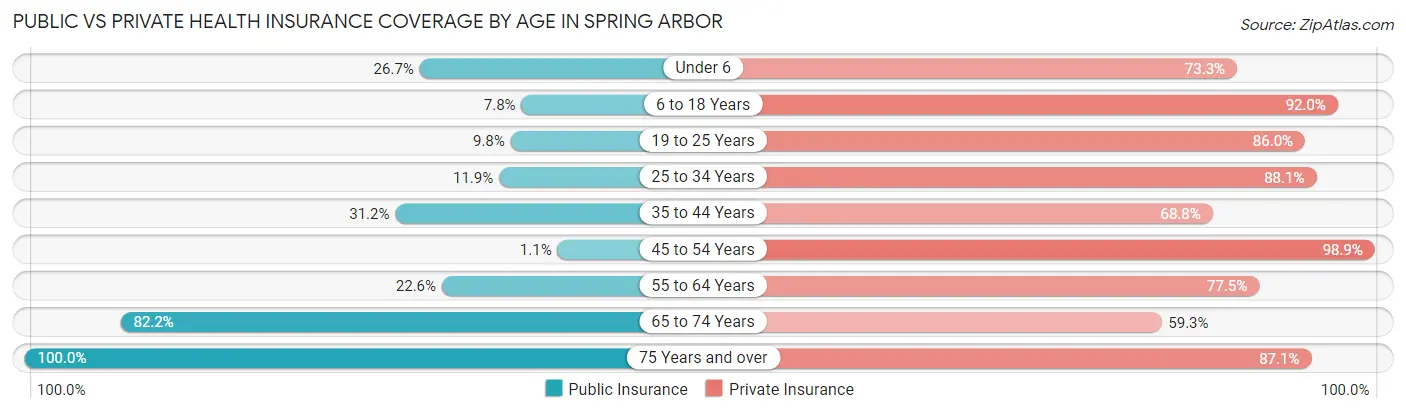
| Age Bracket | Public Insurance | Private Insurance |
| Under 6 | 16 (26.7%) | 44 (73.3%) |
| 6 to 18 Years | 42 (7.8%) | 497 (92.0%) |
| 19 to 25 Years | 76 (9.8%) | 667 (86.0%) |
| 25 to 34 Years | 16 (11.9%) | 118 (88.1%) |
| 35 to 44 Years | 63 (31.2%) | 139 (68.8%) |
| 45 to 54 Years | 1 (1.1%) | 91 (98.9%) |
| 55 to 64 Years | 53 (22.6%) | 182 (77.4%) |
| 65 to 74 Years | 97 (82.2%) | 70 (59.3%) |
| 75 Years and over | 171 (100.0%) | 149 (87.1%) |
| Total | 535 (23.0%) | 1,957 (84.1%) |
Disability Status by Sex by Age in Spring Arbor
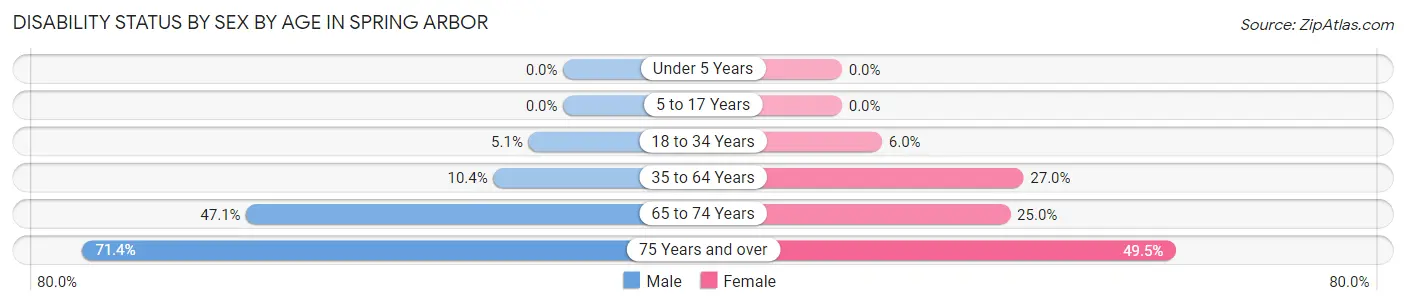
| Age Bracket | Male | Female |
| Under 5 Years | 0 (0.0%) | 0 (0.0%) |
| 5 to 17 Years | 0 (0.0%) | 0 (0.0%) |
| 18 to 34 Years | 20 (5.1%) | 49 (5.9%) |
| 35 to 64 Years | 31 (10.4%) | 62 (27.0%) |
| 65 to 74 Years | 16 (47.1%) | 21 (25.0%) |
| 75 Years and over | 50 (71.4%) | 50 (49.5%) |
Disability Class by Sex by Age in Spring Arbor
Disability Class: Hearing Difficulty
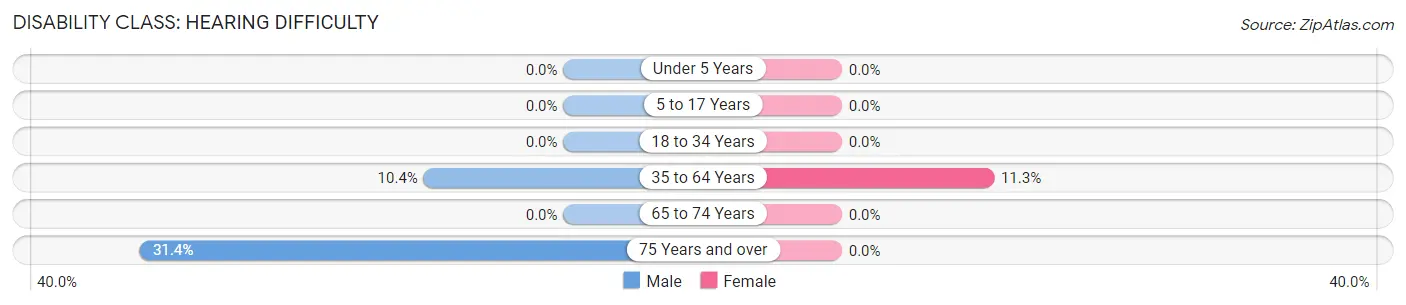
| Age Bracket | Male | Female |
| Under 5 Years | 0 (0.0%) | 0 (0.0%) |
| 5 to 17 Years | 0 (0.0%) | 0 (0.0%) |
| 18 to 34 Years | 0 (0.0%) | 0 (0.0%) |
| 35 to 64 Years | 31 (10.4%) | 26 (11.3%) |
| 65 to 74 Years | 0 (0.0%) | 0 (0.0%) |
| 75 Years and over | 22 (31.4%) | 0 (0.0%) |
Disability Class: Vision Difficulty
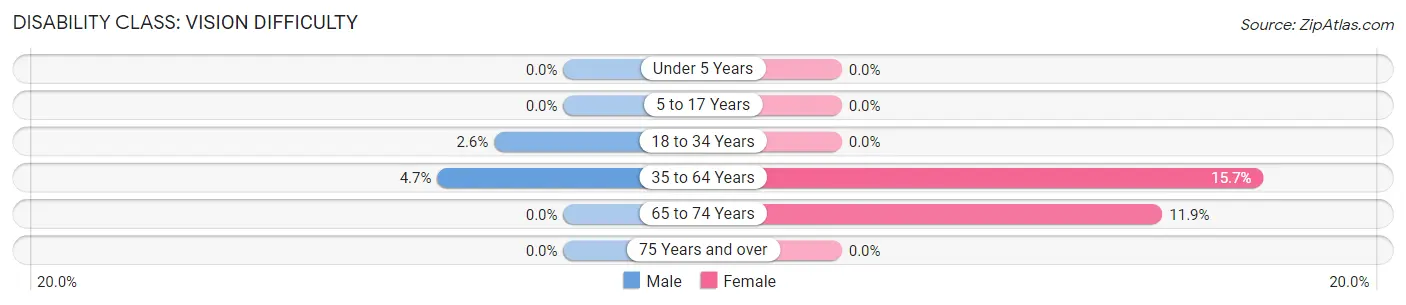
| Age Bracket | Male | Female |
| Under 5 Years | 0 (0.0%) | 0 (0.0%) |
| 5 to 17 Years | 0 (0.0%) | 0 (0.0%) |
| 18 to 34 Years | 10 (2.6%) | 0 (0.0%) |
| 35 to 64 Years | 14 (4.7%) | 36 (15.7%) |
| 65 to 74 Years | 0 (0.0%) | 10 (11.9%) |
| 75 Years and over | 0 (0.0%) | 0 (0.0%) |
Disability Class: Cognitive Difficulty
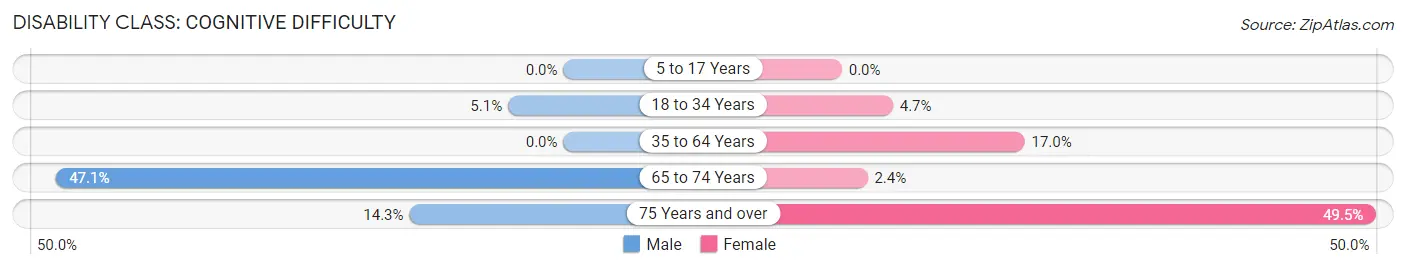
| Age Bracket | Male | Female |
| 5 to 17 Years | 0 (0.0%) | 0 (0.0%) |
| 18 to 34 Years | 20 (5.1%) | 39 (4.7%) |
| 35 to 64 Years | 0 (0.0%) | 39 (17.0%) |
| 65 to 74 Years | 16 (47.1%) | 2 (2.4%) |
| 75 Years and over | 10 (14.3%) | 50 (49.5%) |
Disability Class: Ambulatory Difficulty
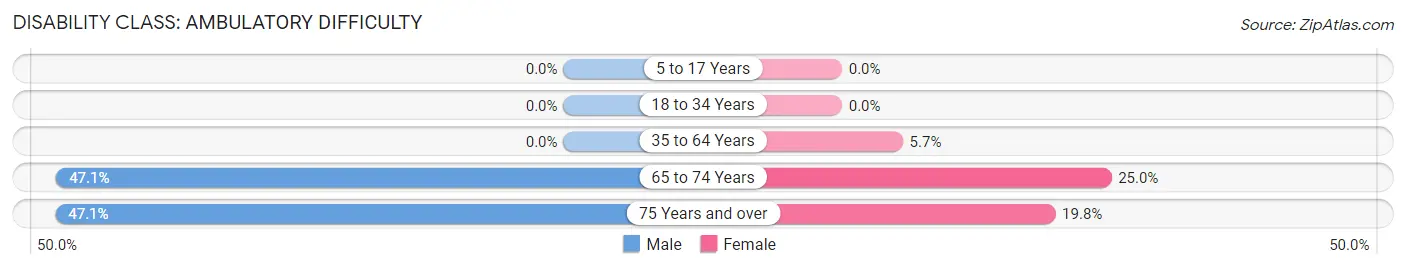
| Age Bracket | Male | Female |
| 5 to 17 Years | 0 (0.0%) | 0 (0.0%) |
| 18 to 34 Years | 0 (0.0%) | 0 (0.0%) |
| 35 to 64 Years | 0 (0.0%) | 13 (5.7%) |
| 65 to 74 Years | 16 (47.1%) | 21 (25.0%) |
| 75 Years and over | 33 (47.1%) | 20 (19.8%) |
Disability Class: Self-Care Difficulty
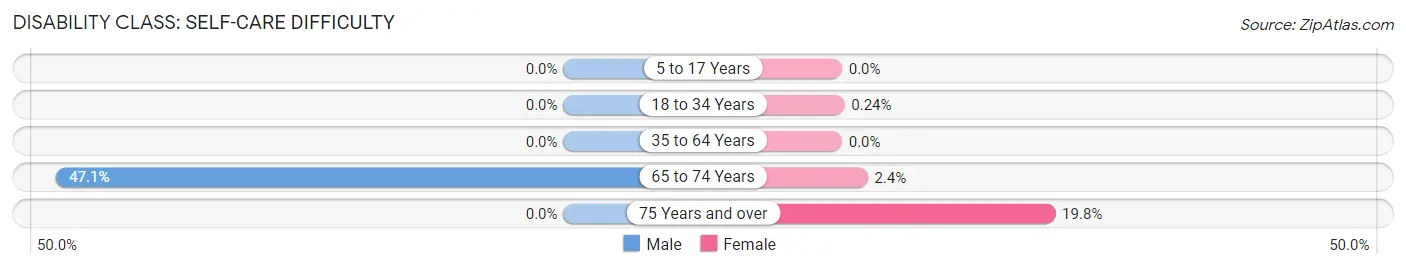
| Age Bracket | Male | Female |
| 5 to 17 Years | 0 (0.0%) | 0 (0.0%) |
| 18 to 34 Years | 0 (0.0%) | 2 (0.2%) |
| 35 to 64 Years | 0 (0.0%) | 0 (0.0%) |
| 65 to 74 Years | 16 (47.1%) | 2 (2.4%) |
| 75 Years and over | 0 (0.0%) | 20 (19.8%) |
Technology Access in Spring Arbor
Computing Device Access in Spring Arbor
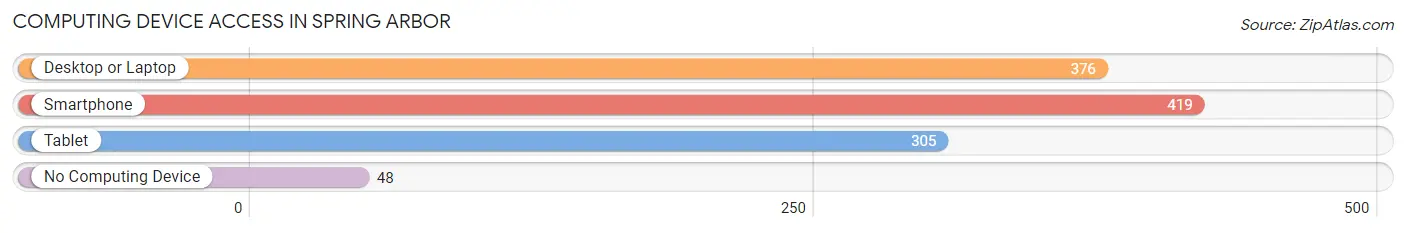
| Device Type | # Households | % Households |
| Desktop or Laptop | 376 | 78.5% |
| Smartphone | 419 | 87.5% |
| Tablet | 305 | 63.7% |
| No Computing Device | 48 | 10.0% |
| Total | 479 | 100.0% |
Internet Access in Spring Arbor
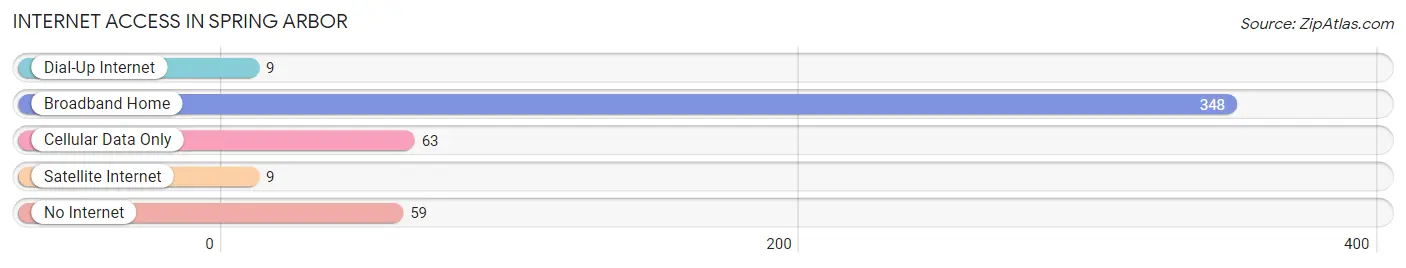
| Internet Type | # Households | % Households |
| Dial-Up Internet | 9 | 1.9% |
| Broadband Home | 348 | 72.7% |
| Cellular Data Only | 63 | 13.2% |
| Satellite Internet | 9 | 1.9% |
| No Internet | 59 | 12.3% |
| Total | 479 | 100.0% |
Spring Arbor Summary
History
Spring Arbor is a small unincorporated community located in Jackson County, Michigan. It is located about 10 miles west of Jackson, the county seat. The community was first settled in 1832 by a group of settlers from New York. The settlers were attracted to the area by the abundance of timber and the fertile soil. The community was originally known as Spring Arbor Township, but the name was changed to Spring Arbor in 1837.
The community was primarily an agricultural community until the late 19th century when the railroad came through the area. This allowed for the development of a small manufacturing industry in the area. The most notable of these was the Spring Arbor Furniture Company, which was founded in 1891 and operated until the early 2000s.
The community has also been home to a number of churches, including the Spring Arbor United Methodist Church, which was founded in 1837. The church is still active today and is the oldest church in the community.
Geography
Spring Arbor is located in Jackson County, Michigan. It is situated about 10 miles west of Jackson, the county seat. The community is located in the central part of the county, just south of the Kalamazoo River. The terrain is mostly flat, with some rolling hills in the area. The climate is generally mild, with cold winters and warm summers.
The community is located in the Spring Arbor Township, which is bordered by the townships of Concord, Parma, and Pulaski. The township covers an area of approximately 36 square miles.
Economy
The economy of Spring Arbor is primarily based on agriculture and manufacturing. The area is home to a number of farms, which produce a variety of crops, including corn, soybeans, and wheat. The area is also home to a number of small manufacturing companies, including the Spring Arbor Furniture Company, which produces furniture for the home and office.
The community is also home to a number of small businesses, including restaurants, retail stores, and service providers. The community is also home to a number of educational institutions, including Spring Arbor University, which is a private liberal arts college.
Demographics
As of the 2010 census, the population of Spring Arbor was 2,845. The racial makeup of the community was 95.3% White, 1.2% African American, 0.3% Native American, 0.7% Asian, 0.1% Pacific Islander, 0.7% from other races, and 1.7% from two or more races. Hispanic or Latino of any race were 2.2% of the population.
The median household income in Spring Arbor was $45,938, and the median family income was $54,844. The per capita income was $20,945. About 8.3% of families and 11.2% of the population were below the poverty line, including 15.2% of those under age 18 and 6.2% of those age 65 or over.
Common Questions
What is Per Capita Income in Spring Arbor?
Per Capita income in Spring Arbor is $23,226.
What is the Median Family Income in Spring Arbor?
Median Family Income in Spring Arbor is $91,346.
What is the Median Household income in Spring Arbor?
Median Household Income in Spring Arbor is $78,393.
What is Income or Wage Gap in Spring Arbor?
Income or Wage Gap in Spring Arbor is 81.2%.
Women in Spring Arbor earn 18.8 cents for every dollar earned by a man.
What is Inequality or Gini Index in Spring Arbor?
Inequality or Gini Index in Spring Arbor is 0.44.
What is the Total Population of Spring Arbor?
Total Population of Spring Arbor is 2,410.
What is the Total Male Population of Spring Arbor?
Total Male Population of Spring Arbor is 911.
What is the Total Female Population of Spring Arbor?
Total Female Population of Spring Arbor is 1,499.
What is the Ratio of Males per 100 Females in Spring Arbor?
There are 60.77 Males per 100 Females in Spring Arbor.
What is the Ratio of Females per 100 Males in Spring Arbor?
There are 164.54 Females per 100 Males in Spring Arbor.
What is the Median Population Age in Spring Arbor?
Median Population Age in Spring Arbor is 22.2 Years.
What is the Average Family Size in Spring Arbor
Average Family Size in Spring Arbor is 3.1 People.
What is the Average Household Size in Spring Arbor
Average Household Size in Spring Arbor is 2.7 People.
How Large is the Labor Force in Spring Arbor?
There are 1,342 People in the Labor Forcein in Spring Arbor.
What is the Percentage of People in the Labor Force in Spring Arbor?
62.6% of People are in the Labor Force in Spring Arbor.
What is the Unemployment Rate in Spring Arbor?
Unemployment Rate in Spring Arbor is 4.1%.