Oscoda, MI Map & Demographics
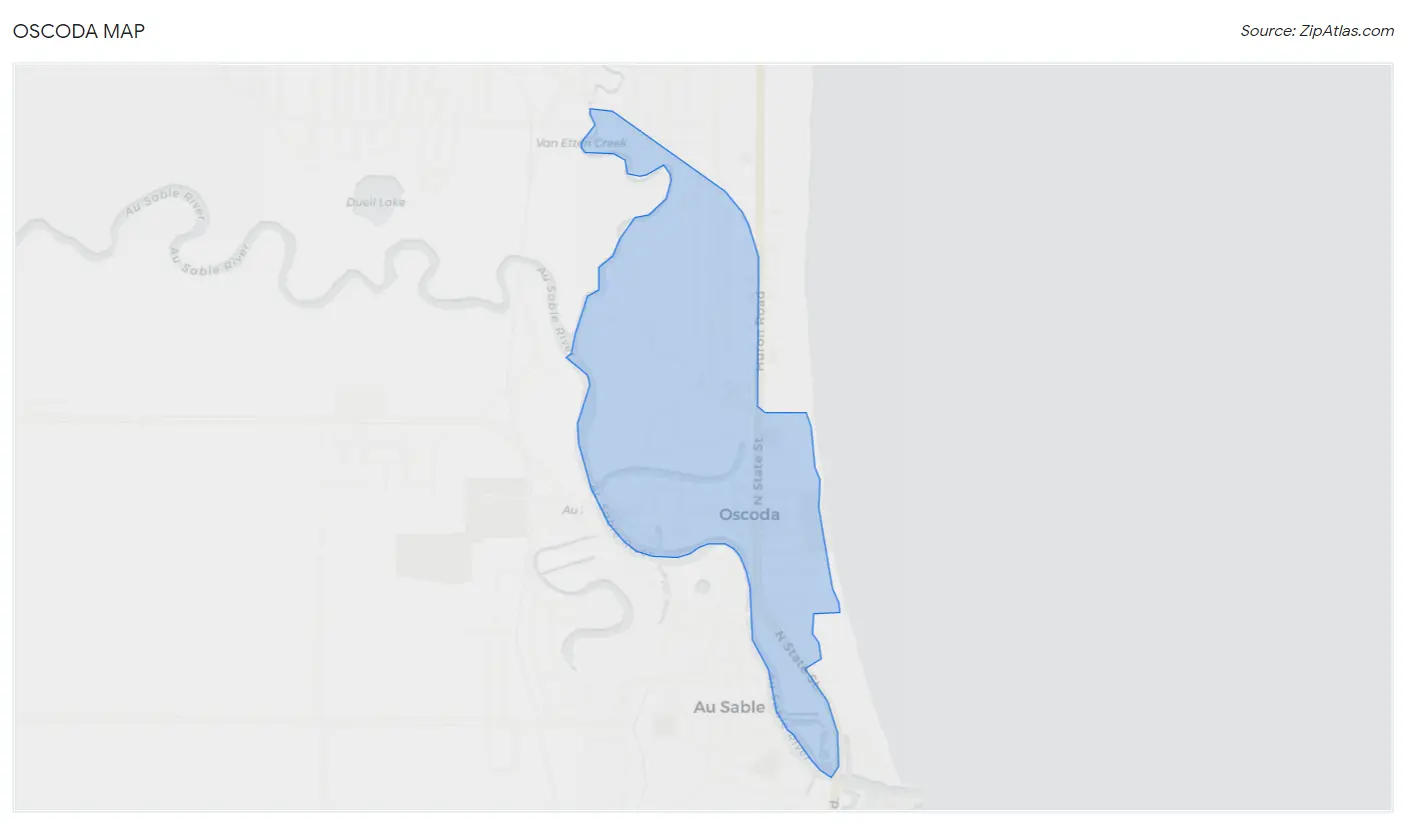
Oscoda Map
Oscoda Overview
$23,440
PER CAPITA INCOME
$48,417
AVG FAMILY INCOME
$40,242
AVG HOUSEHOLD INCOME
37.2%
WAGE / INCOME GAP [ % ]
62.8¢/ $1
WAGE / INCOME GAP [ $ ]
0.42
INEQUALITY / GINI INDEX
918
TOTAL POPULATION
483
MALE POPULATION
435
FEMALE POPULATION
111.03
MALES / 100 FEMALES
90.06
FEMALES / 100 MALES
46.5
MEDIAN AGE
3.4
AVG FAMILY SIZE
2.0
AVG HOUSEHOLD SIZE
338
LABOR FORCE [ PEOPLE ]
40.9%
PERCENT IN LABOR FORCE
8.9%
UNEMPLOYMENT RATE
Oscoda Zip Codes
Oscoda Area Codes
Income in Oscoda
Income Overview in Oscoda
Per Capita Income in Oscoda is $23,440, while median incomes of families and households are $48,417 and $40,242 respectively.
| Characteristic | Number | Measure |
| Per Capita Income | 918 | $23,440 |
| Median Family Income | 188 | $48,417 |
| Mean Family Income | 188 | $59,932 |
| Median Household Income | 450 | $40,242 |
| Mean Household Income | 450 | $46,102 |
| Income Deficit | 188 | $0 |
| Wage / Income Gap (%) | 918 | 37.23% |
| Wage / Income Gap ($) | 918 | 62.77¢ per $1 |
| Gini / Inequality Index | 918 | 0.42 |
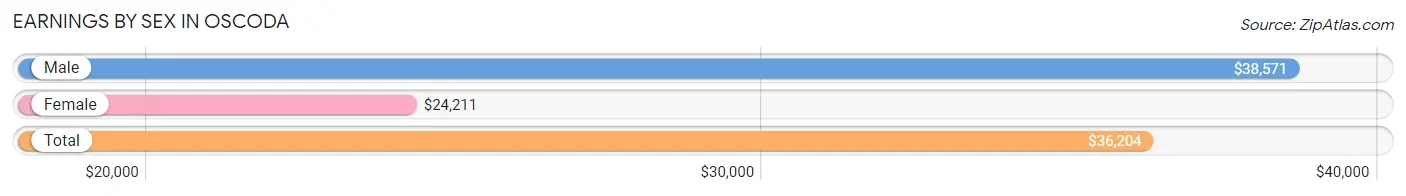
Earnings by Sex in Oscoda
Average Earnings in Oscoda are $36,204, $38,571 for men and $24,211 for women, a difference of 37.2%.
| Sex | Number | Average Earnings |
| Male | 166 (49.1%) | $38,571 |
| Female | 172 (50.9%) | $24,211 |
| Total | 338 (100.0%) | $36,204 |
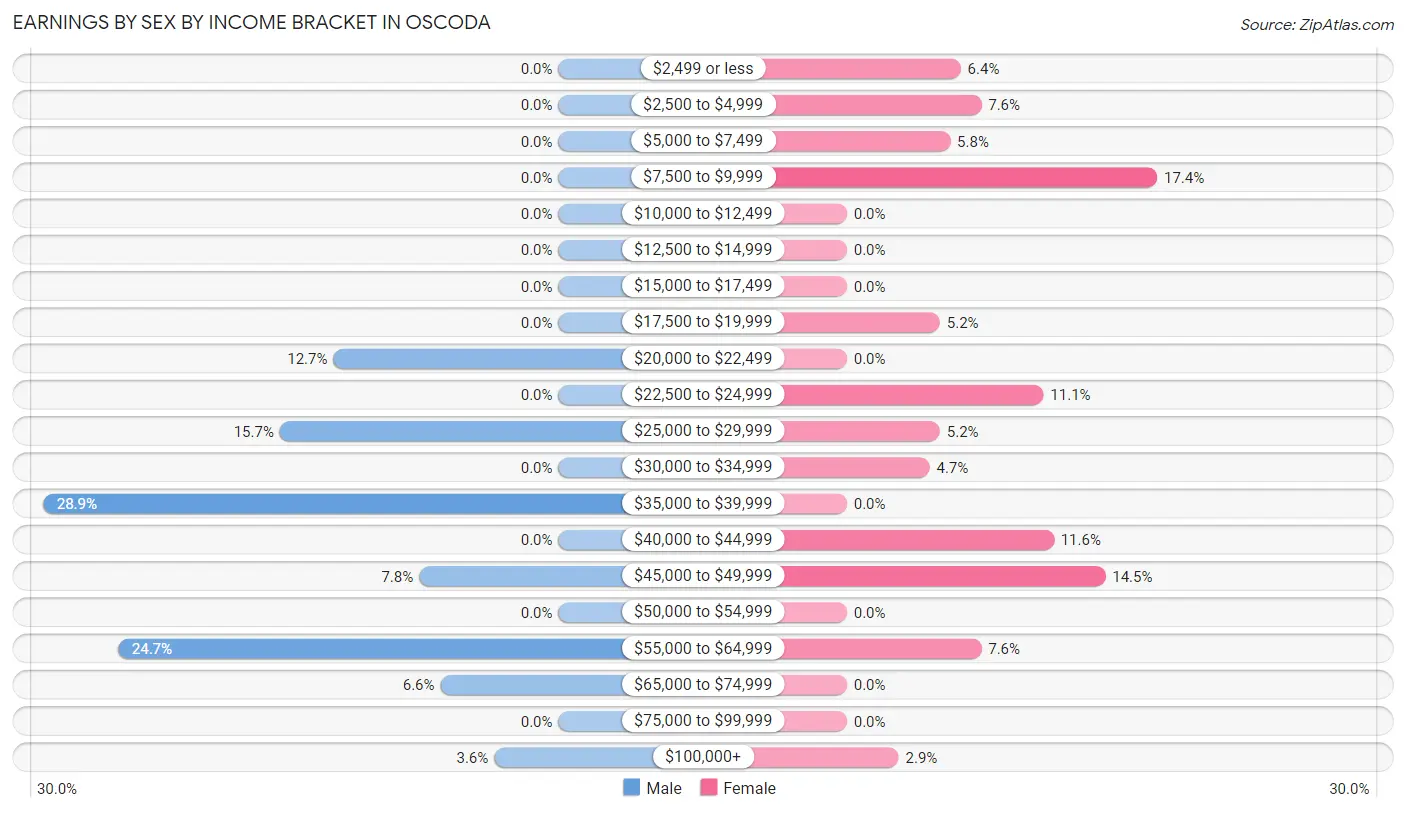
Earnings by Sex by Income Bracket in Oscoda
The most common earnings brackets in Oscoda are $35,000 to $39,999 for men (48 | 28.9%) and $7,500 to $9,999 for women (30 | 17.4%).
| Income | Male | Female |
| $2,499 or less | 0 (0.0%) | 11 (6.4%) |
| $2,500 to $4,999 | 0 (0.0%) | 13 (7.6%) |
| $5,000 to $7,499 | 0 (0.0%) | 10 (5.8%) |
| $7,500 to $9,999 | 0 (0.0%) | 30 (17.4%) |
| $10,000 to $12,499 | 0 (0.0%) | 0 (0.0%) |
| $12,500 to $14,999 | 0 (0.0%) | 0 (0.0%) |
| $15,000 to $17,499 | 0 (0.0%) | 0 (0.0%) |
| $17,500 to $19,999 | 0 (0.0%) | 9 (5.2%) |
| $20,000 to $22,499 | 21 (12.7%) | 0 (0.0%) |
| $22,500 to $24,999 | 0 (0.0%) | 19 (11.1%) |
| $25,000 to $29,999 | 26 (15.7%) | 9 (5.2%) |
| $30,000 to $34,999 | 0 (0.0%) | 8 (4.6%) |
| $35,000 to $39,999 | 48 (28.9%) | 0 (0.0%) |
| $40,000 to $44,999 | 0 (0.0%) | 20 (11.6%) |
| $45,000 to $49,999 | 13 (7.8%) | 25 (14.5%) |
| $50,000 to $54,999 | 0 (0.0%) | 0 (0.0%) |
| $55,000 to $64,999 | 41 (24.7%) | 13 (7.6%) |
| $65,000 to $74,999 | 11 (6.6%) | 0 (0.0%) |
| $75,000 to $99,999 | 0 (0.0%) | 0 (0.0%) |
| $100,000+ | 6 (3.6%) | 5 (2.9%) |
| Total | 166 (100.0%) | 172 (100.0%) |
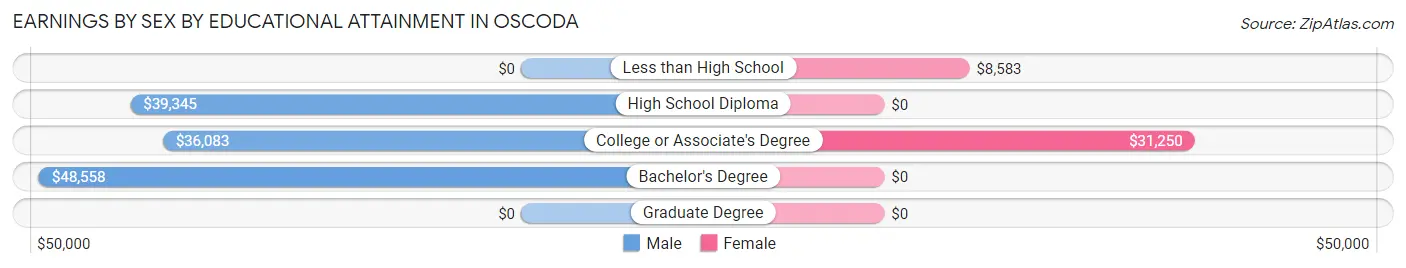
Earnings by Sex by Educational Attainment in Oscoda
Average earnings in Oscoda are $39,345 for men and $24,934 for women, a difference of 36.6%. Men with an educational attainment of bachelor's degree enjoy the highest average annual earnings of $48,558, while those with college or associate's degree education earn the least with $36,083. Women with an educational attainment of college or associate's degree earn the most with the average annual earnings of $31,250, while those with less than high school education have the smallest earnings of $8,583.
| Educational Attainment | Male Income | Female Income |
| Less than High School | - | - |
| High School Diploma | $39,345 | $0 |
| College or Associate's Degree | $36,083 | $31,250 |
| Bachelor's Degree | $48,558 | $0 |
| Graduate Degree | - | - |
| Total | $39,345 | $24,934 |
Family Income in Oscoda
Family Income Brackets in Oscoda
According to the Oscoda family income data, there are 77 families falling into the $35,000 to $49,999 income range, which is the most common income bracket and makes up 41.0% of all families.
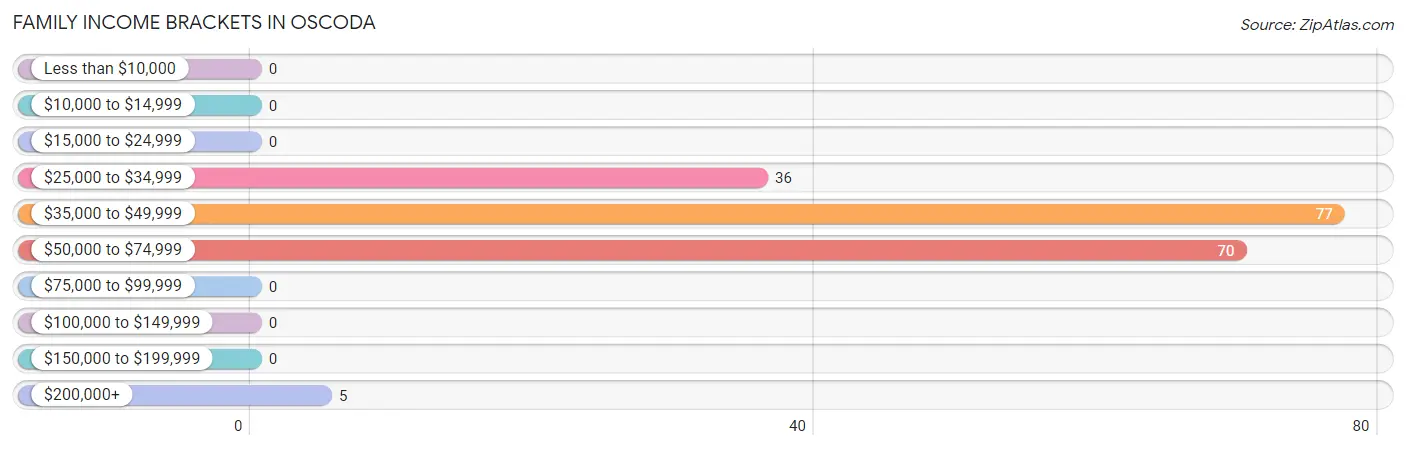
| Income Bracket | # Families | % Families |
| Less than $10,000 | 0 | 0.0% |
| $10,000 to $14,999 | 0 | 0.0% |
| $15,000 to $24,999 | 0 | 0.0% |
| $25,000 to $34,999 | 36 | 19.1% |
| $35,000 to $49,999 | 77 | 41.0% |
| $50,000 to $74,999 | 70 | 37.2% |
| $75,000 to $99,999 | 0 | 0.0% |
| $100,000 to $149,999 | 0 | 0.0% |
| $150,000 to $199,999 | 0 | 0.0% |
| $200,000+ | 5 | 2.7% |
Family Income by Famaliy Size in Oscoda
3-person families (38 | 20.2%) account for the highest median family income in Oscoda with $67,045 per family, while 3-person families (38 | 20.2%) have the highest median income of $22,348 per family member.
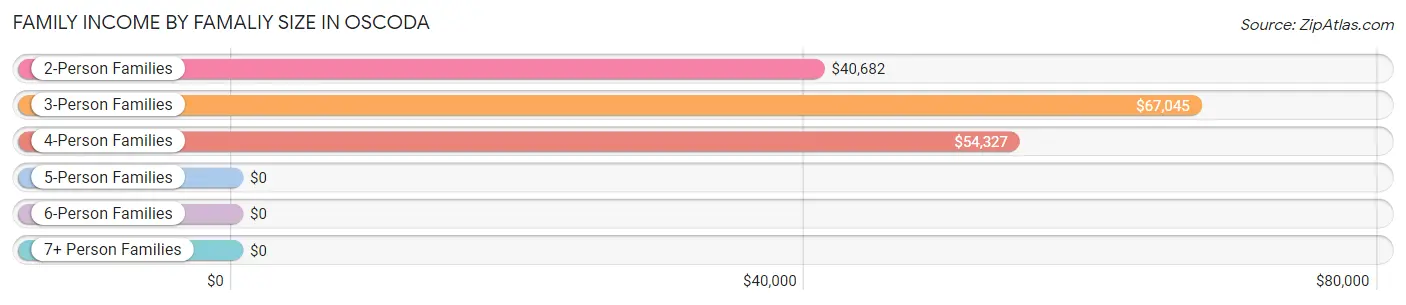
| Income Bracket | # Families | Median Income |
| 2-Person Families | 96 (51.1%) | $40,682 |
| 3-Person Families | 38 (20.2%) | $67,045 |
| 4-Person Families | 37 (19.7%) | $54,327 |
| 5-Person Families | 17 (9.0%) | $0 |
| 6-Person Families | 0 (0.0%) | $0 |
| 7+ Person Families | 0 (0.0%) | $0 |
| Total | 188 (100.0%) | $48,417 |
Family Income by Number of Earners in Oscoda
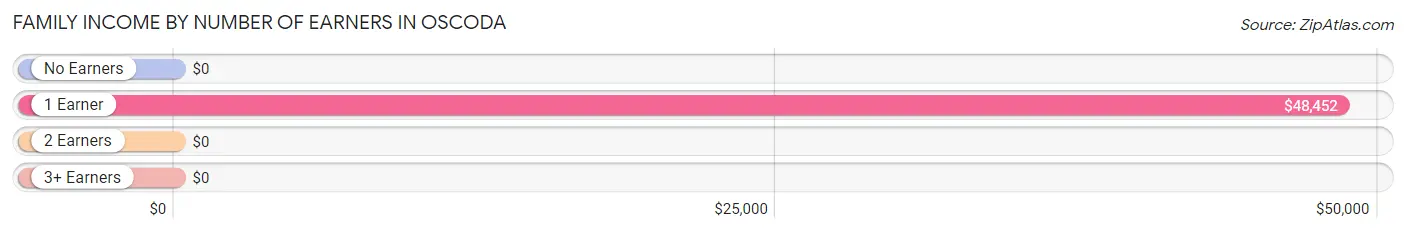
| Number of Earners | # Families | Median Income |
| No Earners | 36 (19.2%) | $0 |
| 1 Earner | 110 (58.5%) | $48,452 |
| 2 Earners | 33 (17.5%) | $0 |
| 3+ Earners | 9 (4.8%) | $0 |
| Total | 188 (100.0%) | $48,417 |
Household Income in Oscoda
Household Income Brackets in Oscoda
With 137 households falling in the category, the $35,000 to $49,999 income range is the most frequent in Oscoda, accounting for 30.4% of all households.
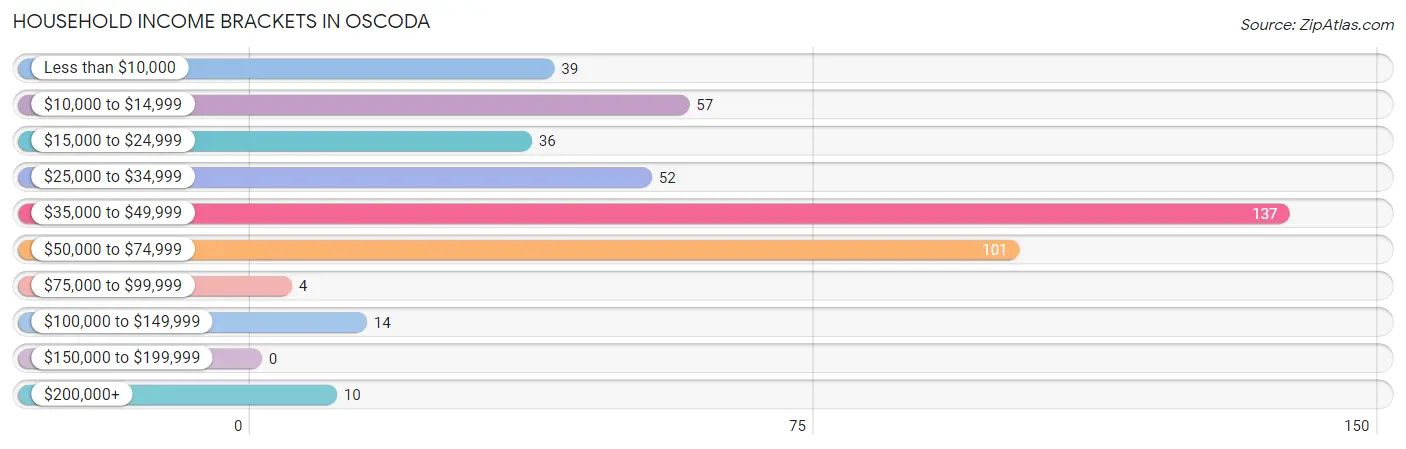
| Income Bracket | # Households | % Households |
| Less than $10,000 | 39 | 8.7% |
| $10,000 to $14,999 | 57 | 12.7% |
| $15,000 to $24,999 | 36 | 8.0% |
| $25,000 to $34,999 | 52 | 11.6% |
| $35,000 to $49,999 | 137 | 30.4% |
| $50,000 to $74,999 | 101 | 22.4% |
| $75,000 to $99,999 | 4 | 0.9% |
| $100,000 to $149,999 | 14 | 3.1% |
| $150,000 to $199,999 | 0 | 0.0% |
| $200,000+ | 10 | 2.2% |
Household Income by Householder Age in Oscoda
The median household income in Oscoda is $40,242, with the highest median household income of $49,038 found in the 25 to 44 years age bracket for the primary householder. A total of 130 households (28.9%) fall into this category.
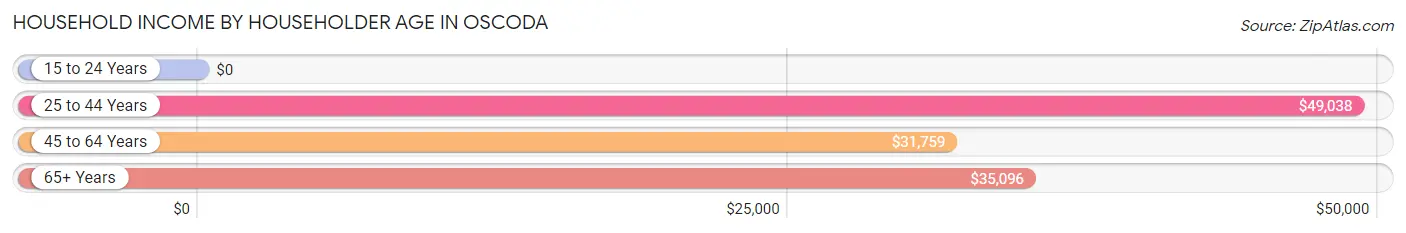
| Income Bracket | # Households | Median Income |
| 15 to 24 Years | 0 (0.0%) | $0 |
| 25 to 44 Years | 130 (28.9%) | $49,038 |
| 45 to 64 Years | 186 (41.3%) | $31,759 |
| 65+ Years | 134 (29.8%) | $35,096 |
| Total | 450 (100.0%) | $40,242 |
Poverty in Oscoda
Income Below Poverty by Sex and Age in Oscoda
With 15.1% poverty level for males and 5.3% for females among the residents of Oscoda, 65 to 74 year old males and 75 year old and over females are the most vulnerable to poverty, with 9 males (50.0%) and 13 females (14.1%) in their respective age groups living below the poverty level.
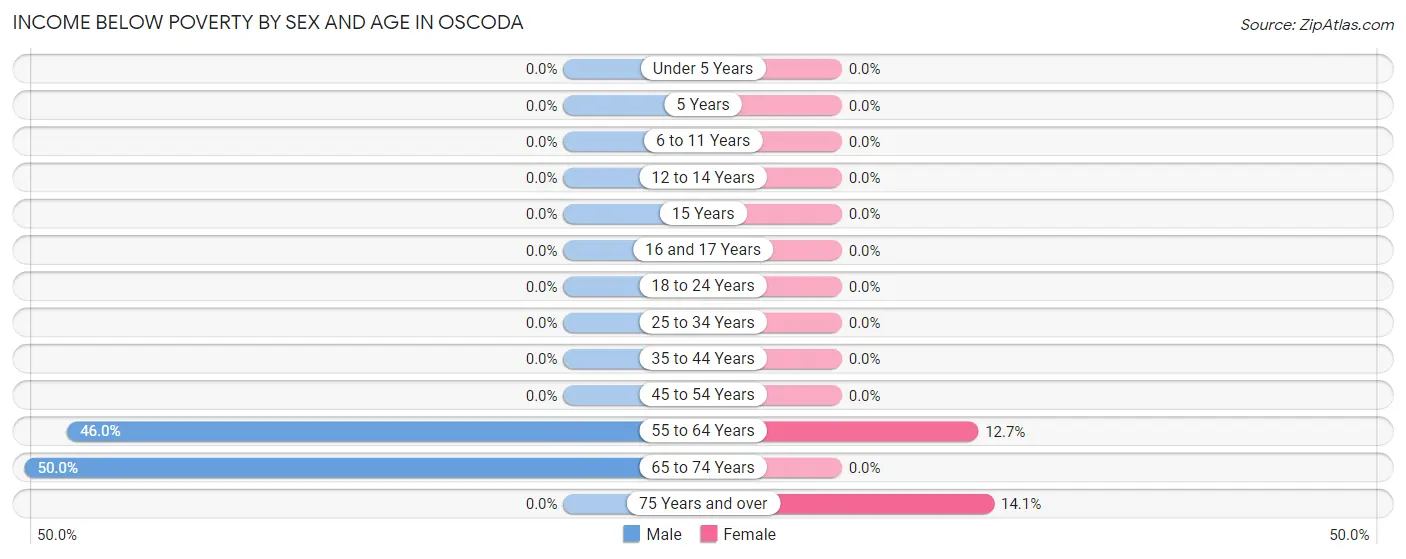
| Age Bracket | Male | Female |
| Under 5 Years | 0 (0.0%) | 0 (0.0%) |
| 5 Years | 0 (0.0%) | 0 (0.0%) |
| 6 to 11 Years | 0 (0.0%) | 0 (0.0%) |
| 12 to 14 Years | 0 (0.0%) | 0 (0.0%) |
| 15 Years | 0 (0.0%) | 0 (0.0%) |
| 16 and 17 Years | 0 (0.0%) | 0 (0.0%) |
| 18 to 24 Years | 0 (0.0%) | 0 (0.0%) |
| 25 to 34 Years | 0 (0.0%) | 0 (0.0%) |
| 35 to 44 Years | 0 (0.0%) | 0 (0.0%) |
| 45 to 54 Years | 0 (0.0%) | 0 (0.0%) |
| 55 to 64 Years | 64 (46.0%) | 10 (12.7%) |
| 65 to 74 Years | 9 (50.0%) | 0 (0.0%) |
| 75 Years and over | 0 (0.0%) | 13 (14.1%) |
| Total | 73 (15.1%) | 23 (5.3%) |
Income Above Poverty by Sex and Age in Oscoda
According to the poverty statistics in Oscoda, males aged 6 to 11 years and females aged under 5 years are the age groups that are most secure financially, with 100.0% of males and 100.0% of females in these age groups living above the poverty line.
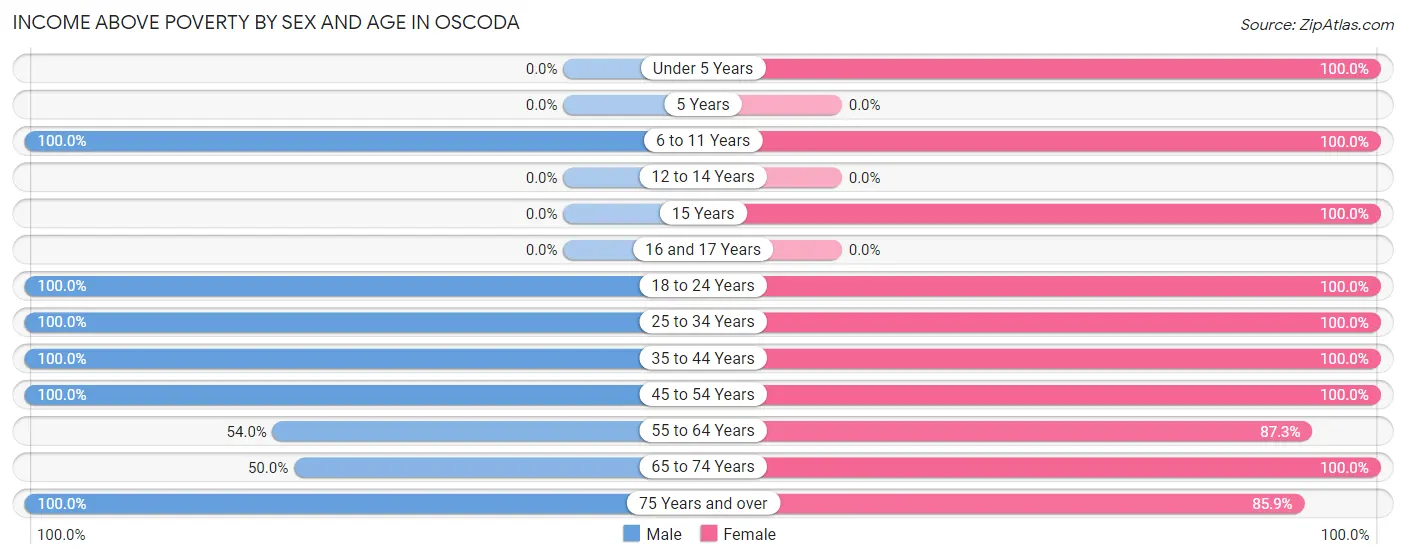
| Age Bracket | Male | Female |
| Under 5 Years | 0 (0.0%) | 13 (100.0%) |
| 5 Years | 0 (0.0%) | 0 (0.0%) |
| 6 to 11 Years | 37 (100.0%) | 30 (100.0%) |
| 12 to 14 Years | 0 (0.0%) | 0 (0.0%) |
| 15 Years | 0 (0.0%) | 11 (100.0%) |
| 16 and 17 Years | 0 (0.0%) | 0 (0.0%) |
| 18 to 24 Years | 120 (100.0%) | 11 (100.0%) |
| 25 to 34 Years | 26 (100.0%) | 58 (100.0%) |
| 35 to 44 Years | 104 (100.0%) | 34 (100.0%) |
| 45 to 54 Years | 21 (100.0%) | 77 (100.0%) |
| 55 to 64 Years | 75 (54.0%) | 69 (87.3%) |
| 65 to 74 Years | 9 (50.0%) | 30 (100.0%) |
| 75 Years and over | 18 (100.0%) | 79 (85.9%) |
| Total | 410 (84.9%) | 412 (94.7%) |
Income Below Poverty Among Married-Couple Families in Oscoda
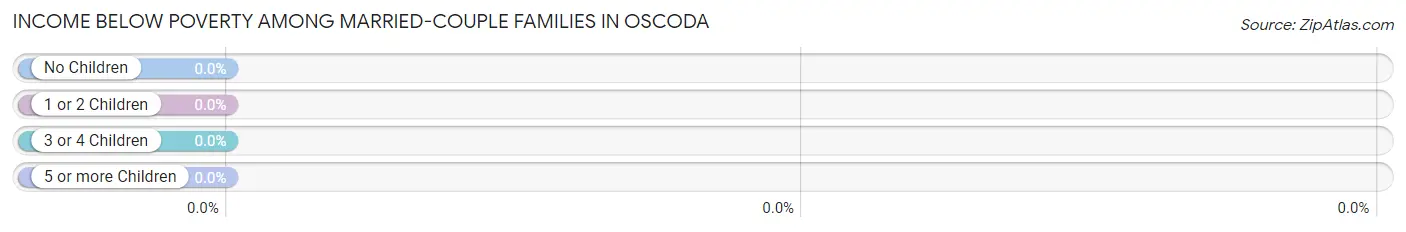
| Children | Above Poverty | Below Poverty |
| No Children | 113 (100.0%) | 0 (0.0%) |
| 1 or 2 Children | 18 (100.0%) | 0 (0.0%) |
| 3 or 4 Children | 0 (0.0%) | 0 (0.0%) |
| 5 or more Children | 0 (0.0%) | 0 (0.0%) |
| Total | 131 (100.0%) | 0 (0.0%) |
Income Below Poverty Among Single-Parent Households in Oscoda
| Children | Single Father | Single Mother |
| No Children | 0 (0.0%) | 0 (0.0%) |
| 1 or 2 Children | 0 (0.0%) | 0 (0.0%) |
| 3 or 4 Children | 0 (0.0%) | 0 (0.0%) |
| 5 or more Children | 0 (0.0%) | 0 (0.0%) |
| Total | 0 (0.0%) | 0 (0.0%) |
Income Below Poverty Among Married-Couple vs Single-Parent Households in Oscoda
| Children | Married-Couple Families | Single-Parent Households |
| No Children | 0 (0.0%) | 0 (0.0%) |
| 1 or 2 Children | 0 (0.0%) | 0 (0.0%) |
| 3 or 4 Children | 0 (0.0%) | 0 (0.0%) |
| 5 or more Children | 0 (0.0%) | 0 (0.0%) |
| Total | 0 (0.0%) | 0 (0.0%) |
Race in Oscoda
The most populous races in Oscoda are White / Caucasian (765 | 83.3%), Native / Alaskan (70 | 7.6%), and Hispanic or Latino (44 | 4.8%).
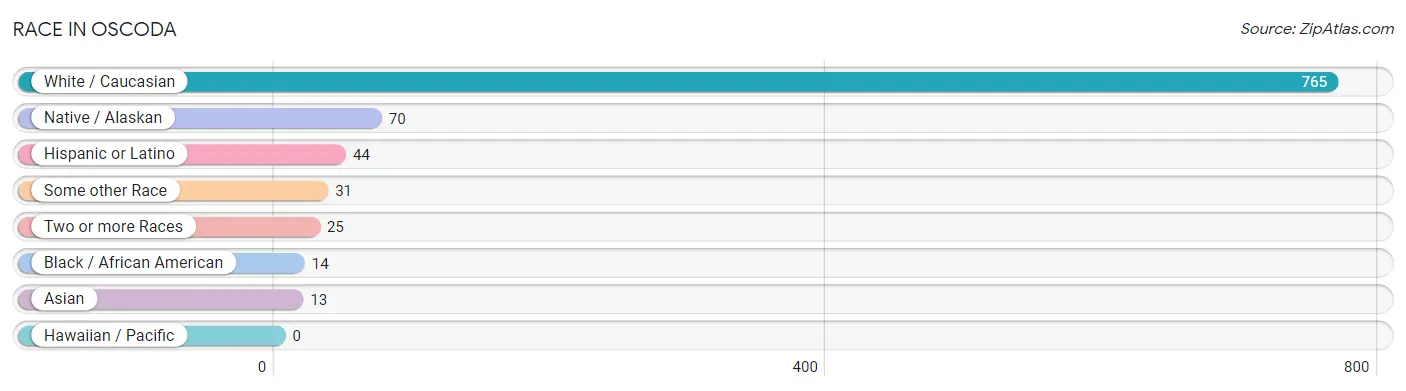
| Race | # Population | % Population |
| Asian | 13 | 1.4% |
| Black / African American | 14 | 1.5% |
| Hawaiian / Pacific | 0 | 0.0% |
| Hispanic or Latino | 44 | 4.8% |
| Native / Alaskan | 70 | 7.6% |
| White / Caucasian | 765 | 83.3% |
| Two or more Races | 25 | 2.7% |
| Some other Race | 31 | 3.4% |
| Total | 918 | 100.0% |
Ancestry in Oscoda
The most populous ancestries reported in Oscoda are German (337 | 36.7%), English (156 | 17.0%), Irish (118 | 12.9%), French (60 | 6.5%), and Polish (43 | 4.7%), together accounting for 77.8% of all Oscoda residents.
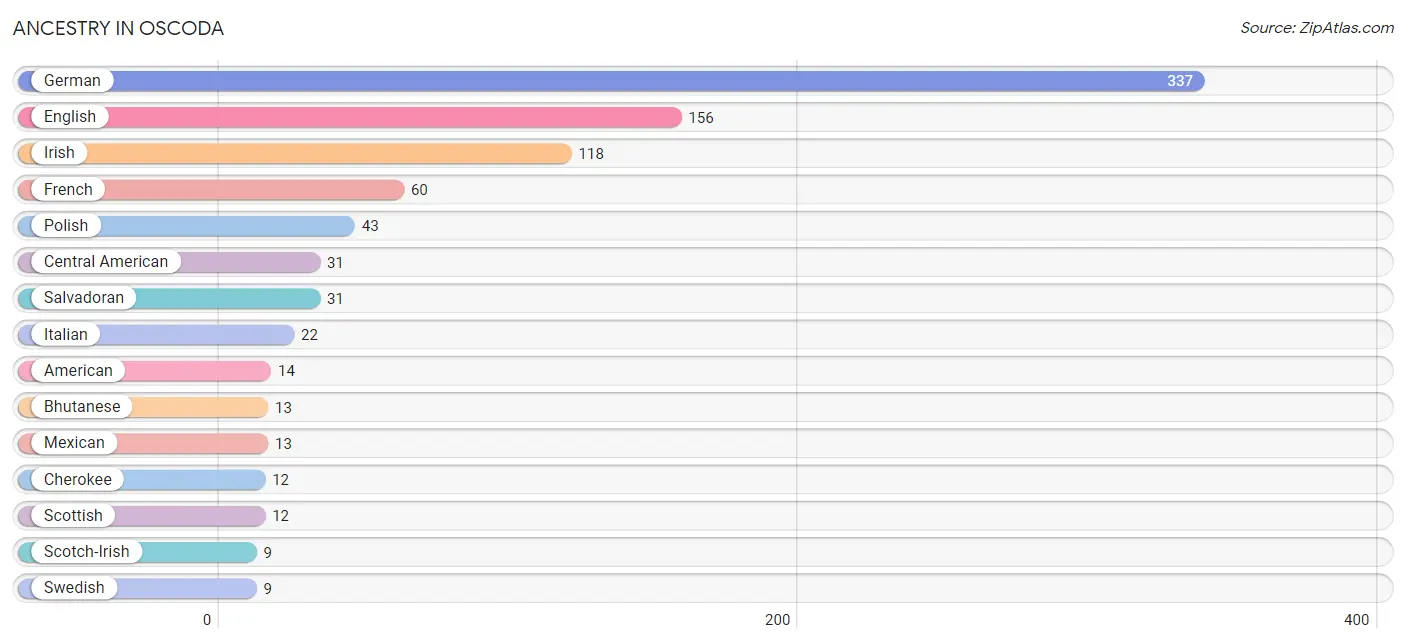
| Ancestry | # Population | % Population |
| American | 14 | 1.5% |
| Bhutanese | 13 | 1.4% |
| Canadian | 8 | 0.9% |
| Central American | 31 | 3.4% |
| Cherokee | 12 | 1.3% |
| Croatian | 4 | 0.4% |
| Danish | 8 | 0.9% |
| English | 156 | 17.0% |
| French | 60 | 6.5% |
| French Canadian | 4 | 0.4% |
| German | 337 | 36.7% |
| Irish | 118 | 12.9% |
| Italian | 22 | 2.4% |
| Mexican | 13 | 1.4% |
| Polish | 43 | 4.7% |
| Salvadoran | 31 | 3.4% |
| Scotch-Irish | 9 | 1.0% |
| Scottish | 12 | 1.3% |
| Swedish | 9 | 1.0% | View All 19 Rows |
Immigrants in Oscoda
The most numerous immigrant groups reported in Oscoda came from Central America (44 | 4.8%), Latin America (44 | 4.8%), El Salvador (31 | 3.4%), Asia (13 | 1.4%), and Eastern Asia (13 | 1.4%), together accounting for 15.8% of all Oscoda residents.
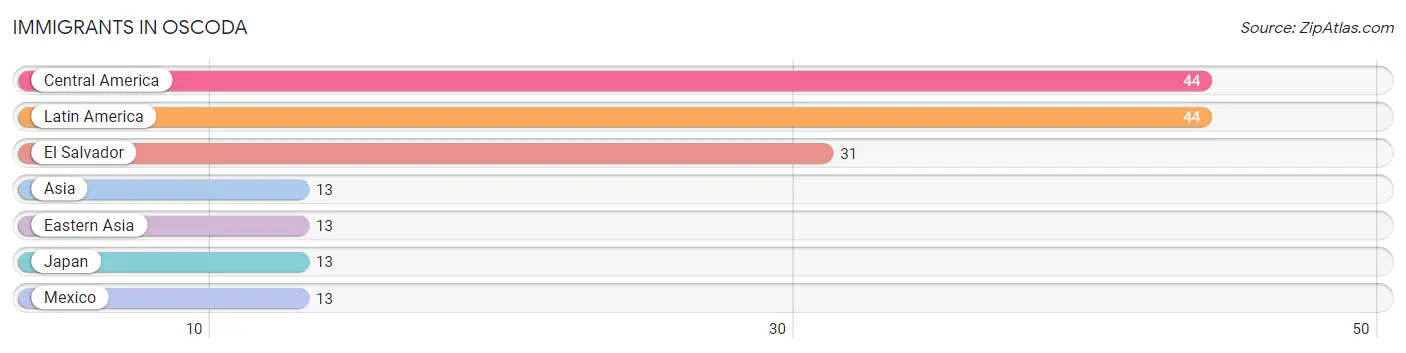
| Immigration Origin | # Population | % Population |
| Asia | 13 | 1.4% |
| Central America | 44 | 4.8% |
| Eastern Asia | 13 | 1.4% |
| El Salvador | 31 | 3.4% |
| Japan | 13 | 1.4% |
| Latin America | 44 | 4.8% |
| Mexico | 13 | 1.4% | View All 7 Rows |
Sex and Age in Oscoda
Sex and Age in Oscoda
The most populous age groups in Oscoda are 55 to 59 Years (77 | 15.9%) for men and 45 to 49 Years (55 | 12.6%) for women.
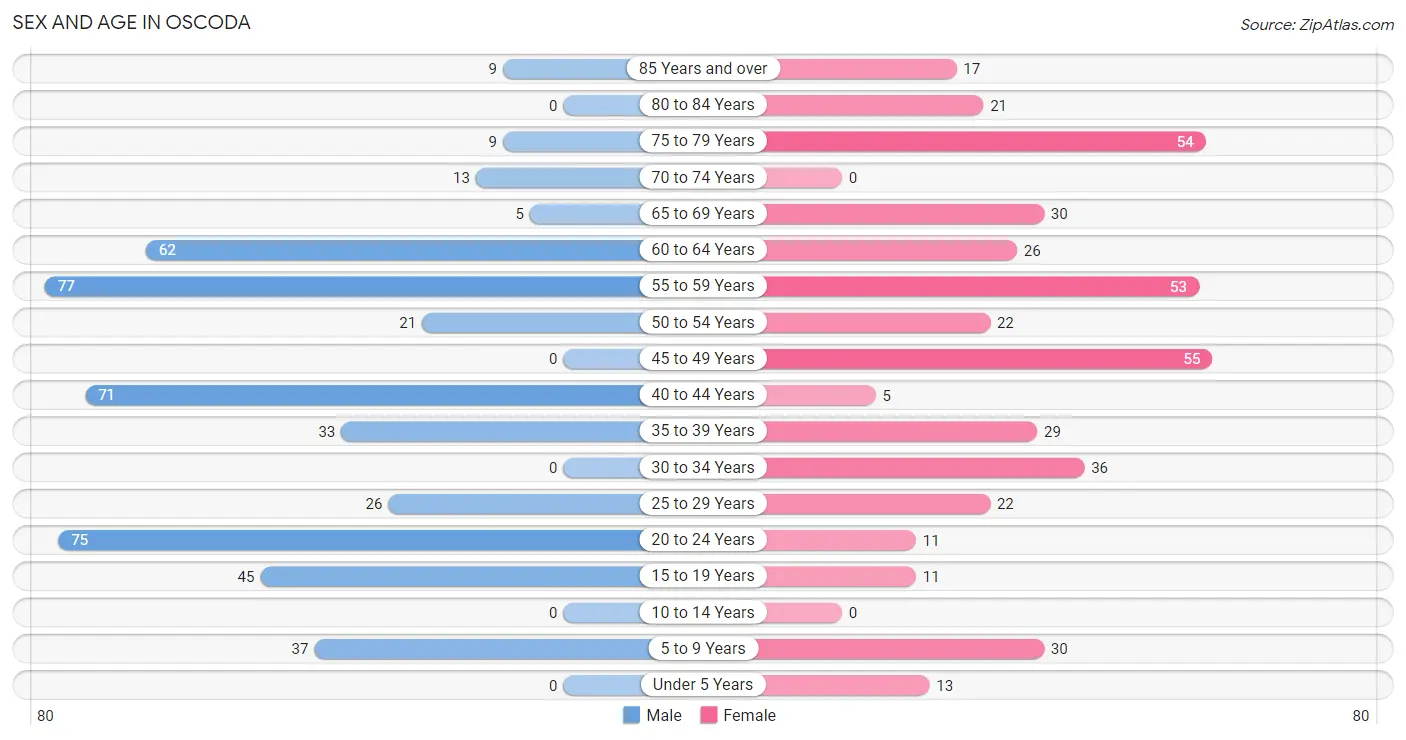
| Age Bracket | Male | Female |
| Under 5 Years | 0 (0.0%) | 13 (3.0%) |
| 5 to 9 Years | 37 (7.7%) | 30 (6.9%) |
| 10 to 14 Years | 0 (0.0%) | 0 (0.0%) |
| 15 to 19 Years | 45 (9.3%) | 11 (2.5%) |
| 20 to 24 Years | 75 (15.5%) | 11 (2.5%) |
| 25 to 29 Years | 26 (5.4%) | 22 (5.1%) |
| 30 to 34 Years | 0 (0.0%) | 36 (8.3%) |
| 35 to 39 Years | 33 (6.8%) | 29 (6.7%) |
| 40 to 44 Years | 71 (14.7%) | 5 (1.1%) |
| 45 to 49 Years | 0 (0.0%) | 55 (12.6%) |
| 50 to 54 Years | 21 (4.3%) | 22 (5.1%) |
| 55 to 59 Years | 77 (15.9%) | 53 (12.2%) |
| 60 to 64 Years | 62 (12.8%) | 26 (6.0%) |
| 65 to 69 Years | 5 (1.0%) | 30 (6.9%) |
| 70 to 74 Years | 13 (2.7%) | 0 (0.0%) |
| 75 to 79 Years | 9 (1.9%) | 54 (12.4%) |
| 80 to 84 Years | 0 (0.0%) | 21 (4.8%) |
| 85 Years and over | 9 (1.9%) | 17 (3.9%) |
| Total | 483 (100.0%) | 435 (100.0%) |
Families and Households in Oscoda
Median Family Size in Oscoda
The median family size in Oscoda is 3.38 persons per family, with single female/mother families (46 | 24.5%) accounting for the largest median family size of 5.5 persons per family. On the other hand, married-couple families (131 | 69.7%) represent the smallest median family size with 2.65 persons per family.
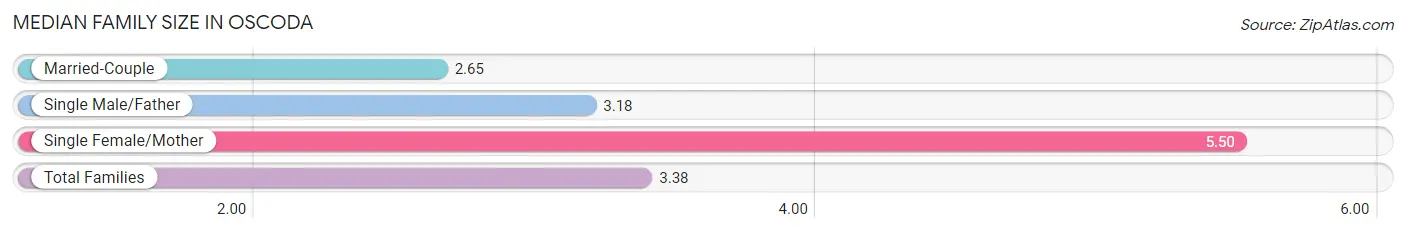
| Family Type | # Families | Family Size |
| Married-Couple | 131 (69.7%) | 2.65 |
| Single Male/Father | 11 (5.9%) | 3.18 |
| Single Female/Mother | 46 (24.5%) | 5.50 |
| Total Families | 188 (100.0%) | 3.38 |
Median Household Size in Oscoda
The median household size in Oscoda is 2.01 persons per household, with single female/mother households (46 | 10.2%) accounting for the largest median household size of 5.5 persons per household. non-family households (262 | 58.2%) represent the smallest median household size with 1.03 persons per household.
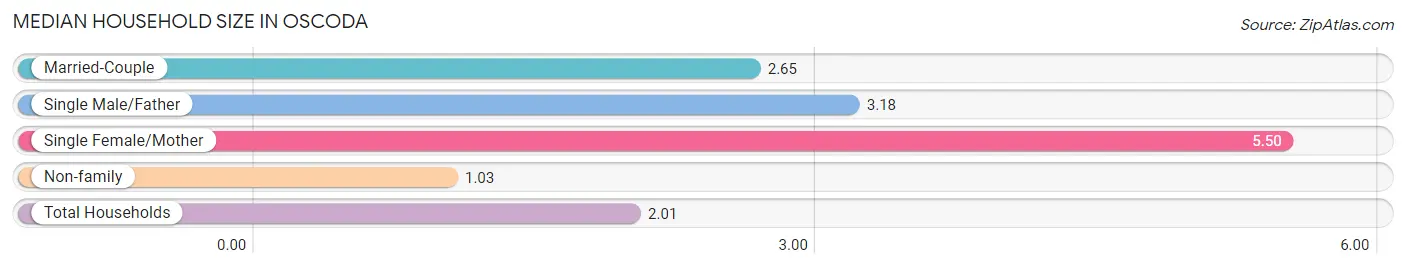
| Household Type | # Households | Household Size |
| Married-Couple | 131 (29.1%) | 2.65 |
| Single Male/Father | 11 (2.4%) | 3.18 |
| Single Female/Mother | 46 (10.2%) | 5.50 |
| Non-family | 262 (58.2%) | 1.03 |
| Total Households | 450 (100.0%) | 2.01 |
Household Size by Marriage Status in Oscoda
Out of a total of 450 households in Oscoda, 188 (41.8%) are family households, while 262 (58.2%) are nonfamily households. The most numerous type of family households are 2-person households, comprising 96, and the most common type of nonfamily households are 1-person households, comprising 257.
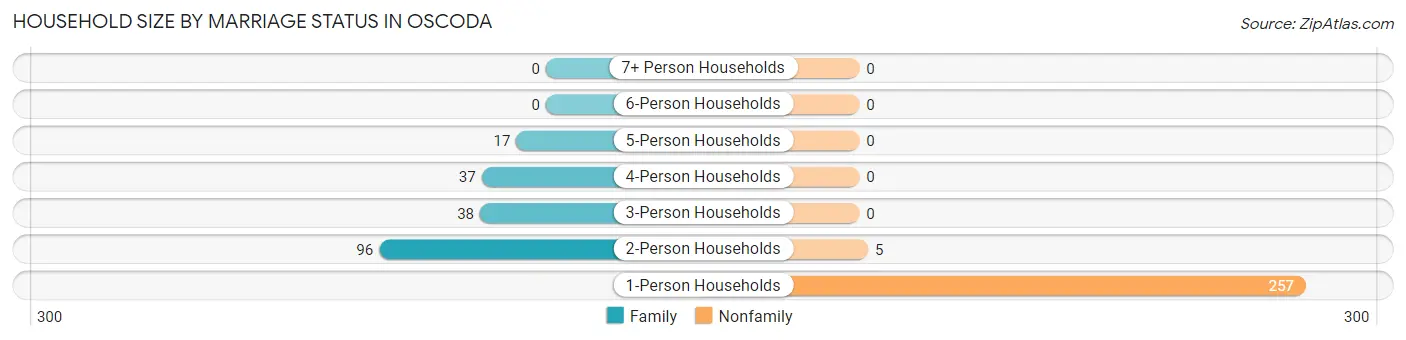
| Household Size | Family Households | Nonfamily Households |
| 1-Person Households | - | 257 (57.1%) |
| 2-Person Households | 96 (21.3%) | 5 (1.1%) |
| 3-Person Households | 38 (8.4%) | 0 (0.0%) |
| 4-Person Households | 37 (8.2%) | 0 (0.0%) |
| 5-Person Households | 17 (3.8%) | 0 (0.0%) |
| 6-Person Households | 0 (0.0%) | 0 (0.0%) |
| 7+ Person Households | 0 (0.0%) | 0 (0.0%) |
| Total | 188 (41.8%) | 262 (58.2%) |
Female Fertility in Oscoda
Fertility by Age in Oscoda
Average fertility rate in Oscoda is 118.0 births per 1,000 women. Women in the age bracket of 35 to 50 years have the highest fertility rate with 225.0 births per 1,000 women. Women in the age bracket of 35 to 50 years acount for 100.0% of all women with births.
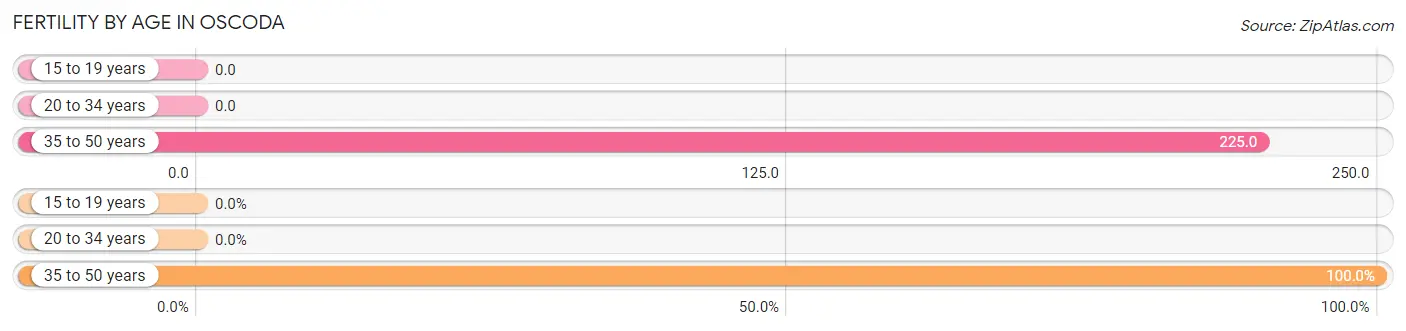
| Age Bracket | Women with Births | Births / 1,000 Women |
| 15 to 19 years | 0 (0.0%) | 0.0 |
| 20 to 34 years | 0 (0.0%) | 0.0 |
| 35 to 50 years | 20 (100.0%) | 225.0 |
| Total | 20 (100.0%) | 118.0 |
Fertility by Age by Marriage Status in Oscoda
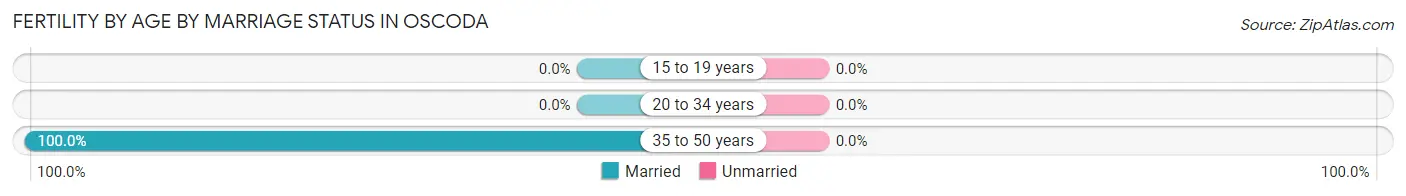
| Age Bracket | Married | Unmarried |
| 15 to 19 years | 0 (0.0%) | 0 (0.0%) |
| 20 to 34 years | 0 (0.0%) | 0 (0.0%) |
| 35 to 50 years | 20 (100.0%) | 0 (0.0%) |
| Total | 20 (100.0%) | 0 (0.0%) |
Fertility by Education in Oscoda
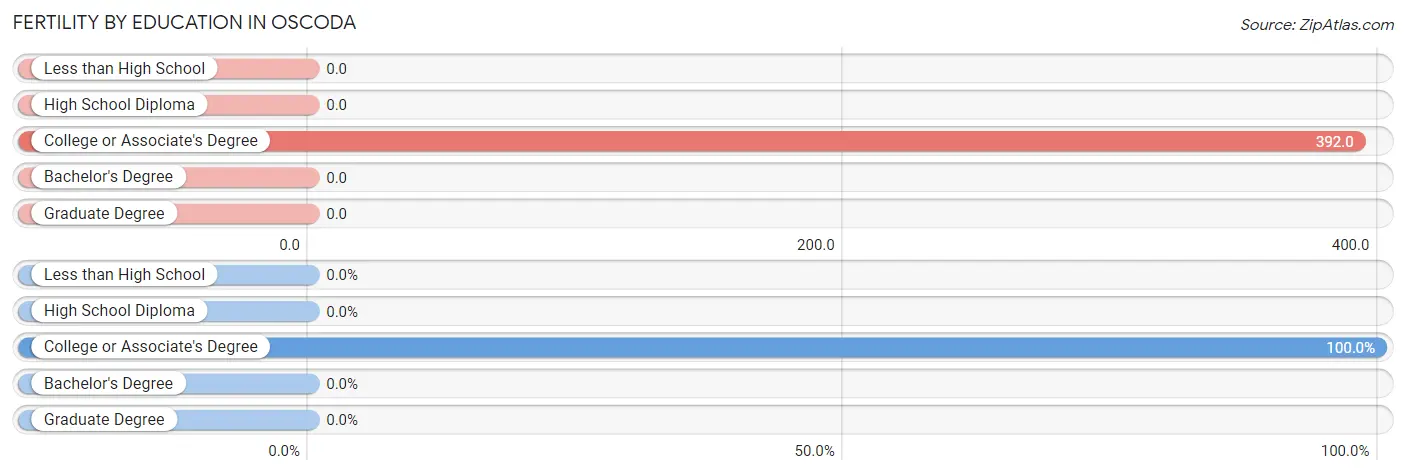
| Educational Attainment | Women with Births | Births / 1,000 Women |
| Less than High School | 0 (0.0%) | 0.0 |
| High School Diploma | 0 (0.0%) | 0.0 |
| College or Associate's Degree | 20 (100.0%) | 392.0 |
| Bachelor's Degree | 0 (0.0%) | 0.0 |
| Graduate Degree | 0 (0.0%) | 0.0 |
| Total | 20 (100.0%) | 118.0 |
Fertility by Education by Marriage Status in Oscoda
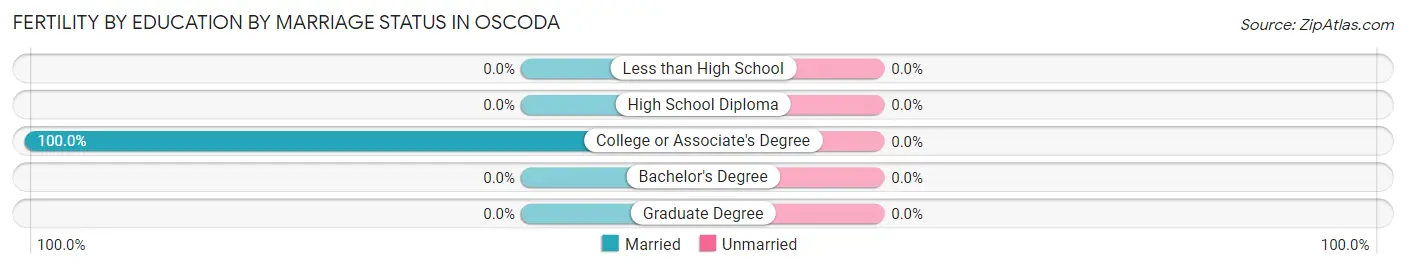
| Educational Attainment | Married | Unmarried |
| Less than High School | 0 (0.0%) | 0 (0.0%) |
| High School Diploma | 0 (0.0%) | 0 (0.0%) |
| College or Associate's Degree | 20 (100.0%) | 0 (0.0%) |
| Bachelor's Degree | 0 (0.0%) | 0 (0.0%) |
| Graduate Degree | 0 (0.0%) | 0 (0.0%) |
| Total | 20 (100.0%) | 0 (0.0%) |
Employment Characteristics in Oscoda
Employment by Class of Employer in Oscoda
Among the 308 employed individuals in Oscoda, private company employees (255 | 82.8%), local government employees (43 | 14.0%), and federal government employees (10 | 3.3%) make up the most common classes of employment.
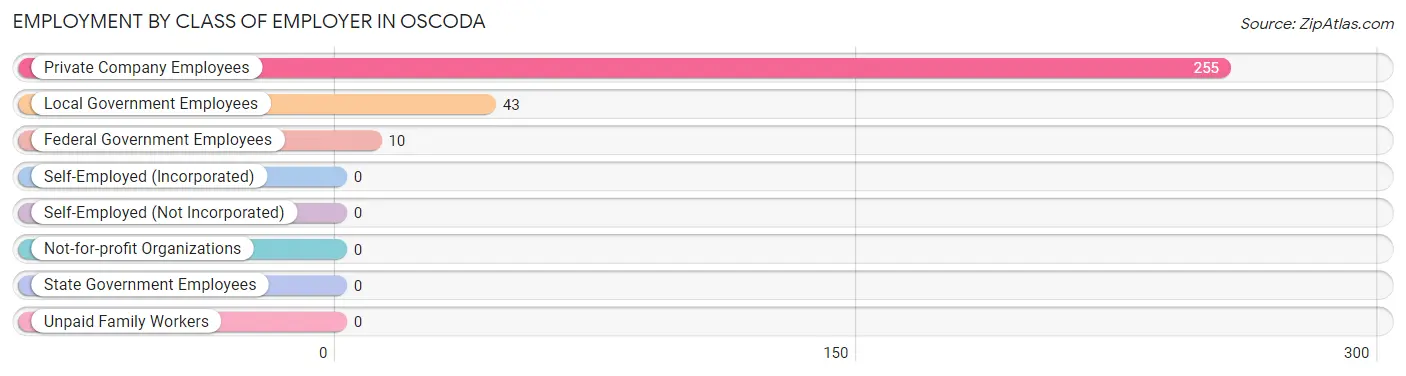
| Employer Class | # Employees | % Employees |
| Private Company Employees | 255 | 82.8% |
| Self-Employed (Incorporated) | 0 | 0.0% |
| Self-Employed (Not Incorporated) | 0 | 0.0% |
| Not-for-profit Organizations | 0 | 0.0% |
| Local Government Employees | 43 | 14.0% |
| State Government Employees | 0 | 0.0% |
| Federal Government Employees | 10 | 3.3% |
| Unpaid Family Workers | 0 | 0.0% |
| Total | 308 | 100.0% |
Employment Status by Age in Oscoda
According to the labor force statistics for Oscoda, out of the total population over 16 years of age (827), 40.9% or 338 individuals are in the labor force, with 8.9% or 30 of them unemployed. The age group with the highest labor force participation rate is 25 to 29 years, with 100.0% or 48 individuals in the labor force. Within the labor force, the 45 to 54 years age range has the highest percentage of unemployed individuals, with 41.1% or 30 of them being unemployed.
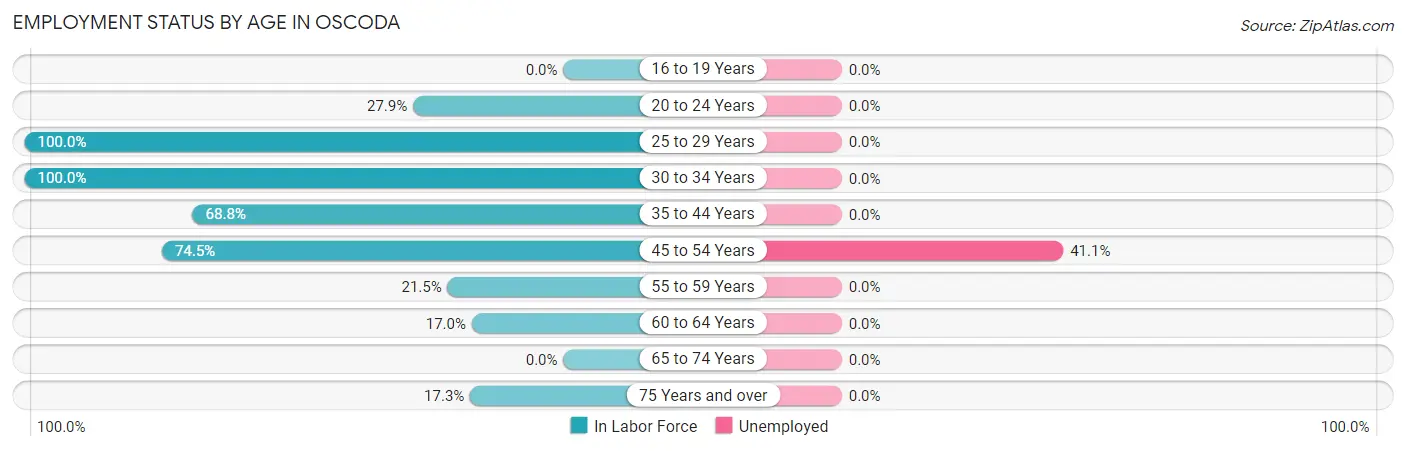
| Age Bracket | In Labor Force | Unemployed |
| 16 to 19 Years | 0 (0.0%) | 0 (0.0%) |
| 20 to 24 Years | 24 (27.9%) | 0 (0.0%) |
| 25 to 29 Years | 48 (100.0%) | 0 (0.0%) |
| 30 to 34 Years | 36 (100.0%) | 0 (0.0%) |
| 35 to 44 Years | 95 (68.8%) | 0 (0.0%) |
| 45 to 54 Years | 73 (74.5%) | 30 (41.1%) |
| 55 to 59 Years | 28 (21.5%) | 0 (0.0%) |
| 60 to 64 Years | 15 (17.0%) | 0 (0.0%) |
| 65 to 74 Years | 0 (0.0%) | 0 (0.0%) |
| 75 Years and over | 19 (17.3%) | 0 (0.0%) |
| Total | 338 (40.9%) | 30 (8.9%) |
Employment Status by Educational Attainment in Oscoda
According to labor force statistics for Oscoda, 54.8% of individuals (295) out of the total population between 25 and 64 years of age (538) are in the labor force, with 10.2% or 30 of them being unemployed. The group with the highest labor force participation rate are those with the educational attainment of bachelor's degree or higher, with 72.8% or 59 individuals in the labor force. Within the labor force, individuals with less than high school education have the highest percentage of unemployment, with 57.7% or 30 of them being unemployed.
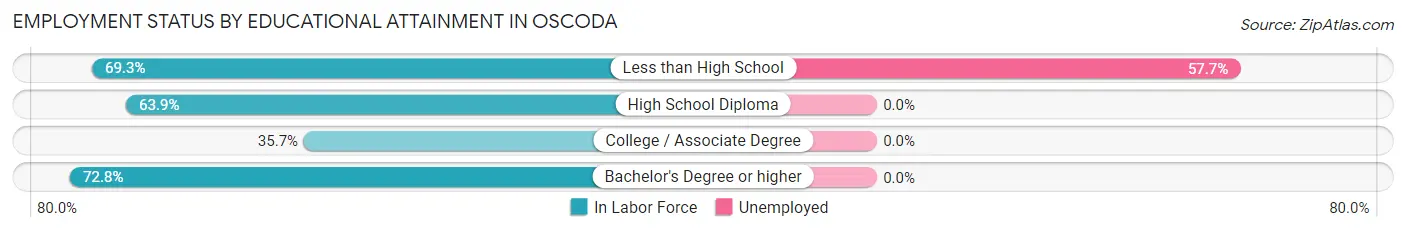
| Educational Attainment | In Labor Force | Unemployed |
| Less than High School | 52 (69.3%) | 43 (57.7%) |
| High School Diploma | 108 (63.9%) | 0 (0.0%) |
| College / Associate Degree | 76 (35.7%) | 0 (0.0%) |
| Bachelor's Degree or higher | 59 (72.8%) | 0 (0.0%) |
| Total | 295 (54.8%) | 55 (10.2%) |
Employment Occupations by Sex in Oscoda
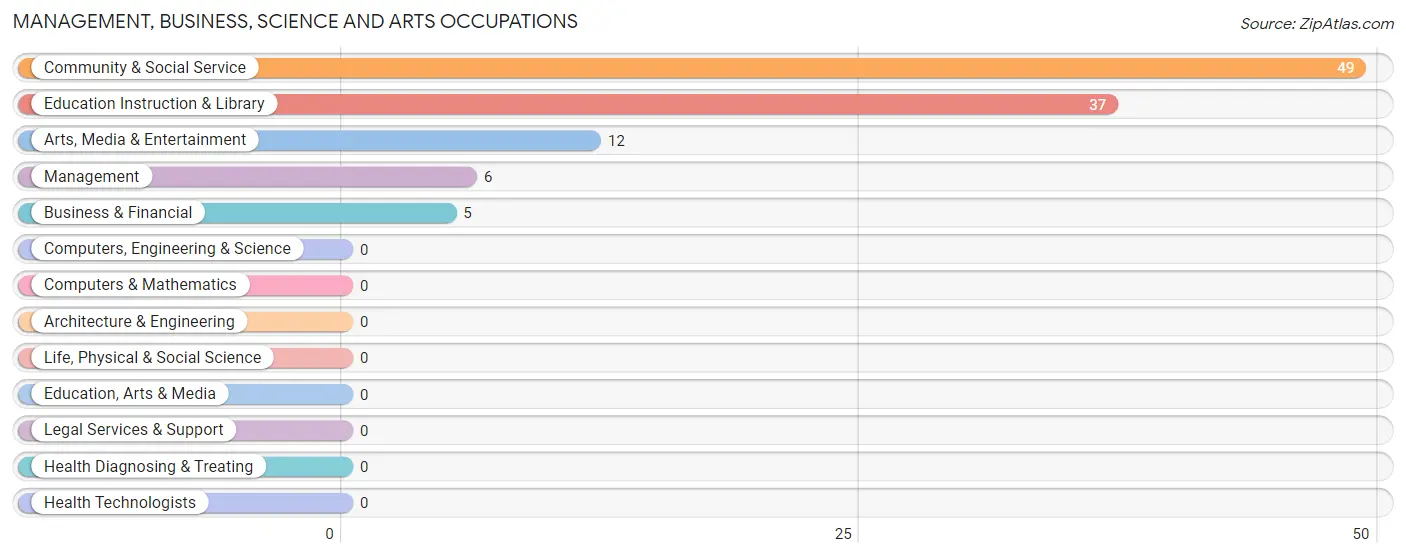
Management, Business, Science and Arts Occupations
The most common Management, Business, Science and Arts occupations in Oscoda are Community & Social Service (49 | 15.9%), Education Instruction & Library (37 | 12.0%), Arts, Media & Entertainment (12 | 3.9%), Management (6 | 1.9%), and Business & Financial (5 | 1.6%).
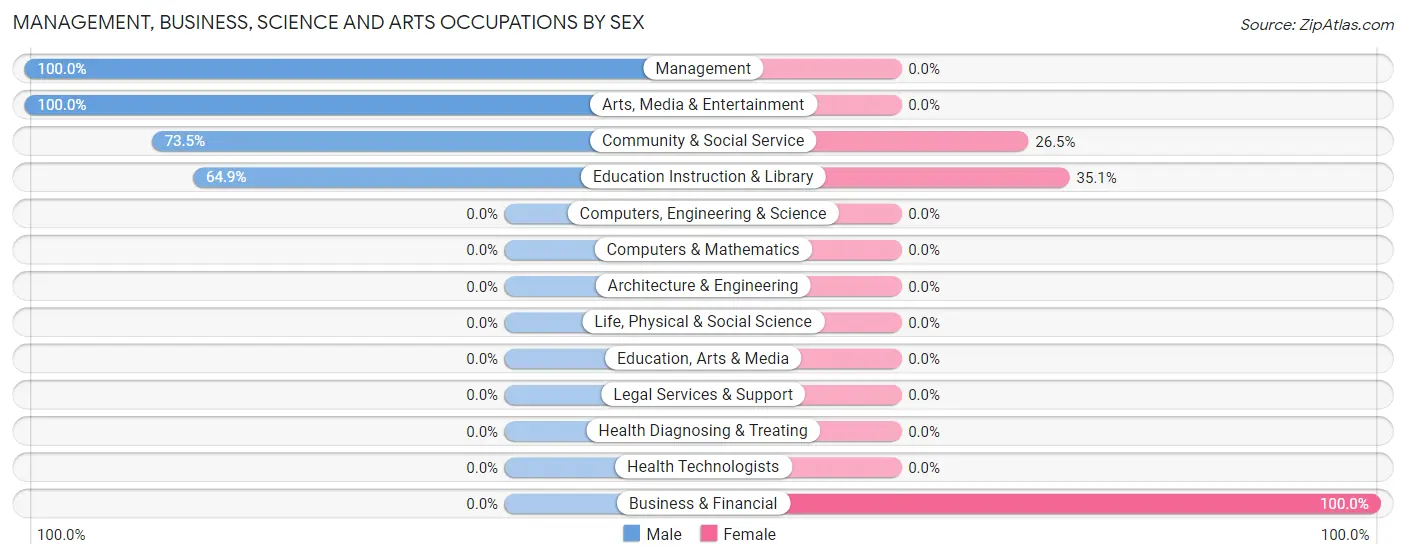
Management, Business, Science and Arts Occupations by Sex
Within the Management, Business, Science and Arts occupations in Oscoda, the most male-oriented occupations are Management (100.0%), Arts, Media & Entertainment (100.0%), and Community & Social Service (73.5%), while the most female-oriented occupations are Business & Financial (100.0%), Education Instruction & Library (35.1%), and Community & Social Service (26.5%).
| Occupation | Male | Female |
| Management | 6 (100.0%) | 0 (0.0%) |
| Business & Financial | 0 (0.0%) | 5 (100.0%) |
| Computers, Engineering & Science | 0 (0.0%) | 0 (0.0%) |
| Computers & Mathematics | 0 (0.0%) | 0 (0.0%) |
| Architecture & Engineering | 0 (0.0%) | 0 (0.0%) |
| Life, Physical & Social Science | 0 (0.0%) | 0 (0.0%) |
| Community & Social Service | 36 (73.5%) | 13 (26.5%) |
| Education, Arts & Media | 0 (0.0%) | 0 (0.0%) |
| Legal Services & Support | 0 (0.0%) | 0 (0.0%) |
| Education Instruction & Library | 24 (64.9%) | 13 (35.1%) |
| Arts, Media & Entertainment | 12 (100.0%) | 0 (0.0%) |
| Health Diagnosing & Treating | 0 (0.0%) | 0 (0.0%) |
| Health Technologists | 0 (0.0%) | 0 (0.0%) |
| Total (Category) | 42 (70.0%) | 18 (30.0%) |
| Total (Overall) | 166 (53.9%) | 142 (46.1%) |
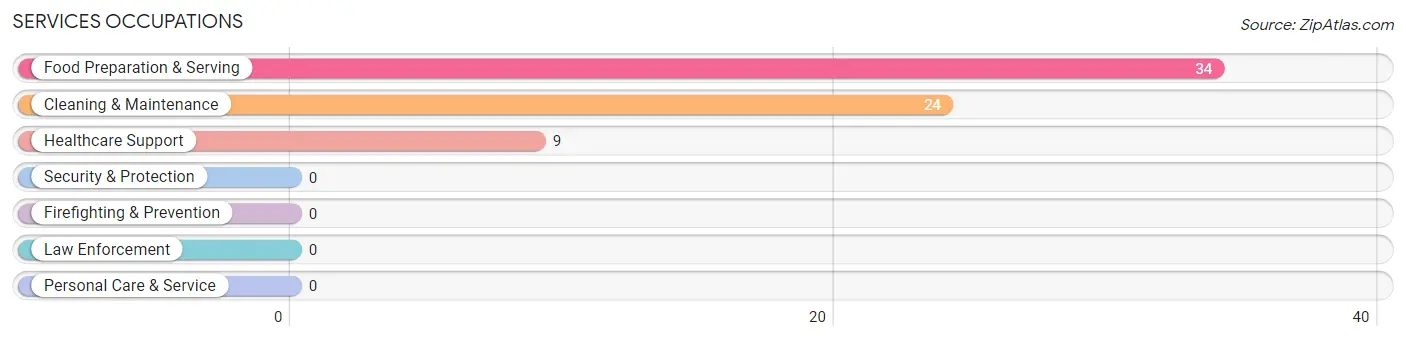
Services Occupations
The most common Services occupations in Oscoda are Food Preparation & Serving (34 | 11.0%), Cleaning & Maintenance (24 | 7.8%), and Healthcare Support (9 | 2.9%).
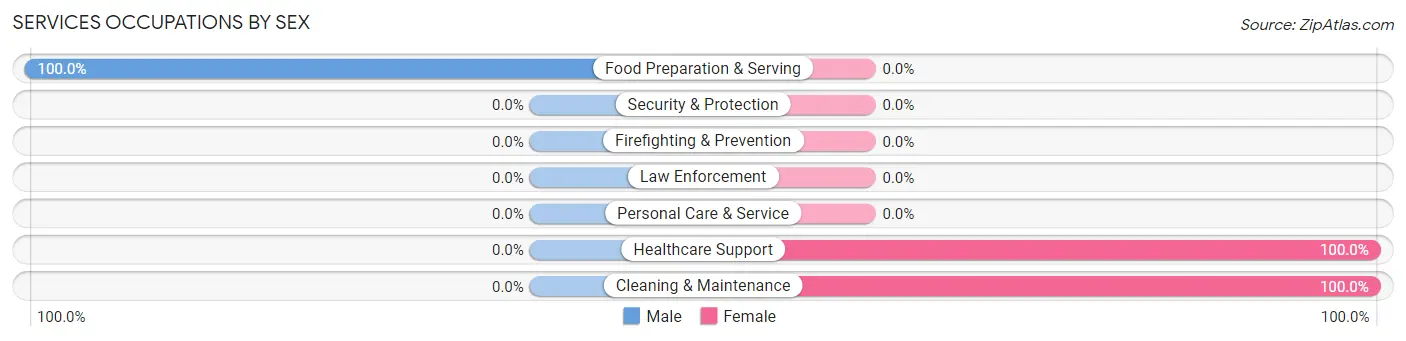
Services Occupations by Sex
| Occupation | Male | Female |
| Healthcare Support | 0 (0.0%) | 9 (100.0%) |
| Security & Protection | 0 (0.0%) | 0 (0.0%) |
| Firefighting & Prevention | 0 (0.0%) | 0 (0.0%) |
| Law Enforcement | 0 (0.0%) | 0 (0.0%) |
| Food Preparation & Serving | 34 (100.0%) | 0 (0.0%) |
| Cleaning & Maintenance | 0 (0.0%) | 24 (100.0%) |
| Personal Care & Service | 0 (0.0%) | 0 (0.0%) |
| Total (Category) | 34 (50.7%) | 33 (49.2%) |
| Total (Overall) | 166 (53.9%) | 142 (46.1%) |
Sales and Office Occupations
The most common Sales and Office occupations in Oscoda are Office & Administration (74 | 24.0%), and Sales & Related (20 | 6.5%).

Sales and Office Occupations by Sex

| Occupation | Male | Female |
| Sales & Related | 0 (0.0%) | 20 (100.0%) |
| Office & Administration | 13 (17.6%) | 61 (82.4%) |
| Total (Category) | 13 (13.8%) | 81 (86.2%) |
| Total (Overall) | 166 (53.9%) | 142 (46.1%) |
Natural Resources, Construction and Maintenance Occupations
The most common Natural Resources, Construction and Maintenance occupations in Oscoda are Construction & Extraction (31 | 10.1%), and Installation, Maintenance & Repair (31 | 10.1%).

Natural Resources, Construction and Maintenance Occupations by Sex

| Occupation | Male | Female |
| Farming, Fishing & Forestry | 0 (0.0%) | 0 (0.0%) |
| Construction & Extraction | 31 (100.0%) | 0 (0.0%) |
| Installation, Maintenance & Repair | 31 (100.0%) | 0 (0.0%) |
| Total (Category) | 62 (100.0%) | 0 (0.0%) |
| Total (Overall) | 166 (53.9%) | 142 (46.1%) |
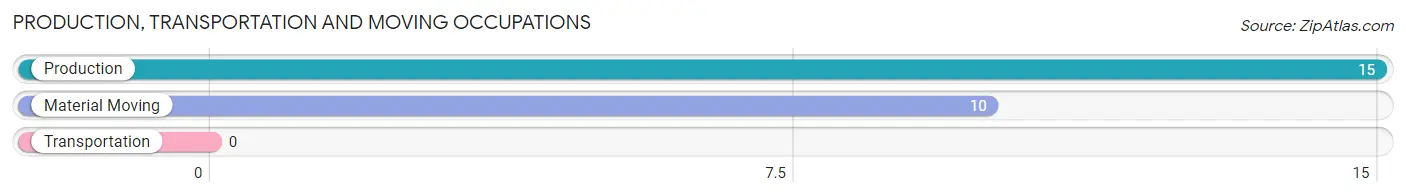
Production, Transportation and Moving Occupations
The most common Production, Transportation and Moving occupations in Oscoda are Production (15 | 4.9%), and Material Moving (10 | 3.3%).
Production, Transportation and Moving Occupations by Sex
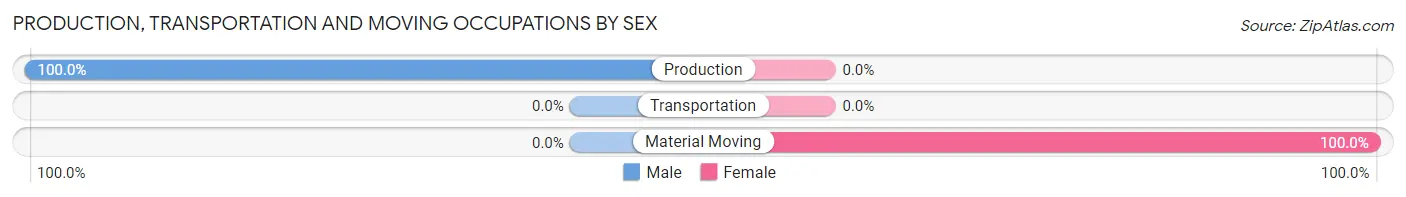
| Occupation | Male | Female |
| Production | 15 (100.0%) | 0 (0.0%) |
| Transportation | 0 (0.0%) | 0 (0.0%) |
| Material Moving | 0 (0.0%) | 10 (100.0%) |
| Total (Category) | 15 (60.0%) | 10 (40.0%) |
| Total (Overall) | 166 (53.9%) | 142 (46.1%) |
Employment Industries by Sex in Oscoda
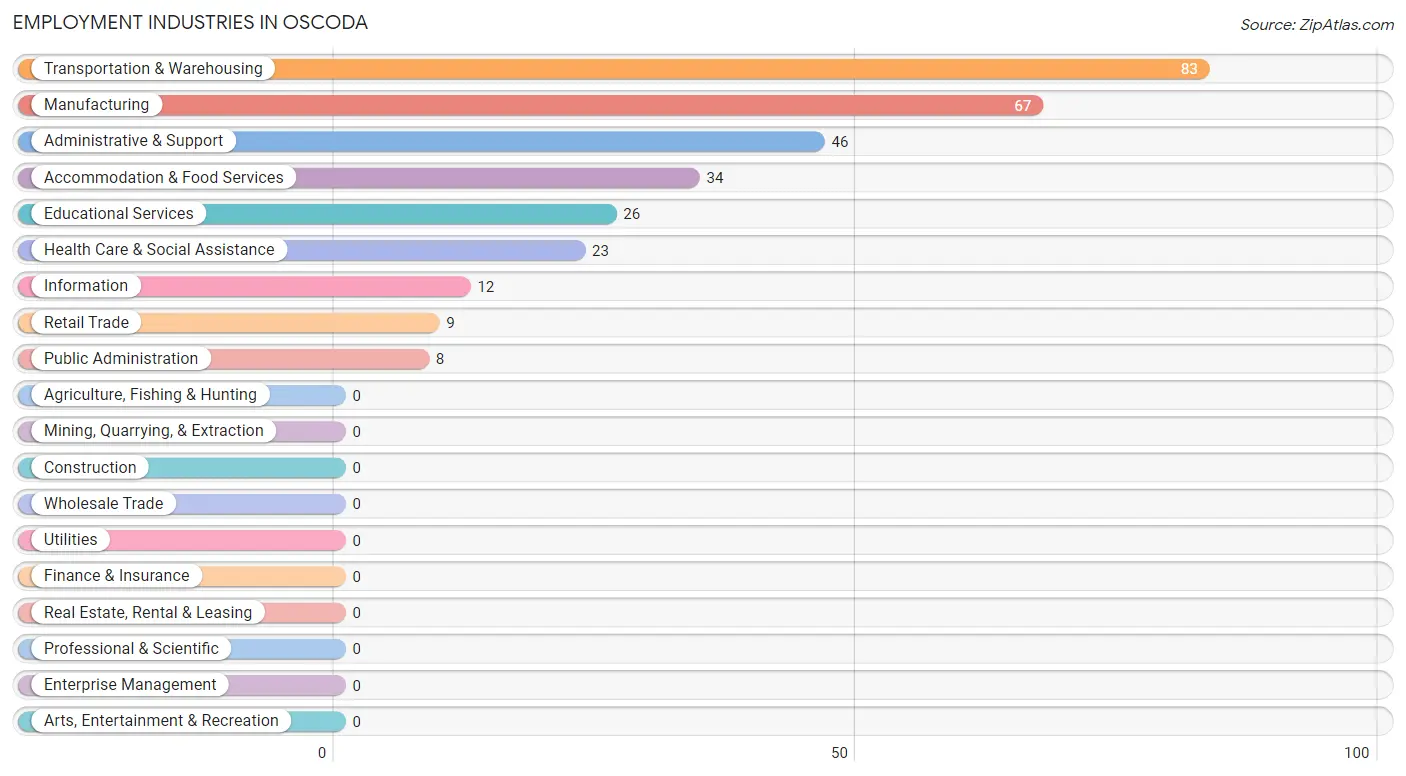
Employment Industries in Oscoda
The major employment industries in Oscoda include Transportation & Warehousing (83 | 27.0%), Manufacturing (67 | 21.7%), Administrative & Support (46 | 14.9%), Accommodation & Food Services (34 | 11.0%), and Educational Services (26 | 8.4%).
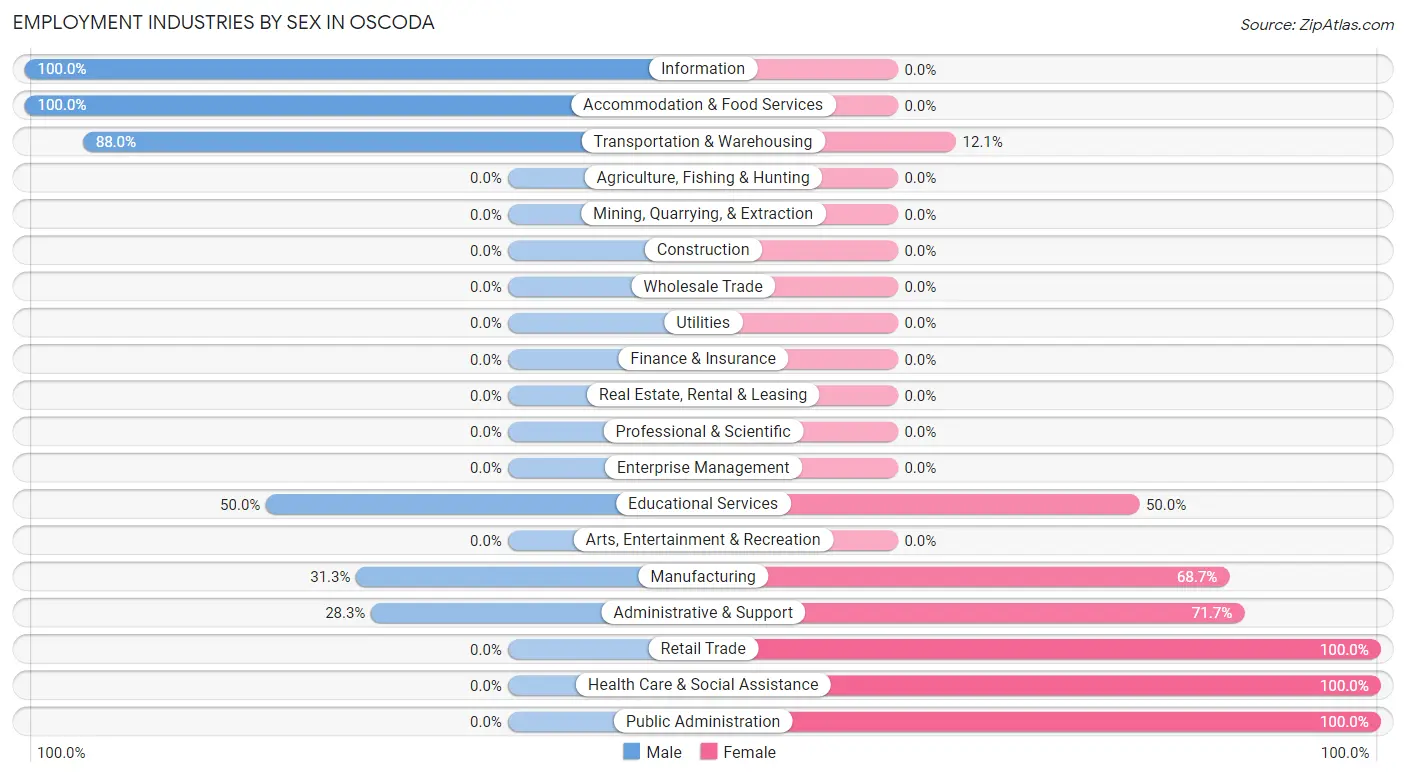
Employment Industries by Sex in Oscoda
The Oscoda industries that see more men than women are Information (100.0%), Accommodation & Food Services (100.0%), and Transportation & Warehousing (87.9%), whereas the industries that tend to have a higher number of women are Retail Trade (100.0%), Health Care & Social Assistance (100.0%), and Public Administration (100.0%).
| Industry | Male | Female |
| Agriculture, Fishing & Hunting | 0 (0.0%) | 0 (0.0%) |
| Mining, Quarrying, & Extraction | 0 (0.0%) | 0 (0.0%) |
| Construction | 0 (0.0%) | 0 (0.0%) |
| Manufacturing | 21 (31.3%) | 46 (68.7%) |
| Wholesale Trade | 0 (0.0%) | 0 (0.0%) |
| Retail Trade | 0 (0.0%) | 9 (100.0%) |
| Transportation & Warehousing | 73 (87.9%) | 10 (12.0%) |
| Utilities | 0 (0.0%) | 0 (0.0%) |
| Information | 12 (100.0%) | 0 (0.0%) |
| Finance & Insurance | 0 (0.0%) | 0 (0.0%) |
| Real Estate, Rental & Leasing | 0 (0.0%) | 0 (0.0%) |
| Professional & Scientific | 0 (0.0%) | 0 (0.0%) |
| Enterprise Management | 0 (0.0%) | 0 (0.0%) |
| Administrative & Support | 13 (28.3%) | 33 (71.7%) |
| Educational Services | 13 (50.0%) | 13 (50.0%) |
| Health Care & Social Assistance | 0 (0.0%) | 23 (100.0%) |
| Arts, Entertainment & Recreation | 0 (0.0%) | 0 (0.0%) |
| Accommodation & Food Services | 34 (100.0%) | 0 (0.0%) |
| Public Administration | 0 (0.0%) | 8 (100.0%) |
| Total | 166 (53.9%) | 142 (46.1%) |
Education in Oscoda
School Enrollment in Oscoda
The most common levels of schooling among the 128 students in Oscoda are elementary school (62 | 48.4%), college / undergraduate (37 | 28.9%), and graduate / professional (13 | 10.2%).
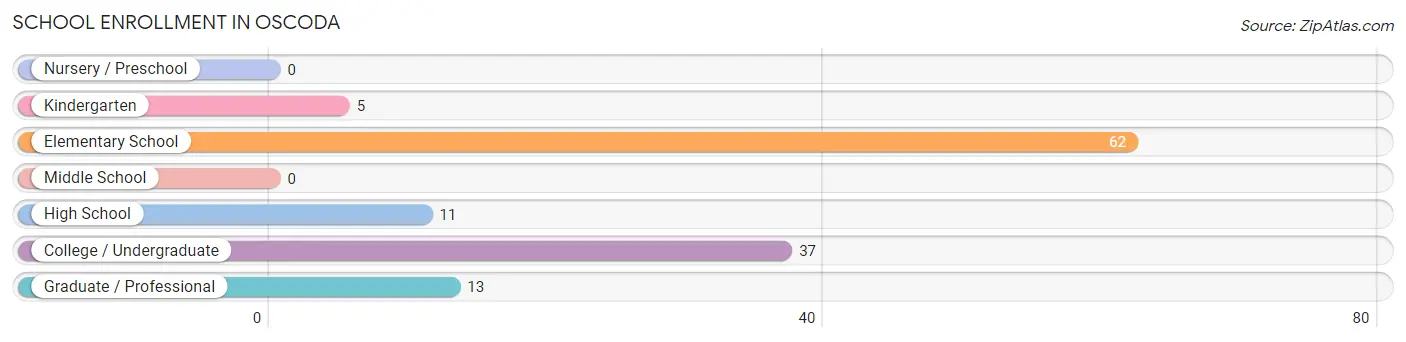
| School Level | # Students | % Students |
| Nursery / Preschool | 0 | 0.0% |
| Kindergarten | 5 | 3.9% |
| Elementary School | 62 | 48.4% |
| Middle School | 0 | 0.0% |
| High School | 11 | 8.6% |
| College / Undergraduate | 37 | 28.9% |
| Graduate / Professional | 13 | 10.2% |
| Total | 128 | 100.0% |
School Enrollment by Age by Funding Source in Oscoda
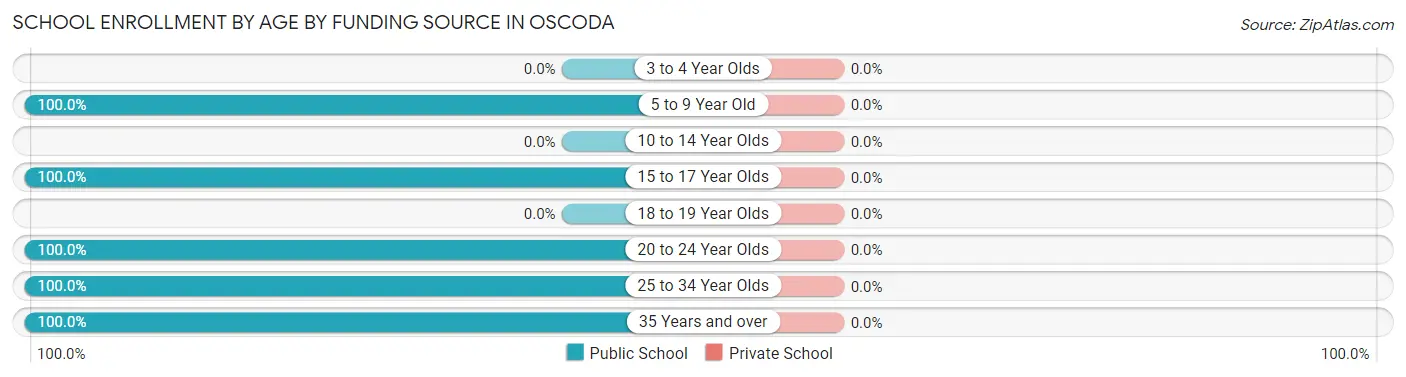
| Age Bracket | Public School | Private School |
| 3 to 4 Year Olds | 0 (0.0%) | 0 (0.0%) |
| 5 to 9 Year Old | 67 (100.0%) | 0 (0.0%) |
| 10 to 14 Year Olds | 0 (0.0%) | 0 (0.0%) |
| 15 to 17 Year Olds | 11 (100.0%) | 0 (0.0%) |
| 18 to 19 Year Olds | 0 (0.0%) | 0 (0.0%) |
| 20 to 24 Year Olds | 25 (100.0%) | 0 (0.0%) |
| 25 to 34 Year Olds | 13 (100.0%) | 0 (0.0%) |
| 35 Years and over | 12 (100.0%) | 0 (0.0%) |
| Total | 128 (100.0%) | 0 (0.0%) |
Educational Attainment by Field of Study in Oscoda
Business (31 | 24.8%), bio, nature & agricultural (26 | 20.8%), engineering (21 | 16.8%), education (14 | 11.2%), and literature & languages (12 | 9.6%) are the most common fields of study among 125 individuals in Oscoda who have obtained a bachelor's degree or higher.
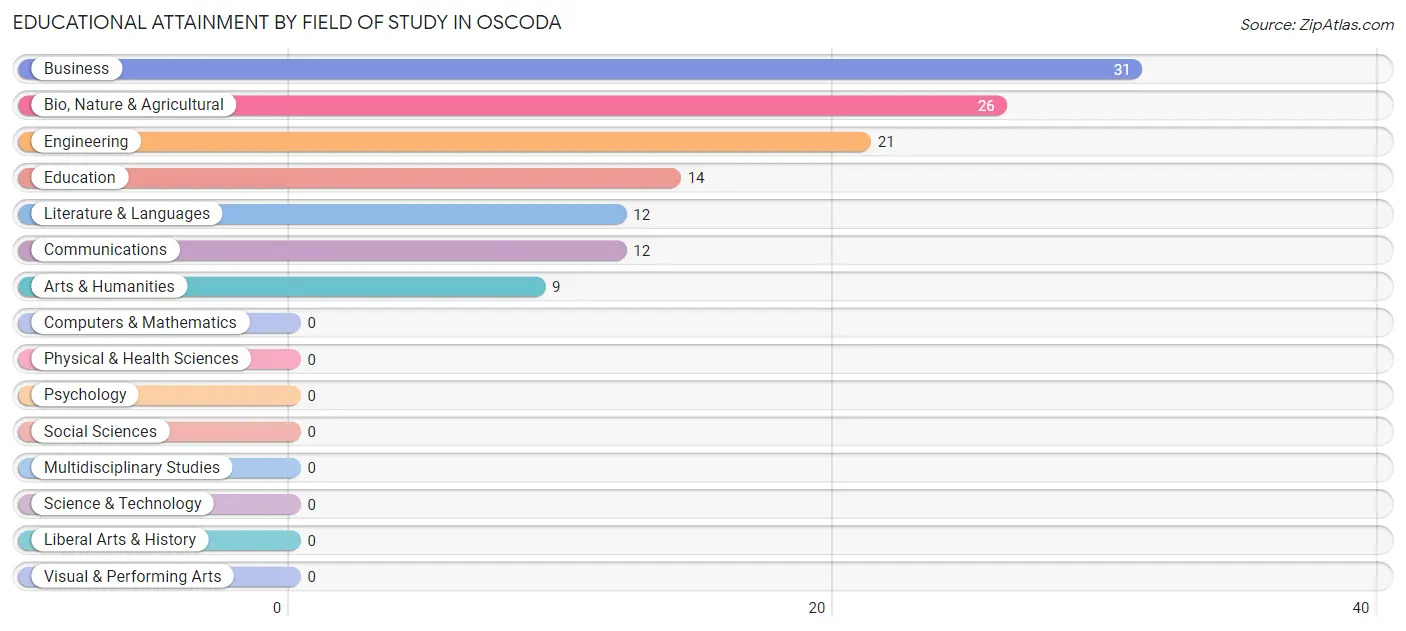
| Field of Study | # Graduates | % Graduates |
| Computers & Mathematics | 0 | 0.0% |
| Bio, Nature & Agricultural | 26 | 20.8% |
| Physical & Health Sciences | 0 | 0.0% |
| Psychology | 0 | 0.0% |
| Social Sciences | 0 | 0.0% |
| Engineering | 21 | 16.8% |
| Multidisciplinary Studies | 0 | 0.0% |
| Science & Technology | 0 | 0.0% |
| Business | 31 | 24.8% |
| Education | 14 | 11.2% |
| Literature & Languages | 12 | 9.6% |
| Liberal Arts & History | 0 | 0.0% |
| Visual & Performing Arts | 0 | 0.0% |
| Communications | 12 | 9.6% |
| Arts & Humanities | 9 | 7.2% |
| Total | 125 | 100.0% |
Transportation & Commute in Oscoda
Vehicle Availability by Sex in Oscoda
The most prevalent vehicle ownership categories in Oscoda are males with 1 vehicle (93, accounting for 56.0%) and females with 1 vehicle (82, making up 65.5%).
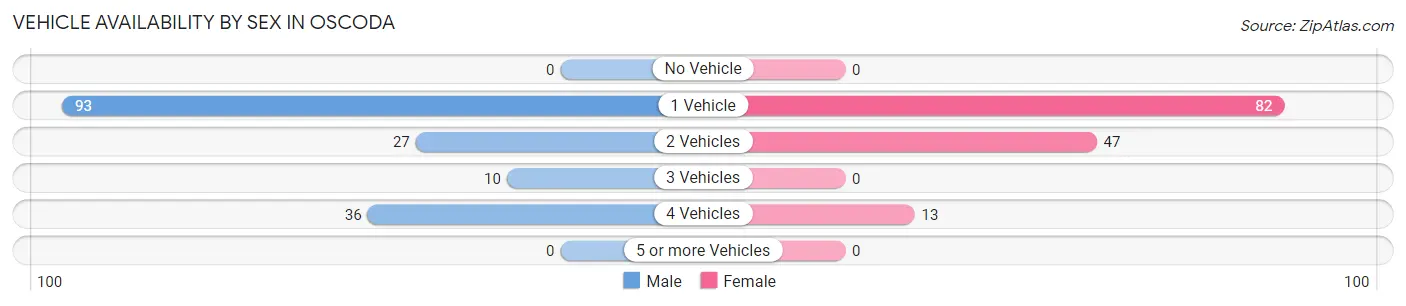
| Vehicles Available | Male | Female |
| No Vehicle | 0 (0.0%) | 0 (0.0%) |
| 1 Vehicle | 93 (56.0%) | 82 (57.8%) |
| 2 Vehicles | 27 (16.3%) | 47 (33.1%) |
| 3 Vehicles | 10 (6.0%) | 0 (0.0%) |
| 4 Vehicles | 36 (21.7%) | 13 (9.1%) |
| 5 or more Vehicles | 0 (0.0%) | 0 (0.0%) |
| Total | 166 (100.0%) | 142 (100.0%) |
Commute Time in Oscoda
The most frequently occuring commute durations in Oscoda are 10 to 14 minutes (97 commuters, 35.1%), less than 5 minutes (91 commuters, 33.0%), and 15 to 19 minutes (46 commuters, 16.7%).
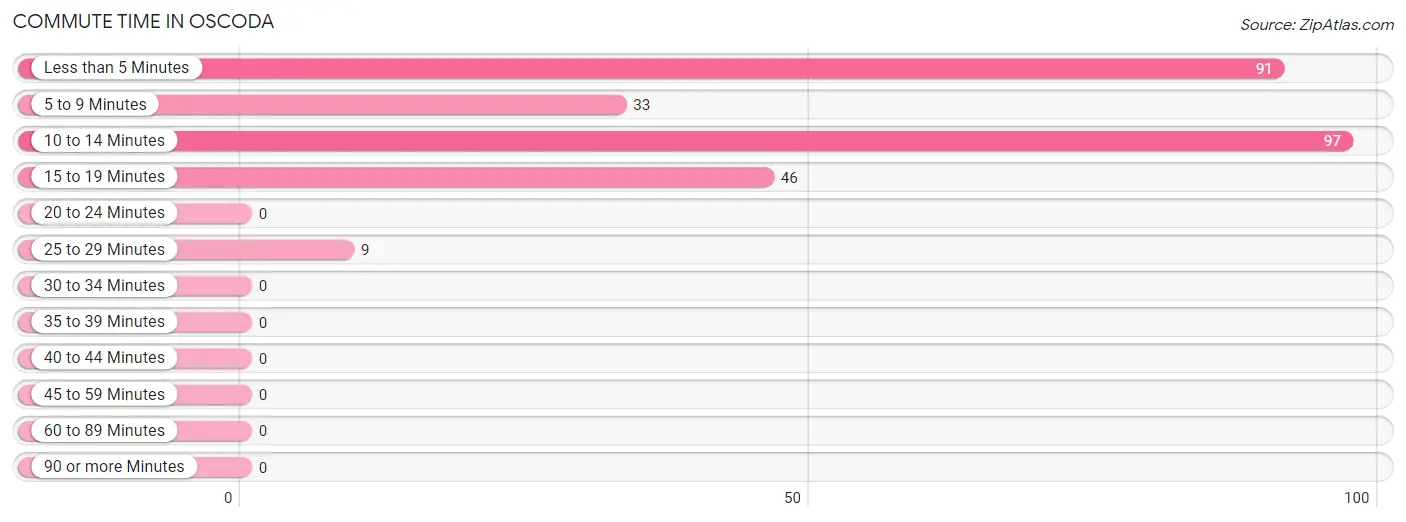
| Commute Time | # Commuters | % Commuters |
| Less than 5 Minutes | 91 | 33.0% |
| 5 to 9 Minutes | 33 | 12.0% |
| 10 to 14 Minutes | 97 | 35.1% |
| 15 to 19 Minutes | 46 | 16.7% |
| 20 to 24 Minutes | 0 | 0.0% |
| 25 to 29 Minutes | 9 | 3.3% |
| 30 to 34 Minutes | 0 | 0.0% |
| 35 to 39 Minutes | 0 | 0.0% |
| 40 to 44 Minutes | 0 | 0.0% |
| 45 to 59 Minutes | 0 | 0.0% |
| 60 to 89 Minutes | 0 | 0.0% |
| 90 or more Minutes | 0 | 0.0% |
Commute Time by Sex in Oscoda
The most common commute times in Oscoda are 10 to 14 minutes (57 commuters, 38.5%) for males and less than 5 minutes (70 commuters, 54.7%) for females.
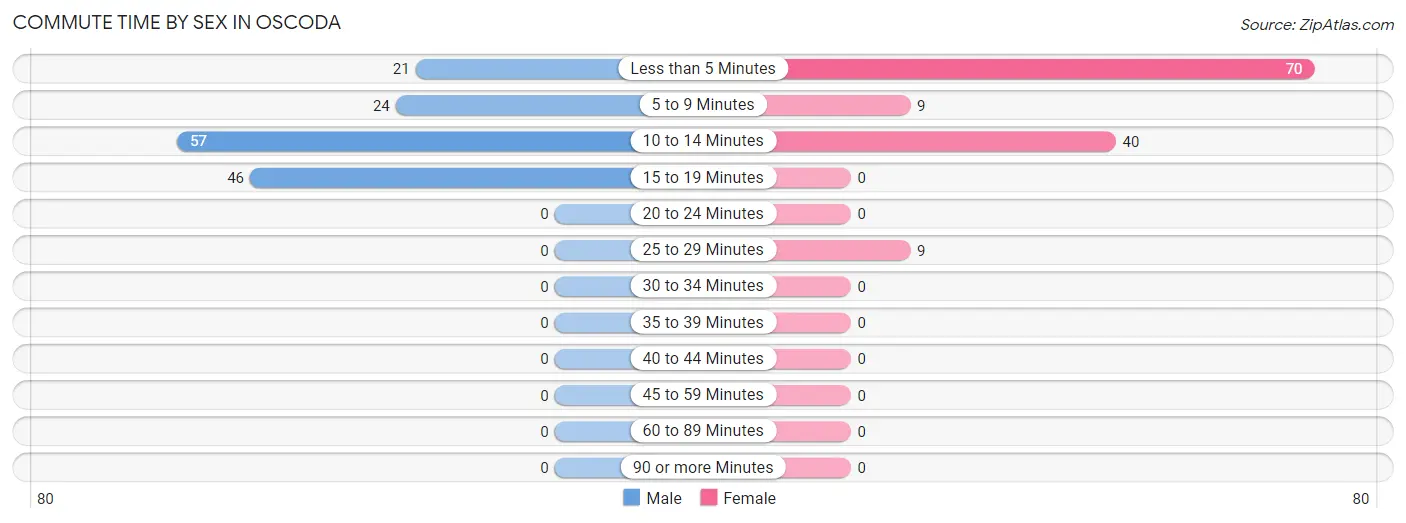
| Commute Time | Male | Female |
| Less than 5 Minutes | 21 (14.2%) | 70 (54.7%) |
| 5 to 9 Minutes | 24 (16.2%) | 9 (7.0%) |
| 10 to 14 Minutes | 57 (38.5%) | 40 (31.2%) |
| 15 to 19 Minutes | 46 (31.1%) | 0 (0.0%) |
| 20 to 24 Minutes | 0 (0.0%) | 0 (0.0%) |
| 25 to 29 Minutes | 0 (0.0%) | 9 (7.0%) |
| 30 to 34 Minutes | 0 (0.0%) | 0 (0.0%) |
| 35 to 39 Minutes | 0 (0.0%) | 0 (0.0%) |
| 40 to 44 Minutes | 0 (0.0%) | 0 (0.0%) |
| 45 to 59 Minutes | 0 (0.0%) | 0 (0.0%) |
| 60 to 89 Minutes | 0 (0.0%) | 0 (0.0%) |
| 90 or more Minutes | 0 (0.0%) | 0 (0.0%) |
Time of Departure to Work by Sex in Oscoda
The most frequent times of departure to work in Oscoda are 12:00 PM to 3:59 PM (44, 29.7%) for males and 7:30 AM to 7:59 AM (46, 35.9%) for females.
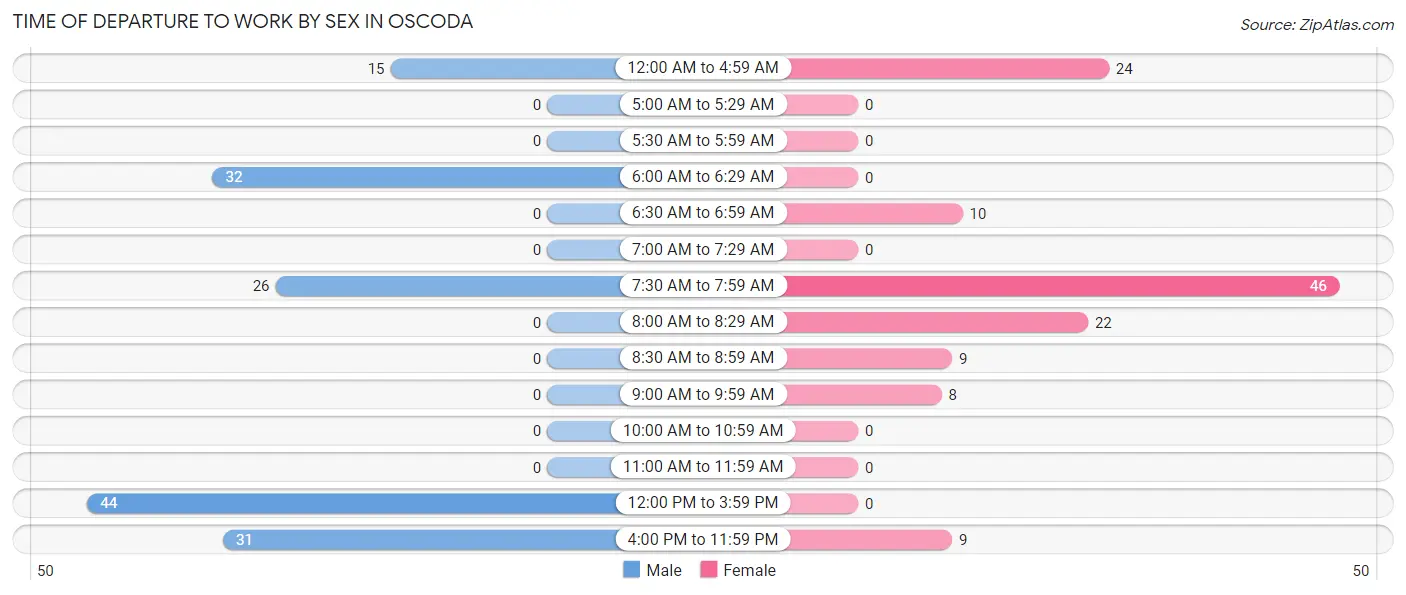
| Time of Departure | Male | Female |
| 12:00 AM to 4:59 AM | 15 (10.1%) | 24 (18.8%) |
| 5:00 AM to 5:29 AM | 0 (0.0%) | 0 (0.0%) |
| 5:30 AM to 5:59 AM | 0 (0.0%) | 0 (0.0%) |
| 6:00 AM to 6:29 AM | 32 (21.6%) | 0 (0.0%) |
| 6:30 AM to 6:59 AM | 0 (0.0%) | 10 (7.8%) |
| 7:00 AM to 7:29 AM | 0 (0.0%) | 0 (0.0%) |
| 7:30 AM to 7:59 AM | 26 (17.6%) | 46 (35.9%) |
| 8:00 AM to 8:29 AM | 0 (0.0%) | 22 (17.2%) |
| 8:30 AM to 8:59 AM | 0 (0.0%) | 9 (7.0%) |
| 9:00 AM to 9:59 AM | 0 (0.0%) | 8 (6.2%) |
| 10:00 AM to 10:59 AM | 0 (0.0%) | 0 (0.0%) |
| 11:00 AM to 11:59 AM | 0 (0.0%) | 0 (0.0%) |
| 12:00 PM to 3:59 PM | 44 (29.7%) | 0 (0.0%) |
| 4:00 PM to 11:59 PM | 31 (20.9%) | 9 (7.0%) |
| Total | 148 (100.0%) | 128 (100.0%) |
Housing Occupancy in Oscoda
Occupancy by Ownership in Oscoda
Of the total 450 dwellings in Oscoda, owner-occupied units account for 274 (60.9%), while renter-occupied units make up 176 (39.1%).
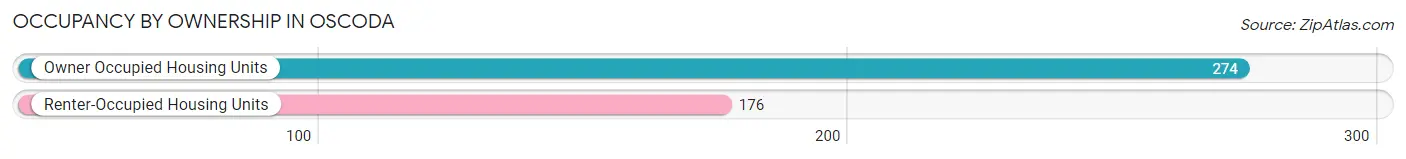
| Occupancy | # Housing Units | % Housing Units |
| Owner Occupied Housing Units | 274 | 60.9% |
| Renter-Occupied Housing Units | 176 | 39.1% |
| Total Occupied Housing Units | 450 | 100.0% |
Occupancy by Household Size in Oscoda
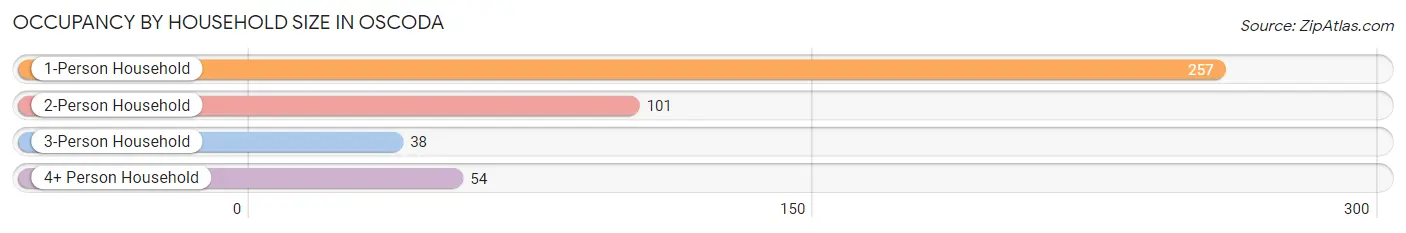
| Household Size | # Housing Units | % Housing Units |
| 1-Person Household | 257 | 57.1% |
| 2-Person Household | 101 | 22.4% |
| 3-Person Household | 38 | 8.4% |
| 4+ Person Household | 54 | 12.0% |
| Total Housing Units | 450 | 100.0% |
Occupancy by Ownership by Household Size in Oscoda
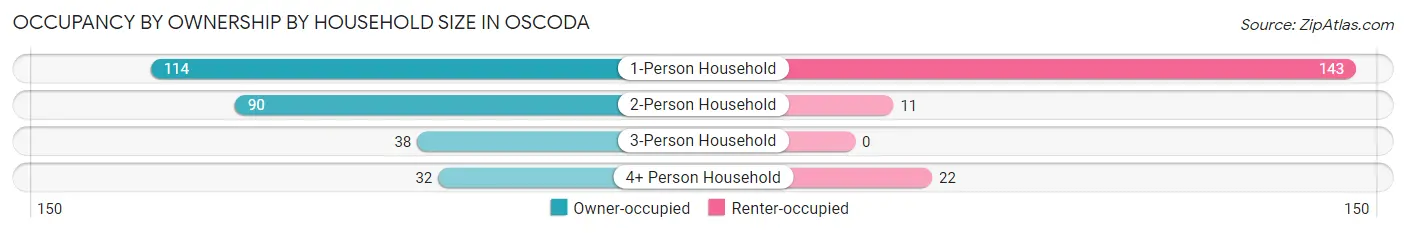
| Household Size | Owner-occupied | Renter-occupied |
| 1-Person Household | 114 (44.4%) | 143 (55.6%) |
| 2-Person Household | 90 (89.1%) | 11 (10.9%) |
| 3-Person Household | 38 (100.0%) | 0 (0.0%) |
| 4+ Person Household | 32 (59.3%) | 22 (40.7%) |
| Total Housing Units | 274 (60.9%) | 176 (39.1%) |
Occupancy by Educational Attainment in Oscoda
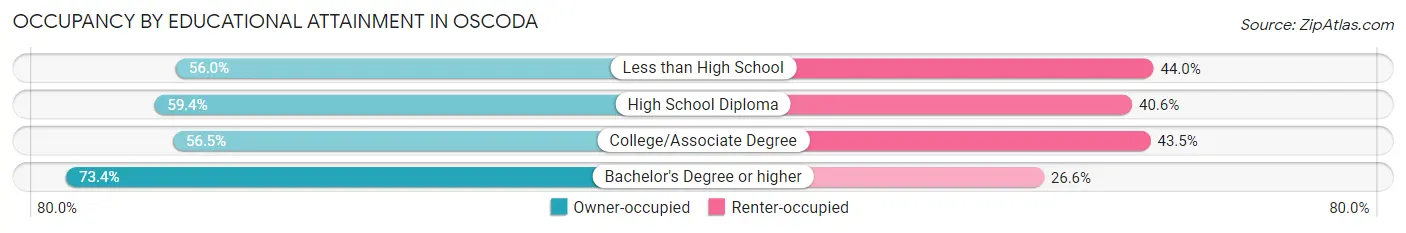
| Household Size | Owner-occupied | Renter-occupied |
| Less than High School | 14 (56.0%) | 11 (44.0%) |
| High School Diploma | 82 (59.4%) | 56 (40.6%) |
| College/Associate Degree | 109 (56.5%) | 84 (43.5%) |
| Bachelor's Degree or higher | 69 (73.4%) | 25 (26.6%) |
Occupancy by Age of Householder in Oscoda
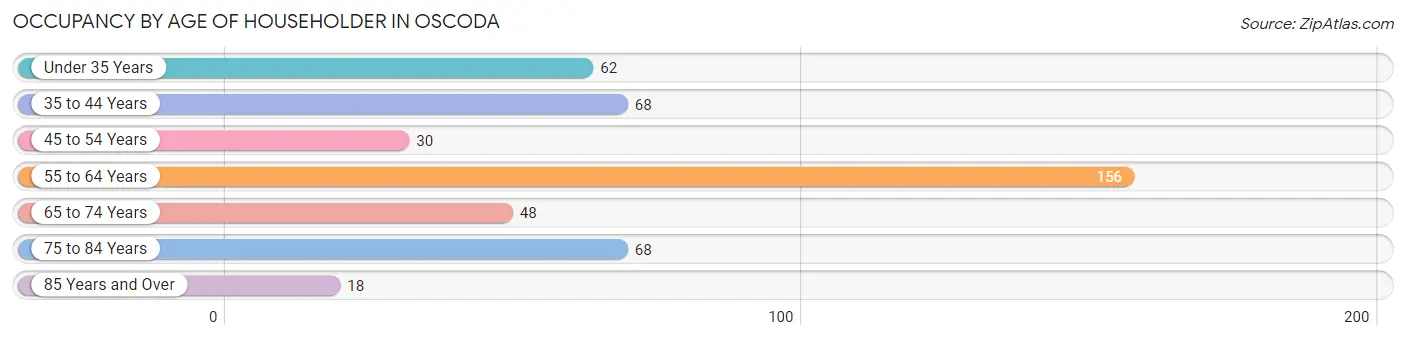
| Age Bracket | # Households | % Households |
| Under 35 Years | 62 | 13.8% |
| 35 to 44 Years | 68 | 15.1% |
| 45 to 54 Years | 30 | 6.7% |
| 55 to 64 Years | 156 | 34.7% |
| 65 to 74 Years | 48 | 10.7% |
| 75 to 84 Years | 68 | 15.1% |
| 85 Years and Over | 18 | 4.0% |
| Total | 450 | 100.0% |
Housing Finances in Oscoda
Median Income by Occupancy in Oscoda
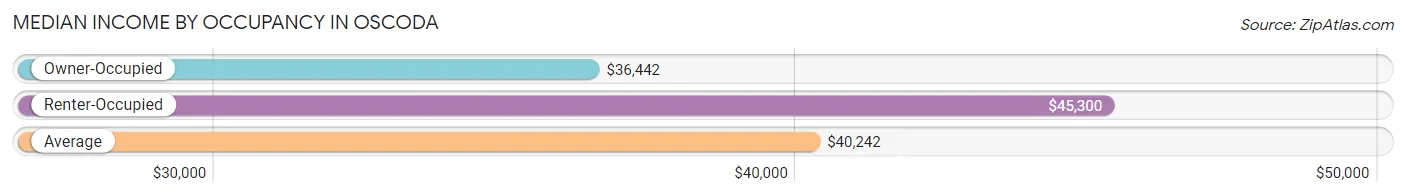
| Occupancy Type | # Households | Median Income |
| Owner-Occupied | 274 (60.9%) | $36,442 |
| Renter-Occupied | 176 (39.1%) | $45,300 |
| Average | 450 (100.0%) | $40,242 |
Occupancy by Householder Income Bracket in Oscoda
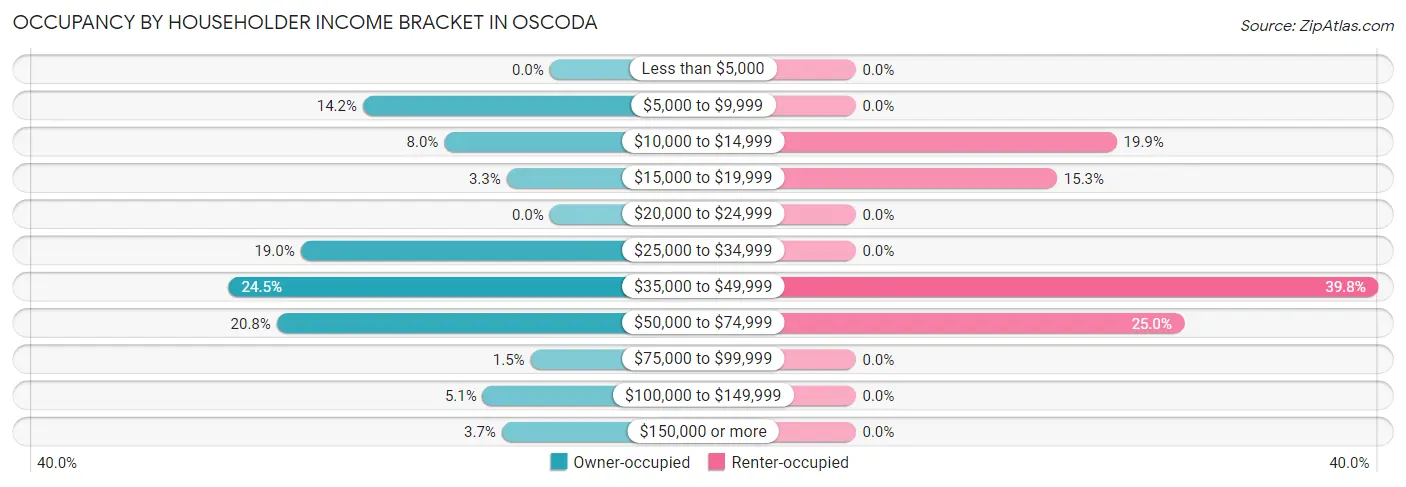
| Income Bracket | Owner-occupied | Renter-occupied |
| Less than $5,000 | 0 (0.0%) | 0 (0.0%) |
| $5,000 to $9,999 | 39 (14.2%) | 0 (0.0%) |
| $10,000 to $14,999 | 22 (8.0%) | 35 (19.9%) |
| $15,000 to $19,999 | 9 (3.3%) | 27 (15.3%) |
| $20,000 to $24,999 | 0 (0.0%) | 0 (0.0%) |
| $25,000 to $34,999 | 52 (19.0%) | 0 (0.0%) |
| $35,000 to $49,999 | 67 (24.4%) | 70 (39.8%) |
| $50,000 to $74,999 | 57 (20.8%) | 44 (25.0%) |
| $75,000 to $99,999 | 4 (1.5%) | 0 (0.0%) |
| $100,000 to $149,999 | 14 (5.1%) | 0 (0.0%) |
| $150,000 or more | 10 (3.6%) | 0 (0.0%) |
| Total | 274 (100.0%) | 176 (100.0%) |
Monthly Housing Cost Tiers in Oscoda
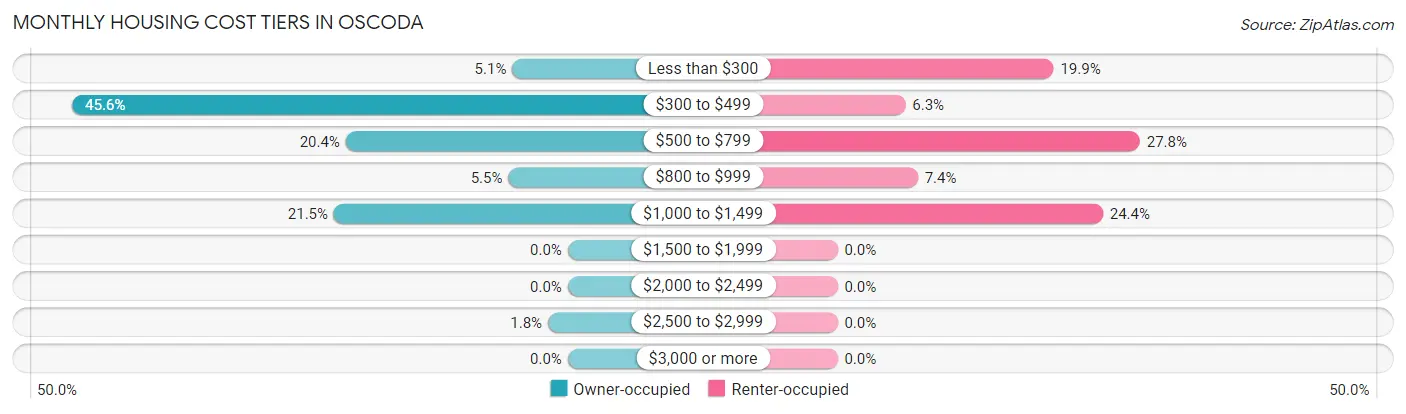
| Monthly Cost | Owner-occupied | Renter-occupied |
| Less than $300 | 14 (5.1%) | 35 (19.9%) |
| $300 to $499 | 125 (45.6%) | 11 (6.2%) |
| $500 to $799 | 56 (20.4%) | 49 (27.8%) |
| $800 to $999 | 15 (5.5%) | 13 (7.4%) |
| $1,000 to $1,499 | 59 (21.5%) | 43 (24.4%) |
| $1,500 to $1,999 | 0 (0.0%) | 0 (0.0%) |
| $2,000 to $2,499 | 0 (0.0%) | 0 (0.0%) |
| $2,500 to $2,999 | 5 (1.8%) | 0 (0.0%) |
| $3,000 or more | 0 (0.0%) | 0 (0.0%) |
| Total | 274 (100.0%) | 176 (100.0%) |
Physical Housing Characteristics in Oscoda
Housing Structures in Oscoda
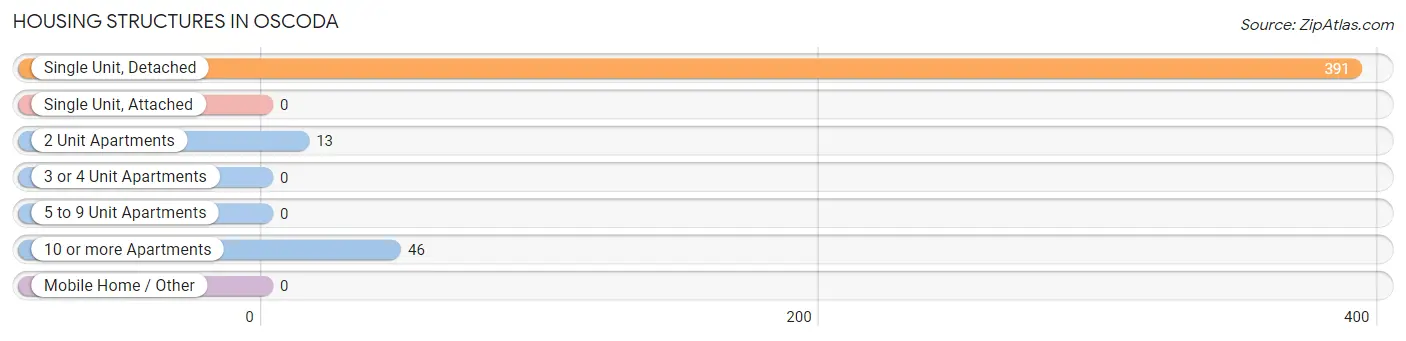
| Structure Type | # Housing Units | % Housing Units |
| Single Unit, Detached | 391 | 86.9% |
| Single Unit, Attached | 0 | 0.0% |
| 2 Unit Apartments | 13 | 2.9% |
| 3 or 4 Unit Apartments | 0 | 0.0% |
| 5 to 9 Unit Apartments | 0 | 0.0% |
| 10 or more Apartments | 46 | 10.2% |
| Mobile Home / Other | 0 | 0.0% |
| Total | 450 | 100.0% |
Housing Structures by Occupancy in Oscoda
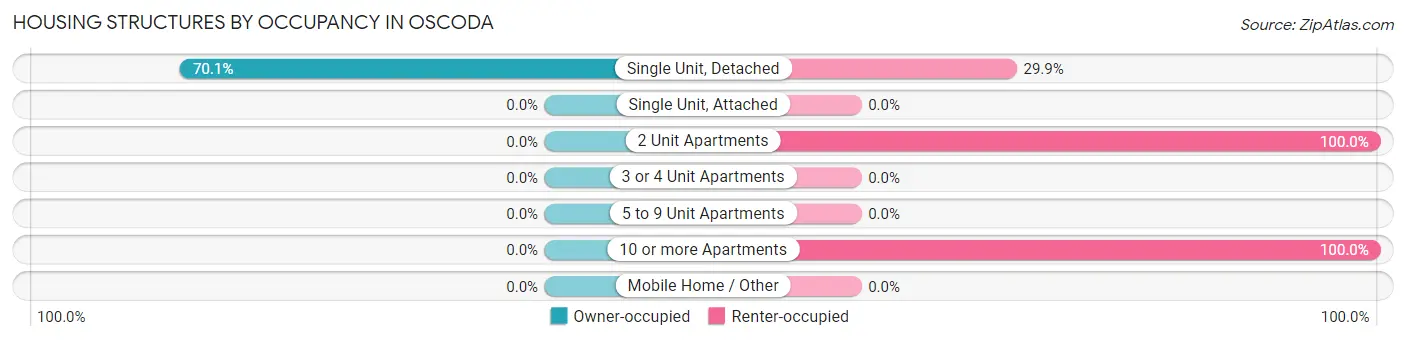
| Structure Type | Owner-occupied | Renter-occupied |
| Single Unit, Detached | 274 (70.1%) | 117 (29.9%) |
| Single Unit, Attached | 0 (0.0%) | 0 (0.0%) |
| 2 Unit Apartments | 0 (0.0%) | 13 (100.0%) |
| 3 or 4 Unit Apartments | 0 (0.0%) | 0 (0.0%) |
| 5 to 9 Unit Apartments | 0 (0.0%) | 0 (0.0%) |
| 10 or more Apartments | 0 (0.0%) | 46 (100.0%) |
| Mobile Home / Other | 0 (0.0%) | 0 (0.0%) |
| Total | 274 (60.9%) | 176 (39.1%) |
Housing Structures by Number of Rooms in Oscoda
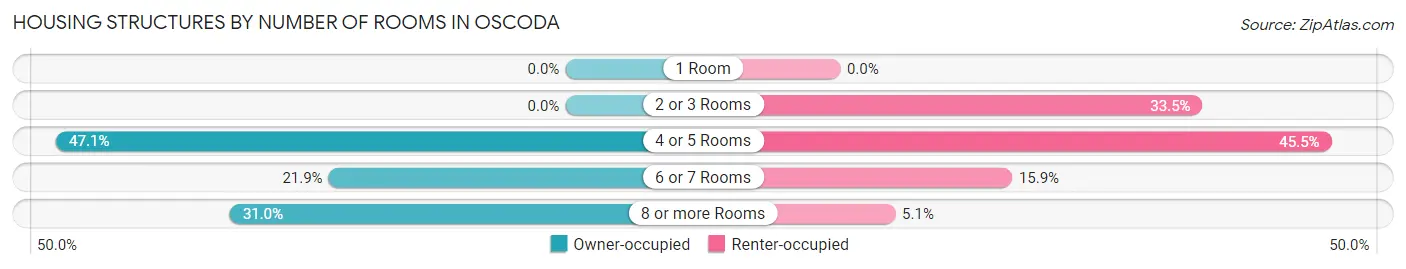
| Number of Rooms | Owner-occupied | Renter-occupied |
| 1 Room | 0 (0.0%) | 0 (0.0%) |
| 2 or 3 Rooms | 0 (0.0%) | 59 (33.5%) |
| 4 or 5 Rooms | 129 (47.1%) | 80 (45.5%) |
| 6 or 7 Rooms | 60 (21.9%) | 28 (15.9%) |
| 8 or more Rooms | 85 (31.0%) | 9 (5.1%) |
| Total | 274 (100.0%) | 176 (100.0%) |
Housing Structure by Heating Type in Oscoda
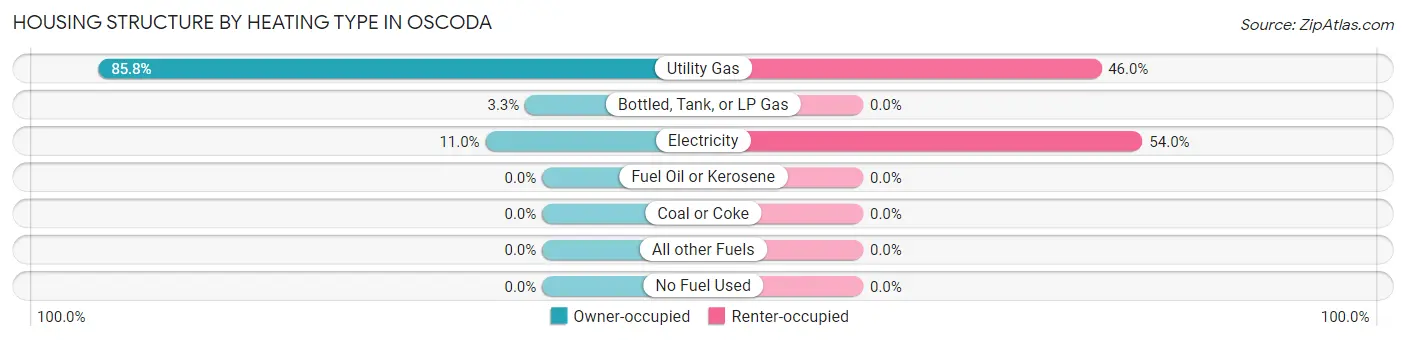
| Heating Type | Owner-occupied | Renter-occupied |
| Utility Gas | 235 (85.8%) | 81 (46.0%) |
| Bottled, Tank, or LP Gas | 9 (3.3%) | 0 (0.0%) |
| Electricity | 30 (11.0%) | 95 (54.0%) |
| Fuel Oil or Kerosene | 0 (0.0%) | 0 (0.0%) |
| Coal or Coke | 0 (0.0%) | 0 (0.0%) |
| All other Fuels | 0 (0.0%) | 0 (0.0%) |
| No Fuel Used | 0 (0.0%) | 0 (0.0%) |
| Total | 274 (100.0%) | 176 (100.0%) |
Household Vehicle Usage in Oscoda
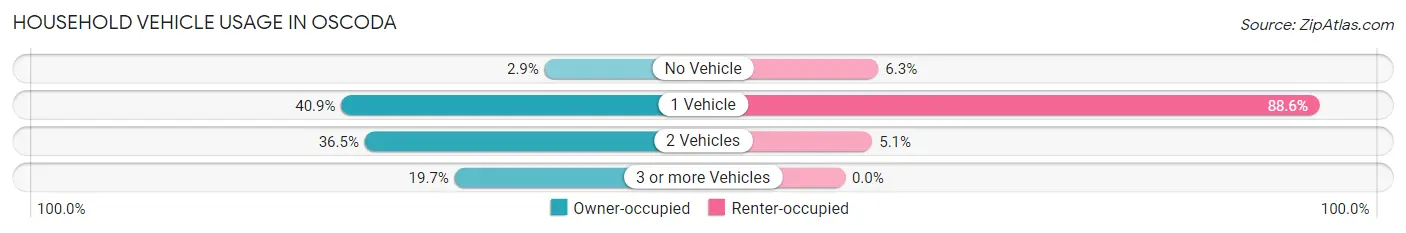
| Vehicles per Household | Owner-occupied | Renter-occupied |
| No Vehicle | 8 (2.9%) | 11 (6.2%) |
| 1 Vehicle | 112 (40.9%) | 156 (88.6%) |
| 2 Vehicles | 100 (36.5%) | 9 (5.1%) |
| 3 or more Vehicles | 54 (19.7%) | 0 (0.0%) |
| Total | 274 (100.0%) | 176 (100.0%) |
Real Estate & Mortgages in Oscoda
Real Estate and Mortgage Overview in Oscoda
| Characteristic | Without Mortgage | With Mortgage |
| Housing Units | 146 | 128 |
| Median Property Value | $54,500 | $130,000 |
| Median Household Income | $31,667 | $10 |
| Monthly Housing Costs | $407 | $0 |
| Real Estate Taxes | $1,096 | $0 |
Property Value by Mortgage Status in Oscoda
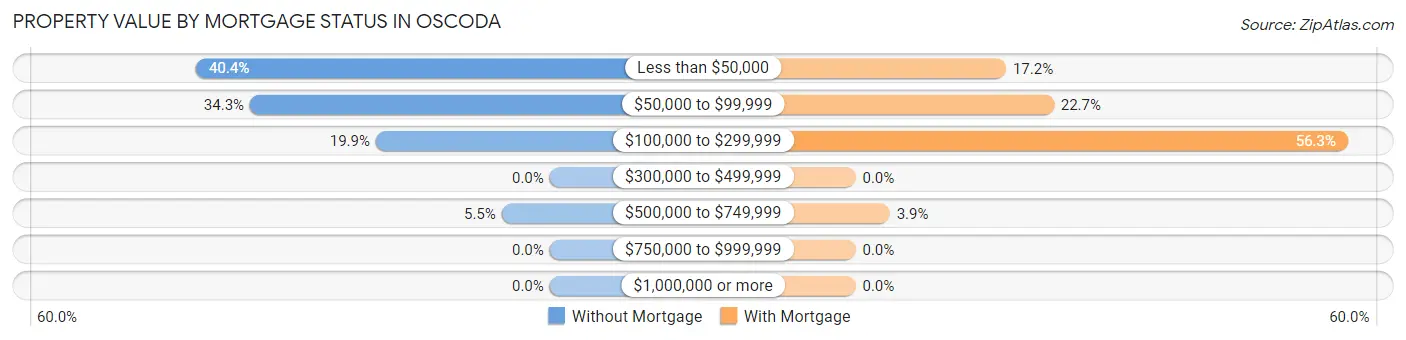
| Property Value | Without Mortgage | With Mortgage |
| Less than $50,000 | 59 (40.4%) | 22 (17.2%) |
| $50,000 to $99,999 | 50 (34.3%) | 29 (22.7%) |
| $100,000 to $299,999 | 29 (19.9%) | 72 (56.2%) |
| $300,000 to $499,999 | 0 (0.0%) | 0 (0.0%) |
| $500,000 to $749,999 | 8 (5.5%) | 5 (3.9%) |
| $750,000 to $999,999 | 0 (0.0%) | 0 (0.0%) |
| $1,000,000 or more | 0 (0.0%) | 0 (0.0%) |
| Total | 146 (100.0%) | 128 (100.0%) |
Household Income by Mortgage Status in Oscoda
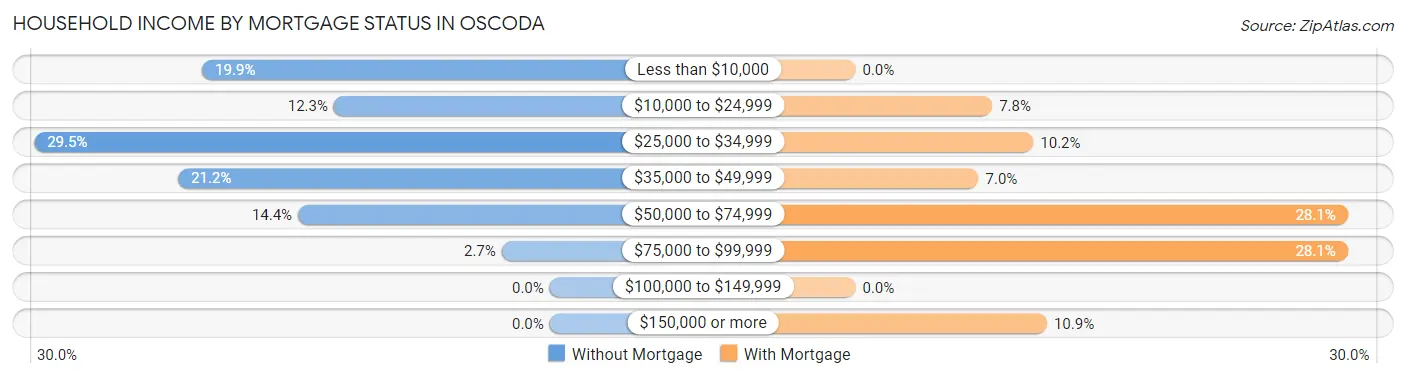
| Household Income | Without Mortgage | With Mortgage |
| Less than $10,000 | 29 (19.9%) | 0 (0.0%) |
| $10,000 to $24,999 | 18 (12.3%) | 10 (7.8%) |
| $25,000 to $34,999 | 43 (29.4%) | 13 (10.2%) |
| $35,000 to $49,999 | 31 (21.2%) | 9 (7.0%) |
| $50,000 to $74,999 | 21 (14.4%) | 36 (28.1%) |
| $75,000 to $99,999 | 4 (2.7%) | 36 (28.1%) |
| $100,000 to $149,999 | 0 (0.0%) | 0 (0.0%) |
| $150,000 or more | 0 (0.0%) | 14 (10.9%) |
| Total | 146 (100.0%) | 128 (100.0%) |
Property Value to Household Income Ratio in Oscoda
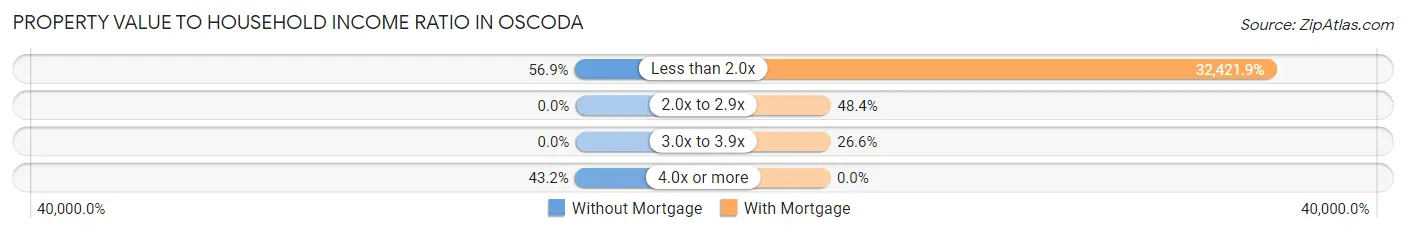
| Value-to-Income Ratio | Without Mortgage | With Mortgage |
| Less than 2.0x | 83 (56.9%) | 41,500 (32,421.9%) |
| 2.0x to 2.9x | 0 (0.0%) | 62 (48.4%) |
| 3.0x to 3.9x | 0 (0.0%) | 34 (26.6%) |
| 4.0x or more | 63 (43.1%) | 0 (0.0%) |
| Total | 146 (100.0%) | 128 (100.0%) |
Real Estate Taxes by Mortgage Status in Oscoda
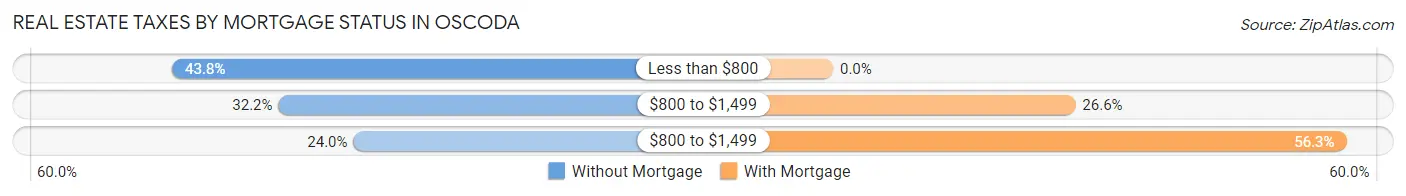
| Property Taxes | Without Mortgage | With Mortgage |
| Less than $800 | 64 (43.8%) | 0 (0.0%) |
| $800 to $1,499 | 47 (32.2%) | 34 (26.6%) |
| $800 to $1,499 | 35 (24.0%) | 72 (56.2%) |
| Total | 146 (100.0%) | 128 (100.0%) |
Health & Disability in Oscoda
Health Insurance Coverage by Age in Oscoda
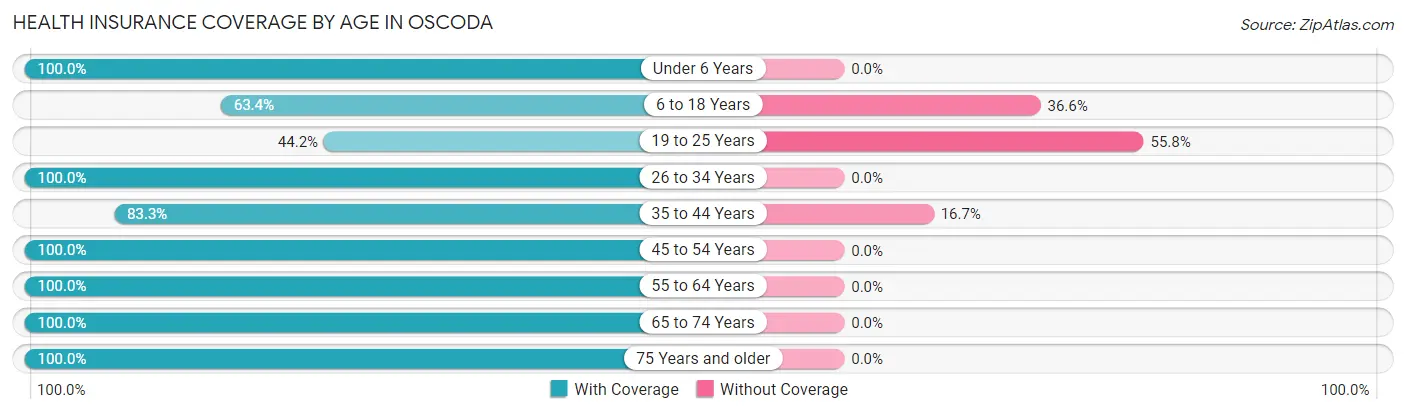
| Age Bracket | With Coverage | Without Coverage |
| Under 6 Years | 13 (100.0%) | 0 (0.0%) |
| 6 to 18 Years | 78 (63.4%) | 45 (36.6%) |
| 19 to 25 Years | 38 (44.2%) | 48 (55.8%) |
| 26 to 34 Years | 84 (100.0%) | 0 (0.0%) |
| 35 to 44 Years | 115 (83.3%) | 23 (16.7%) |
| 45 to 54 Years | 98 (100.0%) | 0 (0.0%) |
| 55 to 64 Years | 218 (100.0%) | 0 (0.0%) |
| 65 to 74 Years | 48 (100.0%) | 0 (0.0%) |
| 75 Years and older | 110 (100.0%) | 0 (0.0%) |
| Total | 802 (87.4%) | 116 (12.6%) |
Health Insurance Coverage by Citizenship Status in Oscoda

| Citizenship Status | With Coverage | Without Coverage |
| Native Born | 13 (100.0%) | 0 (0.0%) |
| Foreign Born, Citizen | 78 (63.4%) | 45 (36.6%) |
| Foreign Born, not a Citizen | 38 (44.2%) | 48 (55.8%) |
Health Insurance Coverage by Household Income in Oscoda
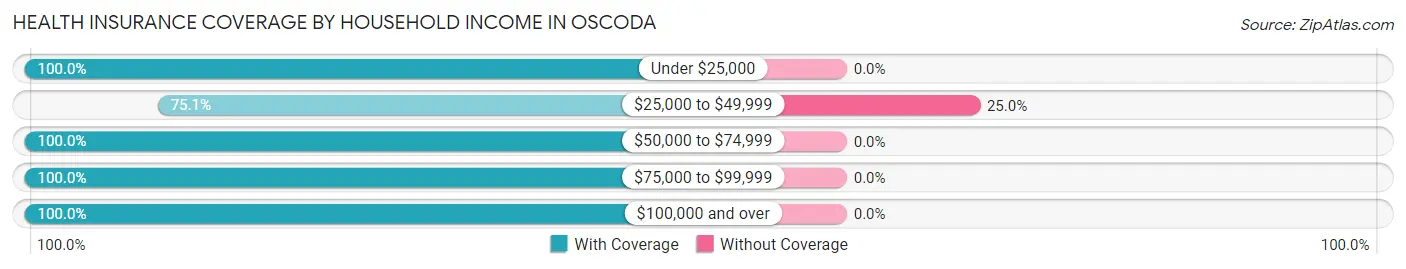
| Household Income | With Coverage | Without Coverage |
| Under $25,000 | 132 (100.0%) | 0 (0.0%) |
| $25,000 to $49,999 | 349 (75.0%) | 116 (24.9%) |
| $50,000 to $74,999 | 261 (100.0%) | 0 (0.0%) |
| $75,000 to $99,999 | 4 (100.0%) | 0 (0.0%) |
| $100,000 and over | 42 (100.0%) | 0 (0.0%) |
Public vs Private Health Insurance Coverage by Age in Oscoda
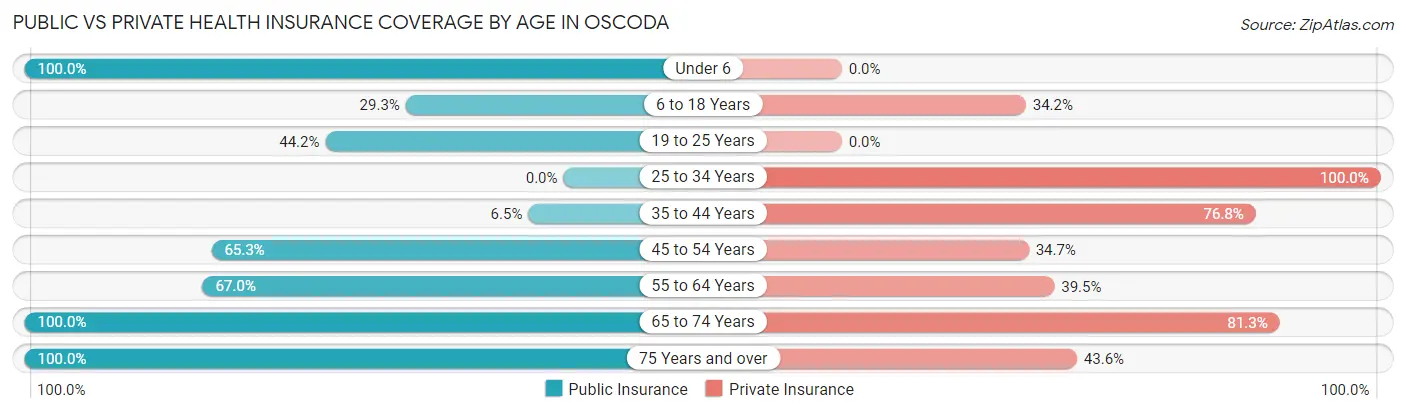
| Age Bracket | Public Insurance | Private Insurance |
| Under 6 | 13 (100.0%) | 0 (0.0%) |
| 6 to 18 Years | 36 (29.3%) | 42 (34.2%) |
| 19 to 25 Years | 38 (44.2%) | 0 (0.0%) |
| 25 to 34 Years | 0 (0.0%) | 84 (100.0%) |
| 35 to 44 Years | 9 (6.5%) | 106 (76.8%) |
| 45 to 54 Years | 64 (65.3%) | 34 (34.7%) |
| 55 to 64 Years | 146 (67.0%) | 86 (39.5%) |
| 65 to 74 Years | 48 (100.0%) | 39 (81.2%) |
| 75 Years and over | 110 (100.0%) | 48 (43.6%) |
| Total | 464 (50.5%) | 439 (47.8%) |
Disability Status by Sex by Age in Oscoda
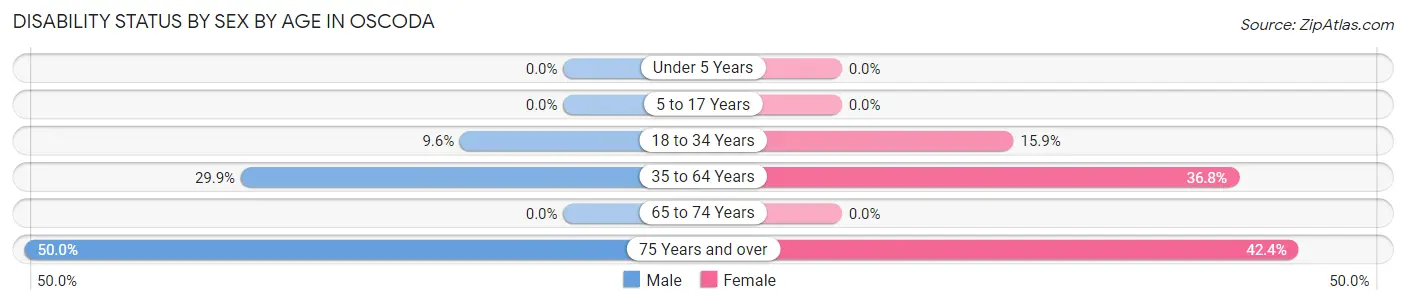
| Age Bracket | Male | Female |
| Under 5 Years | 0 (0.0%) | 0 (0.0%) |
| 5 to 17 Years | 0 (0.0%) | 0 (0.0%) |
| 18 to 34 Years | 14 (9.6%) | 11 (15.9%) |
| 35 to 64 Years | 79 (29.9%) | 70 (36.8%) |
| 65 to 74 Years | 0 (0.0%) | 0 (0.0%) |
| 75 Years and over | 9 (50.0%) | 39 (42.4%) |
Disability Class by Sex by Age in Oscoda
Disability Class: Hearing Difficulty
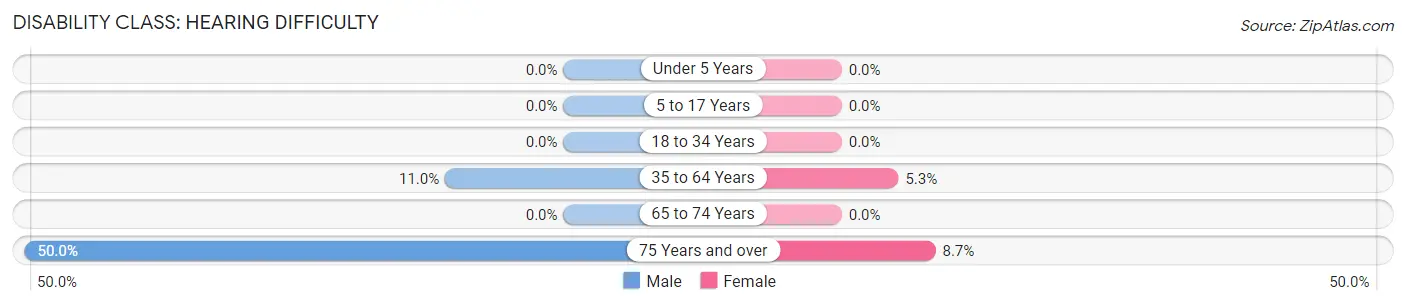
| Age Bracket | Male | Female |
| Under 5 Years | 0 (0.0%) | 0 (0.0%) |
| 5 to 17 Years | 0 (0.0%) | 0 (0.0%) |
| 18 to 34 Years | 0 (0.0%) | 0 (0.0%) |
| 35 to 64 Years | 29 (11.0%) | 10 (5.3%) |
| 65 to 74 Years | 0 (0.0%) | 0 (0.0%) |
| 75 Years and over | 9 (50.0%) | 8 (8.7%) |
Disability Class: Vision Difficulty
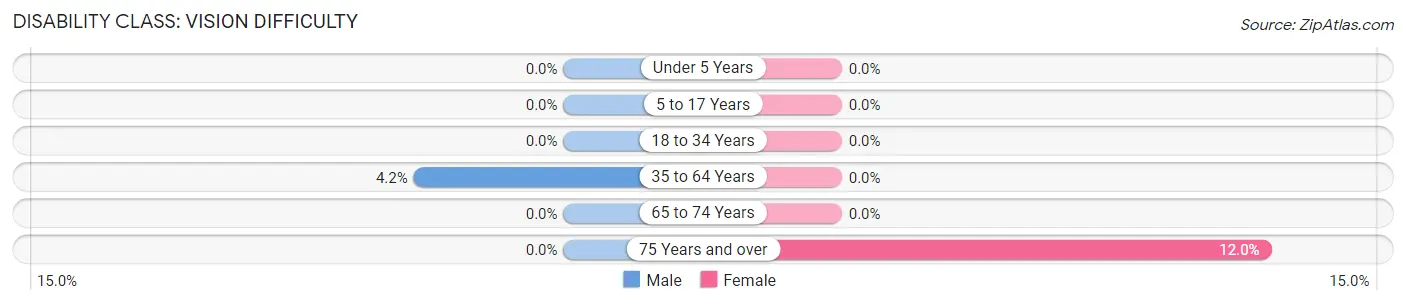
| Age Bracket | Male | Female |
| Under 5 Years | 0 (0.0%) | 0 (0.0%) |
| 5 to 17 Years | 0 (0.0%) | 0 (0.0%) |
| 18 to 34 Years | 0 (0.0%) | 0 (0.0%) |
| 35 to 64 Years | 11 (4.2%) | 0 (0.0%) |
| 65 to 74 Years | 0 (0.0%) | 0 (0.0%) |
| 75 Years and over | 0 (0.0%) | 11 (12.0%) |
Disability Class: Cognitive Difficulty
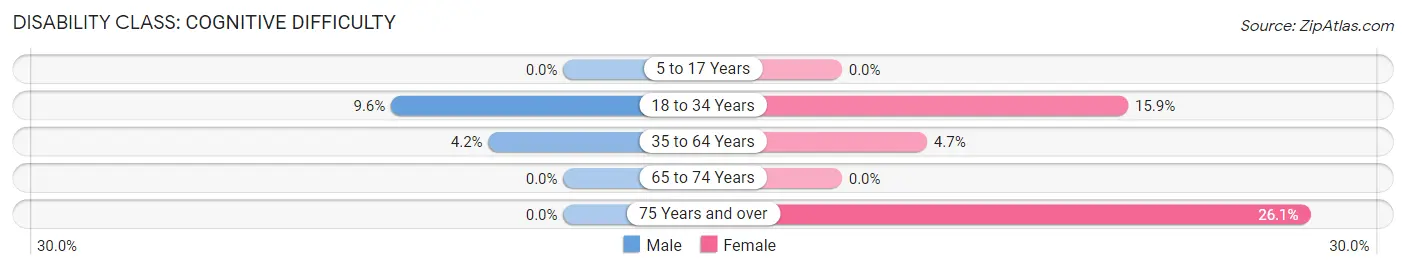
| Age Bracket | Male | Female |
| 5 to 17 Years | 0 (0.0%) | 0 (0.0%) |
| 18 to 34 Years | 14 (9.6%) | 11 (15.9%) |
| 35 to 64 Years | 11 (4.2%) | 9 (4.7%) |
| 65 to 74 Years | 0 (0.0%) | 0 (0.0%) |
| 75 Years and over | 0 (0.0%) | 24 (26.1%) |
Disability Class: Ambulatory Difficulty
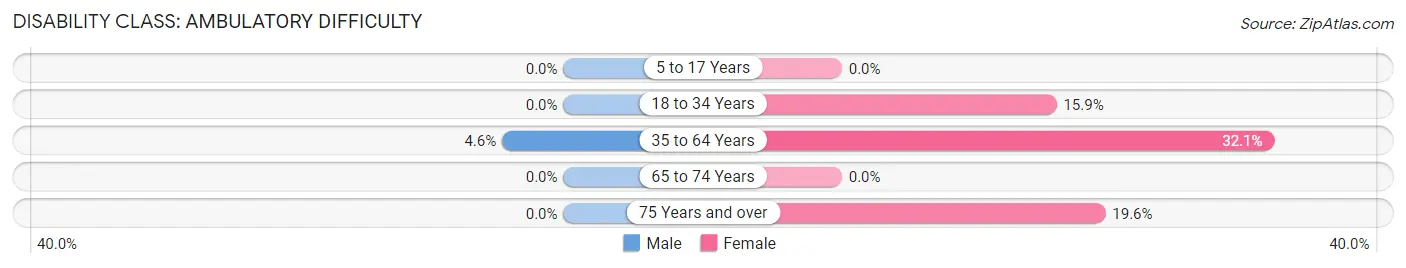
| Age Bracket | Male | Female |
| 5 to 17 Years | 0 (0.0%) | 0 (0.0%) |
| 18 to 34 Years | 0 (0.0%) | 11 (15.9%) |
| 35 to 64 Years | 12 (4.5%) | 61 (32.1%) |
| 65 to 74 Years | 0 (0.0%) | 0 (0.0%) |
| 75 Years and over | 0 (0.0%) | 18 (19.6%) |
Disability Class: Self-Care Difficulty
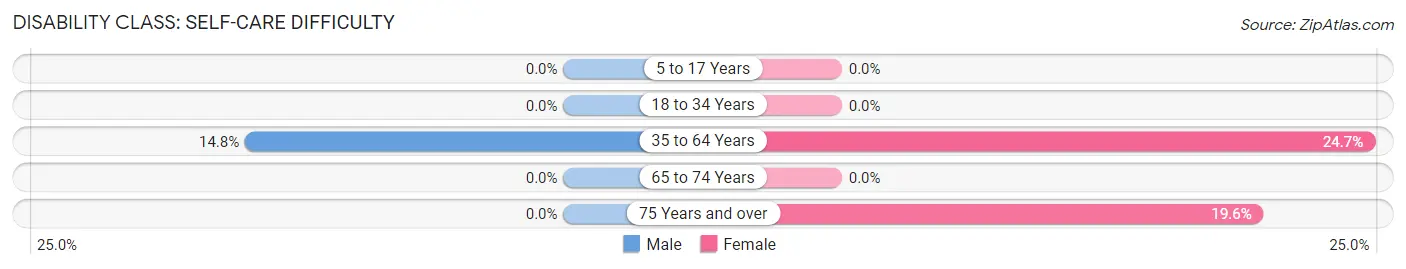
| Age Bracket | Male | Female |
| 5 to 17 Years | 0 (0.0%) | 0 (0.0%) |
| 18 to 34 Years | 0 (0.0%) | 0 (0.0%) |
| 35 to 64 Years | 39 (14.8%) | 47 (24.7%) |
| 65 to 74 Years | 0 (0.0%) | 0 (0.0%) |
| 75 Years and over | 0 (0.0%) | 18 (19.6%) |
Technology Access in Oscoda
Computing Device Access in Oscoda
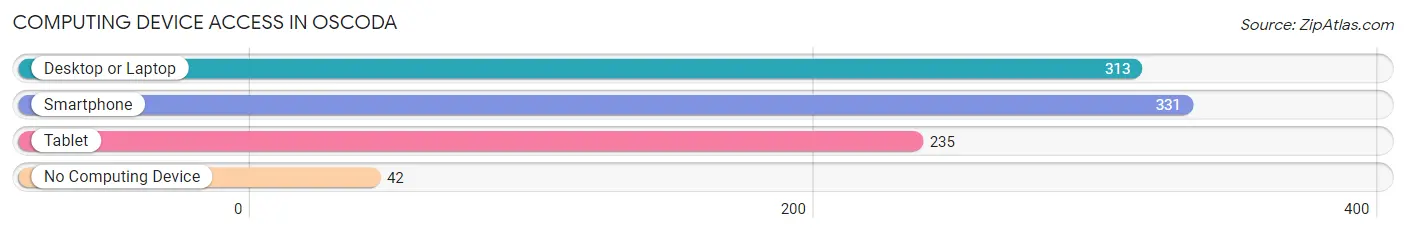
| Device Type | # Households | % Households |
| Desktop or Laptop | 313 | 69.6% |
| Smartphone | 331 | 73.6% |
| Tablet | 235 | 52.2% |
| No Computing Device | 42 | 9.3% |
| Total | 450 | 100.0% |
Internet Access in Oscoda
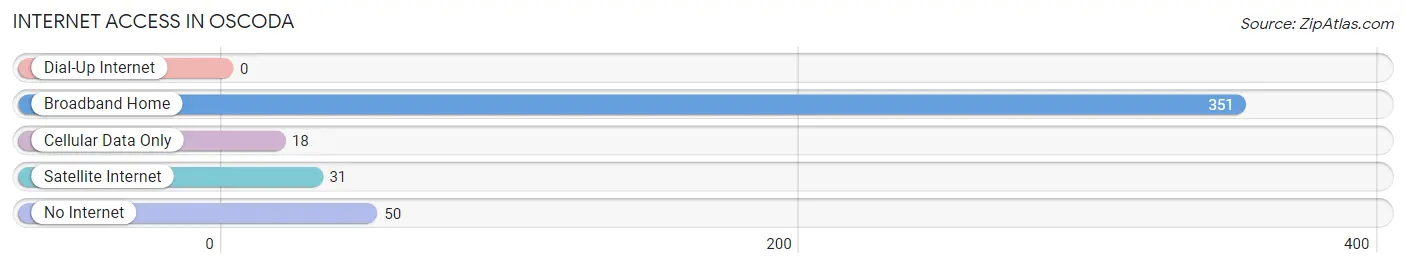
| Internet Type | # Households | % Households |
| Dial-Up Internet | 0 | 0.0% |
| Broadband Home | 351 | 78.0% |
| Cellular Data Only | 18 | 4.0% |
| Satellite Internet | 31 | 6.9% |
| No Internet | 50 | 11.1% |
| Total | 450 | 100.0% |
Oscoda Summary
Oscoda is a small town located in Iosco County, Michigan. It is situated on the northern shore of Lake Huron, approximately 30 miles northeast of the city of Alpena. The town was founded in 1875 and has a population of approximately 1,700 people.
History
The area that is now Oscoda was originally inhabited by the Ojibwe people. The first European settlers arrived in the area in the early 1800s. The town was originally known as Au Sable, and was renamed Oscoda in 1875. The name is derived from the Ojibwe word “Oshkoda”, which means “mouth of the river”.
The town was initially a lumbering and fishing center, and the first sawmill was built in 1876. The lumber industry was the primary source of income for the town until the early 1900s, when the lumber industry began to decline. The town then shifted its focus to tourism, and the first hotel was built in 1910.
Geography
Oscoda is located in Iosco County, Michigan, on the northern shore of Lake Huron. The town is situated on the Au Sable River, which flows into Lake Huron. The town is surrounded by forests and lakes, and is home to several state parks, including the Huron National Forest and the Au Sable State Forest.
The town has a total area of 4.2 square miles, of which 0.2 square miles is water. The town has a humid continental climate, with cold winters and warm summers.
Economy
The economy of Oscoda is largely based on tourism. The town is home to several resorts and hotels, as well as a variety of restaurants and shops. The town is also home to several manufacturing companies, including a paper mill and a plastics factory.
The town is also home to Oscoda-Wurtsmith Airport, which is a former Air Force base. The airport is now used for general aviation and is home to several aviation-related businesses.
Demographics
As of the 2010 census, the population of Oscoda was 1,697. The racial makeup of the town was 95.3% White, 0.7% African American, 0.7% Native American, 0.3% Asian, 0.1% Pacific Islander, 0.7% from other races, and 2.1% from two or more races. Hispanic or Latino of any race were 2.2% of the population.
The median income for a household in the town was $35,938, and the median income for a family was $41,250. The per capita income for the town was $18,945. About 11.2% of families and 14.2% of the population were below the poverty line, including 19.2% of those under age 18 and 8.3% of those age 65 or over.
Common Questions
What is Per Capita Income in Oscoda?
Per Capita income in Oscoda is $23,440.
What is the Median Family Income in Oscoda?
Median Family Income in Oscoda is $48,417.
What is the Median Household income in Oscoda?
Median Household Income in Oscoda is $40,242.
What is Income or Wage Gap in Oscoda?
Income or Wage Gap in Oscoda is 37.2%.
Women in Oscoda earn 62.8 cents for every dollar earned by a man.
What is Inequality or Gini Index in Oscoda?
Inequality or Gini Index in Oscoda is 0.42.
What is the Total Population of Oscoda?
Total Population of Oscoda is 918.
What is the Total Male Population of Oscoda?
Total Male Population of Oscoda is 483.
What is the Total Female Population of Oscoda?
Total Female Population of Oscoda is 435.
What is the Ratio of Males per 100 Females in Oscoda?
There are 111.03 Males per 100 Females in Oscoda.
What is the Ratio of Females per 100 Males in Oscoda?
There are 90.06 Females per 100 Males in Oscoda.
What is the Median Population Age in Oscoda?
Median Population Age in Oscoda is 46.5 Years.
What is the Average Family Size in Oscoda
Average Family Size in Oscoda is 3.4 People.
What is the Average Household Size in Oscoda
Average Household Size in Oscoda is 2.0 People.
How Large is the Labor Force in Oscoda?
There are 338 People in the Labor Forcein in Oscoda.
What is the Percentage of People in the Labor Force in Oscoda?
40.9% of People are in the Labor Force in Oscoda.
What is the Unemployment Rate in Oscoda?
Unemployment Rate in Oscoda is 8.9%.