Eastport, MI Map & Demographics
Eastport Map
Eastport Overview
$37,974
PER CAPITA INCOME
$80,078
AVG FAMILY INCOME
$52,443
AVG HOUSEHOLD INCOME
31.6%
WAGE / INCOME GAP [ % ]
68.4¢/ $1
WAGE / INCOME GAP [ $ ]
0.48
INEQUALITY / GINI INDEX
351
TOTAL POPULATION
141
MALE POPULATION
210
FEMALE POPULATION
67.14
MALES / 100 FEMALES
148.94
FEMALES / 100 MALES
66.7
MEDIAN AGE
2.8
AVG FAMILY SIZE
2.4
AVG HOUSEHOLD SIZE
118
LABOR FORCE [ PEOPLE ]
36.3%
PERCENT IN LABOR FORCE
10.2%
UNEMPLOYMENT RATE
Eastport Zip Codes
Eastport Area Codes
Income in Eastport
Income Overview in Eastport
Per Capita Income in Eastport is $37,974, while median incomes of families and households are $80,078 and $52,443 respectively.
| Characteristic | Number | Measure |
| Per Capita Income | 351 | $37,974 |
| Median Family Income | 101 | $80,078 |
| Mean Family Income | 101 | $69,987 |
| Median Household Income | 147 | $52,443 |
| Mean Household Income | 147 | $79,953 |
| Income Deficit | 101 | $0 |
| Wage / Income Gap (%) | 351 | 31.59% |
| Wage / Income Gap ($) | 351 | 68.41¢ per $1 |
| Gini / Inequality Index | 351 | 0.48 |
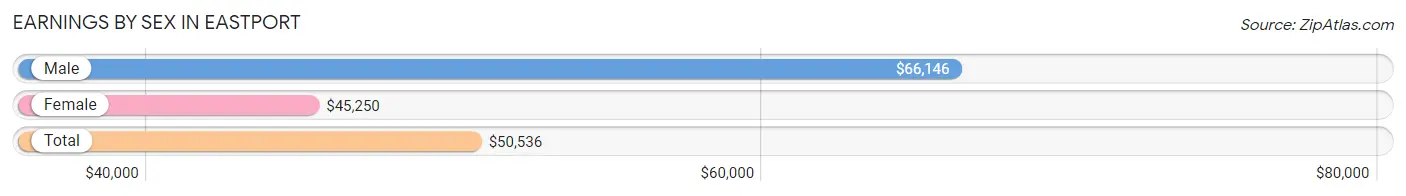
Earnings by Sex in Eastport
Average Earnings in Eastport are $50,536, $66,146 for men and $45,250 for women, a difference of 31.6%.
| Sex | Number | Average Earnings |
| Male | 53 (48.6%) | $66,146 |
| Female | 56 (51.4%) | $45,250 |
| Total | 109 (100.0%) | $50,536 |
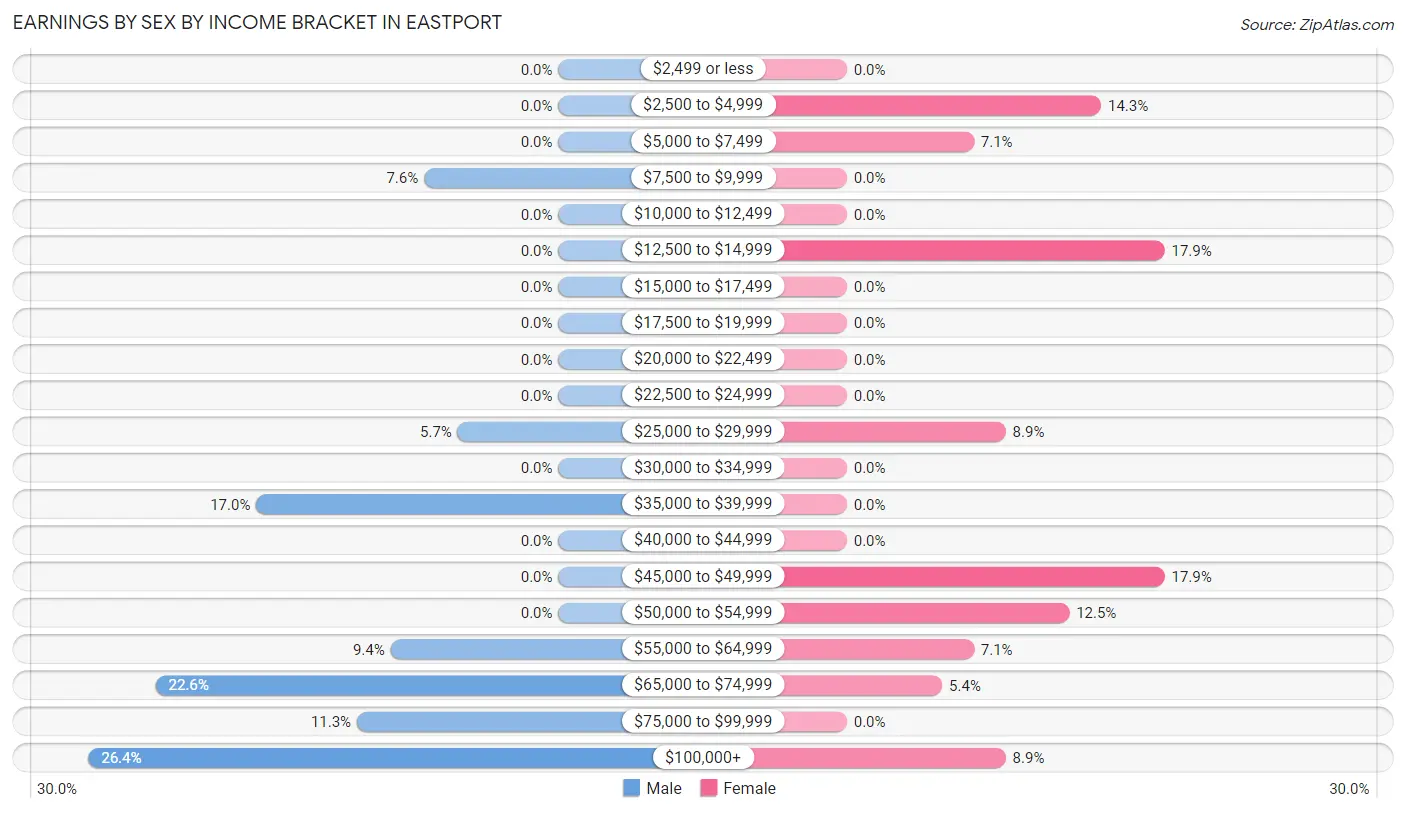
Earnings by Sex by Income Bracket in Eastport
The most common earnings brackets in Eastport are $100,000+ for men (14 | 26.4%) and $12,500 to $14,999 for women (10 | 17.9%).
| Income | Male | Female |
| $2,499 or less | 0 (0.0%) | 0 (0.0%) |
| $2,500 to $4,999 | 0 (0.0%) | 8 (14.3%) |
| $5,000 to $7,499 | 0 (0.0%) | 4 (7.1%) |
| $7,500 to $9,999 | 4 (7.5%) | 0 (0.0%) |
| $10,000 to $12,499 | 0 (0.0%) | 0 (0.0%) |
| $12,500 to $14,999 | 0 (0.0%) | 10 (17.9%) |
| $15,000 to $17,499 | 0 (0.0%) | 0 (0.0%) |
| $17,500 to $19,999 | 0 (0.0%) | 0 (0.0%) |
| $20,000 to $22,499 | 0 (0.0%) | 0 (0.0%) |
| $22,500 to $24,999 | 0 (0.0%) | 0 (0.0%) |
| $25,000 to $29,999 | 3 (5.7%) | 5 (8.9%) |
| $30,000 to $34,999 | 0 (0.0%) | 0 (0.0%) |
| $35,000 to $39,999 | 9 (17.0%) | 0 (0.0%) |
| $40,000 to $44,999 | 0 (0.0%) | 0 (0.0%) |
| $45,000 to $49,999 | 0 (0.0%) | 10 (17.9%) |
| $50,000 to $54,999 | 0 (0.0%) | 7 (12.5%) |
| $55,000 to $64,999 | 5 (9.4%) | 4 (7.1%) |
| $65,000 to $74,999 | 12 (22.6%) | 3 (5.4%) |
| $75,000 to $99,999 | 6 (11.3%) | 0 (0.0%) |
| $100,000+ | 14 (26.4%) | 5 (8.9%) |
| Total | 53 (100.0%) | 56 (100.0%) |
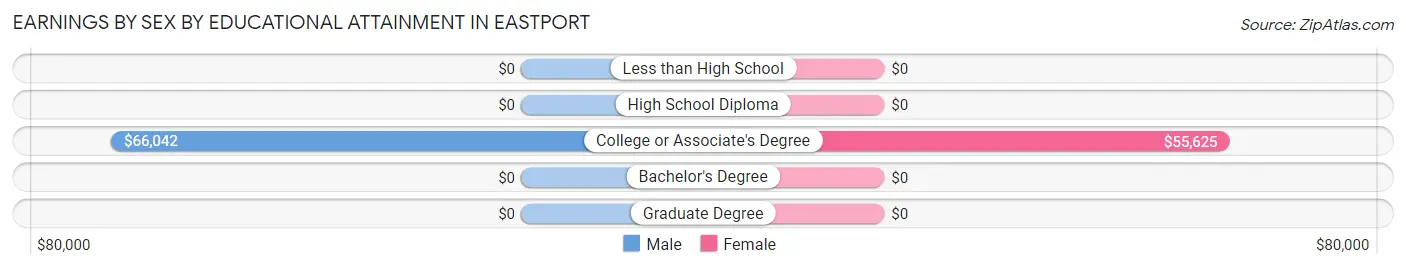
Earnings by Sex by Educational Attainment in Eastport
| Educational Attainment | Male Income | Female Income |
| Less than High School | - | - |
| High School Diploma | - | - |
| College or Associate's Degree | $66,042 | $55,625 |
| Bachelor's Degree | - | - |
| Graduate Degree | - | - |
| Total | $67,083 | $0 |
Family Income in Eastport
Family Income Brackets in Eastport
According to the Eastport family income data, there are 27 families falling into the $100,000 to $149,999 income range, which is the most common income bracket and makes up 26.7% of all families.
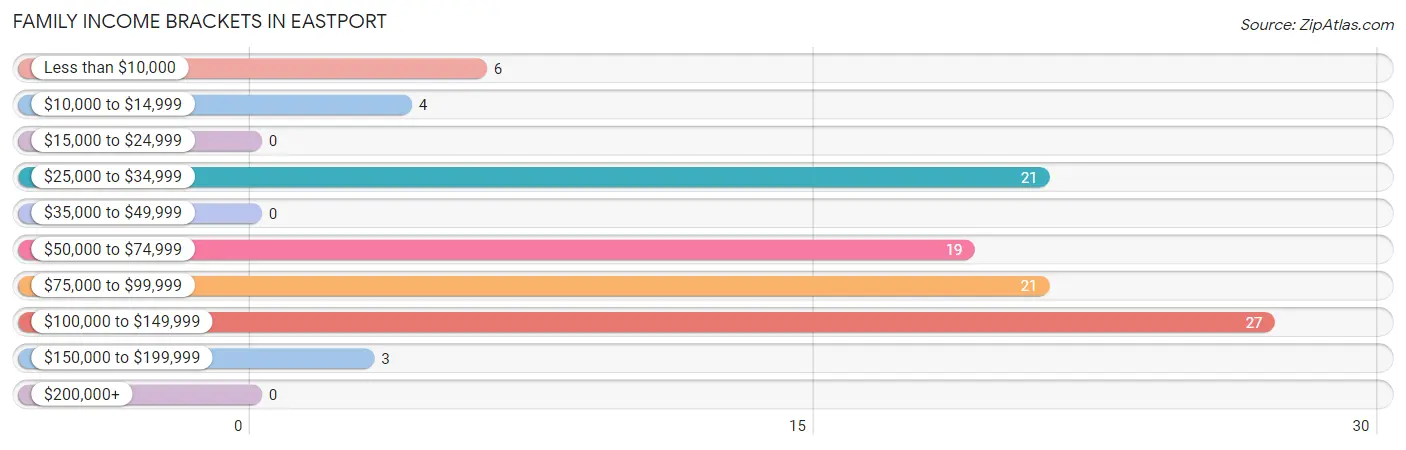
| Income Bracket | # Families | % Families |
| Less than $10,000 | 6 | 5.9% |
| $10,000 to $14,999 | 4 | 4.0% |
| $15,000 to $24,999 | 0 | 0.0% |
| $25,000 to $34,999 | 21 | 20.8% |
| $35,000 to $49,999 | 0 | 0.0% |
| $50,000 to $74,999 | 19 | 18.8% |
| $75,000 to $99,999 | 21 | 20.8% |
| $100,000 to $149,999 | 27 | 26.7% |
| $150,000 to $199,999 | 3 | 3.0% |
| $200,000+ | 0 | 0.0% |
Family Income by Famaliy Size in Eastport
2-person families (75 | 74.3%) account for the highest median family income in Eastport with $51,083 per family, while 2-person families (75 | 74.3%) have the highest median income of $25,542 per family member.
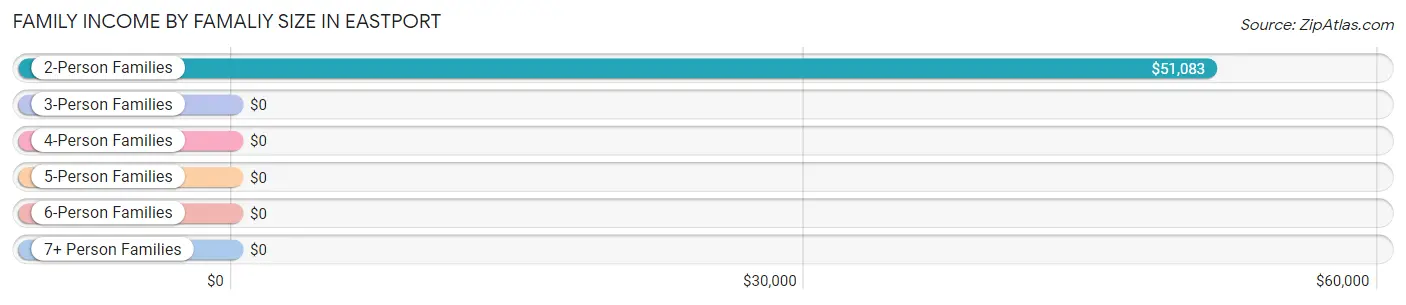
| Income Bracket | # Families | Median Income |
| 2-Person Families | 75 (74.3%) | $51,083 |
| 3-Person Families | 22 (21.8%) | $0 |
| 4-Person Families | 0 (0.0%) | $0 |
| 5-Person Families | 4 (4.0%) | $0 |
| 6-Person Families | 0 (0.0%) | $0 |
| 7+ Person Families | 0 (0.0%) | $0 |
| Total | 101 (100.0%) | $80,078 |
Family Income by Number of Earners in Eastport
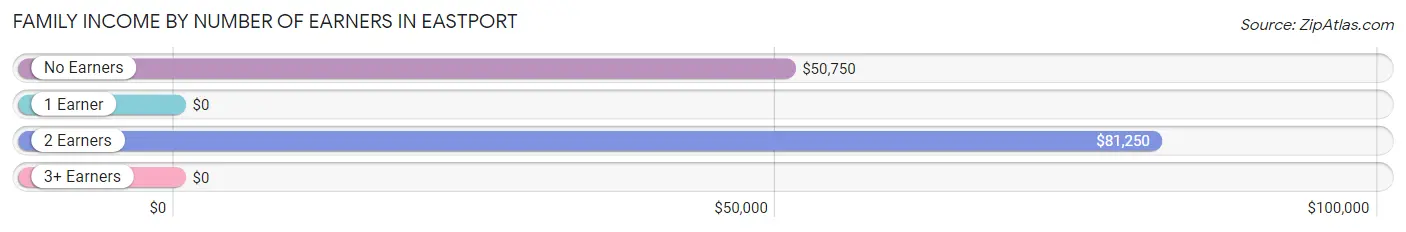
| Number of Earners | # Families | Median Income |
| No Earners | 63 (62.4%) | $50,750 |
| 1 Earner | 8 (7.9%) | $0 |
| 2 Earners | 18 (17.8%) | $81,250 |
| 3+ Earners | 12 (11.9%) | $0 |
| Total | 101 (100.0%) | $80,078 |
Household Income in Eastport
Household Income Brackets in Eastport
With 36 households falling in the category, the $100,000 to $149,999 income range is the most frequent in Eastport, accounting for 24.5% of all households.
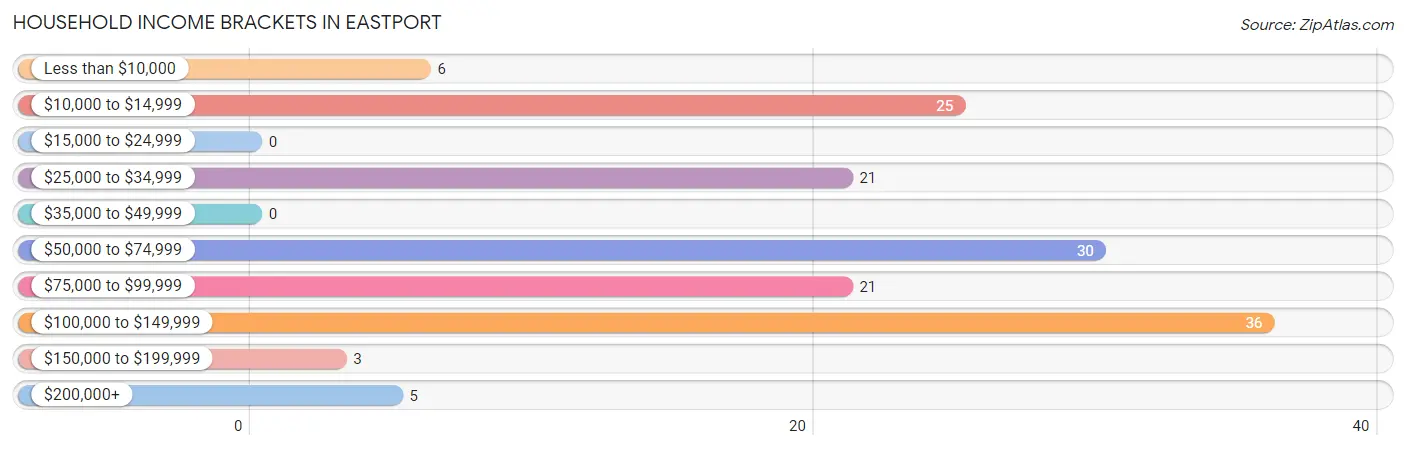
| Income Bracket | # Households | % Households |
| Less than $10,000 | 6 | 4.1% |
| $10,000 to $14,999 | 25 | 17.0% |
| $15,000 to $24,999 | 0 | 0.0% |
| $25,000 to $34,999 | 21 | 14.3% |
| $35,000 to $49,999 | 0 | 0.0% |
| $50,000 to $74,999 | 30 | 20.4% |
| $75,000 to $99,999 | 21 | 14.3% |
| $100,000 to $149,999 | 36 | 24.5% |
| $150,000 to $199,999 | 3 | 2.0% |
| $200,000+ | 5 | 3.4% |
Household Income by Householder Age in Eastport
The median household income in Eastport is $52,443, with the highest median household income of $96,875 found in the 45 to 64 years age bracket for the primary householder. A total of 35 households (23.8%) fall into this category. Meanwhile, the 15 to 24 years age bracket for the primary householder has the lowest median household income of $0, with 10 households (6.8%) in this group.
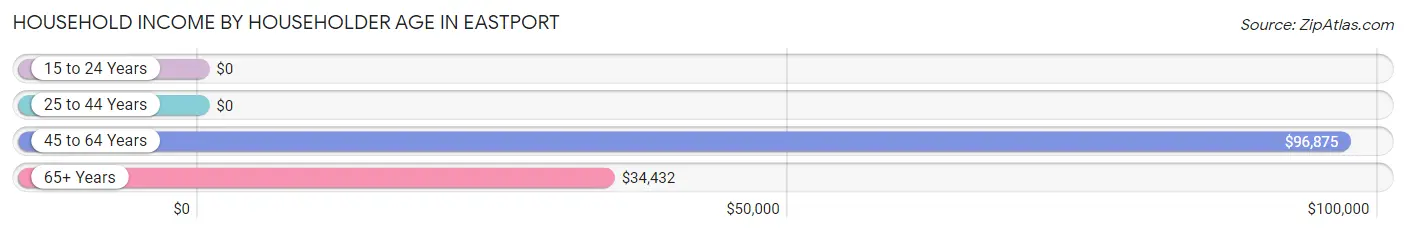
| Income Bracket | # Households | Median Income |
| 15 to 24 Years | 10 (6.8%) | $0 |
| 25 to 44 Years | 23 (15.7%) | $0 |
| 45 to 64 Years | 35 (23.8%) | $96,875 |
| 65+ Years | 79 (53.7%) | $34,432 |
| Total | 147 (100.0%) | $52,443 |
Poverty in Eastport
Income Below Poverty by Sex and Age in Eastport
With 12.1% poverty level for males and 19.5% for females among the residents of Eastport, 12 to 14 year old males and 35 to 44 year old females are the most vulnerable to poverty, with 7 males (100.0%) and 10 females (100.0%) in their respective age groups living below the poverty level.
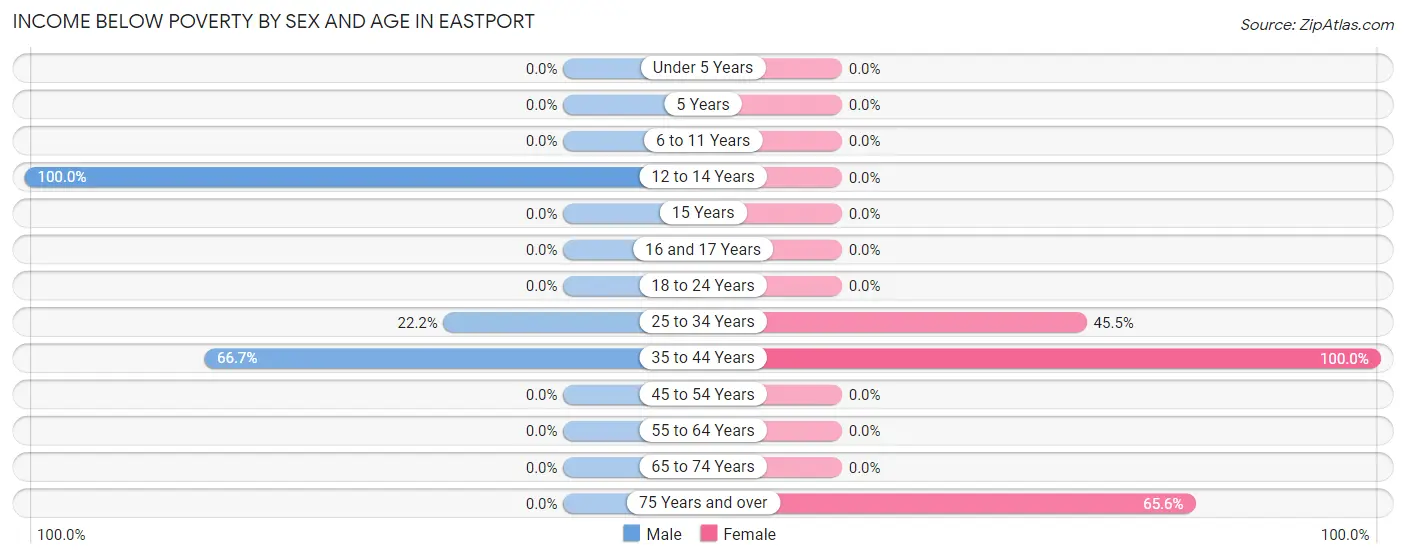
| Age Bracket | Male | Female |
| Under 5 Years | 0 (0.0%) | 0 (0.0%) |
| 5 Years | 0 (0.0%) | 0 (0.0%) |
| 6 to 11 Years | 0 (0.0%) | 0 (0.0%) |
| 12 to 14 Years | 7 (100.0%) | 0 (0.0%) |
| 15 Years | 0 (0.0%) | 0 (0.0%) |
| 16 and 17 Years | 0 (0.0%) | 0 (0.0%) |
| 18 to 24 Years | 0 (0.0%) | 0 (0.0%) |
| 25 to 34 Years | 4 (22.2%) | 10 (45.5%) |
| 35 to 44 Years | 6 (66.7%) | 10 (100.0%) |
| 45 to 54 Years | 0 (0.0%) | 0 (0.0%) |
| 55 to 64 Years | 0 (0.0%) | 0 (0.0%) |
| 65 to 74 Years | 0 (0.0%) | 0 (0.0%) |
| 75 Years and over | 0 (0.0%) | 21 (65.6%) |
| Total | 17 (12.1%) | 41 (19.5%) |
Income Above Poverty by Sex and Age in Eastport
According to the poverty statistics in Eastport, males aged under 5 years and females aged under 5 years are the age groups that are most secure financially, with 100.0% of males and 100.0% of females in these age groups living above the poverty line.
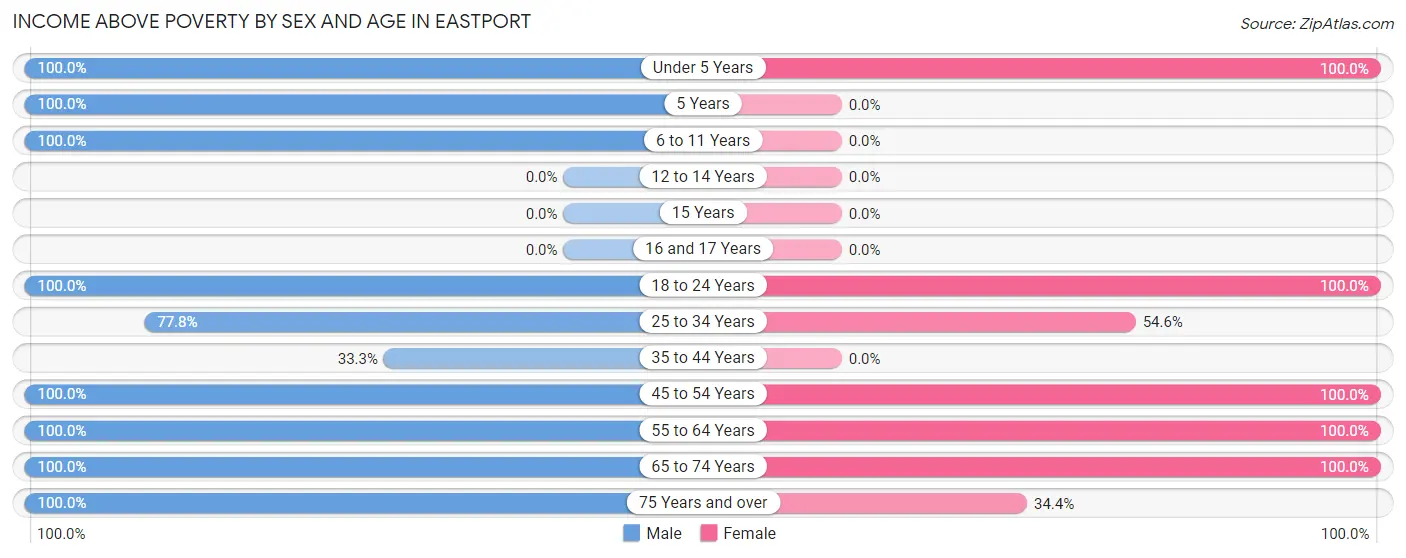
| Age Bracket | Male | Female |
| Under 5 Years | 5 (100.0%) | 3 (100.0%) |
| 5 Years | 5 (100.0%) | 0 (0.0%) |
| 6 to 11 Years | 6 (100.0%) | 0 (0.0%) |
| 12 to 14 Years | 0 (0.0%) | 0 (0.0%) |
| 15 Years | 0 (0.0%) | 0 (0.0%) |
| 16 and 17 Years | 0 (0.0%) | 0 (0.0%) |
| 18 to 24 Years | 9 (100.0%) | 10 (100.0%) |
| 25 to 34 Years | 14 (77.8%) | 12 (54.5%) |
| 35 to 44 Years | 3 (33.3%) | 0 (0.0%) |
| 45 to 54 Years | 5 (100.0%) | 5 (100.0%) |
| 55 to 64 Years | 23 (100.0%) | 18 (100.0%) |
| 65 to 74 Years | 27 (100.0%) | 110 (100.0%) |
| 75 Years and over | 27 (100.0%) | 11 (34.4%) |
| Total | 124 (87.9%) | 169 (80.5%) |
Income Below Poverty Among Married-Couple Families in Eastport
The poverty statistics for married-couple families in Eastport show that 4.2% or 4 of the total 95 families live below the poverty line. Families with no children have the highest poverty rate of 4.9%, comprising of 4 families. On the other hand, families with 1 or 2 children have the lowest poverty rate of 0.0%, which includes 0 families.
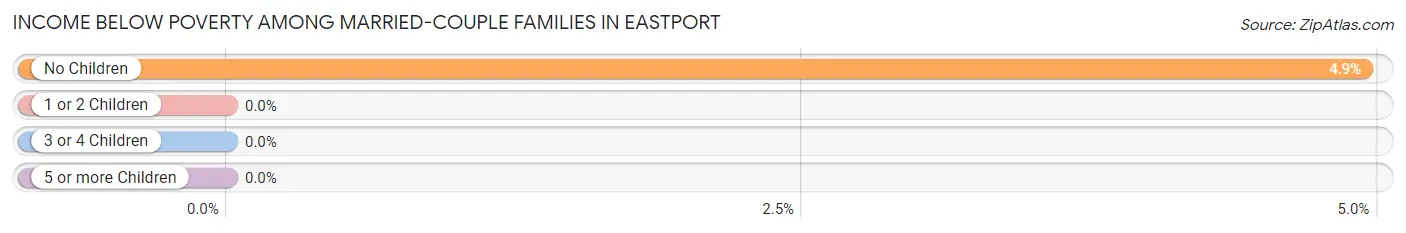
| Children | Above Poverty | Below Poverty |
| No Children | 77 (95.1%) | 4 (4.9%) |
| 1 or 2 Children | 10 (100.0%) | 0 (0.0%) |
| 3 or 4 Children | 4 (100.0%) | 0 (0.0%) |
| 5 or more Children | 0 (0.0%) | 0 (0.0%) |
| Total | 91 (95.8%) | 4 (4.2%) |
Income Below Poverty Among Single-Parent Households in Eastport
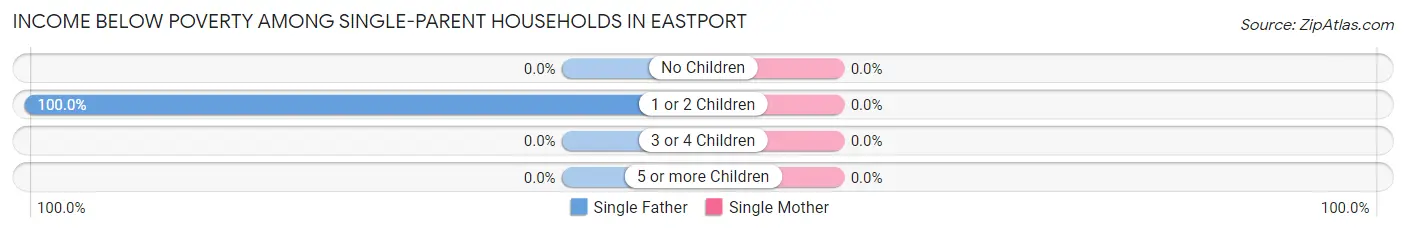
| Children | Single Father | Single Mother |
| No Children | 0 (0.0%) | 0 (0.0%) |
| 1 or 2 Children | 6 (100.0%) | 0 (0.0%) |
| 3 or 4 Children | 0 (0.0%) | 0 (0.0%) |
| 5 or more Children | 0 (0.0%) | 0 (0.0%) |
| Total | 6 (100.0%) | 0 (0.0%) |
Income Below Poverty Among Married-Couple vs Single-Parent Households in Eastport
The poverty data for Eastport shows that 4 of the married-couple family households (4.2%) and 6 of the single-parent households (100.0%) are living below the poverty level. Within the married-couple family households, those with no children have the highest poverty rate, with 4 households (4.9%) falling below the poverty line. Among the single-parent households, those with 1 or 2 children have the highest poverty rate, with 6 household (100.0%) living below poverty.
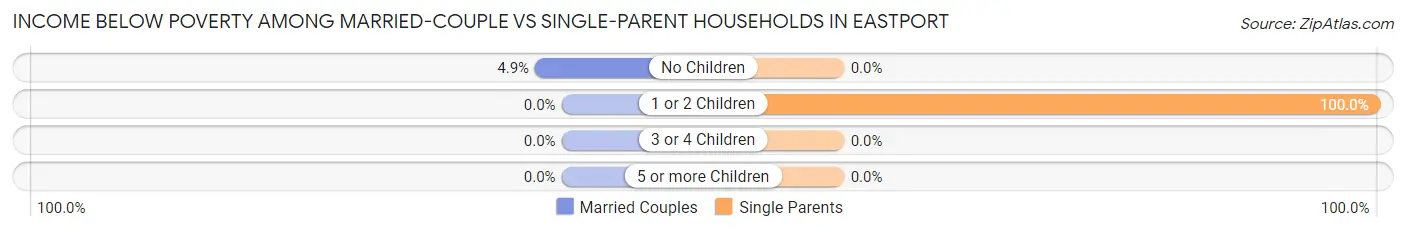
| Children | Married-Couple Families | Single-Parent Households |
| No Children | 4 (4.9%) | 0 (0.0%) |
| 1 or 2 Children | 0 (0.0%) | 6 (100.0%) |
| 3 or 4 Children | 0 (0.0%) | 0 (0.0%) |
| 5 or more Children | 0 (0.0%) | 0 (0.0%) |
| Total | 4 (4.2%) | 6 (100.0%) |
Race in Eastport
The most populous races in Eastport are White / Caucasian (321 | 91.4%), Two or more Races (30 | 8.6%), and Hispanic or Latino (9 | 2.6%).
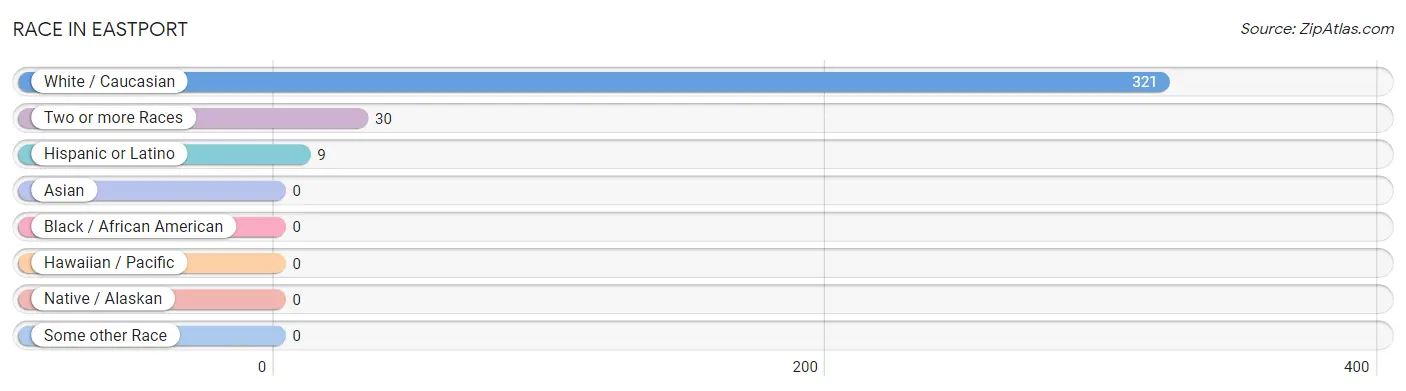
| Race | # Population | % Population |
| Asian | 0 | 0.0% |
| Black / African American | 0 | 0.0% |
| Hawaiian / Pacific | 0 | 0.0% |
| Hispanic or Latino | 9 | 2.6% |
| Native / Alaskan | 0 | 0.0% |
| White / Caucasian | 321 | 91.4% |
| Two or more Races | 30 | 8.6% |
| Some other Race | 0 | 0.0% |
| Total | 351 | 100.0% |
Ancestry in Eastport
The most populous ancestries reported in Eastport are German (87 | 24.8%), English (79 | 22.5%), Swedish (78 | 22.2%), Italian (34 | 9.7%), and Polish (25 | 7.1%), together accounting for 86.3% of all Eastport residents.
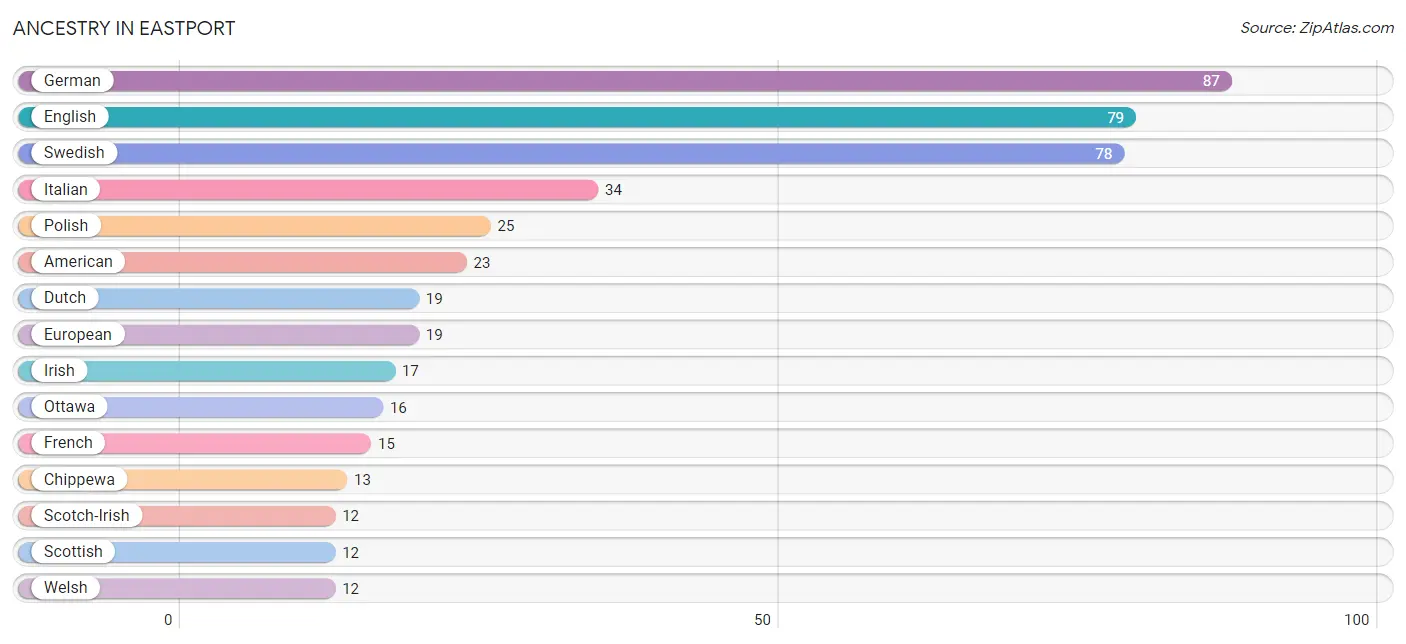
| Ancestry | # Population | % Population |
| American | 23 | 6.6% |
| Canadian | 3 | 0.9% |
| Chippewa | 13 | 3.7% |
| Dutch | 19 | 5.4% |
| English | 79 | 22.5% |
| European | 19 | 5.4% |
| French | 15 | 4.3% |
| German | 87 | 24.8% |
| Hungarian | 3 | 0.9% |
| Irish | 17 | 4.8% |
| Italian | 34 | 9.7% |
| Norwegian | 10 | 2.9% |
| Ottawa | 16 | 4.6% |
| Polish | 25 | 7.1% |
| Scandinavian | 3 | 0.9% |
| Scotch-Irish | 12 | 3.4% |
| Scottish | 12 | 3.4% |
| Serbian | 1 | 0.3% |
| Spaniard | 9 | 2.6% |
| Swedish | 78 | 22.2% |
| Welsh | 12 | 3.4% | View All 21 Rows |
Immigrants in Eastport

| Immigration Origin | # Population | % Population | View All 0 Rows |
Sex and Age in Eastport
Sex and Age in Eastport
The most populous age groups in Eastport are 65 to 69 Years (24 | 17.0%) for men and 65 to 69 Years (89 | 42.4%) for women.
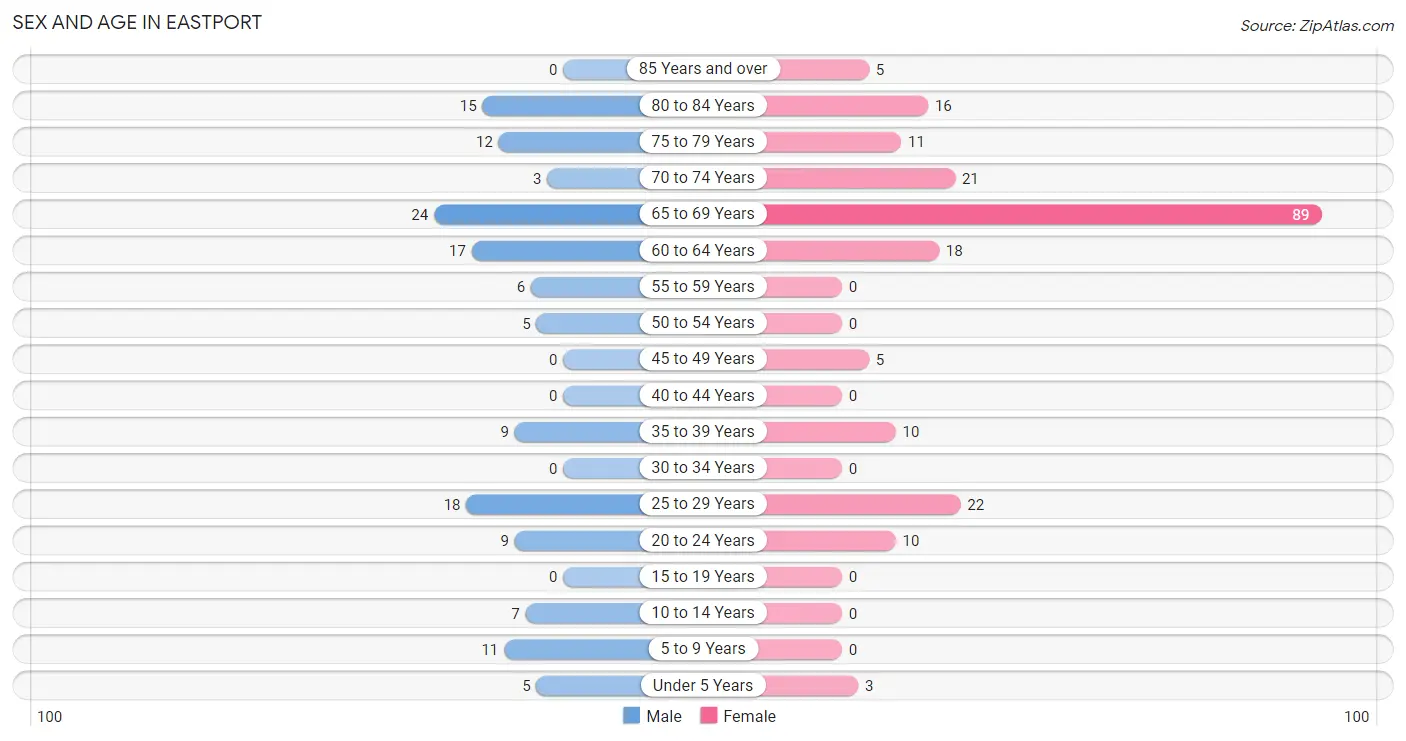
| Age Bracket | Male | Female |
| Under 5 Years | 5 (3.5%) | 3 (1.4%) |
| 5 to 9 Years | 11 (7.8%) | 0 (0.0%) |
| 10 to 14 Years | 7 (5.0%) | 0 (0.0%) |
| 15 to 19 Years | 0 (0.0%) | 0 (0.0%) |
| 20 to 24 Years | 9 (6.4%) | 10 (4.8%) |
| 25 to 29 Years | 18 (12.8%) | 22 (10.5%) |
| 30 to 34 Years | 0 (0.0%) | 0 (0.0%) |
| 35 to 39 Years | 9 (6.4%) | 10 (4.8%) |
| 40 to 44 Years | 0 (0.0%) | 0 (0.0%) |
| 45 to 49 Years | 0 (0.0%) | 5 (2.4%) |
| 50 to 54 Years | 5 (3.5%) | 0 (0.0%) |
| 55 to 59 Years | 6 (4.3%) | 0 (0.0%) |
| 60 to 64 Years | 17 (12.1%) | 18 (8.6%) |
| 65 to 69 Years | 24 (17.0%) | 89 (42.4%) |
| 70 to 74 Years | 3 (2.1%) | 21 (10.0%) |
| 75 to 79 Years | 12 (8.5%) | 11 (5.2%) |
| 80 to 84 Years | 15 (10.6%) | 16 (7.6%) |
| 85 Years and over | 0 (0.0%) | 5 (2.4%) |
| Total | 141 (100.0%) | 210 (100.0%) |
Families and Households in Eastport
Median Family Size in Eastport
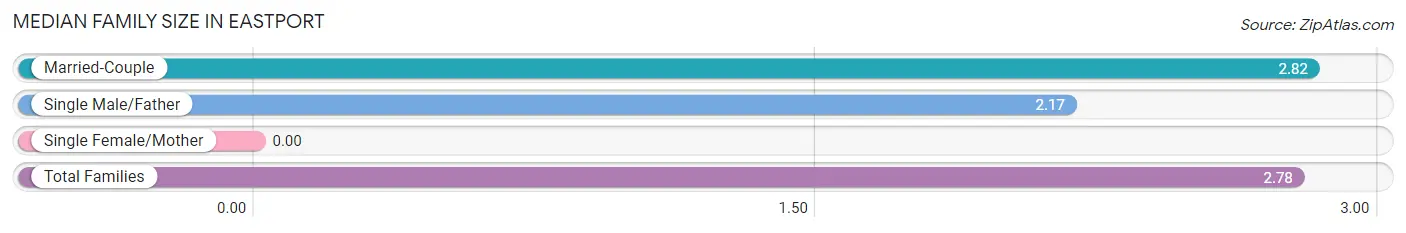
| Family Type | # Families | Family Size |
| Married-Couple | 95 (94.1%) | 2.82 |
| Single Male/Father | 6 (5.9%) | 2.17 |
| Single Female/Mother | 0 (0.0%) | - |
| Total Families | 101 (100.0%) | 2.78 |
Median Household Size in Eastport
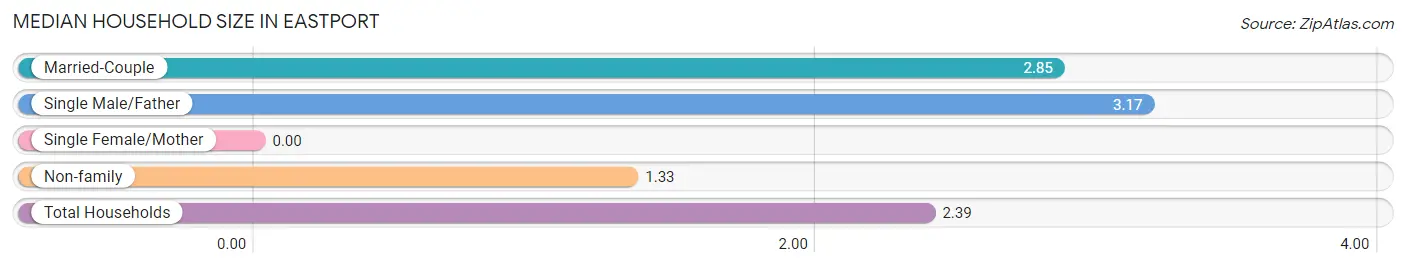
| Household Type | # Households | Household Size |
| Married-Couple | 95 (64.6%) | 2.85 |
| Single Male/Father | 6 (4.1%) | 3.17 |
| Single Female/Mother | 0 (0.0%) | - |
| Non-family | 46 (31.3%) | 1.33 |
| Total Households | 147 (100.0%) | 2.39 |
Household Size by Marriage Status in Eastport
Out of a total of 147 households in Eastport, 101 (68.7%) are family households, while 46 (31.3%) are nonfamily households. The most numerous type of family households are 2-person households, comprising 69, and the most common type of nonfamily households are 1-person households, comprising 32.
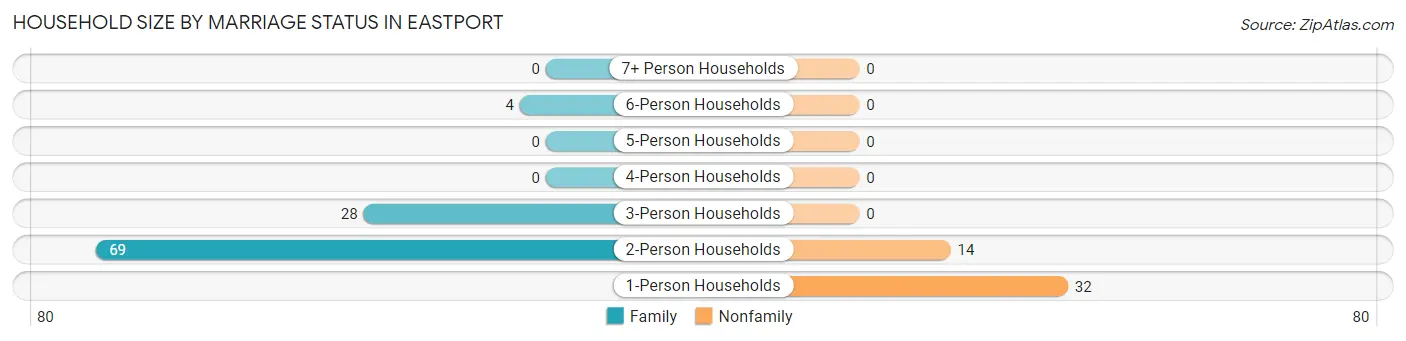
| Household Size | Family Households | Nonfamily Households |
| 1-Person Households | - | 32 (21.8%) |
| 2-Person Households | 69 (46.9%) | 14 (9.5%) |
| 3-Person Households | 28 (19.1%) | 0 (0.0%) |
| 4-Person Households | 0 (0.0%) | 0 (0.0%) |
| 5-Person Households | 0 (0.0%) | 0 (0.0%) |
| 6-Person Households | 4 (2.7%) | 0 (0.0%) |
| 7+ Person Households | 0 (0.0%) | 0 (0.0%) |
| Total | 101 (68.7%) | 46 (31.3%) |
Female Fertility in Eastport
Fertility by Age in Eastport
Average fertility rate in Eastport is 298.0 births per 1,000 women. Women in the age bracket of 20 to 34 years have the highest fertility rate with 438.0 births per 1,000 women. Women in the age bracket of 20 to 34 years acount for 100.0% of all women with births.
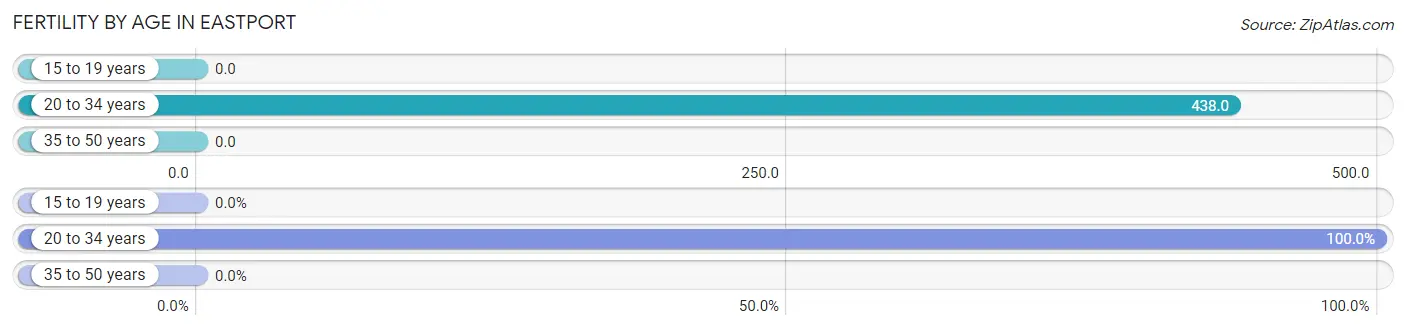
| Age Bracket | Women with Births | Births / 1,000 Women |
| 15 to 19 years | 0 (0.0%) | 0.0 |
| 20 to 34 years | 14 (100.0%) | 438.0 |
| 35 to 50 years | 0 (0.0%) | 0.0 |
| Total | 14 (100.0%) | 298.0 |
Fertility by Age by Marriage Status in Eastport
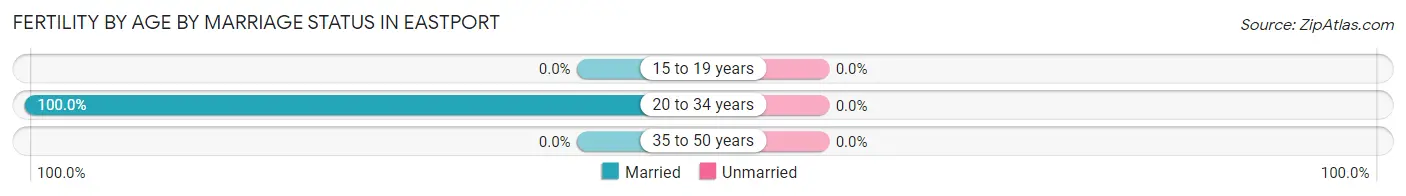
| Age Bracket | Married | Unmarried |
| 15 to 19 years | 0 (0.0%) | 0 (0.0%) |
| 20 to 34 years | 14 (100.0%) | 0 (0.0%) |
| 35 to 50 years | 0 (0.0%) | 0 (0.0%) |
| Total | 14 (100.0%) | 0 (0.0%) |
Fertility by Education in Eastport
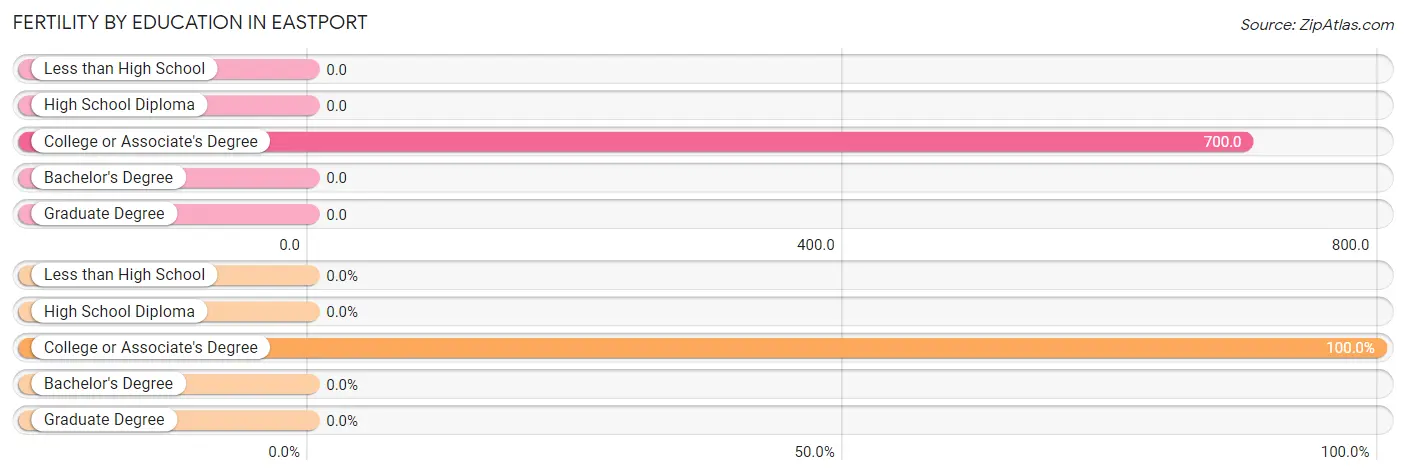
| Educational Attainment | Women with Births | Births / 1,000 Women |
| Less than High School | 0 (0.0%) | 0.0 |
| High School Diploma | 0 (0.0%) | 0.0 |
| College or Associate's Degree | 14 (100.0%) | 700.0 |
| Bachelor's Degree | 0 (0.0%) | 0.0 |
| Graduate Degree | 0 (0.0%) | 0.0 |
| Total | 14 (100.0%) | 298.0 |
Fertility by Education by Marriage Status in Eastport
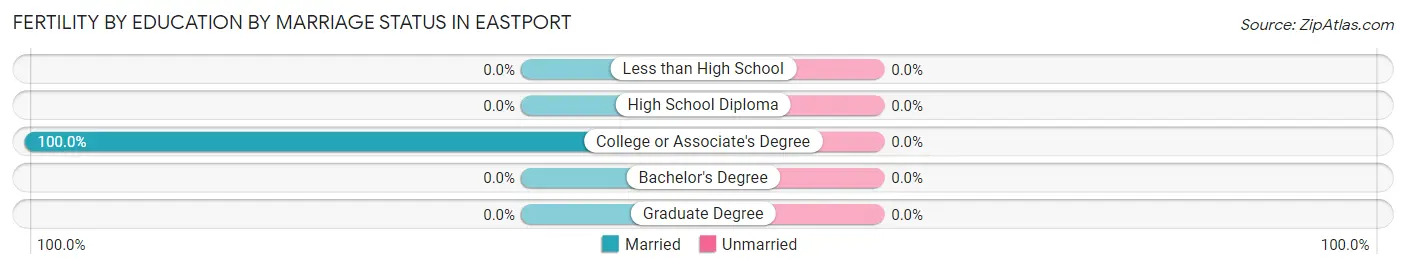
| Educational Attainment | Married | Unmarried |
| Less than High School | 0 (0.0%) | 0 (0.0%) |
| High School Diploma | 0 (0.0%) | 0 (0.0%) |
| College or Associate's Degree | 14 (100.0%) | 0 (0.0%) |
| Bachelor's Degree | 0 (0.0%) | 0 (0.0%) |
| Graduate Degree | 0 (0.0%) | 0 (0.0%) |
| Total | 14 (100.0%) | 0 (0.0%) |
Employment Characteristics in Eastport
Employment by Class of Employer in Eastport
Among the 106 employed individuals in Eastport, private company employees (73 | 68.9%), self-employed (not incorporated) (12 | 11.3%), and local government employees (12 | 11.3%) make up the most common classes of employment.
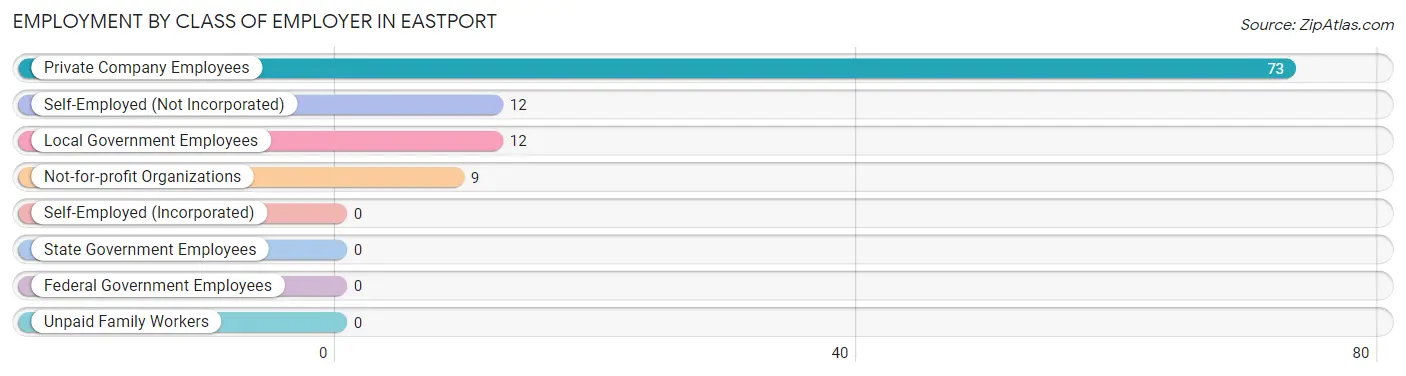
| Employer Class | # Employees | % Employees |
| Private Company Employees | 73 | 68.9% |
| Self-Employed (Incorporated) | 0 | 0.0% |
| Self-Employed (Not Incorporated) | 12 | 11.3% |
| Not-for-profit Organizations | 9 | 8.5% |
| Local Government Employees | 12 | 11.3% |
| State Government Employees | 0 | 0.0% |
| Federal Government Employees | 0 | 0.0% |
| Unpaid Family Workers | 0 | 0.0% |
| Total | 106 | 100.0% |
Employment Status by Age in Eastport
According to the labor force statistics for Eastport, out of the total population over 16 years of age (325), 36.3% or 118 individuals are in the labor force, with 10.2% or 12 of them unemployed. The age group with the highest labor force participation rate is 20 to 24 years, with 100.0% or 19 individuals in the labor force. Within the labor force, the 35 to 44 years age range has the highest percentage of unemployed individuals, with 31.6% or 6 of them being unemployed.
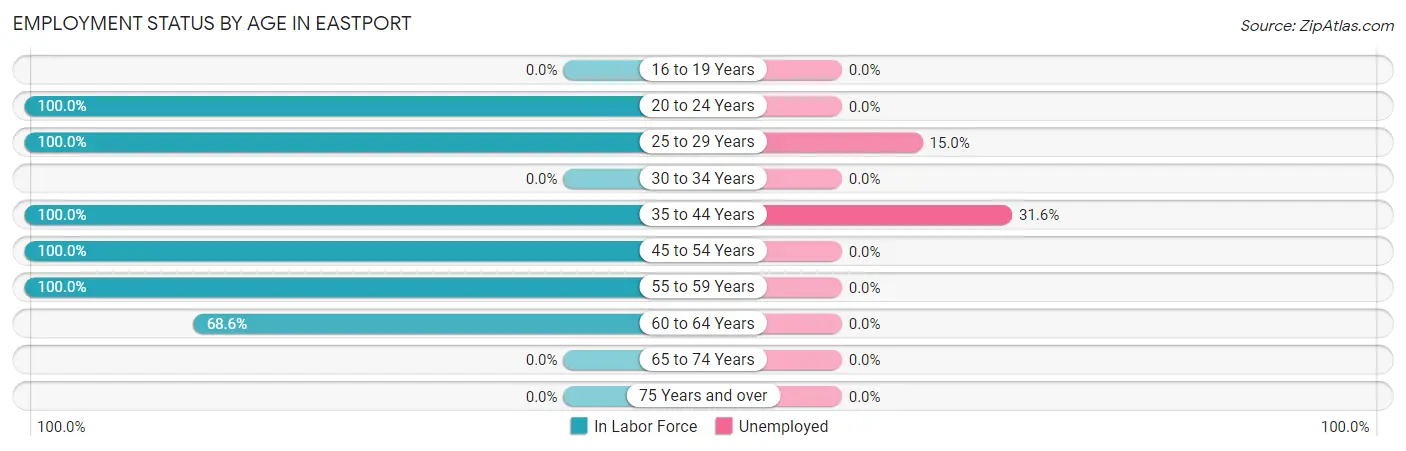
| Age Bracket | In Labor Force | Unemployed |
| 16 to 19 Years | 0 (0.0%) | 0 (0.0%) |
| 20 to 24 Years | 19 (100.0%) | 0 (0.0%) |
| 25 to 29 Years | 40 (100.0%) | 6 (15.0%) |
| 30 to 34 Years | 0 (0.0%) | 0 (0.0%) |
| 35 to 44 Years | 19 (100.0%) | 6 (31.6%) |
| 45 to 54 Years | 10 (100.0%) | 0 (0.0%) |
| 55 to 59 Years | 6 (100.0%) | 0 (0.0%) |
| 60 to 64 Years | 24 (68.6%) | 0 (0.0%) |
| 65 to 74 Years | 0 (0.0%) | 0 (0.0%) |
| 75 Years and over | 0 (0.0%) | 0 (0.0%) |
| Total | 118 (36.3%) | 12 (10.2%) |
Employment Status by Educational Attainment in Eastport
According to labor force statistics for Eastport, 90.0% of individuals (99) out of the total population between 25 and 64 years of age (110) are in the labor force, with 12.1% or 12 of them being unemployed. The group with the highest labor force participation rate are those with the educational attainment of high school diploma, with 100.0% or 7 individuals in the labor force. Within the labor force, individuals with college / associate degree education have the highest percentage of unemployment, with 25.5% or 12 of them being unemployed.
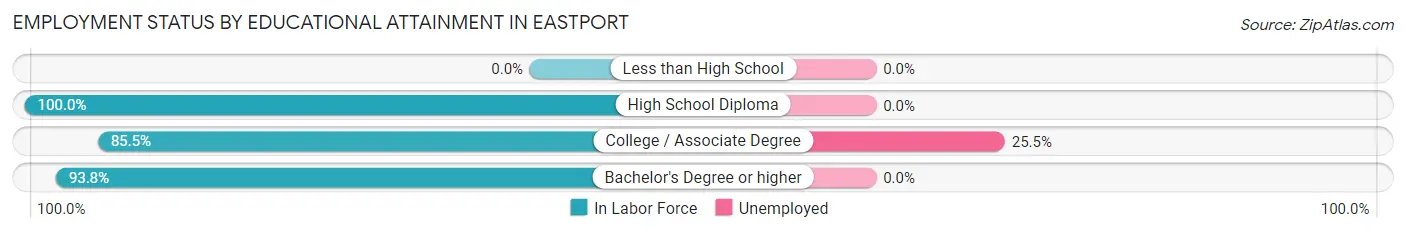
| Educational Attainment | In Labor Force | Unemployed |
| Less than High School | 0 (0.0%) | 0 (0.0%) |
| High School Diploma | 7 (100.0%) | 0 (0.0%) |
| College / Associate Degree | 47 (85.5%) | 14 (25.5%) |
| Bachelor's Degree or higher | 45 (93.8%) | 0 (0.0%) |
| Total | 99 (90.0%) | 13 (12.1%) |
Employment Occupations by Sex in Eastport
Management, Business, Science and Arts Occupations
The most common Management, Business, Science and Arts occupations in Eastport are Management (36 | 34.0%), Community & Social Service (14 | 13.2%), Computers, Engineering & Science (9 | 8.5%), Computers & Mathematics (9 | 8.5%), and Education, Arts & Media (9 | 8.5%).
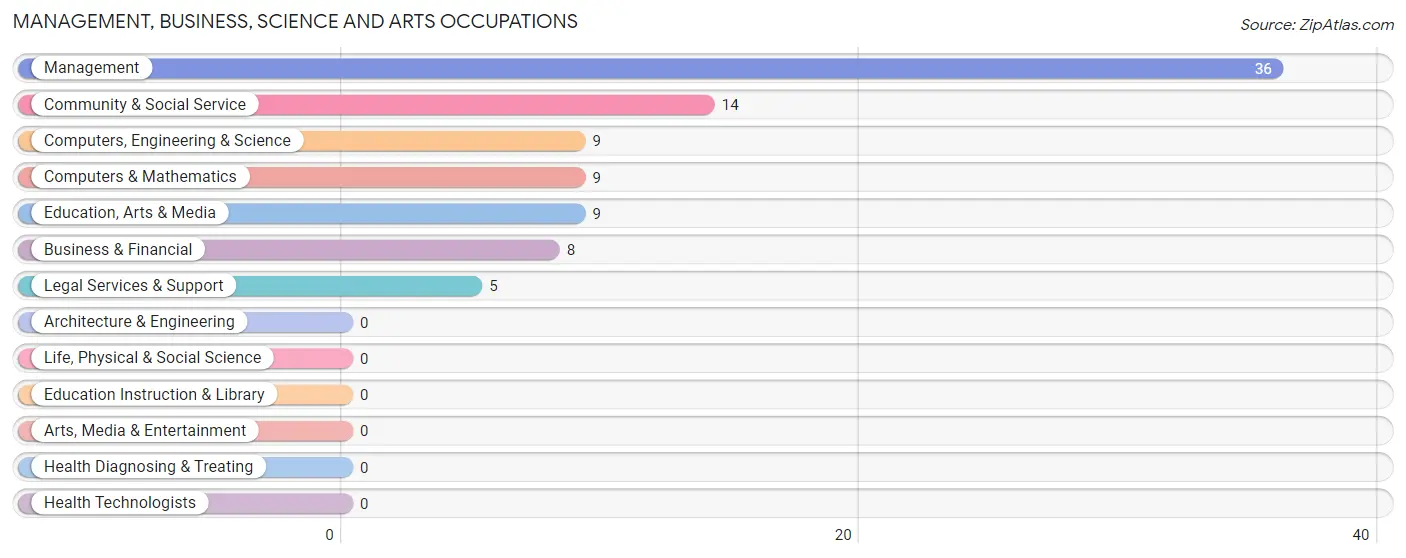
Management, Business, Science and Arts Occupations by Sex
Within the Management, Business, Science and Arts occupations in Eastport, the most male-oriented occupations are Computers, Engineering & Science (100.0%), Computers & Mathematics (100.0%), and Education, Arts & Media (100.0%), while the most female-oriented occupations are Business & Financial (100.0%), Legal Services & Support (100.0%), and Management (52.8%).
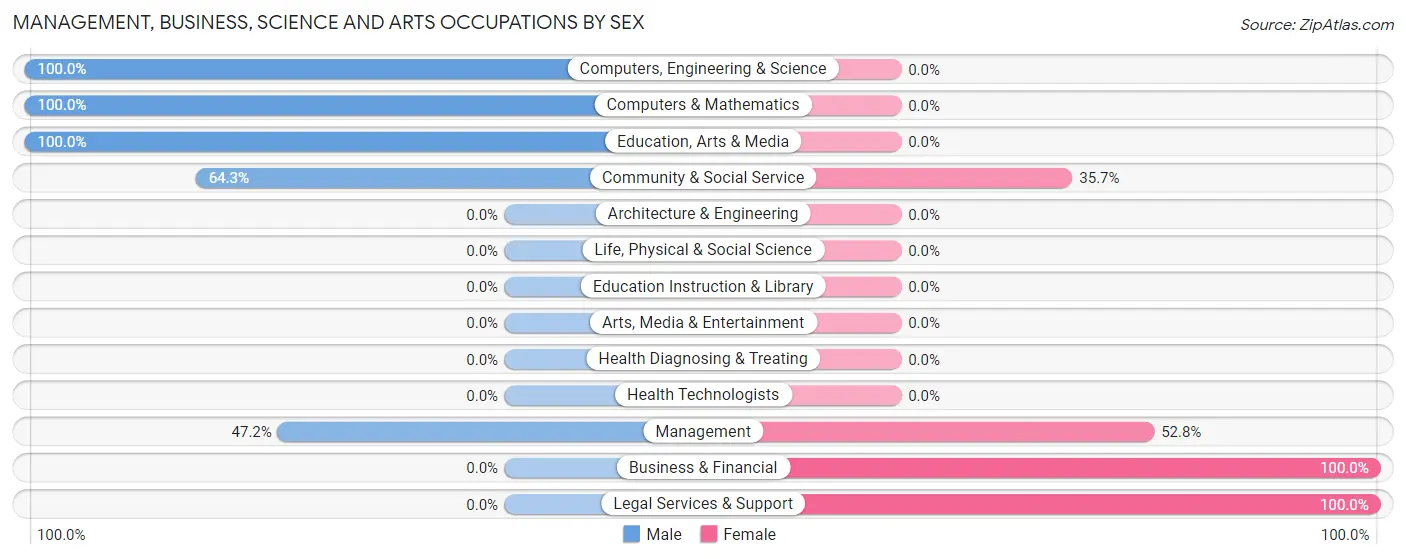
| Occupation | Male | Female |
| Management | 17 (47.2%) | 19 (52.8%) |
| Business & Financial | 0 (0.0%) | 8 (100.0%) |
| Computers, Engineering & Science | 9 (100.0%) | 0 (0.0%) |
| Computers & Mathematics | 9 (100.0%) | 0 (0.0%) |
| Architecture & Engineering | 0 (0.0%) | 0 (0.0%) |
| Life, Physical & Social Science | 0 (0.0%) | 0 (0.0%) |
| Community & Social Service | 9 (64.3%) | 5 (35.7%) |
| Education, Arts & Media | 9 (100.0%) | 0 (0.0%) |
| Legal Services & Support | 0 (0.0%) | 5 (100.0%) |
| Education Instruction & Library | 0 (0.0%) | 0 (0.0%) |
| Arts, Media & Entertainment | 0 (0.0%) | 0 (0.0%) |
| Health Diagnosing & Treating | 0 (0.0%) | 0 (0.0%) |
| Health Technologists | 0 (0.0%) | 0 (0.0%) |
| Total (Category) | 35 (52.2%) | 32 (47.8%) |
| Total (Overall) | 53 (50.0%) | 53 (50.0%) |
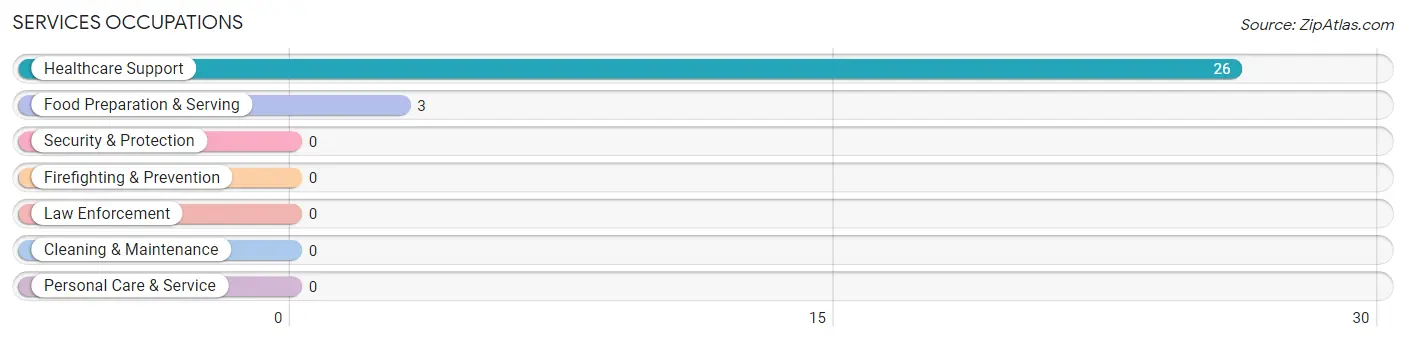
Services Occupations
The most common Services occupations in Eastport are Healthcare Support (26 | 24.5%), and Food Preparation & Serving (3 | 2.8%).
Services Occupations by Sex
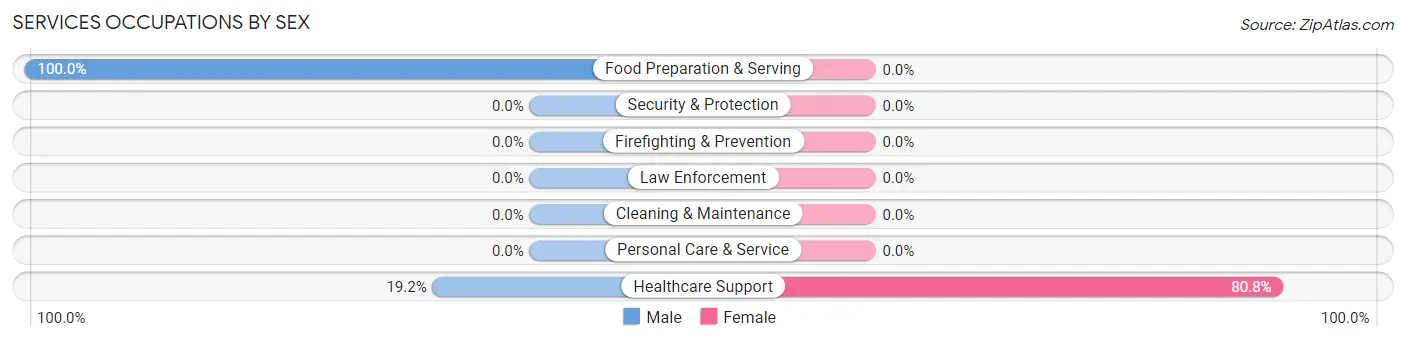
| Occupation | Male | Female |
| Healthcare Support | 5 (19.2%) | 21 (80.8%) |
| Security & Protection | 0 (0.0%) | 0 (0.0%) |
| Firefighting & Prevention | 0 (0.0%) | 0 (0.0%) |
| Law Enforcement | 0 (0.0%) | 0 (0.0%) |
| Food Preparation & Serving | 3 (100.0%) | 0 (0.0%) |
| Cleaning & Maintenance | 0 (0.0%) | 0 (0.0%) |
| Personal Care & Service | 0 (0.0%) | 0 (0.0%) |
| Total (Category) | 8 (27.6%) | 21 (72.4%) |
| Total (Overall) | 53 (50.0%) | 53 (50.0%) |
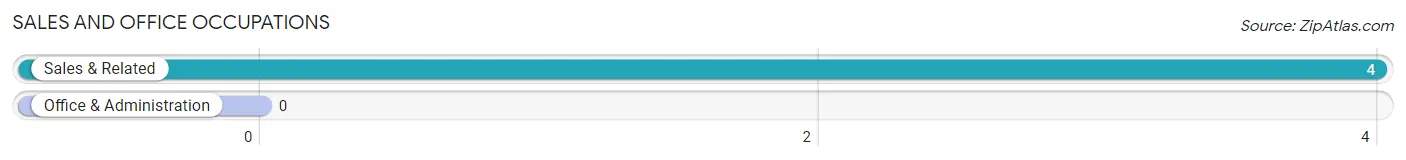
Sales and Office Occupations
The most common Sales and Office occupations in Eastport are , and Sales & Related (4 | 3.8%).
Sales and Office Occupations by Sex

| Occupation | Male | Female |
| Sales & Related | 4 (100.0%) | 0 (0.0%) |
| Office & Administration | 0 (0.0%) | 0 (0.0%) |
| Total (Category) | 4 (100.0%) | 0 (0.0%) |
| Total (Overall) | 53 (50.0%) | 53 (50.0%) |
Natural Resources, Construction and Maintenance Occupations
Natural Resources, Construction and Maintenance Occupations by Sex
| Occupation | Male | Female |
| Farming, Fishing & Forestry | 0 (0.0%) | 0 (0.0%) |
| Construction & Extraction | 0 (0.0%) | 0 (0.0%) |
| Installation, Maintenance & Repair | 0 (0.0%) | 0 (0.0%) |
| Total (Category) | 0 (0.0%) | 0 (0.0%) |
| Total (Overall) | 53 (50.0%) | 53 (50.0%) |
Production, Transportation and Moving Occupations
The most common Production, Transportation and Moving occupations in Eastport are , and Transportation (6 | 5.7%).
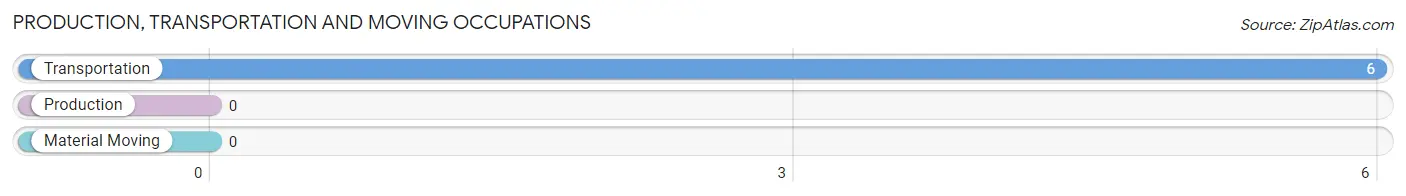
Production, Transportation and Moving Occupations by Sex
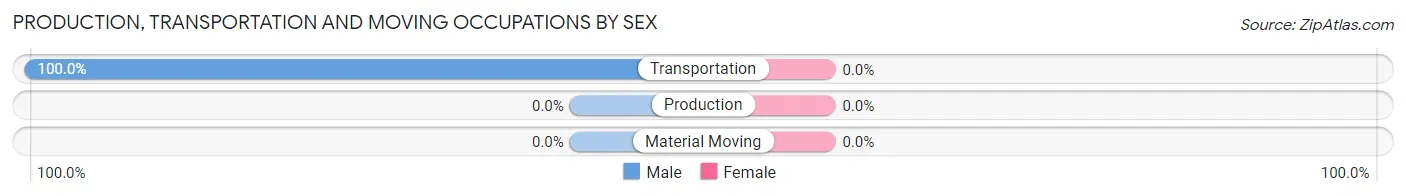
| Occupation | Male | Female |
| Production | 0 (0.0%) | 0 (0.0%) |
| Transportation | 6 (100.0%) | 0 (0.0%) |
| Material Moving | 0 (0.0%) | 0 (0.0%) |
| Total (Category) | 6 (100.0%) | 0 (0.0%) |
| Total (Overall) | 53 (50.0%) | 53 (50.0%) |
Employment Industries by Sex in Eastport
Employment Industries in Eastport
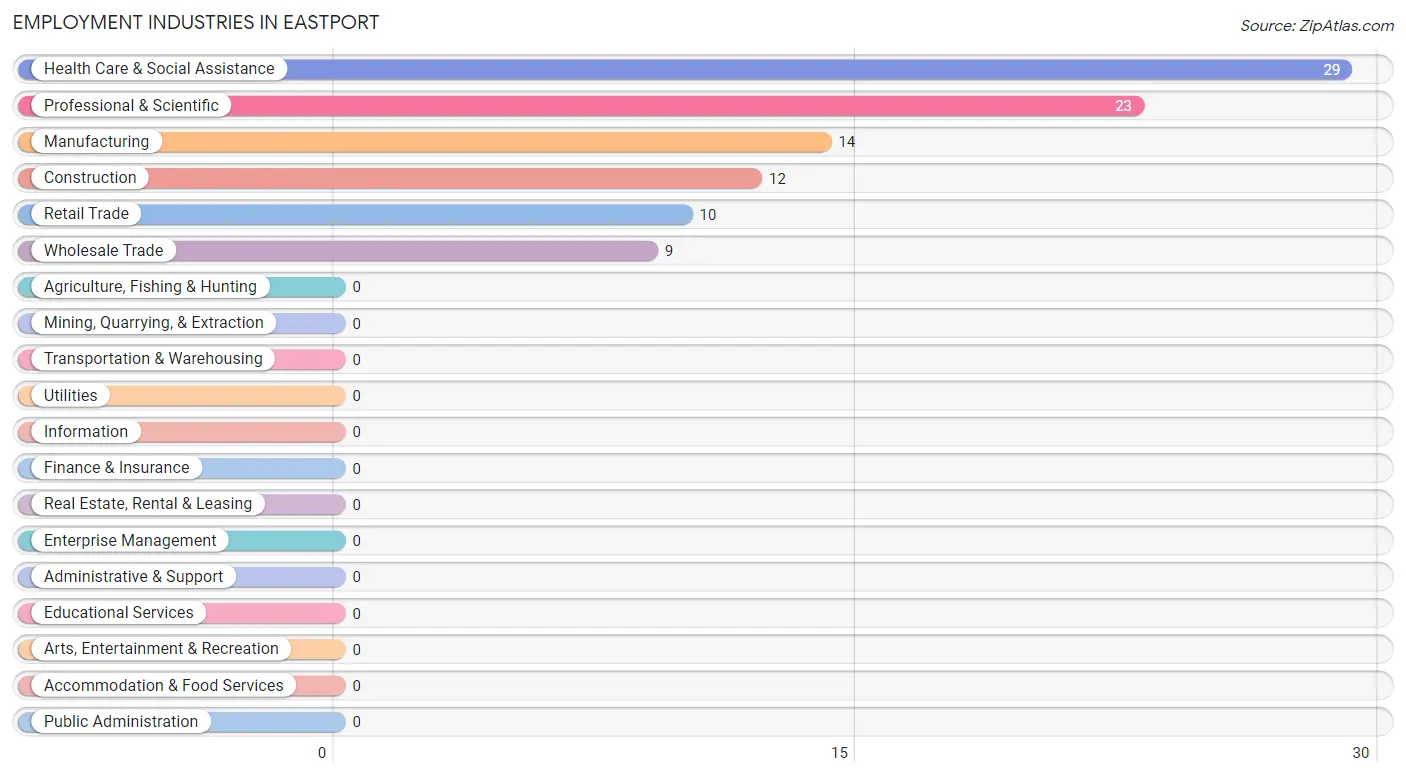
The major employment industries in Eastport include Health Care & Social Assistance (29 | 27.4%), Professional & Scientific (23 | 21.7%), Manufacturing (14 | 13.2%), Construction (12 | 11.3%), and Retail Trade (10 | 9.4%).
Employment Industries by Sex in Eastport
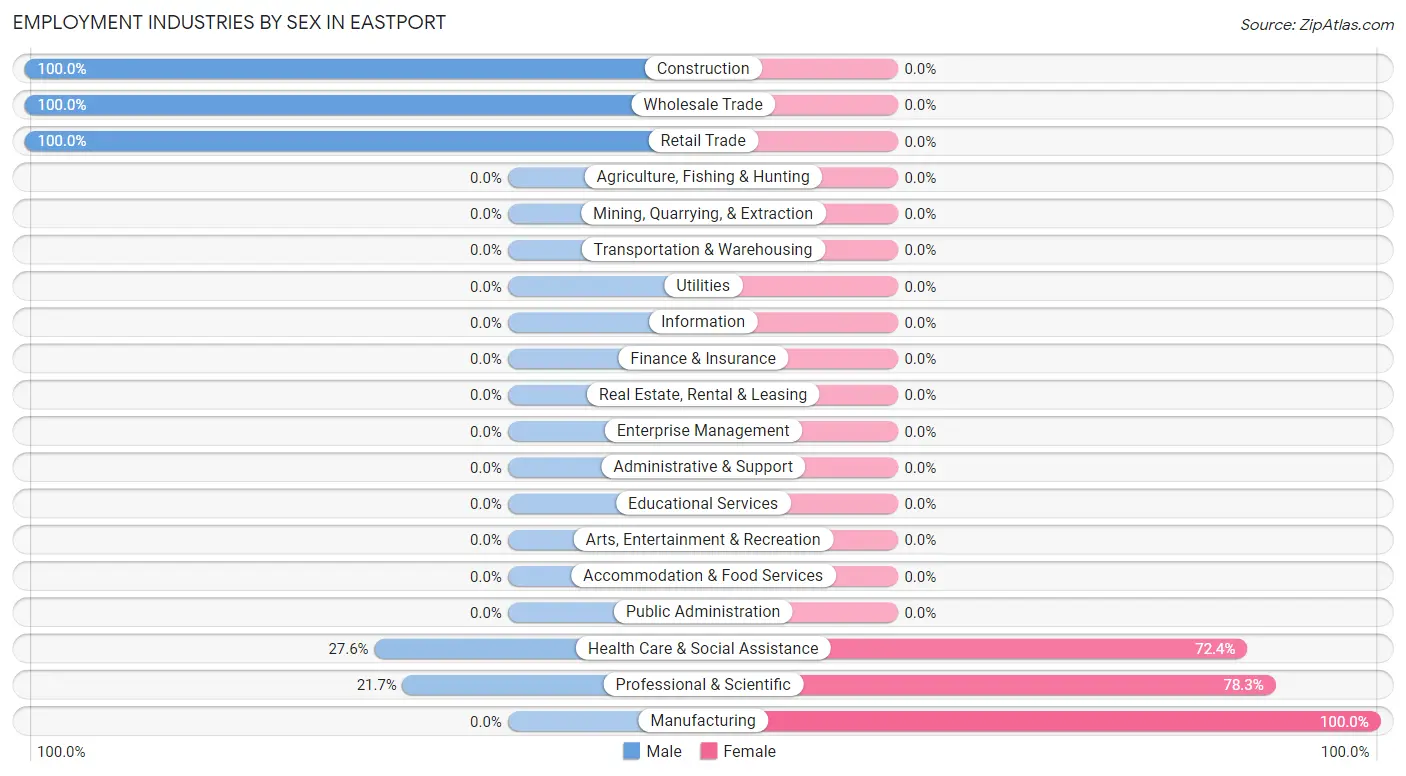
The Eastport industries that see more men than women are Construction (100.0%), Wholesale Trade (100.0%), and Retail Trade (100.0%), whereas the industries that tend to have a higher number of women are Manufacturing (100.0%), Professional & Scientific (78.3%), and Health Care & Social Assistance (72.4%).
| Industry | Male | Female |
| Agriculture, Fishing & Hunting | 0 (0.0%) | 0 (0.0%) |
| Mining, Quarrying, & Extraction | 0 (0.0%) | 0 (0.0%) |
| Construction | 12 (100.0%) | 0 (0.0%) |
| Manufacturing | 0 (0.0%) | 14 (100.0%) |
| Wholesale Trade | 9 (100.0%) | 0 (0.0%) |
| Retail Trade | 10 (100.0%) | 0 (0.0%) |
| Transportation & Warehousing | 0 (0.0%) | 0 (0.0%) |
| Utilities | 0 (0.0%) | 0 (0.0%) |
| Information | 0 (0.0%) | 0 (0.0%) |
| Finance & Insurance | 0 (0.0%) | 0 (0.0%) |
| Real Estate, Rental & Leasing | 0 (0.0%) | 0 (0.0%) |
| Professional & Scientific | 5 (21.7%) | 18 (78.3%) |
| Enterprise Management | 0 (0.0%) | 0 (0.0%) |
| Administrative & Support | 0 (0.0%) | 0 (0.0%) |
| Educational Services | 0 (0.0%) | 0 (0.0%) |
| Health Care & Social Assistance | 8 (27.6%) | 21 (72.4%) |
| Arts, Entertainment & Recreation | 0 (0.0%) | 0 (0.0%) |
| Accommodation & Food Services | 0 (0.0%) | 0 (0.0%) |
| Public Administration | 0 (0.0%) | 0 (0.0%) |
| Total | 53 (50.0%) | 53 (50.0%) |
Education in Eastport
School Enrollment in Eastport
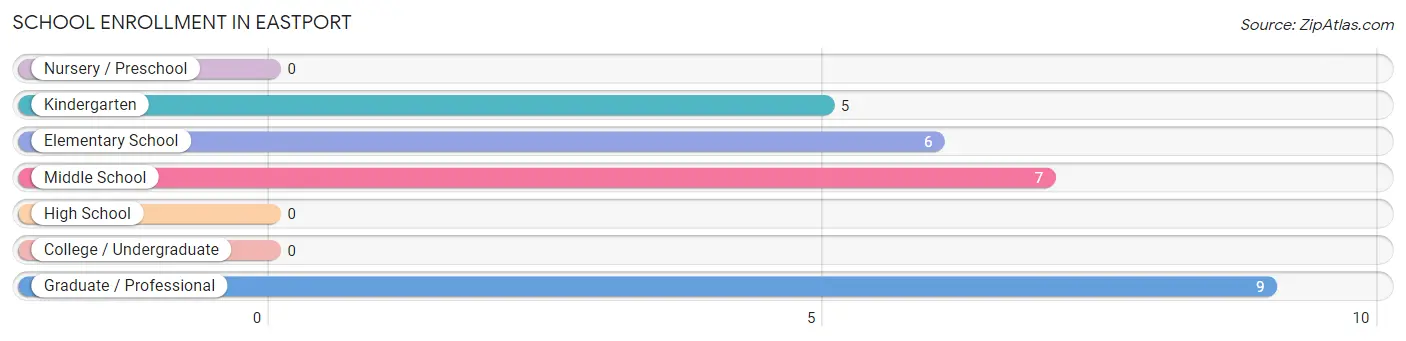
The most common levels of schooling among the 27 students in Eastport are graduate / professional (9 | 33.3%), middle school (7 | 25.9%), and elementary school (6 | 22.2%).
| School Level | # Students | % Students |
| Nursery / Preschool | 0 | 0.0% |
| Kindergarten | 5 | 18.5% |
| Elementary School | 6 | 22.2% |
| Middle School | 7 | 25.9% |
| High School | 0 | 0.0% |
| College / Undergraduate | 0 | 0.0% |
| Graduate / Professional | 9 | 33.3% |
| Total | 27 | 100.0% |
School Enrollment by Age by Funding Source in Eastport
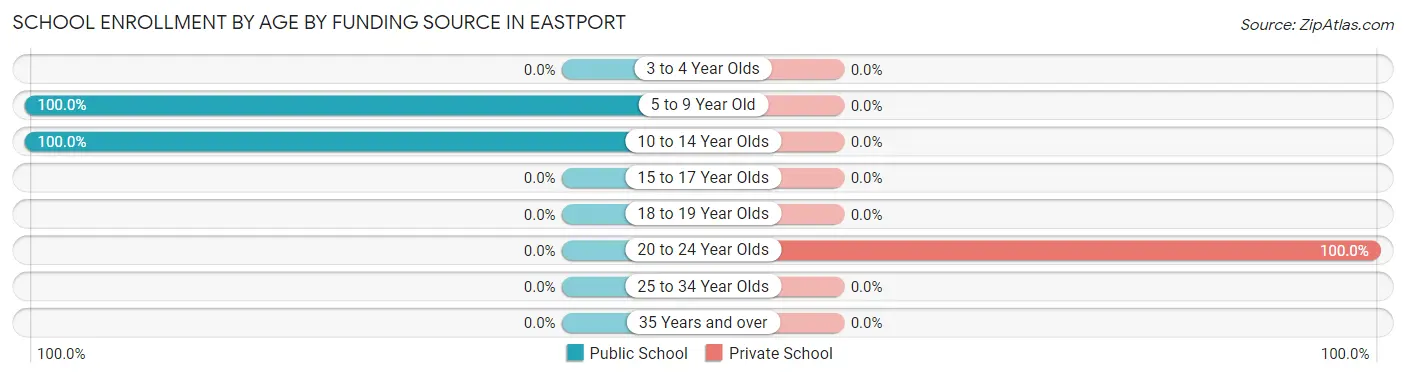
Out of a total of 27 students who are enrolled in schools in Eastport, 9 (33.3%) attend a private institution, while the remaining 18 (66.7%) are enrolled in public schools. The age group of 20 to 24 year olds has the highest likelihood of being enrolled in private schools, with 9 (100.0% in the age bracket) enrolled. Conversely, the age group of 5 to 9 year old has the lowest likelihood of being enrolled in a private school, with 11 (100.0% in the age bracket) attending a public institution.
| Age Bracket | Public School | Private School |
| 3 to 4 Year Olds | 0 (0.0%) | 0 (0.0%) |
| 5 to 9 Year Old | 11 (100.0%) | 0 (0.0%) |
| 10 to 14 Year Olds | 7 (100.0%) | 0 (0.0%) |
| 15 to 17 Year Olds | 0 (0.0%) | 0 (0.0%) |
| 18 to 19 Year Olds | 0 (0.0%) | 0 (0.0%) |
| 20 to 24 Year Olds | 0 (0.0%) | 9 (100.0%) |
| 25 to 34 Year Olds | 0 (0.0%) | 0 (0.0%) |
| 35 Years and over | 0 (0.0%) | 0 (0.0%) |
| Total | 18 (66.7%) | 9 (33.3%) |
Educational Attainment by Field of Study in Eastport
Business (22 | 23.9%), literature & languages (16 | 17.4%), social sciences (13 | 14.1%), engineering (13 | 14.1%), and arts & humanities (12 | 13.0%) are the most common fields of study among 92 individuals in Eastport who have obtained a bachelor's degree or higher.
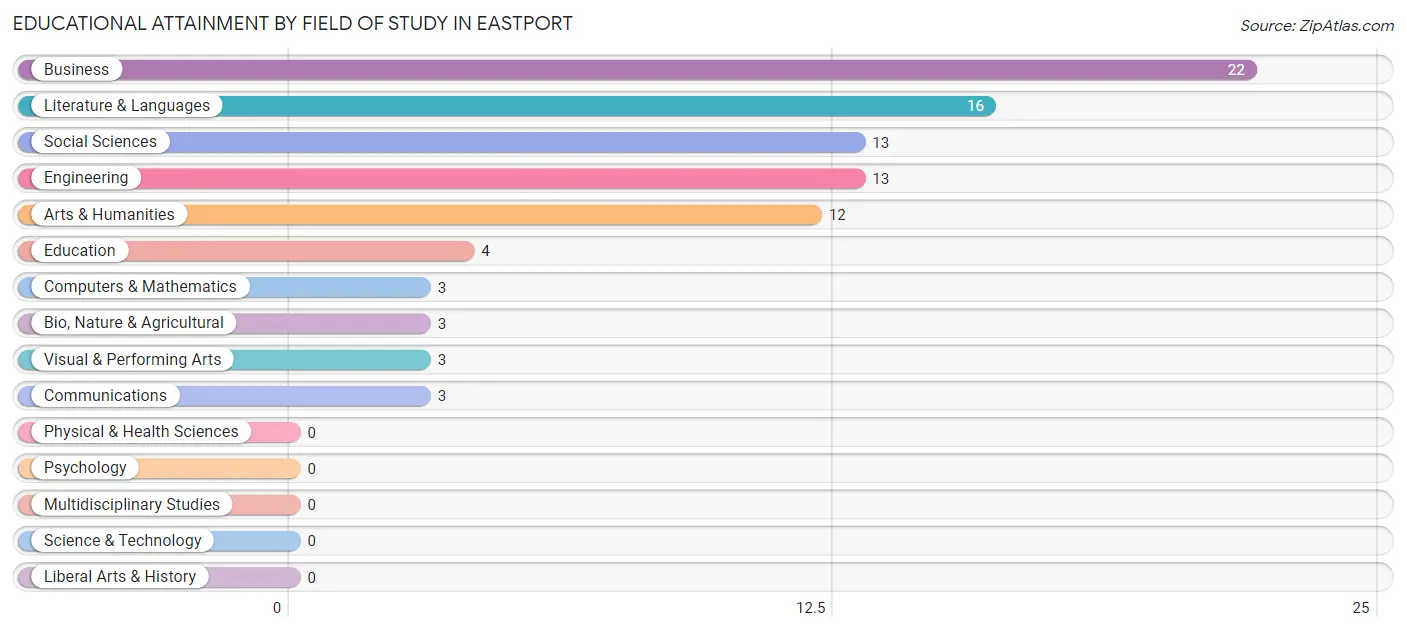
| Field of Study | # Graduates | % Graduates |
| Computers & Mathematics | 3 | 3.3% |
| Bio, Nature & Agricultural | 3 | 3.3% |
| Physical & Health Sciences | 0 | 0.0% |
| Psychology | 0 | 0.0% |
| Social Sciences | 13 | 14.1% |
| Engineering | 13 | 14.1% |
| Multidisciplinary Studies | 0 | 0.0% |
| Science & Technology | 0 | 0.0% |
| Business | 22 | 23.9% |
| Education | 4 | 4.3% |
| Literature & Languages | 16 | 17.4% |
| Liberal Arts & History | 0 | 0.0% |
| Visual & Performing Arts | 3 | 3.3% |
| Communications | 3 | 3.3% |
| Arts & Humanities | 12 | 13.0% |
| Total | 92 | 100.0% |
Transportation & Commute in Eastport
Vehicle Availability by Sex in Eastport
The most prevalent vehicle ownership categories in Eastport are males with 3 vehicles (25, accounting for 47.2%) and females with 3 vehicles (22, making up 47.2%).
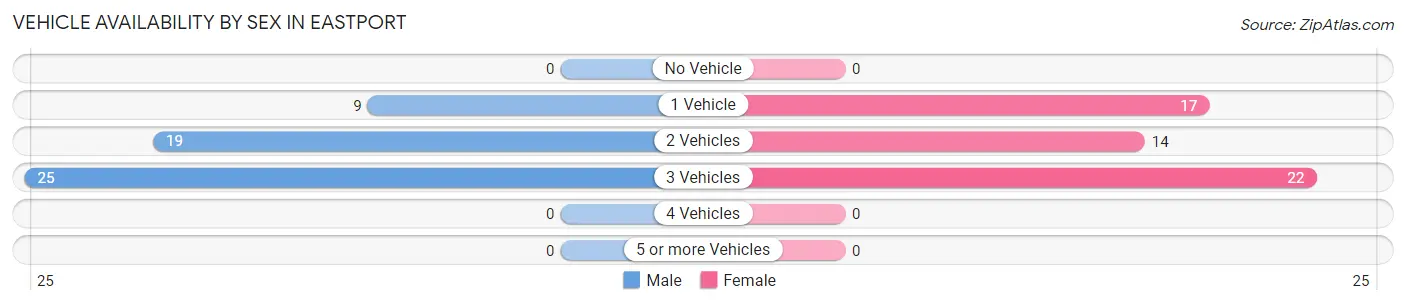
| Vehicles Available | Male | Female |
| No Vehicle | 0 (0.0%) | 0 (0.0%) |
| 1 Vehicle | 9 (17.0%) | 17 (32.1%) |
| 2 Vehicles | 19 (35.8%) | 14 (26.4%) |
| 3 Vehicles | 25 (47.2%) | 22 (41.5%) |
| 4 Vehicles | 0 (0.0%) | 0 (0.0%) |
| 5 or more Vehicles | 0 (0.0%) | 0 (0.0%) |
| Total | 53 (100.0%) | 53 (100.0%) |
Commute Time in Eastport
The most frequently occuring commute durations in Eastport are 20 to 24 minutes (34 commuters, 41.5%), 30 to 34 minutes (12 commuters, 14.6%), and 35 to 39 minutes (12 commuters, 14.6%).
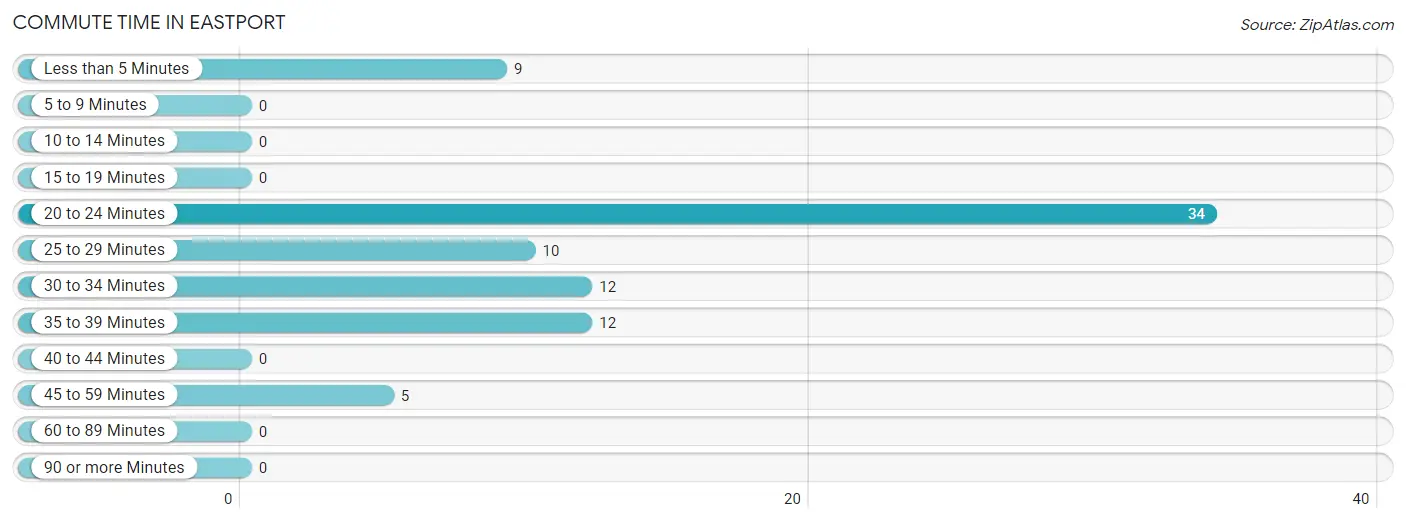
| Commute Time | # Commuters | % Commuters |
| Less than 5 Minutes | 9 | 11.0% |
| 5 to 9 Minutes | 0 | 0.0% |
| 10 to 14 Minutes | 0 | 0.0% |
| 15 to 19 Minutes | 0 | 0.0% |
| 20 to 24 Minutes | 34 | 41.5% |
| 25 to 29 Minutes | 10 | 12.2% |
| 30 to 34 Minutes | 12 | 14.6% |
| 35 to 39 Minutes | 12 | 14.6% |
| 40 to 44 Minutes | 0 | 0.0% |
| 45 to 59 Minutes | 5 | 6.1% |
| 60 to 89 Minutes | 0 | 0.0% |
| 90 or more Minutes | 0 | 0.0% |
Commute Time by Sex in Eastport
The most common commute times in Eastport are 35 to 39 minutes (12 commuters, 27.3%) for males and 20 to 24 minutes (30 commuters, 78.9%) for females.
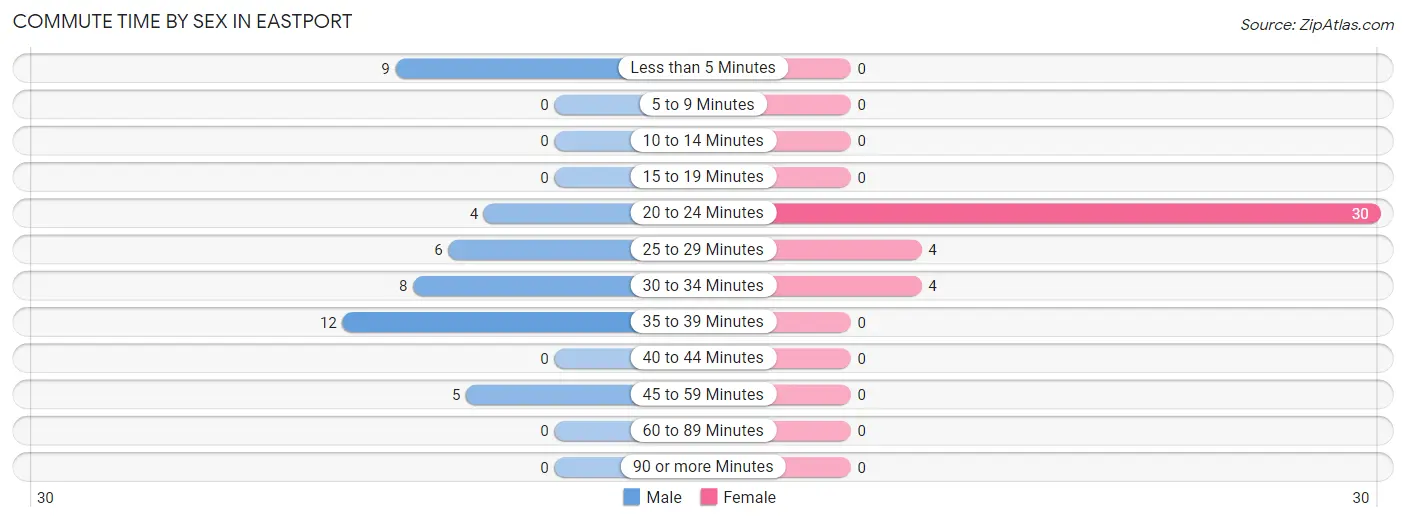
| Commute Time | Male | Female |
| Less than 5 Minutes | 9 (20.4%) | 0 (0.0%) |
| 5 to 9 Minutes | 0 (0.0%) | 0 (0.0%) |
| 10 to 14 Minutes | 0 (0.0%) | 0 (0.0%) |
| 15 to 19 Minutes | 0 (0.0%) | 0 (0.0%) |
| 20 to 24 Minutes | 4 (9.1%) | 30 (78.9%) |
| 25 to 29 Minutes | 6 (13.6%) | 4 (10.5%) |
| 30 to 34 Minutes | 8 (18.2%) | 4 (10.5%) |
| 35 to 39 Minutes | 12 (27.3%) | 0 (0.0%) |
| 40 to 44 Minutes | 0 (0.0%) | 0 (0.0%) |
| 45 to 59 Minutes | 5 (11.4%) | 0 (0.0%) |
| 60 to 89 Minutes | 0 (0.0%) | 0 (0.0%) |
| 90 or more Minutes | 0 (0.0%) | 0 (0.0%) |
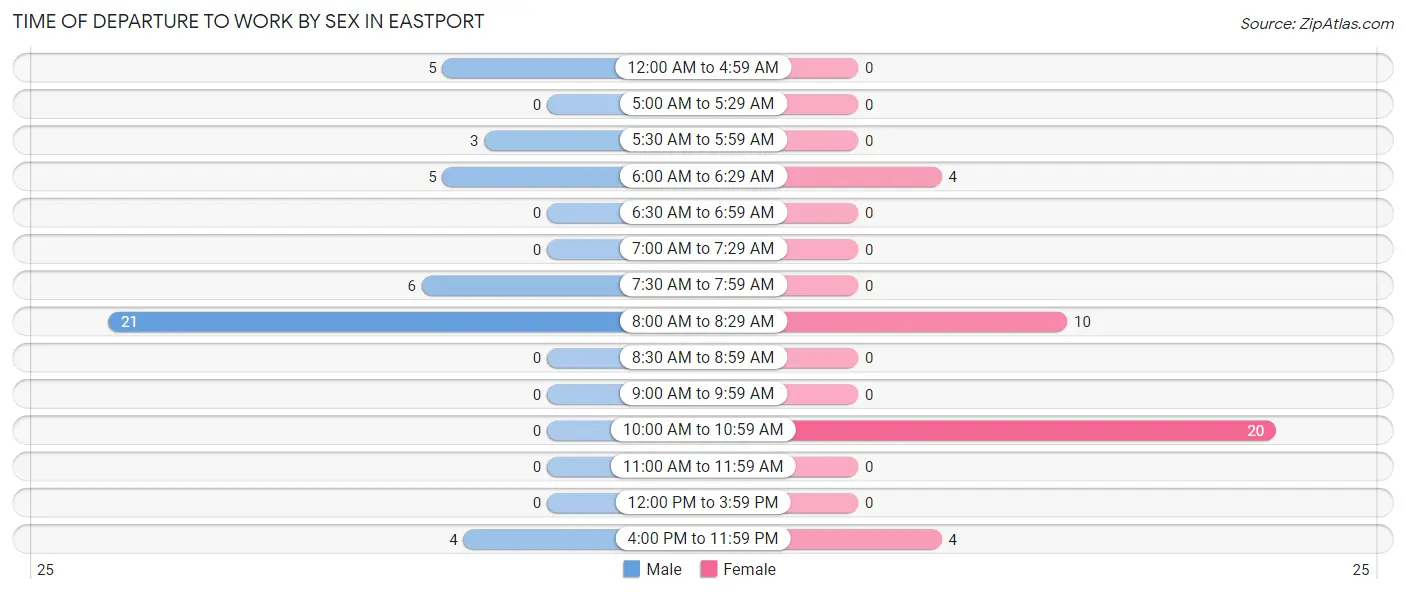
Time of Departure to Work by Sex in Eastport
The most frequent times of departure to work in Eastport are 8:00 AM to 8:29 AM (21, 47.7%) for males and 10:00 AM to 10:59 AM (20, 52.6%) for females.
| Time of Departure | Male | Female |
| 12:00 AM to 4:59 AM | 5 (11.4%) | 0 (0.0%) |
| 5:00 AM to 5:29 AM | 0 (0.0%) | 0 (0.0%) |
| 5:30 AM to 5:59 AM | 3 (6.8%) | 0 (0.0%) |
| 6:00 AM to 6:29 AM | 5 (11.4%) | 4 (10.5%) |
| 6:30 AM to 6:59 AM | 0 (0.0%) | 0 (0.0%) |
| 7:00 AM to 7:29 AM | 0 (0.0%) | 0 (0.0%) |
| 7:30 AM to 7:59 AM | 6 (13.6%) | 0 (0.0%) |
| 8:00 AM to 8:29 AM | 21 (47.7%) | 10 (26.3%) |
| 8:30 AM to 8:59 AM | 0 (0.0%) | 0 (0.0%) |
| 9:00 AM to 9:59 AM | 0 (0.0%) | 0 (0.0%) |
| 10:00 AM to 10:59 AM | 0 (0.0%) | 20 (52.6%) |
| 11:00 AM to 11:59 AM | 0 (0.0%) | 0 (0.0%) |
| 12:00 PM to 3:59 PM | 0 (0.0%) | 0 (0.0%) |
| 4:00 PM to 11:59 PM | 4 (9.1%) | 4 (10.5%) |
| Total | 44 (100.0%) | 38 (100.0%) |
Housing Occupancy in Eastport
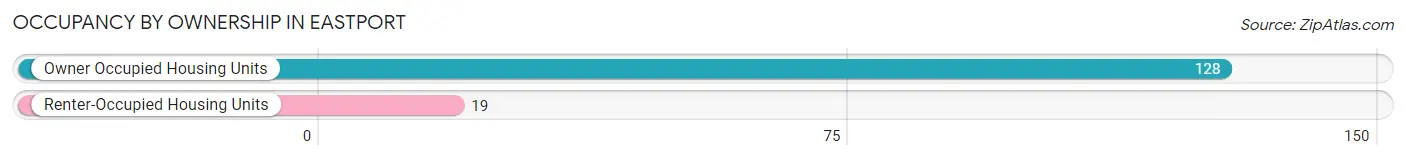
Occupancy by Ownership in Eastport
Of the total 147 dwellings in Eastport, owner-occupied units account for 128 (87.1%), while renter-occupied units make up 19 (12.9%).
| Occupancy | # Housing Units | % Housing Units |
| Owner Occupied Housing Units | 128 | 87.1% |
| Renter-Occupied Housing Units | 19 | 12.9% |
| Total Occupied Housing Units | 147 | 100.0% |
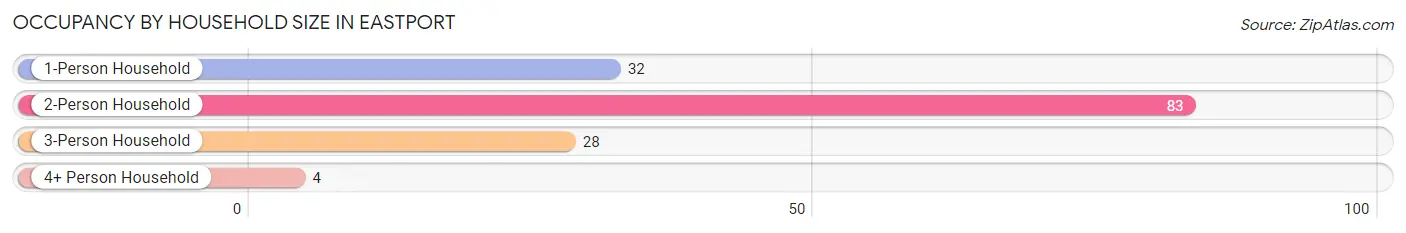
Occupancy by Household Size in Eastport
| Household Size | # Housing Units | % Housing Units |
| 1-Person Household | 32 | 21.8% |
| 2-Person Household | 83 | 56.5% |
| 3-Person Household | 28 | 19.1% |
| 4+ Person Household | 4 | 2.7% |
| Total Housing Units | 147 | 100.0% |
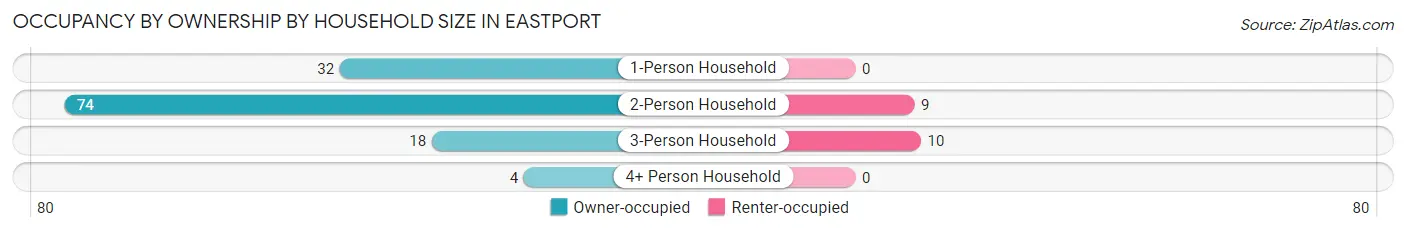
Occupancy by Ownership by Household Size in Eastport
| Household Size | Owner-occupied | Renter-occupied |
| 1-Person Household | 32 (100.0%) | 0 (0.0%) |
| 2-Person Household | 74 (89.2%) | 9 (10.8%) |
| 3-Person Household | 18 (64.3%) | 10 (35.7%) |
| 4+ Person Household | 4 (100.0%) | 0 (0.0%) |
| Total Housing Units | 128 (87.1%) | 19 (12.9%) |
Occupancy by Educational Attainment in Eastport
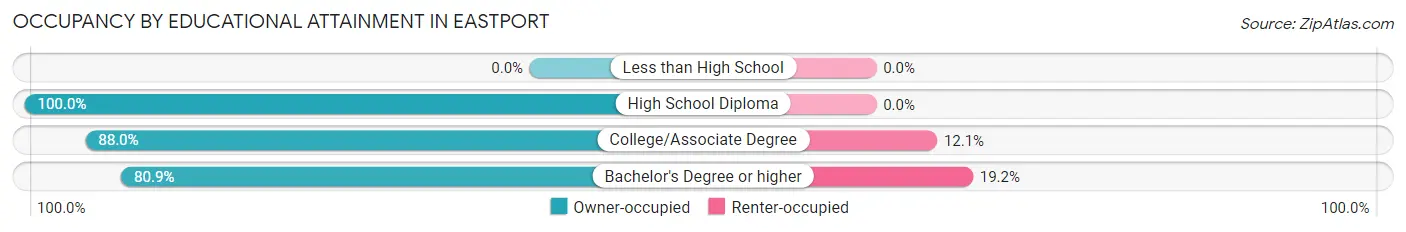
| Household Size | Owner-occupied | Renter-occupied |
| Less than High School | 0 (0.0%) | 0 (0.0%) |
| High School Diploma | 17 (100.0%) | 0 (0.0%) |
| College/Associate Degree | 73 (87.9%) | 10 (12.0%) |
| Bachelor's Degree or higher | 38 (80.8%) | 9 (19.2%) |
Occupancy by Age of Householder in Eastport
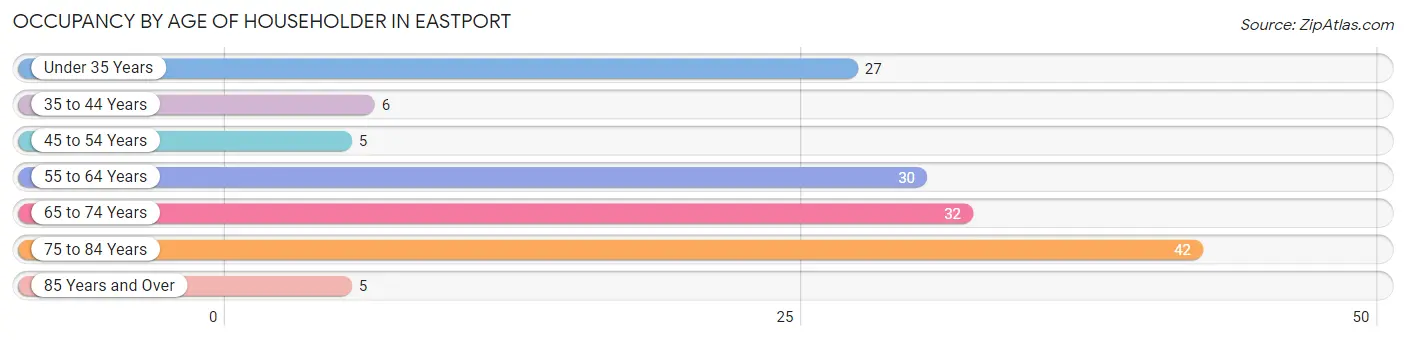
| Age Bracket | # Households | % Households |
| Under 35 Years | 27 | 18.4% |
| 35 to 44 Years | 6 | 4.1% |
| 45 to 54 Years | 5 | 3.4% |
| 55 to 64 Years | 30 | 20.4% |
| 65 to 74 Years | 32 | 21.8% |
| 75 to 84 Years | 42 | 28.6% |
| 85 Years and Over | 5 | 3.4% |
| Total | 147 | 100.0% |
Housing Finances in Eastport
Median Income by Occupancy in Eastport
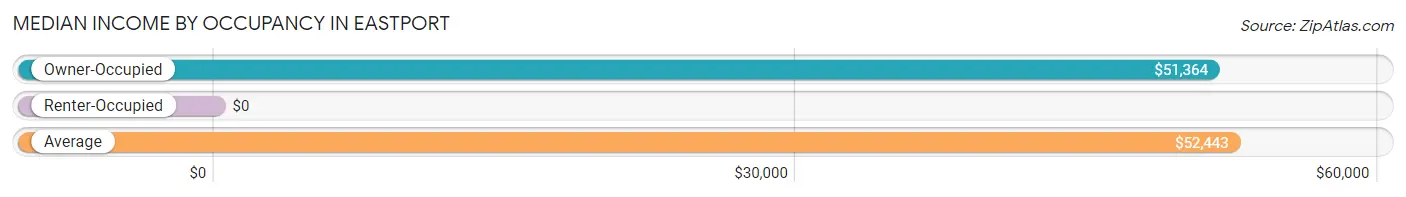
| Occupancy Type | # Households | Median Income |
| Owner-Occupied | 128 (87.1%) | $51,364 |
| Renter-Occupied | 19 (12.9%) | $0 |
| Average | 147 (100.0%) | $52,443 |
Occupancy by Householder Income Bracket in Eastport
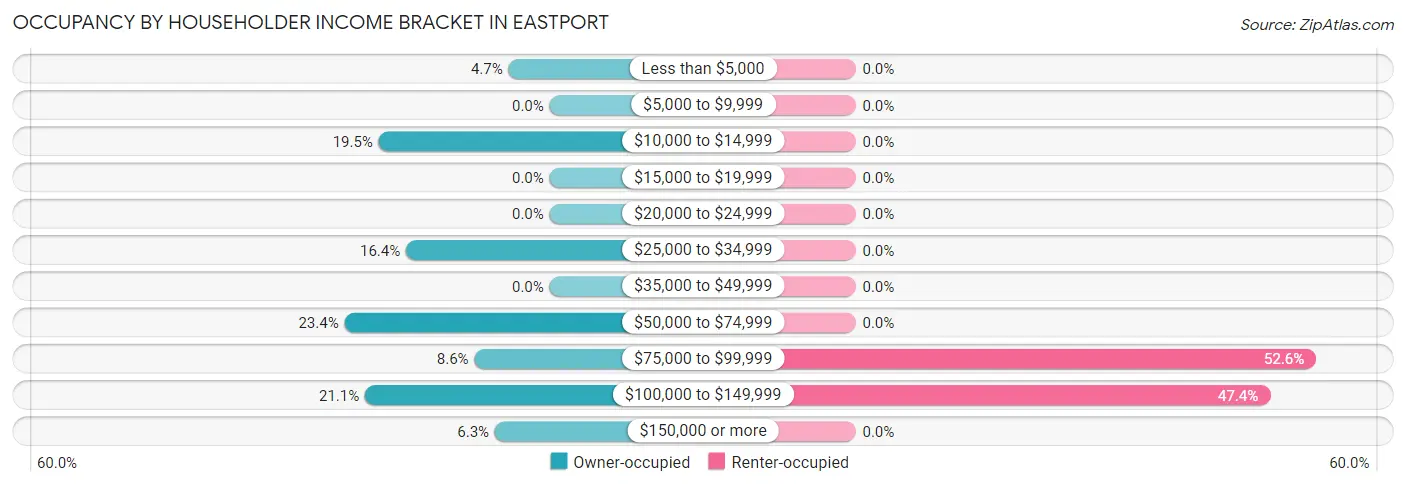
| Income Bracket | Owner-occupied | Renter-occupied |
| Less than $5,000 | 6 (4.7%) | 0 (0.0%) |
| $5,000 to $9,999 | 0 (0.0%) | 0 (0.0%) |
| $10,000 to $14,999 | 25 (19.5%) | 0 (0.0%) |
| $15,000 to $19,999 | 0 (0.0%) | 0 (0.0%) |
| $20,000 to $24,999 | 0 (0.0%) | 0 (0.0%) |
| $25,000 to $34,999 | 21 (16.4%) | 0 (0.0%) |
| $35,000 to $49,999 | 0 (0.0%) | 0 (0.0%) |
| $50,000 to $74,999 | 30 (23.4%) | 0 (0.0%) |
| $75,000 to $99,999 | 11 (8.6%) | 10 (52.6%) |
| $100,000 to $149,999 | 27 (21.1%) | 9 (47.4%) |
| $150,000 or more | 8 (6.2%) | 0 (0.0%) |
| Total | 128 (100.0%) | 19 (100.0%) |
Monthly Housing Cost Tiers in Eastport
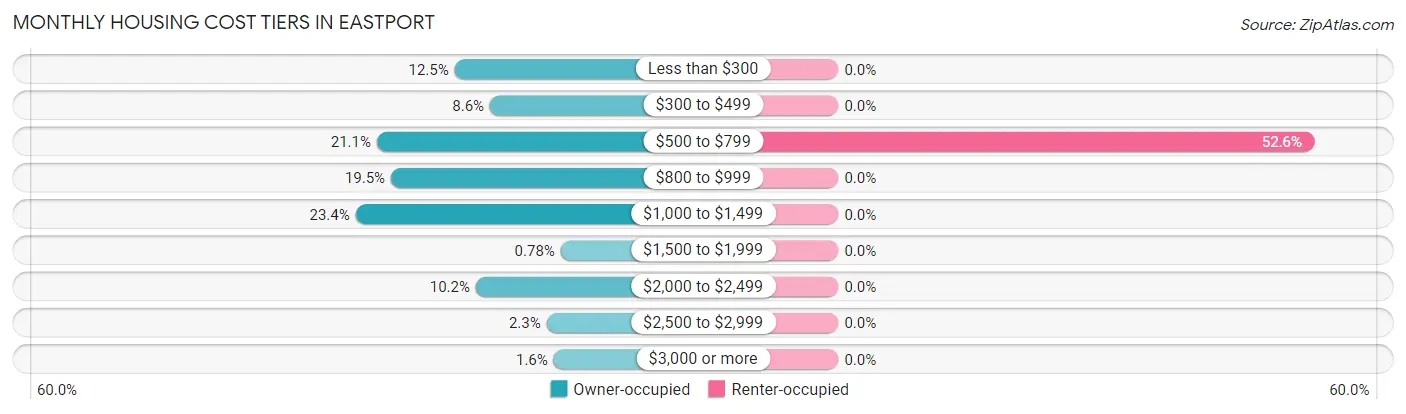
| Monthly Cost | Owner-occupied | Renter-occupied |
| Less than $300 | 16 (12.5%) | 0 (0.0%) |
| $300 to $499 | 11 (8.6%) | 0 (0.0%) |
| $500 to $799 | 27 (21.1%) | 10 (52.6%) |
| $800 to $999 | 25 (19.5%) | 0 (0.0%) |
| $1,000 to $1,499 | 30 (23.4%) | 0 (0.0%) |
| $1,500 to $1,999 | 1 (0.8%) | 0 (0.0%) |
| $2,000 to $2,499 | 13 (10.2%) | 0 (0.0%) |
| $2,500 to $2,999 | 3 (2.3%) | 0 (0.0%) |
| $3,000 or more | 2 (1.6%) | 0 (0.0%) |
| Total | 128 (100.0%) | 19 (100.0%) |
Physical Housing Characteristics in Eastport
Housing Structures in Eastport
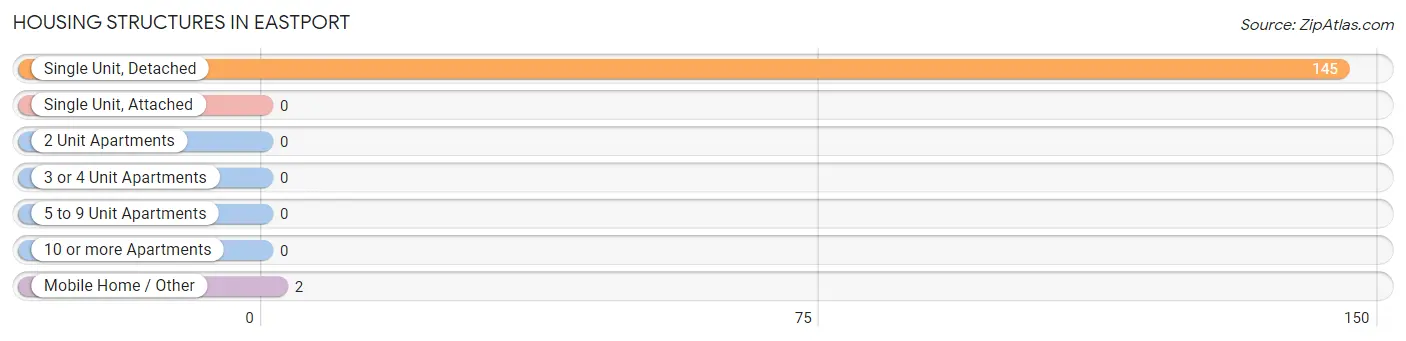
| Structure Type | # Housing Units | % Housing Units |
| Single Unit, Detached | 145 | 98.6% |
| Single Unit, Attached | 0 | 0.0% |
| 2 Unit Apartments | 0 | 0.0% |
| 3 or 4 Unit Apartments | 0 | 0.0% |
| 5 to 9 Unit Apartments | 0 | 0.0% |
| 10 or more Apartments | 0 | 0.0% |
| Mobile Home / Other | 2 | 1.4% |
| Total | 147 | 100.0% |
Housing Structures by Occupancy in Eastport
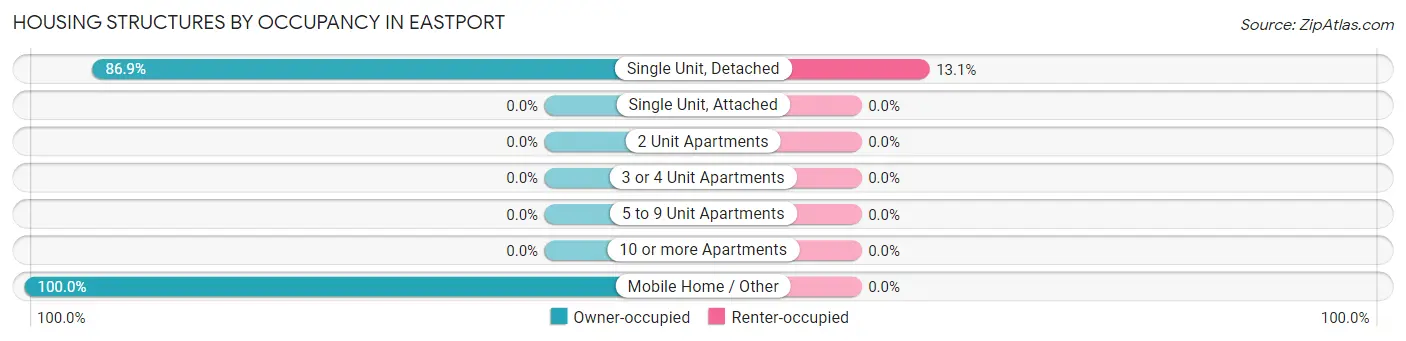
| Structure Type | Owner-occupied | Renter-occupied |
| Single Unit, Detached | 126 (86.9%) | 19 (13.1%) |
| Single Unit, Attached | 0 (0.0%) | 0 (0.0%) |
| 2 Unit Apartments | 0 (0.0%) | 0 (0.0%) |
| 3 or 4 Unit Apartments | 0 (0.0%) | 0 (0.0%) |
| 5 to 9 Unit Apartments | 0 (0.0%) | 0 (0.0%) |
| 10 or more Apartments | 0 (0.0%) | 0 (0.0%) |
| Mobile Home / Other | 2 (100.0%) | 0 (0.0%) |
| Total | 128 (87.1%) | 19 (12.9%) |
Housing Structures by Number of Rooms in Eastport
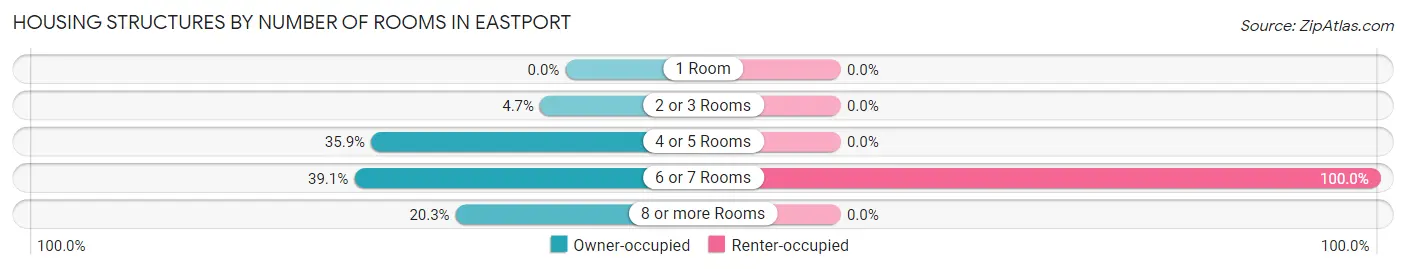
| Number of Rooms | Owner-occupied | Renter-occupied |
| 1 Room | 0 (0.0%) | 0 (0.0%) |
| 2 or 3 Rooms | 6 (4.7%) | 0 (0.0%) |
| 4 or 5 Rooms | 46 (35.9%) | 0 (0.0%) |
| 6 or 7 Rooms | 50 (39.1%) | 19 (100.0%) |
| 8 or more Rooms | 26 (20.3%) | 0 (0.0%) |
| Total | 128 (100.0%) | 19 (100.0%) |
Housing Structure by Heating Type in Eastport
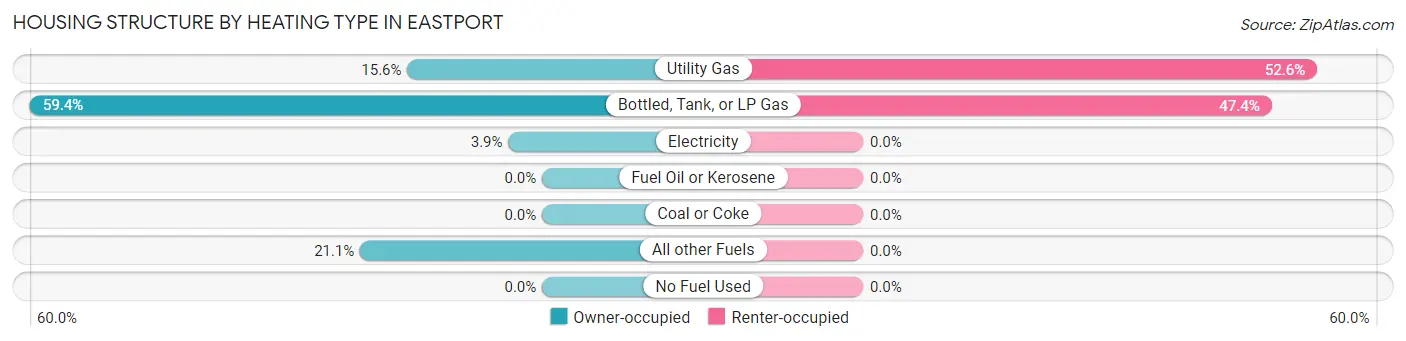
| Heating Type | Owner-occupied | Renter-occupied |
| Utility Gas | 20 (15.6%) | 10 (52.6%) |
| Bottled, Tank, or LP Gas | 76 (59.4%) | 9 (47.4%) |
| Electricity | 5 (3.9%) | 0 (0.0%) |
| Fuel Oil or Kerosene | 0 (0.0%) | 0 (0.0%) |
| Coal or Coke | 0 (0.0%) | 0 (0.0%) |
| All other Fuels | 27 (21.1%) | 0 (0.0%) |
| No Fuel Used | 0 (0.0%) | 0 (0.0%) |
| Total | 128 (100.0%) | 19 (100.0%) |
Household Vehicle Usage in Eastport
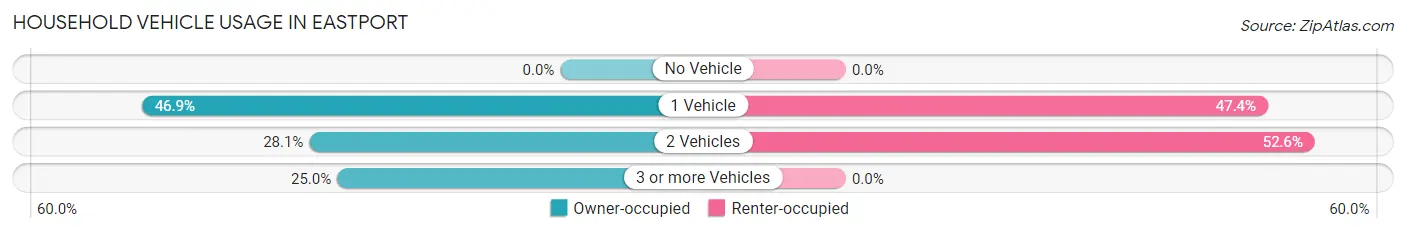
| Vehicles per Household | Owner-occupied | Renter-occupied |
| No Vehicle | 0 (0.0%) | 0 (0.0%) |
| 1 Vehicle | 60 (46.9%) | 9 (47.4%) |
| 2 Vehicles | 36 (28.1%) | 10 (52.6%) |
| 3 or more Vehicles | 32 (25.0%) | 0 (0.0%) |
| Total | 128 (100.0%) | 19 (100.0%) |
Real Estate & Mortgages in Eastport
Real Estate and Mortgage Overview in Eastport
| Characteristic | Without Mortgage | With Mortgage |
| Housing Units | 73 | 55 |
| Median Property Value | $611,400 | $198,800 |
| Median Household Income | - | - |
| Monthly Housing Costs | $563 | $2 |
| Real Estate Taxes | $3,500 | $0 |
Property Value by Mortgage Status in Eastport
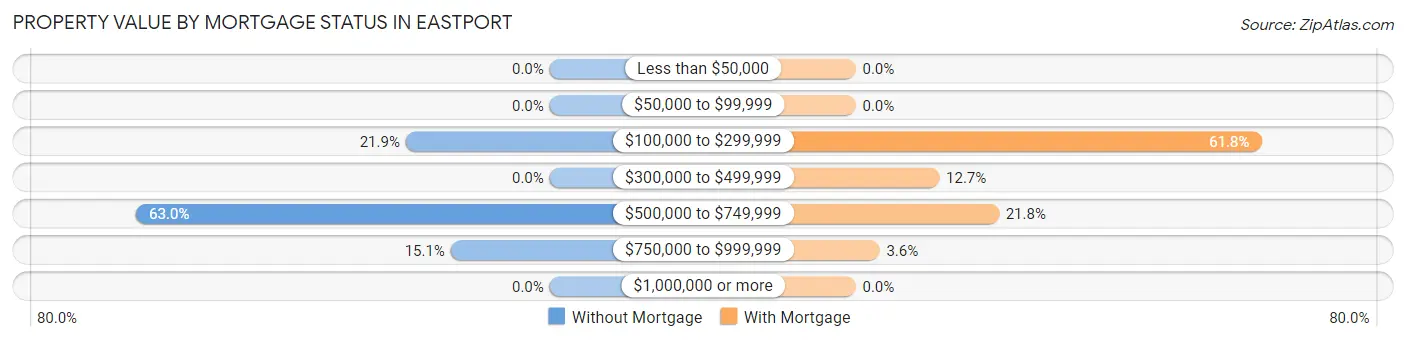
| Property Value | Without Mortgage | With Mortgage |
| Less than $50,000 | 0 (0.0%) | 0 (0.0%) |
| $50,000 to $99,999 | 0 (0.0%) | 0 (0.0%) |
| $100,000 to $299,999 | 16 (21.9%) | 34 (61.8%) |
| $300,000 to $499,999 | 0 (0.0%) | 7 (12.7%) |
| $500,000 to $749,999 | 46 (63.0%) | 12 (21.8%) |
| $750,000 to $999,999 | 11 (15.1%) | 2 (3.6%) |
| $1,000,000 or more | 0 (0.0%) | 0 (0.0%) |
| Total | 73 (100.0%) | 55 (100.0%) |
Household Income by Mortgage Status in Eastport
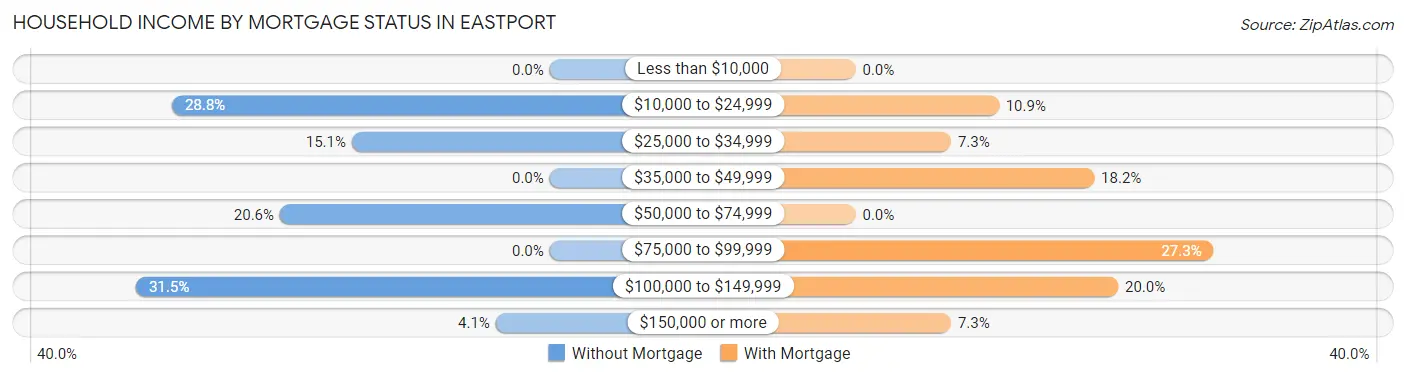
| Household Income | Without Mortgage | With Mortgage |
| Less than $10,000 | 0 (0.0%) | 0 (0.0%) |
| $10,000 to $24,999 | 21 (28.8%) | 6 (10.9%) |
| $25,000 to $34,999 | 11 (15.1%) | 4 (7.3%) |
| $35,000 to $49,999 | 0 (0.0%) | 10 (18.2%) |
| $50,000 to $74,999 | 15 (20.5%) | 0 (0.0%) |
| $75,000 to $99,999 | 0 (0.0%) | 15 (27.3%) |
| $100,000 to $149,999 | 23 (31.5%) | 11 (20.0%) |
| $150,000 or more | 3 (4.1%) | 4 (7.3%) |
| Total | 73 (100.0%) | 55 (100.0%) |
Property Value to Household Income Ratio in Eastport
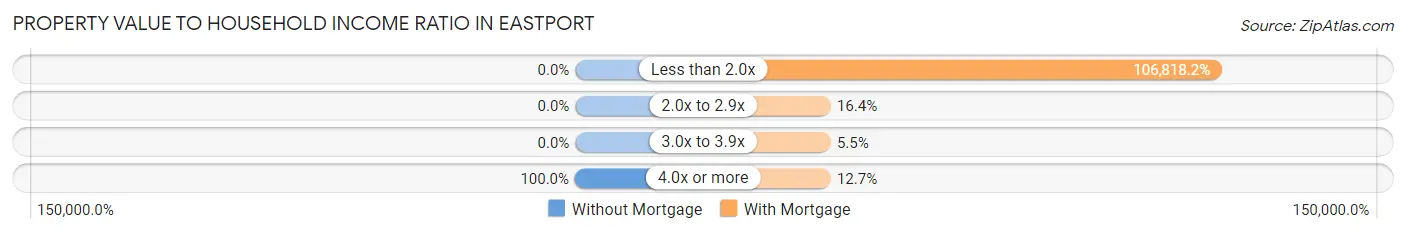
| Value-to-Income Ratio | Without Mortgage | With Mortgage |
| Less than 2.0x | 0 (0.0%) | 58,750 (106,818.2%) |
| 2.0x to 2.9x | 0 (0.0%) | 9 (16.4%) |
| 3.0x to 3.9x | 0 (0.0%) | 3 (5.4%) |
| 4.0x or more | 73 (100.0%) | 7 (12.7%) |
| Total | 73 (100.0%) | 55 (100.0%) |
Real Estate Taxes by Mortgage Status in Eastport
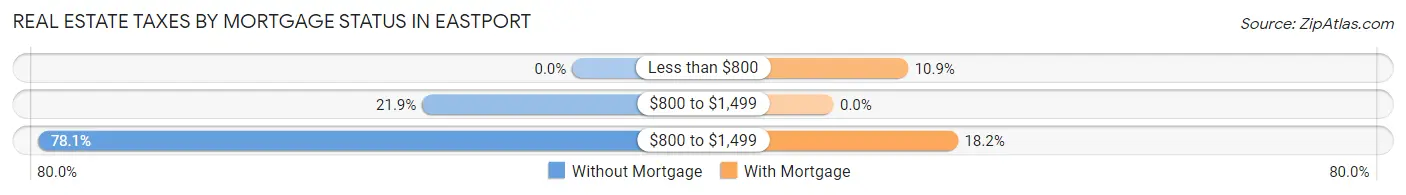
| Property Taxes | Without Mortgage | With Mortgage |
| Less than $800 | 0 (0.0%) | 6 (10.9%) |
| $800 to $1,499 | 16 (21.9%) | 0 (0.0%) |
| $800 to $1,499 | 57 (78.1%) | 10 (18.2%) |
| Total | 73 (100.0%) | 55 (100.0%) |
Health & Disability in Eastport
Health Insurance Coverage by Age in Eastport
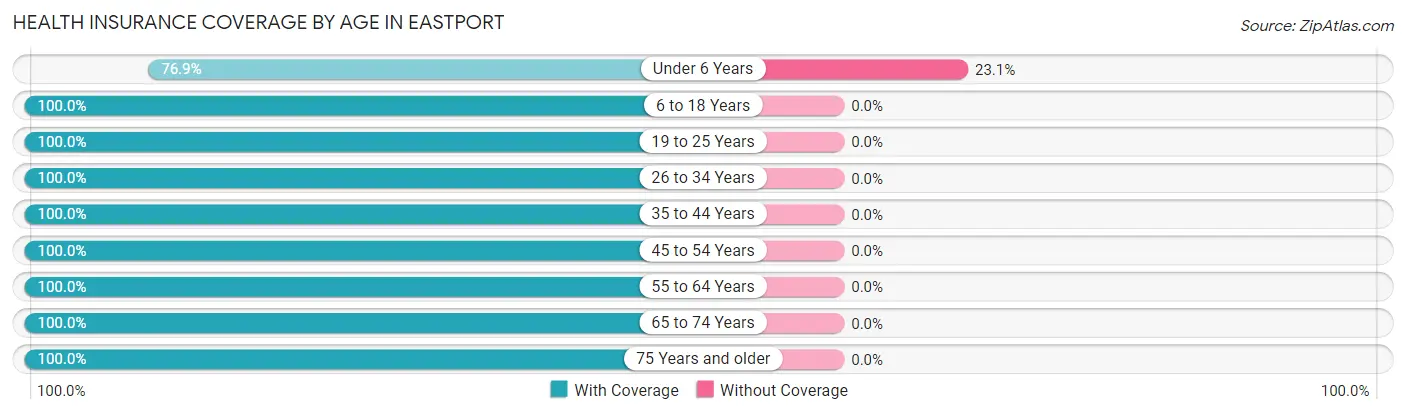
| Age Bracket | With Coverage | Without Coverage |
| Under 6 Years | 10 (76.9%) | 3 (23.1%) |
| 6 to 18 Years | 13 (100.0%) | 0 (0.0%) |
| 19 to 25 Years | 19 (100.0%) | 0 (0.0%) |
| 26 to 34 Years | 40 (100.0%) | 0 (0.0%) |
| 35 to 44 Years | 19 (100.0%) | 0 (0.0%) |
| 45 to 54 Years | 10 (100.0%) | 0 (0.0%) |
| 55 to 64 Years | 41 (100.0%) | 0 (0.0%) |
| 65 to 74 Years | 137 (100.0%) | 0 (0.0%) |
| 75 Years and older | 59 (100.0%) | 0 (0.0%) |
| Total | 348 (99.2%) | 3 (0.9%) |
Health Insurance Coverage by Citizenship Status in Eastport
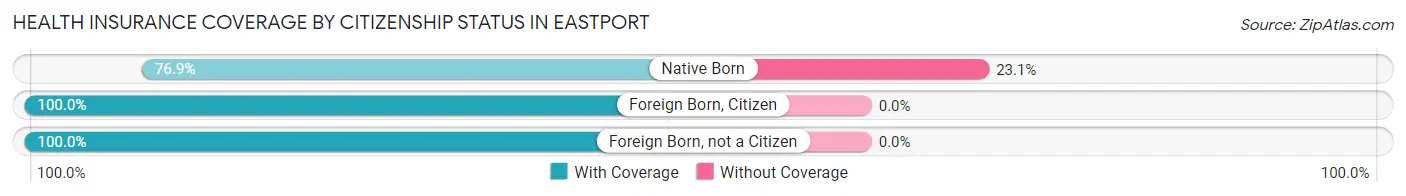
| Citizenship Status | With Coverage | Without Coverage |
| Native Born | 10 (76.9%) | 3 (23.1%) |
| Foreign Born, Citizen | 13 (100.0%) | 0 (0.0%) |
| Foreign Born, not a Citizen | 19 (100.0%) | 0 (0.0%) |
Health Insurance Coverage by Household Income in Eastport
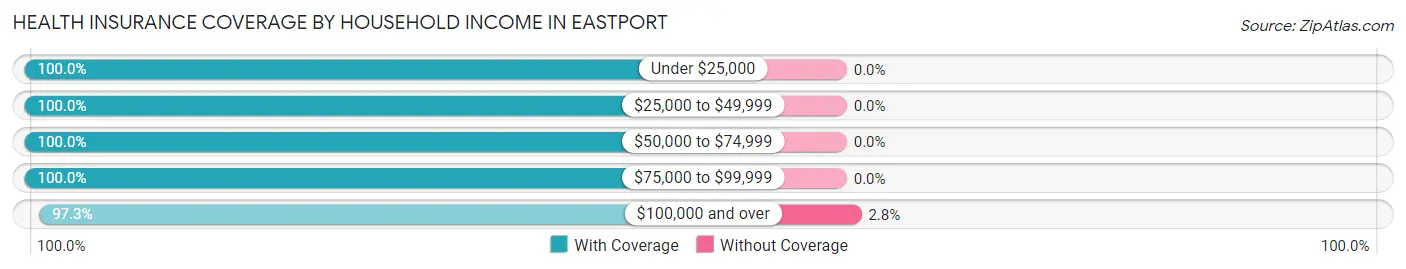
| Household Income | With Coverage | Without Coverage |
| Under $25,000 | 48 (100.0%) | 0 (0.0%) |
| $25,000 to $49,999 | 42 (100.0%) | 0 (0.0%) |
| $50,000 to $74,999 | 105 (100.0%) | 0 (0.0%) |
| $75,000 to $99,999 | 47 (100.0%) | 0 (0.0%) |
| $100,000 and over | 106 (97.3%) | 3 (2.8%) |
Public vs Private Health Insurance Coverage by Age in Eastport
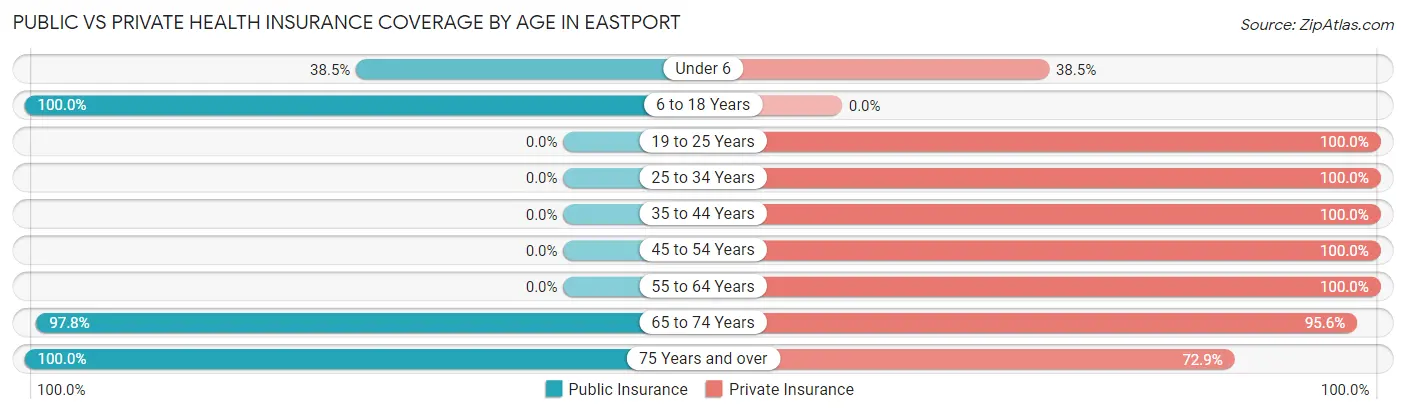
| Age Bracket | Public Insurance | Private Insurance |
| Under 6 | 5 (38.5%) | 5 (38.5%) |
| 6 to 18 Years | 13 (100.0%) | 0 (0.0%) |
| 19 to 25 Years | 0 (0.0%) | 19 (100.0%) |
| 25 to 34 Years | 0 (0.0%) | 40 (100.0%) |
| 35 to 44 Years | 0 (0.0%) | 19 (100.0%) |
| 45 to 54 Years | 0 (0.0%) | 10 (100.0%) |
| 55 to 64 Years | 0 (0.0%) | 41 (100.0%) |
| 65 to 74 Years | 134 (97.8%) | 131 (95.6%) |
| 75 Years and over | 59 (100.0%) | 43 (72.9%) |
| Total | 211 (60.1%) | 308 (87.7%) |
Disability Status by Sex by Age in Eastport
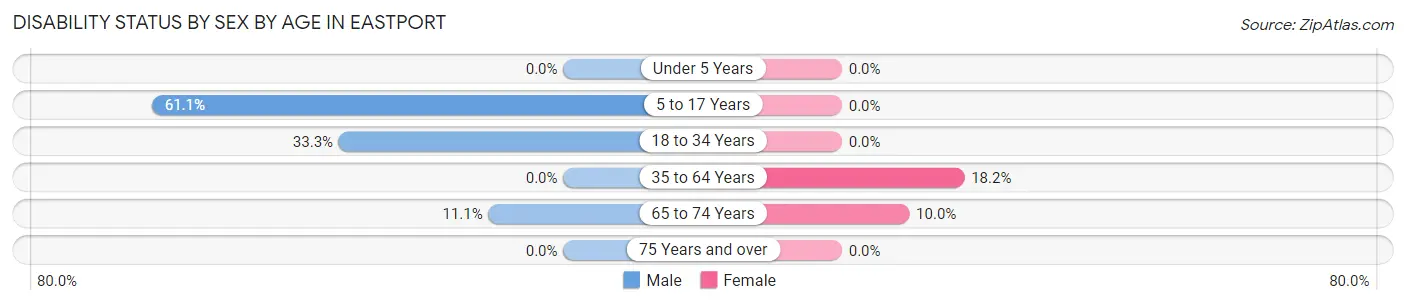
| Age Bracket | Male | Female |
| Under 5 Years | 0 (0.0%) | 0 (0.0%) |
| 5 to 17 Years | 11 (61.1%) | 0 (0.0%) |
| 18 to 34 Years | 9 (33.3%) | 0 (0.0%) |
| 35 to 64 Years | 0 (0.0%) | 6 (18.2%) |
| 65 to 74 Years | 3 (11.1%) | 11 (10.0%) |
| 75 Years and over | 0 (0.0%) | 0 (0.0%) |
Disability Class by Sex by Age in Eastport
Disability Class: Hearing Difficulty
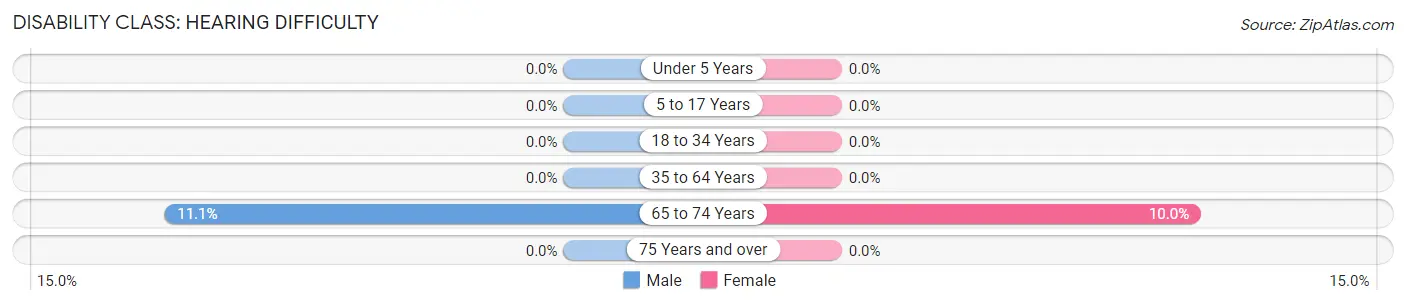
| Age Bracket | Male | Female |
| Under 5 Years | 0 (0.0%) | 0 (0.0%) |
| 5 to 17 Years | 0 (0.0%) | 0 (0.0%) |
| 18 to 34 Years | 0 (0.0%) | 0 (0.0%) |
| 35 to 64 Years | 0 (0.0%) | 0 (0.0%) |
| 65 to 74 Years | 3 (11.1%) | 11 (10.0%) |
| 75 Years and over | 0 (0.0%) | 0 (0.0%) |
Disability Class: Vision Difficulty
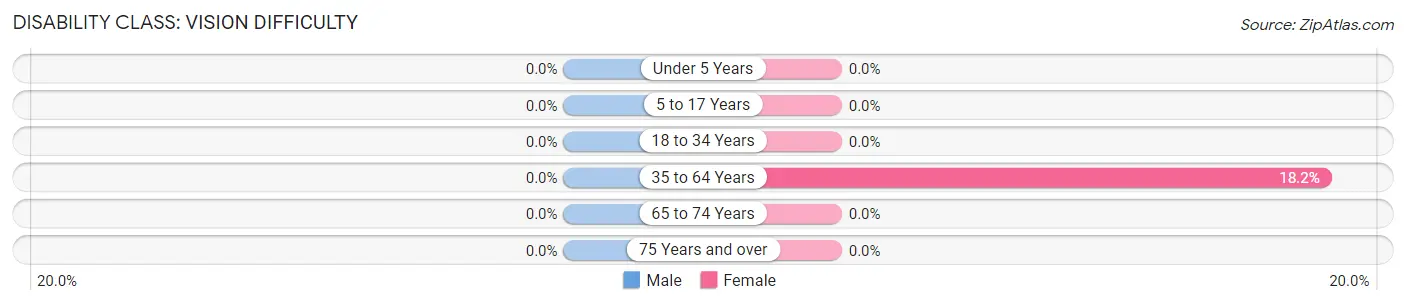
| Age Bracket | Male | Female |
| Under 5 Years | 0 (0.0%) | 0 (0.0%) |
| 5 to 17 Years | 0 (0.0%) | 0 (0.0%) |
| 18 to 34 Years | 0 (0.0%) | 0 (0.0%) |
| 35 to 64 Years | 0 (0.0%) | 6 (18.2%) |
| 65 to 74 Years | 0 (0.0%) | 0 (0.0%) |
| 75 Years and over | 0 (0.0%) | 0 (0.0%) |
Disability Class: Cognitive Difficulty
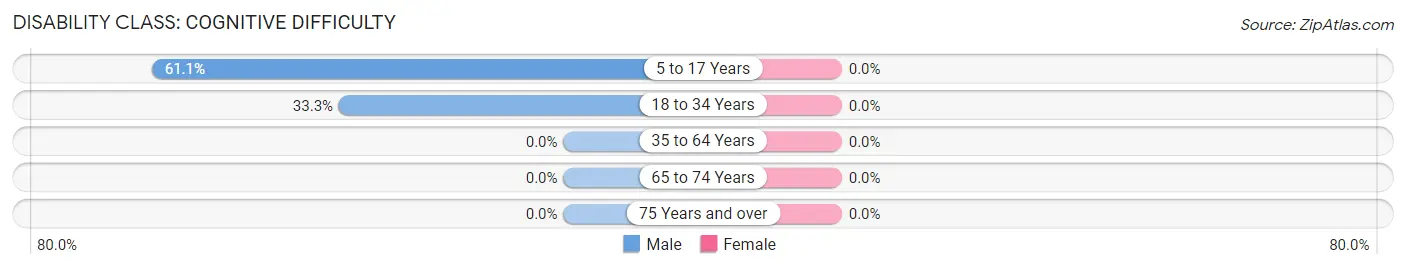
| Age Bracket | Male | Female |
| 5 to 17 Years | 11 (61.1%) | 0 (0.0%) |
| 18 to 34 Years | 9 (33.3%) | 0 (0.0%) |
| 35 to 64 Years | 0 (0.0%) | 0 (0.0%) |
| 65 to 74 Years | 0 (0.0%) | 0 (0.0%) |
| 75 Years and over | 0 (0.0%) | 0 (0.0%) |
Disability Class: Ambulatory Difficulty
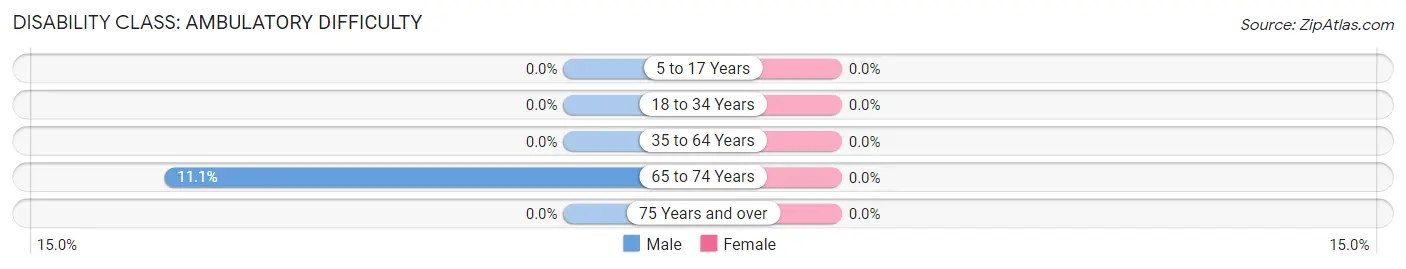
| Age Bracket | Male | Female |
| 5 to 17 Years | 0 (0.0%) | 0 (0.0%) |
| 18 to 34 Years | 0 (0.0%) | 0 (0.0%) |
| 35 to 64 Years | 0 (0.0%) | 0 (0.0%) |
| 65 to 74 Years | 3 (11.1%) | 0 (0.0%) |
| 75 Years and over | 0 (0.0%) | 0 (0.0%) |
Disability Class: Self-Care Difficulty
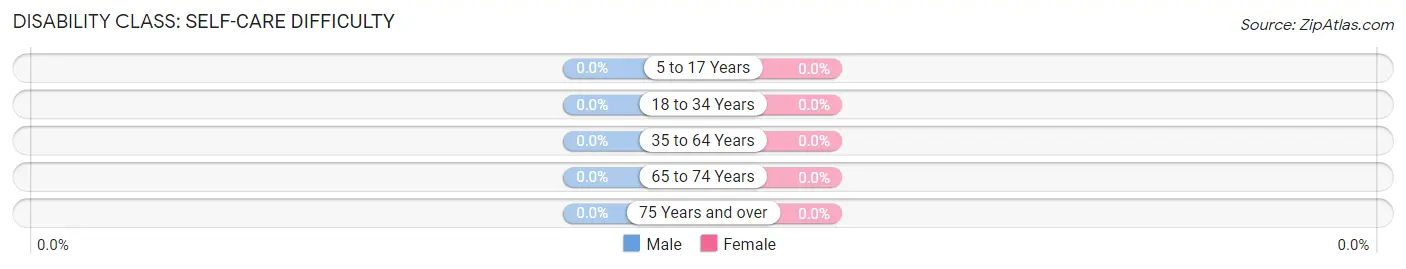
| Age Bracket | Male | Female |
| 5 to 17 Years | 0 (0.0%) | 0 (0.0%) |
| 18 to 34 Years | 0 (0.0%) | 0 (0.0%) |
| 35 to 64 Years | 0 (0.0%) | 0 (0.0%) |
| 65 to 74 Years | 0 (0.0%) | 0 (0.0%) |
| 75 Years and over | 0 (0.0%) | 0 (0.0%) |
Technology Access in Eastport
Computing Device Access in Eastport
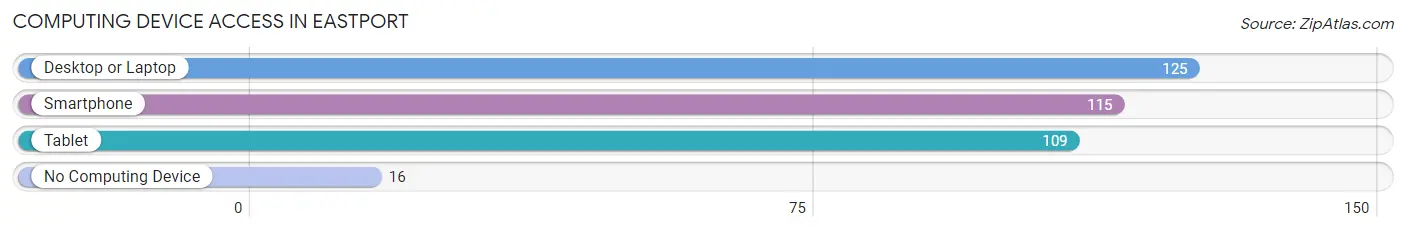
| Device Type | # Households | % Households |
| Desktop or Laptop | 125 | 85.0% |
| Smartphone | 115 | 78.2% |
| Tablet | 109 | 74.2% |
| No Computing Device | 16 | 10.9% |
| Total | 147 | 100.0% |
Internet Access in Eastport
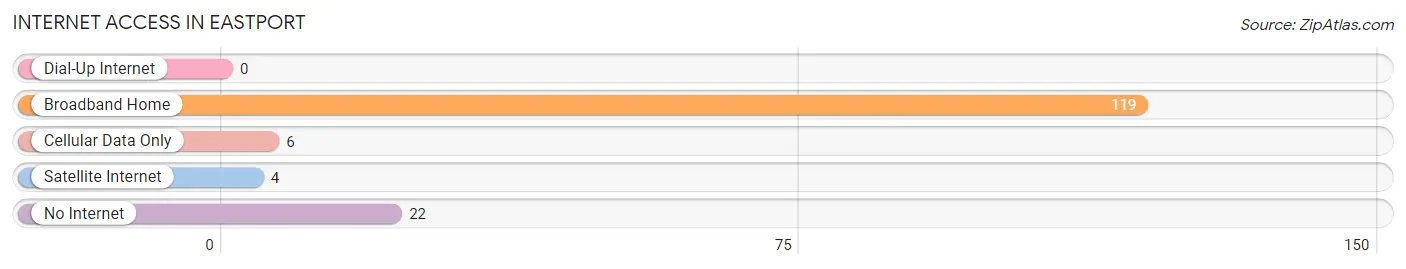
| Internet Type | # Households | % Households |
| Dial-Up Internet | 0 | 0.0% |
| Broadband Home | 119 | 80.9% |
| Cellular Data Only | 6 | 4.1% |
| Satellite Internet | 4 | 2.7% |
| No Internet | 22 | 15.0% |
| Total | 147 | 100.0% |
Eastport Summary
Eastport is a small unincorporated community located in the northeast corner of Michigan’s Lower Peninsula. It is situated on the shores of Lake Huron, just south of the Mackinac Bridge. The community is part of Cheboygan County and is home to approximately 500 people.
History
Eastport was first settled in the early 1800s by French-Canadian fur traders. The area was known as “L’Anse aux Pins”, which translates to “Pine Bay”. The first permanent settlers arrived in 1836 and the community was officially established in 1845. The town was named after the Eastport Lighthouse, which was built in 1848.
The town grew slowly over the years, but it was not until the completion of the Mackinac Bridge in 1957 that Eastport began to experience significant growth. The bridge connected the Upper and Lower Peninsulas of Michigan, making Eastport a popular destination for tourists.
Geography
Eastport is located in the northeast corner of Michigan’s Lower Peninsula. It is situated on the shores of Lake Huron, just south of the Mackinac Bridge. The community is part of Cheboygan County and is home to approximately 500 people.
The town is surrounded by lush forests and rolling hills. The nearby Cheboygan River provides ample opportunities for fishing, boating, and other outdoor activities. The area is also home to several state parks, including the Cheboygan State Park and the Wilderness State Park.
Economy
Eastport’s economy is largely based on tourism. The town is a popular destination for visitors from all over the world, who come to enjoy the area’s natural beauty and outdoor activities. The town is also home to several small businesses, including restaurants, shops, and lodging.
The town is also home to several manufacturing companies, including a paper mill and a boat building company. These companies provide employment opportunities for many of the town’s residents.
Demographics
As of the 2010 census, Eastport had a population of 498 people. The racial makeup of the town was 97.2% White, 0.2% African American, 0.2% Native American, 0.4% Asian, 0.2% from other races, and 1.8% from two or more races. Hispanic or Latino of any race were 1.2% of the population.
The median household income in Eastport was $37,500, and the median family income was $45,000. The per capita income for the town was $19,000. About 11.2% of families and 14.2% of the population were below the poverty line, including 18.2% of those under age 18 and 8.3% of those age 65 or over.
Eastport is a small, rural community with a rich history and a bright future. The town is home to a diverse population and offers a variety of activities and attractions for visitors and residents alike. With its beautiful natural surroundings and strong economy, Eastport is an ideal place to live and work.
Common Questions
What is Per Capita Income in Eastport?
Per Capita income in Eastport is $37,974.
What is the Median Family Income in Eastport?
Median Family Income in Eastport is $80,078.
What is the Median Household income in Eastport?
Median Household Income in Eastport is $52,443.
What is Income or Wage Gap in Eastport?
Income or Wage Gap in Eastport is 31.6%.
Women in Eastport earn 68.4 cents for every dollar earned by a man.
What is Inequality or Gini Index in Eastport?
Inequality or Gini Index in Eastport is 0.48.
What is the Total Population of Eastport?
Total Population of Eastport is 351.
What is the Total Male Population of Eastport?
Total Male Population of Eastport is 141.
What is the Total Female Population of Eastport?
Total Female Population of Eastport is 210.
What is the Ratio of Males per 100 Females in Eastport?
There are 67.14 Males per 100 Females in Eastport.
What is the Ratio of Females per 100 Males in Eastport?
There are 148.94 Females per 100 Males in Eastport.
What is the Median Population Age in Eastport?
Median Population Age in Eastport is 66.7 Years.
What is the Average Family Size in Eastport
Average Family Size in Eastport is 2.8 People.
What is the Average Household Size in Eastport
Average Household Size in Eastport is 2.4 People.
How Large is the Labor Force in Eastport?
There are 118 People in the Labor Forcein in Eastport.
What is the Percentage of People in the Labor Force in Eastport?
36.3% of People are in the Labor Force in Eastport.
What is the Unemployment Rate in Eastport?
Unemployment Rate in Eastport is 10.2%.