Utica, MI Map & Demographics
Utica Map
Utica Overview
$35,842
PER CAPITA INCOME
$81,184
AVG FAMILY INCOME
$52,247
AVG HOUSEHOLD INCOME
30.2%
WAGE / INCOME GAP [ % ]
69.8¢/ $1
WAGE / INCOME GAP [ $ ]
0.40
INEQUALITY / GINI INDEX
5,195
TOTAL POPULATION
2,512
MALE POPULATION
2,683
FEMALE POPULATION
93.63
MALES / 100 FEMALES
106.81
FEMALES / 100 MALES
44.6
MEDIAN AGE
2.9
AVG FAMILY SIZE
2.0
AVG HOUSEHOLD SIZE
2,648
LABOR FORCE [ PEOPLE ]
58.8%
PERCENT IN LABOR FORCE
4.2%
UNEMPLOYMENT RATE
Utica Area Codes
Income in Utica
Income Overview in Utica
Per Capita Income in Utica is $35,842, while median incomes of families and households are $81,184 and $52,247 respectively.
| Characteristic | Number | Measure |
| Per Capita Income | 5,195 | $35,842 |
| Median Family Income | 1,124 | $81,184 |
| Mean Family Income | 1,124 | $94,529 |
| Median Household Income | 2,529 | $52,247 |
| Mean Household Income | 2,529 | $72,069 |
| Income Deficit | 1,124 | $0 |
| Wage / Income Gap (%) | 5,195 | 30.18% |
| Wage / Income Gap ($) | 5,195 | 69.82¢ per $1 |
| Gini / Inequality Index | 5,195 | 0.40 |
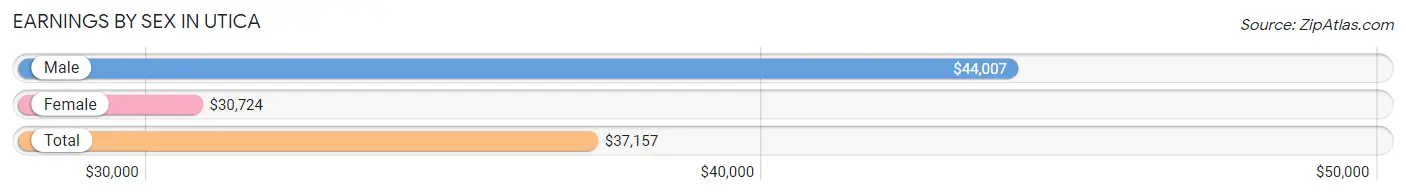
Earnings by Sex in Utica
Average Earnings in Utica are $37,157, $44,007 for men and $30,724 for women, a difference of 30.2%.
| Sex | Number | Average Earnings |
| Male | 1,477 (52.1%) | $44,007 |
| Female | 1,360 (47.9%) | $30,724 |
| Total | 2,837 (100.0%) | $37,157 |
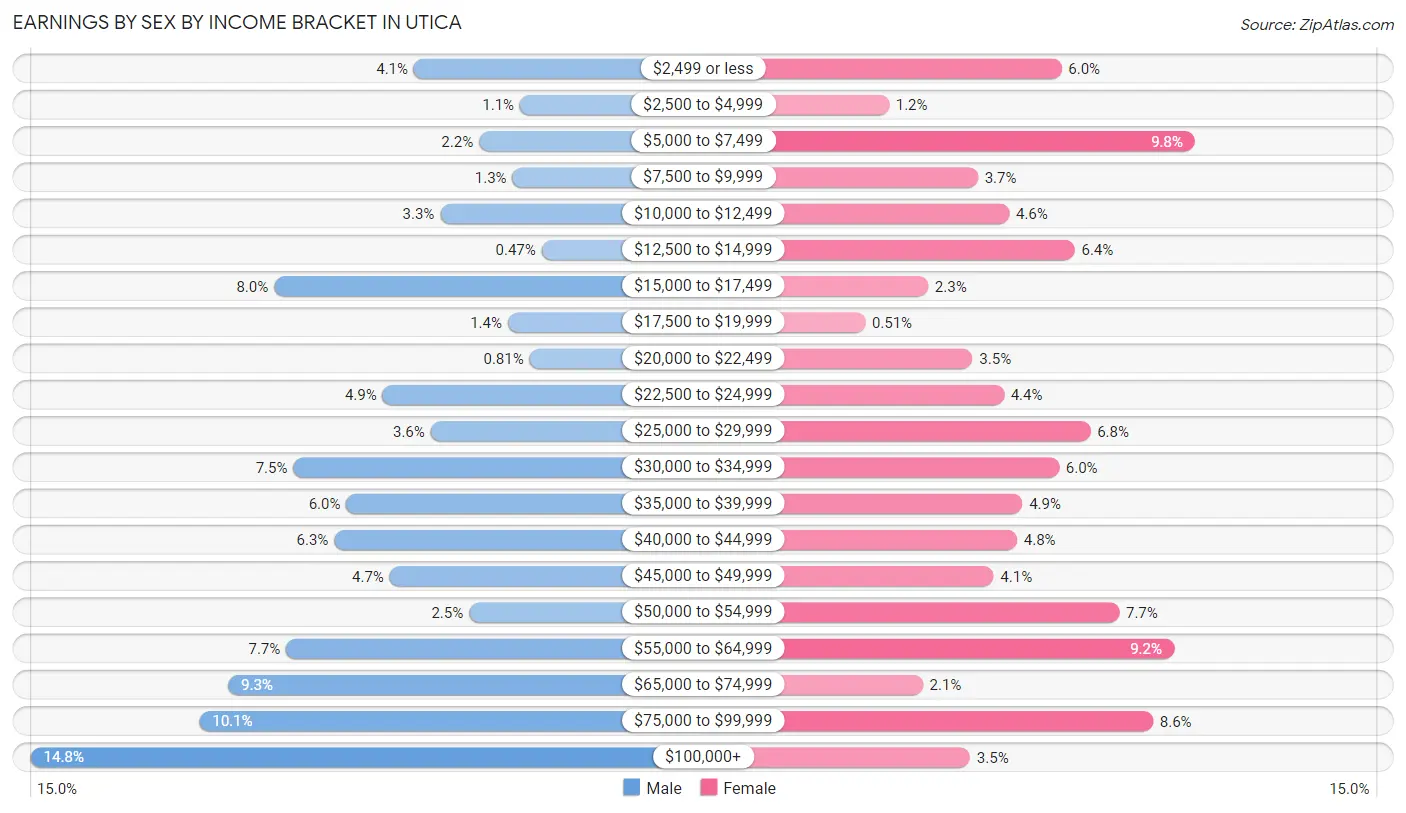
Earnings by Sex by Income Bracket in Utica
The most common earnings brackets in Utica are $100,000+ for men (219 | 14.8%) and $5,000 to $7,499 for women (133 | 9.8%).
| Income | Male | Female |
| $2,499 or less | 60 (4.1%) | 82 (6.0%) |
| $2,500 to $4,999 | 16 (1.1%) | 16 (1.2%) |
| $5,000 to $7,499 | 33 (2.2%) | 133 (9.8%) |
| $7,500 to $9,999 | 19 (1.3%) | 50 (3.7%) |
| $10,000 to $12,499 | 49 (3.3%) | 62 (4.6%) |
| $12,500 to $14,999 | 7 (0.5%) | 87 (6.4%) |
| $15,000 to $17,499 | 118 (8.0%) | 31 (2.3%) |
| $17,500 to $19,999 | 21 (1.4%) | 7 (0.5%) |
| $20,000 to $22,499 | 12 (0.8%) | 48 (3.5%) |
| $22,500 to $24,999 | 73 (4.9%) | 60 (4.4%) |
| $25,000 to $29,999 | 53 (3.6%) | 93 (6.8%) |
| $30,000 to $34,999 | 110 (7.4%) | 81 (6.0%) |
| $35,000 to $39,999 | 88 (6.0%) | 67 (4.9%) |
| $40,000 to $44,999 | 93 (6.3%) | 65 (4.8%) |
| $45,000 to $49,999 | 70 (4.7%) | 56 (4.1%) |
| $50,000 to $54,999 | 37 (2.5%) | 104 (7.6%) |
| $55,000 to $64,999 | 113 (7.6%) | 125 (9.2%) |
| $65,000 to $74,999 | 137 (9.3%) | 29 (2.1%) |
| $75,000 to $99,999 | 149 (10.1%) | 117 (8.6%) |
| $100,000+ | 219 (14.8%) | 47 (3.5%) |
| Total | 1,477 (100.0%) | 1,360 (100.0%) |
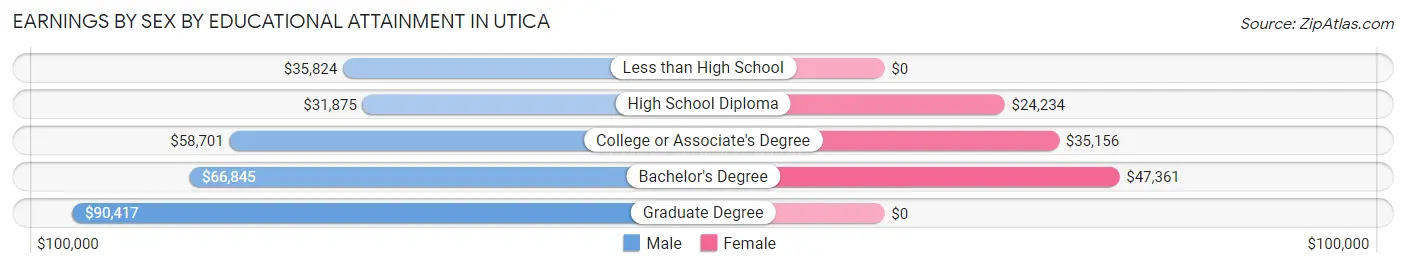
Earnings by Sex by Educational Attainment in Utica
Average earnings in Utica are $49,423 for men and $33,000 for women, a difference of 33.2%. Men with an educational attainment of graduate degree enjoy the highest average annual earnings of $90,417, while those with high school diploma education earn the least with $31,875. Women with an educational attainment of bachelor's degree earn the most with the average annual earnings of $47,361, while those with high school diploma education have the smallest earnings of $24,234.
| Educational Attainment | Male Income | Female Income |
| Less than High School | $35,824 | $0 |
| High School Diploma | $31,875 | $24,234 |
| College or Associate's Degree | $58,701 | $35,156 |
| Bachelor's Degree | $66,845 | $47,361 |
| Graduate Degree | $90,417 | $0 |
| Total | $49,423 | $33,000 |
Family Income in Utica
Family Income Brackets in Utica
According to the Utica family income data, there are 235 families falling into the $100,000 to $149,999 income range, which is the most common income bracket and makes up 20.9% of all families.
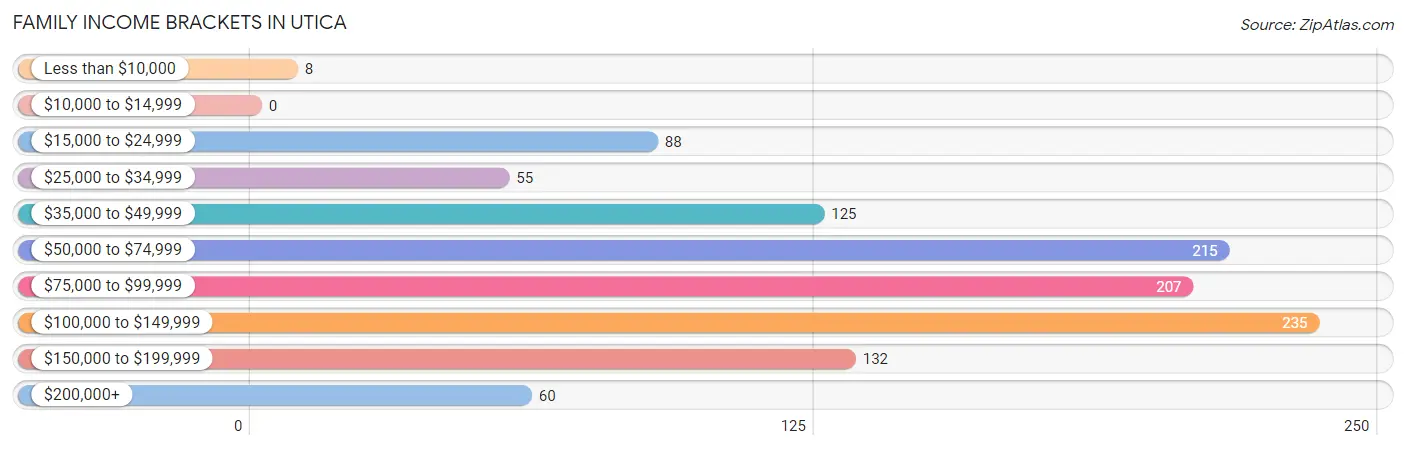
| Income Bracket | # Families | % Families |
| Less than $10,000 | 8 | 0.7% |
| $10,000 to $14,999 | 0 | 0.0% |
| $15,000 to $24,999 | 88 | 7.8% |
| $25,000 to $34,999 | 55 | 4.9% |
| $35,000 to $49,999 | 125 | 11.1% |
| $50,000 to $74,999 | 215 | 19.1% |
| $75,000 to $99,999 | 207 | 18.4% |
| $100,000 to $149,999 | 235 | 20.9% |
| $150,000 to $199,999 | 132 | 11.7% |
| $200,000+ | 60 | 5.3% |
Family Income by Famaliy Size in Utica
4-person families (188 | 16.7%) account for the highest median family income in Utica with $111,029 per family, while 2-person families (525 | 46.7%) have the highest median income of $36,656 per family member.
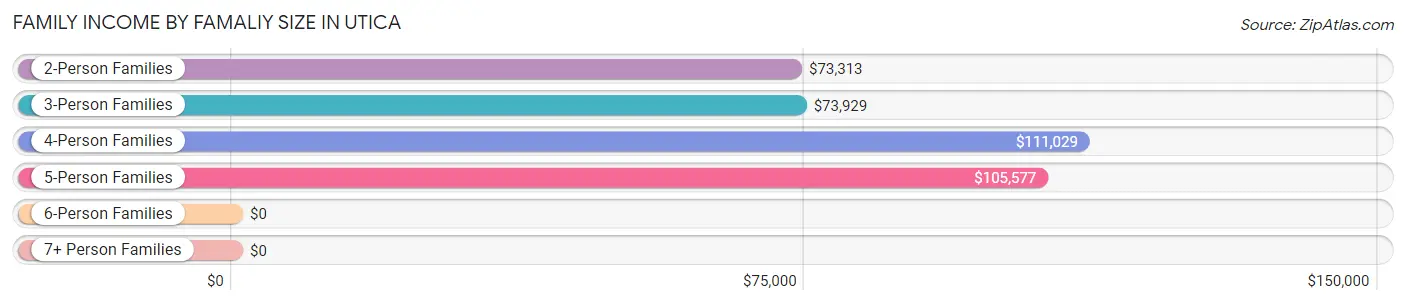
| Income Bracket | # Families | Median Income |
| 2-Person Families | 525 (46.7%) | $73,313 |
| 3-Person Families | 314 (27.9%) | $73,929 |
| 4-Person Families | 188 (16.7%) | $111,029 |
| 5-Person Families | 92 (8.2%) | $105,577 |
| 6-Person Families | 5 (0.4%) | $0 |
| 7+ Person Families | 0 (0.0%) | $0 |
| Total | 1,124 (100.0%) | $81,184 |
Family Income by Number of Earners in Utica
The median family income in Utica is $81,184, with families comprising 3+ earners (107) having the highest median family income of $105,288, while families with no earners (115) have the lowest median family income of $44,063, accounting for 9.5% and 10.2% of families, respectively.
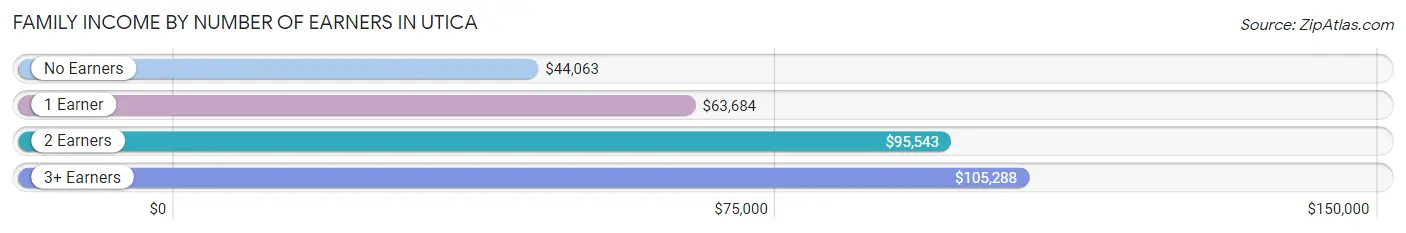
| Number of Earners | # Families | Median Income |
| No Earners | 115 (10.2%) | $44,063 |
| 1 Earner | 420 (37.4%) | $63,684 |
| 2 Earners | 482 (42.9%) | $95,543 |
| 3+ Earners | 107 (9.5%) | $105,288 |
| Total | 1,124 (100.0%) | $81,184 |
Household Income in Utica
Household Income Brackets in Utica
With 420 households falling in the category, the $50,000 to $74,999 income range is the most frequent in Utica, accounting for 16.6% of all households. In contrast, only 23 households (0.9%) fall into the less than $10,000 income bracket, making it the least populous group.
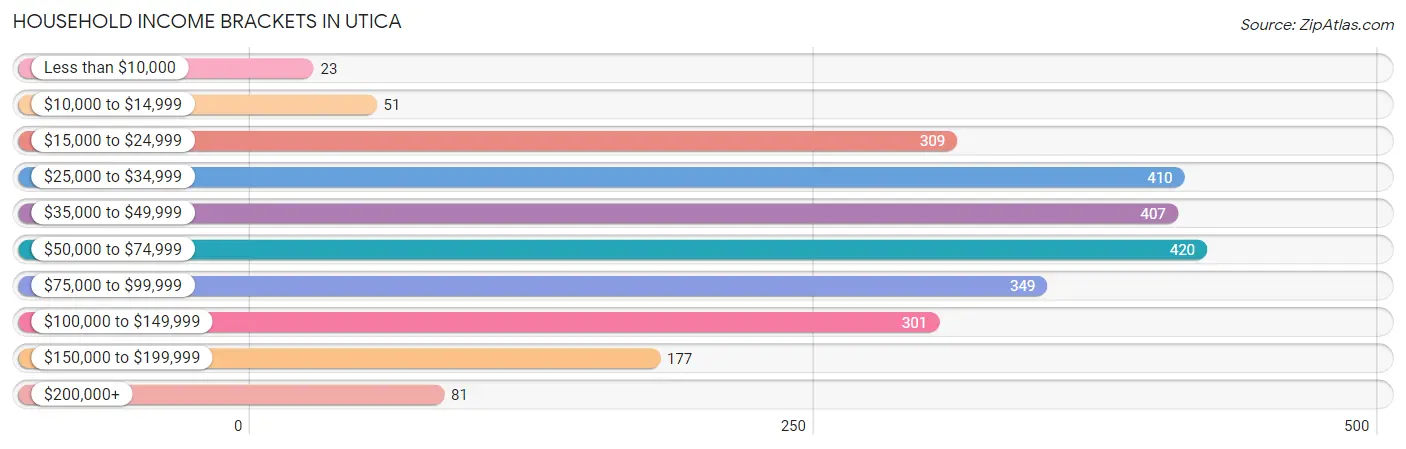
| Income Bracket | # Households | % Households |
| Less than $10,000 | 23 | 0.9% |
| $10,000 to $14,999 | 51 | 2.0% |
| $15,000 to $24,999 | 309 | 12.2% |
| $25,000 to $34,999 | 410 | 16.2% |
| $35,000 to $49,999 | 407 | 16.1% |
| $50,000 to $74,999 | 420 | 16.6% |
| $75,000 to $99,999 | 349 | 13.8% |
| $100,000 to $149,999 | 301 | 11.9% |
| $150,000 to $199,999 | 177 | 7.0% |
| $200,000+ | 81 | 3.2% |
Household Income by Householder Age in Utica
The median household income in Utica is $52,247, with the highest median household income of $78,636 found in the 25 to 44 years age bracket for the primary householder. A total of 736 households (29.1%) fall into this category. Meanwhile, the 15 to 24 years age bracket for the primary householder has the lowest median household income of $0, with 54 households (2.1%) in this group.
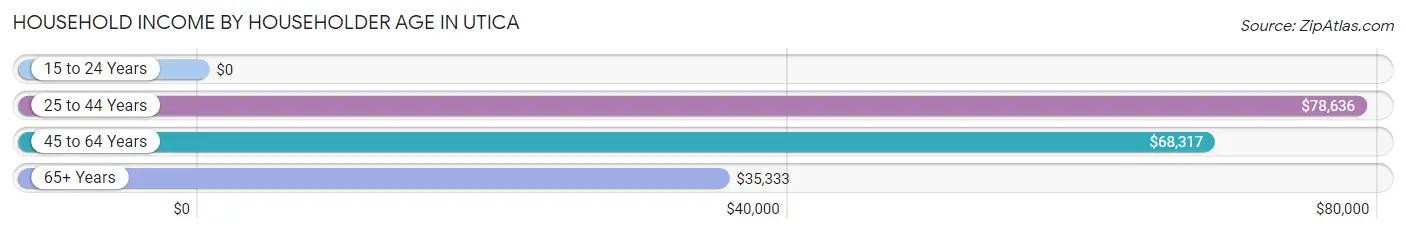
| Income Bracket | # Households | Median Income |
| 15 to 24 Years | 54 (2.1%) | $0 |
| 25 to 44 Years | 736 (29.1%) | $78,636 |
| 45 to 64 Years | 735 (29.1%) | $68,317 |
| 65+ Years | 1,004 (39.7%) | $35,333 |
| Total | 2,529 (100.0%) | $52,247 |
Poverty in Utica
Income Below Poverty by Sex and Age in Utica
With 6.4% poverty level for males and 9.2% for females among the residents of Utica, 18 to 24 year old males and 18 to 24 year old females are the most vulnerable to poverty, with 53 males (22.3%) and 34 females (23.8%) in their respective age groups living below the poverty level.
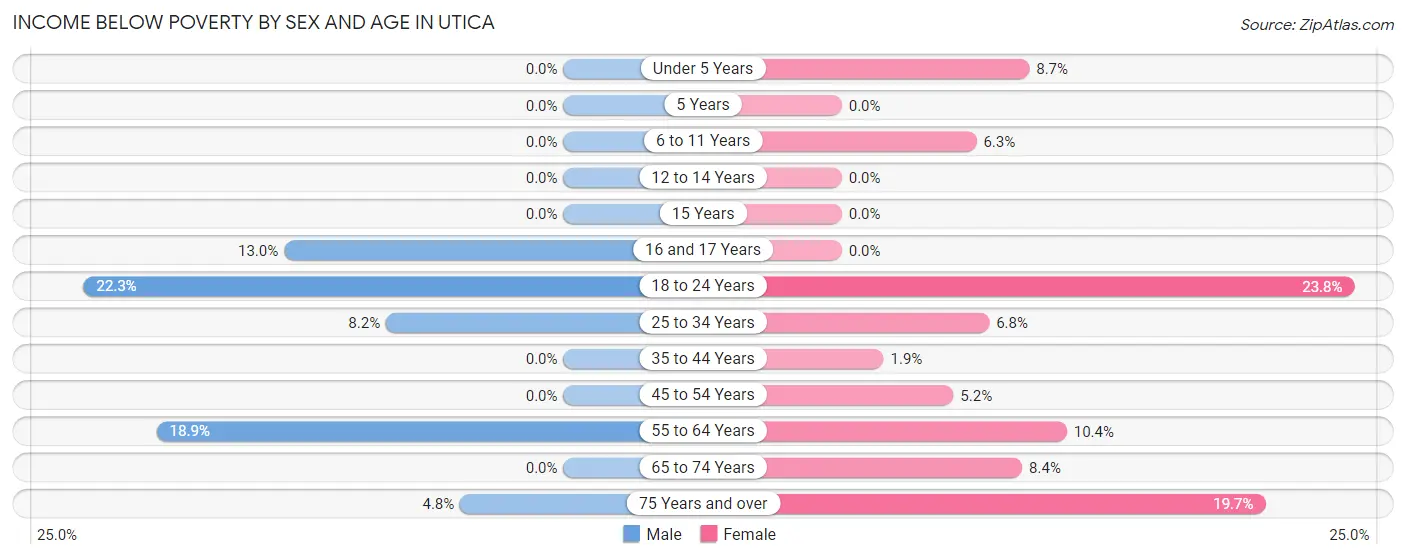
| Age Bracket | Male | Female |
| Under 5 Years | 0 (0.0%) | 14 (8.7%) |
| 5 Years | 0 (0.0%) | 0 (0.0%) |
| 6 to 11 Years | 0 (0.0%) | 7 (6.2%) |
| 12 to 14 Years | 0 (0.0%) | 0 (0.0%) |
| 15 Years | 0 (0.0%) | 0 (0.0%) |
| 16 and 17 Years | 7 (13.0%) | 0 (0.0%) |
| 18 to 24 Years | 53 (22.3%) | 34 (23.8%) |
| 25 to 34 Years | 33 (8.2%) | 21 (6.8%) |
| 35 to 44 Years | 0 (0.0%) | 7 (1.9%) |
| 45 to 54 Years | 0 (0.0%) | 13 (5.2%) |
| 55 to 64 Years | 57 (18.9%) | 40 (10.4%) |
| 65 to 74 Years | 0 (0.0%) | 39 (8.4%) |
| 75 Years and over | 8 (4.8%) | 68 (19.7%) |
| Total | 158 (6.4%) | 243 (9.2%) |
Income Above Poverty by Sex and Age in Utica
According to the poverty statistics in Utica, males aged under 5 years and females aged 5 years are the age groups that are most secure financially, with 100.0% of males and 100.0% of females in these age groups living above the poverty line.
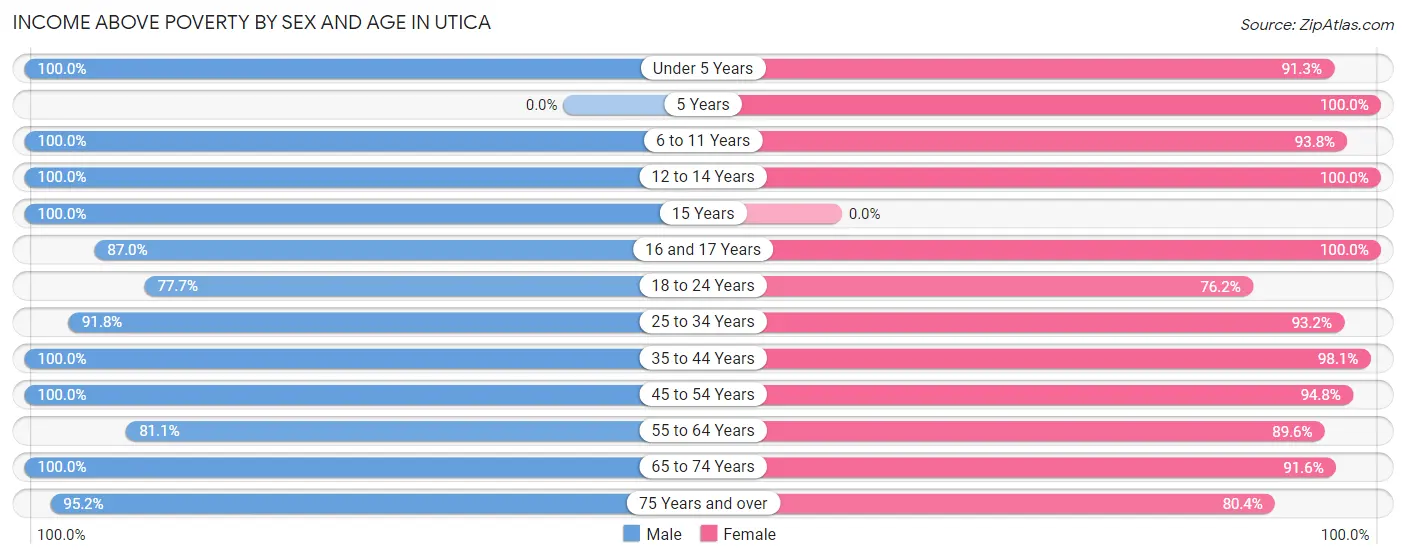
| Age Bracket | Male | Female |
| Under 5 Years | 63 (100.0%) | 147 (91.3%) |
| 5 Years | 0 (0.0%) | 10 (100.0%) |
| 6 to 11 Years | 154 (100.0%) | 105 (93.8%) |
| 12 to 14 Years | 106 (100.0%) | 80 (100.0%) |
| 15 Years | 6 (100.0%) | 0 (0.0%) |
| 16 and 17 Years | 47 (87.0%) | 28 (100.0%) |
| 18 to 24 Years | 185 (77.7%) | 109 (76.2%) |
| 25 to 34 Years | 368 (91.8%) | 286 (93.2%) |
| 35 to 44 Years | 399 (100.0%) | 353 (98.1%) |
| 45 to 54 Years | 219 (100.0%) | 238 (94.8%) |
| 55 to 64 Years | 245 (81.1%) | 343 (89.6%) |
| 65 to 74 Years | 380 (100.0%) | 427 (91.6%) |
| 75 Years and over | 159 (95.2%) | 278 (80.3%) |
| Total | 2,331 (93.6%) | 2,404 (90.8%) |
Income Below Poverty Among Married-Couple Families in Utica
The poverty statistics for married-couple families in Utica show that 1.8% or 15 of the total 831 families live below the poverty line. Families with no children have the highest poverty rate of 2.8%, comprising of 15 families. On the other hand, families with 1 or 2 children have the lowest poverty rate of 0.0%, which includes 0 families.
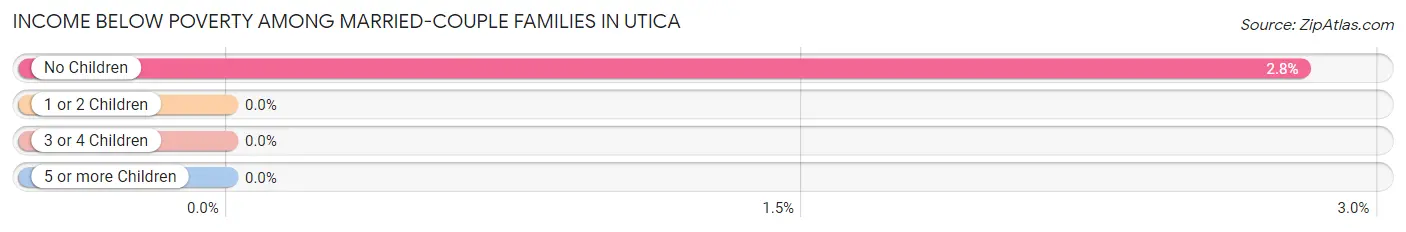
| Children | Above Poverty | Below Poverty |
| No Children | 521 (97.2%) | 15 (2.8%) |
| 1 or 2 Children | 261 (100.0%) | 0 (0.0%) |
| 3 or 4 Children | 34 (100.0%) | 0 (0.0%) |
| 5 or more Children | 0 (0.0%) | 0 (0.0%) |
| Total | 816 (98.2%) | 15 (1.8%) |
Income Below Poverty Among Single-Parent Households in Utica
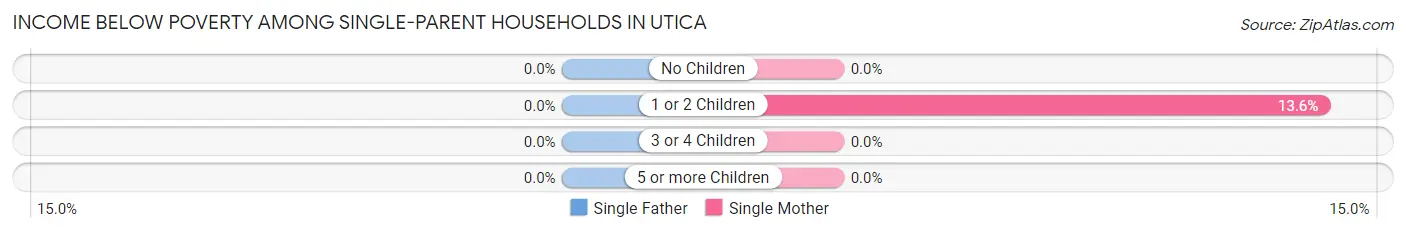
| Children | Single Father | Single Mother |
| No Children | 0 (0.0%) | 0 (0.0%) |
| 1 or 2 Children | 0 (0.0%) | 14 (13.6%) |
| 3 or 4 Children | 0 (0.0%) | 0 (0.0%) |
| 5 or more Children | 0 (0.0%) | 0 (0.0%) |
| Total | 0 (0.0%) | 14 (6.5%) |
Income Below Poverty Among Married-Couple vs Single-Parent Households in Utica
The poverty data for Utica shows that 15 of the married-couple family households (1.8%) and 14 of the single-parent households (4.8%) are living below the poverty level. Within the married-couple family households, those with no children have the highest poverty rate, with 15 households (2.8%) falling below the poverty line. Among the single-parent households, those with 1 or 2 children have the highest poverty rate, with 14 household (9.9%) living below poverty.
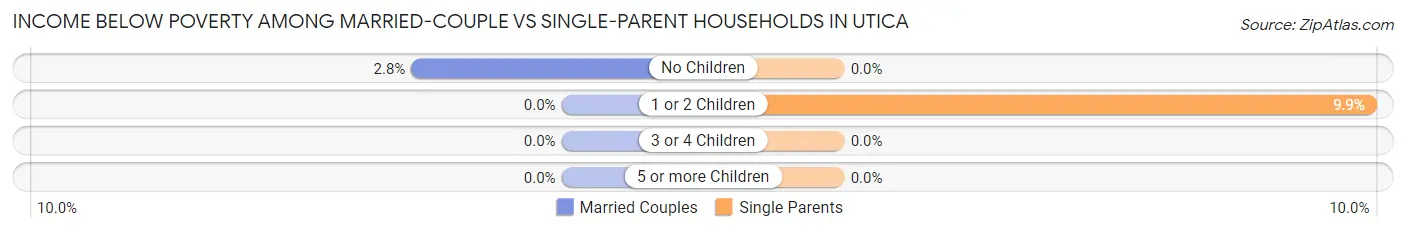
| Children | Married-Couple Families | Single-Parent Households |
| No Children | 15 (2.8%) | 0 (0.0%) |
| 1 or 2 Children | 0 (0.0%) | 14 (9.9%) |
| 3 or 4 Children | 0 (0.0%) | 0 (0.0%) |
| 5 or more Children | 0 (0.0%) | 0 (0.0%) |
| Total | 15 (1.8%) | 14 (4.8%) |
Race in Utica
The most populous races in Utica are White / Caucasian (4,142 | 79.7%), Asian (326 | 6.3%), and Hispanic or Latino (280 | 5.4%).
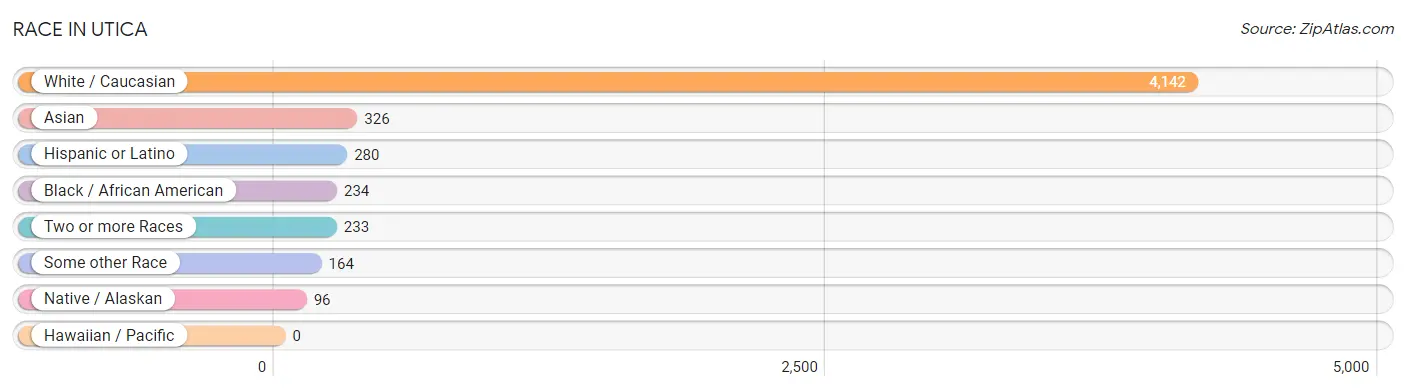
| Race | # Population | % Population |
| Asian | 326 | 6.3% |
| Black / African American | 234 | 4.5% |
| Hawaiian / Pacific | 0 | 0.0% |
| Hispanic or Latino | 280 | 5.4% |
| Native / Alaskan | 96 | 1.8% |
| White / Caucasian | 4,142 | 79.7% |
| Two or more Races | 233 | 4.5% |
| Some other Race | 164 | 3.2% |
| Total | 5,195 | 100.0% |
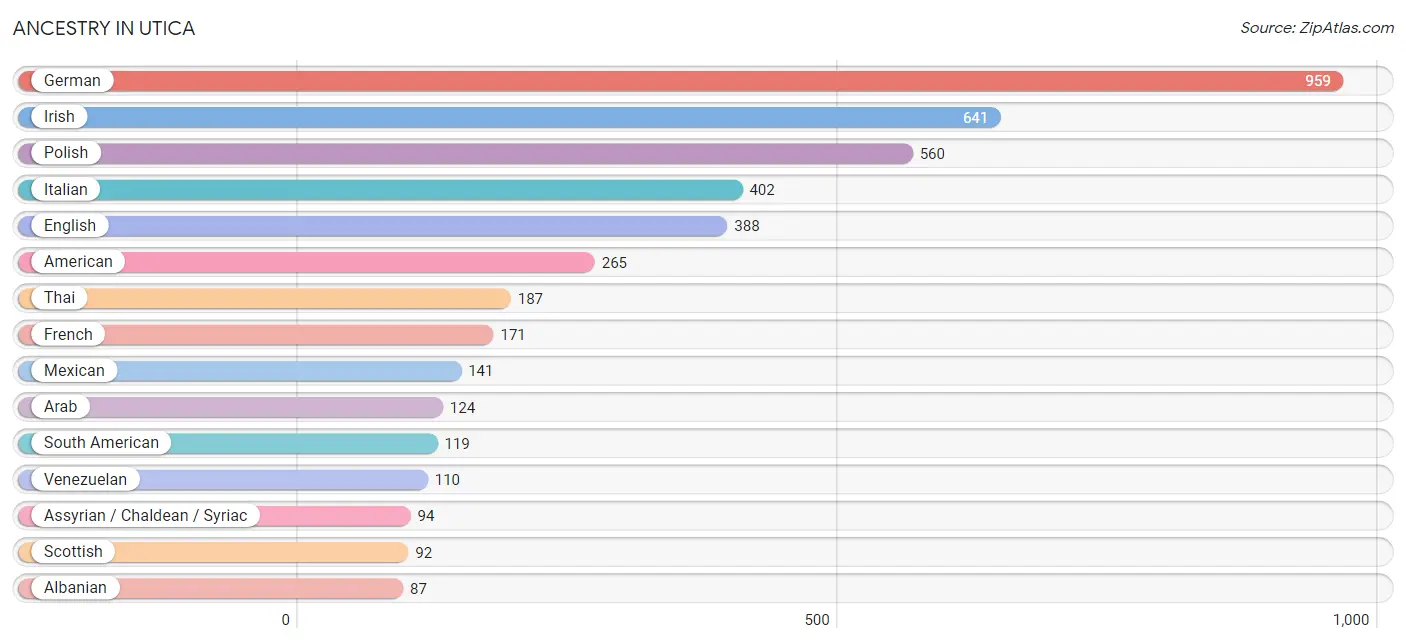
Ancestry in Utica
The most populous ancestries reported in Utica are German (959 | 18.5%), Irish (641 | 12.3%), Polish (560 | 10.8%), Italian (402 | 7.7%), and English (388 | 7.5%), together accounting for 56.8% of all Utica residents.
| Ancestry | # Population | % Population |
| Albanian | 87 | 1.7% |
| American | 265 | 5.1% |
| Apache | 5 | 0.1% |
| Arab | 124 | 2.4% |
| Armenian | 15 | 0.3% |
| Assyrian / Chaldean / Syriac | 94 | 1.8% |
| Austrian | 8 | 0.2% |
| Belgian | 44 | 0.9% |
| British | 16 | 0.3% |
| Central American Indian | 50 | 1.0% |
| Cherokee | 13 | 0.3% |
| Choctaw | 3 | 0.1% |
| Czech | 8 | 0.2% |
| Danish | 8 | 0.2% |
| Dutch | 43 | 0.8% |
| Eastern European | 8 | 0.2% |
| English | 388 | 7.5% |
| European | 53 | 1.0% |
| Finnish | 8 | 0.2% |
| French | 171 | 3.3% |
| French Canadian | 79 | 1.5% |
| German | 959 | 18.5% |
| Greek | 10 | 0.2% |
| Hungarian | 17 | 0.3% |
| Indian (Asian) | 4 | 0.1% |
| Irish | 641 | 12.3% |
| Italian | 402 | 7.7% |
| Korean | 52 | 1.0% |
| Lebanese | 67 | 1.3% |
| Lithuanian | 28 | 0.5% |
| Macedonian | 63 | 1.2% |
| Mexican | 141 | 2.7% |
| Mexican American Indian | 41 | 0.8% |
| Norwegian | 61 | 1.2% |
| Pennsylvania German | 6 | 0.1% |
| Peruvian | 9 | 0.2% |
| Polish | 560 | 10.8% |
| Portuguese | 24 | 0.5% |
| Puerto Rican | 12 | 0.2% |
| Romanian | 8 | 0.2% |
| Russian | 57 | 1.1% |
| Scandinavian | 14 | 0.3% |
| Scotch-Irish | 31 | 0.6% |
| Scottish | 92 | 1.8% |
| Serbian | 12 | 0.2% |
| Slovak | 8 | 0.2% |
| Slovene | 15 | 0.3% |
| South American | 119 | 2.3% |
| Spaniard | 8 | 0.2% |
| Swedish | 18 | 0.4% |
| Swiss | 8 | 0.2% |
| Syrian | 28 | 0.5% |
| Thai | 187 | 3.6% |
| Ukrainian | 58 | 1.1% |
| Venezuelan | 110 | 2.1% |
| Welsh | 12 | 0.2% |
| Yugoslavian | 32 | 0.6% | View All 57 Rows |
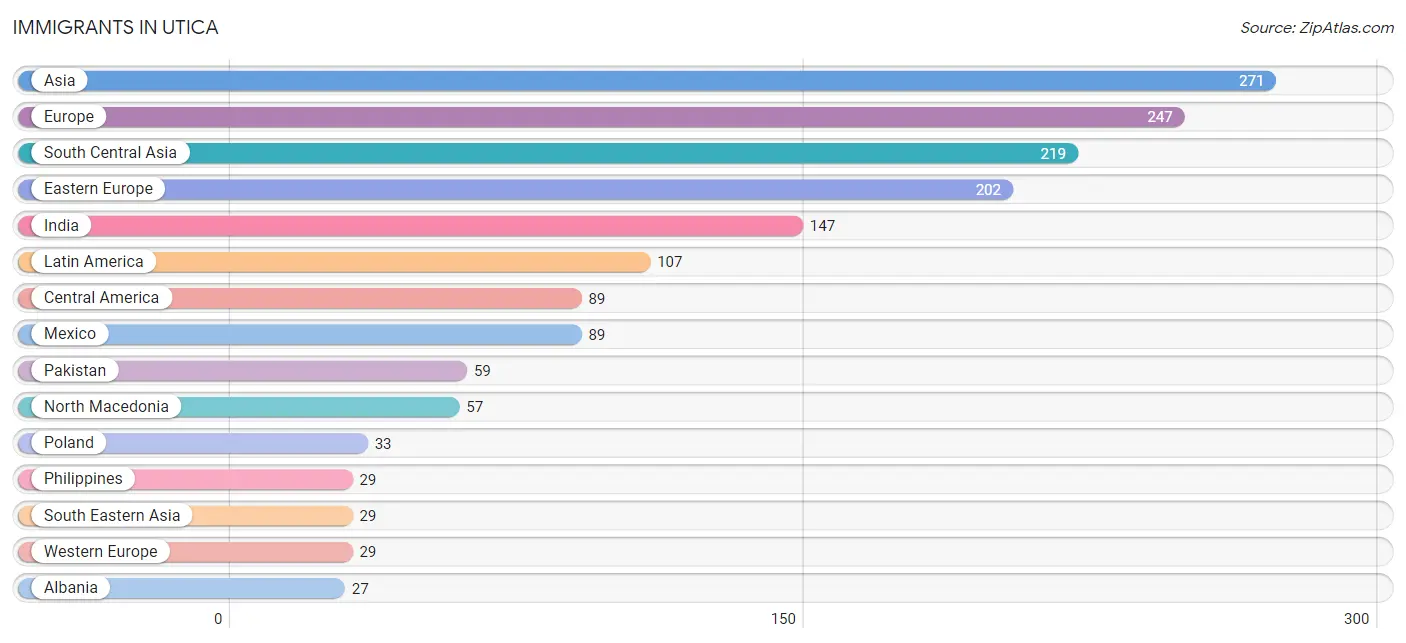
Immigrants in Utica
The most numerous immigrant groups reported in Utica came from Asia (271 | 5.2%), Europe (247 | 4.8%), South Central Asia (219 | 4.2%), Eastern Europe (202 | 3.9%), and India (147 | 2.8%), together accounting for 20.9% of all Utica residents.
| Immigration Origin | # Population | % Population |
| Albania | 27 | 0.5% |
| Asia | 271 | 5.2% |
| Austria | 8 | 0.2% |
| Bangladesh | 13 | 0.3% |
| Bosnia and Herzegovina | 19 | 0.4% |
| Canada | 9 | 0.2% |
| Central America | 89 | 1.7% |
| Eastern Europe | 202 | 3.9% |
| England | 8 | 0.2% |
| Europe | 247 | 4.8% |
| Germany | 12 | 0.2% |
| Hungary | 7 | 0.1% |
| India | 147 | 2.8% |
| Iraq | 23 | 0.4% |
| Ireland | 8 | 0.2% |
| Latin America | 107 | 2.1% |
| Mexico | 89 | 1.7% |
| Netherlands | 7 | 0.1% |
| North Macedonia | 57 | 1.1% |
| Northern Europe | 16 | 0.3% |
| Pakistan | 59 | 1.1% |
| Peru | 5 | 0.1% |
| Philippines | 29 | 0.6% |
| Poland | 33 | 0.6% |
| Romania | 8 | 0.2% |
| Russia | 16 | 0.3% |
| South America | 18 | 0.4% |
| South Central Asia | 219 | 4.2% |
| South Eastern Asia | 29 | 0.6% |
| Switzerland | 2 | 0.0% |
| Venezuela | 13 | 0.3% |
| Western Asia | 23 | 0.4% |
| Western Europe | 29 | 0.6% | View All 33 Rows |
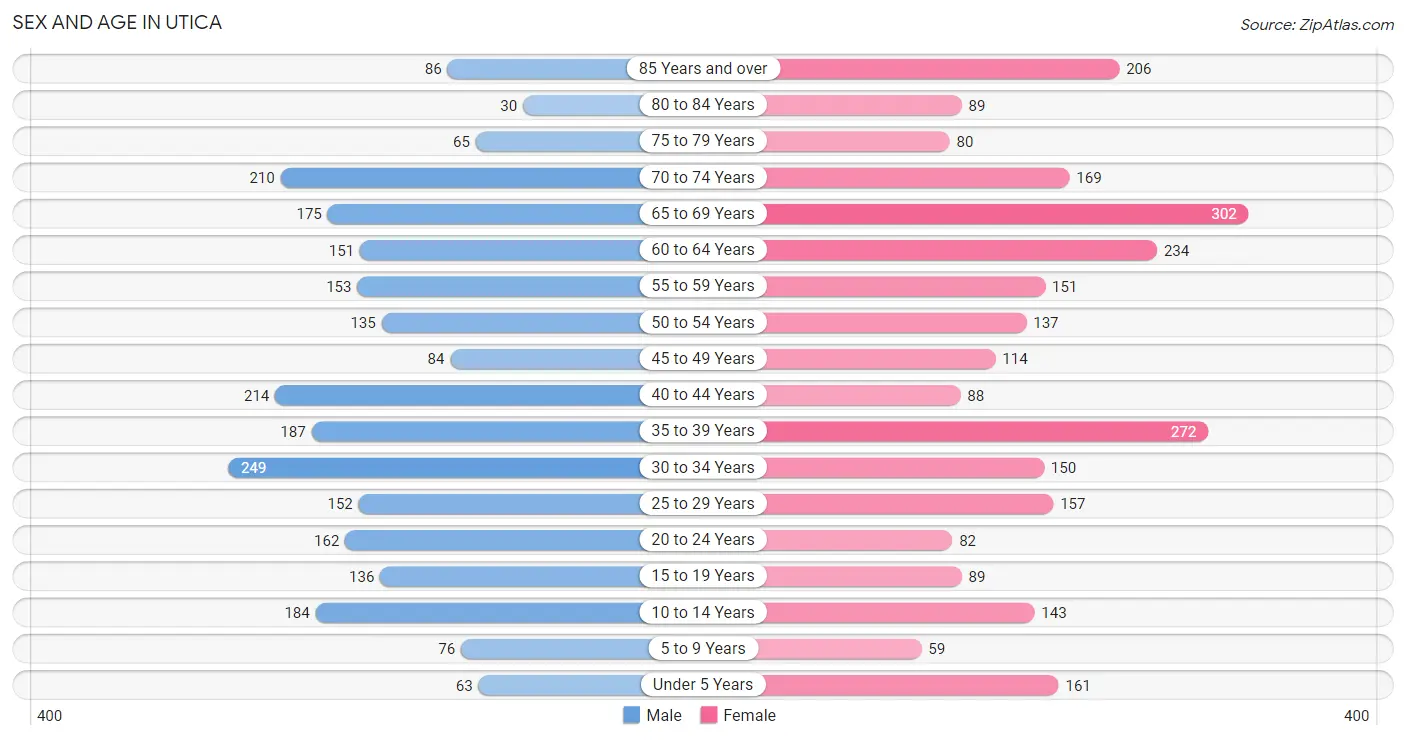
Sex and Age in Utica
Sex and Age in Utica
The most populous age groups in Utica are 30 to 34 Years (249 | 9.9%) for men and 65 to 69 Years (302 | 11.3%) for women.
| Age Bracket | Male | Female |
| Under 5 Years | 63 (2.5%) | 161 (6.0%) |
| 5 to 9 Years | 76 (3.0%) | 59 (2.2%) |
| 10 to 14 Years | 184 (7.3%) | 143 (5.3%) |
| 15 to 19 Years | 136 (5.4%) | 89 (3.3%) |
| 20 to 24 Years | 162 (6.5%) | 82 (3.1%) |
| 25 to 29 Years | 152 (6.0%) | 157 (5.9%) |
| 30 to 34 Years | 249 (9.9%) | 150 (5.6%) |
| 35 to 39 Years | 187 (7.4%) | 272 (10.1%) |
| 40 to 44 Years | 214 (8.5%) | 88 (3.3%) |
| 45 to 49 Years | 84 (3.3%) | 114 (4.3%) |
| 50 to 54 Years | 135 (5.4%) | 137 (5.1%) |
| 55 to 59 Years | 153 (6.1%) | 151 (5.6%) |
| 60 to 64 Years | 151 (6.0%) | 234 (8.7%) |
| 65 to 69 Years | 175 (7.0%) | 302 (11.3%) |
| 70 to 74 Years | 210 (8.4%) | 169 (6.3%) |
| 75 to 79 Years | 65 (2.6%) | 80 (3.0%) |
| 80 to 84 Years | 30 (1.2%) | 89 (3.3%) |
| 85 Years and over | 86 (3.4%) | 206 (7.7%) |
| Total | 2,512 (100.0%) | 2,683 (100.0%) |
Families and Households in Utica
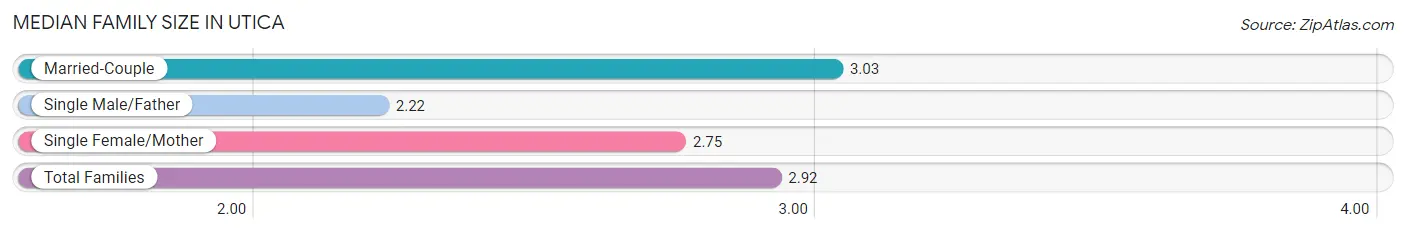
Median Family Size in Utica
The median family size in Utica is 2.92 persons per family, with married-couple families (831 | 73.9%) accounting for the largest median family size of 3.03 persons per family. On the other hand, single male/father families (78 | 6.9%) represent the smallest median family size with 2.22 persons per family.
| Family Type | # Families | Family Size |
| Married-Couple | 831 (73.9%) | 3.03 |
| Single Male/Father | 78 (6.9%) | 2.22 |
| Single Female/Mother | 215 (19.1%) | 2.75 |
| Total Families | 1,124 (100.0%) | 2.92 |
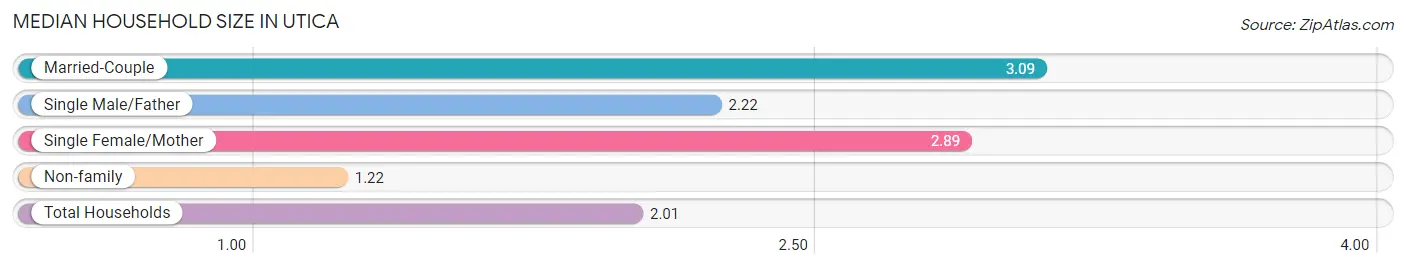
Median Household Size in Utica
The median household size in Utica is 2.01 persons per household, with married-couple households (831 | 32.9%) accounting for the largest median household size of 3.09 persons per household. non-family households (1,405 | 55.6%) represent the smallest median household size with 1.22 persons per household.
| Household Type | # Households | Household Size |
| Married-Couple | 831 (32.9%) | 3.09 |
| Single Male/Father | 78 (3.1%) | 2.22 |
| Single Female/Mother | 215 (8.5%) | 2.89 |
| Non-family | 1,405 (55.6%) | 1.22 |
| Total Households | 2,529 (100.0%) | 2.01 |
Household Size by Marriage Status in Utica
Out of a total of 2,529 households in Utica, 1,124 (44.4%) are family households, while 1,405 (55.6%) are nonfamily households. The most numerous type of family households are 2-person households, comprising 499, and the most common type of nonfamily households are 1-person households, comprising 1,208.
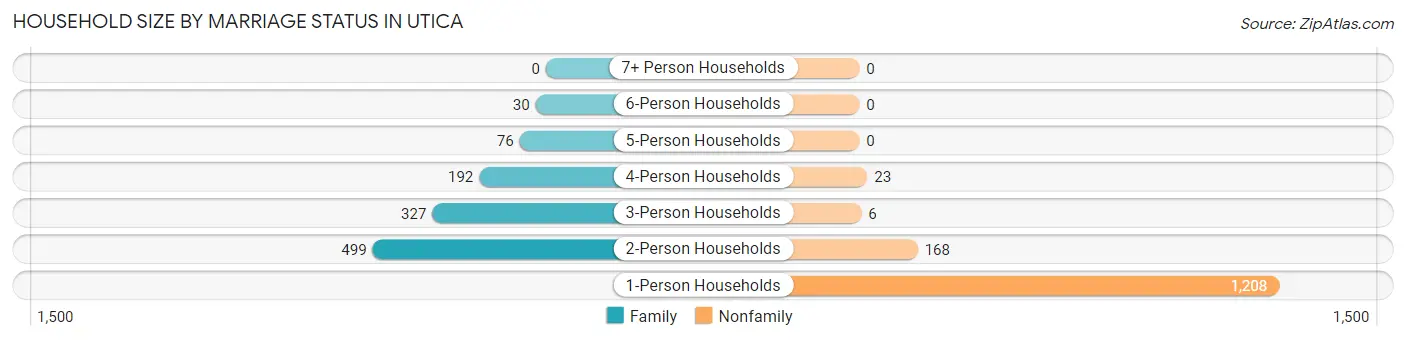
| Household Size | Family Households | Nonfamily Households |
| 1-Person Households | - | 1,208 (47.8%) |
| 2-Person Households | 499 (19.7%) | 168 (6.6%) |
| 3-Person Households | 327 (12.9%) | 6 (0.2%) |
| 4-Person Households | 192 (7.6%) | 23 (0.9%) |
| 5-Person Households | 76 (3.0%) | 0 (0.0%) |
| 6-Person Households | 30 (1.2%) | 0 (0.0%) |
| 7+ Person Households | 0 (0.0%) | 0 (0.0%) |
| Total | 1,124 (44.4%) | 1,405 (55.6%) |
Female Fertility in Utica
Fertility by Age in Utica
Average fertility rate in Utica is 34.0 births per 1,000 women. Women in the age bracket of 20 to 34 years have the highest fertility rate with 87.0 births per 1,000 women. Women in the age bracket of 20 to 34 years acount for 100.0% of all women with births.
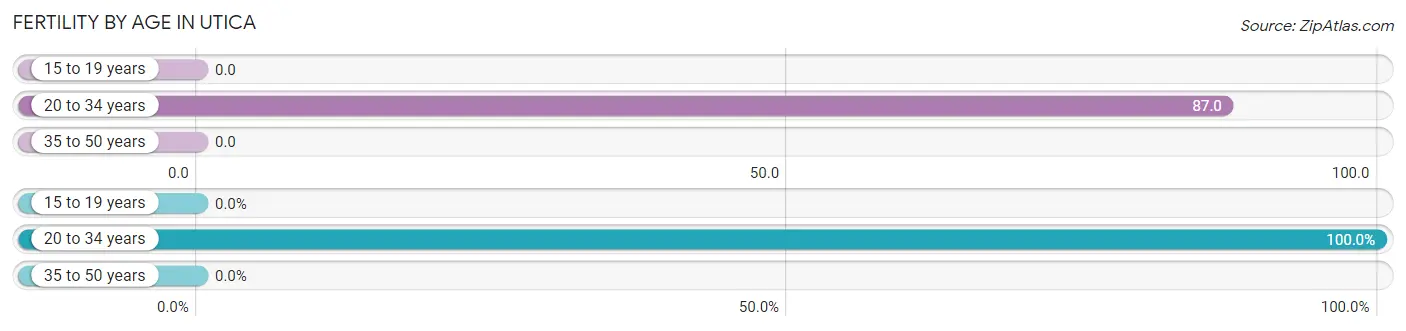
| Age Bracket | Women with Births | Births / 1,000 Women |
| 15 to 19 years | 0 (0.0%) | 0.0 |
| 20 to 34 years | 34 (100.0%) | 87.0 |
| 35 to 50 years | 0 (0.0%) | 0.0 |
| Total | 34 (100.0%) | 34.0 |
Fertility by Age by Marriage Status in Utica
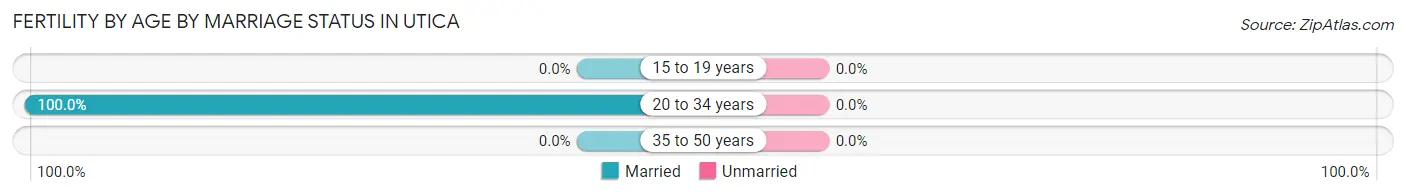
| Age Bracket | Married | Unmarried |
| 15 to 19 years | 0 (0.0%) | 0 (0.0%) |
| 20 to 34 years | 34 (100.0%) | 0 (0.0%) |
| 35 to 50 years | 0 (0.0%) | 0 (0.0%) |
| Total | 34 (100.0%) | 0 (0.0%) |
Fertility by Education in Utica
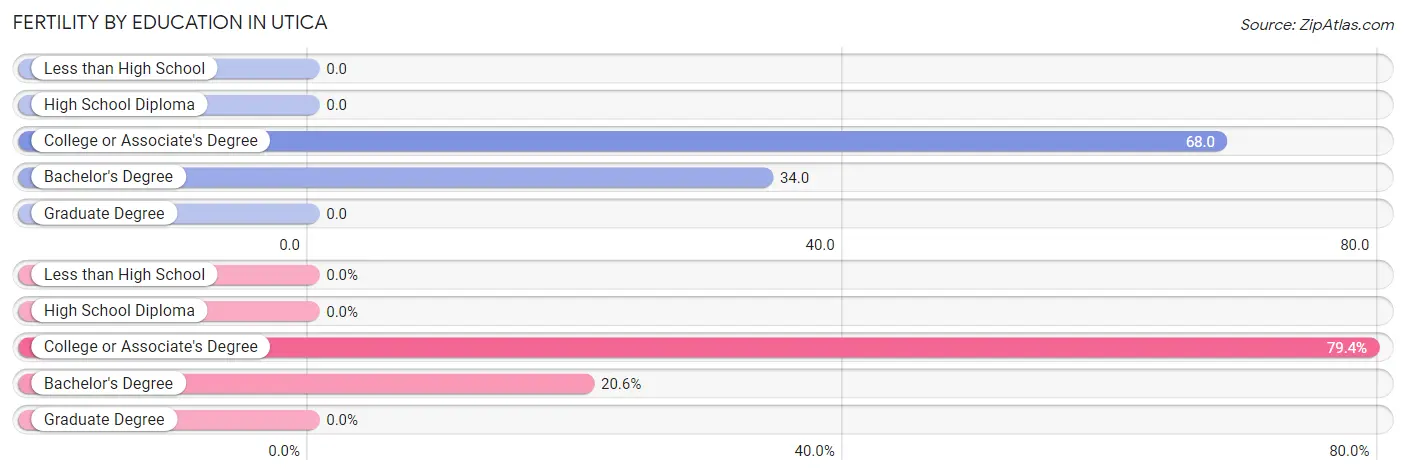
| Educational Attainment | Women with Births | Births / 1,000 Women |
| Less than High School | 0 (0.0%) | 0.0 |
| High School Diploma | 0 (0.0%) | 0.0 |
| College or Associate's Degree | 27 (79.4%) | 68.0 |
| Bachelor's Degree | 7 (20.6%) | 34.0 |
| Graduate Degree | 0 (0.0%) | 0.0 |
| Total | 34 (100.0%) | 34.0 |
Fertility by Education by Marriage Status in Utica
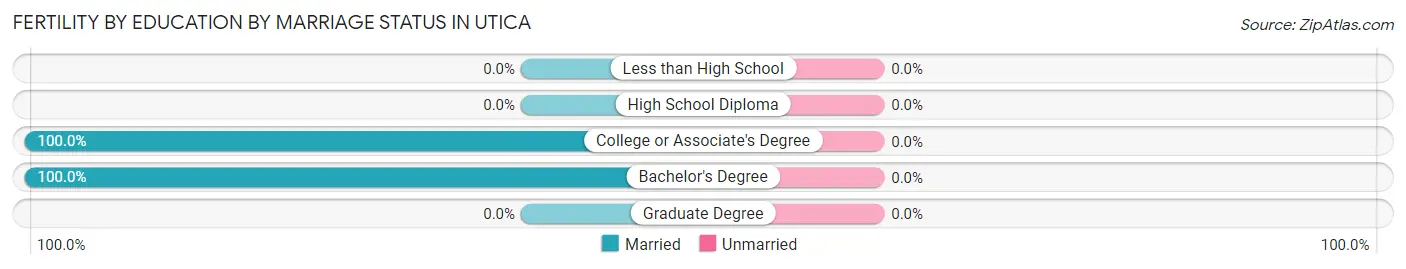
| Educational Attainment | Married | Unmarried |
| Less than High School | 0 (0.0%) | 0 (0.0%) |
| High School Diploma | 0 (0.0%) | 0 (0.0%) |
| College or Associate's Degree | 27 (100.0%) | 0 (0.0%) |
| Bachelor's Degree | 7 (100.0%) | 0 (0.0%) |
| Graduate Degree | 0 (0.0%) | 0 (0.0%) |
| Total | 34 (100.0%) | 0 (0.0%) |
Employment Characteristics in Utica
Employment by Class of Employer in Utica
Among the 2,408 employed individuals in Utica, private company employees (1,889 | 78.4%), local government employees (130 | 5.4%), and not-for-profit organizations (120 | 5.0%) make up the most common classes of employment.
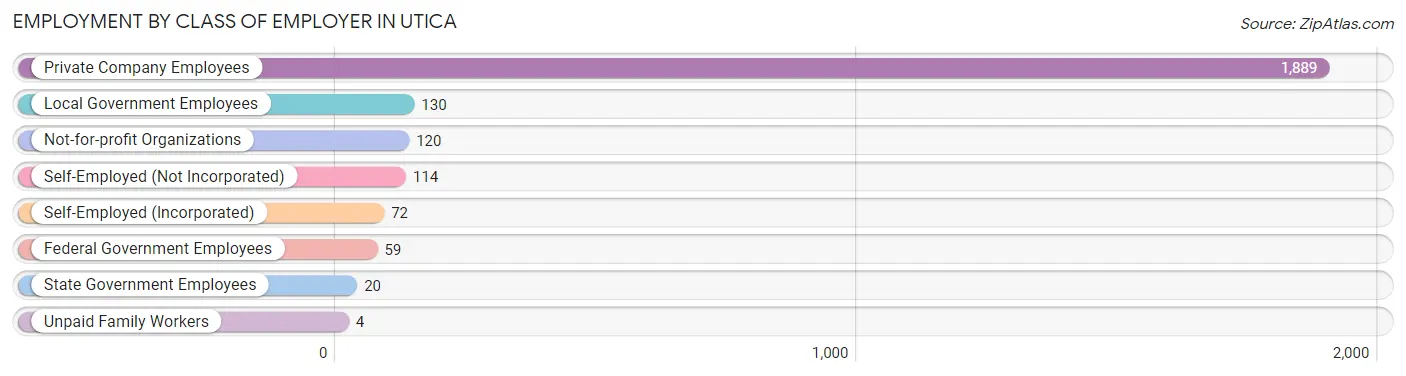
| Employer Class | # Employees | % Employees |
| Private Company Employees | 1,889 | 78.4% |
| Self-Employed (Incorporated) | 72 | 3.0% |
| Self-Employed (Not Incorporated) | 114 | 4.7% |
| Not-for-profit Organizations | 120 | 5.0% |
| Local Government Employees | 130 | 5.4% |
| State Government Employees | 20 | 0.8% |
| Federal Government Employees | 59 | 2.5% |
| Unpaid Family Workers | 4 | 0.2% |
| Total | 2,408 | 100.0% |
Employment Status by Age in Utica
According to the labor force statistics for Utica, out of the total population over 16 years of age (4,503), 58.8% or 2,648 individuals are in the labor force, with 4.2% or 111 of them unemployed. The age group with the highest labor force participation rate is 25 to 29 years, with 93.9% or 290 individuals in the labor force. Within the labor force, the 16 to 19 years age range has the highest percentage of unemployed individuals, with 13.2% or 7 of them being unemployed.
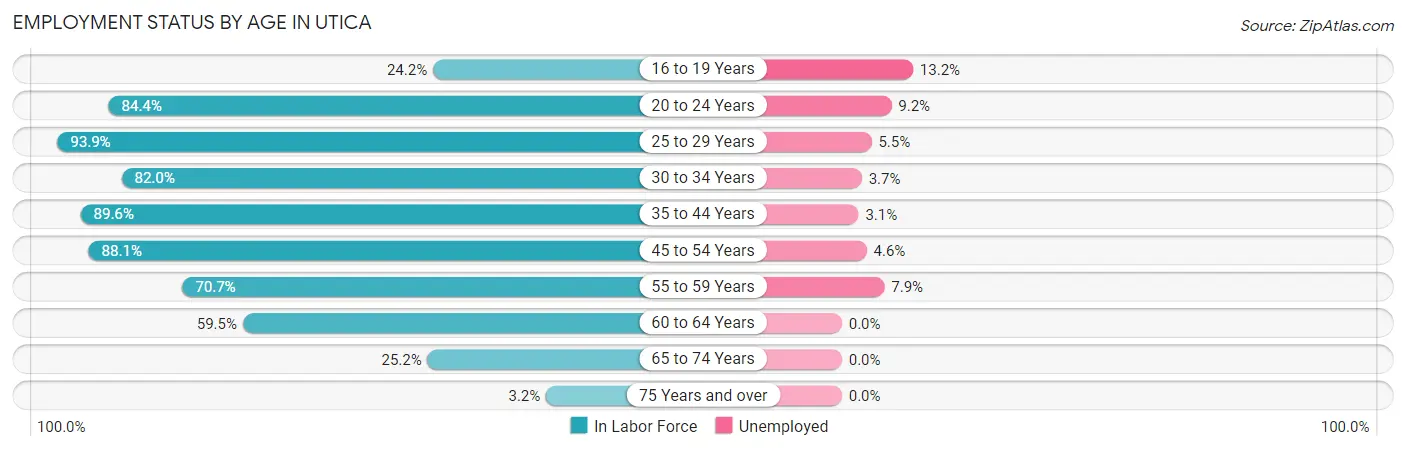
| Age Bracket | In Labor Force | Unemployed |
| 16 to 19 Years | 53 (24.2%) | 7 (13.2%) |
| 20 to 24 Years | 206 (84.4%) | 19 (9.2%) |
| 25 to 29 Years | 290 (93.9%) | 16 (5.5%) |
| 30 to 34 Years | 327 (82.0%) | 12 (3.7%) |
| 35 to 44 Years | 682 (89.6%) | 21 (3.1%) |
| 45 to 54 Years | 414 (88.1%) | 19 (4.6%) |
| 55 to 59 Years | 215 (70.7%) | 17 (7.9%) |
| 60 to 64 Years | 229 (59.5%) | 0 (0.0%) |
| 65 to 74 Years | 216 (25.2%) | 0 (0.0%) |
| 75 Years and over | 18 (3.2%) | 0 (0.0%) |
| Total | 2,648 (58.8%) | 111 (4.2%) |
Employment Status by Educational Attainment in Utica
According to labor force statistics for Utica, 82.1% of individuals (2,158) out of the total population between 25 and 64 years of age (2,628) are in the labor force, with 3.9% or 84 of them being unemployed. The group with the highest labor force participation rate are those with the educational attainment of college / associate degree, with 87.0% or 927 individuals in the labor force. Within the labor force, individuals with high school diploma education have the highest percentage of unemployment, with 9.1% or 47 of them being unemployed.
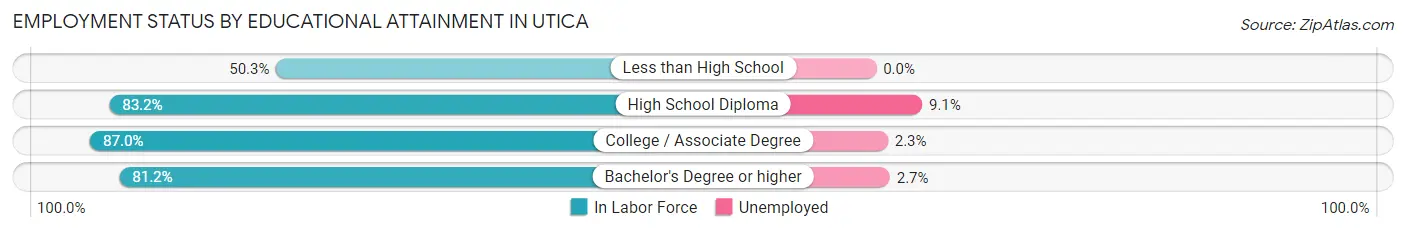
| Educational Attainment | In Labor Force | Unemployed |
| Less than High School | 82 (50.3%) | 0 (0.0%) |
| High School Diploma | 515 (83.2%) | 56 (9.1%) |
| College / Associate Degree | 927 (87.0%) | 25 (2.3%) |
| Bachelor's Degree or higher | 633 (81.2%) | 21 (2.7%) |
| Total | 2,158 (82.1%) | 102 (3.9%) |
Employment Occupations by Sex in Utica
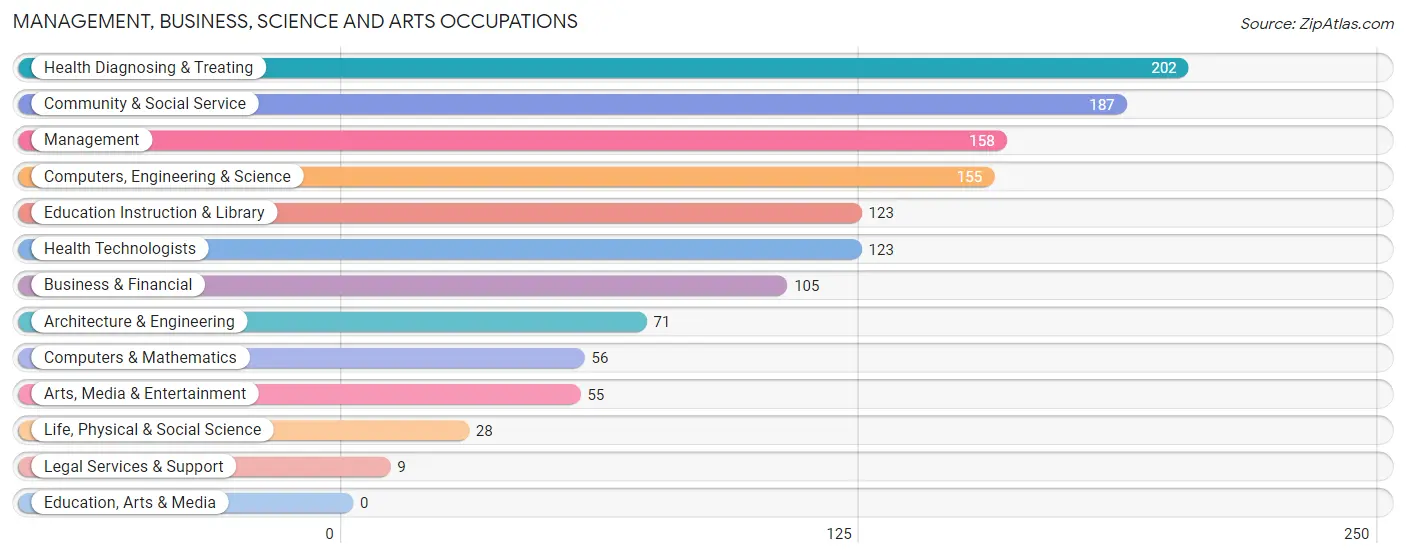
Management, Business, Science and Arts Occupations
The most common Management, Business, Science and Arts occupations in Utica are Health Diagnosing & Treating (202 | 8.0%), Community & Social Service (187 | 7.4%), Management (158 | 6.2%), Computers, Engineering & Science (155 | 6.1%), and Education Instruction & Library (123 | 4.8%).
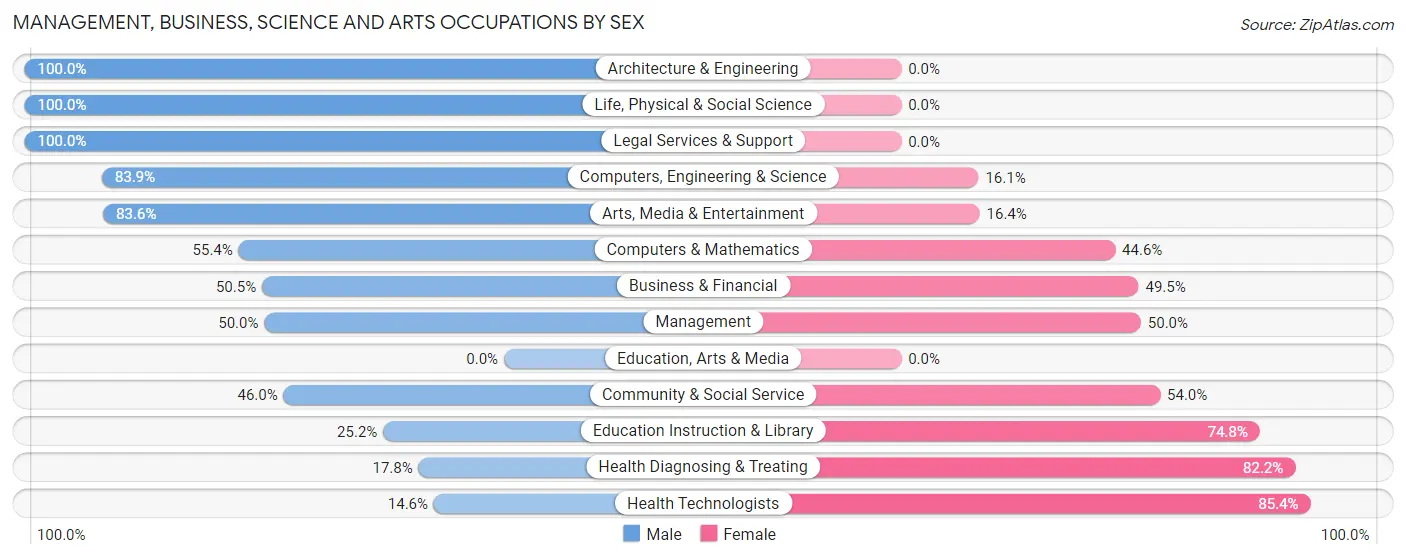
Management, Business, Science and Arts Occupations by Sex
Within the Management, Business, Science and Arts occupations in Utica, the most male-oriented occupations are Architecture & Engineering (100.0%), Life, Physical & Social Science (100.0%), and Legal Services & Support (100.0%), while the most female-oriented occupations are Health Technologists (85.4%), Health Diagnosing & Treating (82.2%), and Education Instruction & Library (74.8%).
| Occupation | Male | Female |
| Management | 79 (50.0%) | 79 (50.0%) |
| Business & Financial | 53 (50.5%) | 52 (49.5%) |
| Computers, Engineering & Science | 130 (83.9%) | 25 (16.1%) |
| Computers & Mathematics | 31 (55.4%) | 25 (44.6%) |
| Architecture & Engineering | 71 (100.0%) | 0 (0.0%) |
| Life, Physical & Social Science | 28 (100.0%) | 0 (0.0%) |
| Community & Social Service | 86 (46.0%) | 101 (54.0%) |
| Education, Arts & Media | 0 (0.0%) | 0 (0.0%) |
| Legal Services & Support | 9 (100.0%) | 0 (0.0%) |
| Education Instruction & Library | 31 (25.2%) | 92 (74.8%) |
| Arts, Media & Entertainment | 46 (83.6%) | 9 (16.4%) |
| Health Diagnosing & Treating | 36 (17.8%) | 166 (82.2%) |
| Health Technologists | 18 (14.6%) | 105 (85.4%) |
| Total (Category) | 384 (47.6%) | 423 (52.4%) |
| Total (Overall) | 1,374 (54.1%) | 1,165 (45.9%) |
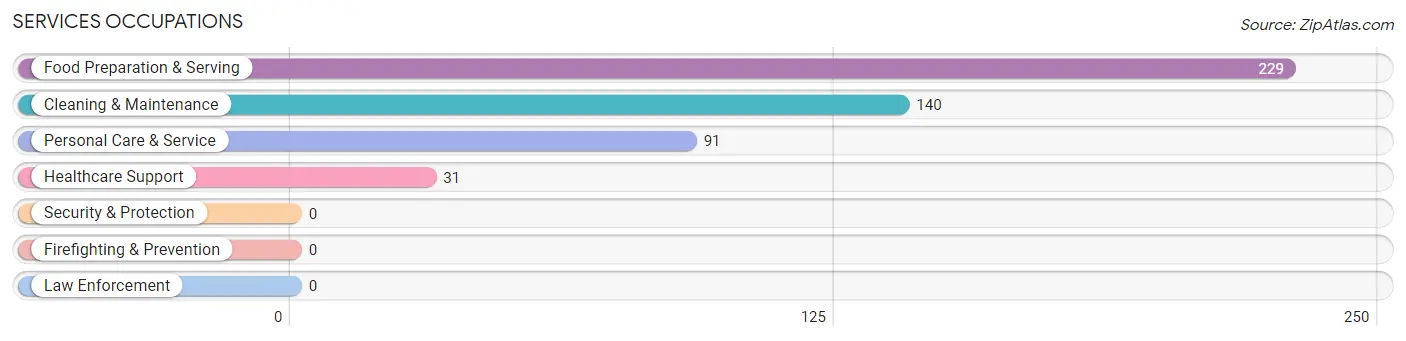
Services Occupations
The most common Services occupations in Utica are Food Preparation & Serving (229 | 9.0%), Cleaning & Maintenance (140 | 5.5%), Personal Care & Service (91 | 3.6%), and Healthcare Support (31 | 1.2%).
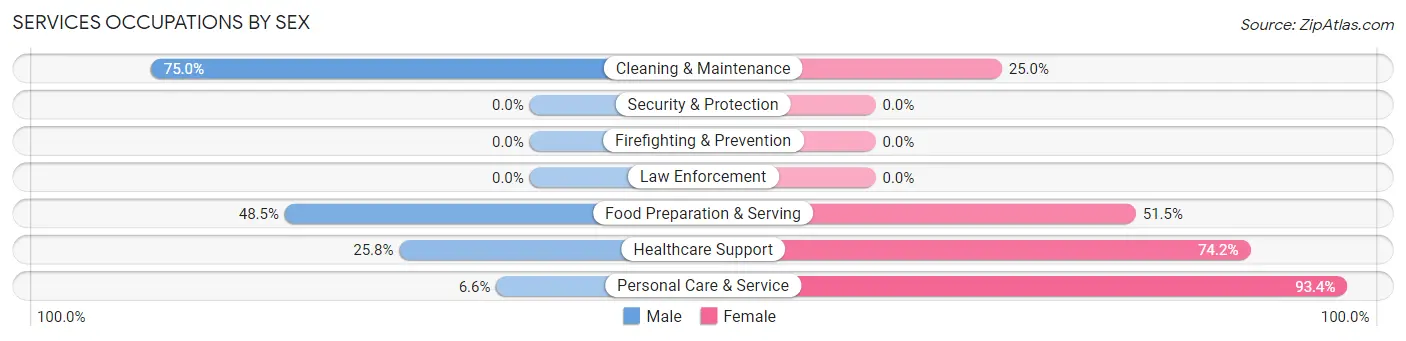
Services Occupations by Sex
Within the Services occupations in Utica, the most male-oriented occupations are Cleaning & Maintenance (75.0%), Food Preparation & Serving (48.5%), and Healthcare Support (25.8%), while the most female-oriented occupations are Personal Care & Service (93.4%), Healthcare Support (74.2%), and Food Preparation & Serving (51.5%).
| Occupation | Male | Female |
| Healthcare Support | 8 (25.8%) | 23 (74.2%) |
| Security & Protection | 0 (0.0%) | 0 (0.0%) |
| Firefighting & Prevention | 0 (0.0%) | 0 (0.0%) |
| Law Enforcement | 0 (0.0%) | 0 (0.0%) |
| Food Preparation & Serving | 111 (48.5%) | 118 (51.5%) |
| Cleaning & Maintenance | 105 (75.0%) | 35 (25.0%) |
| Personal Care & Service | 6 (6.6%) | 85 (93.4%) |
| Total (Category) | 230 (46.8%) | 261 (53.2%) |
| Total (Overall) | 1,374 (54.1%) | 1,165 (45.9%) |
Sales and Office Occupations
The most common Sales and Office occupations in Utica are Office & Administration (439 | 17.3%), and Sales & Related (263 | 10.4%).
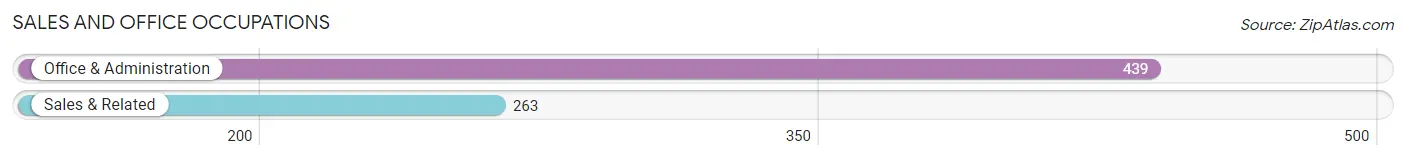
Sales and Office Occupations by Sex
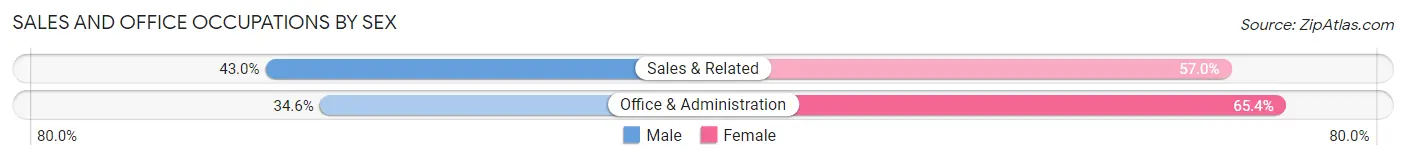
| Occupation | Male | Female |
| Sales & Related | 113 (43.0%) | 150 (57.0%) |
| Office & Administration | 152 (34.6%) | 287 (65.4%) |
| Total (Category) | 265 (37.8%) | 437 (62.3%) |
| Total (Overall) | 1,374 (54.1%) | 1,165 (45.9%) |
Natural Resources, Construction and Maintenance Occupations
The most common Natural Resources, Construction and Maintenance occupations in Utica are Construction & Extraction (112 | 4.4%), Installation, Maintenance & Repair (77 | 3.0%), and Farming, Fishing & Forestry (21 | 0.8%).
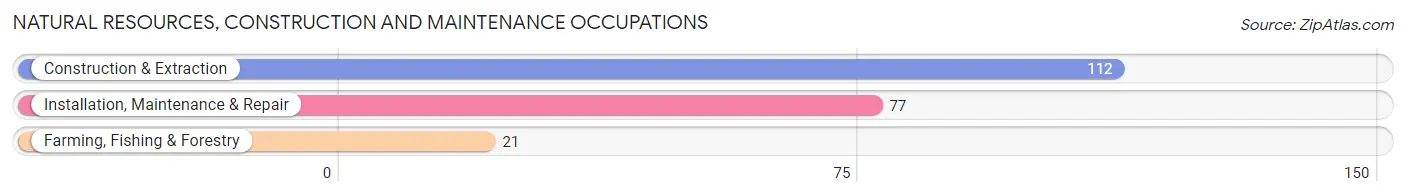
Natural Resources, Construction and Maintenance Occupations by Sex
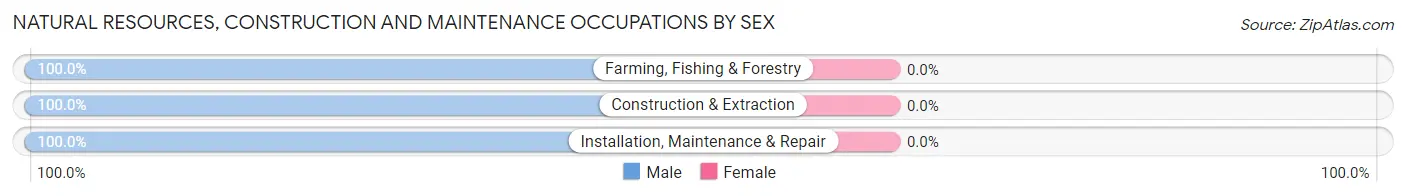
| Occupation | Male | Female |
| Farming, Fishing & Forestry | 21 (100.0%) | 0 (0.0%) |
| Construction & Extraction | 112 (100.0%) | 0 (0.0%) |
| Installation, Maintenance & Repair | 77 (100.0%) | 0 (0.0%) |
| Total (Category) | 210 (100.0%) | 0 (0.0%) |
| Total (Overall) | 1,374 (54.1%) | 1,165 (45.9%) |
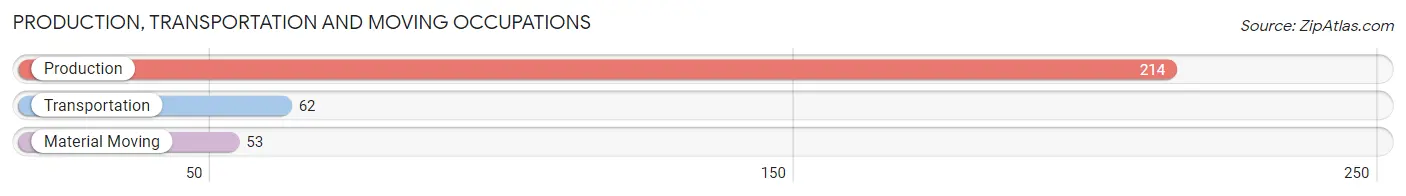
Production, Transportation and Moving Occupations
The most common Production, Transportation and Moving occupations in Utica are Production (214 | 8.4%), Transportation (62 | 2.4%), and Material Moving (53 | 2.1%).
Production, Transportation and Moving Occupations by Sex
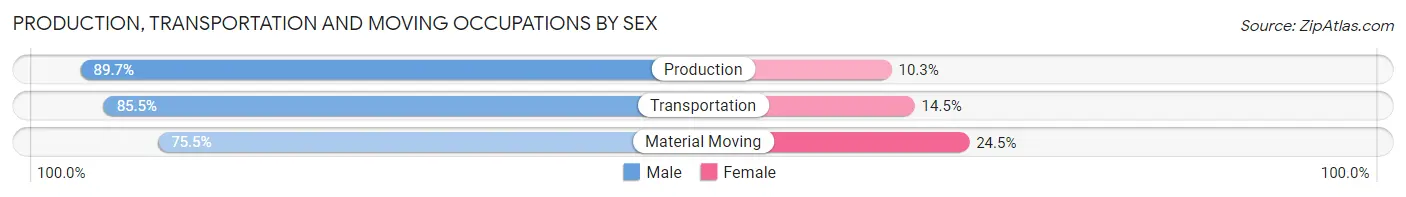
| Occupation | Male | Female |
| Production | 192 (89.7%) | 22 (10.3%) |
| Transportation | 53 (85.5%) | 9 (14.5%) |
| Material Moving | 40 (75.5%) | 13 (24.5%) |
| Total (Category) | 285 (86.6%) | 44 (13.4%) |
| Total (Overall) | 1,374 (54.1%) | 1,165 (45.9%) |
Employment Industries by Sex in Utica
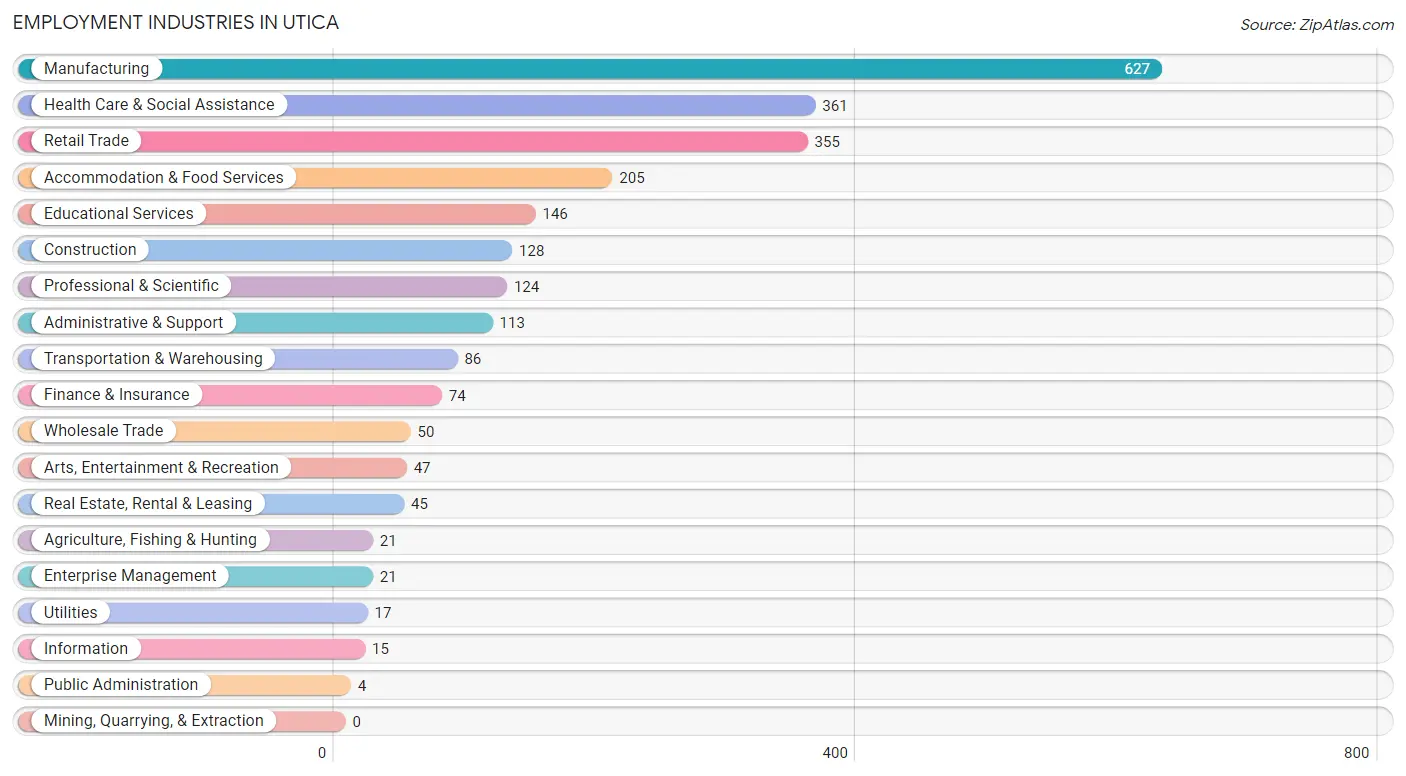
Employment Industries in Utica
The major employment industries in Utica include Manufacturing (627 | 24.7%), Health Care & Social Assistance (361 | 14.2%), Retail Trade (355 | 14.0%), Accommodation & Food Services (205 | 8.1%), and Educational Services (146 | 5.8%).
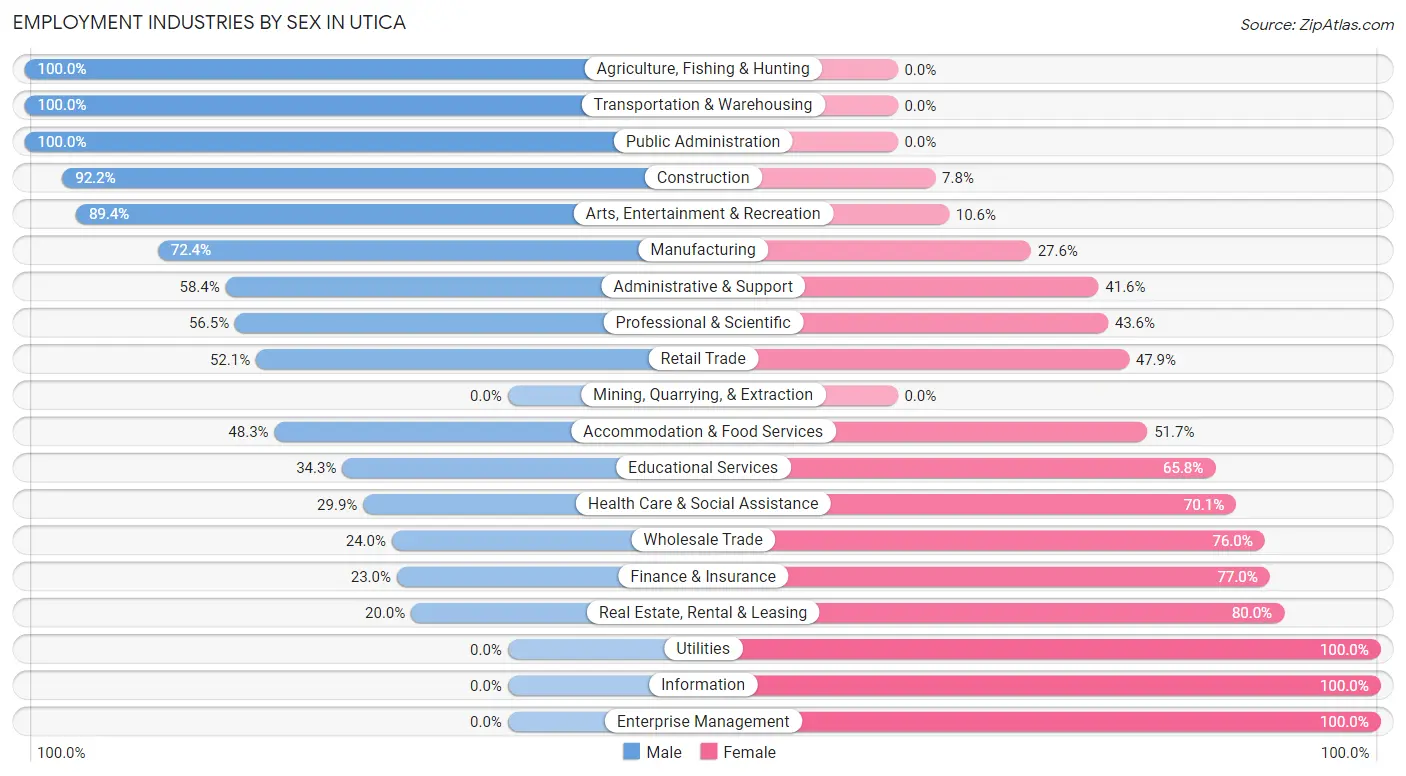
Employment Industries by Sex in Utica
The Utica industries that see more men than women are Agriculture, Fishing & Hunting (100.0%), Transportation & Warehousing (100.0%), and Public Administration (100.0%), whereas the industries that tend to have a higher number of women are Utilities (100.0%), Information (100.0%), and Enterprise Management (100.0%).
| Industry | Male | Female |
| Agriculture, Fishing & Hunting | 21 (100.0%) | 0 (0.0%) |
| Mining, Quarrying, & Extraction | 0 (0.0%) | 0 (0.0%) |
| Construction | 118 (92.2%) | 10 (7.8%) |
| Manufacturing | 454 (72.4%) | 173 (27.6%) |
| Wholesale Trade | 12 (24.0%) | 38 (76.0%) |
| Retail Trade | 185 (52.1%) | 170 (47.9%) |
| Transportation & Warehousing | 86 (100.0%) | 0 (0.0%) |
| Utilities | 0 (0.0%) | 17 (100.0%) |
| Information | 0 (0.0%) | 15 (100.0%) |
| Finance & Insurance | 17 (23.0%) | 57 (77.0%) |
| Real Estate, Rental & Leasing | 9 (20.0%) | 36 (80.0%) |
| Professional & Scientific | 70 (56.5%) | 54 (43.5%) |
| Enterprise Management | 0 (0.0%) | 21 (100.0%) |
| Administrative & Support | 66 (58.4%) | 47 (41.6%) |
| Educational Services | 50 (34.3%) | 96 (65.7%) |
| Health Care & Social Assistance | 108 (29.9%) | 253 (70.1%) |
| Arts, Entertainment & Recreation | 42 (89.4%) | 5 (10.6%) |
| Accommodation & Food Services | 99 (48.3%) | 106 (51.7%) |
| Public Administration | 4 (100.0%) | 0 (0.0%) |
| Total | 1,374 (54.1%) | 1,165 (45.9%) |
Education in Utica
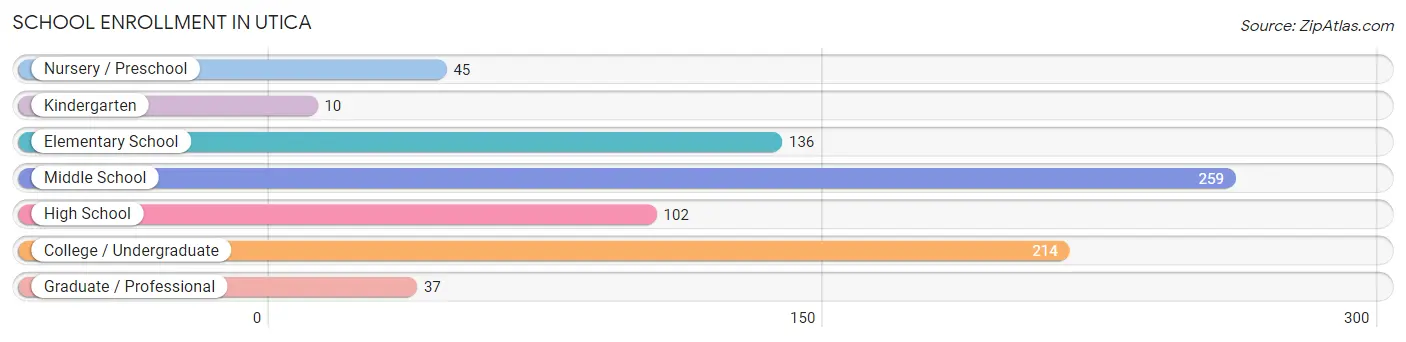
School Enrollment in Utica
The most common levels of schooling among the 803 students in Utica are middle school (259 | 32.3%), college / undergraduate (214 | 26.7%), and elementary school (136 | 16.9%).
| School Level | # Students | % Students |
| Nursery / Preschool | 45 | 5.6% |
| Kindergarten | 10 | 1.3% |
| Elementary School | 136 | 16.9% |
| Middle School | 259 | 32.3% |
| High School | 102 | 12.7% |
| College / Undergraduate | 214 | 26.7% |
| Graduate / Professional | 37 | 4.6% |
| Total | 803 | 100.0% |
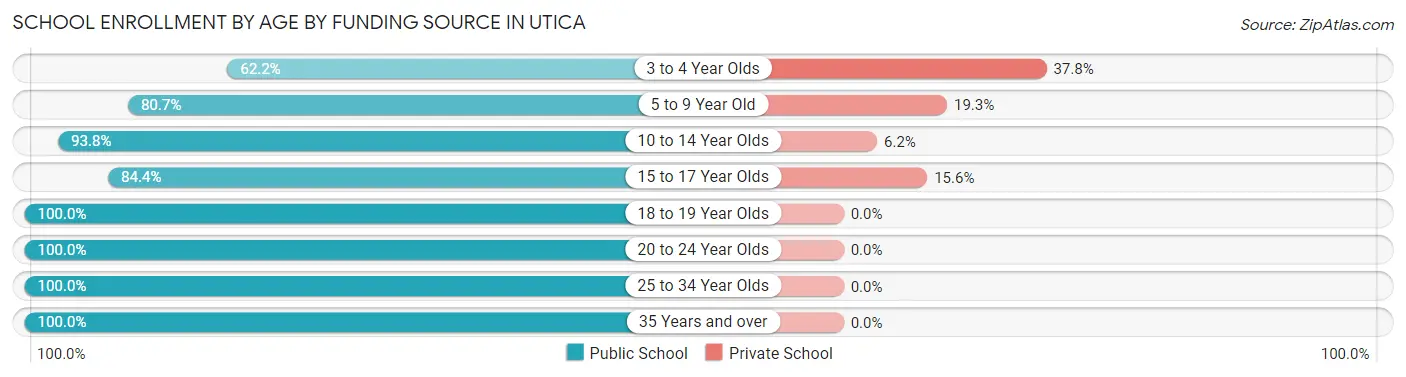
School Enrollment by Age by Funding Source in Utica
Out of a total of 803 students who are enrolled in schools in Utica, 70 (8.7%) attend a private institution, while the remaining 733 (91.3%) are enrolled in public schools. The age group of 3 to 4 year olds has the highest likelihood of being enrolled in private schools, with 17 (37.8% in the age bracket) enrolled. Conversely, the age group of 18 to 19 year olds has the lowest likelihood of being enrolled in a private school, with 126 (100.0% in the age bracket) attending a public institution.
| Age Bracket | Public School | Private School |
| 3 to 4 Year Olds | 28 (62.2%) | 17 (37.8%) |
| 5 to 9 Year Old | 109 (80.7%) | 26 (19.3%) |
| 10 to 14 Year Olds | 301 (93.8%) | 20 (6.2%) |
| 15 to 17 Year Olds | 38 (84.4%) | 7 (15.6%) |
| 18 to 19 Year Olds | 126 (100.0%) | 0 (0.0%) |
| 20 to 24 Year Olds | 63 (100.0%) | 0 (0.0%) |
| 25 to 34 Year Olds | 55 (100.0%) | 0 (0.0%) |
| 35 Years and over | 13 (100.0%) | 0 (0.0%) |
| Total | 733 (91.3%) | 70 (8.7%) |
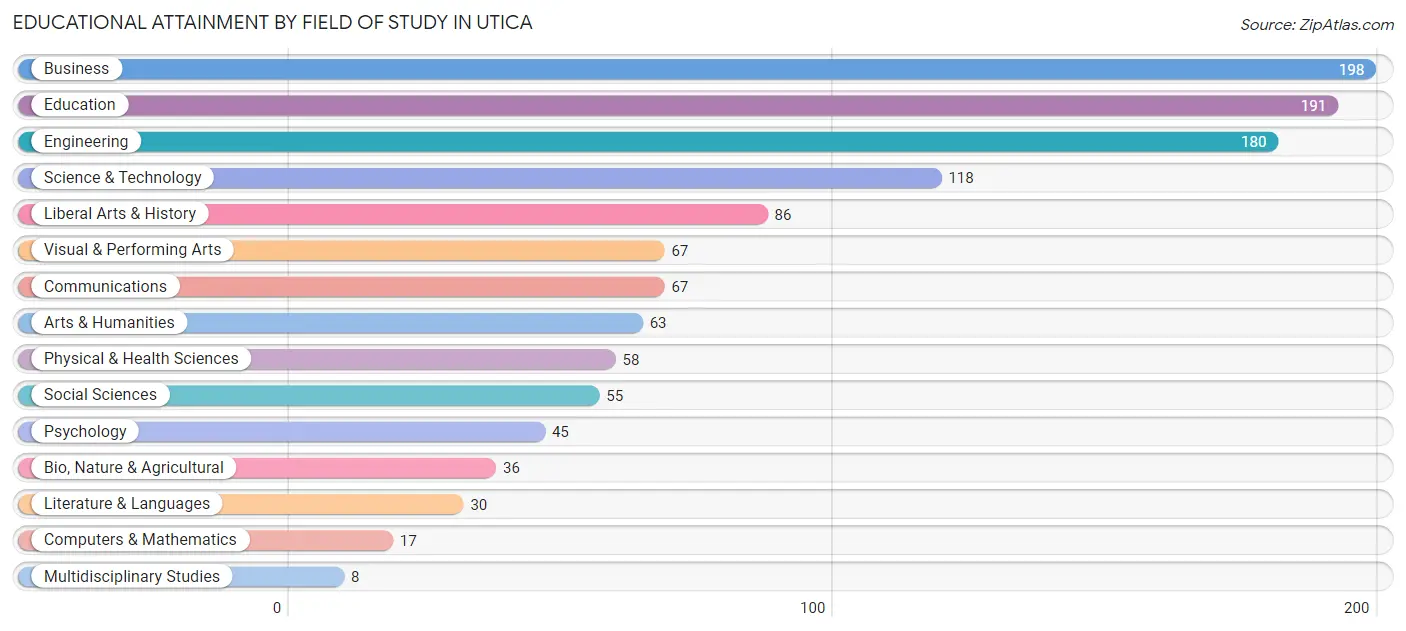
Educational Attainment by Field of Study in Utica
Business (198 | 16.2%), education (191 | 15.7%), engineering (180 | 14.8%), science & technology (118 | 9.7%), and liberal arts & history (86 | 7.0%) are the most common fields of study among 1,219 individuals in Utica who have obtained a bachelor's degree or higher.
| Field of Study | # Graduates | % Graduates |
| Computers & Mathematics | 17 | 1.4% |
| Bio, Nature & Agricultural | 36 | 2.9% |
| Physical & Health Sciences | 58 | 4.8% |
| Psychology | 45 | 3.7% |
| Social Sciences | 55 | 4.5% |
| Engineering | 180 | 14.8% |
| Multidisciplinary Studies | 8 | 0.7% |
| Science & Technology | 118 | 9.7% |
| Business | 198 | 16.2% |
| Education | 191 | 15.7% |
| Literature & Languages | 30 | 2.5% |
| Liberal Arts & History | 86 | 7.0% |
| Visual & Performing Arts | 67 | 5.5% |
| Communications | 67 | 5.5% |
| Arts & Humanities | 63 | 5.2% |
| Total | 1,219 | 100.0% |
Transportation & Commute in Utica
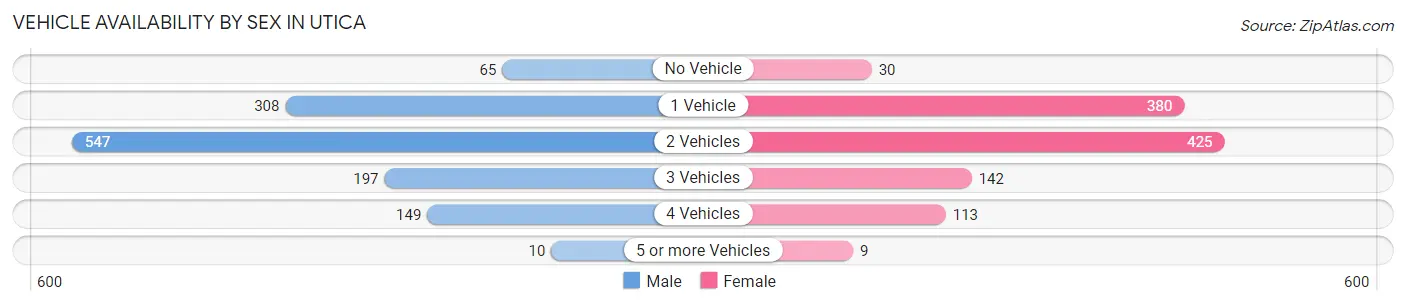
Vehicle Availability by Sex in Utica
The most prevalent vehicle ownership categories in Utica are males with 2 vehicles (547, accounting for 42.9%) and females with 2 vehicles (425, making up 49.8%).
| Vehicles Available | Male | Female |
| No Vehicle | 65 (5.1%) | 30 (2.7%) |
| 1 Vehicle | 308 (24.1%) | 380 (34.6%) |
| 2 Vehicles | 547 (42.9%) | 425 (38.7%) |
| 3 Vehicles | 197 (15.4%) | 142 (12.9%) |
| 4 Vehicles | 149 (11.7%) | 113 (10.3%) |
| 5 or more Vehicles | 10 (0.8%) | 9 (0.8%) |
| Total | 1,276 (100.0%) | 1,099 (100.0%) |
Commute Time in Utica
The most frequently occuring commute durations in Utica are 30 to 34 minutes (491 commuters, 22.6%), 20 to 24 minutes (401 commuters, 18.4%), and 15 to 19 minutes (301 commuters, 13.9%).
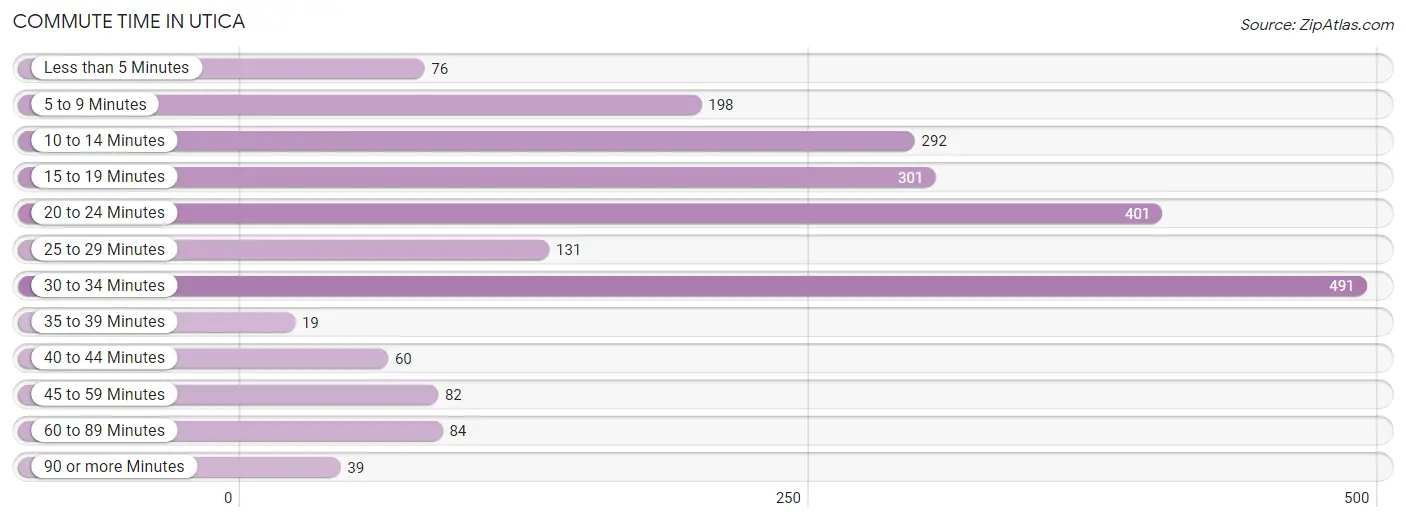
| Commute Time | # Commuters | % Commuters |
| Less than 5 Minutes | 76 | 3.5% |
| 5 to 9 Minutes | 198 | 9.1% |
| 10 to 14 Minutes | 292 | 13.4% |
| 15 to 19 Minutes | 301 | 13.9% |
| 20 to 24 Minutes | 401 | 18.4% |
| 25 to 29 Minutes | 131 | 6.0% |
| 30 to 34 Minutes | 491 | 22.6% |
| 35 to 39 Minutes | 19 | 0.9% |
| 40 to 44 Minutes | 60 | 2.8% |
| 45 to 59 Minutes | 82 | 3.8% |
| 60 to 89 Minutes | 84 | 3.9% |
| 90 or more Minutes | 39 | 1.8% |
Commute Time by Sex in Utica
The most common commute times in Utica are 20 to 24 minutes (274 commuters, 23.5%) for males and 30 to 34 minutes (258 commuters, 25.7%) for females.
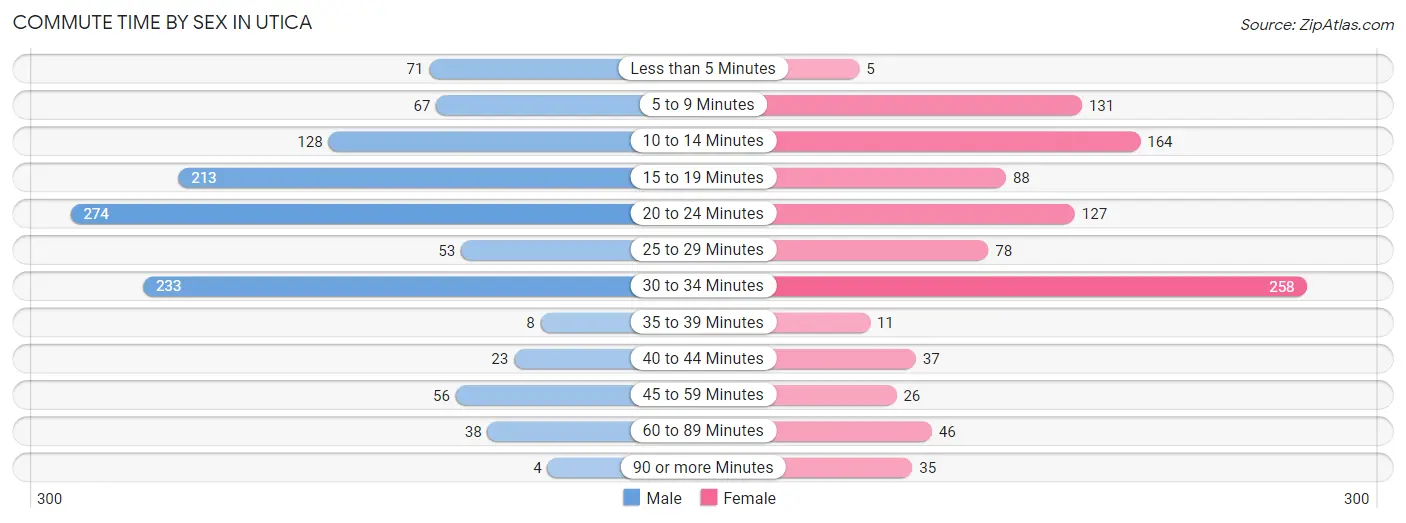
| Commute Time | Male | Female |
| Less than 5 Minutes | 71 (6.1%) | 5 (0.5%) |
| 5 to 9 Minutes | 67 (5.7%) | 131 (13.0%) |
| 10 to 14 Minutes | 128 (11.0%) | 164 (16.3%) |
| 15 to 19 Minutes | 213 (18.2%) | 88 (8.7%) |
| 20 to 24 Minutes | 274 (23.5%) | 127 (12.6%) |
| 25 to 29 Minutes | 53 (4.5%) | 78 (7.7%) |
| 30 to 34 Minutes | 233 (20.0%) | 258 (25.7%) |
| 35 to 39 Minutes | 8 (0.7%) | 11 (1.1%) |
| 40 to 44 Minutes | 23 (2.0%) | 37 (3.7%) |
| 45 to 59 Minutes | 56 (4.8%) | 26 (2.6%) |
| 60 to 89 Minutes | 38 (3.3%) | 46 (4.6%) |
| 90 or more Minutes | 4 (0.3%) | 35 (3.5%) |
Time of Departure to Work by Sex in Utica
The most frequent times of departure to work in Utica are 8:00 AM to 8:29 AM (172, 14.7%) for males and 8:00 AM to 8:29 AM (252, 25.1%) for females.
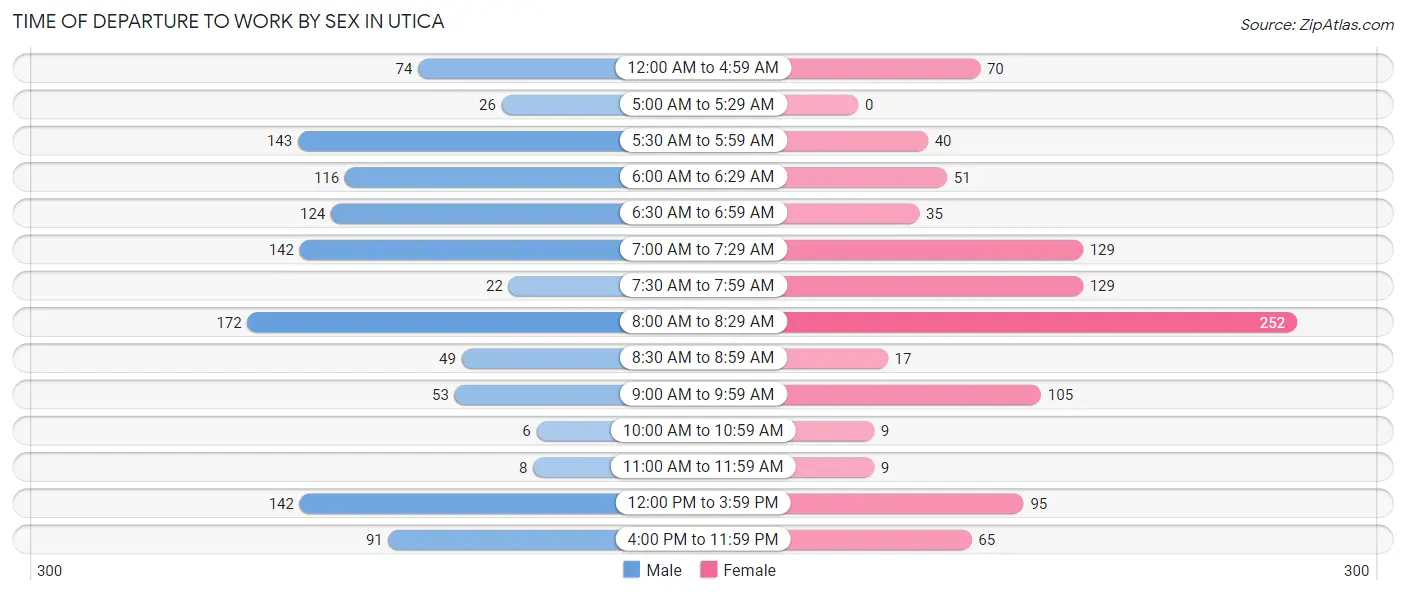
| Time of Departure | Male | Female |
| 12:00 AM to 4:59 AM | 74 (6.3%) | 70 (7.0%) |
| 5:00 AM to 5:29 AM | 26 (2.2%) | 0 (0.0%) |
| 5:30 AM to 5:59 AM | 143 (12.2%) | 40 (4.0%) |
| 6:00 AM to 6:29 AM | 116 (9.9%) | 51 (5.1%) |
| 6:30 AM to 6:59 AM | 124 (10.6%) | 35 (3.5%) |
| 7:00 AM to 7:29 AM | 142 (12.2%) | 129 (12.8%) |
| 7:30 AM to 7:59 AM | 22 (1.9%) | 129 (12.8%) |
| 8:00 AM to 8:29 AM | 172 (14.7%) | 252 (25.1%) |
| 8:30 AM to 8:59 AM | 49 (4.2%) | 17 (1.7%) |
| 9:00 AM to 9:59 AM | 53 (4.5%) | 105 (10.4%) |
| 10:00 AM to 10:59 AM | 6 (0.5%) | 9 (0.9%) |
| 11:00 AM to 11:59 AM | 8 (0.7%) | 9 (0.9%) |
| 12:00 PM to 3:59 PM | 142 (12.2%) | 95 (9.4%) |
| 4:00 PM to 11:59 PM | 91 (7.8%) | 65 (6.5%) |
| Total | 1,168 (100.0%) | 1,006 (100.0%) |
Housing Occupancy in Utica
Occupancy by Ownership in Utica
Of the total 2,529 dwellings in Utica, owner-occupied units account for 1,343 (53.1%), while renter-occupied units make up 1,186 (46.9%).
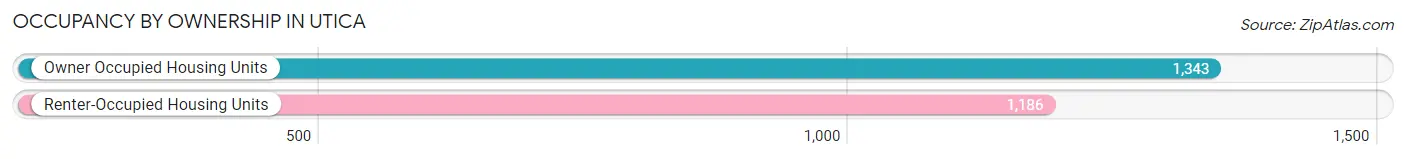
| Occupancy | # Housing Units | % Housing Units |
| Owner Occupied Housing Units | 1,343 | 53.1% |
| Renter-Occupied Housing Units | 1,186 | 46.9% |
| Total Occupied Housing Units | 2,529 | 100.0% |
Occupancy by Household Size in Utica
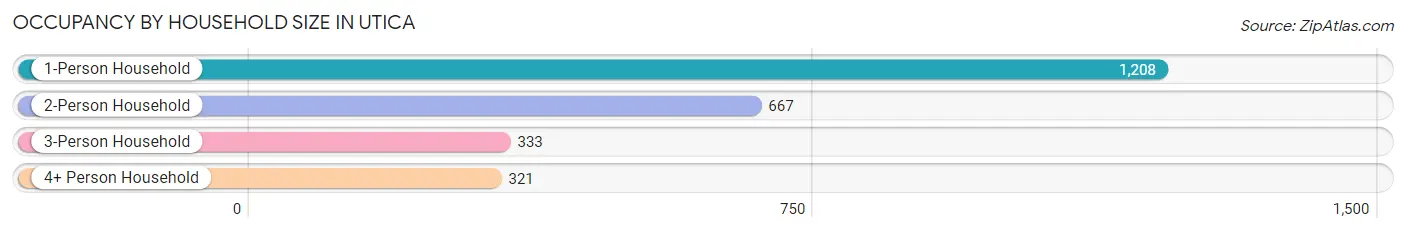
| Household Size | # Housing Units | % Housing Units |
| 1-Person Household | 1,208 | 47.8% |
| 2-Person Household | 667 | 26.4% |
| 3-Person Household | 333 | 13.2% |
| 4+ Person Household | 321 | 12.7% |
| Total Housing Units | 2,529 | 100.0% |
Occupancy by Ownership by Household Size in Utica
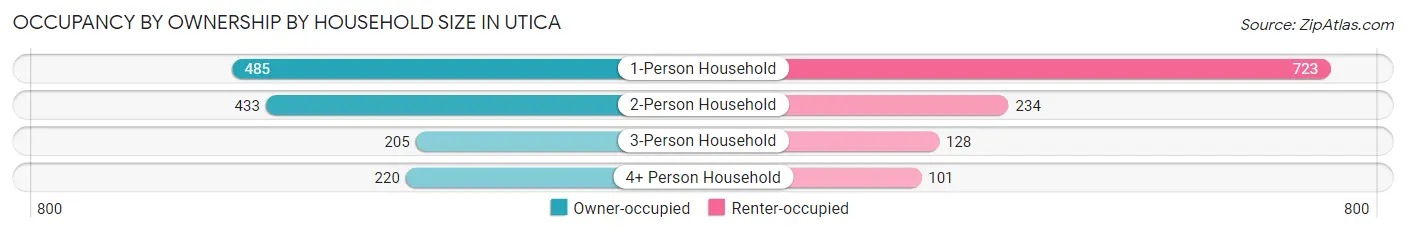
| Household Size | Owner-occupied | Renter-occupied |
| 1-Person Household | 485 (40.2%) | 723 (59.9%) |
| 2-Person Household | 433 (64.9%) | 234 (35.1%) |
| 3-Person Household | 205 (61.6%) | 128 (38.4%) |
| 4+ Person Household | 220 (68.5%) | 101 (31.5%) |
| Total Housing Units | 1,343 (53.1%) | 1,186 (46.9%) |
Occupancy by Educational Attainment in Utica
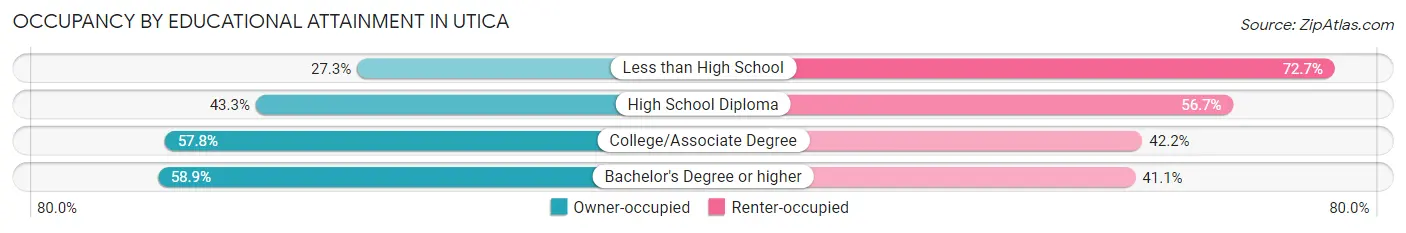
| Household Size | Owner-occupied | Renter-occupied |
| Less than High School | 30 (27.3%) | 80 (72.7%) |
| High School Diploma | 280 (43.3%) | 366 (56.7%) |
| College/Associate Degree | 569 (57.8%) | 416 (42.2%) |
| Bachelor's Degree or higher | 464 (58.9%) | 324 (41.1%) |
Occupancy by Age of Householder in Utica
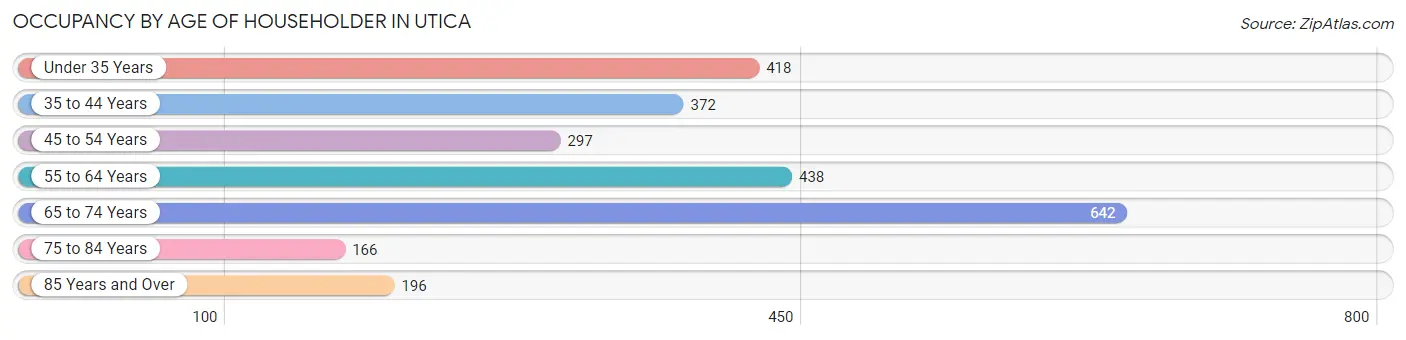
| Age Bracket | # Households | % Households |
| Under 35 Years | 418 | 16.5% |
| 35 to 44 Years | 372 | 14.7% |
| 45 to 54 Years | 297 | 11.7% |
| 55 to 64 Years | 438 | 17.3% |
| 65 to 74 Years | 642 | 25.4% |
| 75 to 84 Years | 166 | 6.6% |
| 85 Years and Over | 196 | 7.7% |
| Total | 2,529 | 100.0% |
Housing Finances in Utica
Median Income by Occupancy in Utica
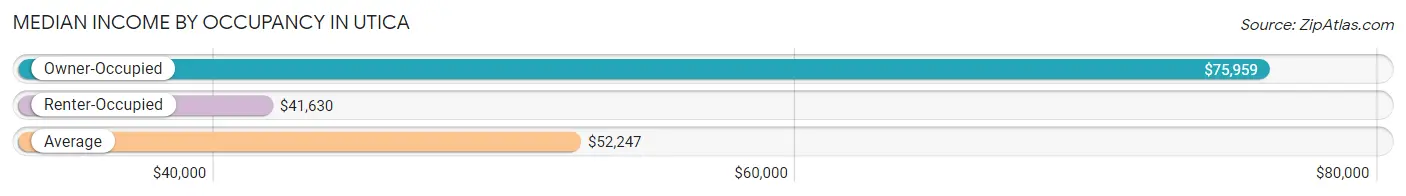
| Occupancy Type | # Households | Median Income |
| Owner-Occupied | 1,343 (53.1%) | $75,959 |
| Renter-Occupied | 1,186 (46.9%) | $41,630 |
| Average | 2,529 (100.0%) | $52,247 |
Occupancy by Householder Income Bracket in Utica
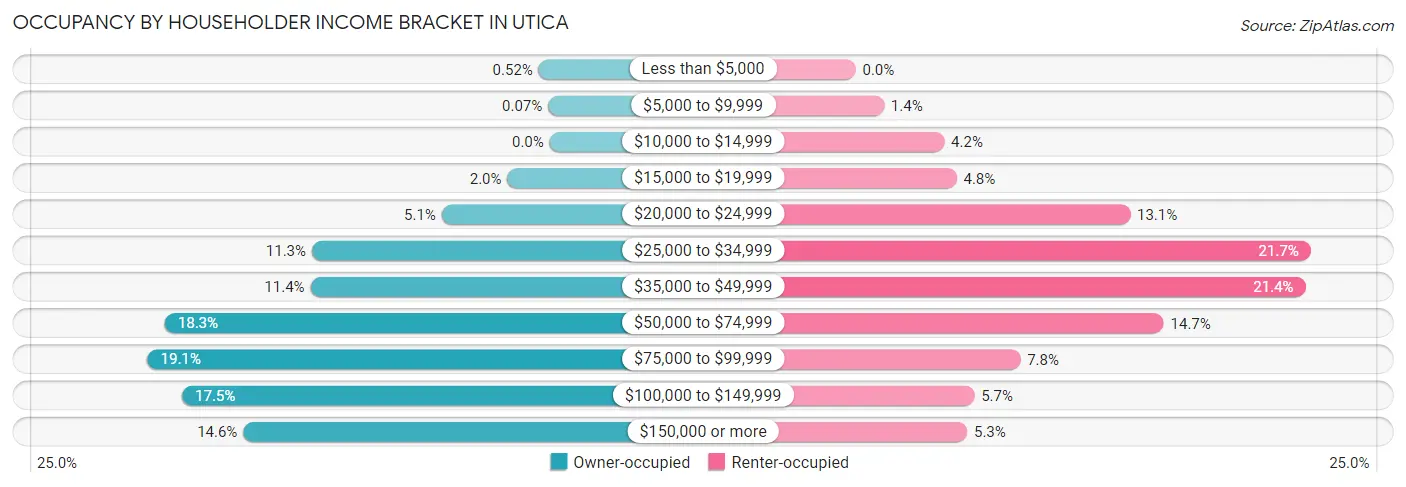
| Income Bracket | Owner-occupied | Renter-occupied |
| Less than $5,000 | 7 (0.5%) | 0 (0.0%) |
| $5,000 to $9,999 | 1 (0.1%) | 16 (1.3%) |
| $10,000 to $14,999 | 0 (0.0%) | 50 (4.2%) |
| $15,000 to $19,999 | 27 (2.0%) | 57 (4.8%) |
| $20,000 to $24,999 | 69 (5.1%) | 155 (13.1%) |
| $25,000 to $34,999 | 152 (11.3%) | 257 (21.7%) |
| $35,000 to $49,999 | 153 (11.4%) | 254 (21.4%) |
| $50,000 to $74,999 | 246 (18.3%) | 174 (14.7%) |
| $75,000 to $99,999 | 257 (19.1%) | 93 (7.8%) |
| $100,000 to $149,999 | 235 (17.5%) | 67 (5.7%) |
| $150,000 or more | 196 (14.6%) | 63 (5.3%) |
| Total | 1,343 (100.0%) | 1,186 (100.0%) |
Monthly Housing Cost Tiers in Utica
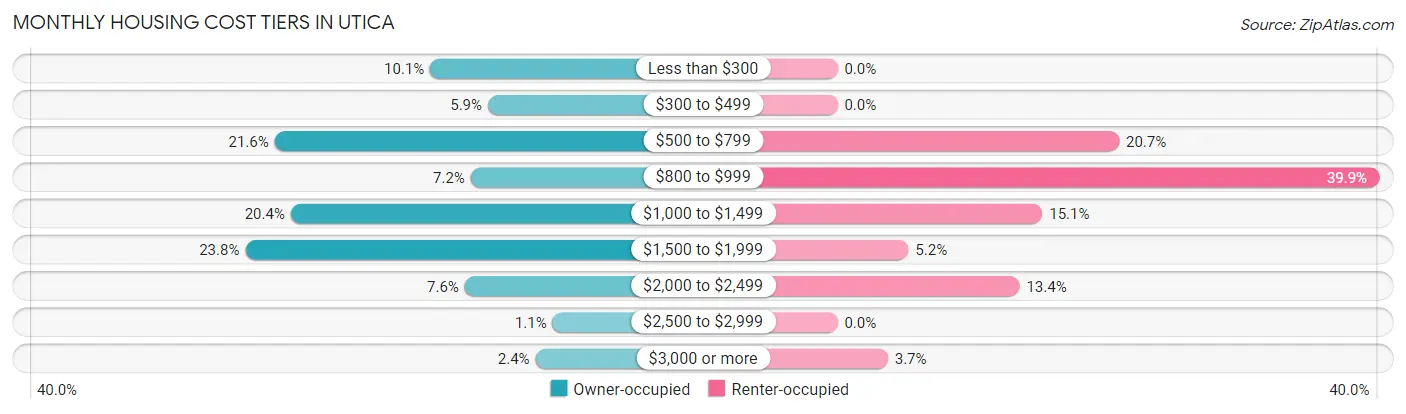
| Monthly Cost | Owner-occupied | Renter-occupied |
| Less than $300 | 136 (10.1%) | 0 (0.0%) |
| $300 to $499 | 79 (5.9%) | 0 (0.0%) |
| $500 to $799 | 290 (21.6%) | 246 (20.7%) |
| $800 to $999 | 96 (7.1%) | 473 (39.9%) |
| $1,000 to $1,499 | 274 (20.4%) | 179 (15.1%) |
| $1,500 to $1,999 | 319 (23.7%) | 62 (5.2%) |
| $2,000 to $2,499 | 102 (7.6%) | 159 (13.4%) |
| $2,500 to $2,999 | 15 (1.1%) | 0 (0.0%) |
| $3,000 or more | 32 (2.4%) | 44 (3.7%) |
| Total | 1,343 (100.0%) | 1,186 (100.0%) |
Physical Housing Characteristics in Utica
Housing Structures in Utica
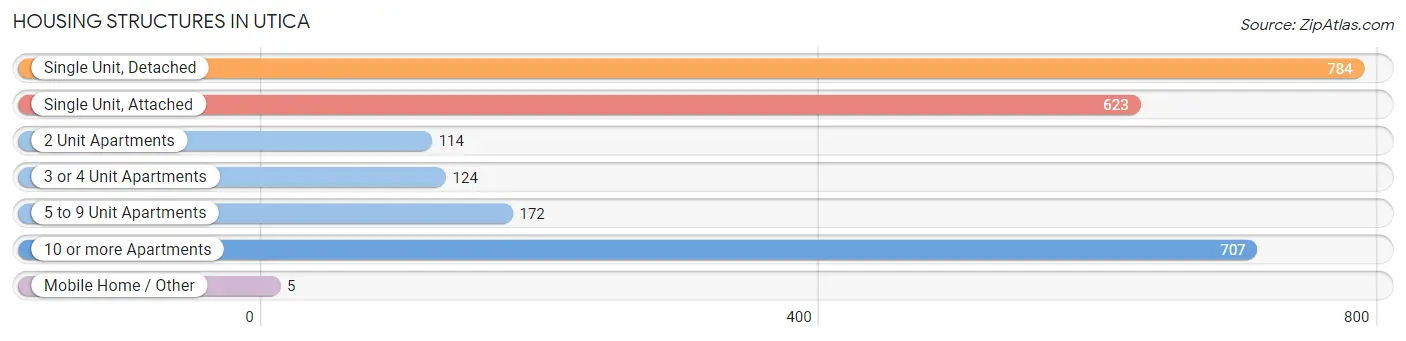
| Structure Type | # Housing Units | % Housing Units |
| Single Unit, Detached | 784 | 31.0% |
| Single Unit, Attached | 623 | 24.6% |
| 2 Unit Apartments | 114 | 4.5% |
| 3 or 4 Unit Apartments | 124 | 4.9% |
| 5 to 9 Unit Apartments | 172 | 6.8% |
| 10 or more Apartments | 707 | 28.0% |
| Mobile Home / Other | 5 | 0.2% |
| Total | 2,529 | 100.0% |
Housing Structures by Occupancy in Utica
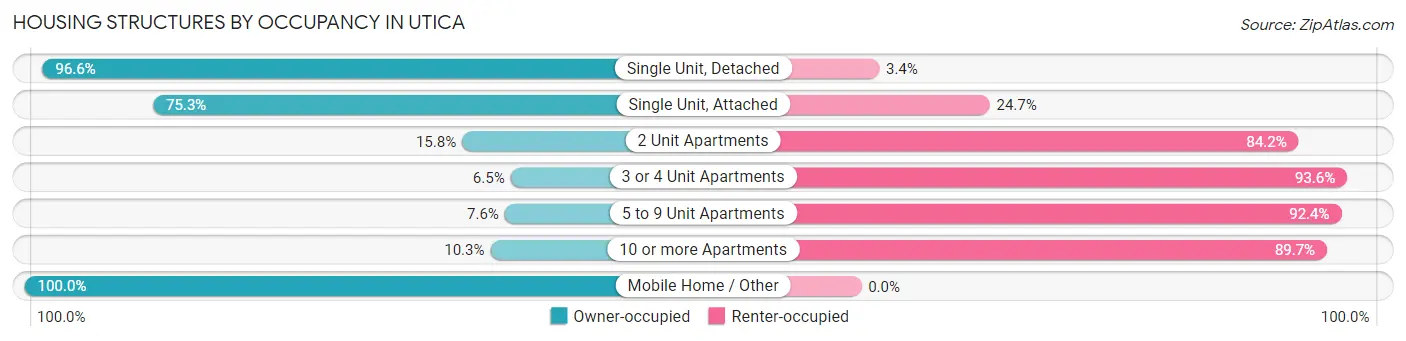
| Structure Type | Owner-occupied | Renter-occupied |
| Single Unit, Detached | 757 (96.6%) | 27 (3.4%) |
| Single Unit, Attached | 469 (75.3%) | 154 (24.7%) |
| 2 Unit Apartments | 18 (15.8%) | 96 (84.2%) |
| 3 or 4 Unit Apartments | 8 (6.5%) | 116 (93.5%) |
| 5 to 9 Unit Apartments | 13 (7.6%) | 159 (92.4%) |
| 10 or more Apartments | 73 (10.3%) | 634 (89.7%) |
| Mobile Home / Other | 5 (100.0%) | 0 (0.0%) |
| Total | 1,343 (53.1%) | 1,186 (46.9%) |
Housing Structures by Number of Rooms in Utica
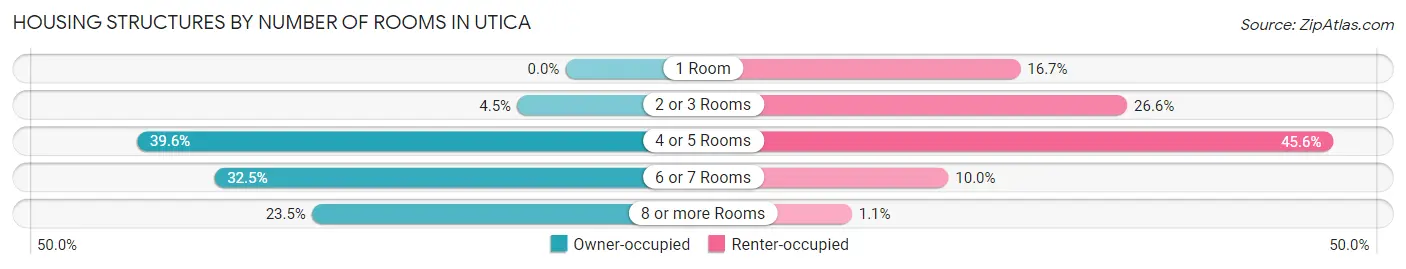
| Number of Rooms | Owner-occupied | Renter-occupied |
| 1 Room | 0 (0.0%) | 198 (16.7%) |
| 2 or 3 Rooms | 60 (4.5%) | 315 (26.6%) |
| 4 or 5 Rooms | 532 (39.6%) | 541 (45.6%) |
| 6 or 7 Rooms | 436 (32.5%) | 119 (10.0%) |
| 8 or more Rooms | 315 (23.4%) | 13 (1.1%) |
| Total | 1,343 (100.0%) | 1,186 (100.0%) |
Housing Structure by Heating Type in Utica
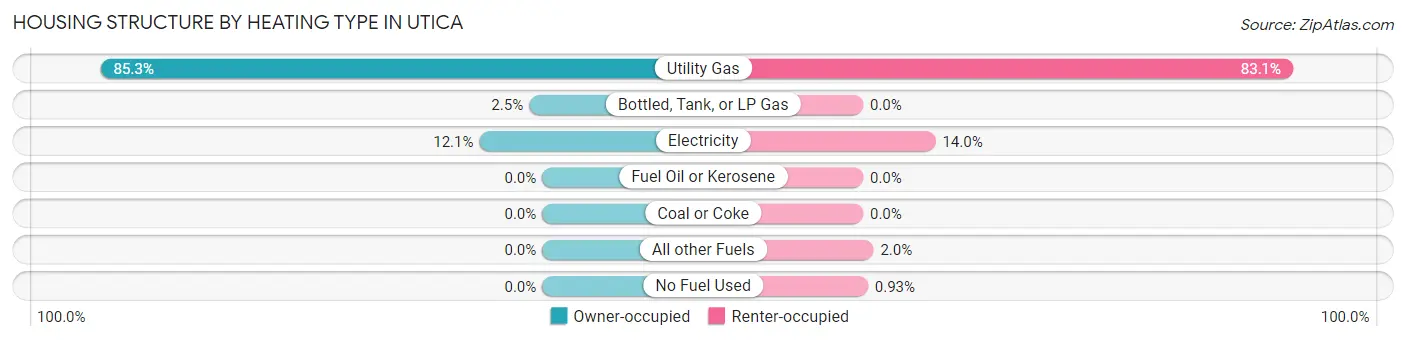
| Heating Type | Owner-occupied | Renter-occupied |
| Utility Gas | 1,146 (85.3%) | 985 (83.1%) |
| Bottled, Tank, or LP Gas | 34 (2.5%) | 0 (0.0%) |
| Electricity | 163 (12.1%) | 166 (14.0%) |
| Fuel Oil or Kerosene | 0 (0.0%) | 0 (0.0%) |
| Coal or Coke | 0 (0.0%) | 0 (0.0%) |
| All other Fuels | 0 (0.0%) | 24 (2.0%) |
| No Fuel Used | 0 (0.0%) | 11 (0.9%) |
| Total | 1,343 (100.0%) | 1,186 (100.0%) |
Household Vehicle Usage in Utica
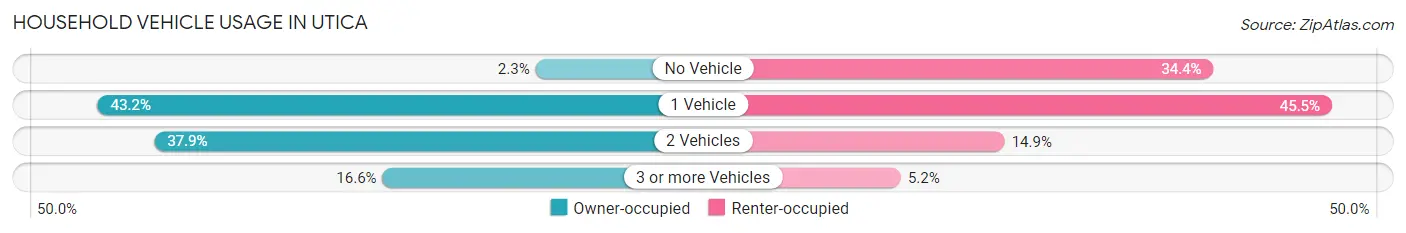
| Vehicles per Household | Owner-occupied | Renter-occupied |
| No Vehicle | 31 (2.3%) | 408 (34.4%) |
| 1 Vehicle | 580 (43.2%) | 539 (45.5%) |
| 2 Vehicles | 509 (37.9%) | 177 (14.9%) |
| 3 or more Vehicles | 223 (16.6%) | 62 (5.2%) |
| Total | 1,343 (100.0%) | 1,186 (100.0%) |
Real Estate & Mortgages in Utica
Real Estate and Mortgage Overview in Utica
| Characteristic | Without Mortgage | With Mortgage |
| Housing Units | 468 | 875 |
| Median Property Value | $92,200 | $213,300 |
| Median Household Income | $41,471 | $142 |
| Monthly Housing Costs | $549 | $32 |
| Real Estate Taxes | $2,660 | $16 |
Property Value by Mortgage Status in Utica
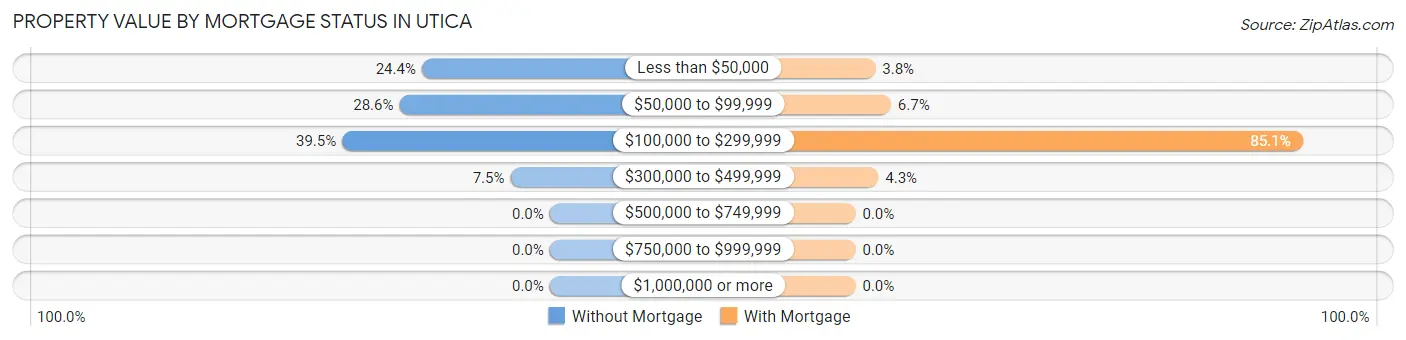
| Property Value | Without Mortgage | With Mortgage |
| Less than $50,000 | 114 (24.4%) | 33 (3.8%) |
| $50,000 to $99,999 | 134 (28.6%) | 59 (6.7%) |
| $100,000 to $299,999 | 185 (39.5%) | 745 (85.1%) |
| $300,000 to $499,999 | 35 (7.5%) | 38 (4.3%) |
| $500,000 to $749,999 | 0 (0.0%) | 0 (0.0%) |
| $750,000 to $999,999 | 0 (0.0%) | 0 (0.0%) |
| $1,000,000 or more | 0 (0.0%) | 0 (0.0%) |
| Total | 468 (100.0%) | 875 (100.0%) |
Household Income by Mortgage Status in Utica
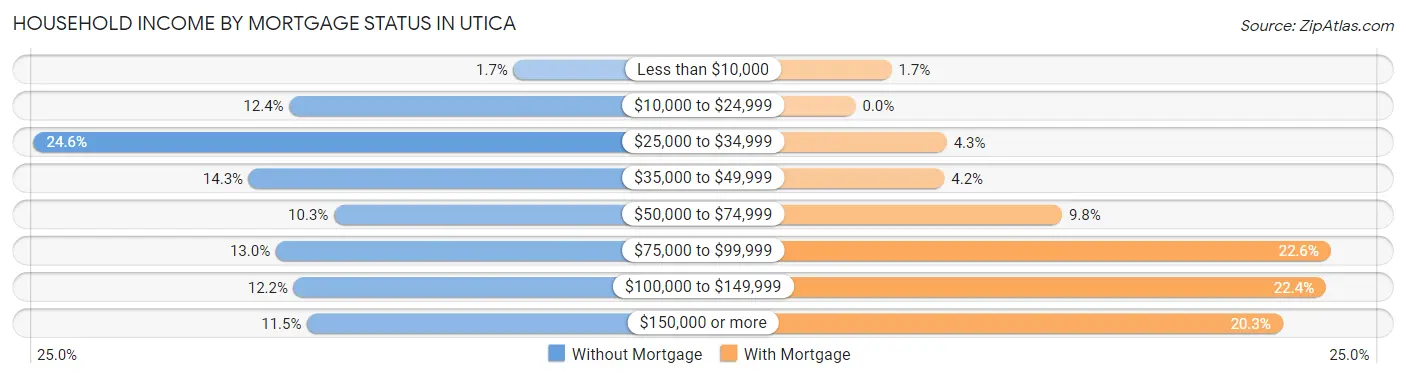
| Household Income | Without Mortgage | With Mortgage |
| Less than $10,000 | 8 (1.7%) | 15 (1.7%) |
| $10,000 to $24,999 | 58 (12.4%) | 0 (0.0%) |
| $25,000 to $34,999 | 115 (24.6%) | 38 (4.3%) |
| $35,000 to $49,999 | 67 (14.3%) | 37 (4.2%) |
| $50,000 to $74,999 | 48 (10.3%) | 86 (9.8%) |
| $75,000 to $99,999 | 61 (13.0%) | 198 (22.6%) |
| $100,000 to $149,999 | 57 (12.2%) | 196 (22.4%) |
| $150,000 or more | 54 (11.5%) | 178 (20.3%) |
| Total | 468 (100.0%) | 875 (100.0%) |
Property Value to Household Income Ratio in Utica
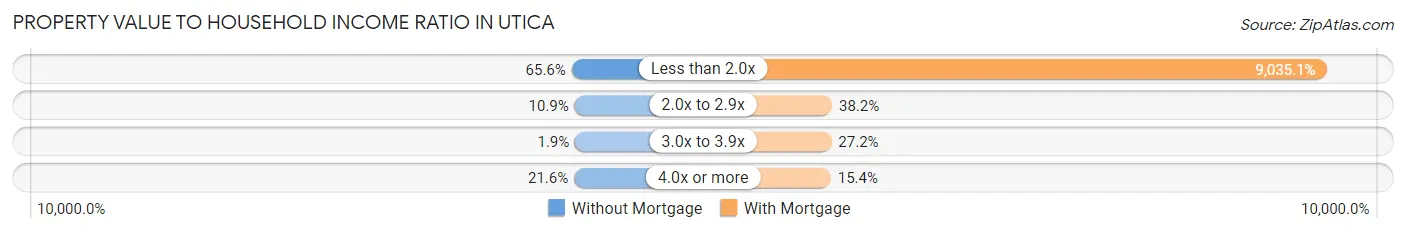
| Value-to-Income Ratio | Without Mortgage | With Mortgage |
| Less than 2.0x | 307 (65.6%) | 79,057 (9,035.1%) |
| 2.0x to 2.9x | 51 (10.9%) | 334 (38.2%) |
| 3.0x to 3.9x | 9 (1.9%) | 238 (27.2%) |
| 4.0x or more | 101 (21.6%) | 135 (15.4%) |
| Total | 468 (100.0%) | 875 (100.0%) |
Real Estate Taxes by Mortgage Status in Utica
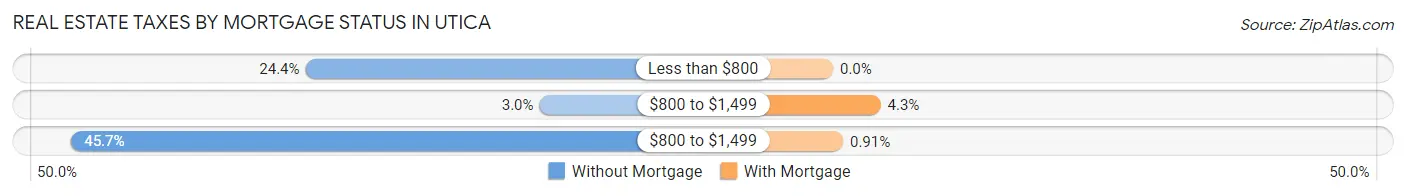
| Property Taxes | Without Mortgage | With Mortgage |
| Less than $800 | 114 (24.4%) | 0 (0.0%) |
| $800 to $1,499 | 14 (3.0%) | 38 (4.3%) |
| $800 to $1,499 | 214 (45.7%) | 8 (0.9%) |
| Total | 468 (100.0%) | 875 (100.0%) |
Health & Disability in Utica
Health Insurance Coverage by Age in Utica
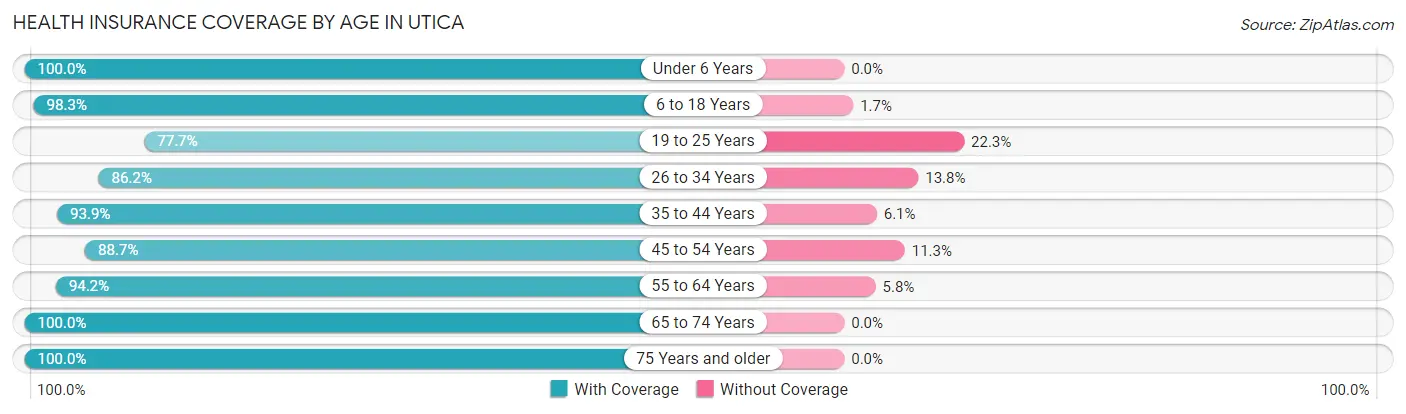
| Age Bracket | With Coverage | Without Coverage |
| Under 6 Years | 234 (100.0%) | 0 (0.0%) |
| 6 to 18 Years | 589 (98.3%) | 10 (1.7%) |
| 19 to 25 Years | 299 (77.7%) | 86 (22.3%) |
| 26 to 34 Years | 556 (86.2%) | 89 (13.8%) |
| 35 to 44 Years | 713 (93.9%) | 46 (6.1%) |
| 45 to 54 Years | 417 (88.7%) | 53 (11.3%) |
| 55 to 64 Years | 645 (94.2%) | 40 (5.8%) |
| 65 to 74 Years | 846 (100.0%) | 0 (0.0%) |
| 75 Years and older | 513 (100.0%) | 0 (0.0%) |
| Total | 4,812 (93.7%) | 324 (6.3%) |
Health Insurance Coverage by Citizenship Status in Utica
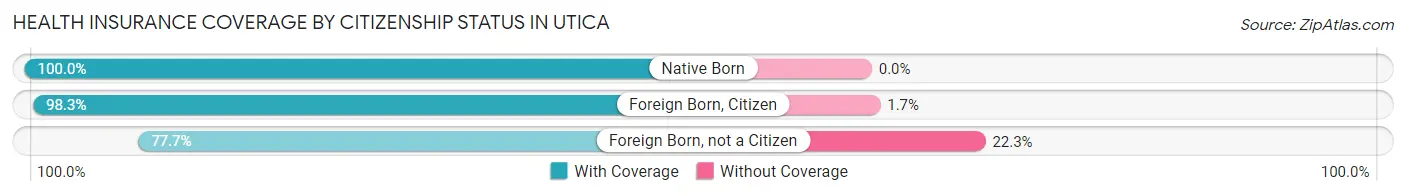
| Citizenship Status | With Coverage | Without Coverage |
| Native Born | 234 (100.0%) | 0 (0.0%) |
| Foreign Born, Citizen | 589 (98.3%) | 10 (1.7%) |
| Foreign Born, not a Citizen | 299 (77.7%) | 86 (22.3%) |
Health Insurance Coverage by Household Income in Utica
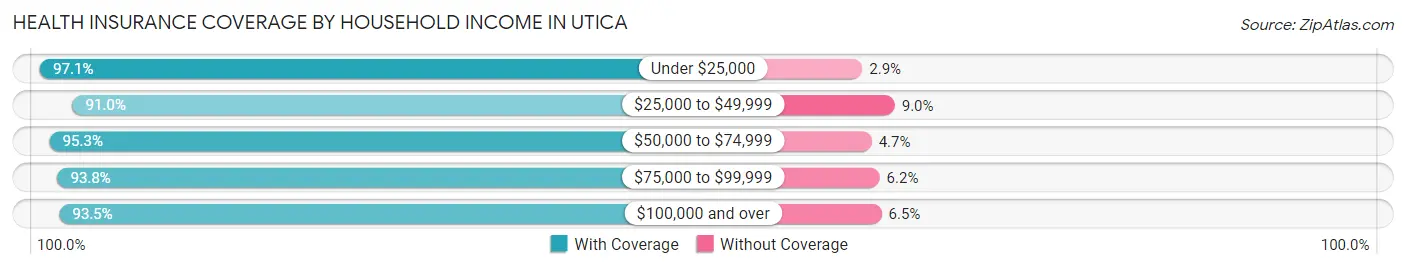
| Household Income | With Coverage | Without Coverage |
| Under $25,000 | 499 (97.1%) | 15 (2.9%) |
| $25,000 to $49,999 | 1,073 (91.0%) | 106 (9.0%) |
| $50,000 to $74,999 | 756 (95.3%) | 37 (4.7%) |
| $75,000 to $99,999 | 808 (93.8%) | 53 (6.2%) |
| $100,000 and over | 1,619 (93.5%) | 113 (6.5%) |
Public vs Private Health Insurance Coverage by Age in Utica
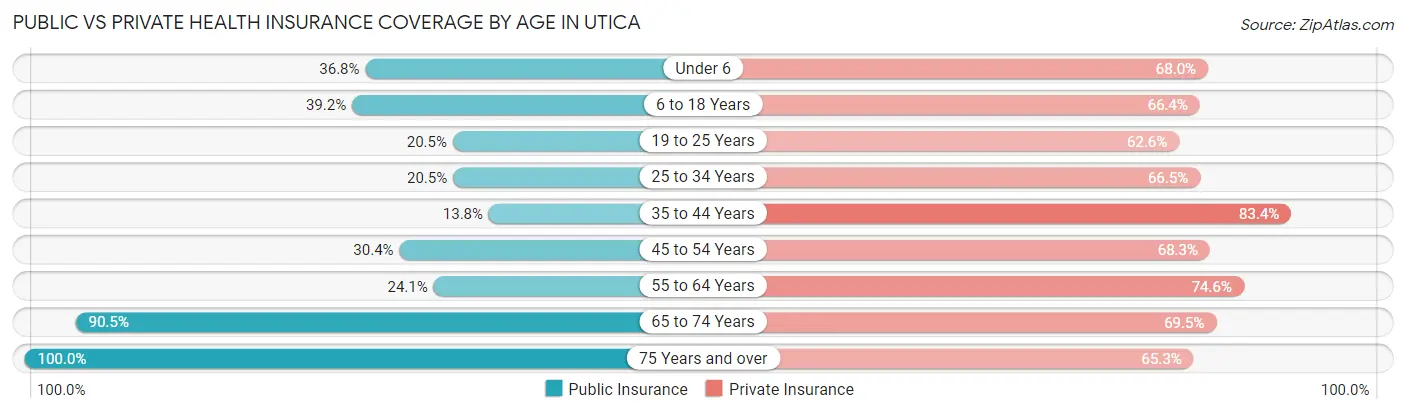
| Age Bracket | Public Insurance | Private Insurance |
| Under 6 | 86 (36.7%) | 159 (67.9%) |
| 6 to 18 Years | 235 (39.2%) | 398 (66.4%) |
| 19 to 25 Years | 79 (20.5%) | 241 (62.6%) |
| 25 to 34 Years | 132 (20.5%) | 429 (66.5%) |
| 35 to 44 Years | 105 (13.8%) | 633 (83.4%) |
| 45 to 54 Years | 143 (30.4%) | 321 (68.3%) |
| 55 to 64 Years | 165 (24.1%) | 511 (74.6%) |
| 65 to 74 Years | 766 (90.5%) | 588 (69.5%) |
| 75 Years and over | 513 (100.0%) | 335 (65.3%) |
| Total | 2,224 (43.3%) | 3,615 (70.4%) |
Disability Status by Sex by Age in Utica
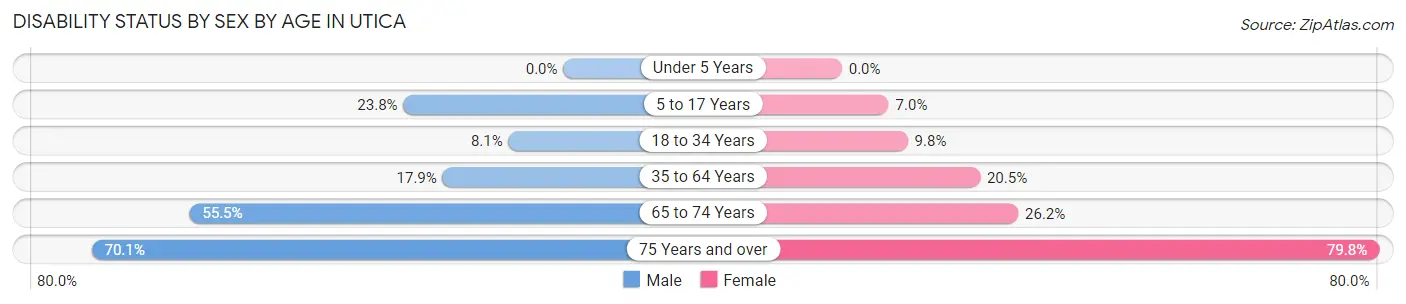
| Age Bracket | Male | Female |
| Under 5 Years | 0 (0.0%) | 0 (0.0%) |
| 5 to 17 Years | 76 (23.7%) | 16 (7.0%) |
| 18 to 34 Years | 52 (8.1%) | 44 (9.8%) |
| 35 to 64 Years | 165 (17.9%) | 204 (20.5%) |
| 65 to 74 Years | 211 (55.5%) | 122 (26.2%) |
| 75 Years and over | 117 (70.1%) | 276 (79.8%) |
Disability Class by Sex by Age in Utica
Disability Class: Hearing Difficulty
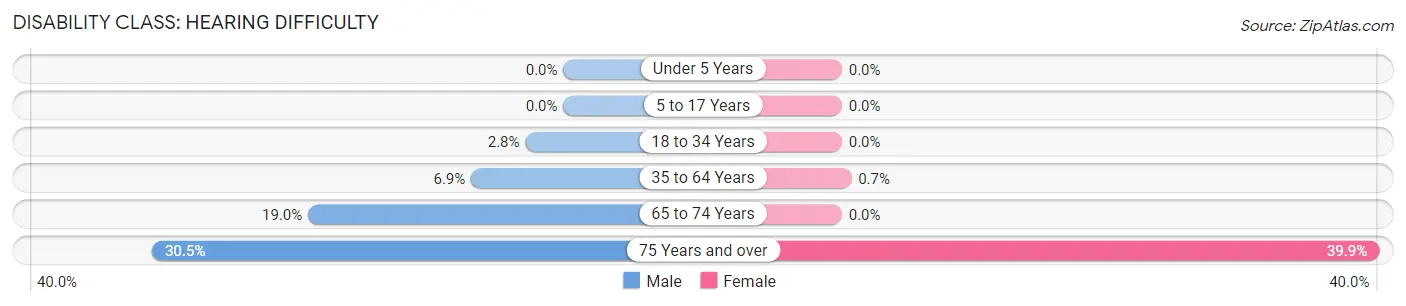
| Age Bracket | Male | Female |
| Under 5 Years | 0 (0.0%) | 0 (0.0%) |
| 5 to 17 Years | 0 (0.0%) | 0 (0.0%) |
| 18 to 34 Years | 18 (2.8%) | 0 (0.0%) |
| 35 to 64 Years | 63 (6.9%) | 7 (0.7%) |
| 65 to 74 Years | 72 (19.0%) | 0 (0.0%) |
| 75 Years and over | 51 (30.5%) | 138 (39.9%) |
Disability Class: Vision Difficulty
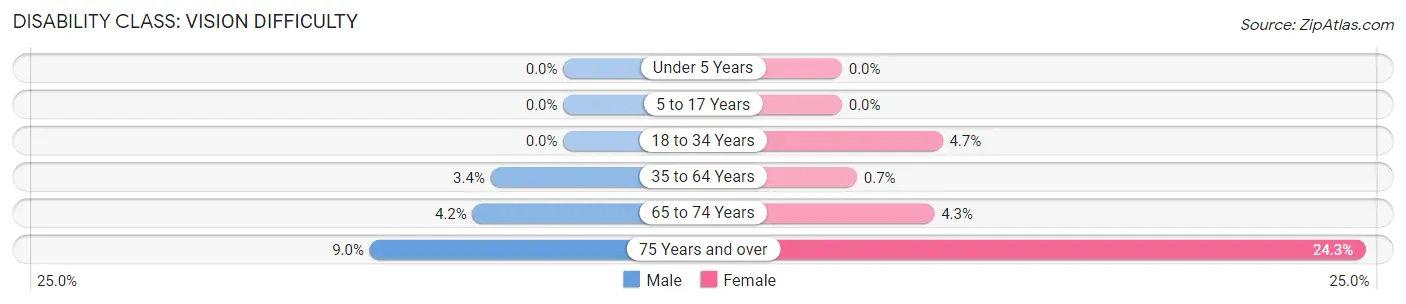
| Age Bracket | Male | Female |
| Under 5 Years | 0 (0.0%) | 0 (0.0%) |
| 5 to 17 Years | 0 (0.0%) | 0 (0.0%) |
| 18 to 34 Years | 0 (0.0%) | 21 (4.7%) |
| 35 to 64 Years | 31 (3.4%) | 7 (0.7%) |
| 65 to 74 Years | 16 (4.2%) | 20 (4.3%) |
| 75 Years and over | 15 (9.0%) | 84 (24.3%) |
Disability Class: Cognitive Difficulty
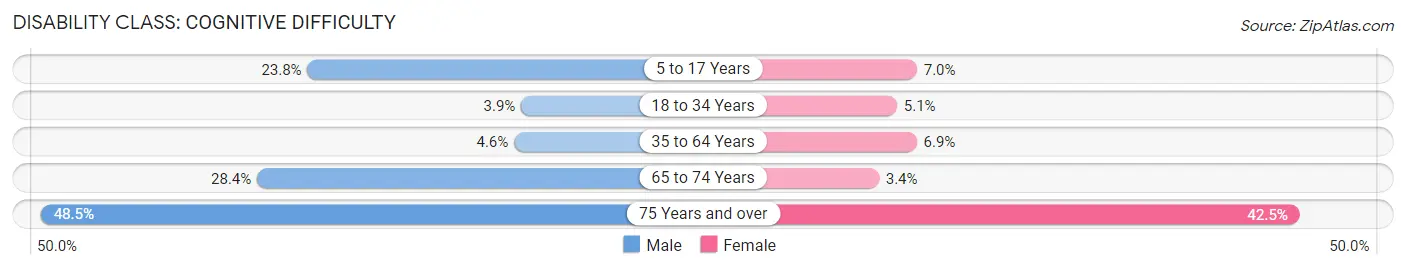
| Age Bracket | Male | Female |
| 5 to 17 Years | 76 (23.7%) | 16 (7.0%) |
| 18 to 34 Years | 25 (3.9%) | 23 (5.1%) |
| 35 to 64 Years | 42 (4.6%) | 69 (6.9%) |
| 65 to 74 Years | 108 (28.4%) | 16 (3.4%) |
| 75 Years and over | 81 (48.5%) | 147 (42.5%) |
Disability Class: Ambulatory Difficulty
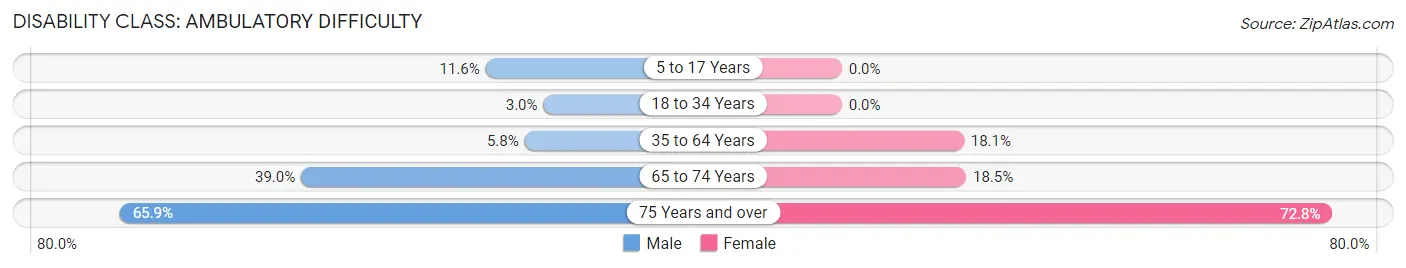
| Age Bracket | Male | Female |
| 5 to 17 Years | 37 (11.6%) | 0 (0.0%) |
| 18 to 34 Years | 19 (3.0%) | 0 (0.0%) |
| 35 to 64 Years | 53 (5.8%) | 180 (18.1%) |
| 65 to 74 Years | 148 (39.0%) | 86 (18.4%) |
| 75 Years and over | 110 (65.9%) | 252 (72.8%) |
Disability Class: Self-Care Difficulty
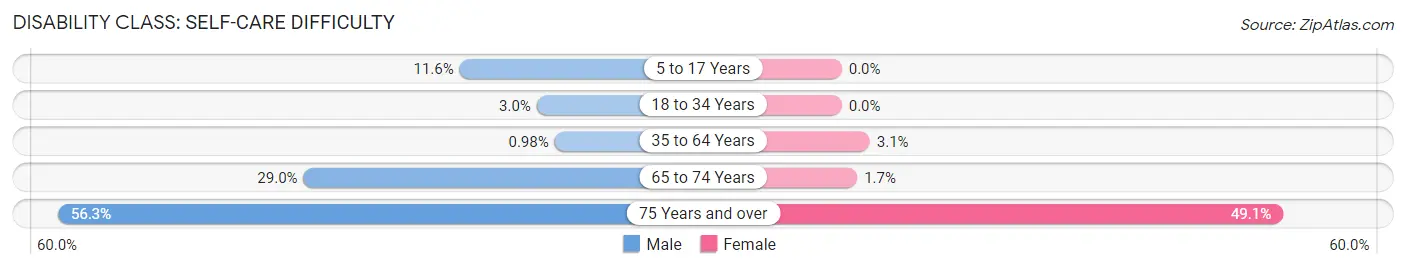
| Age Bracket | Male | Female |
| 5 to 17 Years | 37 (11.6%) | 0 (0.0%) |
| 18 to 34 Years | 19 (3.0%) | 0 (0.0%) |
| 35 to 64 Years | 9 (1.0%) | 31 (3.1%) |
| 65 to 74 Years | 110 (28.9%) | 8 (1.7%) |
| 75 Years and over | 94 (56.3%) | 170 (49.1%) |
Technology Access in Utica
Computing Device Access in Utica
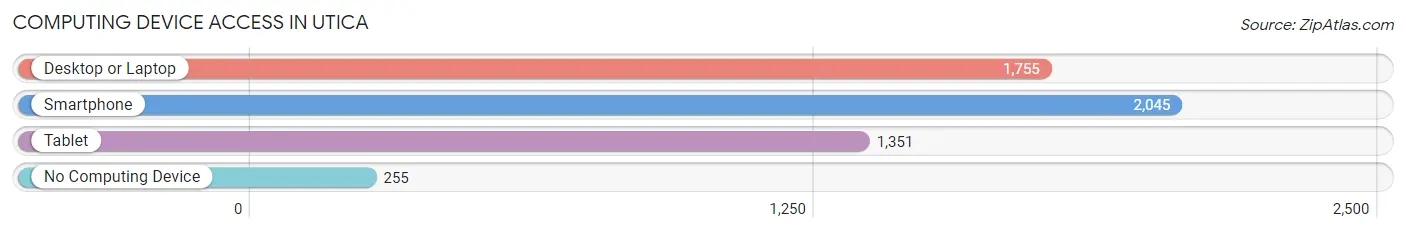
| Device Type | # Households | % Households |
| Desktop or Laptop | 1,755 | 69.4% |
| Smartphone | 2,045 | 80.9% |
| Tablet | 1,351 | 53.4% |
| No Computing Device | 255 | 10.1% |
| Total | 2,529 | 100.0% |
Internet Access in Utica
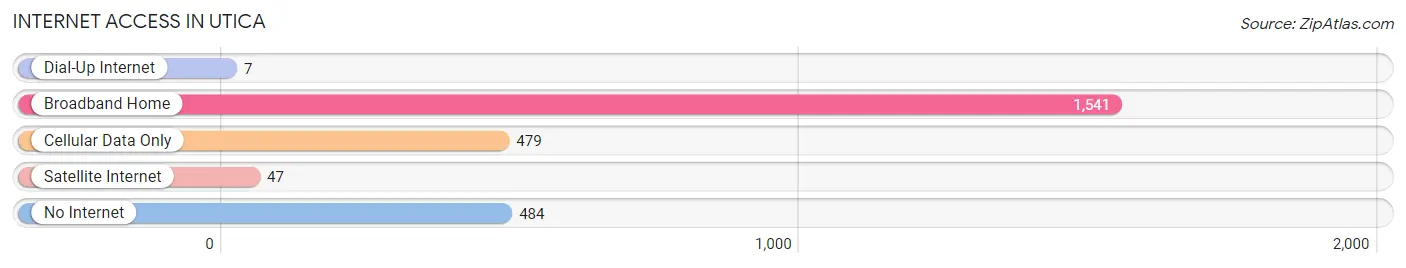
| Internet Type | # Households | % Households |
| Dial-Up Internet | 7 | 0.3% |
| Broadband Home | 1,541 | 60.9% |
| Cellular Data Only | 479 | 18.9% |
| Satellite Internet | 47 | 1.9% |
| No Internet | 484 | 19.1% |
| Total | 2,529 | 100.0% |
Utica Summary
Utica, Michigan is a small city located in Macomb County, Michigan. It is situated along the Clinton River and is part of the Metro Detroit area. The city has a population of 4,757 as of the 2010 census.
History
Utica was first settled in 1817 by a group of settlers from New York. The settlement was originally called Macomb Center, but was later changed to Utica in 1829. The name was chosen in honor of the city of Utica, New York. The city was incorporated in 1867.
Utica was a major center of industry in the 19th century. It was home to several factories, including a paper mill, a sawmill, a grist mill, and a woolen mill. The city also had a large number of stores and shops.
In the early 20th century, Utica was a popular tourist destination. It was home to several resorts, including the Utica Hotel and the Utica Beach Resort. The city also had a large amusement park, which was a popular destination for visitors.
Geography
Utica is located in Macomb County, Michigan. It is situated along the Clinton River, which flows through the city. The city is bordered by the cities of Sterling Heights to the north, Shelby Township to the east, and Macomb Township to the south.
The city has a total area of 4.2 square miles, all of which is land. The terrain is mostly flat, with some rolling hills. The city has several parks, including the Utica City Park, which is located along the Clinton River.
Economy
Utica is a small city with a diverse economy. The city is home to several manufacturing companies, including a paper mill, a sawmill, and a grist mill. The city also has a number of retail stores and shops.
The city is also home to several healthcare facilities, including the Utica Community Hospital and the Utica Medical Center. The city also has a number of educational institutions, including the Utica Public Schools and the Macomb Community College.
Demographics
As of the 2010 census, the population of Utica was 4,757. The racial makeup of the city was 87.3% White, 6.2% African American, 0.7% Native American, 1.2% Asian, 0.1% Pacific Islander, 1.7% from other races, and 2.9% from two or more races. Hispanic or Latino of any race were 4.3% of the population.
The median household income in Utica was $50,945, and the median family income was $60,917. The per capita income for the city was $25,945. About 8.3% of families and 10.2% of the population were below the poverty line, including 14.2% of those under age 18 and 6.2% of those age 65 or over.
Utica is a small city with a rich history and a diverse economy. The city has a number of manufacturing companies, healthcare facilities, and educational institutions. The city also has a number of parks and recreational areas. The population of Utica is diverse, with a mix of different racial and ethnic backgrounds.
Common Questions
What is Per Capita Income in Utica?
Per Capita income in Utica is $35,842.
What is the Median Family Income in Utica?
Median Family Income in Utica is $81,184.
What is the Median Household income in Utica?
Median Household Income in Utica is $52,247.
What is Income or Wage Gap in Utica?
Income or Wage Gap in Utica is 30.2%.
Women in Utica earn 69.8 cents for every dollar earned by a man.
What is Inequality or Gini Index in Utica?
Inequality or Gini Index in Utica is 0.40.
What is the Total Population of Utica?
Total Population of Utica is 5,195.
What is the Total Male Population of Utica?
Total Male Population of Utica is 2,512.
What is the Total Female Population of Utica?
Total Female Population of Utica is 2,683.
What is the Ratio of Males per 100 Females in Utica?
There are 93.63 Males per 100 Females in Utica.
What is the Ratio of Females per 100 Males in Utica?
There are 106.81 Females per 100 Males in Utica.
What is the Median Population Age in Utica?
Median Population Age in Utica is 44.6 Years.
What is the Average Family Size in Utica
Average Family Size in Utica is 2.9 People.
What is the Average Household Size in Utica
Average Household Size in Utica is 2.0 People.
How Large is the Labor Force in Utica?
There are 2,648 People in the Labor Forcein in Utica.
What is the Percentage of People in the Labor Force in Utica?
58.8% of People are in the Labor Force in Utica.
What is the Unemployment Rate in Utica?
Unemployment Rate in Utica is 4.2%.