Dearborn Heights, MI Map & Demographics
Dearborn Heights Map
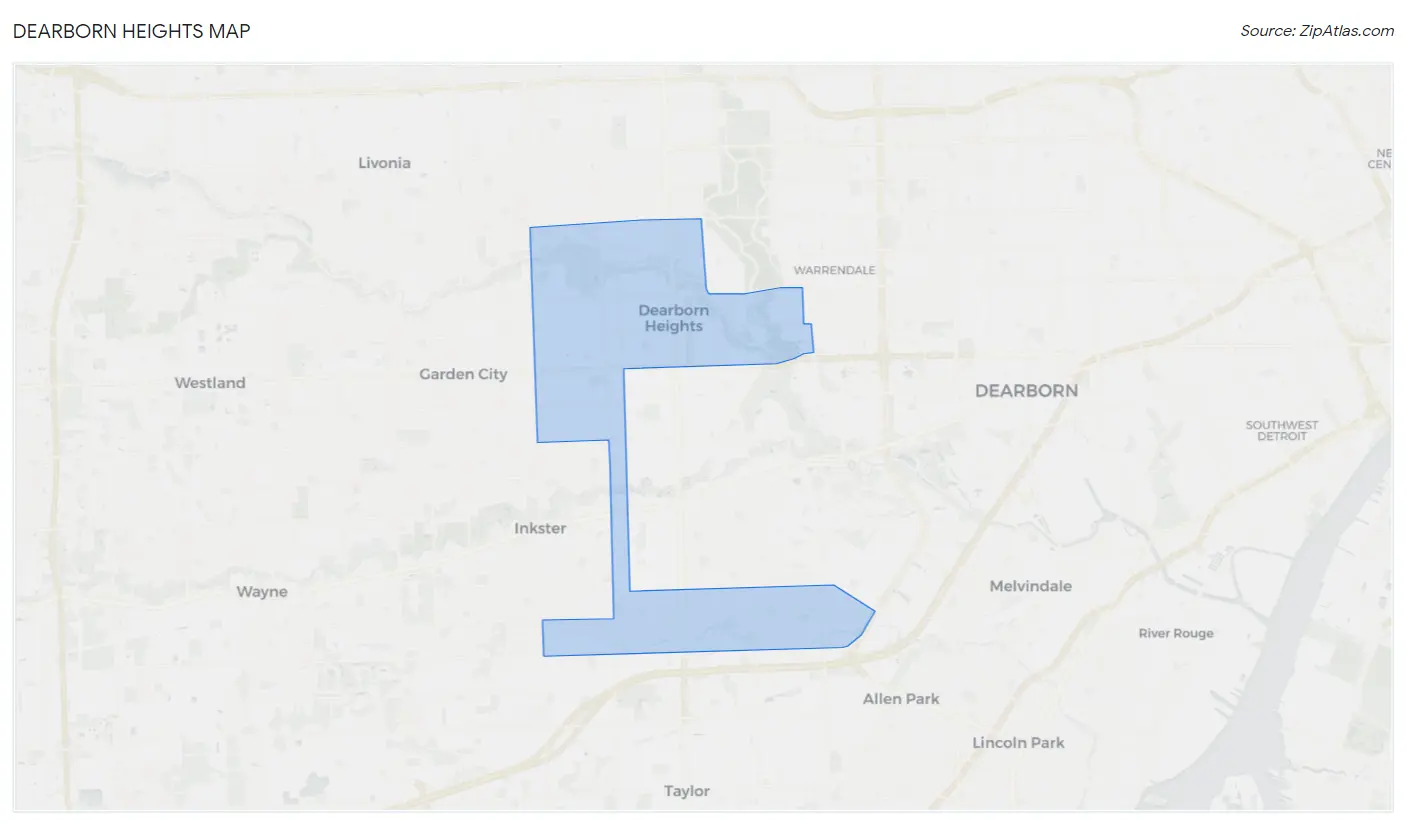
Dearborn Heights Overview
$28,115
PER CAPITA INCOME
$65,171
AVG FAMILY INCOME
$58,335
AVG HOUSEHOLD INCOME
32.7%
WAGE / INCOME GAP [ % ]
67.3¢/ $1
WAGE / INCOME GAP [ $ ]
$11,782
FAMILY INCOME DEFICIT
0.46
INEQUALITY / GINI INDEX
62,474
TOTAL POPULATION
30,592
MALE POPULATION
31,882
FEMALE POPULATION
95.95
MALES / 100 FEMALES
104.22
FEMALES / 100 MALES
36.0
MEDIAN AGE
3.5
AVG FAMILY SIZE
2.8
AVG HOUSEHOLD SIZE
27,303
LABOR FORCE [ PEOPLE ]
55.9%
PERCENT IN LABOR FORCE
8.2%
UNEMPLOYMENT RATE
Dearborn Heights Area Codes
Income in Dearborn Heights
Income Overview in Dearborn Heights
Per Capita Income in Dearborn Heights is $28,115, while median incomes of families and households are $65,171 and $58,335 respectively.
| Characteristic | Number | Measure |
| Per Capita Income | 62,474 | $28,115 |
| Median Family Income | 15,120 | $65,171 |
| Mean Family Income | 15,120 | $85,347 |
| Median Household Income | 22,070 | $58,335 |
| Mean Household Income | 22,070 | $75,901 |
| Income Deficit | 15,120 | $11,782 |
| Wage / Income Gap (%) | 62,474 | 32.72% |
| Wage / Income Gap ($) | 62,474 | 67.28¢ per $1 |
| Gini / Inequality Index | 62,474 | 0.46 |
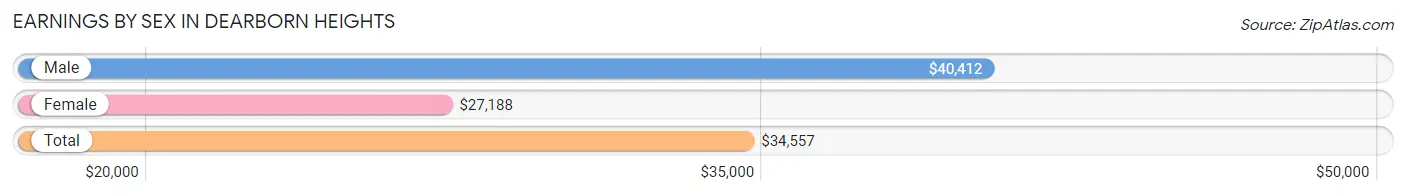
Earnings by Sex in Dearborn Heights
Average Earnings in Dearborn Heights are $34,557, $40,412 for men and $27,188 for women, a difference of 32.7%.
| Sex | Number | Average Earnings |
| Male | 15,398 (54.8%) | $40,412 |
| Female | 12,719 (45.2%) | $27,188 |
| Total | 28,117 (100.0%) | $34,557 |
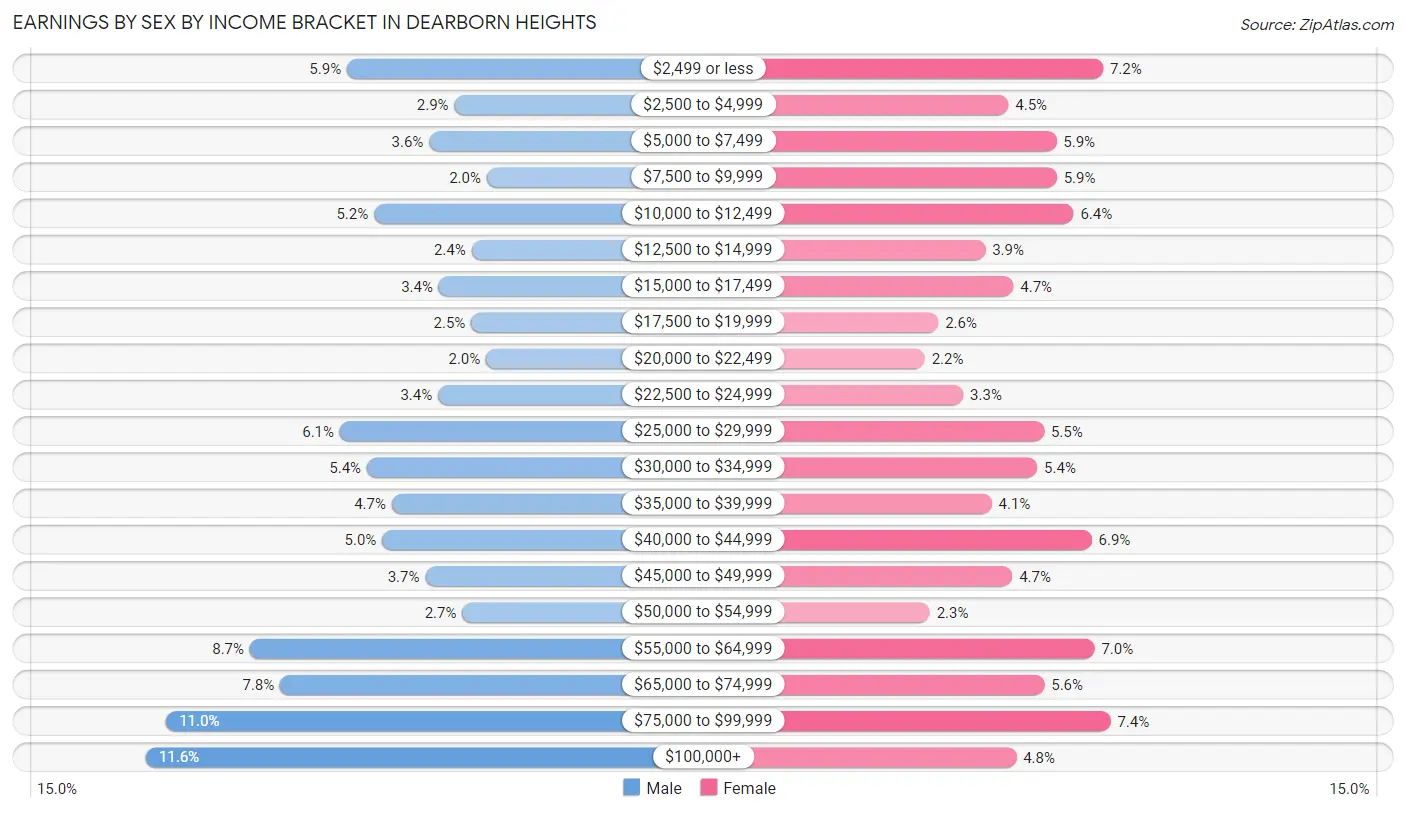
Earnings by Sex by Income Bracket in Dearborn Heights
The most common earnings brackets in Dearborn Heights are $100,000+ for men (1,784 | 11.6%) and $75,000 to $99,999 for women (943 | 7.4%).
| Income | Male | Female |
| $2,499 or less | 914 (5.9%) | 916 (7.2%) |
| $2,500 to $4,999 | 449 (2.9%) | 577 (4.5%) |
| $5,000 to $7,499 | 559 (3.6%) | 749 (5.9%) |
| $7,500 to $9,999 | 309 (2.0%) | 751 (5.9%) |
| $10,000 to $12,499 | 798 (5.2%) | 810 (6.4%) |
| $12,500 to $14,999 | 375 (2.4%) | 495 (3.9%) |
| $15,000 to $17,499 | 518 (3.4%) | 595 (4.7%) |
| $17,500 to $19,999 | 377 (2.5%) | 327 (2.6%) |
| $20,000 to $22,499 | 312 (2.0%) | 279 (2.2%) |
| $22,500 to $24,999 | 520 (3.4%) | 416 (3.3%) |
| $25,000 to $29,999 | 945 (6.1%) | 705 (5.5%) |
| $30,000 to $34,999 | 828 (5.4%) | 680 (5.3%) |
| $35,000 to $39,999 | 721 (4.7%) | 518 (4.1%) |
| $40,000 to $44,999 | 762 (5.0%) | 875 (6.9%) |
| $45,000 to $49,999 | 576 (3.7%) | 591 (4.6%) |
| $50,000 to $54,999 | 415 (2.7%) | 296 (2.3%) |
| $55,000 to $64,999 | 1,335 (8.7%) | 885 (7.0%) |
| $65,000 to $74,999 | 1,204 (7.8%) | 706 (5.6%) |
| $75,000 to $99,999 | 1,697 (11.0%) | 943 (7.4%) |
| $100,000+ | 1,784 (11.6%) | 605 (4.8%) |
| Total | 15,398 (100.0%) | 12,719 (100.0%) |
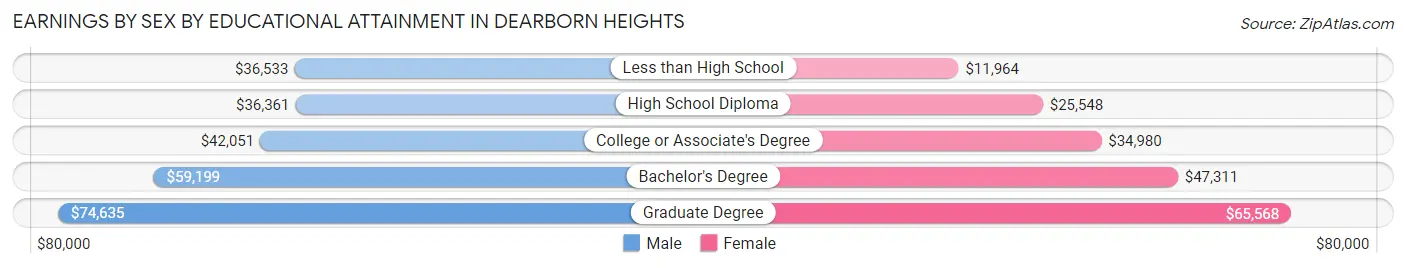
Earnings by Sex by Educational Attainment in Dearborn Heights
Average earnings in Dearborn Heights are $45,031 for men and $33,127 for women, a difference of 26.4%. Men with an educational attainment of graduate degree enjoy the highest average annual earnings of $74,635, while those with high school diploma education earn the least with $36,361. Women with an educational attainment of graduate degree earn the most with the average annual earnings of $65,568, while those with less than high school education have the smallest earnings of $11,964.
| Educational Attainment | Male Income | Female Income |
| Less than High School | $36,533 | $11,964 |
| High School Diploma | $36,361 | $25,548 |
| College or Associate's Degree | $42,051 | $34,980 |
| Bachelor's Degree | $59,199 | $47,311 |
| Graduate Degree | $74,635 | $65,568 |
| Total | $45,031 | $33,127 |
Family Income in Dearborn Heights
Family Income Brackets in Dearborn Heights
According to the Dearborn Heights family income data, there are 3,009 families falling into the $50,000 to $74,999 income range, which is the most common income bracket and makes up 19.9% of all families. Conversely, the $10,000 to $14,999 income bracket is the least frequent group with only 348 families (2.3%) belonging to this category.
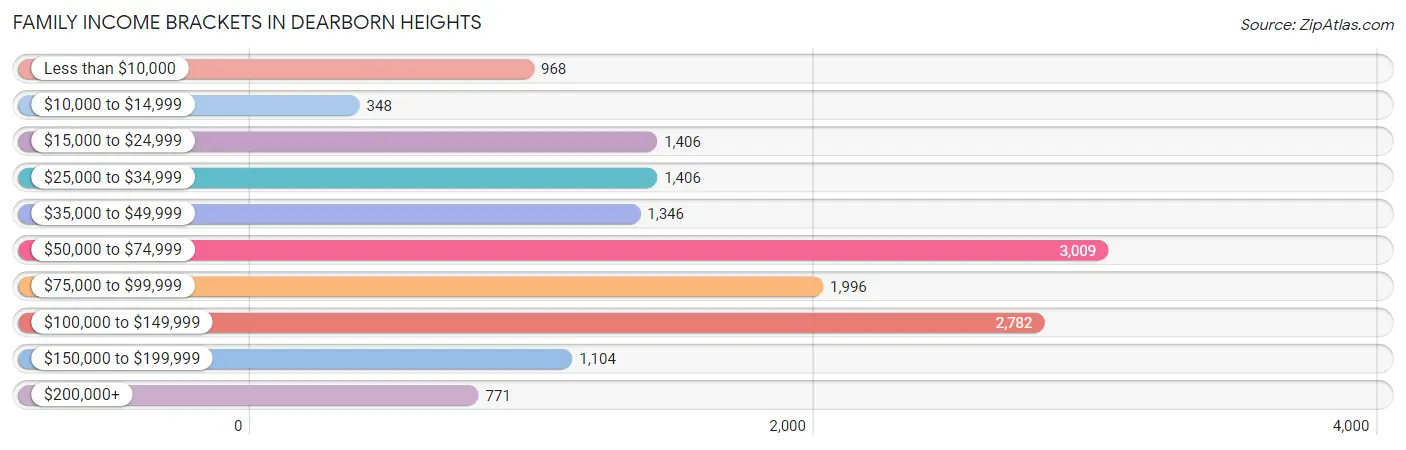
| Income Bracket | # Families | % Families |
| Less than $10,000 | 968 | 6.4% |
| $10,000 to $14,999 | 348 | 2.3% |
| $15,000 to $24,999 | 1,406 | 9.3% |
| $25,000 to $34,999 | 1,406 | 9.3% |
| $35,000 to $49,999 | 1,346 | 8.9% |
| $50,000 to $74,999 | 3,009 | 19.9% |
| $75,000 to $99,999 | 1,996 | 13.2% |
| $100,000 to $149,999 | 2,782 | 18.4% |
| $150,000 to $199,999 | 1,104 | 7.3% |
| $200,000+ | 771 | 5.1% |
Family Income by Famaliy Size in Dearborn Heights
4-person families (2,655 | 17.6%) account for the highest median family income in Dearborn Heights with $80,126 per family, while 2-person families (6,233 | 41.2%) have the highest median income of $30,830 per family member.
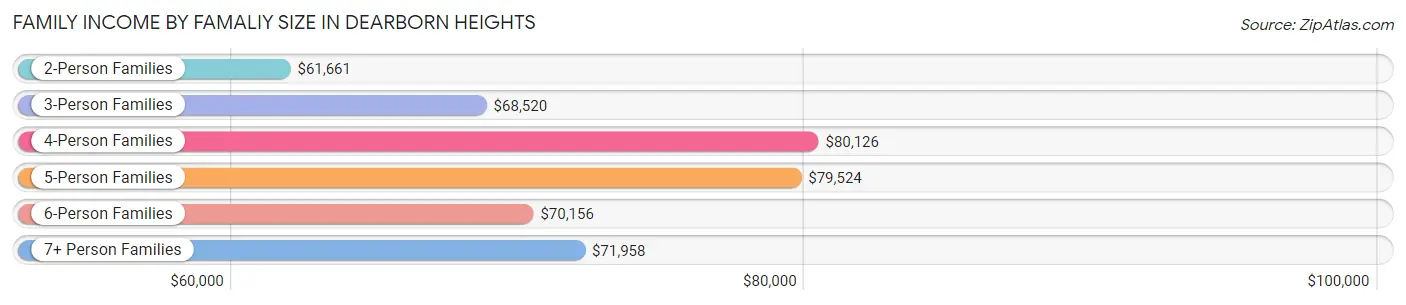
| Income Bracket | # Families | Median Income |
| 2-Person Families | 6,233 (41.2%) | $61,661 |
| 3-Person Families | 3,376 (22.3%) | $68,520 |
| 4-Person Families | 2,655 (17.6%) | $80,126 |
| 5-Person Families | 1,756 (11.6%) | $79,524 |
| 6-Person Families | 797 (5.3%) | $70,156 |
| 7+ Person Families | 303 (2.0%) | $71,958 |
| Total | 15,120 (100.0%) | $65,171 |
Family Income by Number of Earners in Dearborn Heights
The median family income in Dearborn Heights is $65,171, with families comprising 3+ earners (1,638) having the highest median family income of $133,571, while families with no earners (3,052) have the lowest median family income of $39,964, accounting for 10.8% and 20.2% of families, respectively.
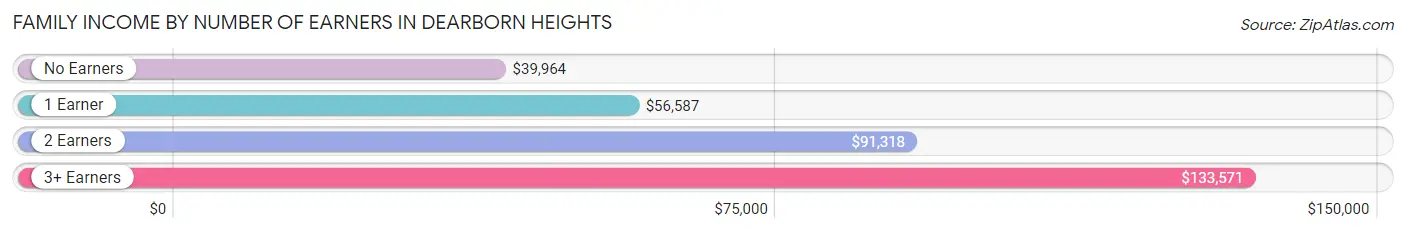
| Number of Earners | # Families | Median Income |
| No Earners | 3,052 (20.2%) | $39,964 |
| 1 Earner | 5,069 (33.5%) | $56,587 |
| 2 Earners | 5,361 (35.5%) | $91,318 |
| 3+ Earners | 1,638 (10.8%) | $133,571 |
| Total | 15,120 (100.0%) | $65,171 |
Household Income in Dearborn Heights
Household Income Brackets in Dearborn Heights
With 4,215 households falling in the category, the $50,000 to $74,999 income range is the most frequent in Dearborn Heights, accounting for 19.1% of all households. In contrast, only 883 households (4.0%) fall into the $200,000+ income bracket, making it the least populous group.
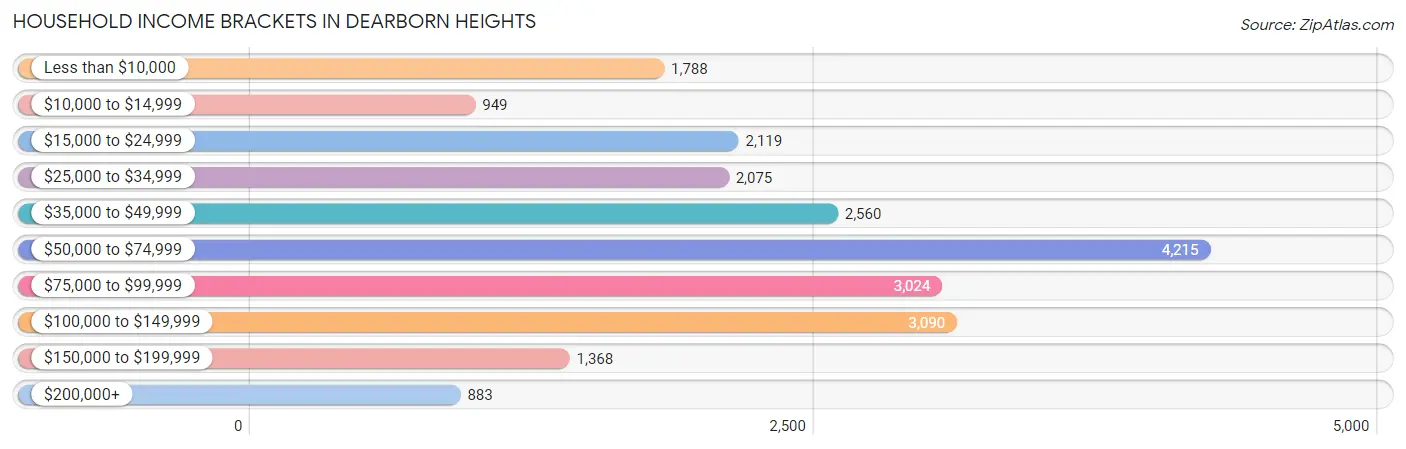
| Income Bracket | # Households | % Households |
| Less than $10,000 | 1,788 | 8.1% |
| $10,000 to $14,999 | 949 | 4.3% |
| $15,000 to $24,999 | 2,119 | 9.6% |
| $25,000 to $34,999 | 2,075 | 9.4% |
| $35,000 to $49,999 | 2,560 | 11.6% |
| $50,000 to $74,999 | 4,215 | 19.1% |
| $75,000 to $99,999 | 3,024 | 13.7% |
| $100,000 to $149,999 | 3,090 | 14.0% |
| $150,000 to $199,999 | 1,368 | 6.2% |
| $200,000+ | 883 | 4.0% |
Household Income by Householder Age in Dearborn Heights
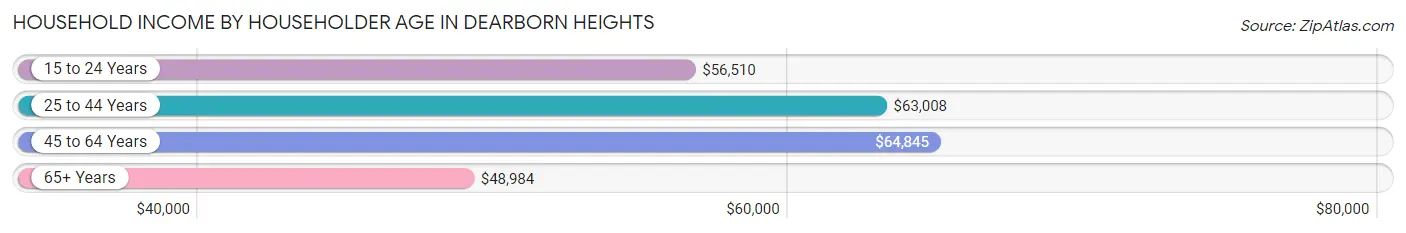
The median household income in Dearborn Heights is $58,335, with the highest median household income of $64,845 found in the 45 to 64 years age bracket for the primary householder. A total of 8,571 households (38.8%) fall into this category. Meanwhile, the 65+ years age bracket for the primary householder has the lowest median household income of $48,984, with 6,333 households (28.7%) in this group.
| Income Bracket | # Households | Median Income |
| 15 to 24 Years | 329 (1.5%) | $56,510 |
| 25 to 44 Years | 6,837 (31.0%) | $63,008 |
| 45 to 64 Years | 8,571 (38.8%) | $64,845 |
| 65+ Years | 6,333 (28.7%) | $48,984 |
| Total | 22,070 (100.0%) | $58,335 |
Poverty in Dearborn Heights
Income Below Poverty by Sex and Age in Dearborn Heights
With 20.0% poverty level for males and 23.4% for females among the residents of Dearborn Heights, 15 year old males and 12 to 14 year old females are the most vulnerable to poverty, with 221 males (57.0%) and 550 females (47.3%) in their respective age groups living below the poverty level.
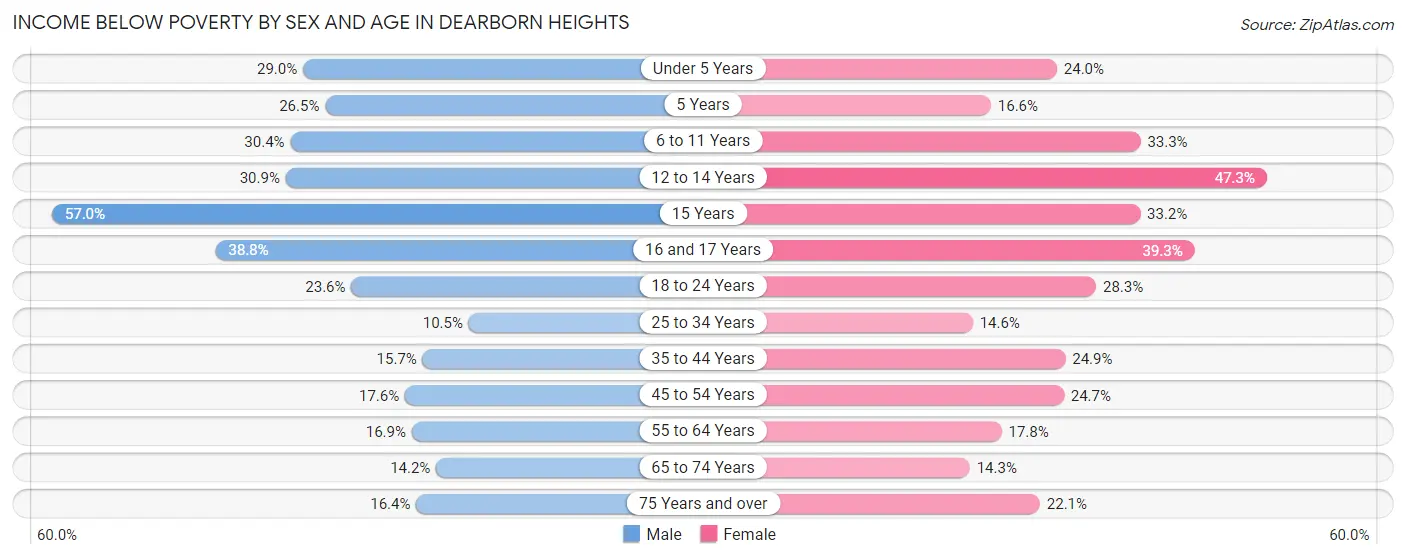
| Age Bracket | Male | Female |
| Under 5 Years | 550 (29.0%) | 530 (23.9%) |
| 5 Years | 196 (26.5%) | 81 (16.6%) |
| 6 to 11 Years | 659 (30.4%) | 793 (33.3%) |
| 12 to 14 Years | 427 (30.9%) | 550 (47.3%) |
| 15 Years | 221 (57.0%) | 188 (33.2%) |
| 16 and 17 Years | 377 (38.8%) | 400 (39.3%) |
| 18 to 24 Years | 622 (23.6%) | 712 (28.3%) |
| 25 to 34 Years | 485 (10.5%) | 709 (14.6%) |
| 35 to 44 Years | 500 (15.7%) | 854 (24.9%) |
| 45 to 54 Years | 682 (17.6%) | 876 (24.7%) |
| 55 to 64 Years | 677 (16.9%) | 750 (17.8%) |
| 65 to 74 Years | 390 (14.2%) | 378 (14.2%) |
| 75 Years and over | 263 (16.4%) | 558 (22.1%) |
| Total | 6,049 (20.0%) | 7,379 (23.4%) |
Income Above Poverty by Sex and Age in Dearborn Heights
According to the poverty statistics in Dearborn Heights, males aged 25 to 34 years and females aged 65 to 74 years are the age groups that are most secure financially, with 89.5% of males and 85.8% of females in these age groups living above the poverty line.
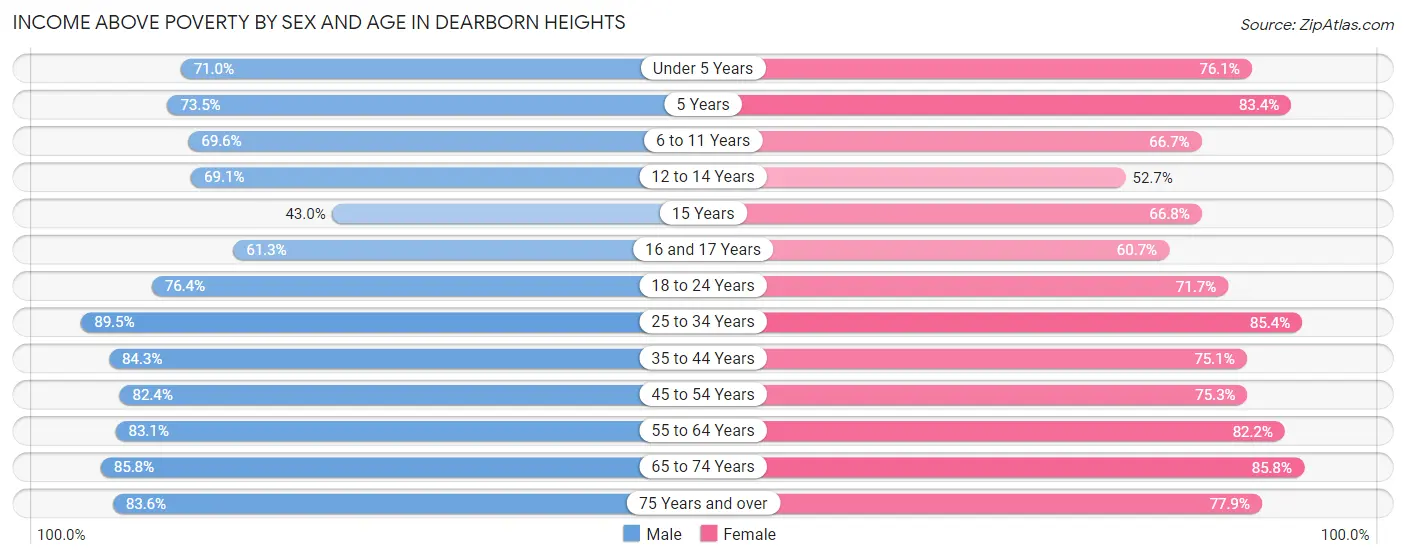
| Age Bracket | Male | Female |
| Under 5 Years | 1,347 (71.0%) | 1,683 (76.0%) |
| 5 Years | 543 (73.5%) | 407 (83.4%) |
| 6 to 11 Years | 1,509 (69.6%) | 1,591 (66.7%) |
| 12 to 14 Years | 954 (69.1%) | 612 (52.7%) |
| 15 Years | 167 (43.0%) | 378 (66.8%) |
| 16 and 17 Years | 596 (61.3%) | 618 (60.7%) |
| 18 to 24 Years | 2,012 (76.4%) | 1,802 (71.7%) |
| 25 to 34 Years | 4,121 (89.5%) | 4,153 (85.4%) |
| 35 to 44 Years | 2,690 (84.3%) | 2,577 (75.1%) |
| 45 to 54 Years | 3,187 (82.4%) | 2,667 (75.3%) |
| 55 to 64 Years | 3,334 (83.1%) | 3,467 (82.2%) |
| 65 to 74 Years | 2,364 (85.8%) | 2,275 (85.8%) |
| 75 Years and over | 1,343 (83.6%) | 1,971 (77.9%) |
| Total | 24,167 (80.0%) | 24,201 (76.6%) |
Income Below Poverty Among Married-Couple Families in Dearborn Heights
The poverty statistics for married-couple families in Dearborn Heights show that 15.1% or 1,613 of the total 10,673 families live below the poverty line. Families with 3 or 4 children have the highest poverty rate of 35.0%, comprising of 557 families. On the other hand, families with no children have the lowest poverty rate of 8.9%, which includes 507 families.
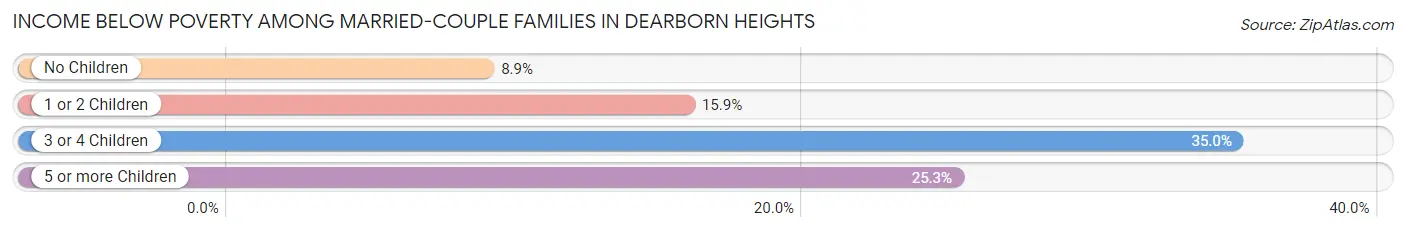
| Children | Above Poverty | Below Poverty |
| No Children | 5,178 (91.1%) | 507 (8.9%) |
| 1 or 2 Children | 2,780 (84.1%) | 526 (15.9%) |
| 3 or 4 Children | 1,034 (65.0%) | 557 (35.0%) |
| 5 or more Children | 68 (74.7%) | 23 (25.3%) |
| Total | 9,060 (84.9%) | 1,613 (15.1%) |
Income Below Poverty Among Single-Parent Households in Dearborn Heights
According to the poverty data in Dearborn Heights, 19.4% or 241 single-father households and 28.2% or 904 single-mother households are living below the poverty line. Among single-father households, those with 3 or 4 children have the highest poverty rate, with 40 households (100.0%) experiencing poverty. Likewise, among single-mother households, those with 5 or more children have the highest poverty rate, with 53 households (86.9%) falling below the poverty line.
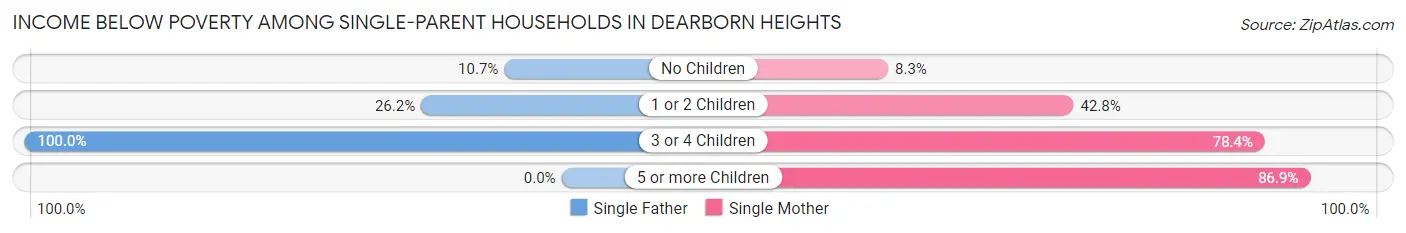
| Children | Single Father | Single Mother |
| No Children | 78 (10.7%) | 133 (8.3%) |
| 1 or 2 Children | 123 (26.2%) | 587 (42.8%) |
| 3 or 4 Children | 40 (100.0%) | 131 (78.4%) |
| 5 or more Children | 0 (0.0%) | 53 (86.9%) |
| Total | 241 (19.4%) | 904 (28.2%) |
Income Below Poverty Among Married-Couple vs Single-Parent Households in Dearborn Heights
The poverty data for Dearborn Heights shows that 1,613 of the married-couple family households (15.1%) and 1,145 of the single-parent households (25.8%) are living below the poverty level. Within the married-couple family households, those with 3 or 4 children have the highest poverty rate, with 557 households (35.0%) falling below the poverty line. Among the single-parent households, those with 5 or more children have the highest poverty rate, with 53 household (86.9%) living below poverty.
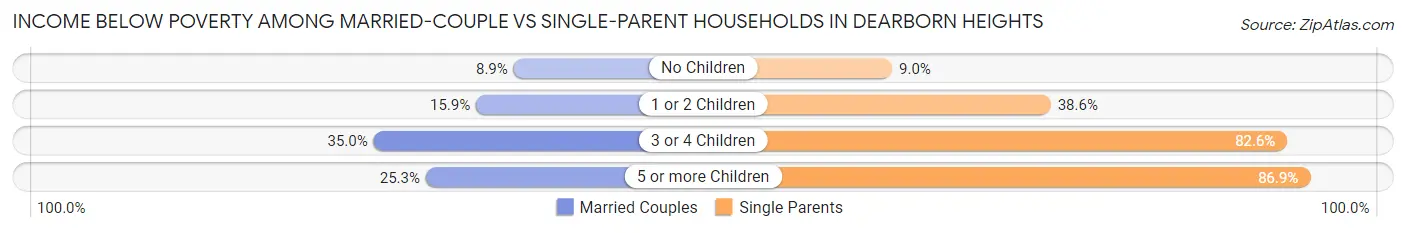
| Children | Married-Couple Families | Single-Parent Households |
| No Children | 507 (8.9%) | 211 (9.0%) |
| 1 or 2 Children | 526 (15.9%) | 710 (38.6%) |
| 3 or 4 Children | 557 (35.0%) | 171 (82.6%) |
| 5 or more Children | 23 (25.3%) | 53 (86.9%) |
| Total | 1,613 (15.1%) | 1,145 (25.8%) |
Race in Dearborn Heights
The most populous races in Dearborn Heights are White / Caucasian (52,378 | 83.8%), Black / African American (5,296 | 8.5%), and Two or more Races (3,198 | 5.1%).
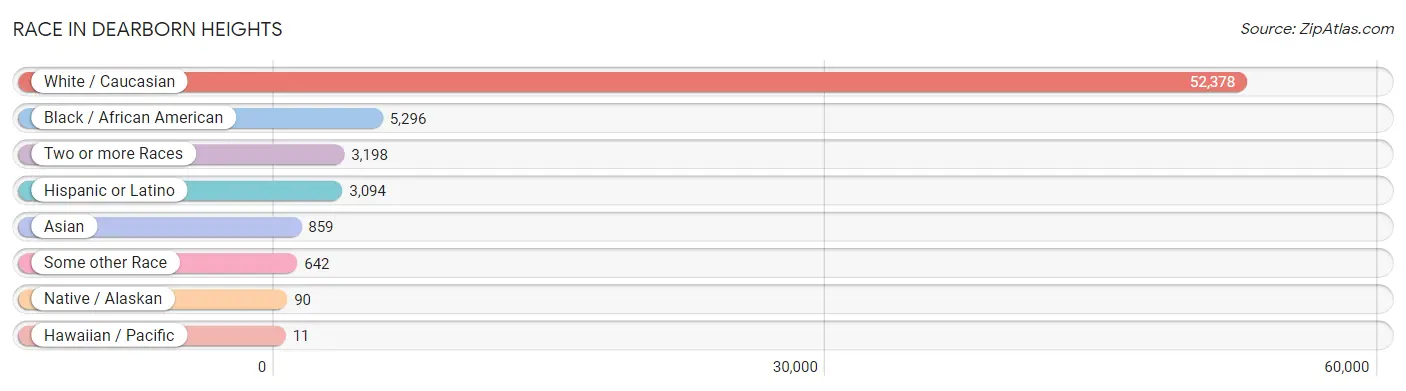
| Race | # Population | % Population |
| Asian | 859 | 1.4% |
| Black / African American | 5,296 | 8.5% |
| Hawaiian / Pacific | 11 | 0.0% |
| Hispanic or Latino | 3,094 | 5.0% |
| Native / Alaskan | 90 | 0.1% |
| White / Caucasian | 52,378 | 83.8% |
| Two or more Races | 3,198 | 5.1% |
| Some other Race | 642 | 1.0% |
| Total | 62,474 | 100.0% |
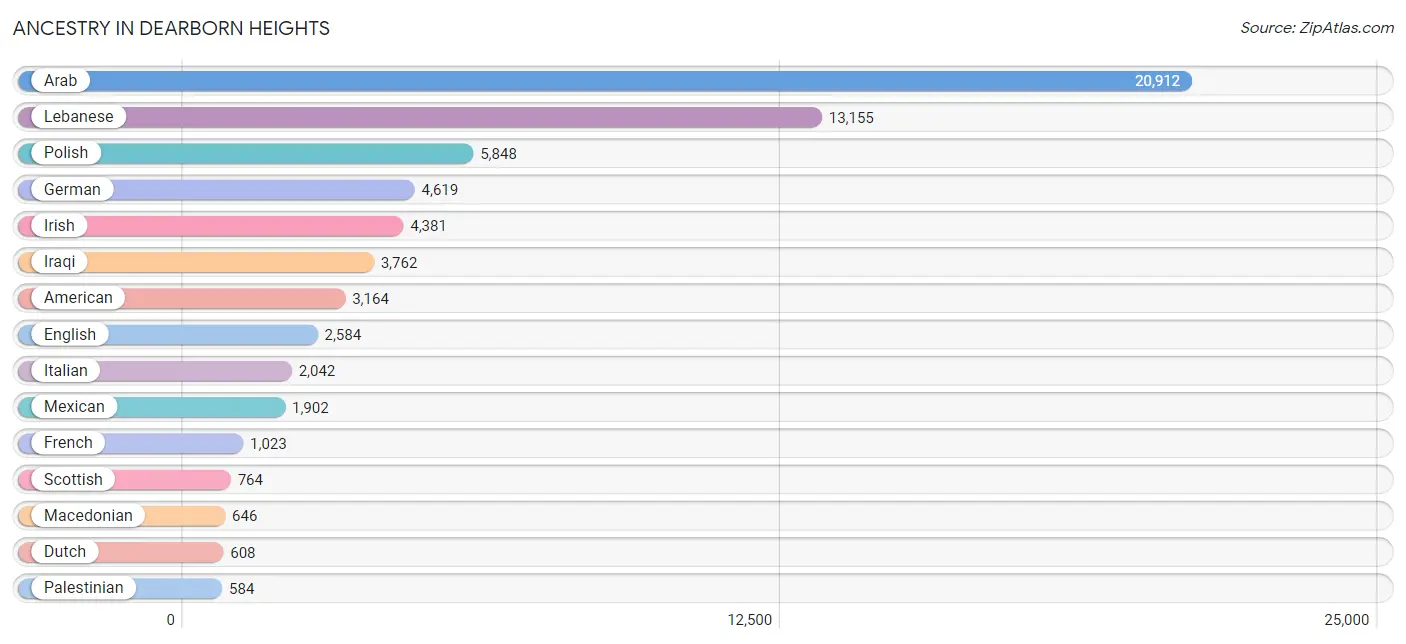
Ancestry in Dearborn Heights
The most populous ancestries reported in Dearborn Heights are Arab (20,912 | 33.5%), Lebanese (13,155 | 21.1%), Polish (5,848 | 9.4%), German (4,619 | 7.4%), and Irish (4,381 | 7.0%), together accounting for 78.3% of all Dearborn Heights residents.
| Ancestry | # Population | % Population |
| African | 156 | 0.3% |
| Albanian | 164 | 0.3% |
| American | 3,164 | 5.1% |
| Apache | 28 | 0.0% |
| Arab | 20,912 | 33.5% |
| Argentinean | 23 | 0.0% |
| Armenian | 147 | 0.2% |
| Assyrian / Chaldean / Syriac | 36 | 0.1% |
| Australian | 138 | 0.2% |
| Austrian | 27 | 0.0% |
| Belgian | 57 | 0.1% |
| Bhutanese | 38 | 0.1% |
| Blackfeet | 12 | 0.0% |
| British | 28 | 0.0% |
| Bulgarian | 199 | 0.3% |
| Burmese | 52 | 0.1% |
| Canadian | 259 | 0.4% |
| Central American | 189 | 0.3% |
| Central American Indian | 21 | 0.0% |
| Cherokee | 77 | 0.1% |
| Chippewa | 86 | 0.1% |
| Colombian | 8 | 0.0% |
| Croatian | 37 | 0.1% |
| Cuban | 75 | 0.1% |
| Czech | 118 | 0.2% |
| Czechoslovakian | 145 | 0.2% |
| Danish | 71 | 0.1% |
| Delaware | 2 | 0.0% |
| Dominican | 4 | 0.0% |
| Dutch | 608 | 1.0% |
| Dutch West Indian | 38 | 0.1% |
| Eastern European | 211 | 0.3% |
| Egyptian | 133 | 0.2% |
| English | 2,584 | 4.1% |
| Ethiopian | 9 | 0.0% |
| European | 558 | 0.9% |
| Finnish | 389 | 0.6% |
| French | 1,023 | 1.6% |
| French American Indian | 48 | 0.1% |
| French Canadian | 372 | 0.6% |
| German | 4,619 | 7.4% |
| Greek | 217 | 0.4% |
| Honduran | 174 | 0.3% |
| Hungarian | 551 | 0.9% |
| Indian (Asian) | 98 | 0.2% |
| Iranian | 92 | 0.2% |
| Iraqi | 3,762 | 6.0% |
| Irish | 4,381 | 7.0% |
| Iroquois | 20 | 0.0% |
| Italian | 2,042 | 3.3% |
| Jordanian | 519 | 0.8% |
| Korean | 106 | 0.2% |
| Laotian | 4 | 0.0% |
| Lebanese | 13,155 | 21.1% |
| Liberian | 31 | 0.1% |
| Lithuanian | 315 | 0.5% |
| Macedonian | 646 | 1.0% |
| Maltese | 210 | 0.3% |
| Mexican | 1,902 | 3.0% |
| Moroccan | 70 | 0.1% |
| Native Hawaiian | 4 | 0.0% |
| Nigerian | 30 | 0.1% |
| Norwegian | 139 | 0.2% |
| Palestinian | 584 | 0.9% |
| Panamanian | 15 | 0.0% |
| Polish | 5,848 | 9.4% |
| Potawatomi | 5 | 0.0% |
| Puerto Rican | 230 | 0.4% |
| Romanian | 546 | 0.9% |
| Russian | 226 | 0.4% |
| Samoan | 7 | 0.0% |
| Scandinavian | 78 | 0.1% |
| Scotch-Irish | 257 | 0.4% |
| Scottish | 764 | 1.2% |
| Serbian | 92 | 0.2% |
| Sierra Leonean | 42 | 0.1% |
| Slavic | 4 | 0.0% |
| Slovak | 97 | 0.2% |
| Slovene | 36 | 0.1% |
| South American | 253 | 0.4% |
| Spaniard | 68 | 0.1% |
| Spanish | 311 | 0.5% |
| Sri Lankan | 46 | 0.1% |
| Subsaharan African | 283 | 0.4% |
| Swedish | 181 | 0.3% |
| Swiss | 44 | 0.1% |
| Syrian | 232 | 0.4% |
| Thai | 303 | 0.5% |
| Turkish | 7 | 0.0% |
| Ukrainian | 205 | 0.3% |
| Venezuelan | 222 | 0.4% |
| Vietnamese | 34 | 0.1% |
| Welsh | 219 | 0.4% |
| West Indian | 60 | 0.1% |
| Yugoslavian | 209 | 0.3% | View All 95 Rows |
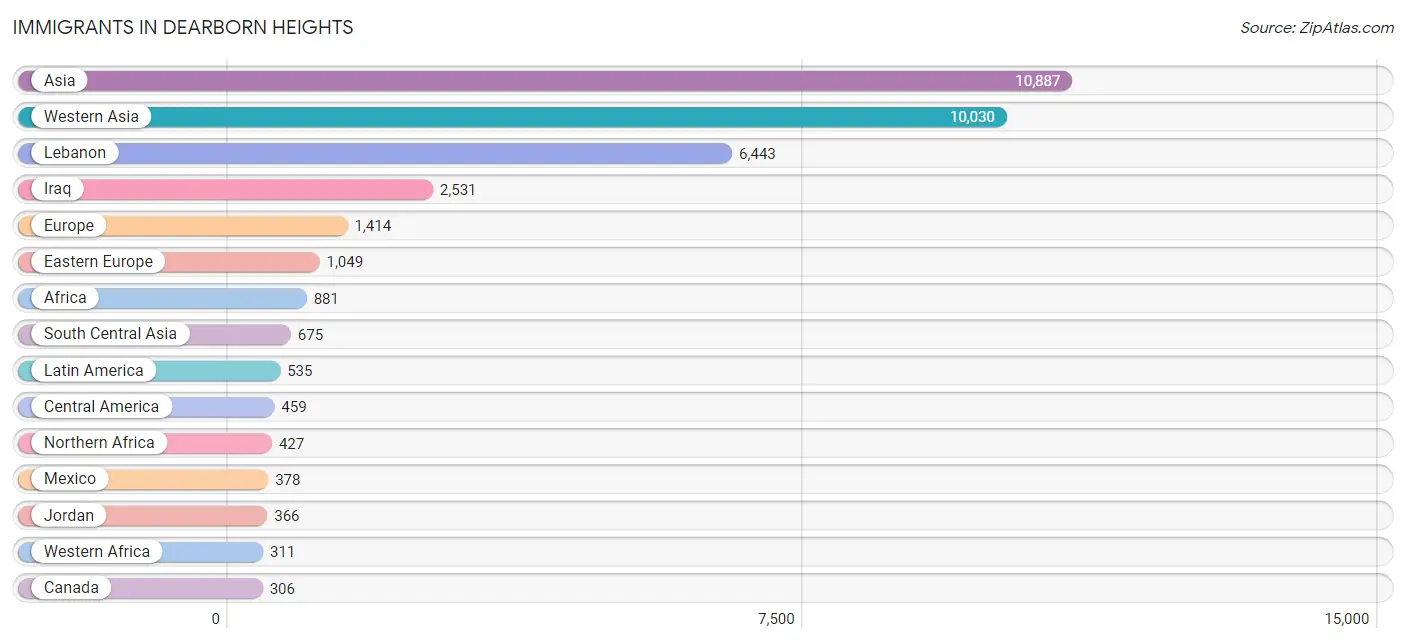
Immigrants in Dearborn Heights
The most numerous immigrant groups reported in Dearborn Heights came from Asia (10,887 | 17.4%), Western Asia (10,030 | 16.1%), Lebanon (6,443 | 10.3%), Iraq (2,531 | 4.1%), and Europe (1,414 | 2.3%), together accounting for 50.1% of all Dearborn Heights residents.
| Immigration Origin | # Population | % Population |
| Africa | 881 | 1.4% |
| Albania | 23 | 0.0% |
| Argentina | 11 | 0.0% |
| Asia | 10,887 | 17.4% |
| Australia | 146 | 0.2% |
| Austria | 5 | 0.0% |
| Bangladesh | 8 | 0.0% |
| Bulgaria | 129 | 0.2% |
| Cameroon | 9 | 0.0% |
| Canada | 306 | 0.5% |
| Caribbean | 22 | 0.0% |
| Central America | 459 | 0.7% |
| China | 61 | 0.1% |
| Colombia | 8 | 0.0% |
| Dominican Republic | 4 | 0.0% |
| Eastern Africa | 55 | 0.1% |
| Eastern Asia | 95 | 0.2% |
| Eastern Europe | 1,049 | 1.7% |
| Egypt | 97 | 0.2% |
| England | 38 | 0.1% |
| Ethiopia | 9 | 0.0% |
| Europe | 1,414 | 2.3% |
| France | 21 | 0.0% |
| Germany | 46 | 0.1% |
| Greece | 60 | 0.1% |
| Honduras | 73 | 0.1% |
| India | 211 | 0.3% |
| Iran | 141 | 0.2% |
| Iraq | 2,531 | 4.1% |
| Israel | 17 | 0.0% |
| Italy | 107 | 0.2% |
| Japan | 13 | 0.0% |
| Jordan | 366 | 0.6% |
| Korea | 21 | 0.0% |
| Kuwait | 71 | 0.1% |
| Latin America | 535 | 0.9% |
| Lebanon | 6,443 | 10.3% |
| Liberia | 42 | 0.1% |
| Lithuania | 11 | 0.0% |
| Mexico | 378 | 0.6% |
| Middle Africa | 9 | 0.0% |
| Morocco | 64 | 0.1% |
| Nigeria | 13 | 0.0% |
| North Macedonia | 279 | 0.4% |
| Northern Africa | 427 | 0.7% |
| Northern Europe | 38 | 0.1% |
| Oceania | 146 | 0.2% |
| Pakistan | 181 | 0.3% |
| Panama | 8 | 0.0% |
| Philippines | 22 | 0.0% |
| Poland | 158 | 0.3% |
| Romania | 213 | 0.3% |
| Russia | 78 | 0.1% |
| Saudi Arabia | 189 | 0.3% |
| Sierra Leone | 202 | 0.3% |
| South America | 54 | 0.1% |
| South Central Asia | 675 | 1.1% |
| South Eastern Asia | 48 | 0.1% |
| Southern Europe | 255 | 0.4% |
| Spain | 9 | 0.0% |
| Syria | 149 | 0.2% |
| Taiwan | 7 | 0.0% |
| Trinidad and Tobago | 18 | 0.0% |
| Ukraine | 7 | 0.0% |
| Uzbekistan | 134 | 0.2% |
| Venezuela | 35 | 0.1% |
| Vietnam | 26 | 0.0% |
| Western Africa | 311 | 0.5% |
| Western Asia | 10,030 | 16.1% |
| Western Europe | 72 | 0.1% |
| Yemen | 180 | 0.3% | View All 71 Rows |
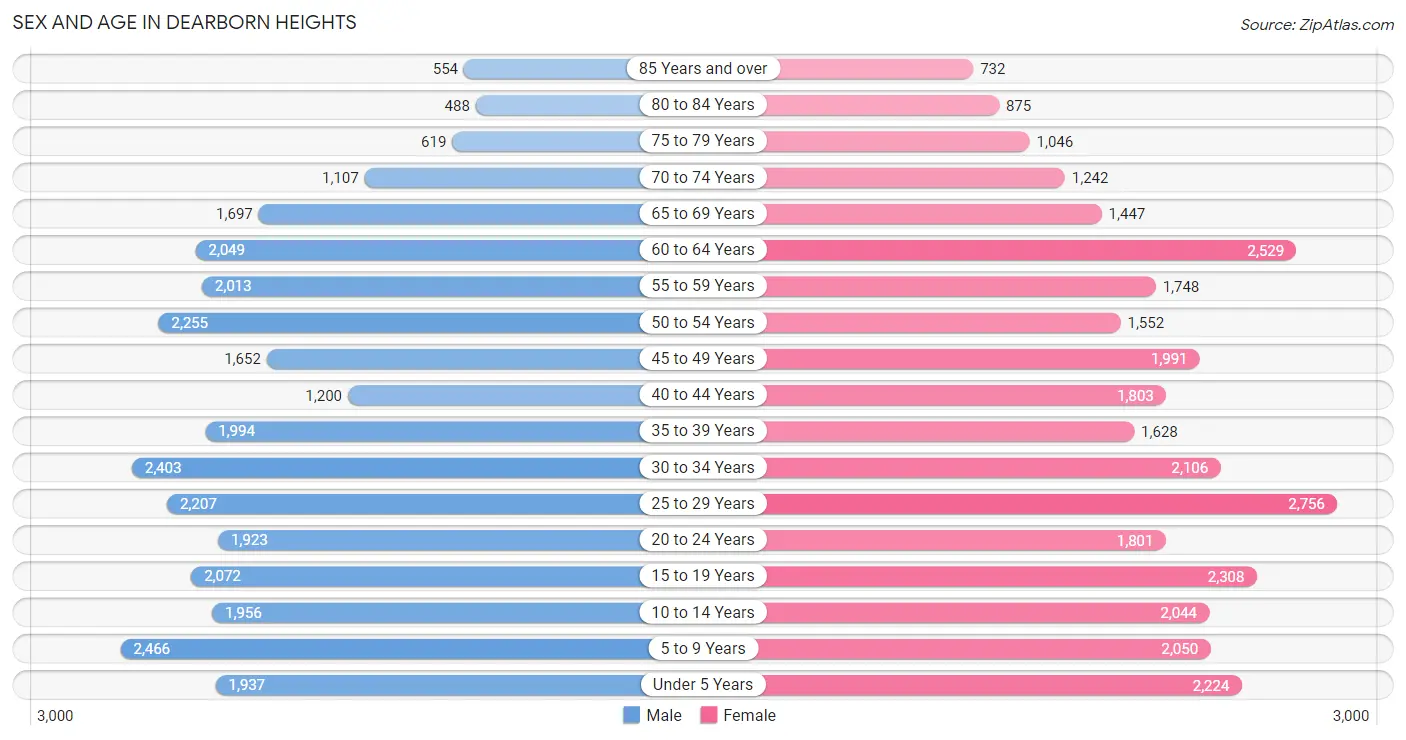
Sex and Age in Dearborn Heights
Sex and Age in Dearborn Heights
The most populous age groups in Dearborn Heights are 5 to 9 Years (2,466 | 8.1%) for men and 25 to 29 Years (2,756 | 8.6%) for women.
| Age Bracket | Male | Female |
| Under 5 Years | 1,937 (6.3%) | 2,224 (7.0%) |
| 5 to 9 Years | 2,466 (8.1%) | 2,050 (6.4%) |
| 10 to 14 Years | 1,956 (6.4%) | 2,044 (6.4%) |
| 15 to 19 Years | 2,072 (6.8%) | 2,308 (7.2%) |
| 20 to 24 Years | 1,923 (6.3%) | 1,801 (5.7%) |
| 25 to 29 Years | 2,207 (7.2%) | 2,756 (8.6%) |
| 30 to 34 Years | 2,403 (7.9%) | 2,106 (6.6%) |
| 35 to 39 Years | 1,994 (6.5%) | 1,628 (5.1%) |
| 40 to 44 Years | 1,200 (3.9%) | 1,803 (5.7%) |
| 45 to 49 Years | 1,652 (5.4%) | 1,991 (6.2%) |
| 50 to 54 Years | 2,255 (7.4%) | 1,552 (4.9%) |
| 55 to 59 Years | 2,013 (6.6%) | 1,748 (5.5%) |
| 60 to 64 Years | 2,049 (6.7%) | 2,529 (7.9%) |
| 65 to 69 Years | 1,697 (5.6%) | 1,447 (4.5%) |
| 70 to 74 Years | 1,107 (3.6%) | 1,242 (3.9%) |
| 75 to 79 Years | 619 (2.0%) | 1,046 (3.3%) |
| 80 to 84 Years | 488 (1.6%) | 875 (2.7%) |
| 85 Years and over | 554 (1.8%) | 732 (2.3%) |
| Total | 30,592 (100.0%) | 31,882 (100.0%) |
Families and Households in Dearborn Heights
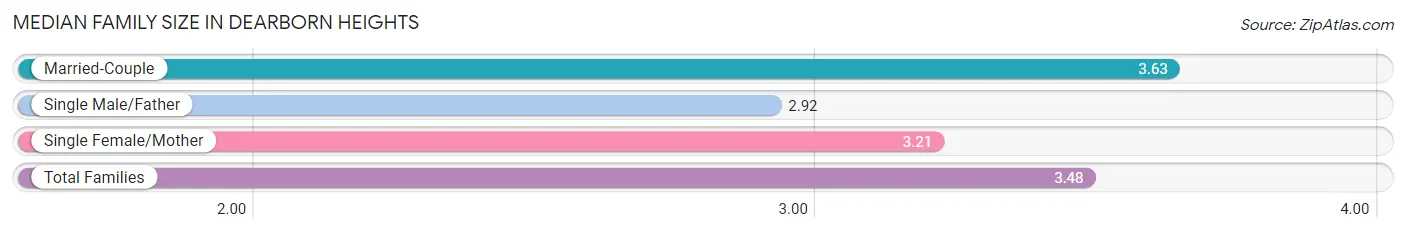
Median Family Size in Dearborn Heights
The median family size in Dearborn Heights is 3.48 persons per family, with married-couple families (10,673 | 70.6%) accounting for the largest median family size of 3.63 persons per family. On the other hand, single male/father families (1,240 | 8.2%) represent the smallest median family size with 2.92 persons per family.
| Family Type | # Families | Family Size |
| Married-Couple | 10,673 (70.6%) | 3.63 |
| Single Male/Father | 1,240 (8.2%) | 2.92 |
| Single Female/Mother | 3,207 (21.2%) | 3.21 |
| Total Families | 15,120 (100.0%) | 3.48 |
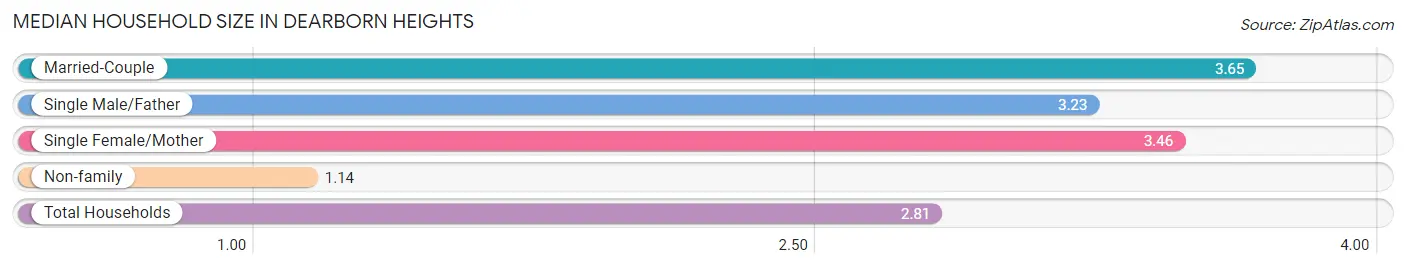
Median Household Size in Dearborn Heights
The median household size in Dearborn Heights is 2.81 persons per household, with married-couple households (10,673 | 48.4%) accounting for the largest median household size of 3.65 persons per household. non-family households (6,950 | 31.5%) represent the smallest median household size with 1.14 persons per household.
| Household Type | # Households | Household Size |
| Married-Couple | 10,673 (48.4%) | 3.65 |
| Single Male/Father | 1,240 (5.6%) | 3.23 |
| Single Female/Mother | 3,207 (14.5%) | 3.46 |
| Non-family | 6,950 (31.5%) | 1.14 |
| Total Households | 22,070 (100.0%) | 2.81 |
Household Size by Marriage Status in Dearborn Heights
Out of a total of 22,070 households in Dearborn Heights, 15,120 (68.5%) are family households, while 6,950 (31.5%) are nonfamily households. The most numerous type of family households are 2-person households, comprising 5,725, and the most common type of nonfamily households are 1-person households, comprising 6,300.
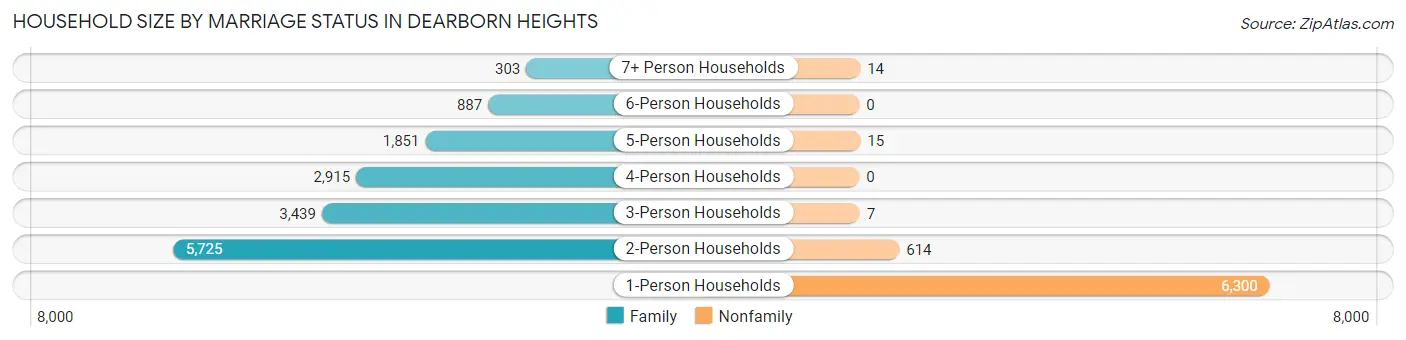
| Household Size | Family Households | Nonfamily Households |
| 1-Person Households | - | 6,300 (28.5%) |
| 2-Person Households | 5,725 (25.9%) | 614 (2.8%) |
| 3-Person Households | 3,439 (15.6%) | 7 (0.0%) |
| 4-Person Households | 2,915 (13.2%) | 0 (0.0%) |
| 5-Person Households | 1,851 (8.4%) | 15 (0.1%) |
| 6-Person Households | 887 (4.0%) | 0 (0.0%) |
| 7+ Person Households | 303 (1.4%) | 14 (0.1%) |
| Total | 15,120 (68.5%) | 6,950 (31.5%) |
Female Fertility in Dearborn Heights
Fertility by Age in Dearborn Heights
Average fertility rate in Dearborn Heights is 59.0 births per 1,000 women. Women in the age bracket of 20 to 34 years have the highest fertility rate with 99.0 births per 1,000 women. Women in the age bracket of 20 to 34 years acount for 76.1% of all women with births.
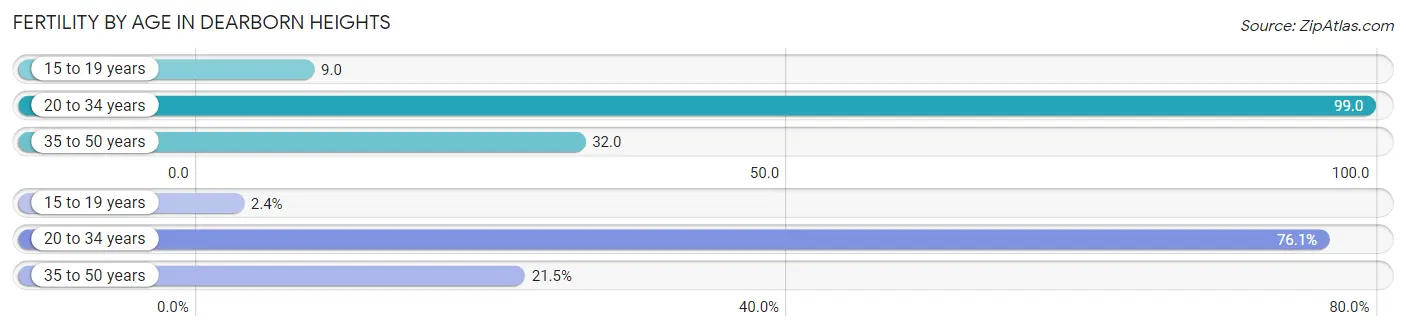
| Age Bracket | Women with Births | Births / 1,000 Women |
| 15 to 19 years | 21 (2.4%) | 9.0 |
| 20 to 34 years | 658 (76.1%) | 99.0 |
| 35 to 50 years | 186 (21.5%) | 32.0 |
| Total | 865 (100.0%) | 59.0 |
Fertility by Age by Marriage Status in Dearborn Heights
82.2% of women with births (865) in Dearborn Heights are married. The highest percentage of unmarried women with births falls into 20 to 34 years age bracket with 20.8% of them unmarried at the time of birth, while the lowest percentage of unmarried women with births belong to 15 to 19 years age bracket with 0.0% of them unmarried.
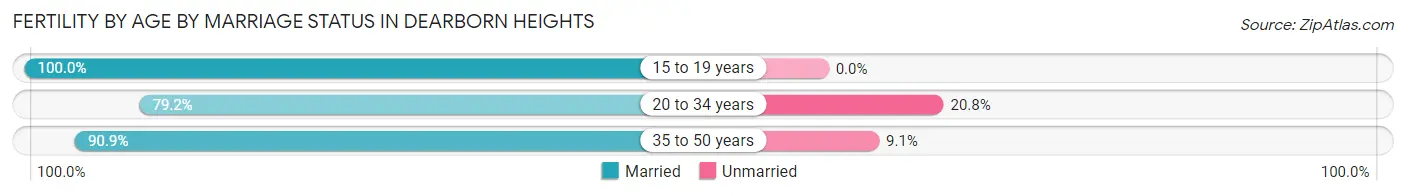
| Age Bracket | Married | Unmarried |
| 15 to 19 years | 21 (100.0%) | 0 (0.0%) |
| 20 to 34 years | 521 (79.2%) | 137 (20.8%) |
| 35 to 50 years | 169 (90.9%) | 17 (9.1%) |
| Total | 711 (82.2%) | 154 (17.8%) |
Fertility by Education in Dearborn Heights
Average fertility rate in Dearborn Heights is 59.0 births per 1,000 women. Women with the education attainment of bachelor's degree have the highest fertility rate of 109.0 births per 1,000 women, while women with the education attainment of less than high school have the lowest fertility at 21.0 births per 1,000 women. Women with the education attainment of college or associate's degree represent 38.2% of all women with births.
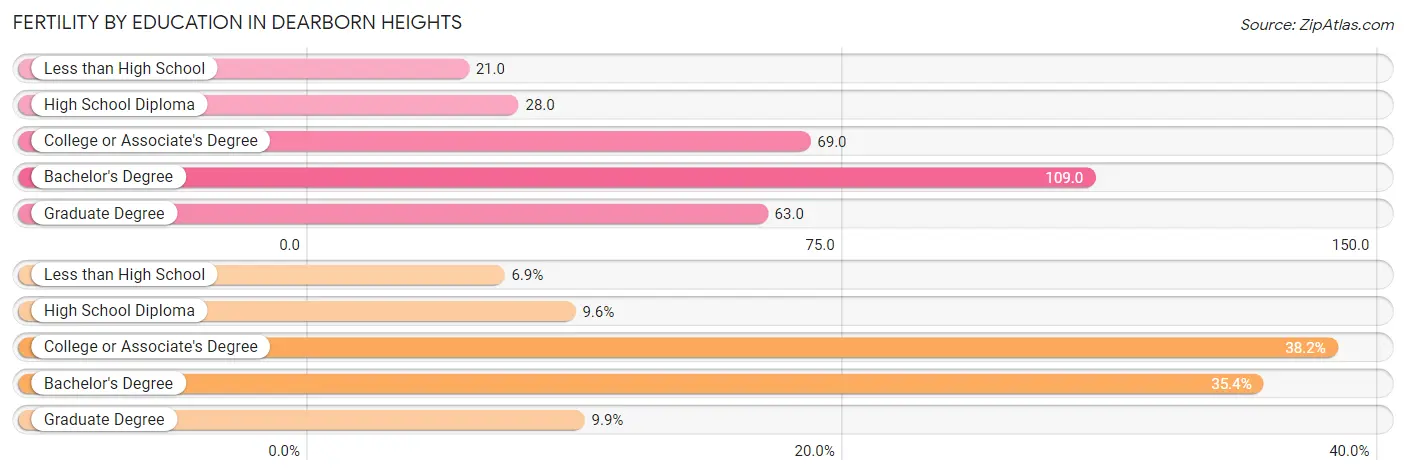
| Educational Attainment | Women with Births | Births / 1,000 Women |
| Less than High School | 60 (6.9%) | 21.0 |
| High School Diploma | 83 (9.6%) | 28.0 |
| College or Associate's Degree | 330 (38.2%) | 69.0 |
| Bachelor's Degree | 306 (35.4%) | 109.0 |
| Graduate Degree | 86 (9.9%) | 63.0 |
| Total | 865 (100.0%) | 59.0 |
Fertility by Education by Marriage Status in Dearborn Heights
17.8% of women with births in Dearborn Heights are unmarried. Women with the educational attainment of less than high school are most likely to be married with 100.0% of them married at childbirth, while women with the educational attainment of bachelor's degree are least likely to be married with 28.1% of them unmarried at childbirth.
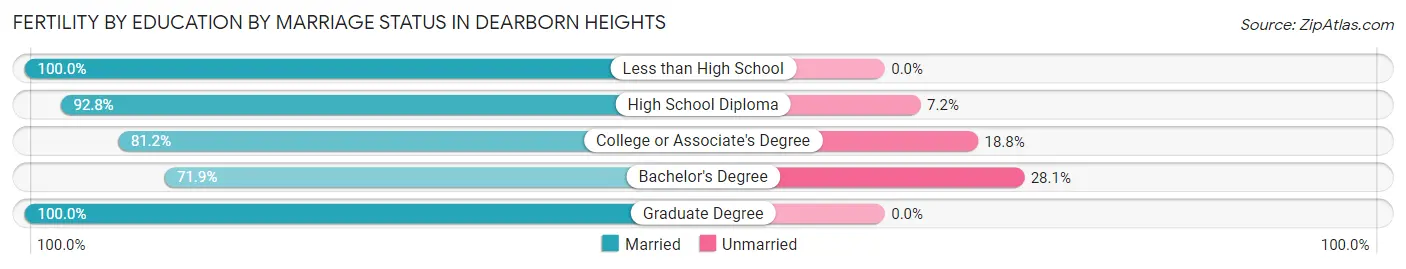
| Educational Attainment | Married | Unmarried |
| Less than High School | 60 (100.0%) | 0 (0.0%) |
| High School Diploma | 77 (92.8%) | 6 (7.2%) |
| College or Associate's Degree | 268 (81.2%) | 62 (18.8%) |
| Bachelor's Degree | 220 (71.9%) | 86 (28.1%) |
| Graduate Degree | 86 (100.0%) | 0 (0.0%) |
| Total | 711 (82.2%) | 154 (17.8%) |
Employment Characteristics in Dearborn Heights
Employment by Class of Employer in Dearborn Heights
Among the 24,342 employed individuals in Dearborn Heights, private company employees (18,408 | 75.6%), not-for-profit organizations (1,625 | 6.7%), and self-employed (not incorporated) (1,578 | 6.5%) make up the most common classes of employment.
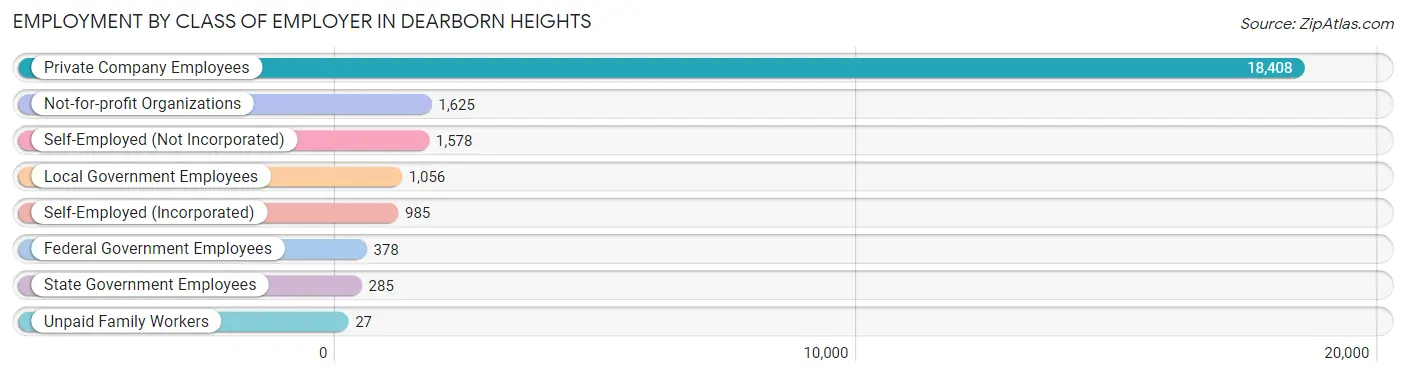
| Employer Class | # Employees | % Employees |
| Private Company Employees | 18,408 | 75.6% |
| Self-Employed (Incorporated) | 985 | 4.1% |
| Self-Employed (Not Incorporated) | 1,578 | 6.5% |
| Not-for-profit Organizations | 1,625 | 6.7% |
| Local Government Employees | 1,056 | 4.3% |
| State Government Employees | 285 | 1.2% |
| Federal Government Employees | 378 | 1.5% |
| Unpaid Family Workers | 27 | 0.1% |
| Total | 24,342 | 100.0% |
Employment Status by Age in Dearborn Heights
According to the labor force statistics for Dearborn Heights, out of the total population over 16 years of age (48,843), 55.9% or 27,303 individuals are in the labor force, with 8.2% or 2,239 of them unemployed. The age group with the highest labor force participation rate is 30 to 34 years, with 81.2% or 3,661 individuals in the labor force. Within the labor force, the 20 to 24 years age range has the highest percentage of unemployed individuals, with 14.7% or 351 of them being unemployed.
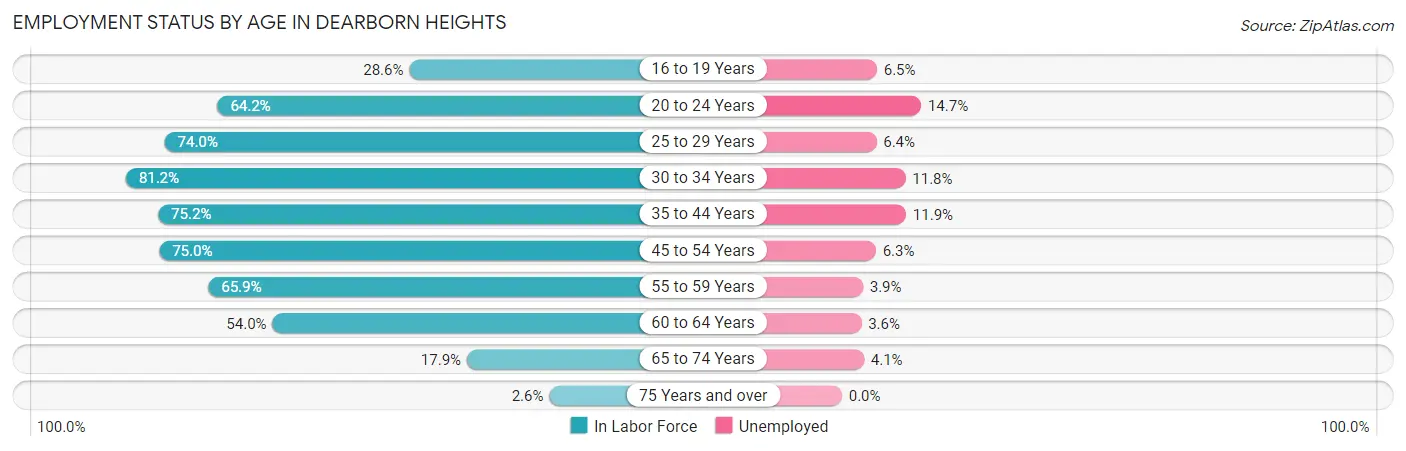
| Age Bracket | In Labor Force | Unemployed |
| 16 to 19 Years | 980 (28.6%) | 64 (6.5%) |
| 20 to 24 Years | 2,391 (64.2%) | 351 (14.7%) |
| 25 to 29 Years | 3,673 (74.0%) | 235 (6.4%) |
| 30 to 34 Years | 3,661 (81.2%) | 432 (11.8%) |
| 35 to 44 Years | 4,982 (75.2%) | 593 (11.9%) |
| 45 to 54 Years | 5,588 (75.0%) | 352 (6.3%) |
| 55 to 59 Years | 2,478 (65.9%) | 97 (3.9%) |
| 60 to 64 Years | 2,472 (54.0%) | 89 (3.6%) |
| 65 to 74 Years | 983 (17.9%) | 40 (4.1%) |
| 75 Years and over | 112 (2.6%) | 0 (0.0%) |
| Total | 27,303 (55.9%) | 2,239 (8.2%) |
Employment Status by Educational Attainment in Dearborn Heights
According to labor force statistics for Dearborn Heights, 71.7% of individuals (22,862) out of the total population between 25 and 64 years of age (31,886) are in the labor force, with 7.8% or 1,783 of them being unemployed. The group with the highest labor force participation rate are those with the educational attainment of bachelor's degree or higher, with 85.7% or 7,475 individuals in the labor force. Within the labor force, individuals with high school diploma education have the highest percentage of unemployment, with 10.7% or 636 of them being unemployed.
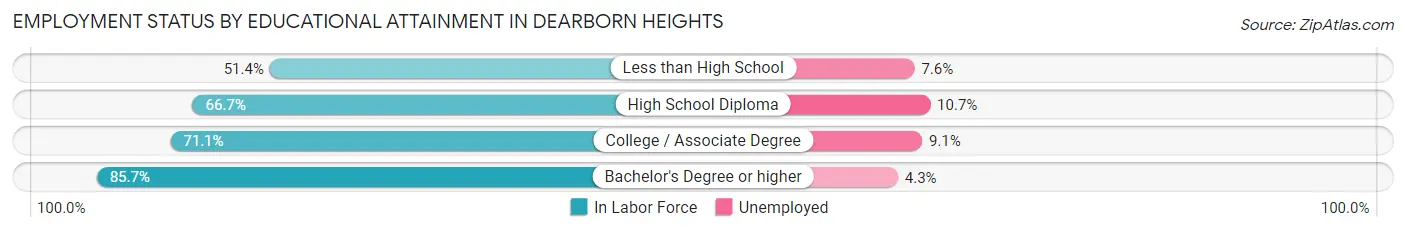
| Educational Attainment | In Labor Force | Unemployed |
| Less than High School | 1,821 (51.4%) | 269 (7.6%) |
| High School Diploma | 5,940 (66.7%) | 953 (10.7%) |
| College / Associate Degree | 7,619 (71.1%) | 975 (9.1%) |
| Bachelor's Degree or higher | 7,475 (85.7%) | 375 (4.3%) |
| Total | 22,862 (71.7%) | 2,487 (7.8%) |
Employment Occupations by Sex in Dearborn Heights
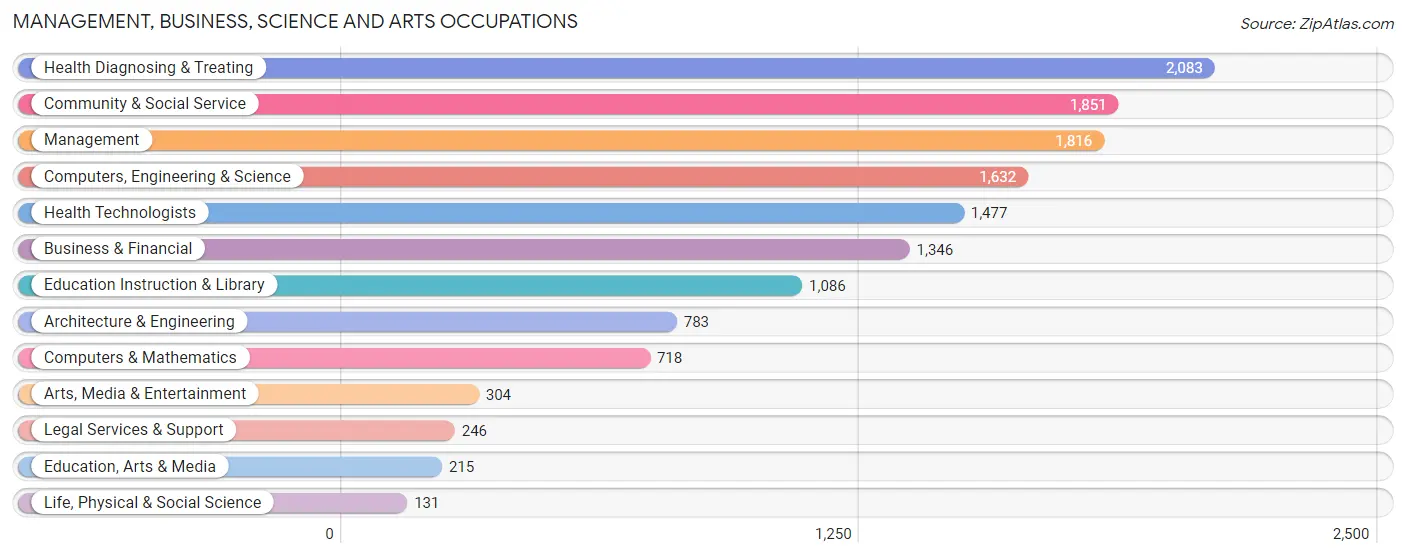
Management, Business, Science and Arts Occupations
The most common Management, Business, Science and Arts occupations in Dearborn Heights are Health Diagnosing & Treating (2,083 | 8.3%), Community & Social Service (1,851 | 7.4%), Management (1,816 | 7.2%), Computers, Engineering & Science (1,632 | 6.5%), and Health Technologists (1,477 | 5.9%).
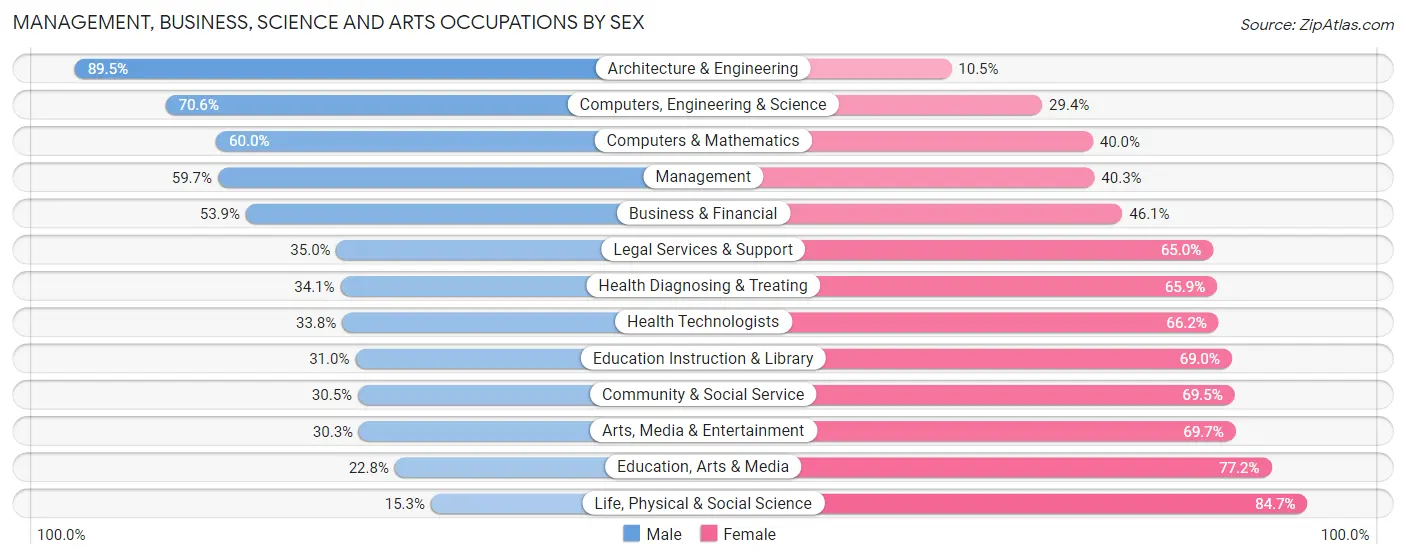
Management, Business, Science and Arts Occupations by Sex
Within the Management, Business, Science and Arts occupations in Dearborn Heights, the most male-oriented occupations are Architecture & Engineering (89.5%), Computers, Engineering & Science (70.6%), and Computers & Mathematics (60.0%), while the most female-oriented occupations are Life, Physical & Social Science (84.7%), Education, Arts & Media (77.2%), and Arts, Media & Entertainment (69.7%).
| Occupation | Male | Female |
| Management | 1,084 (59.7%) | 732 (40.3%) |
| Business & Financial | 725 (53.9%) | 621 (46.1%) |
| Computers, Engineering & Science | 1,152 (70.6%) | 480 (29.4%) |
| Computers & Mathematics | 431 (60.0%) | 287 (40.0%) |
| Architecture & Engineering | 701 (89.5%) | 82 (10.5%) |
| Life, Physical & Social Science | 20 (15.3%) | 111 (84.7%) |
| Community & Social Service | 564 (30.5%) | 1,287 (69.5%) |
| Education, Arts & Media | 49 (22.8%) | 166 (77.2%) |
| Legal Services & Support | 86 (35.0%) | 160 (65.0%) |
| Education Instruction & Library | 337 (31.0%) | 749 (69.0%) |
| Arts, Media & Entertainment | 92 (30.3%) | 212 (69.7%) |
| Health Diagnosing & Treating | 711 (34.1%) | 1,372 (65.9%) |
| Health Technologists | 499 (33.8%) | 978 (66.2%) |
| Total (Category) | 4,236 (48.5%) | 4,492 (51.5%) |
| Total (Overall) | 13,726 (54.8%) | 11,327 (45.2%) |
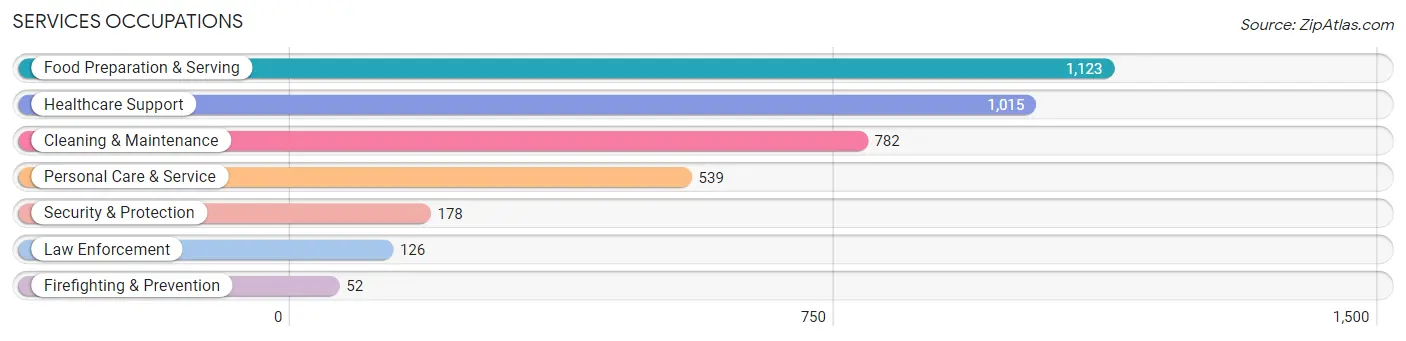
Services Occupations
The most common Services occupations in Dearborn Heights are Food Preparation & Serving (1,123 | 4.5%), Healthcare Support (1,015 | 4.1%), Cleaning & Maintenance (782 | 3.1%), Personal Care & Service (539 | 2.1%), and Security & Protection (178 | 0.7%).
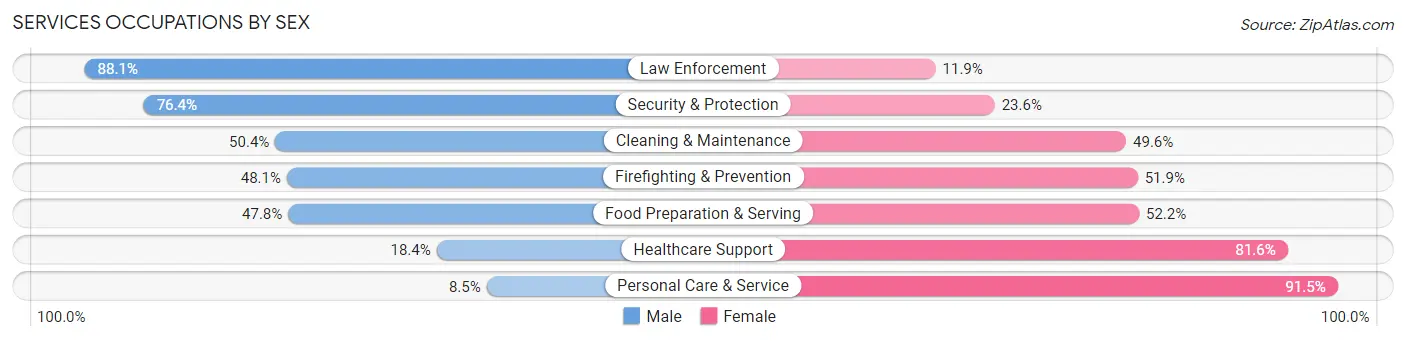
Services Occupations by Sex
Within the Services occupations in Dearborn Heights, the most male-oriented occupations are Law Enforcement (88.1%), Security & Protection (76.4%), and Cleaning & Maintenance (50.4%), while the most female-oriented occupations are Personal Care & Service (91.5%), Healthcare Support (81.6%), and Food Preparation & Serving (52.2%).
| Occupation | Male | Female |
| Healthcare Support | 187 (18.4%) | 828 (81.6%) |
| Security & Protection | 136 (76.4%) | 42 (23.6%) |
| Firefighting & Prevention | 25 (48.1%) | 27 (51.9%) |
| Law Enforcement | 111 (88.1%) | 15 (11.9%) |
| Food Preparation & Serving | 537 (47.8%) | 586 (52.2%) |
| Cleaning & Maintenance | 394 (50.4%) | 388 (49.6%) |
| Personal Care & Service | 46 (8.5%) | 493 (91.5%) |
| Total (Category) | 1,300 (35.7%) | 2,337 (64.3%) |
| Total (Overall) | 13,726 (54.8%) | 11,327 (45.2%) |
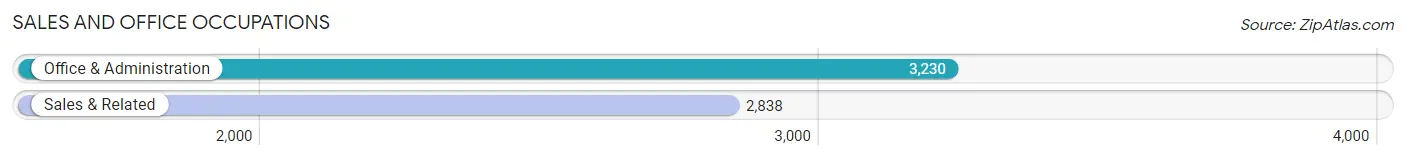
Sales and Office Occupations
The most common Sales and Office occupations in Dearborn Heights are Office & Administration (3,230 | 12.9%), and Sales & Related (2,838 | 11.3%).
Sales and Office Occupations by Sex
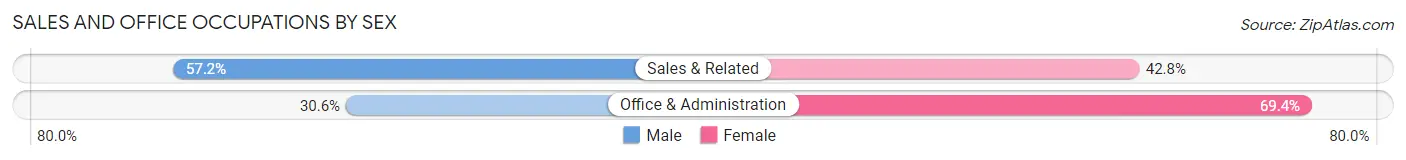
| Occupation | Male | Female |
| Sales & Related | 1,623 (57.2%) | 1,215 (42.8%) |
| Office & Administration | 987 (30.6%) | 2,243 (69.4%) |
| Total (Category) | 2,610 (43.0%) | 3,458 (57.0%) |
| Total (Overall) | 13,726 (54.8%) | 11,327 (45.2%) |
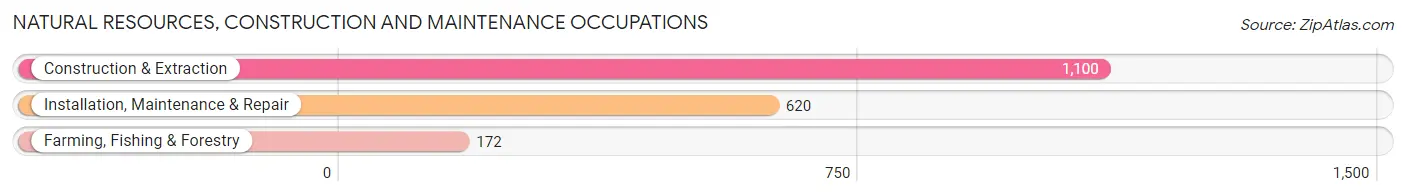
Natural Resources, Construction and Maintenance Occupations
The most common Natural Resources, Construction and Maintenance occupations in Dearborn Heights are Construction & Extraction (1,100 | 4.4%), Installation, Maintenance & Repair (620 | 2.5%), and Farming, Fishing & Forestry (172 | 0.7%).
Natural Resources, Construction and Maintenance Occupations by Sex
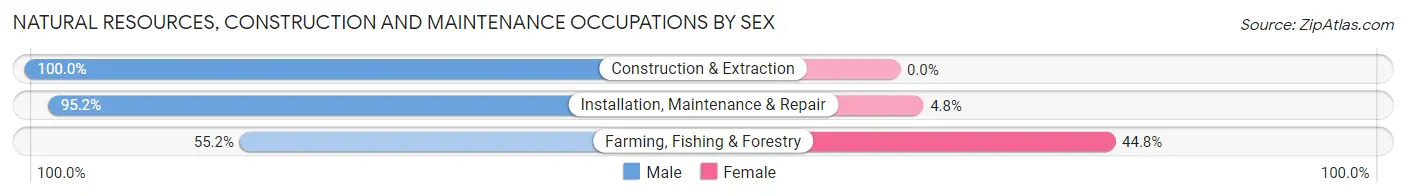
| Occupation | Male | Female |
| Farming, Fishing & Forestry | 95 (55.2%) | 77 (44.8%) |
| Construction & Extraction | 1,100 (100.0%) | 0 (0.0%) |
| Installation, Maintenance & Repair | 590 (95.2%) | 30 (4.8%) |
| Total (Category) | 1,785 (94.3%) | 107 (5.7%) |
| Total (Overall) | 13,726 (54.8%) | 11,327 (45.2%) |
Production, Transportation and Moving Occupations
The most common Production, Transportation and Moving occupations in Dearborn Heights are Production (2,093 | 8.4%), Transportation (1,489 | 5.9%), and Material Moving (1,146 | 4.6%).
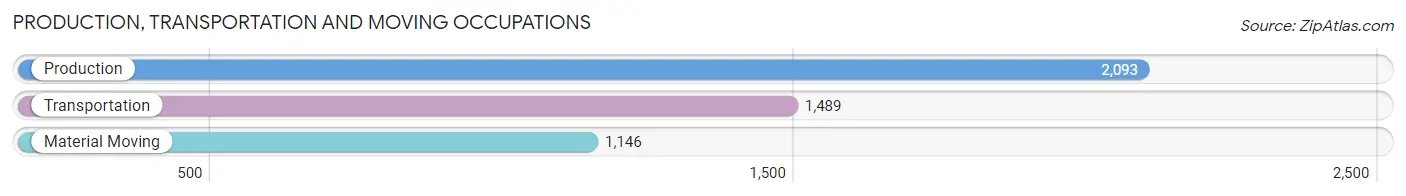
Production, Transportation and Moving Occupations by Sex
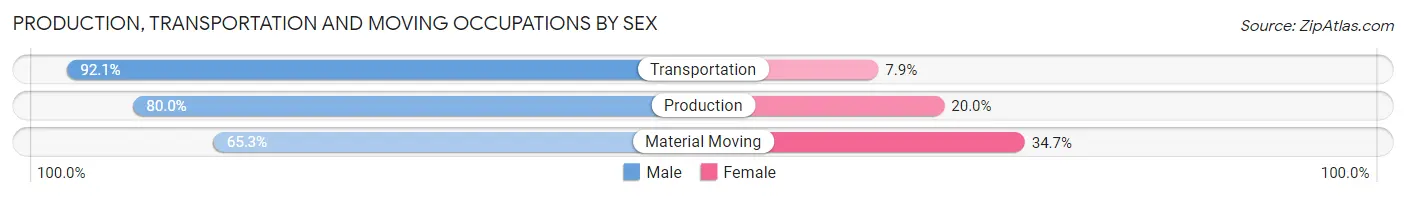
| Occupation | Male | Female |
| Production | 1,675 (80.0%) | 418 (20.0%) |
| Transportation | 1,372 (92.1%) | 117 (7.9%) |
| Material Moving | 748 (65.3%) | 398 (34.7%) |
| Total (Category) | 3,795 (80.3%) | 933 (19.7%) |
| Total (Overall) | 13,726 (54.8%) | 11,327 (45.2%) |
Employment Industries by Sex in Dearborn Heights
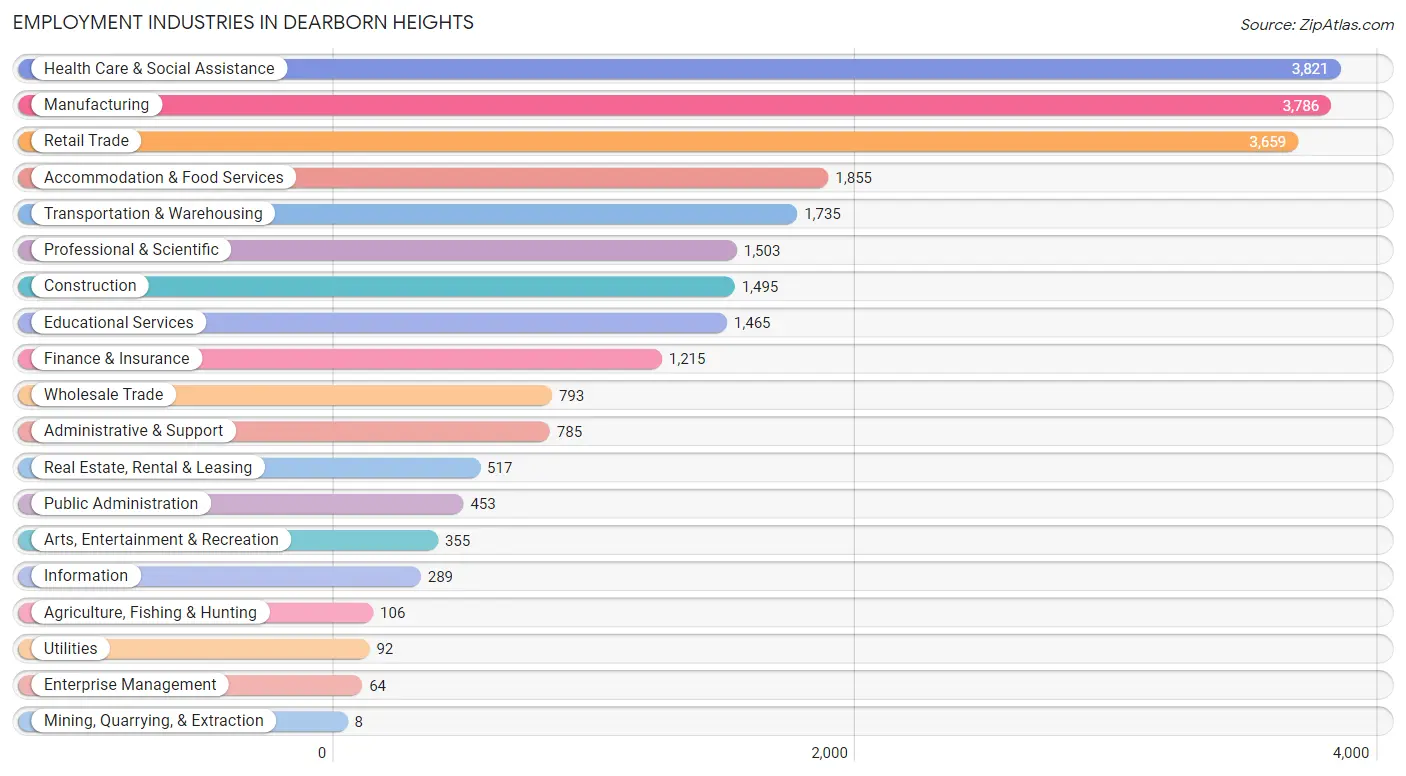
Employment Industries in Dearborn Heights
The major employment industries in Dearborn Heights include Health Care & Social Assistance (3,821 | 15.2%), Manufacturing (3,786 | 15.1%), Retail Trade (3,659 | 14.6%), Accommodation & Food Services (1,855 | 7.4%), and Transportation & Warehousing (1,735 | 6.9%).
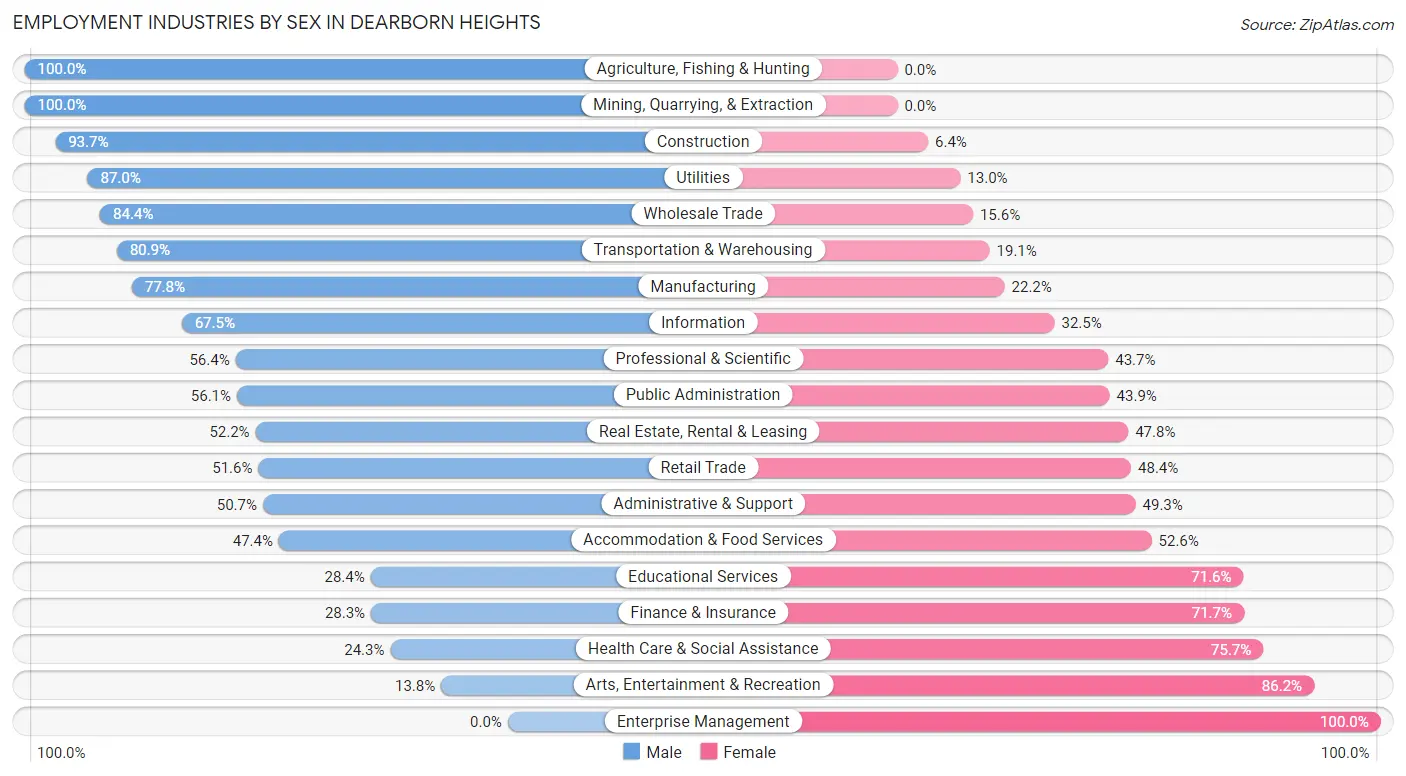
Employment Industries by Sex in Dearborn Heights
The Dearborn Heights industries that see more men than women are Agriculture, Fishing & Hunting (100.0%), Mining, Quarrying, & Extraction (100.0%), and Construction (93.6%), whereas the industries that tend to have a higher number of women are Enterprise Management (100.0%), Arts, Entertainment & Recreation (86.2%), and Health Care & Social Assistance (75.7%).
| Industry | Male | Female |
| Agriculture, Fishing & Hunting | 106 (100.0%) | 0 (0.0%) |
| Mining, Quarrying, & Extraction | 8 (100.0%) | 0 (0.0%) |
| Construction | 1,400 (93.6%) | 95 (6.4%) |
| Manufacturing | 2,946 (77.8%) | 840 (22.2%) |
| Wholesale Trade | 669 (84.4%) | 124 (15.6%) |
| Retail Trade | 1,889 (51.6%) | 1,770 (48.4%) |
| Transportation & Warehousing | 1,404 (80.9%) | 331 (19.1%) |
| Utilities | 80 (87.0%) | 12 (13.0%) |
| Information | 195 (67.5%) | 94 (32.5%) |
| Finance & Insurance | 344 (28.3%) | 871 (71.7%) |
| Real Estate, Rental & Leasing | 270 (52.2%) | 247 (47.8%) |
| Professional & Scientific | 847 (56.4%) | 656 (43.6%) |
| Enterprise Management | 0 (0.0%) | 64 (100.0%) |
| Administrative & Support | 398 (50.7%) | 387 (49.3%) |
| Educational Services | 416 (28.4%) | 1,049 (71.6%) |
| Health Care & Social Assistance | 929 (24.3%) | 2,892 (75.7%) |
| Arts, Entertainment & Recreation | 49 (13.8%) | 306 (86.2%) |
| Accommodation & Food Services | 879 (47.4%) | 976 (52.6%) |
| Public Administration | 254 (56.1%) | 199 (43.9%) |
| Total | 13,726 (54.8%) | 11,327 (45.2%) |
Education in Dearborn Heights
School Enrollment in Dearborn Heights
The most common levels of schooling among the 16,411 students in Dearborn Heights are high school (3,665 | 22.3%), college / undergraduate (3,558 | 21.7%), and middle school (3,189 | 19.4%).
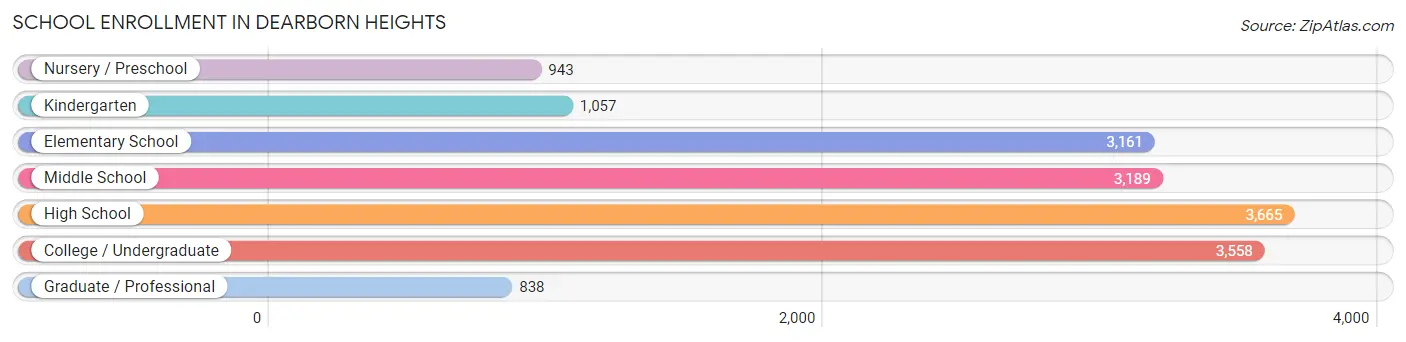
| School Level | # Students | % Students |
| Nursery / Preschool | 943 | 5.8% |
| Kindergarten | 1,057 | 6.4% |
| Elementary School | 3,161 | 19.3% |
| Middle School | 3,189 | 19.4% |
| High School | 3,665 | 22.3% |
| College / Undergraduate | 3,558 | 21.7% |
| Graduate / Professional | 838 | 5.1% |
| Total | 16,411 | 100.0% |
School Enrollment by Age by Funding Source in Dearborn Heights
Out of a total of 16,411 students who are enrolled in schools in Dearborn Heights, 2,281 (13.9%) attend a private institution, while the remaining 14,130 (86.1%) are enrolled in public schools. The age group of 3 to 4 year olds has the highest likelihood of being enrolled in private schools, with 298 (41.0% in the age bracket) enrolled. Conversely, the age group of 15 to 17 year olds has the lowest likelihood of being enrolled in a private school, with 2,637 (90.8% in the age bracket) attending a public institution.
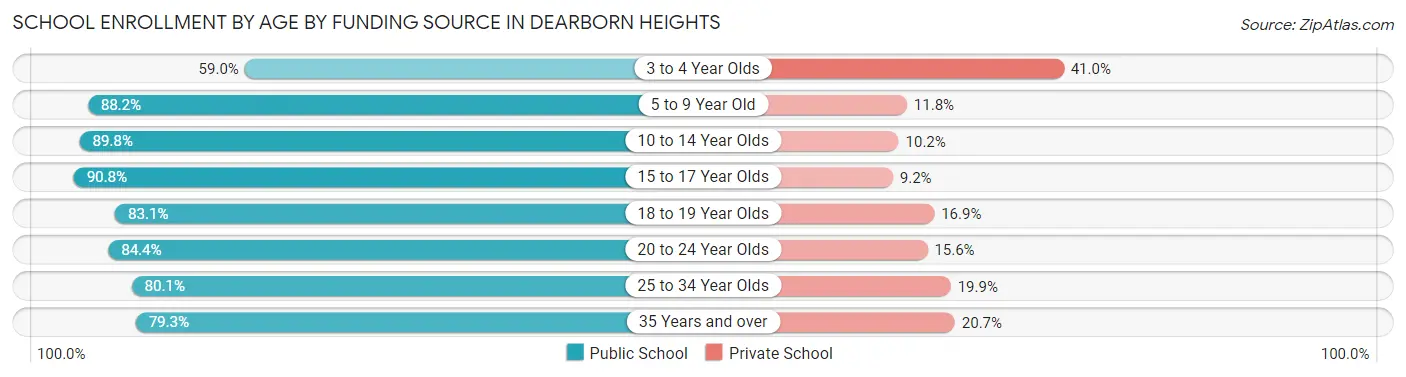
| Age Bracket | Public School | Private School |
| 3 to 4 Year Olds | 429 (59.0%) | 298 (41.0%) |
| 5 to 9 Year Old | 3,791 (88.2%) | 506 (11.8%) |
| 10 to 14 Year Olds | 3,397 (89.8%) | 387 (10.2%) |
| 15 to 17 Year Olds | 2,637 (90.8%) | 266 (9.2%) |
| 18 to 19 Year Olds | 907 (83.1%) | 184 (16.9%) |
| 20 to 24 Year Olds | 1,639 (84.4%) | 303 (15.6%) |
| 25 to 34 Year Olds | 859 (80.1%) | 214 (19.9%) |
| 35 Years and over | 471 (79.3%) | 123 (20.7%) |
| Total | 14,130 (86.1%) | 2,281 (13.9%) |
Educational Attainment by Field of Study in Dearborn Heights
Business (2,100 | 18.9%), science & technology (1,838 | 16.5%), engineering (1,678 | 15.1%), education (964 | 8.7%), and bio, nature & agricultural (707 | 6.4%) are the most common fields of study among 11,119 individuals in Dearborn Heights who have obtained a bachelor's degree or higher.
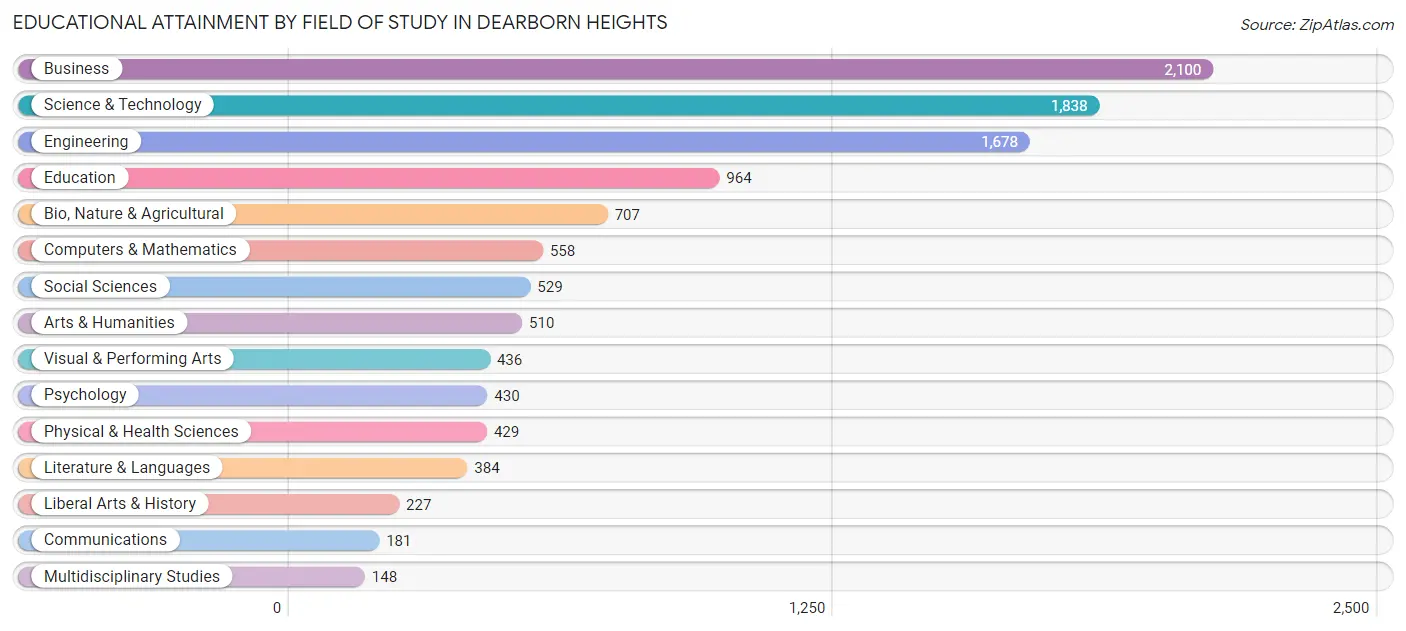
| Field of Study | # Graduates | % Graduates |
| Computers & Mathematics | 558 | 5.0% |
| Bio, Nature & Agricultural | 707 | 6.4% |
| Physical & Health Sciences | 429 | 3.9% |
| Psychology | 430 | 3.9% |
| Social Sciences | 529 | 4.8% |
| Engineering | 1,678 | 15.1% |
| Multidisciplinary Studies | 148 | 1.3% |
| Science & Technology | 1,838 | 16.5% |
| Business | 2,100 | 18.9% |
| Education | 964 | 8.7% |
| Literature & Languages | 384 | 3.5% |
| Liberal Arts & History | 227 | 2.0% |
| Visual & Performing Arts | 436 | 3.9% |
| Communications | 181 | 1.6% |
| Arts & Humanities | 510 | 4.6% |
| Total | 11,119 | 100.0% |
Transportation & Commute in Dearborn Heights
Vehicle Availability by Sex in Dearborn Heights
The most prevalent vehicle ownership categories in Dearborn Heights are males with 2 vehicles (6,288, accounting for 46.7%) and females with 2 vehicles (4,570, making up 57.8%).
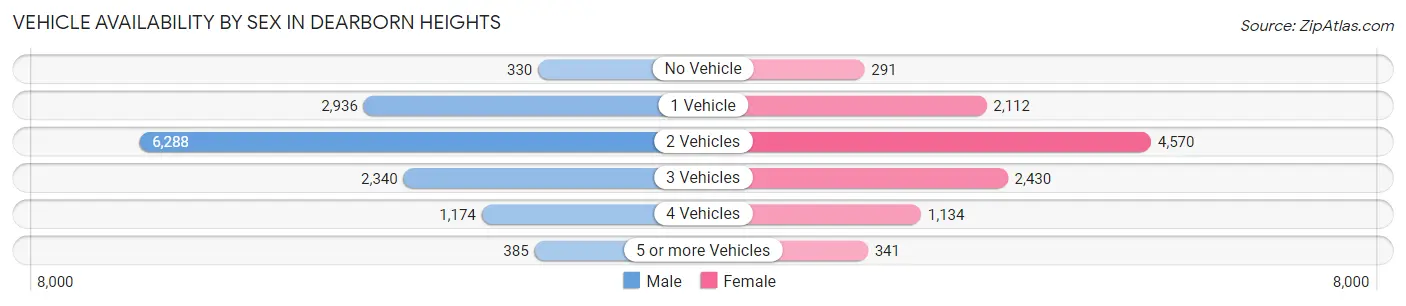
| Vehicles Available | Male | Female |
| No Vehicle | 330 (2.5%) | 291 (2.7%) |
| 1 Vehicle | 2,936 (21.8%) | 2,112 (19.4%) |
| 2 Vehicles | 6,288 (46.7%) | 4,570 (42.0%) |
| 3 Vehicles | 2,340 (17.4%) | 2,430 (22.3%) |
| 4 Vehicles | 1,174 (8.7%) | 1,134 (10.4%) |
| 5 or more Vehicles | 385 (2.9%) | 341 (3.1%) |
| Total | 13,453 (100.0%) | 10,878 (100.0%) |
Commute Time in Dearborn Heights
The most frequently occuring commute durations in Dearborn Heights are 20 to 24 minutes (5,159 commuters, 23.3%), 15 to 19 minutes (3,972 commuters, 17.9%), and 30 to 34 minutes (3,365 commuters, 15.2%).
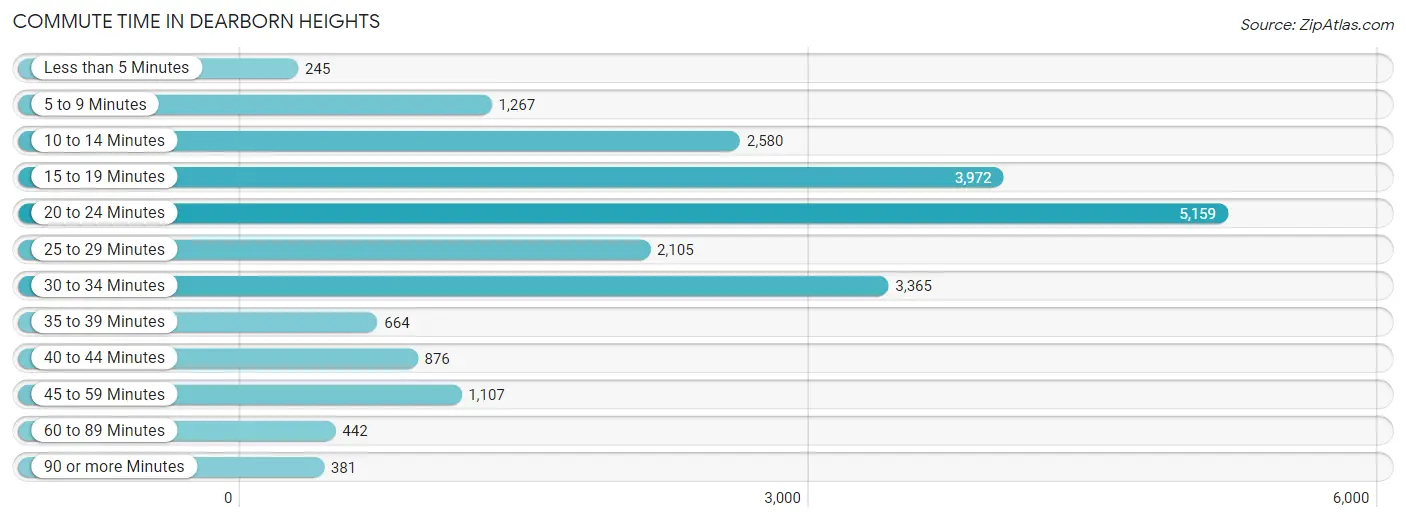
| Commute Time | # Commuters | % Commuters |
| Less than 5 Minutes | 245 | 1.1% |
| 5 to 9 Minutes | 1,267 | 5.7% |
| 10 to 14 Minutes | 2,580 | 11.6% |
| 15 to 19 Minutes | 3,972 | 17.9% |
| 20 to 24 Minutes | 5,159 | 23.3% |
| 25 to 29 Minutes | 2,105 | 9.5% |
| 30 to 34 Minutes | 3,365 | 15.2% |
| 35 to 39 Minutes | 664 | 3.0% |
| 40 to 44 Minutes | 876 | 4.0% |
| 45 to 59 Minutes | 1,107 | 5.0% |
| 60 to 89 Minutes | 442 | 2.0% |
| 90 or more Minutes | 381 | 1.7% |
Commute Time by Sex in Dearborn Heights
The most common commute times in Dearborn Heights are 20 to 24 minutes (3,240 commuters, 26.3%) for males and 15 to 19 minutes (2,026 commuters, 20.6%) for females.
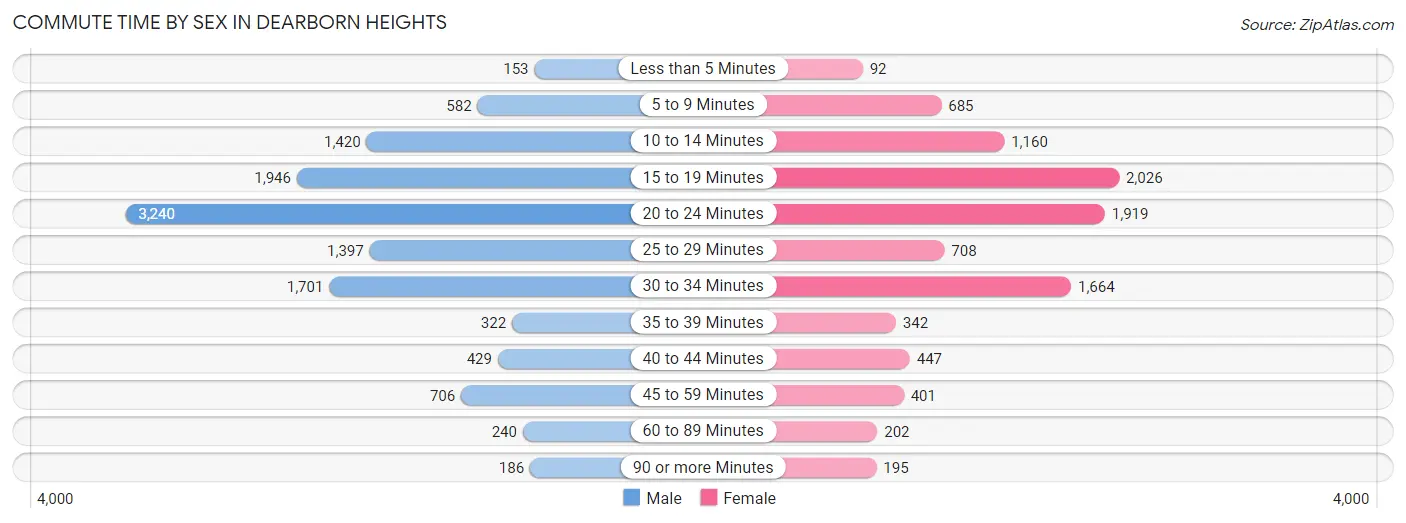
| Commute Time | Male | Female |
| Less than 5 Minutes | 153 (1.2%) | 92 (0.9%) |
| 5 to 9 Minutes | 582 (4.7%) | 685 (7.0%) |
| 10 to 14 Minutes | 1,420 (11.5%) | 1,160 (11.8%) |
| 15 to 19 Minutes | 1,946 (15.8%) | 2,026 (20.6%) |
| 20 to 24 Minutes | 3,240 (26.3%) | 1,919 (19.5%) |
| 25 to 29 Minutes | 1,397 (11.3%) | 708 (7.2%) |
| 30 to 34 Minutes | 1,701 (13.8%) | 1,664 (16.9%) |
| 35 to 39 Minutes | 322 (2.6%) | 342 (3.5%) |
| 40 to 44 Minutes | 429 (3.5%) | 447 (4.5%) |
| 45 to 59 Minutes | 706 (5.7%) | 401 (4.1%) |
| 60 to 89 Minutes | 240 (1.9%) | 202 (2.1%) |
| 90 or more Minutes | 186 (1.5%) | 195 (2.0%) |
Time of Departure to Work by Sex in Dearborn Heights
The most frequent times of departure to work in Dearborn Heights are 7:00 AM to 7:29 AM (1,480, 12.0%) for males and 9:00 AM to 9:59 AM (1,631, 16.6%) for females.
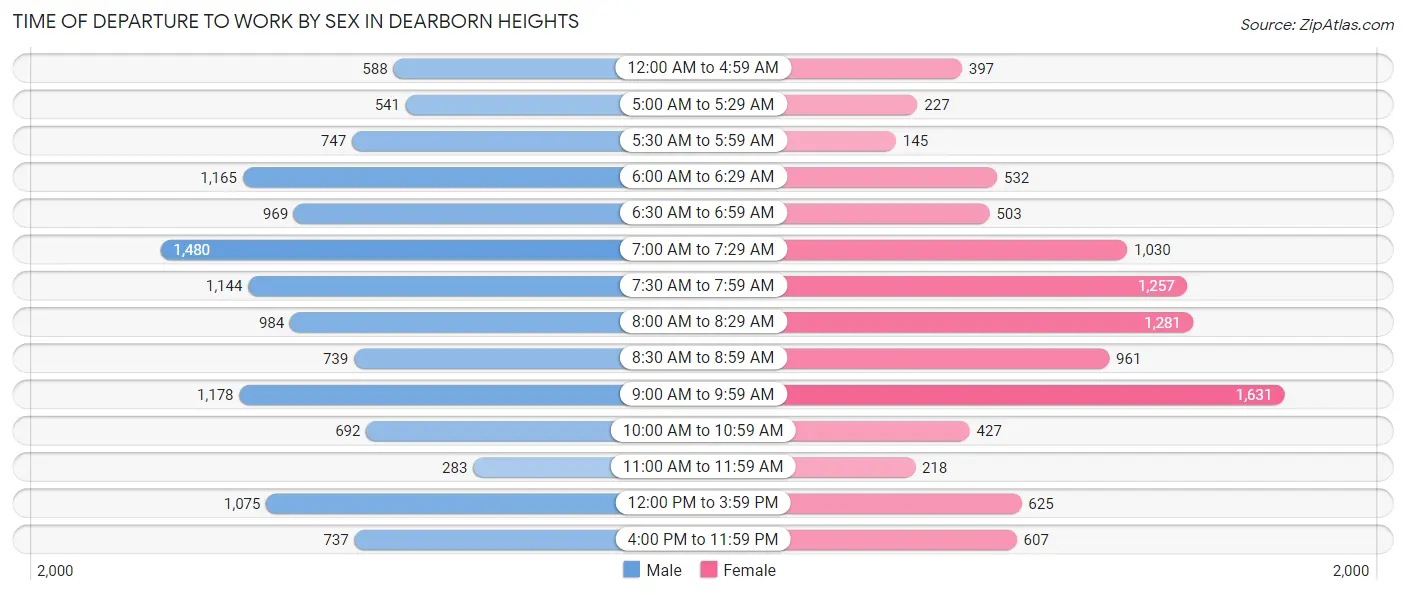
| Time of Departure | Male | Female |
| 12:00 AM to 4:59 AM | 588 (4.8%) | 397 (4.0%) |
| 5:00 AM to 5:29 AM | 541 (4.4%) | 227 (2.3%) |
| 5:30 AM to 5:59 AM | 747 (6.1%) | 145 (1.5%) |
| 6:00 AM to 6:29 AM | 1,165 (9.5%) | 532 (5.4%) |
| 6:30 AM to 6:59 AM | 969 (7.9%) | 503 (5.1%) |
| 7:00 AM to 7:29 AM | 1,480 (12.0%) | 1,030 (10.5%) |
| 7:30 AM to 7:59 AM | 1,144 (9.3%) | 1,257 (12.8%) |
| 8:00 AM to 8:29 AM | 984 (8.0%) | 1,281 (13.0%) |
| 8:30 AM to 8:59 AM | 739 (6.0%) | 961 (9.8%) |
| 9:00 AM to 9:59 AM | 1,178 (9.6%) | 1,631 (16.6%) |
| 10:00 AM to 10:59 AM | 692 (5.6%) | 427 (4.3%) |
| 11:00 AM to 11:59 AM | 283 (2.3%) | 218 (2.2%) |
| 12:00 PM to 3:59 PM | 1,075 (8.7%) | 625 (6.4%) |
| 4:00 PM to 11:59 PM | 737 (6.0%) | 607 (6.2%) |
| Total | 12,322 (100.0%) | 9,841 (100.0%) |
Housing Occupancy in Dearborn Heights
Occupancy by Ownership in Dearborn Heights
Of the total 22,070 dwellings in Dearborn Heights, owner-occupied units account for 15,843 (71.8%), while renter-occupied units make up 6,227 (28.2%).
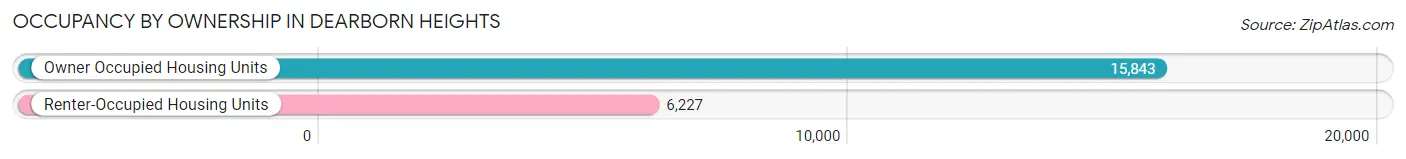
| Occupancy | # Housing Units | % Housing Units |
| Owner Occupied Housing Units | 15,843 | 71.8% |
| Renter-Occupied Housing Units | 6,227 | 28.2% |
| Total Occupied Housing Units | 22,070 | 100.0% |
Occupancy by Household Size in Dearborn Heights
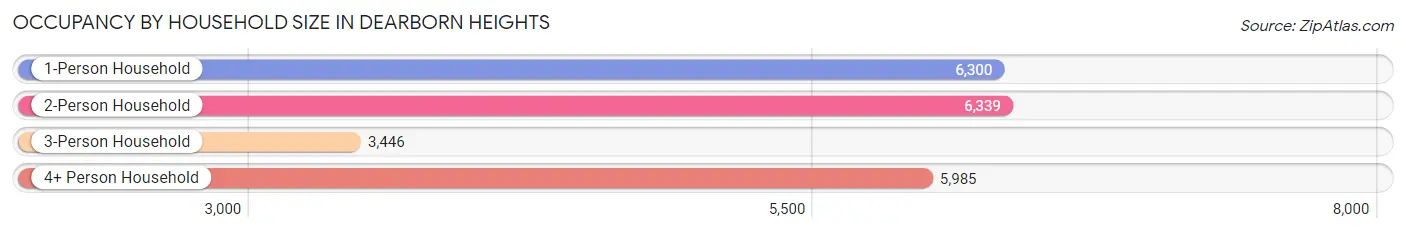
| Household Size | # Housing Units | % Housing Units |
| 1-Person Household | 6,300 | 28.5% |
| 2-Person Household | 6,339 | 28.7% |
| 3-Person Household | 3,446 | 15.6% |
| 4+ Person Household | 5,985 | 27.1% |
| Total Housing Units | 22,070 | 100.0% |
Occupancy by Ownership by Household Size in Dearborn Heights
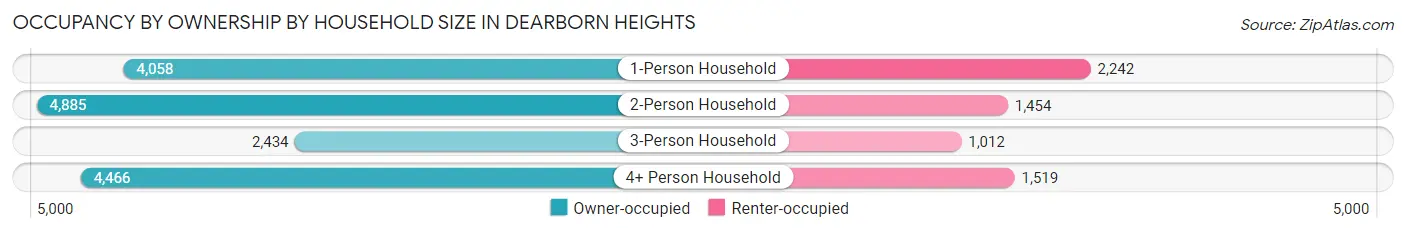
| Household Size | Owner-occupied | Renter-occupied |
| 1-Person Household | 4,058 (64.4%) | 2,242 (35.6%) |
| 2-Person Household | 4,885 (77.1%) | 1,454 (22.9%) |
| 3-Person Household | 2,434 (70.6%) | 1,012 (29.4%) |
| 4+ Person Household | 4,466 (74.6%) | 1,519 (25.4%) |
| Total Housing Units | 15,843 (71.8%) | 6,227 (28.2%) |
Occupancy by Educational Attainment in Dearborn Heights
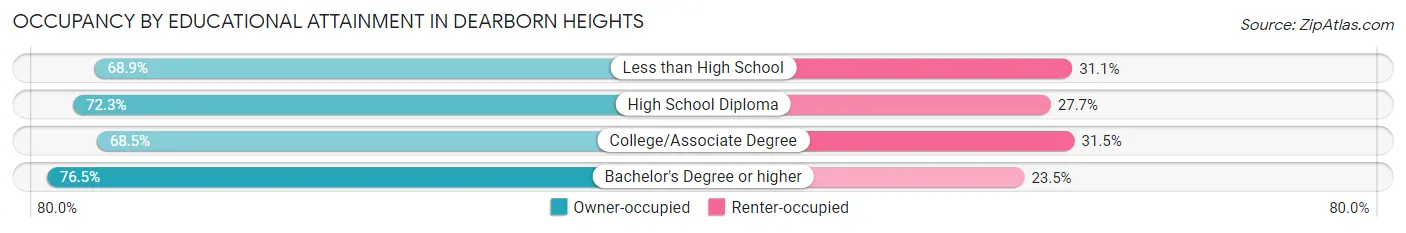
| Household Size | Owner-occupied | Renter-occupied |
| Less than High School | 1,497 (68.9%) | 676 (31.1%) |
| High School Diploma | 4,734 (72.3%) | 1,815 (27.7%) |
| College/Associate Degree | 5,151 (68.5%) | 2,364 (31.5%) |
| Bachelor's Degree or higher | 4,461 (76.5%) | 1,372 (23.5%) |
Occupancy by Age of Householder in Dearborn Heights
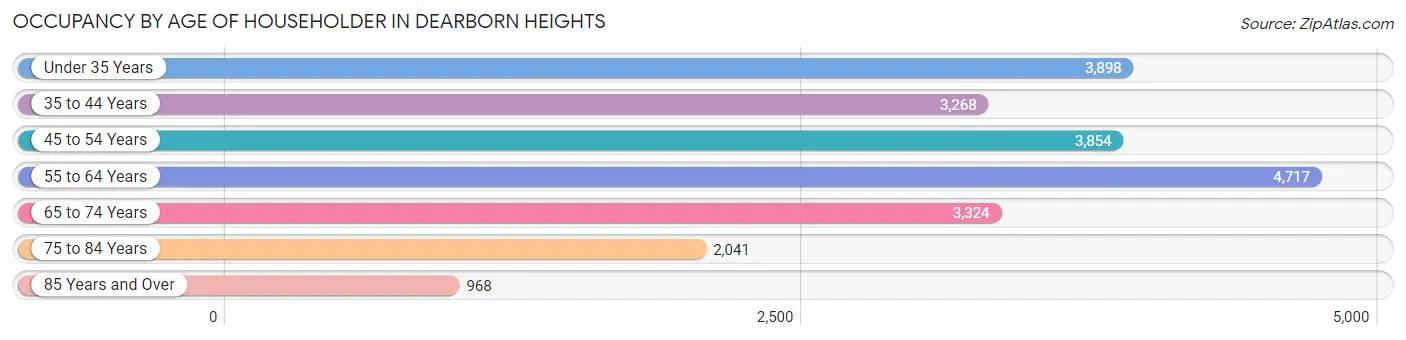
| Age Bracket | # Households | % Households |
| Under 35 Years | 3,898 | 17.7% |
| 35 to 44 Years | 3,268 | 14.8% |
| 45 to 54 Years | 3,854 | 17.5% |
| 55 to 64 Years | 4,717 | 21.4% |
| 65 to 74 Years | 3,324 | 15.1% |
| 75 to 84 Years | 2,041 | 9.2% |
| 85 Years and Over | 968 | 4.4% |
| Total | 22,070 | 100.0% |
Housing Finances in Dearborn Heights
Median Income by Occupancy in Dearborn Heights
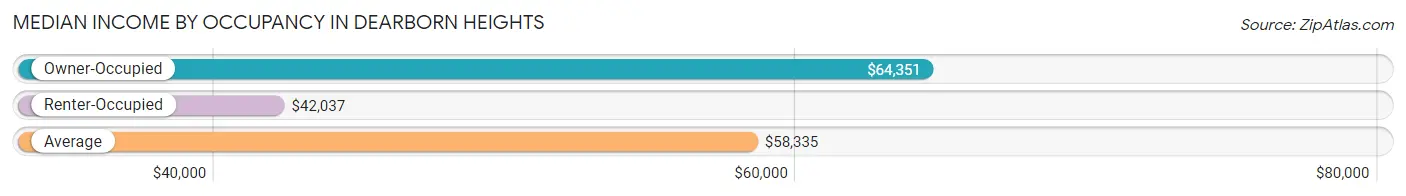
| Occupancy Type | # Households | Median Income |
| Owner-Occupied | 15,843 (71.8%) | $64,351 |
| Renter-Occupied | 6,227 (28.2%) | $42,037 |
| Average | 22,070 (100.0%) | $58,335 |
Occupancy by Householder Income Bracket in Dearborn Heights
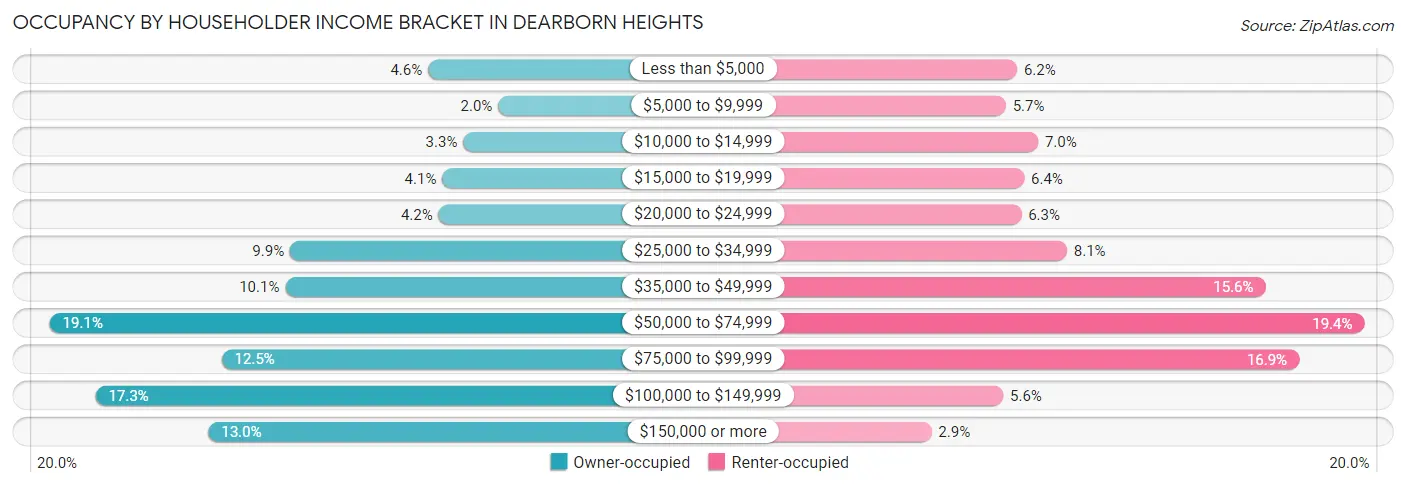
| Income Bracket | Owner-occupied | Renter-occupied |
| Less than $5,000 | 733 (4.6%) | 383 (6.1%) |
| $5,000 to $9,999 | 310 (2.0%) | 356 (5.7%) |
| $10,000 to $14,999 | 522 (3.3%) | 433 (7.0%) |
| $15,000 to $19,999 | 648 (4.1%) | 400 (6.4%) |
| $20,000 to $24,999 | 670 (4.2%) | 393 (6.3%) |
| $25,000 to $34,999 | 1,567 (9.9%) | 501 (8.1%) |
| $35,000 to $49,999 | 1,595 (10.1%) | 972 (15.6%) |
| $50,000 to $74,999 | 3,018 (19.1%) | 1,207 (19.4%) |
| $75,000 to $99,999 | 1,980 (12.5%) | 1,052 (16.9%) |
| $100,000 to $149,999 | 2,741 (17.3%) | 350 (5.6%) |
| $150,000 or more | 2,059 (13.0%) | 180 (2.9%) |
| Total | 15,843 (100.0%) | 6,227 (100.0%) |
Monthly Housing Cost Tiers in Dearborn Heights
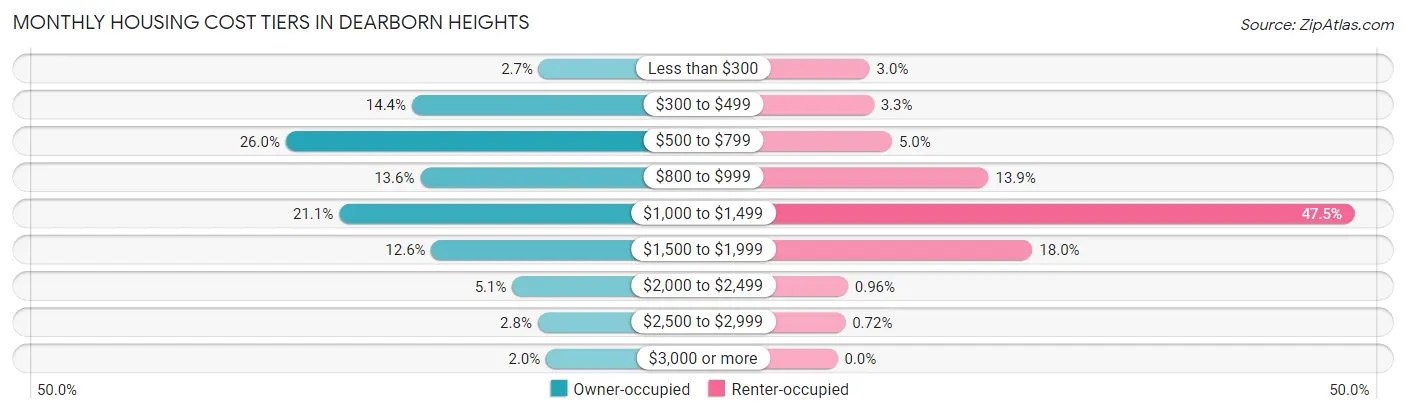
| Monthly Cost | Owner-occupied | Renter-occupied |
| Less than $300 | 421 (2.7%) | 185 (3.0%) |
| $300 to $499 | 2,273 (14.3%) | 208 (3.3%) |
| $500 to $799 | 4,113 (26.0%) | 313 (5.0%) |
| $800 to $999 | 2,152 (13.6%) | 866 (13.9%) |
| $1,000 to $1,499 | 3,335 (21.0%) | 2,960 (47.5%) |
| $1,500 to $1,999 | 1,988 (12.6%) | 1,118 (17.9%) |
| $2,000 to $2,499 | 808 (5.1%) | 60 (1.0%) |
| $2,500 to $2,999 | 437 (2.8%) | 45 (0.7%) |
| $3,000 or more | 316 (2.0%) | 0 (0.0%) |
| Total | 15,843 (100.0%) | 6,227 (100.0%) |
Physical Housing Characteristics in Dearborn Heights
Housing Structures in Dearborn Heights
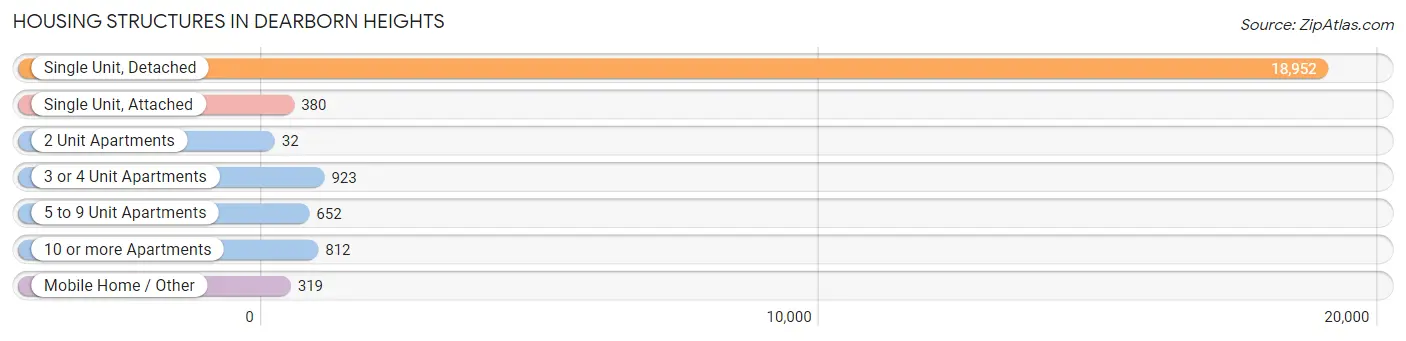
| Structure Type | # Housing Units | % Housing Units |
| Single Unit, Detached | 18,952 | 85.9% |
| Single Unit, Attached | 380 | 1.7% |
| 2 Unit Apartments | 32 | 0.1% |
| 3 or 4 Unit Apartments | 923 | 4.2% |
| 5 to 9 Unit Apartments | 652 | 2.9% |
| 10 or more Apartments | 812 | 3.7% |
| Mobile Home / Other | 319 | 1.5% |
| Total | 22,070 | 100.0% |
Housing Structures by Occupancy in Dearborn Heights
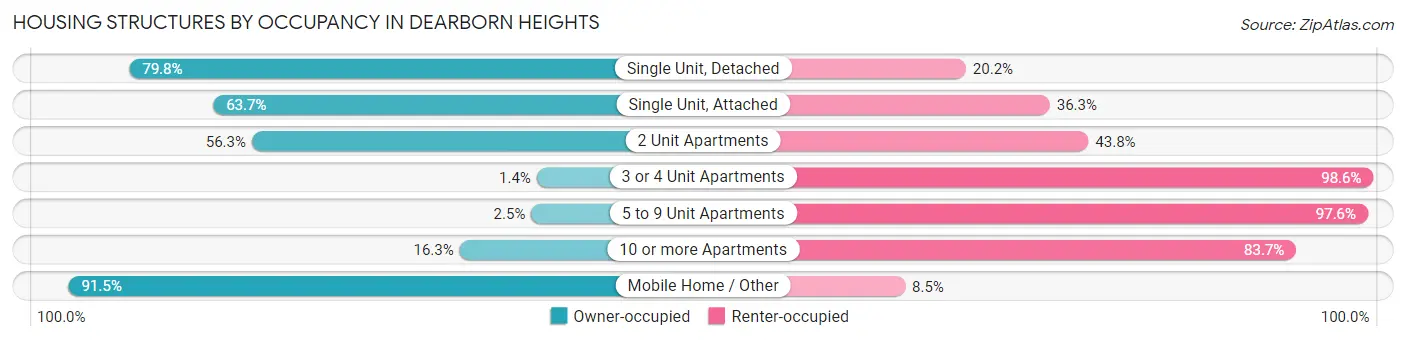
| Structure Type | Owner-occupied | Renter-occupied |
| Single Unit, Detached | 15,130 (79.8%) | 3,822 (20.2%) |
| Single Unit, Attached | 242 (63.7%) | 138 (36.3%) |
| 2 Unit Apartments | 18 (56.2%) | 14 (43.8%) |
| 3 or 4 Unit Apartments | 13 (1.4%) | 910 (98.6%) |
| 5 to 9 Unit Apartments | 16 (2.5%) | 636 (97.6%) |
| 10 or more Apartments | 132 (16.3%) | 680 (83.7%) |
| Mobile Home / Other | 292 (91.5%) | 27 (8.5%) |
| Total | 15,843 (71.8%) | 6,227 (28.2%) |
Housing Structures by Number of Rooms in Dearborn Heights
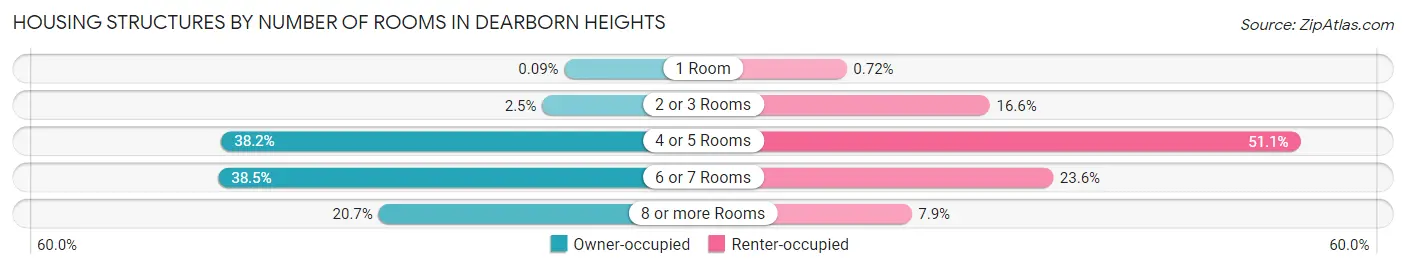
| Number of Rooms | Owner-occupied | Renter-occupied |
| 1 Room | 15 (0.1%) | 45 (0.7%) |
| 2 or 3 Rooms | 402 (2.5%) | 1,034 (16.6%) |
| 4 or 5 Rooms | 6,046 (38.2%) | 3,182 (51.1%) |
| 6 or 7 Rooms | 6,099 (38.5%) | 1,472 (23.6%) |
| 8 or more Rooms | 3,281 (20.7%) | 494 (7.9%) |
| Total | 15,843 (100.0%) | 6,227 (100.0%) |
Housing Structure by Heating Type in Dearborn Heights
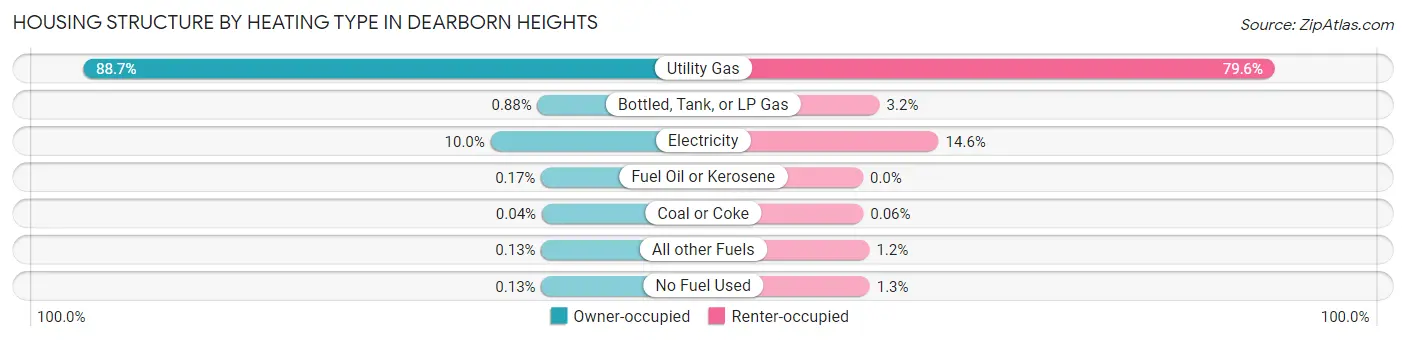
| Heating Type | Owner-occupied | Renter-occupied |
| Utility Gas | 14,051 (88.7%) | 4,955 (79.6%) |
| Bottled, Tank, or LP Gas | 139 (0.9%) | 200 (3.2%) |
| Electricity | 1,577 (10.0%) | 910 (14.6%) |
| Fuel Oil or Kerosene | 27 (0.2%) | 0 (0.0%) |
| Coal or Coke | 7 (0.0%) | 4 (0.1%) |
| All other Fuels | 21 (0.1%) | 77 (1.2%) |
| No Fuel Used | 21 (0.1%) | 81 (1.3%) |
| Total | 15,843 (100.0%) | 6,227 (100.0%) |
Household Vehicle Usage in Dearborn Heights
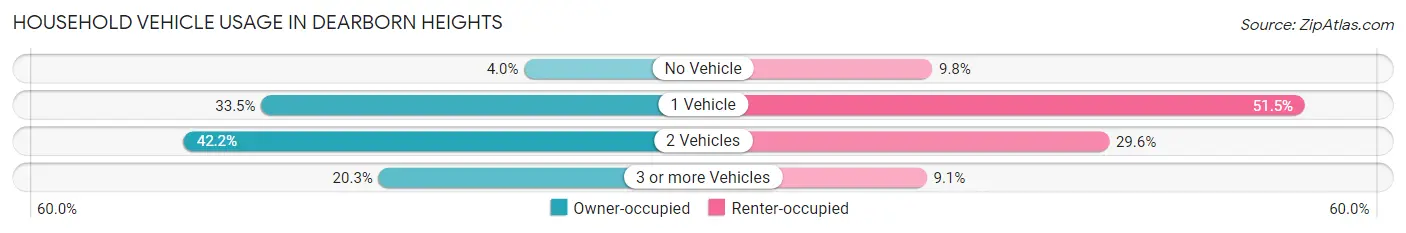
| Vehicles per Household | Owner-occupied | Renter-occupied |
| No Vehicle | 637 (4.0%) | 608 (9.8%) |
| 1 Vehicle | 5,304 (33.5%) | 3,208 (51.5%) |
| 2 Vehicles | 6,679 (42.2%) | 1,842 (29.6%) |
| 3 or more Vehicles | 3,223 (20.3%) | 569 (9.1%) |
| Total | 15,843 (100.0%) | 6,227 (100.0%) |
Real Estate & Mortgages in Dearborn Heights
Real Estate and Mortgage Overview in Dearborn Heights
| Characteristic | Without Mortgage | With Mortgage |
| Housing Units | 7,854 | 7,989 |
| Median Property Value | $146,000 | $174,700 |
| Median Household Income | $53,317 | $1,219 |
| Monthly Housing Costs | $590 | $316 |
| Real Estate Taxes | $2,722 | $215 |
Property Value by Mortgage Status in Dearborn Heights
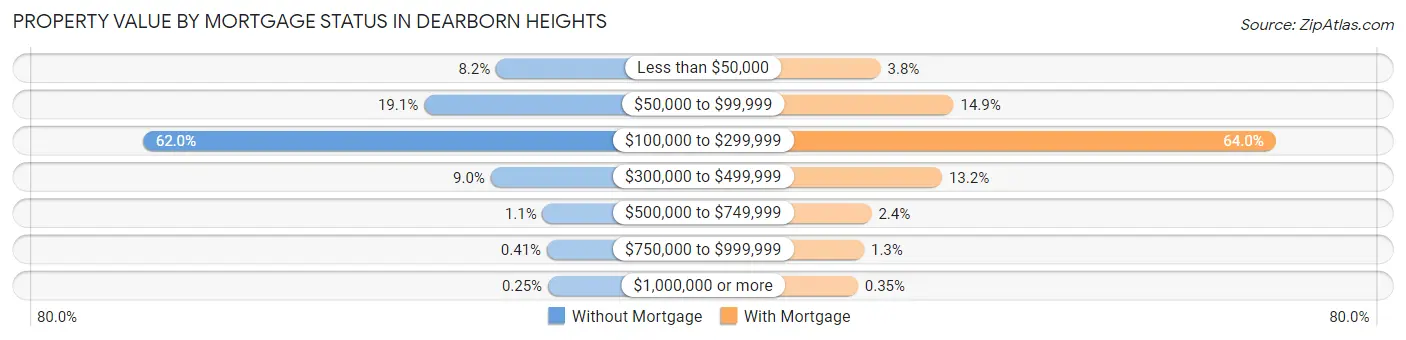
| Property Value | Without Mortgage | With Mortgage |
| Less than $50,000 | 641 (8.2%) | 305 (3.8%) |
| $50,000 to $99,999 | 1,503 (19.1%) | 1,193 (14.9%) |
| $100,000 to $299,999 | 4,868 (62.0%) | 5,114 (64.0%) |
| $300,000 to $499,999 | 705 (9.0%) | 1,052 (13.2%) |
| $500,000 to $749,999 | 85 (1.1%) | 194 (2.4%) |
| $750,000 to $999,999 | 32 (0.4%) | 103 (1.3%) |
| $1,000,000 or more | 20 (0.3%) | 28 (0.4%) |
| Total | 7,854 (100.0%) | 7,989 (100.0%) |
Household Income by Mortgage Status in Dearborn Heights
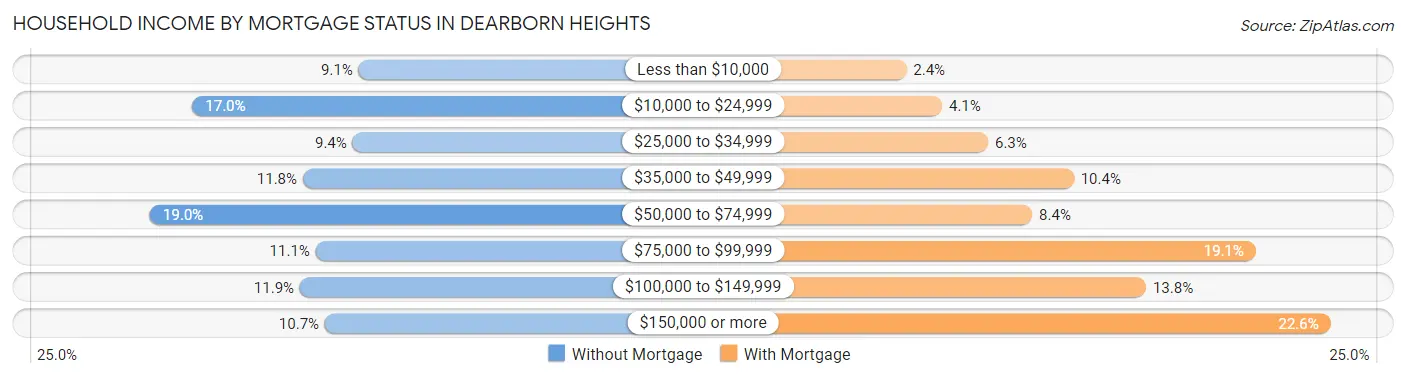
| Household Income | Without Mortgage | With Mortgage |
| Less than $10,000 | 714 (9.1%) | 193 (2.4%) |
| $10,000 to $24,999 | 1,336 (17.0%) | 329 (4.1%) |
| $25,000 to $34,999 | 737 (9.4%) | 504 (6.3%) |
| $35,000 to $49,999 | 923 (11.7%) | 830 (10.4%) |
| $50,000 to $74,999 | 1,495 (19.0%) | 672 (8.4%) |
| $75,000 to $99,999 | 875 (11.1%) | 1,523 (19.1%) |
| $100,000 to $149,999 | 934 (11.9%) | 1,105 (13.8%) |
| $150,000 or more | 840 (10.7%) | 1,807 (22.6%) |
| Total | 7,854 (100.0%) | 7,989 (100.0%) |
Property Value to Household Income Ratio in Dearborn Heights
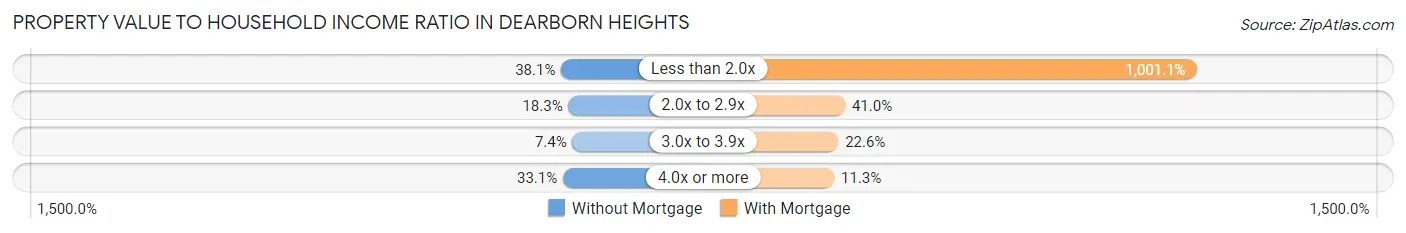
| Value-to-Income Ratio | Without Mortgage | With Mortgage |
| Less than 2.0x | 2,994 (38.1%) | 79,980 (1,001.1%) |
| 2.0x to 2.9x | 1,438 (18.3%) | 3,278 (41.0%) |
| 3.0x to 3.9x | 580 (7.4%) | 1,804 (22.6%) |
| 4.0x or more | 2,600 (33.1%) | 906 (11.3%) |
| Total | 7,854 (100.0%) | 7,989 (100.0%) |
Real Estate Taxes by Mortgage Status in Dearborn Heights
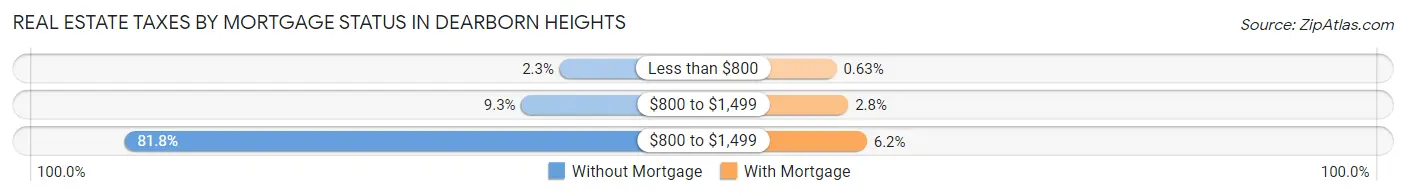
| Property Taxes | Without Mortgage | With Mortgage |
| Less than $800 | 177 (2.2%) | 50 (0.6%) |
| $800 to $1,499 | 727 (9.3%) | 221 (2.8%) |
| $800 to $1,499 | 6,421 (81.8%) | 492 (6.2%) |
| Total | 7,854 (100.0%) | 7,989 (100.0%) |
Health & Disability in Dearborn Heights
Health Insurance Coverage by Age in Dearborn Heights
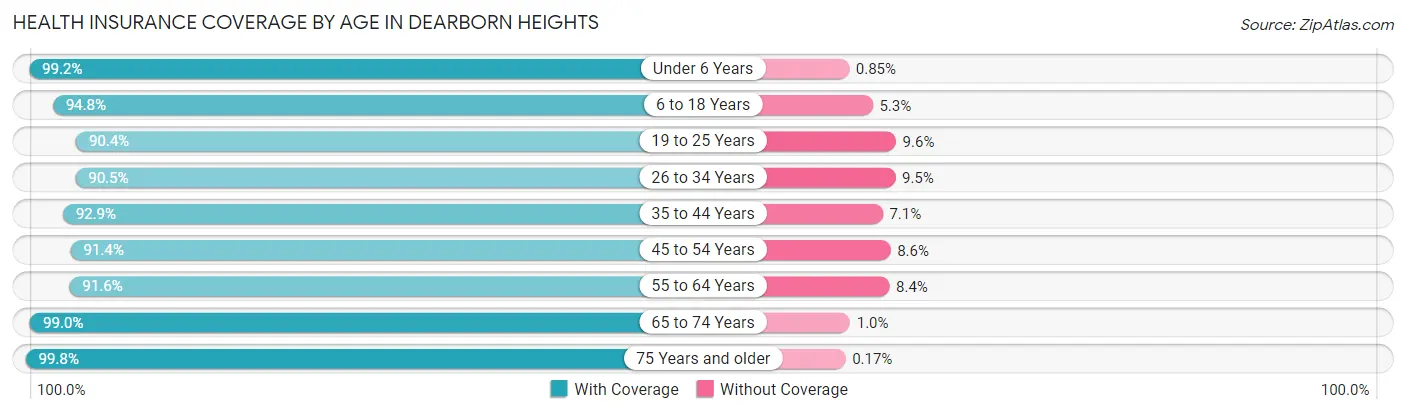
| Age Bracket | With Coverage | Without Coverage |
| Under 6 Years | 5,365 (99.2%) | 46 (0.9%) |
| 6 to 18 Years | 10,431 (94.8%) | 578 (5.2%) |
| 19 to 25 Years | 4,812 (90.4%) | 510 (9.6%) |
| 26 to 34 Years | 7,679 (90.5%) | 802 (9.5%) |
| 35 to 44 Years | 6,150 (92.9%) | 471 (7.1%) |
| 45 to 54 Years | 6,777 (91.4%) | 635 (8.6%) |
| 55 to 64 Years | 7,540 (91.6%) | 688 (8.4%) |
| 65 to 74 Years | 5,352 (99.0%) | 55 (1.0%) |
| 75 Years and older | 4,128 (99.8%) | 7 (0.2%) |
| Total | 58,234 (93.9%) | 3,792 (6.1%) |
Health Insurance Coverage by Citizenship Status in Dearborn Heights
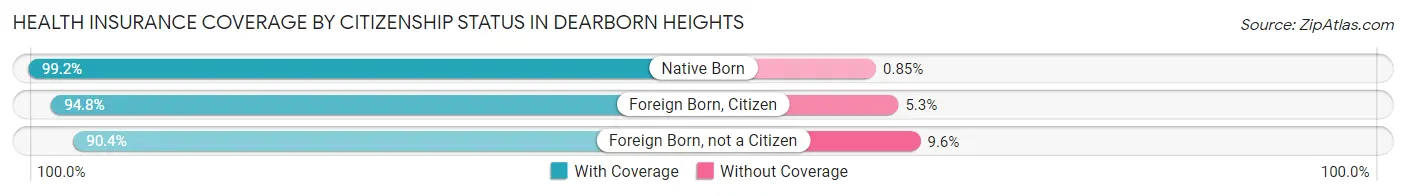
| Citizenship Status | With Coverage | Without Coverage |
| Native Born | 5,365 (99.2%) | 46 (0.9%) |
| Foreign Born, Citizen | 10,431 (94.8%) | 578 (5.2%) |
| Foreign Born, not a Citizen | 4,812 (90.4%) | 510 (9.6%) |
Health Insurance Coverage by Household Income in Dearborn Heights
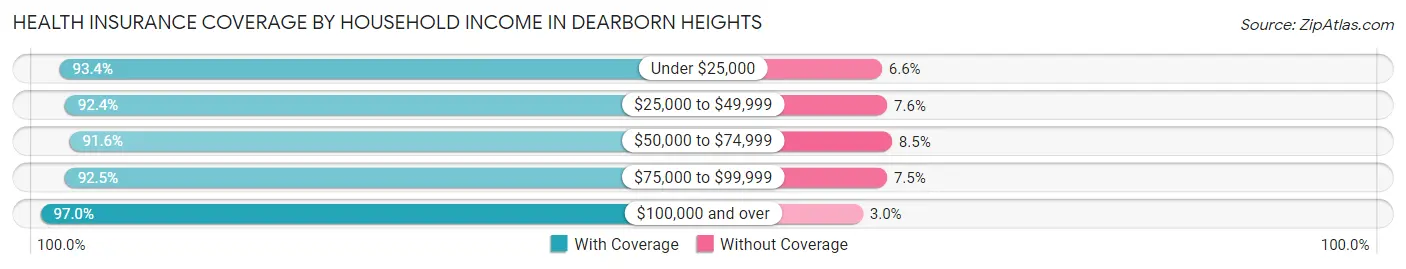
| Household Income | With Coverage | Without Coverage |
| Under $25,000 | 10,350 (93.4%) | 728 (6.6%) |
| $25,000 to $49,999 | 11,317 (92.4%) | 925 (7.6%) |
| $50,000 to $74,999 | 10,229 (91.5%) | 944 (8.5%) |
| $75,000 to $99,999 | 7,525 (92.5%) | 613 (7.5%) |
| $100,000 and over | 18,733 (97.0%) | 582 (3.0%) |
Public vs Private Health Insurance Coverage by Age in Dearborn Heights
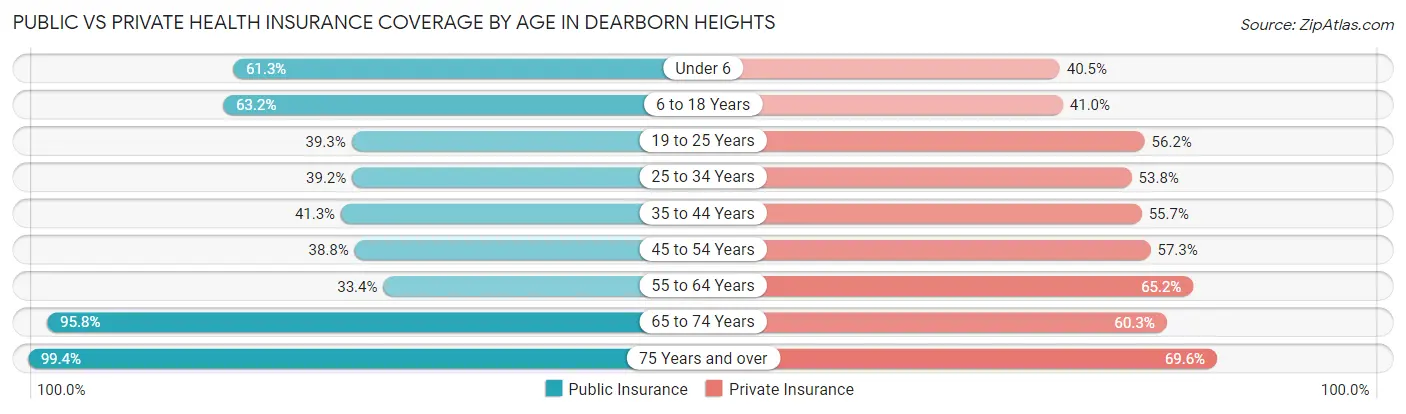
| Age Bracket | Public Insurance | Private Insurance |
| Under 6 | 3,318 (61.3%) | 2,190 (40.5%) |
| 6 to 18 Years | 6,954 (63.2%) | 4,517 (41.0%) |
| 19 to 25 Years | 2,092 (39.3%) | 2,992 (56.2%) |
| 25 to 34 Years | 3,325 (39.2%) | 4,563 (53.8%) |
| 35 to 44 Years | 2,733 (41.3%) | 3,686 (55.7%) |
| 45 to 54 Years | 2,872 (38.8%) | 4,248 (57.3%) |
| 55 to 64 Years | 2,750 (33.4%) | 5,366 (65.2%) |
| 65 to 74 Years | 5,181 (95.8%) | 3,260 (60.3%) |
| 75 Years and over | 4,111 (99.4%) | 2,879 (69.6%) |
| Total | 33,336 (53.7%) | 33,701 (54.3%) |
Disability Status by Sex by Age in Dearborn Heights
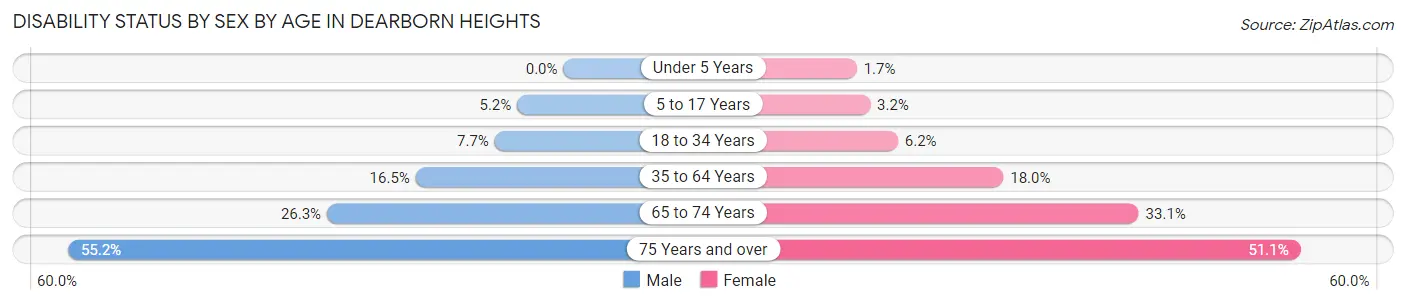
| Age Bracket | Male | Female |
| Under 5 Years | 0 (0.0%) | 37 (1.7%) |
| 5 to 17 Years | 298 (5.1%) | 179 (3.2%) |
| 18 to 34 Years | 553 (7.6%) | 460 (6.2%) |
| 35 to 64 Years | 1,821 (16.5%) | 2,013 (18.0%) |
| 65 to 74 Years | 725 (26.3%) | 877 (33.1%) |
| 75 Years and over | 886 (55.2%) | 1,292 (51.1%) |
Disability Class by Sex by Age in Dearborn Heights
Disability Class: Hearing Difficulty
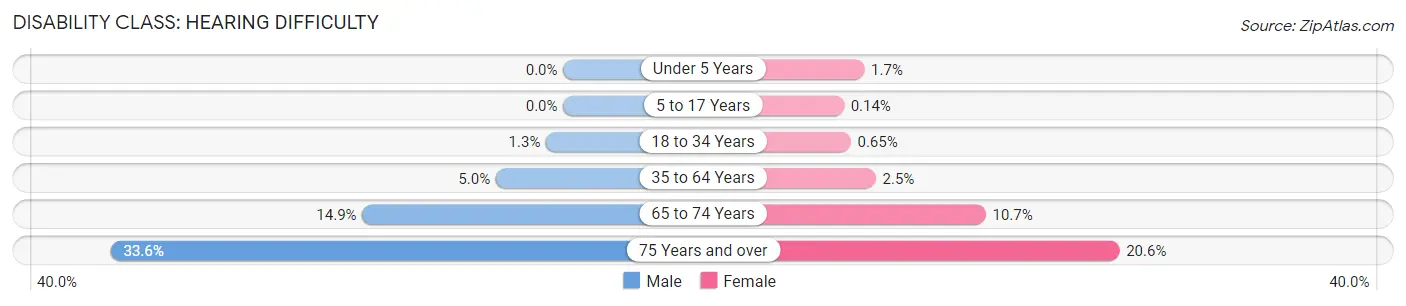
| Age Bracket | Male | Female |
| Under 5 Years | 0 (0.0%) | 37 (1.7%) |
| 5 to 17 Years | 0 (0.0%) | 8 (0.1%) |
| 18 to 34 Years | 92 (1.3%) | 48 (0.6%) |
| 35 to 64 Years | 553 (5.0%) | 281 (2.5%) |
| 65 to 74 Years | 411 (14.9%) | 283 (10.7%) |
| 75 Years and over | 540 (33.6%) | 521 (20.6%) |
Disability Class: Vision Difficulty
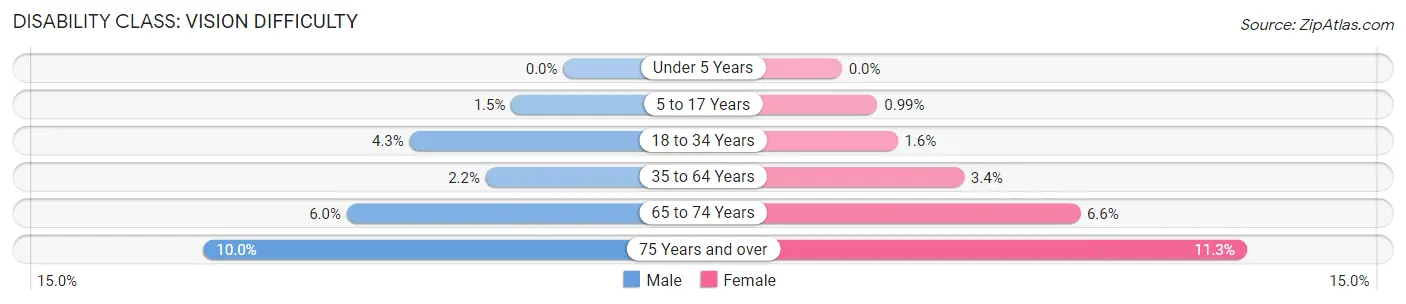
| Age Bracket | Male | Female |
| Under 5 Years | 0 (0.0%) | 0 (0.0%) |
| 5 to 17 Years | 84 (1.5%) | 56 (1.0%) |
| 18 to 34 Years | 309 (4.3%) | 114 (1.5%) |
| 35 to 64 Years | 239 (2.2%) | 380 (3.4%) |
| 65 to 74 Years | 166 (6.0%) | 176 (6.6%) |
| 75 Years and over | 161 (10.0%) | 285 (11.3%) |
Disability Class: Cognitive Difficulty
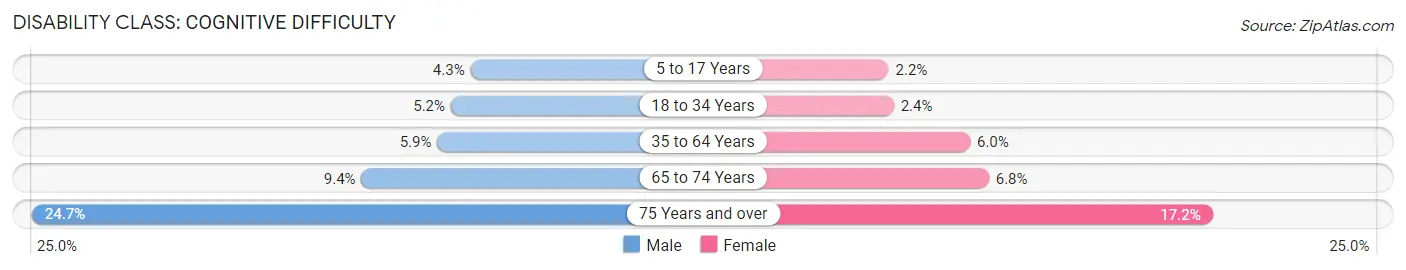
| Age Bracket | Male | Female |
| 5 to 17 Years | 249 (4.3%) | 123 (2.2%) |
| 18 to 34 Years | 377 (5.2%) | 178 (2.4%) |
| 35 to 64 Years | 648 (5.9%) | 666 (5.9%) |
| 65 to 74 Years | 258 (9.4%) | 181 (6.8%) |
| 75 Years and over | 396 (24.7%) | 435 (17.2%) |
Disability Class: Ambulatory Difficulty
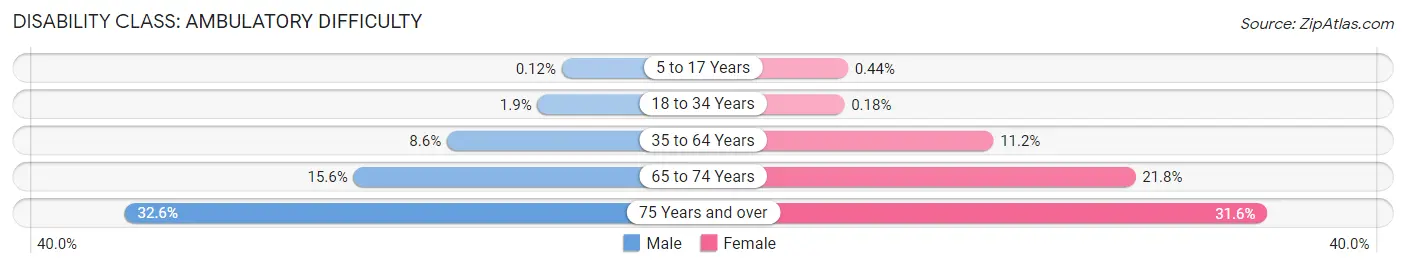
| Age Bracket | Male | Female |
| 5 to 17 Years | 7 (0.1%) | 25 (0.4%) |
| 18 to 34 Years | 139 (1.9%) | 13 (0.2%) |
| 35 to 64 Years | 956 (8.6%) | 1,258 (11.2%) |
| 65 to 74 Years | 429 (15.6%) | 578 (21.8%) |
| 75 Years and over | 523 (32.6%) | 799 (31.6%) |
Disability Class: Self-Care Difficulty
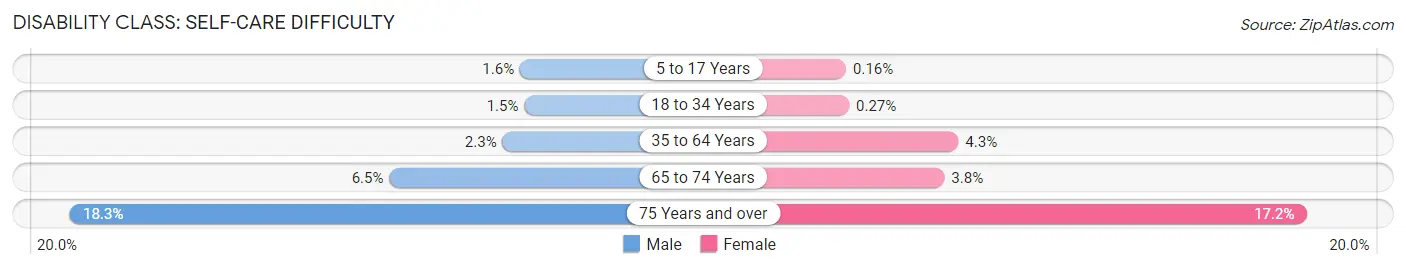
| Age Bracket | Male | Female |
| 5 to 17 Years | 93 (1.6%) | 9 (0.2%) |
| 18 to 34 Years | 105 (1.5%) | 20 (0.3%) |
| 35 to 64 Years | 250 (2.3%) | 485 (4.3%) |
| 65 to 74 Years | 178 (6.5%) | 101 (3.8%) |
| 75 Years and over | 294 (18.3%) | 436 (17.2%) |
Technology Access in Dearborn Heights
Computing Device Access in Dearborn Heights
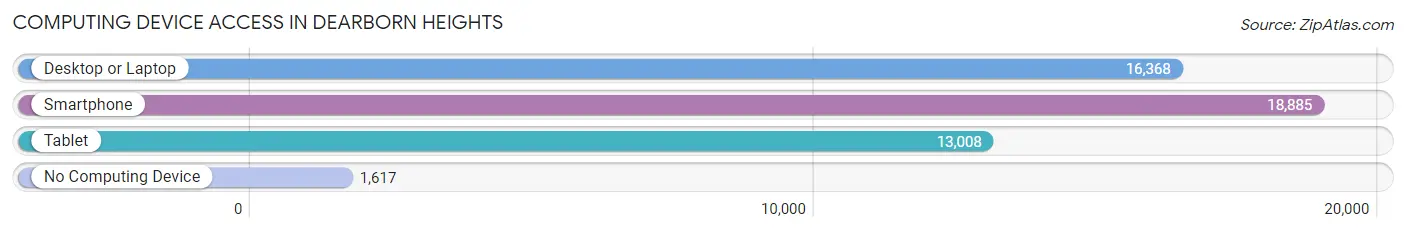
| Device Type | # Households | % Households |
| Desktop or Laptop | 16,368 | 74.2% |
| Smartphone | 18,885 | 85.6% |
| Tablet | 13,008 | 58.9% |
| No Computing Device | 1,617 | 7.3% |
| Total | 22,070 | 100.0% |
Internet Access in Dearborn Heights
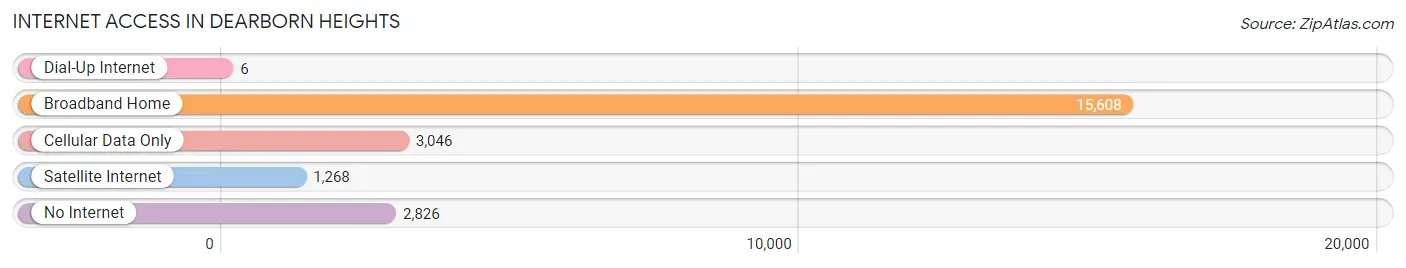
| Internet Type | # Households | % Households |
| Dial-Up Internet | 6 | 0.0% |
| Broadband Home | 15,608 | 70.7% |
| Cellular Data Only | 3,046 | 13.8% |
| Satellite Internet | 1,268 | 5.8% |
| No Internet | 2,826 | 12.8% |
| Total | 22,070 | 100.0% |
Dearborn Heights Summary
Introduction
Dearborn Heights is a city located in Wayne County, Michigan. It is a suburb of Detroit and is part of the Metro Detroit area. The city has a population of 57,774 as of the 2010 census. Dearborn Heights is known for its diverse population, with a large Arab-American population, as well as a large African-American population. The city is also home to many parks and recreational areas, making it a great place to live and visit.
History
The area that is now Dearborn Heights was originally inhabited by the Potawatomi Native Americans. The first European settlers arrived in the area in the early 1800s. The area was originally part of Dearborn Township, which was established in 1833. In the late 1800s, the area began to develop as a farming community.
In the early 1900s, the area began to experience rapid growth due to the automobile industry. The city of Dearborn Heights was officially incorporated in 1960. The city was formed by the merger of the villages of Inkster and Dearborn. The city has continued to grow since then, and is now home to a diverse population.
Geography
Dearborn Heights is located in Wayne County, Michigan. It is situated on the western edge of Detroit, and is part of the Metro Detroit area. The city has a total area of 10.2 square miles, of which 10.1 square miles is land and 0.1 square miles is water. The city is bordered by the cities of Dearborn, Livonia, Redford Township, and Westland.
The city is located in the Huron River watershed. The Huron River runs through the city, and there are several parks and recreational areas along its banks. The city is also home to several lakes, including Lake Erie, Lake St. Clair, and Lake Huron.
Economy
The economy of Dearborn Heights is largely based on the automotive industry. The city is home to several automotive-related businesses, including Ford Motor Company, which has its world headquarters in Dearborn. The city is also home to several other businesses, including manufacturing, retail, and healthcare.
The city has a median household income of $50,845, and the median home value is $127,400. The unemployment rate in the city is 4.2%, which is lower than the national average.
Demographics
As of the 2010 census, the population of Dearborn Heights was 57,774. The city has a diverse population, with a large Arab-American population, as well as a large African-American population. The city is also home to a large number of immigrants from other countries, including Iraq, Syria, and Lebanon.
The city has a median age of 39.7 years, and the median household income is $50,845. The city has a poverty rate of 13.3%, which is higher than the national average.
Conclusion
Dearborn Heights is a city located in Wayne County, Michigan. It is a suburb of Detroit and is part of the Metro Detroit area. The city has a population of 57,774 as of the 2010 census. Dearborn Heights is known for its diverse population, with a large Arab-American population, as well as a large African-American population. The city is also home to many parks and recreational areas, making it a great place to live and visit. The economy of Dearborn Heights is largely based on the automotive industry, and the city has a median household income of $50,845. The city has a diverse population, with a large Arab-American population, as well as a large African-American population.
Common Questions
What is Per Capita Income in Dearborn Heights?
Per Capita income in Dearborn Heights is $28,115.
What is the Median Family Income in Dearborn Heights?
Median Family Income in Dearborn Heights is $65,171.
What is the Median Household income in Dearborn Heights?
Median Household Income in Dearborn Heights is $58,335.
What is Income or Wage Gap in Dearborn Heights?
Income or Wage Gap in Dearborn Heights is 32.7%.
Women in Dearborn Heights earn 67.3 cents for every dollar earned by a man.
What is Family Income Deficit in Dearborn Heights?
Family Income Deficit in Dearborn Heights is $11,782.
Families that are below poverty line in Dearborn Heights earn $11,782 less on average than the poverty threshold level.
What is Inequality or Gini Index in Dearborn Heights?
Inequality or Gini Index in Dearborn Heights is 0.46.
What is the Total Population of Dearborn Heights?
Total Population of Dearborn Heights is 62,474.
What is the Total Male Population of Dearborn Heights?
Total Male Population of Dearborn Heights is 30,592.
What is the Total Female Population of Dearborn Heights?
Total Female Population of Dearborn Heights is 31,882.
What is the Ratio of Males per 100 Females in Dearborn Heights?
There are 95.95 Males per 100 Females in Dearborn Heights.
What is the Ratio of Females per 100 Males in Dearborn Heights?
There are 104.22 Females per 100 Males in Dearborn Heights.
What is the Median Population Age in Dearborn Heights?
Median Population Age in Dearborn Heights is 36.0 Years.
What is the Average Family Size in Dearborn Heights
Average Family Size in Dearborn Heights is 3.5 People.
What is the Average Household Size in Dearborn Heights
Average Household Size in Dearborn Heights is 2.8 People.
How Large is the Labor Force in Dearborn Heights?
There are 27,303 People in the Labor Forcein in Dearborn Heights.
What is the Percentage of People in the Labor Force in Dearborn Heights?
55.9% of People are in the Labor Force in Dearborn Heights.
What is the Unemployment Rate in Dearborn Heights?
Unemployment Rate in Dearborn Heights is 8.2%.