Gladstone, MI Map & Demographics
Gladstone Map
Gladstone Overview
$27,496
PER CAPITA INCOME
$79,420
AVG FAMILY INCOME
$59,133
AVG HOUSEHOLD INCOME
56.5%
WAGE / INCOME GAP [ % ]
43.5¢/ $1
WAGE / INCOME GAP [ $ ]
$10,285
FAMILY INCOME DEFICIT
0.39
INEQUALITY / GINI INDEX
5,231
TOTAL POPULATION
2,640
MALE POPULATION
2,591
FEMALE POPULATION
101.89
MALES / 100 FEMALES
98.14
FEMALES / 100 MALES
40.5
MEDIAN AGE
3.1
AVG FAMILY SIZE
2.6
AVG HOUSEHOLD SIZE
2,316
LABOR FORCE [ PEOPLE ]
54.8%
PERCENT IN LABOR FORCE
3.8%
UNEMPLOYMENT RATE
Gladstone Zip Codes
Gladstone Area Codes
Income in Gladstone
Income Overview in Gladstone
Per Capita Income in Gladstone is $27,496, while median incomes of families and households are $79,420 and $59,133 respectively.
| Characteristic | Number | Measure |
| Per Capita Income | 5,231 | $27,496 |
| Median Family Income | 1,324 | $79,420 |
| Mean Family Income | 1,324 | $79,765 |
| Median Household Income | 1,994 | $59,133 |
| Mean Household Income | 1,994 | $70,406 |
| Income Deficit | 1,324 | $10,285 |
| Wage / Income Gap (%) | 5,231 | 56.45% |
| Wage / Income Gap ($) | 5,231 | 43.55¢ per $1 |
| Gini / Inequality Index | 5,231 | 0.39 |
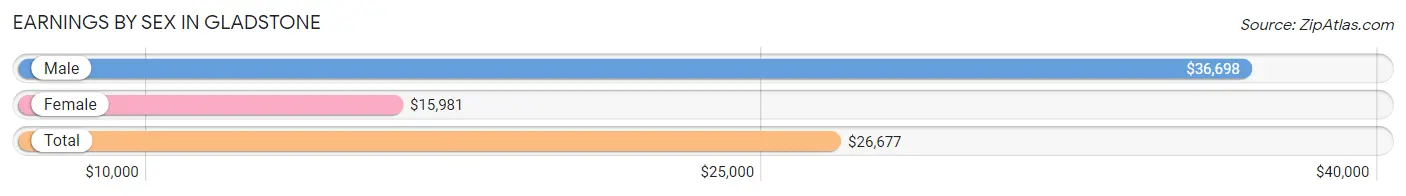
Earnings by Sex in Gladstone
Average Earnings in Gladstone are $26,677, $36,698 for men and $15,981 for women, a difference of 56.5%.
| Sex | Number | Average Earnings |
| Male | 1,520 (55.2%) | $36,698 |
| Female | 1,235 (44.8%) | $15,981 |
| Total | 2,755 (100.0%) | $26,677 |
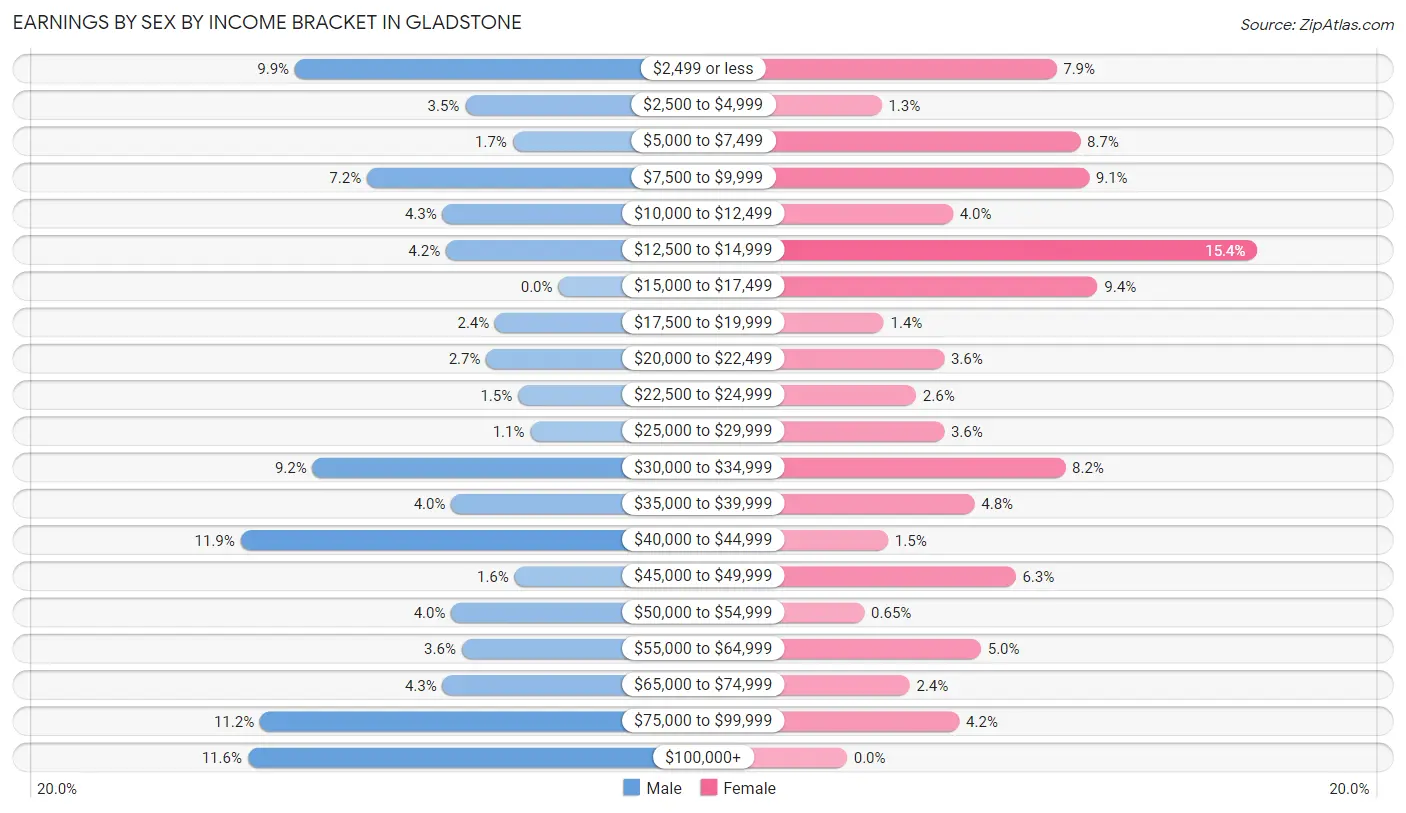
Earnings by Sex by Income Bracket in Gladstone
The most common earnings brackets in Gladstone are $40,000 to $44,999 for men (181 | 11.9%) and $12,500 to $14,999 for women (190 | 15.4%).
| Income | Male | Female |
| $2,499 or less | 150 (9.9%) | 97 (7.9%) |
| $2,500 to $4,999 | 53 (3.5%) | 16 (1.3%) |
| $5,000 to $7,499 | 26 (1.7%) | 108 (8.7%) |
| $7,500 to $9,999 | 109 (7.2%) | 112 (9.1%) |
| $10,000 to $12,499 | 66 (4.3%) | 49 (4.0%) |
| $12,500 to $14,999 | 64 (4.2%) | 190 (15.4%) |
| $15,000 to $17,499 | 0 (0.0%) | 116 (9.4%) |
| $17,500 to $19,999 | 36 (2.4%) | 17 (1.4%) |
| $20,000 to $22,499 | 41 (2.7%) | 45 (3.6%) |
| $22,500 to $24,999 | 23 (1.5%) | 32 (2.6%) |
| $25,000 to $29,999 | 16 (1.1%) | 45 (3.6%) |
| $30,000 to $34,999 | 140 (9.2%) | 101 (8.2%) |
| $35,000 to $39,999 | 61 (4.0%) | 59 (4.8%) |
| $40,000 to $44,999 | 181 (11.9%) | 19 (1.5%) |
| $45,000 to $49,999 | 25 (1.6%) | 78 (6.3%) |
| $50,000 to $54,999 | 61 (4.0%) | 8 (0.6%) |
| $55,000 to $64,999 | 55 (3.6%) | 62 (5.0%) |
| $65,000 to $74,999 | 66 (4.3%) | 29 (2.4%) |
| $75,000 to $99,999 | 170 (11.2%) | 52 (4.2%) |
| $100,000+ | 177 (11.6%) | 0 (0.0%) |
| Total | 1,520 (100.0%) | 1,235 (100.0%) |
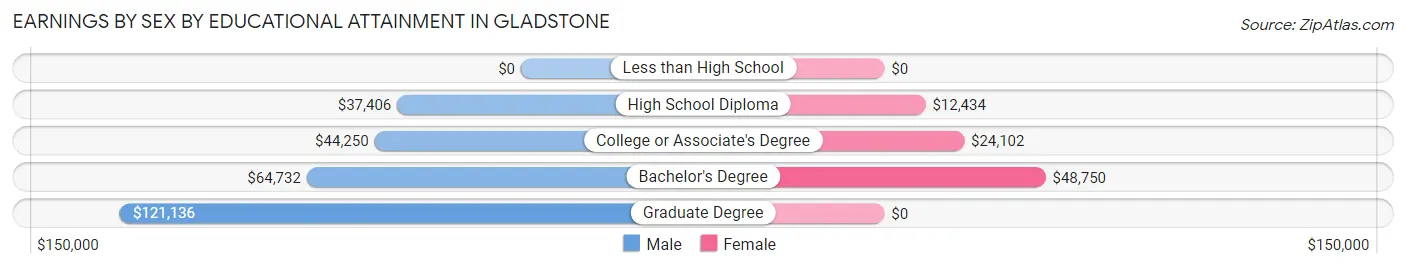
Earnings by Sex by Educational Attainment in Gladstone
Average earnings in Gladstone are $43,265 for men and $17,260 for women, a difference of 60.1%. Men with an educational attainment of graduate degree enjoy the highest average annual earnings of $121,136, while those with high school diploma education earn the least with $37,406. Women with an educational attainment of bachelor's degree earn the most with the average annual earnings of $48,750, while those with high school diploma education have the smallest earnings of $12,434.
| Educational Attainment | Male Income | Female Income |
| Less than High School | - | - |
| High School Diploma | $37,406 | $12,434 |
| College or Associate's Degree | $44,250 | $24,102 |
| Bachelor's Degree | $64,732 | $48,750 |
| Graduate Degree | $121,136 | $0 |
| Total | $43,265 | $17,260 |
Family Income in Gladstone
Family Income Brackets in Gladstone
According to the Gladstone family income data, there are 371 families falling into the $100,000 to $149,999 income range, which is the most common income bracket and makes up 28.0% of all families. Conversely, the $200,000+ income bracket is the least frequent group with only 28 families (2.1%) belonging to this category.
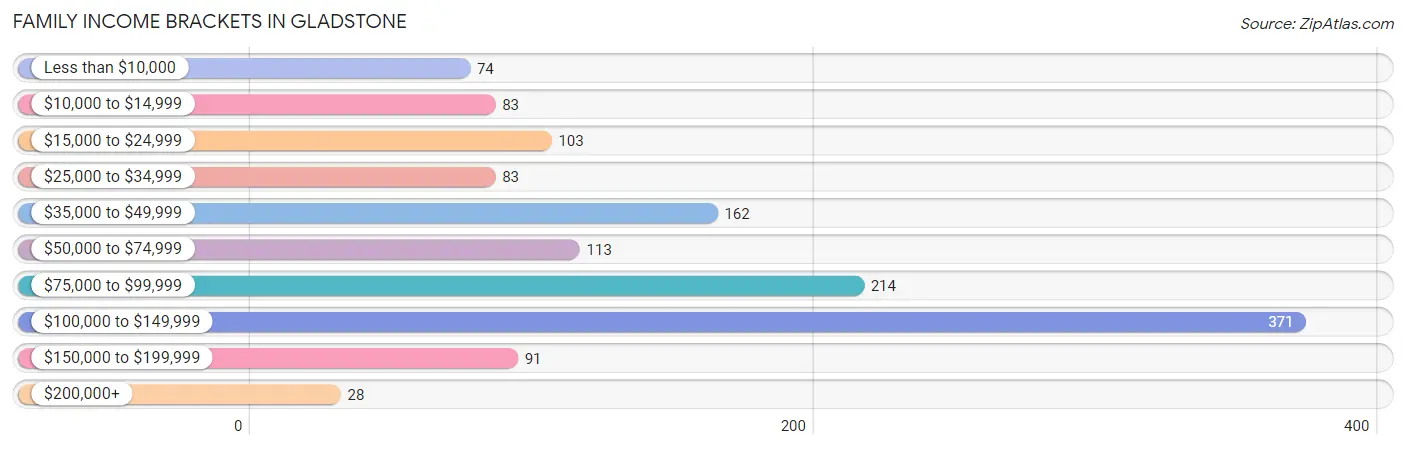
| Income Bracket | # Families | % Families |
| Less than $10,000 | 74 | 5.6% |
| $10,000 to $14,999 | 83 | 6.3% |
| $15,000 to $24,999 | 103 | 7.8% |
| $25,000 to $34,999 | 83 | 6.3% |
| $35,000 to $49,999 | 162 | 12.2% |
| $50,000 to $74,999 | 113 | 8.5% |
| $75,000 to $99,999 | 214 | 16.2% |
| $100,000 to $149,999 | 371 | 28.0% |
| $150,000 to $199,999 | 91 | 6.9% |
| $200,000+ | 28 | 2.1% |
Family Income by Famaliy Size in Gladstone
5-person families (91 | 6.9%) account for the highest median family income in Gladstone with $168,371 per family, while 5-person families (91 | 6.9%) have the highest median income of $33,674 per family member.
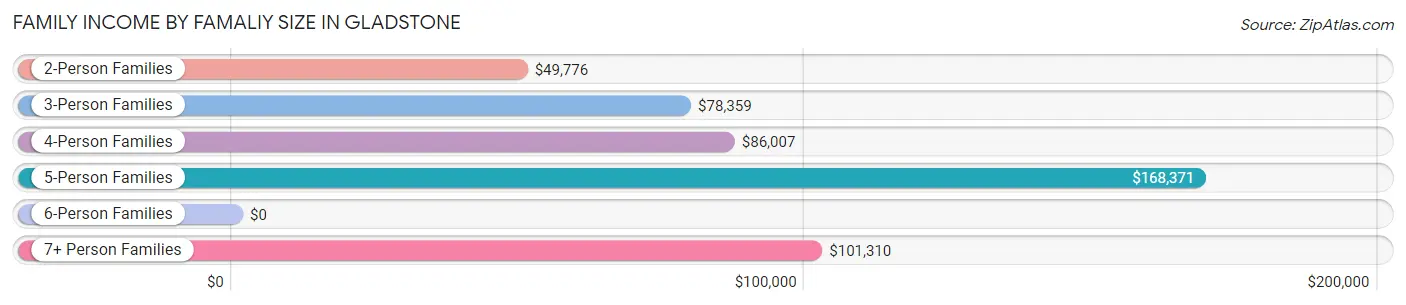
| Income Bracket | # Families | Median Income |
| 2-Person Families | 766 (57.9%) | $49,776 |
| 3-Person Families | 159 (12.0%) | $78,359 |
| 4-Person Families | 211 (15.9%) | $86,007 |
| 5-Person Families | 91 (6.9%) | $168,371 |
| 6-Person Families | 39 (2.9%) | $0 |
| 7+ Person Families | 58 (4.4%) | $101,310 |
| Total | 1,324 (100.0%) | $79,420 |
Family Income by Number of Earners in Gladstone
The median family income in Gladstone is $79,420, with families comprising 3+ earners (174) having the highest median family income of $113,958, while families with 1 earner (425) have the lowest median family income of $31,193, accounting for 13.1% and 32.1% of families, respectively.
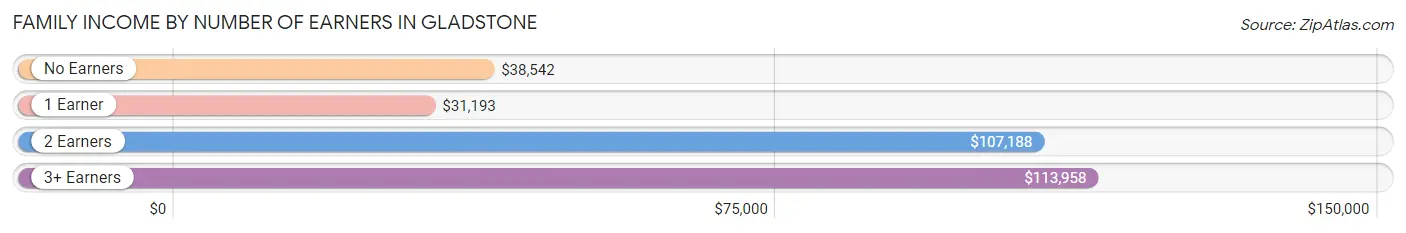
| Number of Earners | # Families | Median Income |
| No Earners | 222 (16.8%) | $38,542 |
| 1 Earner | 425 (32.1%) | $31,193 |
| 2 Earners | 503 (38.0%) | $107,188 |
| 3+ Earners | 174 (13.1%) | $113,958 |
| Total | 1,324 (100.0%) | $79,420 |
Household Income in Gladstone
Household Income Brackets in Gladstone
With 381 households falling in the category, the $100,000 to $149,999 income range is the most frequent in Gladstone, accounting for 19.1% of all households. In contrast, only 28 households (1.4%) fall into the $200,000+ income bracket, making it the least populous group.
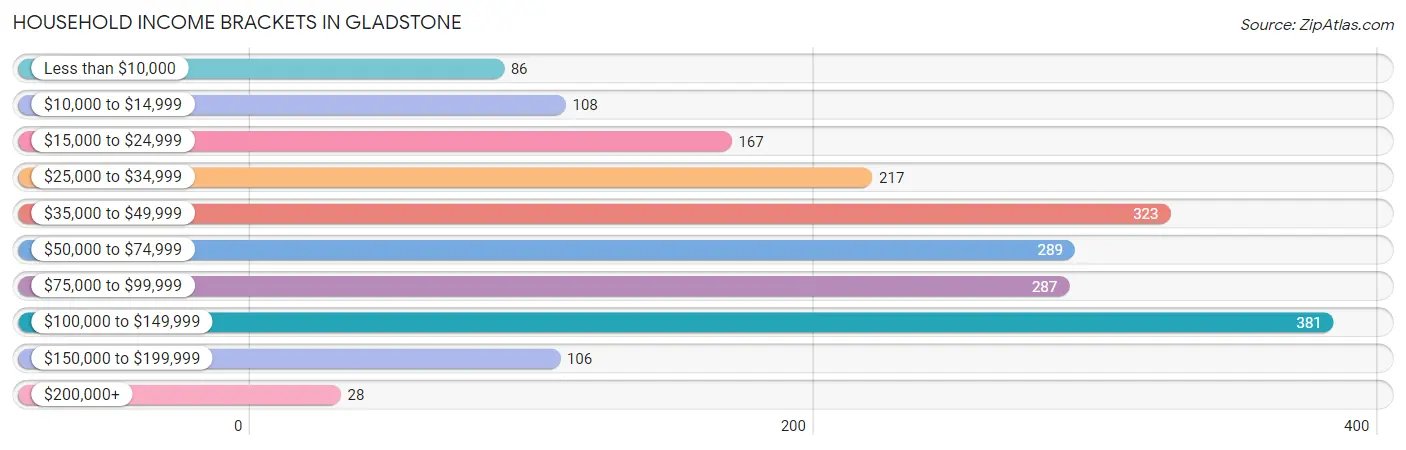
| Income Bracket | # Households | % Households |
| Less than $10,000 | 86 | 4.3% |
| $10,000 to $14,999 | 108 | 5.4% |
| $15,000 to $24,999 | 167 | 8.4% |
| $25,000 to $34,999 | 217 | 10.9% |
| $35,000 to $49,999 | 323 | 16.2% |
| $50,000 to $74,999 | 289 | 14.5% |
| $75,000 to $99,999 | 287 | 14.4% |
| $100,000 to $149,999 | 381 | 19.1% |
| $150,000 to $199,999 | 106 | 5.3% |
| $200,000+ | 28 | 1.4% |
Household Income by Householder Age in Gladstone
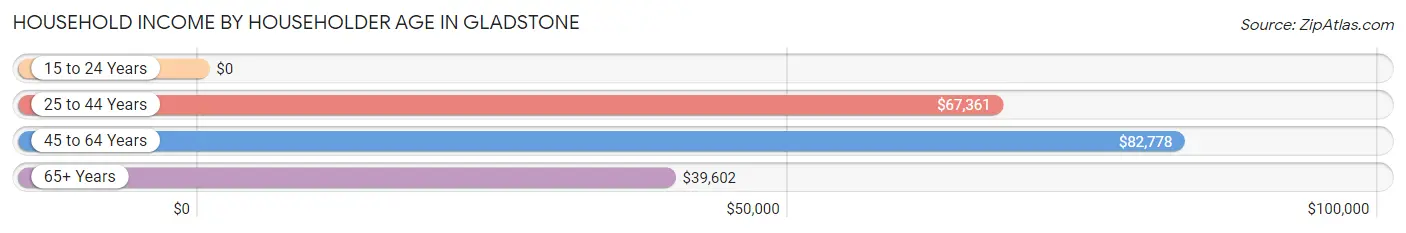
The median household income in Gladstone is $59,133, with the highest median household income of $82,778 found in the 45 to 64 years age bracket for the primary householder. A total of 696 households (34.9%) fall into this category. Meanwhile, the 15 to 24 years age bracket for the primary householder has the lowest median household income of $0, with 47 households (2.4%) in this group.
| Income Bracket | # Households | Median Income |
| 15 to 24 Years | 47 (2.4%) | $0 |
| 25 to 44 Years | 619 (31.0%) | $67,361 |
| 45 to 64 Years | 696 (34.9%) | $82,778 |
| 65+ Years | 632 (31.7%) | $39,602 |
| Total | 1,994 (100.0%) | $59,133 |
Poverty in Gladstone
Income Below Poverty by Sex and Age in Gladstone
With 14.8% poverty level for males and 17.0% for females among the residents of Gladstone, 5 year old males and under 5 year old females are the most vulnerable to poverty, with 27 males (62.8%) and 62 females (50.0%) in their respective age groups living below the poverty level.
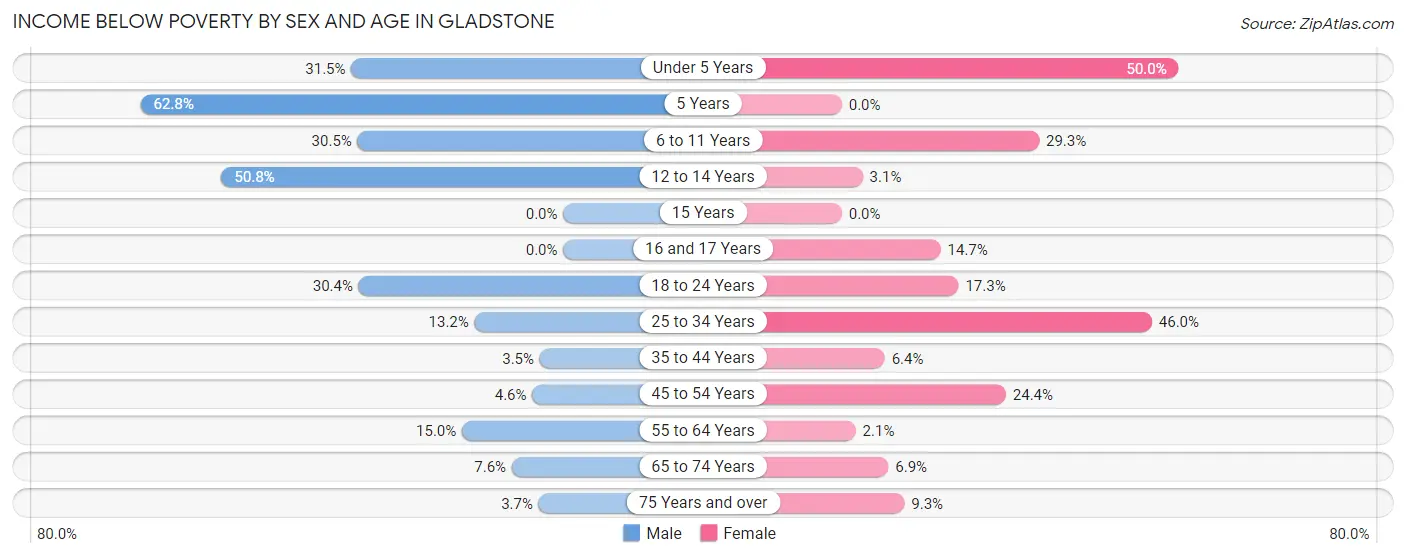
| Age Bracket | Male | Female |
| Under 5 Years | 34 (31.5%) | 62 (50.0%) |
| 5 Years | 27 (62.8%) | 0 (0.0%) |
| 6 to 11 Years | 62 (30.5%) | 58 (29.3%) |
| 12 to 14 Years | 33 (50.8%) | 4 (3.1%) |
| 15 Years | 0 (0.0%) | 0 (0.0%) |
| 16 and 17 Years | 0 (0.0%) | 11 (14.7%) |
| 18 to 24 Years | 82 (30.4%) | 35 (17.3%) |
| 25 to 34 Years | 46 (13.2%) | 128 (46.0%) |
| 35 to 44 Years | 9 (3.5%) | 21 (6.4%) |
| 45 to 54 Years | 16 (4.6%) | 57 (24.4%) |
| 55 to 64 Years | 55 (15.0%) | 7 (2.1%) |
| 65 to 74 Years | 12 (7.6%) | 26 (6.9%) |
| 75 Years and over | 8 (3.6%) | 21 (9.3%) |
| Total | 384 (14.8%) | 430 (17.0%) |
Income Above Poverty by Sex and Age in Gladstone
According to the poverty statistics in Gladstone, males aged 15 years and females aged 5 years are the age groups that are most secure financially, with 100.0% of males and 100.0% of females in these age groups living above the poverty line.
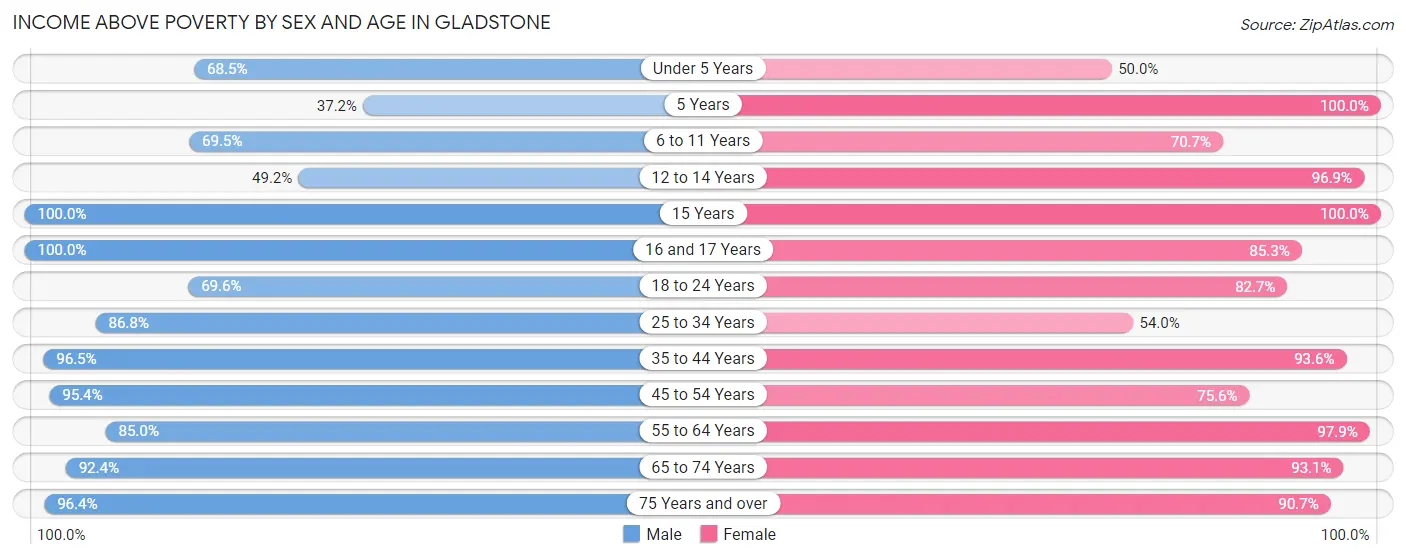
| Age Bracket | Male | Female |
| Under 5 Years | 74 (68.5%) | 62 (50.0%) |
| 5 Years | 16 (37.2%) | 8 (100.0%) |
| 6 to 11 Years | 141 (69.5%) | 140 (70.7%) |
| 12 to 14 Years | 32 (49.2%) | 125 (96.9%) |
| 15 Years | 14 (100.0%) | 13 (100.0%) |
| 16 and 17 Years | 189 (100.0%) | 64 (85.3%) |
| 18 to 24 Years | 188 (69.6%) | 167 (82.7%) |
| 25 to 34 Years | 303 (86.8%) | 150 (54.0%) |
| 35 to 44 Years | 249 (96.5%) | 308 (93.6%) |
| 45 to 54 Years | 332 (95.4%) | 177 (75.6%) |
| 55 to 64 Years | 311 (85.0%) | 333 (97.9%) |
| 65 to 74 Years | 145 (92.4%) | 350 (93.1%) |
| 75 Years and over | 211 (96.4%) | 205 (90.7%) |
| Total | 2,205 (85.2%) | 2,102 (83.0%) |
Income Below Poverty Among Married-Couple Families in Gladstone
The poverty statistics for married-couple families in Gladstone show that 3.6% or 36 of the total 989 families live below the poverty line. Families with 5 or more children have the highest poverty rate of 43.8%, comprising of 7 families. On the other hand, families with 1 or 2 children have the lowest poverty rate of 0.0%, which includes 0 families.
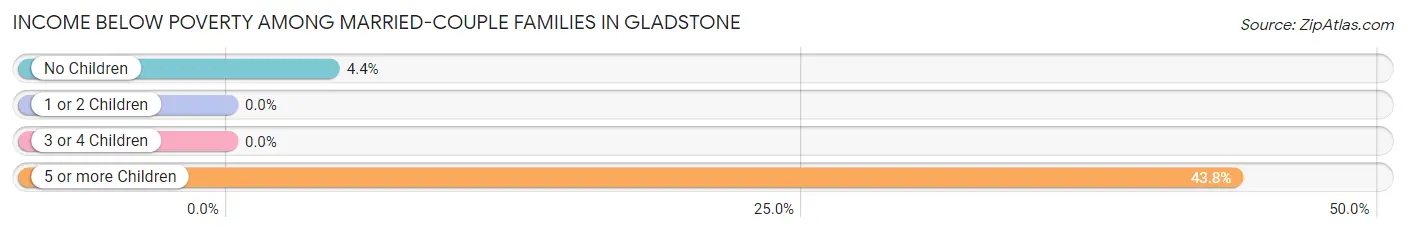
| Children | Above Poverty | Below Poverty |
| No Children | 626 (95.6%) | 29 (4.4%) |
| 1 or 2 Children | 201 (100.0%) | 0 (0.0%) |
| 3 or 4 Children | 117 (100.0%) | 0 (0.0%) |
| 5 or more Children | 9 (56.2%) | 7 (43.8%) |
| Total | 953 (96.4%) | 36 (3.6%) |
Income Below Poverty Among Single-Parent Households in Gladstone
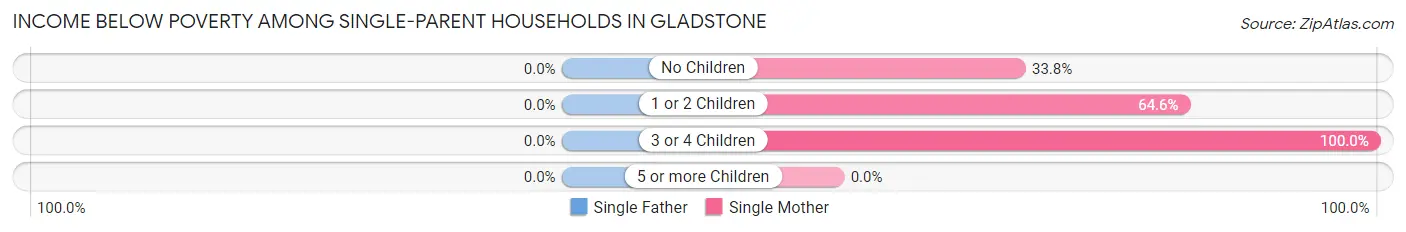
| Children | Single Father | Single Mother |
| No Children | 0 (0.0%) | 25 (33.8%) |
| 1 or 2 Children | 0 (0.0%) | 102 (64.6%) |
| 3 or 4 Children | 0 (0.0%) | 47 (100.0%) |
| 5 or more Children | 0 (0.0%) | 0 (0.0%) |
| Total | 0 (0.0%) | 174 (62.4%) |
Income Below Poverty Among Married-Couple vs Single-Parent Households in Gladstone
The poverty data for Gladstone shows that 36 of the married-couple family households (3.6%) and 174 of the single-parent households (51.9%) are living below the poverty level. Within the married-couple family households, those with 5 or more children have the highest poverty rate, with 7 households (43.8%) falling below the poverty line. Among the single-parent households, those with 3 or 4 children have the highest poverty rate, with 47 household (100.0%) living below poverty.
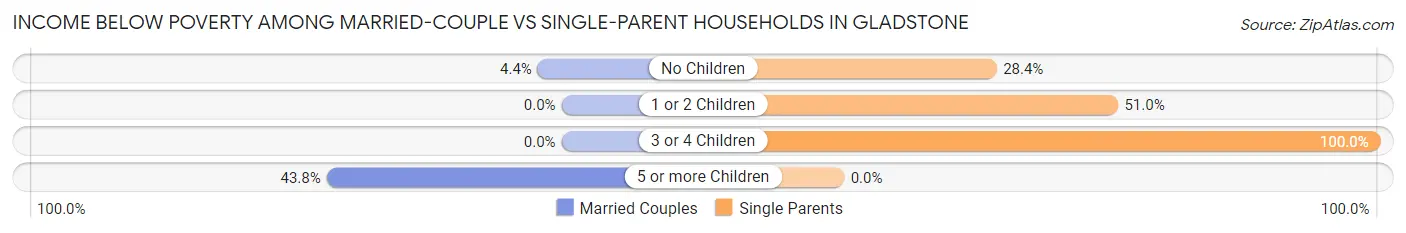
| Children | Married-Couple Families | Single-Parent Households |
| No Children | 29 (4.4%) | 25 (28.4%) |
| 1 or 2 Children | 0 (0.0%) | 102 (51.0%) |
| 3 or 4 Children | 0 (0.0%) | 47 (100.0%) |
| 5 or more Children | 7 (43.8%) | 0 (0.0%) |
| Total | 36 (3.6%) | 174 (51.9%) |
Race in Gladstone
The most populous races in Gladstone are White / Caucasian (4,910 | 93.9%), Two or more Races (227 | 4.3%), and Some other Race (38 | 0.7%).
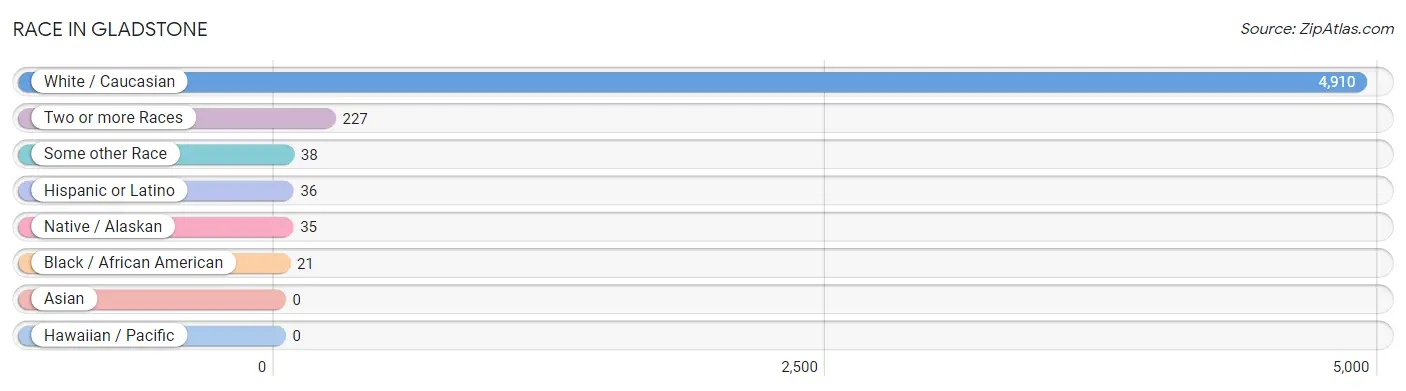
| Race | # Population | % Population |
| Asian | 0 | 0.0% |
| Black / African American | 21 | 0.4% |
| Hawaiian / Pacific | 0 | 0.0% |
| Hispanic or Latino | 36 | 0.7% |
| Native / Alaskan | 35 | 0.7% |
| White / Caucasian | 4,910 | 93.9% |
| Two or more Races | 227 | 4.3% |
| Some other Race | 38 | 0.7% |
| Total | 5,231 | 100.0% |
Ancestry in Gladstone
The most populous ancestries reported in Gladstone are Swedish (871 | 16.7%), German (863 | 16.5%), Finnish (537 | 10.3%), English (385 | 7.4%), and French Canadian (329 | 6.3%), together accounting for 57.1% of all Gladstone residents.
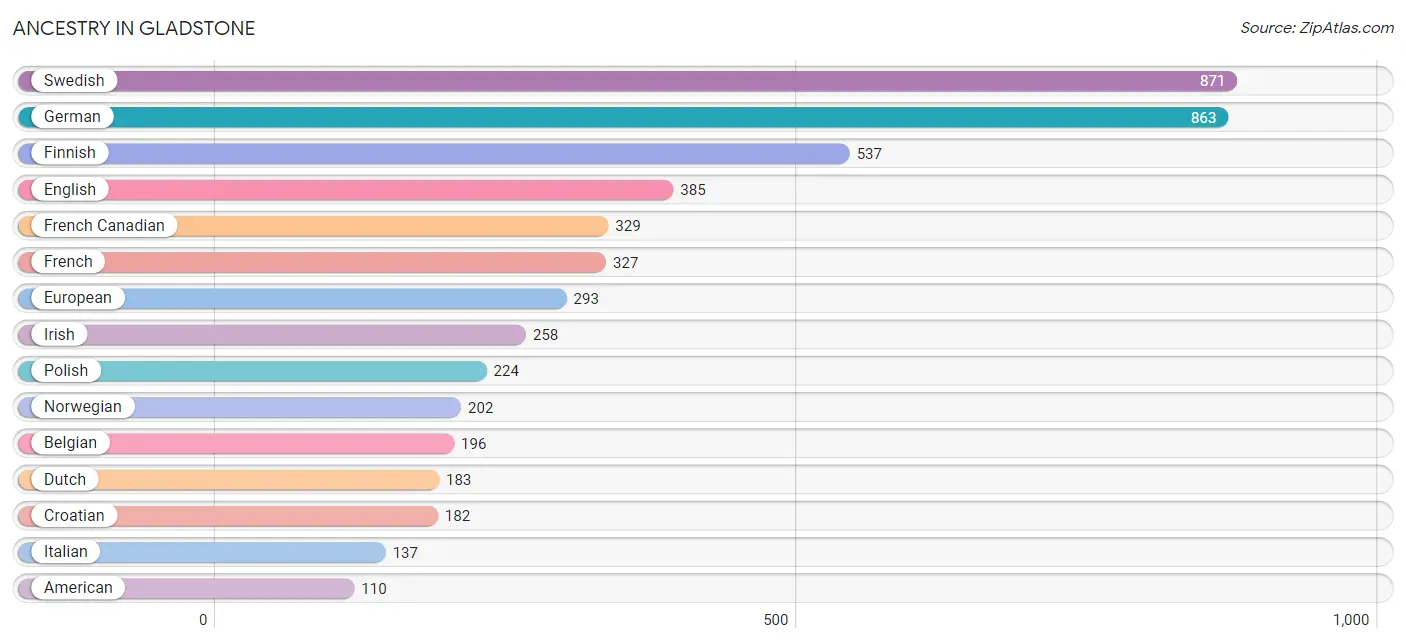
| Ancestry | # Population | % Population |
| American | 110 | 2.1% |
| Belgian | 196 | 3.7% |
| Bhutanese | 13 | 0.3% |
| Chippewa | 89 | 1.7% |
| Creek | 21 | 0.4% |
| Croatian | 182 | 3.5% |
| Czech | 4 | 0.1% |
| Czechoslovakian | 8 | 0.2% |
| Danish | 19 | 0.4% |
| Dutch | 183 | 3.5% |
| English | 385 | 7.4% |
| European | 293 | 5.6% |
| Finnish | 537 | 10.3% |
| French | 327 | 6.2% |
| French American Indian | 8 | 0.2% |
| French Canadian | 329 | 6.3% |
| German | 863 | 16.5% |
| Greek | 40 | 0.8% |
| Hungarian | 35 | 0.7% |
| Irish | 258 | 4.9% |
| Italian | 137 | 2.6% |
| Korean | 14 | 0.3% |
| Lithuanian | 74 | 1.4% |
| Mexican | 2 | 0.0% |
| Northern European | 8 | 0.2% |
| Norwegian | 202 | 3.9% |
| Ottawa | 7 | 0.1% |
| Polish | 224 | 4.3% |
| Puerto Rican | 34 | 0.6% |
| Scandinavian | 38 | 0.7% |
| Scotch-Irish | 15 | 0.3% |
| Scottish | 18 | 0.3% |
| Swedish | 871 | 16.7% |
| Ukrainian | 61 | 1.2% |
| Welsh | 20 | 0.4% | View All 35 Rows |
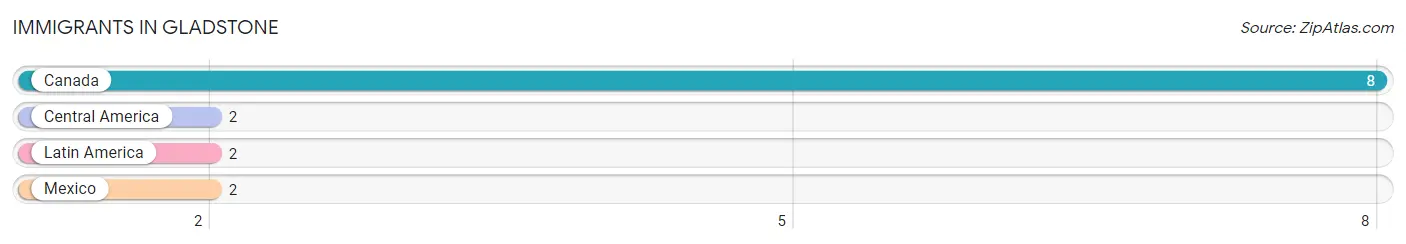
Immigrants in Gladstone
The most numerous immigrant groups reported in Gladstone came from Canada (8 | 0.2%), Central America (2 | 0.0%), Latin America (2 | 0.0%), and Mexico (2 | 0.0%), together accounting for 0.3% of all Gladstone residents.
| Immigration Origin | # Population | % Population |
| Canada | 8 | 0.2% |
| Central America | 2 | 0.0% |
| Latin America | 2 | 0.0% |
| Mexico | 2 | 0.0% | View All 4 Rows |
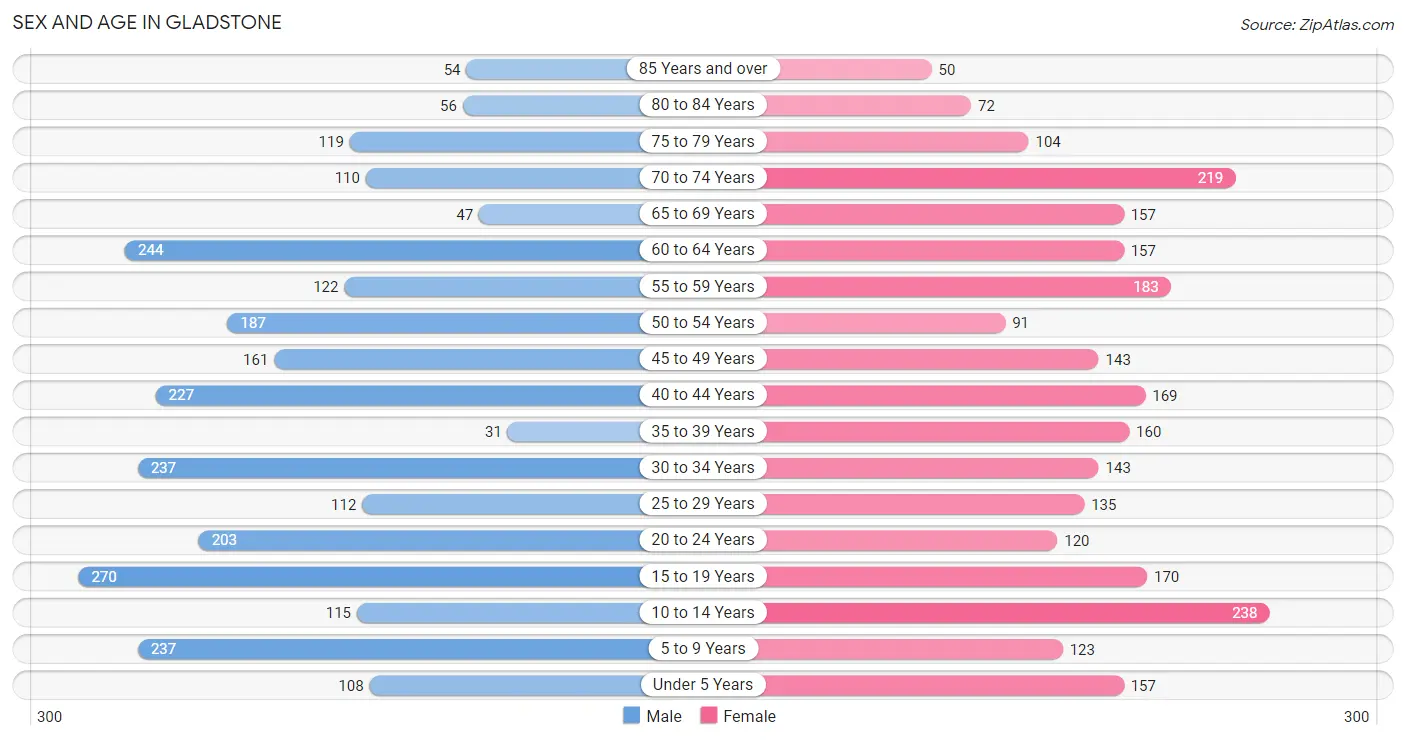
Sex and Age in Gladstone
Sex and Age in Gladstone
The most populous age groups in Gladstone are 15 to 19 Years (270 | 10.2%) for men and 10 to 14 Years (238 | 9.2%) for women.
| Age Bracket | Male | Female |
| Under 5 Years | 108 (4.1%) | 157 (6.1%) |
| 5 to 9 Years | 237 (9.0%) | 123 (4.8%) |
| 10 to 14 Years | 115 (4.4%) | 238 (9.2%) |
| 15 to 19 Years | 270 (10.2%) | 170 (6.6%) |
| 20 to 24 Years | 203 (7.7%) | 120 (4.6%) |
| 25 to 29 Years | 112 (4.2%) | 135 (5.2%) |
| 30 to 34 Years | 237 (9.0%) | 143 (5.5%) |
| 35 to 39 Years | 31 (1.2%) | 160 (6.2%) |
| 40 to 44 Years | 227 (8.6%) | 169 (6.5%) |
| 45 to 49 Years | 161 (6.1%) | 143 (5.5%) |
| 50 to 54 Years | 187 (7.1%) | 91 (3.5%) |
| 55 to 59 Years | 122 (4.6%) | 183 (7.1%) |
| 60 to 64 Years | 244 (9.2%) | 157 (6.1%) |
| 65 to 69 Years | 47 (1.8%) | 157 (6.1%) |
| 70 to 74 Years | 110 (4.2%) | 219 (8.5%) |
| 75 to 79 Years | 119 (4.5%) | 104 (4.0%) |
| 80 to 84 Years | 56 (2.1%) | 72 (2.8%) |
| 85 Years and over | 54 (2.1%) | 50 (1.9%) |
| Total | 2,640 (100.0%) | 2,591 (100.0%) |
Families and Households in Gladstone
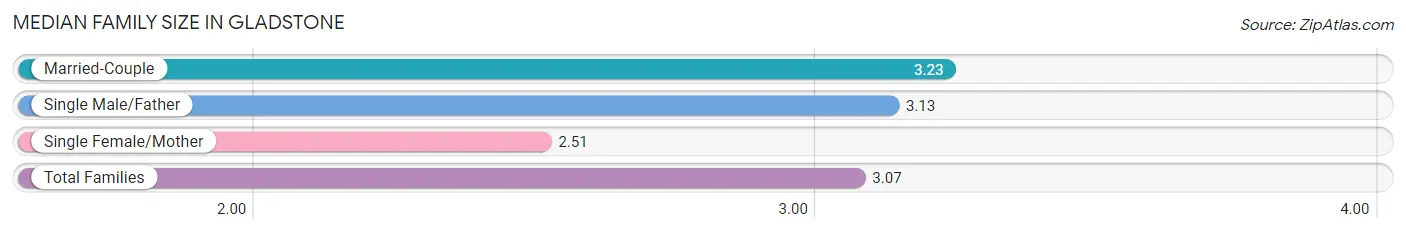
Median Family Size in Gladstone
The median family size in Gladstone is 3.07 persons per family, with married-couple families (989 | 74.7%) accounting for the largest median family size of 3.23 persons per family. On the other hand, single female/mother families (279 | 21.1%) represent the smallest median family size with 2.51 persons per family.
| Family Type | # Families | Family Size |
| Married-Couple | 989 (74.7%) | 3.23 |
| Single Male/Father | 56 (4.2%) | 3.13 |
| Single Female/Mother | 279 (21.1%) | 2.51 |
| Total Families | 1,324 (100.0%) | 3.07 |
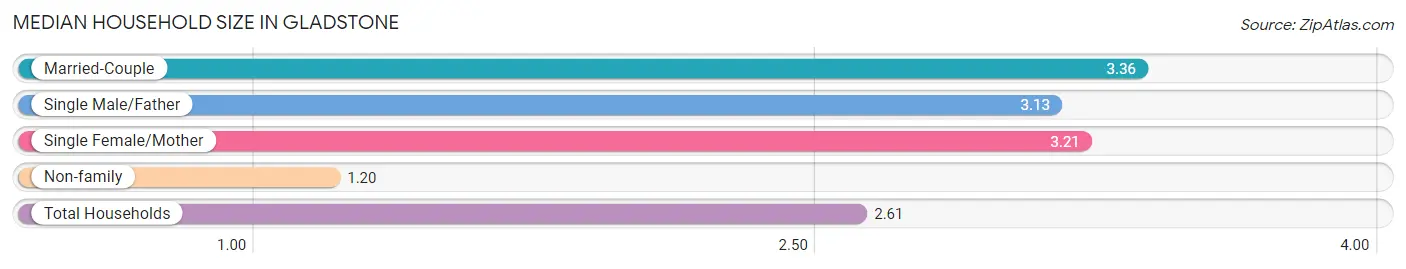
Median Household Size in Gladstone
The median household size in Gladstone is 2.61 persons per household, with married-couple households (989 | 49.6%) accounting for the largest median household size of 3.36 persons per household. non-family households (670 | 33.6%) represent the smallest median household size with 1.20 persons per household.
| Household Type | # Households | Household Size |
| Married-Couple | 989 (49.6%) | 3.36 |
| Single Male/Father | 56 (2.8%) | 3.13 |
| Single Female/Mother | 279 (14.0%) | 3.21 |
| Non-family | 670 (33.6%) | 1.20 |
| Total Households | 1,994 (100.0%) | 2.61 |
Household Size by Marriage Status in Gladstone
Out of a total of 1,994 households in Gladstone, 1,324 (66.4%) are family households, while 670 (33.6%) are nonfamily households. The most numerous type of family households are 2-person households, comprising 726, and the most common type of nonfamily households are 1-person households, comprising 531.
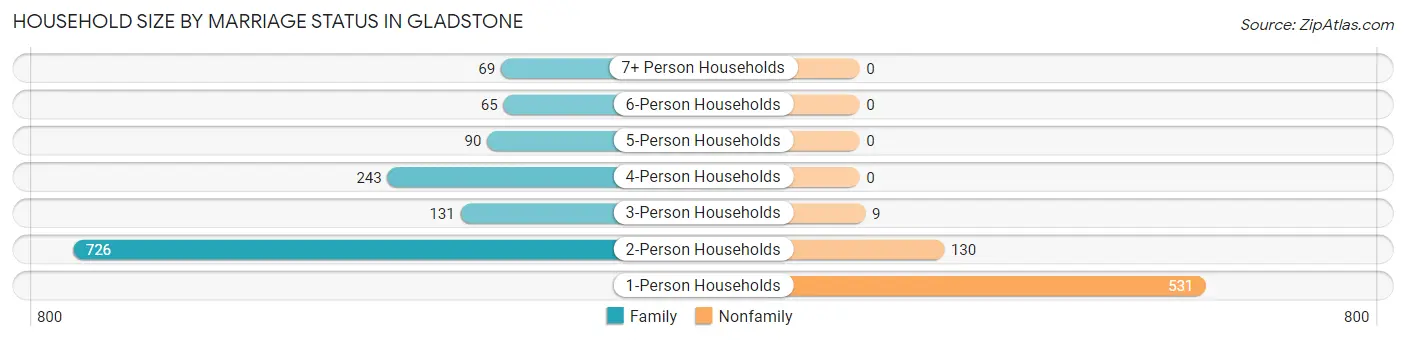
| Household Size | Family Households | Nonfamily Households |
| 1-Person Households | - | 531 (26.6%) |
| 2-Person Households | 726 (36.4%) | 130 (6.5%) |
| 3-Person Households | 131 (6.6%) | 9 (0.4%) |
| 4-Person Households | 243 (12.2%) | 0 (0.0%) |
| 5-Person Households | 90 (4.5%) | 0 (0.0%) |
| 6-Person Households | 65 (3.3%) | 0 (0.0%) |
| 7+ Person Households | 69 (3.5%) | 0 (0.0%) |
| Total | 1,324 (66.4%) | 670 (33.6%) |
Female Fertility in Gladstone
Fertility by Age in Gladstone
Average fertility rate in Gladstone is 48.0 births per 1,000 women. Women in the age bracket of 20 to 34 years have the highest fertility rate with 128.0 births per 1,000 women. Women in the age bracket of 20 to 34 years acount for 100.0% of all women with births.
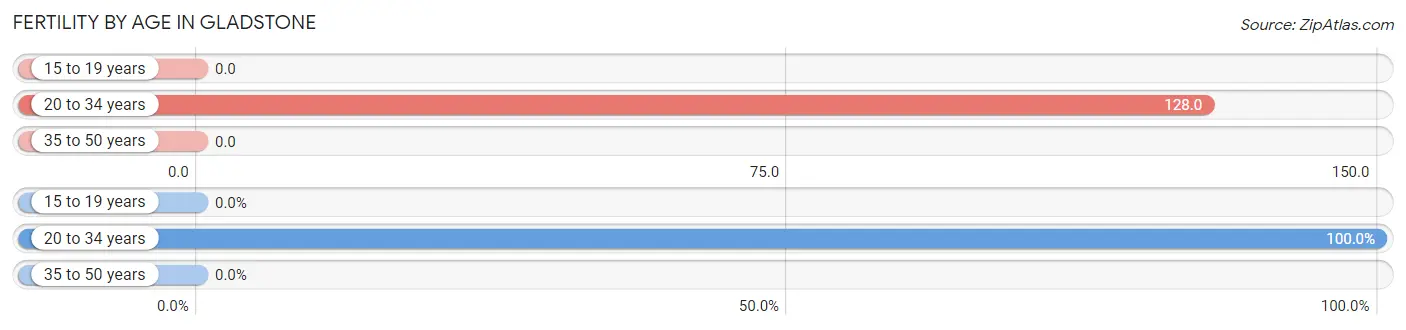
| Age Bracket | Women with Births | Births / 1,000 Women |
| 15 to 19 years | 0 (0.0%) | 0.0 |
| 20 to 34 years | 51 (100.0%) | 128.0 |
| 35 to 50 years | 0 (0.0%) | 0.0 |
| Total | 51 (100.0%) | 48.0 |
Fertility by Age by Marriage Status in Gladstone
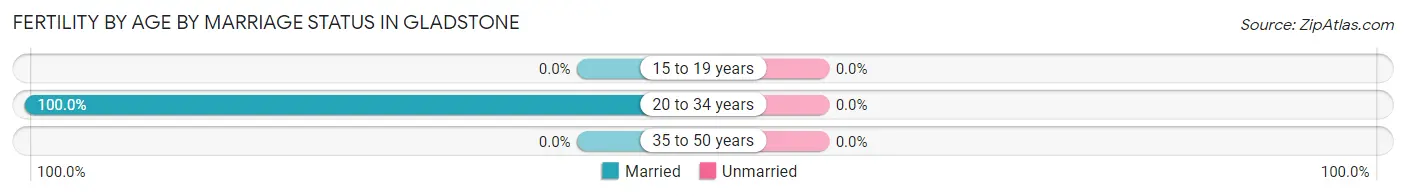
| Age Bracket | Married | Unmarried |
| 15 to 19 years | 0 (0.0%) | 0 (0.0%) |
| 20 to 34 years | 51 (100.0%) | 0 (0.0%) |
| 35 to 50 years | 0 (0.0%) | 0 (0.0%) |
| Total | 51 (100.0%) | 0 (0.0%) |
Fertility by Education in Gladstone
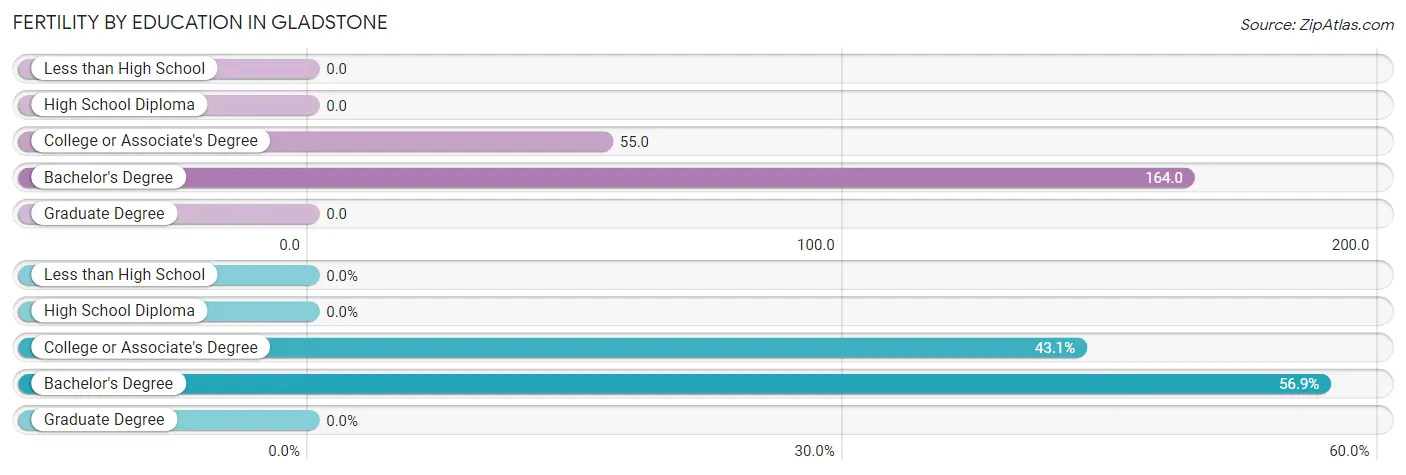
| Educational Attainment | Women with Births | Births / 1,000 Women |
| Less than High School | 0 (0.0%) | 0.0 |
| High School Diploma | 0 (0.0%) | 0.0 |
| College or Associate's Degree | 22 (43.1%) | 55.0 |
| Bachelor's Degree | 29 (56.9%) | 164.0 |
| Graduate Degree | 0 (0.0%) | 0.0 |
| Total | 51 (100.0%) | 48.0 |
Fertility by Education by Marriage Status in Gladstone
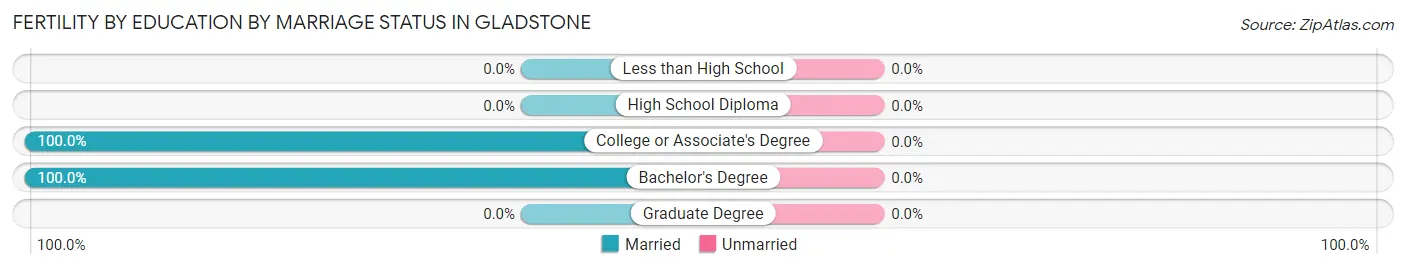
| Educational Attainment | Married | Unmarried |
| Less than High School | 0 (0.0%) | 0 (0.0%) |
| High School Diploma | 0 (0.0%) | 0 (0.0%) |
| College or Associate's Degree | 22 (100.0%) | 0 (0.0%) |
| Bachelor's Degree | 29 (100.0%) | 0 (0.0%) |
| Graduate Degree | 0 (0.0%) | 0 (0.0%) |
| Total | 51 (100.0%) | 0 (0.0%) |
Employment Characteristics in Gladstone
Employment by Class of Employer in Gladstone
Among the 2,202 employed individuals in Gladstone, private company employees (1,325 | 60.2%), not-for-profit organizations (223 | 10.1%), and local government employees (200 | 9.1%) make up the most common classes of employment.
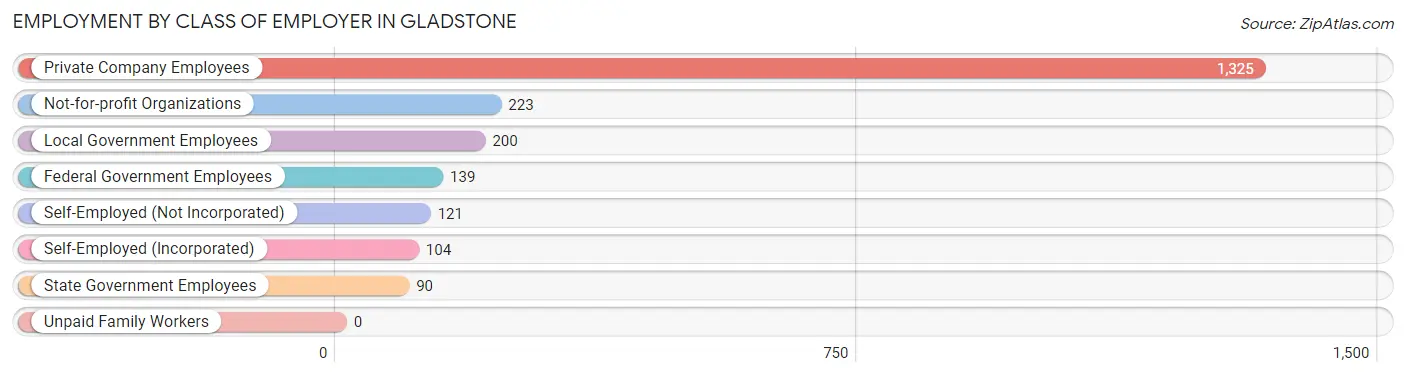
| Employer Class | # Employees | % Employees |
| Private Company Employees | 1,325 | 60.2% |
| Self-Employed (Incorporated) | 104 | 4.7% |
| Self-Employed (Not Incorporated) | 121 | 5.5% |
| Not-for-profit Organizations | 223 | 10.1% |
| Local Government Employees | 200 | 9.1% |
| State Government Employees | 90 | 4.1% |
| Federal Government Employees | 139 | 6.3% |
| Unpaid Family Workers | 0 | 0.0% |
| Total | 2,202 | 100.0% |
Employment Status by Age in Gladstone
According to the labor force statistics for Gladstone, out of the total population over 16 years of age (4,226), 54.8% or 2,316 individuals are in the labor force, with 3.8% or 88 of them unemployed. The age group with the highest labor force participation rate is 45 to 54 years, with 86.9% or 506 individuals in the labor force. Within the labor force, the 20 to 24 years age range has the highest percentage of unemployed individuals, with 14.8% or 37 of them being unemployed.
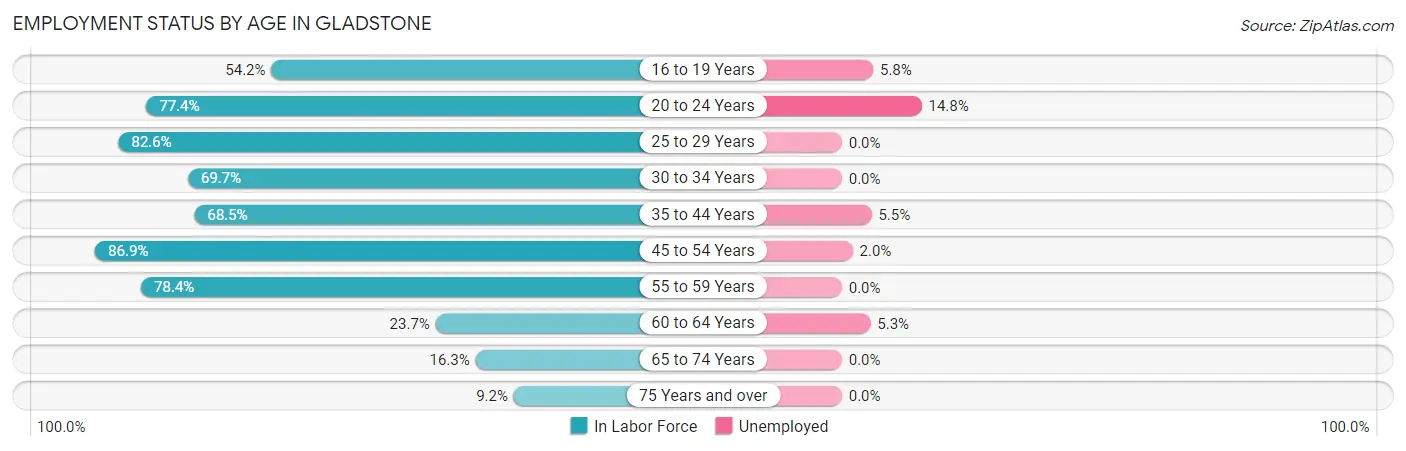
| Age Bracket | In Labor Force | Unemployed |
| 16 to 19 Years | 224 (54.2%) | 13 (5.8%) |
| 20 to 24 Years | 250 (77.4%) | 37 (14.8%) |
| 25 to 29 Years | 204 (82.6%) | 0 (0.0%) |
| 30 to 34 Years | 265 (69.7%) | 0 (0.0%) |
| 35 to 44 Years | 402 (68.5%) | 22 (5.5%) |
| 45 to 54 Years | 506 (86.9%) | 10 (2.0%) |
| 55 to 59 Years | 239 (78.4%) | 0 (0.0%) |
| 60 to 64 Years | 95 (23.7%) | 5 (5.3%) |
| 65 to 74 Years | 87 (16.3%) | 0 (0.0%) |
| 75 Years and over | 42 (9.2%) | 0 (0.0%) |
| Total | 2,316 (54.8%) | 88 (3.8%) |
Employment Status by Educational Attainment in Gladstone
According to labor force statistics for Gladstone, 68.4% of individuals (1,711) out of the total population between 25 and 64 years of age (2,502) are in the labor force, with 2.2% or 38 of them being unemployed. The group with the highest labor force participation rate are those with the educational attainment of bachelor's degree or higher, with 89.3% or 475 individuals in the labor force. Within the labor force, individuals with bachelor's degree or higher education have the highest percentage of unemployment, with 4.6% or 22 of them being unemployed.
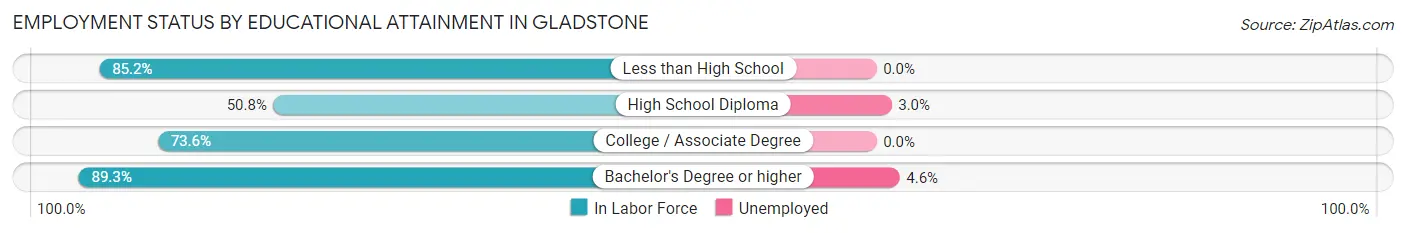
| Educational Attainment | In Labor Force | Unemployed |
| Less than High School | 92 (85.2%) | 0 (0.0%) |
| High School Diploma | 505 (50.8%) | 30 (3.0%) |
| College / Associate Degree | 639 (73.6%) | 0 (0.0%) |
| Bachelor's Degree or higher | 475 (89.3%) | 24 (4.6%) |
| Total | 1,711 (68.4%) | 55 (2.2%) |
Employment Occupations by Sex in Gladstone
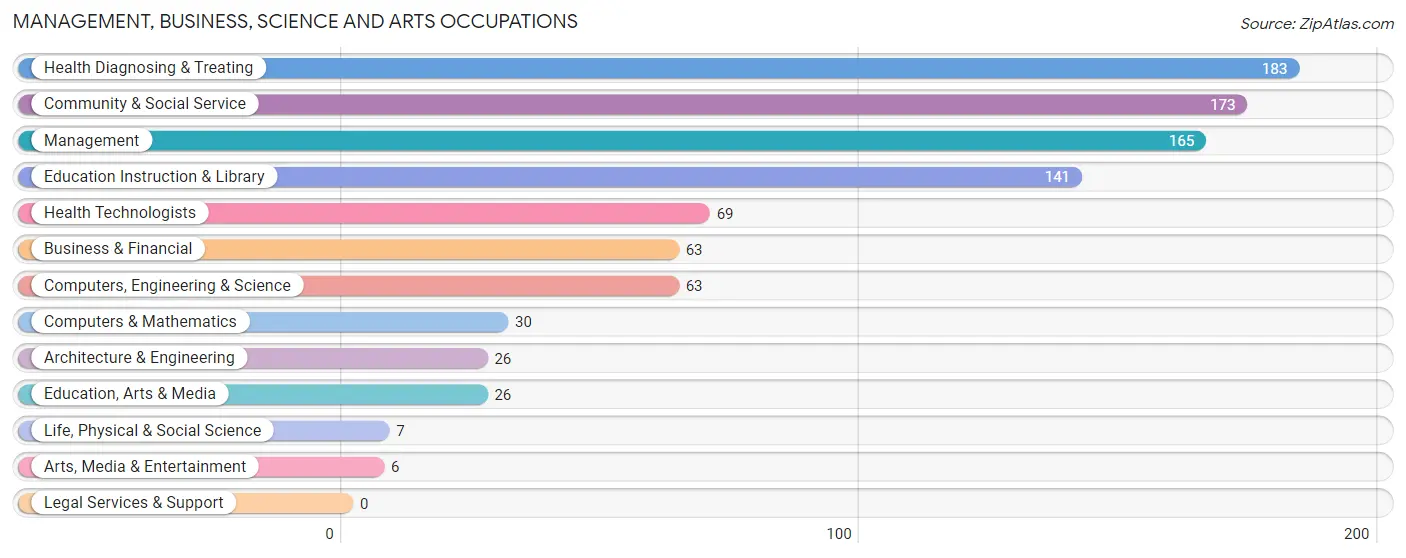
Management, Business, Science and Arts Occupations
The most common Management, Business, Science and Arts occupations in Gladstone are Health Diagnosing & Treating (183 | 8.2%), Community & Social Service (173 | 7.8%), Management (165 | 7.4%), Education Instruction & Library (141 | 6.3%), and Health Technologists (69 | 3.1%).
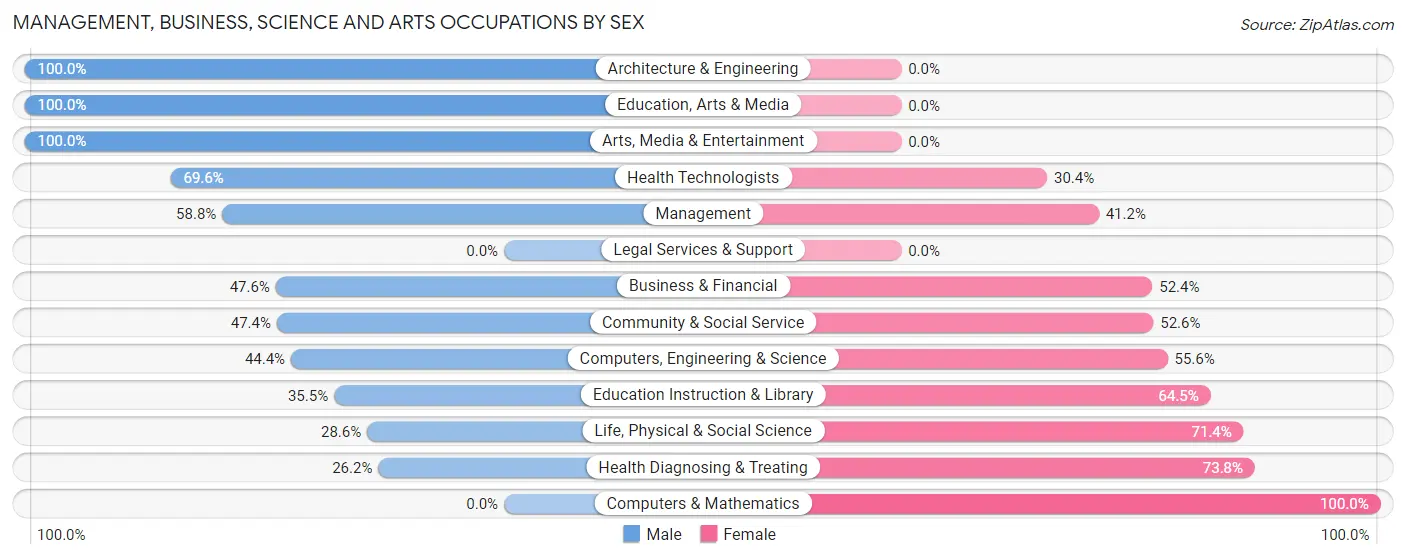
Management, Business, Science and Arts Occupations by Sex
Within the Management, Business, Science and Arts occupations in Gladstone, the most male-oriented occupations are Architecture & Engineering (100.0%), Education, Arts & Media (100.0%), and Arts, Media & Entertainment (100.0%), while the most female-oriented occupations are Computers & Mathematics (100.0%), Health Diagnosing & Treating (73.8%), and Life, Physical & Social Science (71.4%).
| Occupation | Male | Female |
| Management | 97 (58.8%) | 68 (41.2%) |
| Business & Financial | 30 (47.6%) | 33 (52.4%) |
| Computers, Engineering & Science | 28 (44.4%) | 35 (55.6%) |
| Computers & Mathematics | 0 (0.0%) | 30 (100.0%) |
| Architecture & Engineering | 26 (100.0%) | 0 (0.0%) |
| Life, Physical & Social Science | 2 (28.6%) | 5 (71.4%) |
| Community & Social Service | 82 (47.4%) | 91 (52.6%) |
| Education, Arts & Media | 26 (100.0%) | 0 (0.0%) |
| Legal Services & Support | 0 (0.0%) | 0 (0.0%) |
| Education Instruction & Library | 50 (35.5%) | 91 (64.5%) |
| Arts, Media & Entertainment | 6 (100.0%) | 0 (0.0%) |
| Health Diagnosing & Treating | 48 (26.2%) | 135 (73.8%) |
| Health Technologists | 48 (69.6%) | 21 (30.4%) |
| Total (Category) | 285 (44.1%) | 362 (55.9%) |
| Total (Overall) | 1,184 (53.2%) | 1,043 (46.8%) |
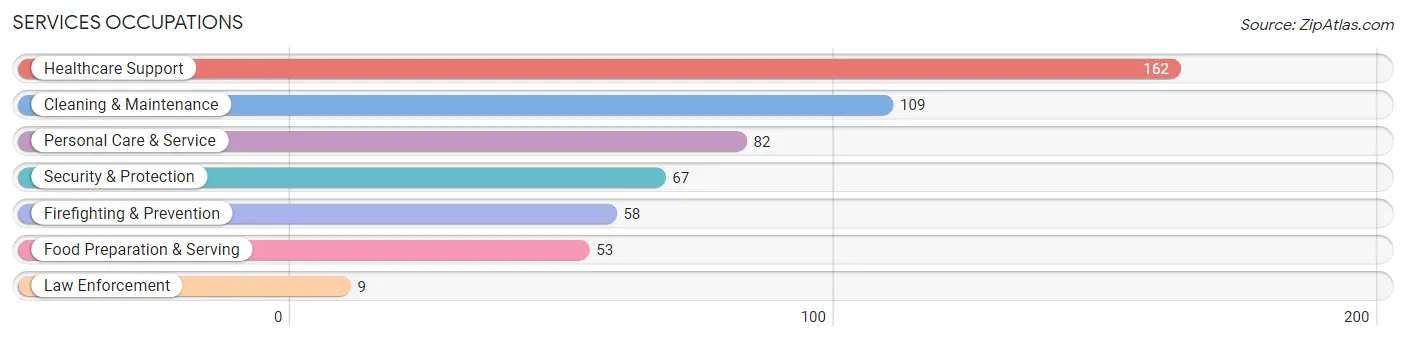
Services Occupations
The most common Services occupations in Gladstone are Healthcare Support (162 | 7.3%), Cleaning & Maintenance (109 | 4.9%), Personal Care & Service (82 | 3.7%), Security & Protection (67 | 3.0%), and Firefighting & Prevention (58 | 2.6%).
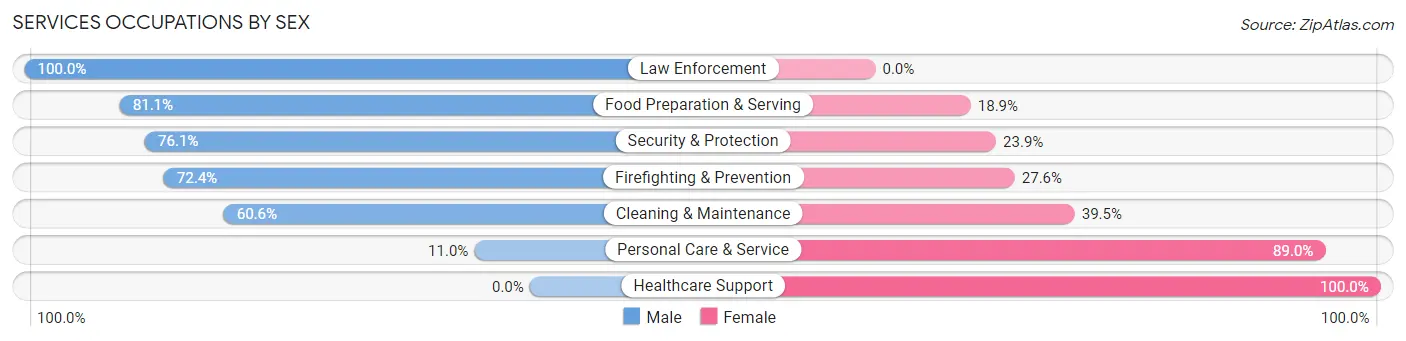
Services Occupations by Sex
Within the Services occupations in Gladstone, the most male-oriented occupations are Law Enforcement (100.0%), Food Preparation & Serving (81.1%), and Security & Protection (76.1%), while the most female-oriented occupations are Healthcare Support (100.0%), Personal Care & Service (89.0%), and Cleaning & Maintenance (39.5%).
| Occupation | Male | Female |
| Healthcare Support | 0 (0.0%) | 162 (100.0%) |
| Security & Protection | 51 (76.1%) | 16 (23.9%) |
| Firefighting & Prevention | 42 (72.4%) | 16 (27.6%) |
| Law Enforcement | 9 (100.0%) | 0 (0.0%) |
| Food Preparation & Serving | 43 (81.1%) | 10 (18.9%) |
| Cleaning & Maintenance | 66 (60.6%) | 43 (39.5%) |
| Personal Care & Service | 9 (11.0%) | 73 (89.0%) |
| Total (Category) | 169 (35.7%) | 304 (64.3%) |
| Total (Overall) | 1,184 (53.2%) | 1,043 (46.8%) |
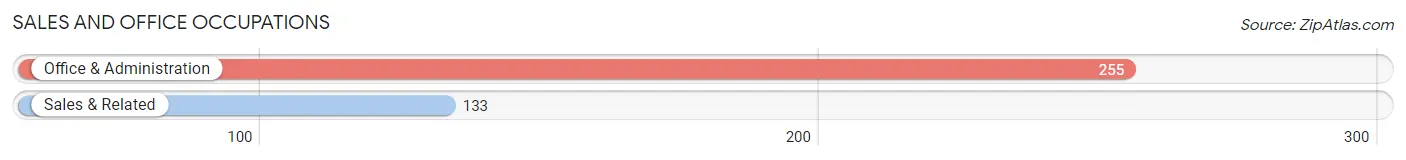
Sales and Office Occupations
The most common Sales and Office occupations in Gladstone are Office & Administration (255 | 11.5%), and Sales & Related (133 | 6.0%).
Sales and Office Occupations by Sex
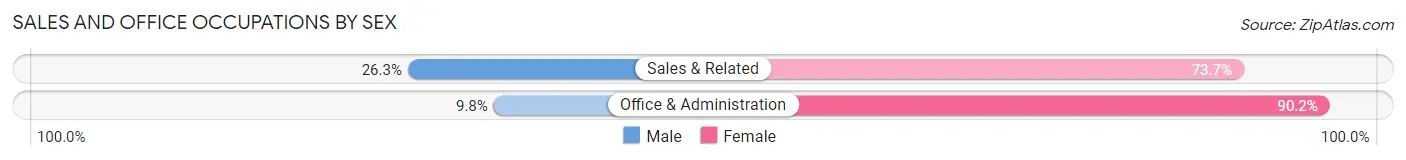
| Occupation | Male | Female |
| Sales & Related | 35 (26.3%) | 98 (73.7%) |
| Office & Administration | 25 (9.8%) | 230 (90.2%) |
| Total (Category) | 60 (15.5%) | 328 (84.5%) |
| Total (Overall) | 1,184 (53.2%) | 1,043 (46.8%) |
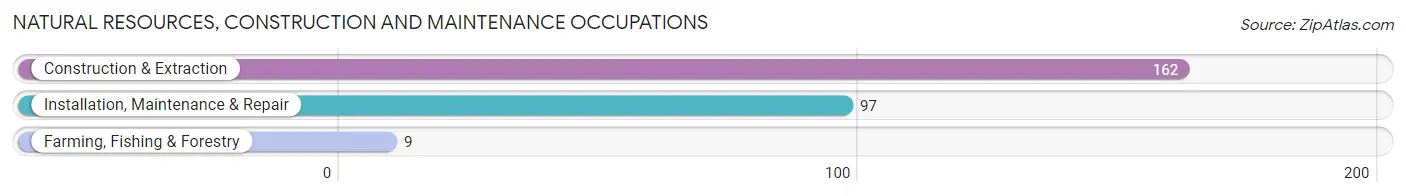
Natural Resources, Construction and Maintenance Occupations
The most common Natural Resources, Construction and Maintenance occupations in Gladstone are Construction & Extraction (162 | 7.3%), Installation, Maintenance & Repair (97 | 4.4%), and Farming, Fishing & Forestry (9 | 0.4%).
Natural Resources, Construction and Maintenance Occupations by Sex
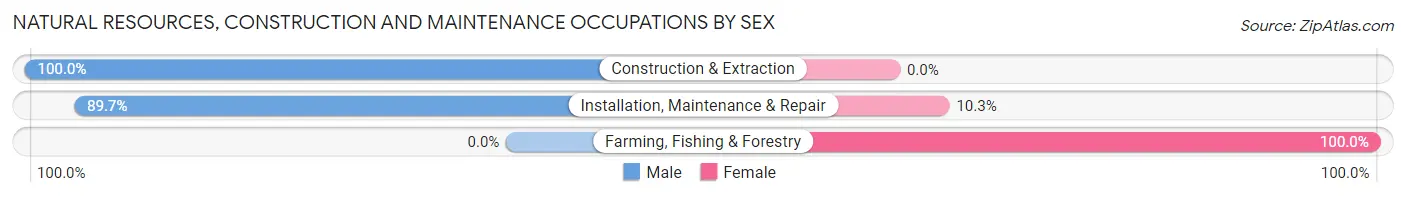
| Occupation | Male | Female |
| Farming, Fishing & Forestry | 0 (0.0%) | 9 (100.0%) |
| Construction & Extraction | 162 (100.0%) | 0 (0.0%) |
| Installation, Maintenance & Repair | 87 (89.7%) | 10 (10.3%) |
| Total (Category) | 249 (92.9%) | 19 (7.1%) |
| Total (Overall) | 1,184 (53.2%) | 1,043 (46.8%) |
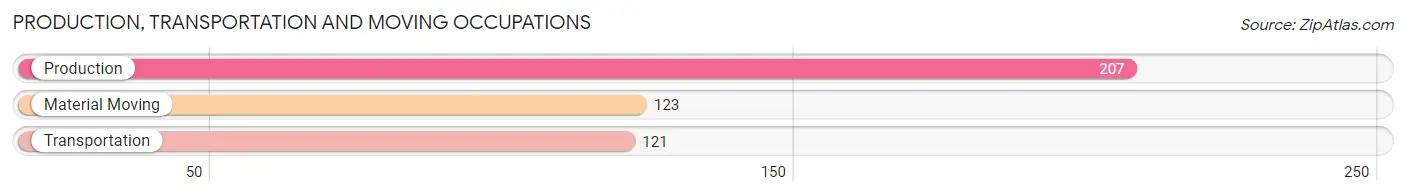
Production, Transportation and Moving Occupations
The most common Production, Transportation and Moving occupations in Gladstone are Production (207 | 9.3%), Material Moving (123 | 5.5%), and Transportation (121 | 5.4%).
Production, Transportation and Moving Occupations by Sex
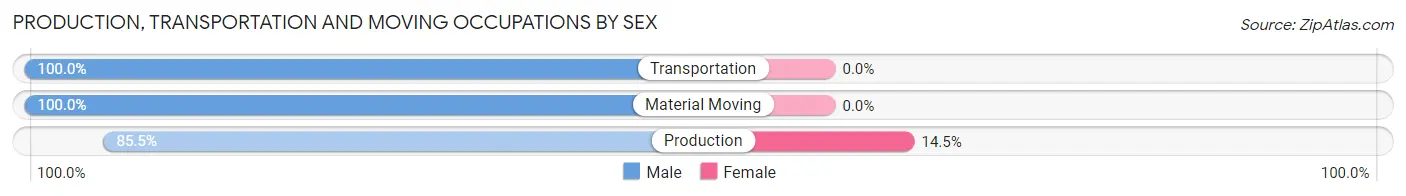
| Occupation | Male | Female |
| Production | 177 (85.5%) | 30 (14.5%) |
| Transportation | 121 (100.0%) | 0 (0.0%) |
| Material Moving | 123 (100.0%) | 0 (0.0%) |
| Total (Category) | 421 (93.3%) | 30 (6.7%) |
| Total (Overall) | 1,184 (53.2%) | 1,043 (46.8%) |
Employment Industries by Sex in Gladstone
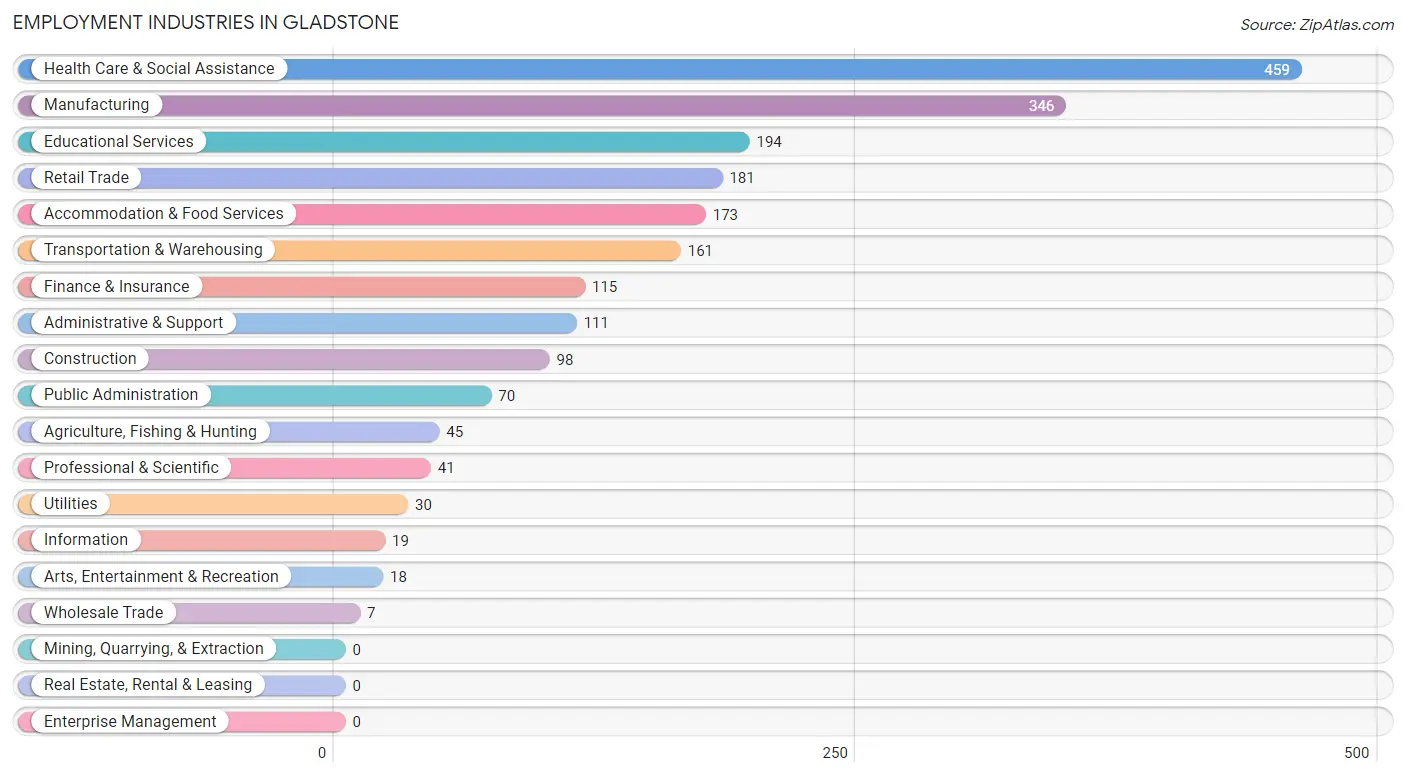
Employment Industries in Gladstone
The major employment industries in Gladstone include Health Care & Social Assistance (459 | 20.6%), Manufacturing (346 | 15.5%), Educational Services (194 | 8.7%), Retail Trade (181 | 8.1%), and Accommodation & Food Services (173 | 7.8%).
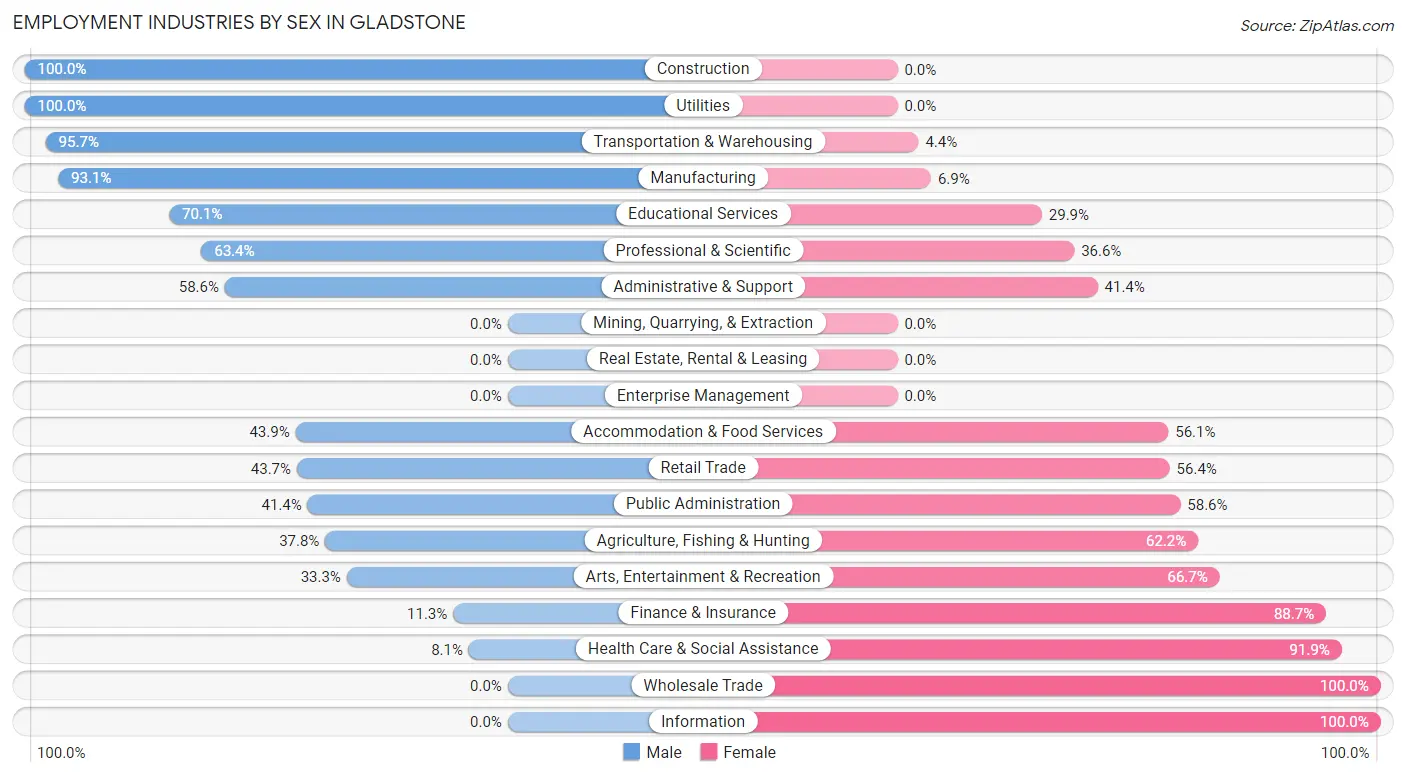
Employment Industries by Sex in Gladstone
The Gladstone industries that see more men than women are Construction (100.0%), Utilities (100.0%), and Transportation & Warehousing (95.7%), whereas the industries that tend to have a higher number of women are Wholesale Trade (100.0%), Information (100.0%), and Health Care & Social Assistance (91.9%).
| Industry | Male | Female |
| Agriculture, Fishing & Hunting | 17 (37.8%) | 28 (62.2%) |
| Mining, Quarrying, & Extraction | 0 (0.0%) | 0 (0.0%) |
| Construction | 98 (100.0%) | 0 (0.0%) |
| Manufacturing | 322 (93.1%) | 24 (6.9%) |
| Wholesale Trade | 0 (0.0%) | 7 (100.0%) |
| Retail Trade | 79 (43.6%) | 102 (56.4%) |
| Transportation & Warehousing | 154 (95.7%) | 7 (4.3%) |
| Utilities | 30 (100.0%) | 0 (0.0%) |
| Information | 0 (0.0%) | 19 (100.0%) |
| Finance & Insurance | 13 (11.3%) | 102 (88.7%) |
| Real Estate, Rental & Leasing | 0 (0.0%) | 0 (0.0%) |
| Professional & Scientific | 26 (63.4%) | 15 (36.6%) |
| Enterprise Management | 0 (0.0%) | 0 (0.0%) |
| Administrative & Support | 65 (58.6%) | 46 (41.4%) |
| Educational Services | 136 (70.1%) | 58 (29.9%) |
| Health Care & Social Assistance | 37 (8.1%) | 422 (91.9%) |
| Arts, Entertainment & Recreation | 6 (33.3%) | 12 (66.7%) |
| Accommodation & Food Services | 76 (43.9%) | 97 (56.1%) |
| Public Administration | 29 (41.4%) | 41 (58.6%) |
| Total | 1,184 (53.2%) | 1,043 (46.8%) |
Education in Gladstone
School Enrollment in Gladstone
The most common levels of schooling among the 1,238 students in Gladstone are high school (342 | 27.6%), elementary school (312 | 25.2%), and middle school (255 | 20.6%).
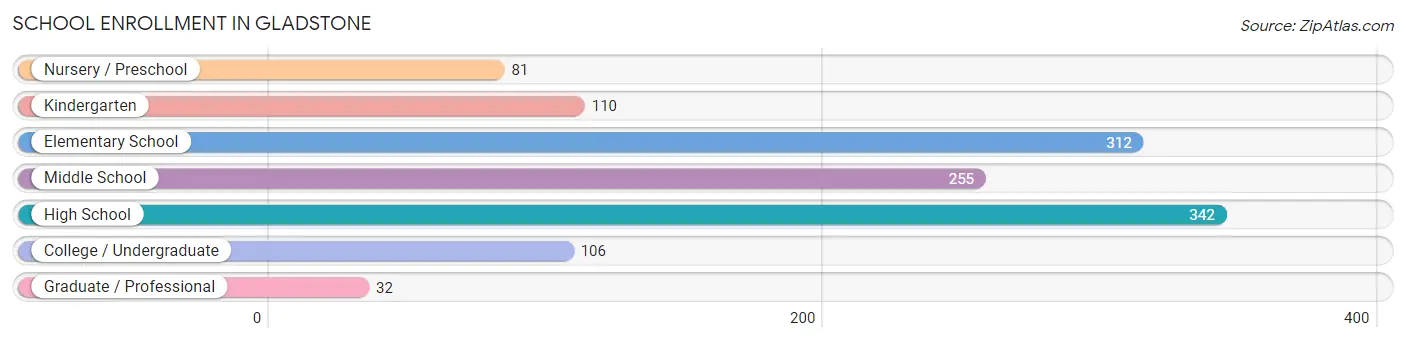
| School Level | # Students | % Students |
| Nursery / Preschool | 81 | 6.5% |
| Kindergarten | 110 | 8.9% |
| Elementary School | 312 | 25.2% |
| Middle School | 255 | 20.6% |
| High School | 342 | 27.6% |
| College / Undergraduate | 106 | 8.6% |
| Graduate / Professional | 32 | 2.6% |
| Total | 1,238 | 100.0% |
School Enrollment by Age by Funding Source in Gladstone
Out of a total of 1,238 students who are enrolled in schools in Gladstone, 316 (25.5%) attend a private institution, while the remaining 922 (74.5%) are enrolled in public schools. The age group of 25 to 34 year olds has the highest likelihood of being enrolled in private schools, with 4 (100.0% in the age bracket) enrolled. Conversely, the age group of 18 to 19 year olds has the lowest likelihood of being enrolled in a private school, with 67 (100.0% in the age bracket) attending a public institution.
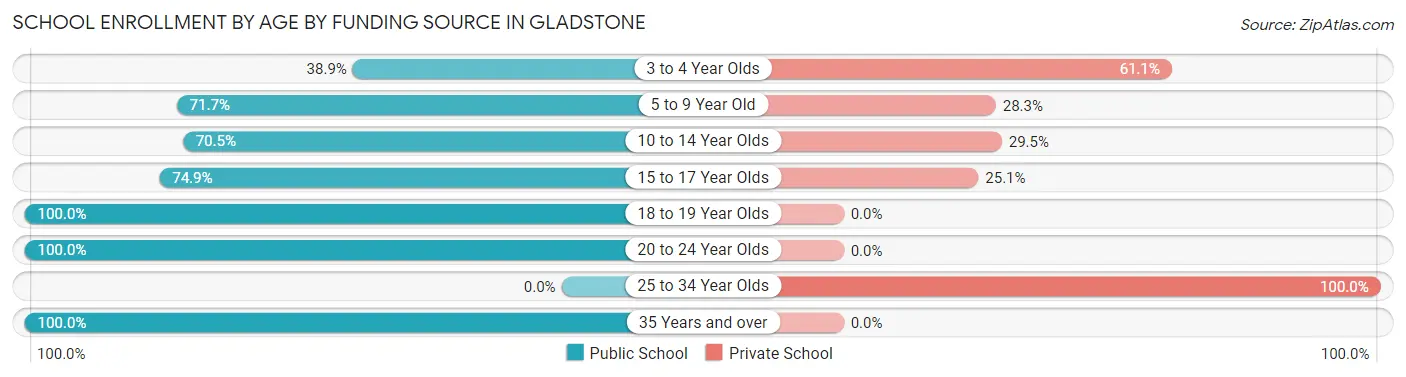
| Age Bracket | Public School | Private School |
| 3 to 4 Year Olds | 21 (38.9%) | 33 (61.1%) |
| 5 to 9 Year Old | 258 (71.7%) | 102 (28.3%) |
| 10 to 14 Year Olds | 249 (70.5%) | 104 (29.5%) |
| 15 to 17 Year Olds | 218 (74.9%) | 73 (25.1%) |
| 18 to 19 Year Olds | 67 (100.0%) | 0 (0.0%) |
| 20 to 24 Year Olds | 71 (100.0%) | 0 (0.0%) |
| 25 to 34 Year Olds | 0 (0.0%) | 4 (100.0%) |
| 35 Years and over | 38 (100.0%) | 0 (0.0%) |
| Total | 922 (74.5%) | 316 (25.5%) |
Educational Attainment by Field of Study in Gladstone
Business (159 | 22.2%), education (112 | 15.6%), science & technology (110 | 15.4%), engineering (102 | 14.2%), and bio, nature & agricultural (85 | 11.9%) are the most common fields of study among 716 individuals in Gladstone who have obtained a bachelor's degree or higher.
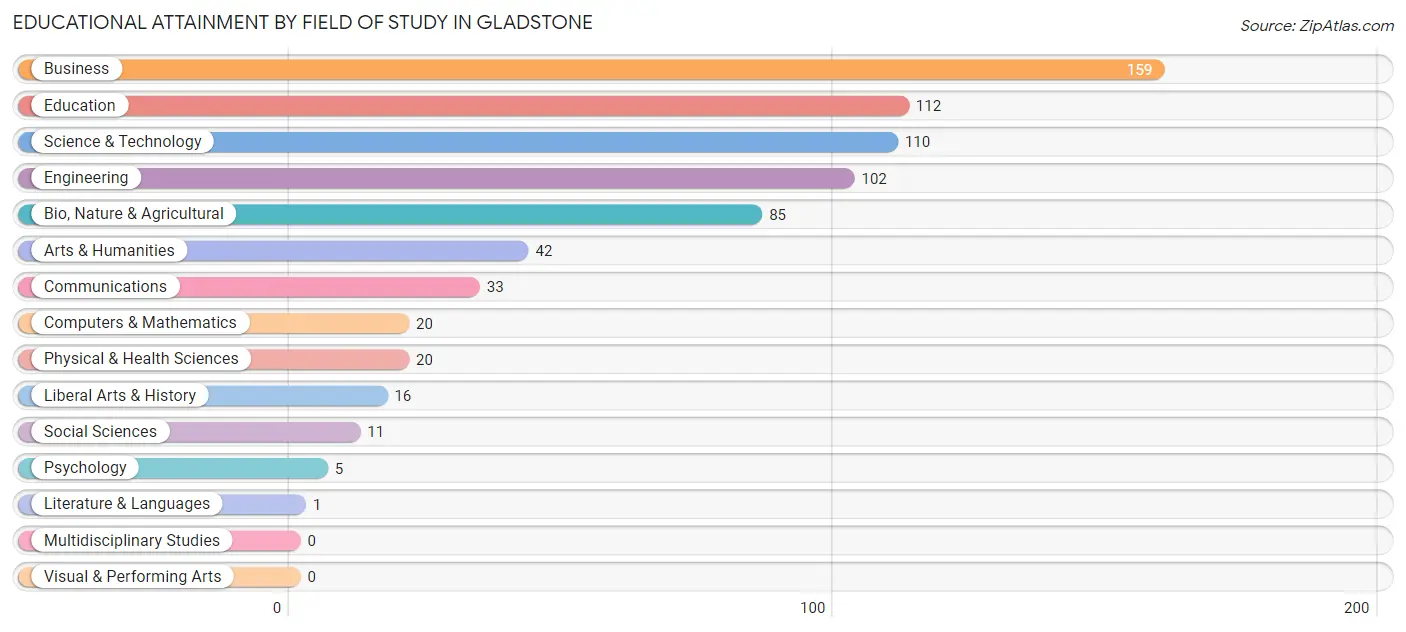
| Field of Study | # Graduates | % Graduates |
| Computers & Mathematics | 20 | 2.8% |
| Bio, Nature & Agricultural | 85 | 11.9% |
| Physical & Health Sciences | 20 | 2.8% |
| Psychology | 5 | 0.7% |
| Social Sciences | 11 | 1.5% |
| Engineering | 102 | 14.2% |
| Multidisciplinary Studies | 0 | 0.0% |
| Science & Technology | 110 | 15.4% |
| Business | 159 | 22.2% |
| Education | 112 | 15.6% |
| Literature & Languages | 1 | 0.1% |
| Liberal Arts & History | 16 | 2.2% |
| Visual & Performing Arts | 0 | 0.0% |
| Communications | 33 | 4.6% |
| Arts & Humanities | 42 | 5.9% |
| Total | 716 | 100.0% |
Transportation & Commute in Gladstone
Vehicle Availability by Sex in Gladstone
The most prevalent vehicle ownership categories in Gladstone are males with 2 vehicles (731, accounting for 61.8%) and females with 2 vehicles (484, making up 71.9%).
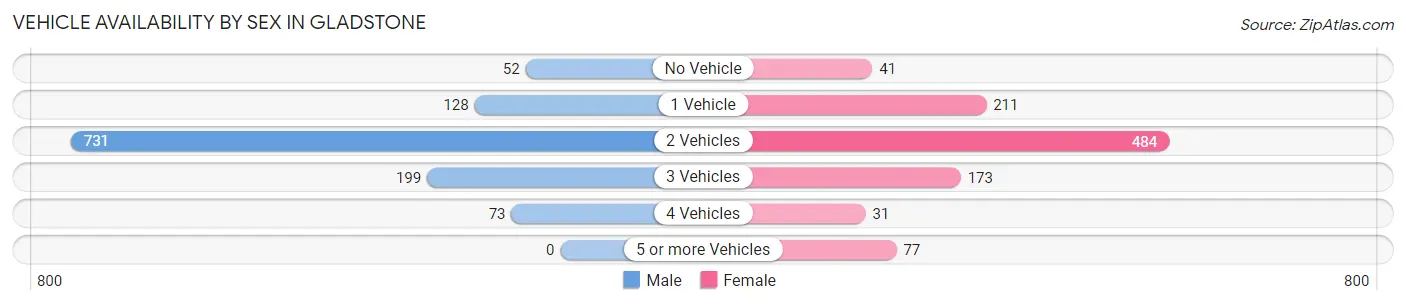
| Vehicles Available | Male | Female |
| No Vehicle | 52 (4.4%) | 41 (4.0%) |
| 1 Vehicle | 128 (10.8%) | 211 (20.7%) |
| 2 Vehicles | 731 (61.8%) | 484 (47.6%) |
| 3 Vehicles | 199 (16.8%) | 173 (17.0%) |
| 4 Vehicles | 73 (6.2%) | 31 (3.0%) |
| 5 or more Vehicles | 0 (0.0%) | 77 (7.6%) |
| Total | 1,183 (100.0%) | 1,017 (100.0%) |
Commute Time in Gladstone
The most frequently occuring commute durations in Gladstone are 15 to 19 minutes (614 commuters, 29.4%), 5 to 9 minutes (479 commuters, 22.9%), and 10 to 14 minutes (336 commuters, 16.1%).
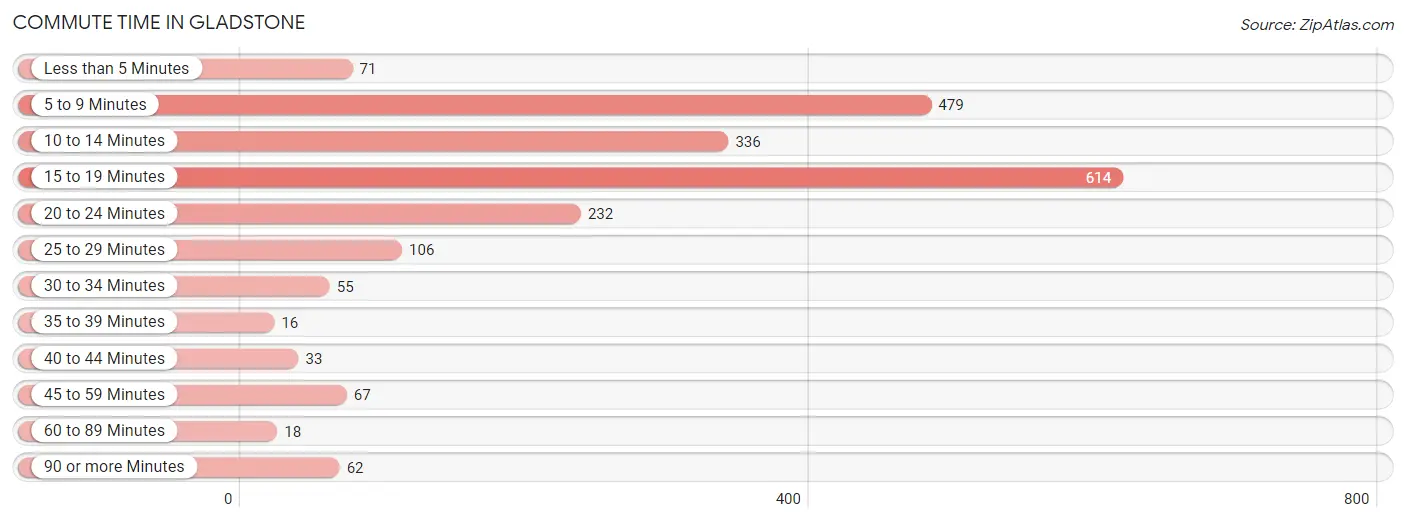
| Commute Time | # Commuters | % Commuters |
| Less than 5 Minutes | 71 | 3.4% |
| 5 to 9 Minutes | 479 | 22.9% |
| 10 to 14 Minutes | 336 | 16.1% |
| 15 to 19 Minutes | 614 | 29.4% |
| 20 to 24 Minutes | 232 | 11.1% |
| 25 to 29 Minutes | 106 | 5.1% |
| 30 to 34 Minutes | 55 | 2.6% |
| 35 to 39 Minutes | 16 | 0.8% |
| 40 to 44 Minutes | 33 | 1.6% |
| 45 to 59 Minutes | 67 | 3.2% |
| 60 to 89 Minutes | 18 | 0.9% |
| 90 or more Minutes | 62 | 3.0% |
Commute Time by Sex in Gladstone
The most common commute times in Gladstone are 15 to 19 minutes (339 commuters, 29.7%) for males and 5 to 9 minutes (311 commuters, 32.8%) for females.
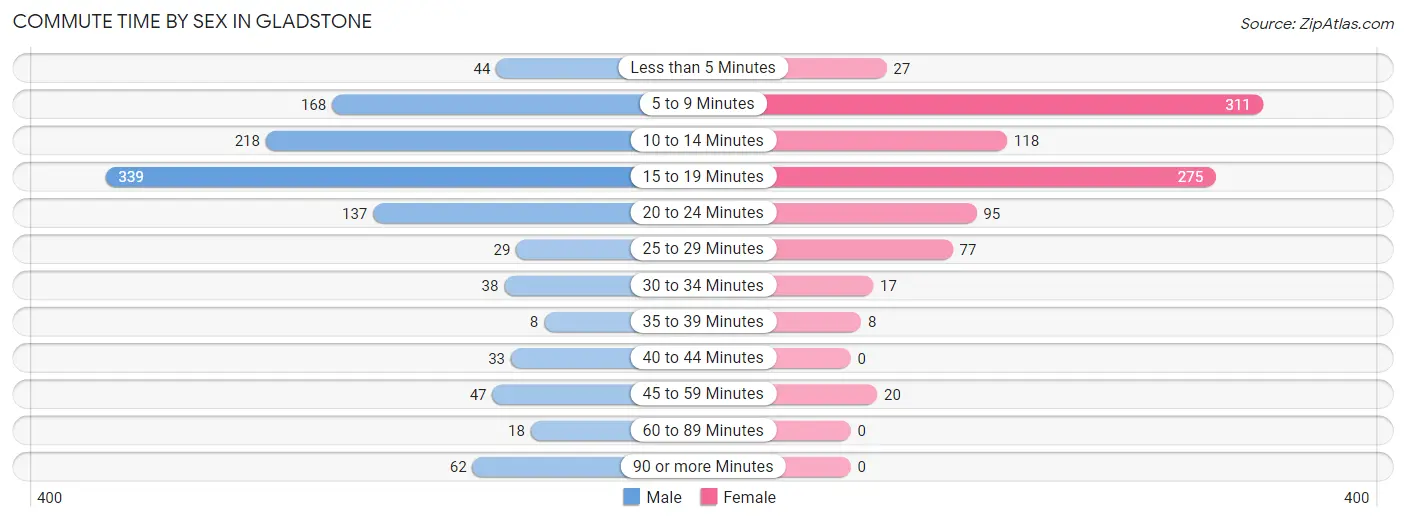
| Commute Time | Male | Female |
| Less than 5 Minutes | 44 (3.9%) | 27 (2.9%) |
| 5 to 9 Minutes | 168 (14.7%) | 311 (32.8%) |
| 10 to 14 Minutes | 218 (19.1%) | 118 (12.4%) |
| 15 to 19 Minutes | 339 (29.7%) | 275 (29.0%) |
| 20 to 24 Minutes | 137 (12.0%) | 95 (10.0%) |
| 25 to 29 Minutes | 29 (2.5%) | 77 (8.1%) |
| 30 to 34 Minutes | 38 (3.3%) | 17 (1.8%) |
| 35 to 39 Minutes | 8 (0.7%) | 8 (0.8%) |
| 40 to 44 Minutes | 33 (2.9%) | 0 (0.0%) |
| 45 to 59 Minutes | 47 (4.1%) | 20 (2.1%) |
| 60 to 89 Minutes | 18 (1.6%) | 0 (0.0%) |
| 90 or more Minutes | 62 (5.4%) | 0 (0.0%) |
Time of Departure to Work by Sex in Gladstone
The most frequent times of departure to work in Gladstone are 7:00 AM to 7:29 AM (244, 21.4%) for males and 8:00 AM to 8:29 AM (174, 18.3%) for females.
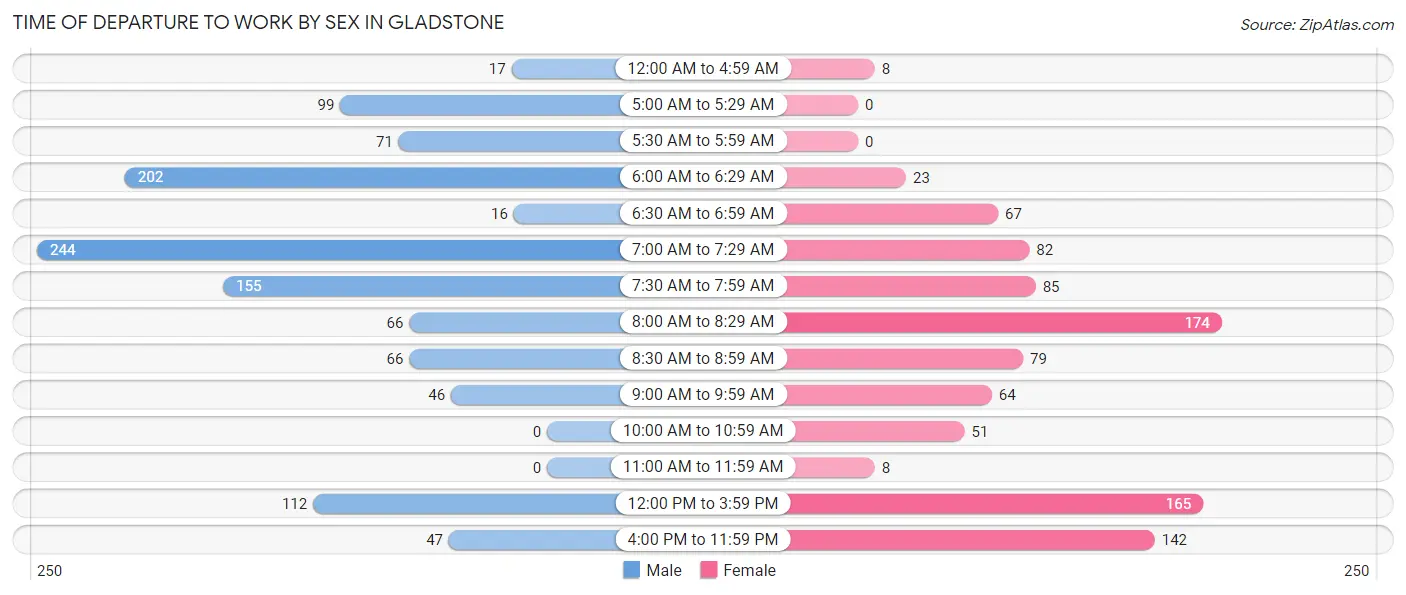
| Time of Departure | Male | Female |
| 12:00 AM to 4:59 AM | 17 (1.5%) | 8 (0.8%) |
| 5:00 AM to 5:29 AM | 99 (8.7%) | 0 (0.0%) |
| 5:30 AM to 5:59 AM | 71 (6.2%) | 0 (0.0%) |
| 6:00 AM to 6:29 AM | 202 (17.7%) | 23 (2.4%) |
| 6:30 AM to 6:59 AM | 16 (1.4%) | 67 (7.1%) |
| 7:00 AM to 7:29 AM | 244 (21.4%) | 82 (8.6%) |
| 7:30 AM to 7:59 AM | 155 (13.6%) | 85 (9.0%) |
| 8:00 AM to 8:29 AM | 66 (5.8%) | 174 (18.3%) |
| 8:30 AM to 8:59 AM | 66 (5.8%) | 79 (8.3%) |
| 9:00 AM to 9:59 AM | 46 (4.0%) | 64 (6.8%) |
| 10:00 AM to 10:59 AM | 0 (0.0%) | 51 (5.4%) |
| 11:00 AM to 11:59 AM | 0 (0.0%) | 8 (0.8%) |
| 12:00 PM to 3:59 PM | 112 (9.8%) | 165 (17.4%) |
| 4:00 PM to 11:59 PM | 47 (4.1%) | 142 (15.0%) |
| Total | 1,141 (100.0%) | 948 (100.0%) |
Housing Occupancy in Gladstone
Occupancy by Ownership in Gladstone
Of the total 1,994 dwellings in Gladstone, owner-occupied units account for 1,431 (71.8%), while renter-occupied units make up 563 (28.2%).
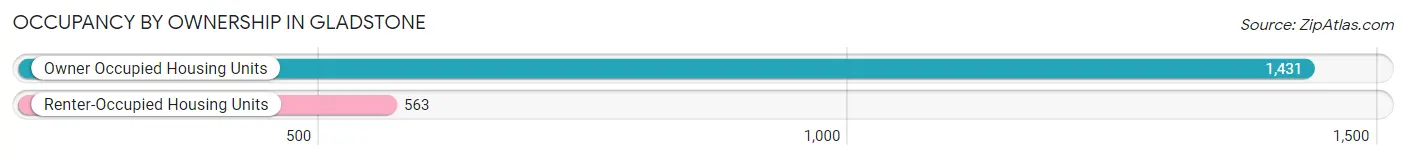
| Occupancy | # Housing Units | % Housing Units |
| Owner Occupied Housing Units | 1,431 | 71.8% |
| Renter-Occupied Housing Units | 563 | 28.2% |
| Total Occupied Housing Units | 1,994 | 100.0% |
Occupancy by Household Size in Gladstone
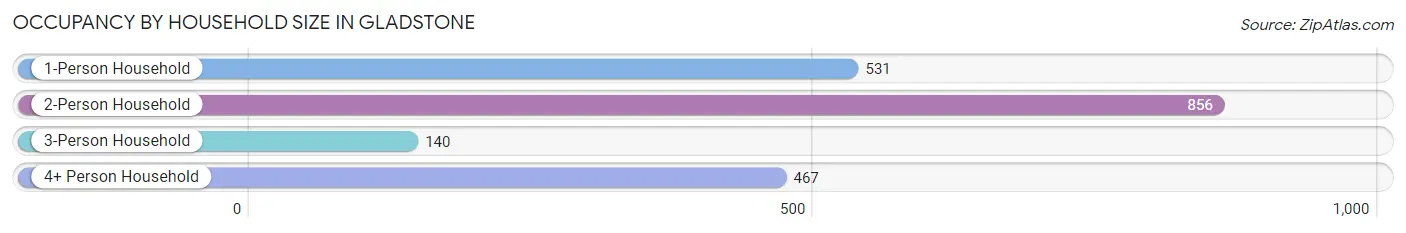
| Household Size | # Housing Units | % Housing Units |
| 1-Person Household | 531 | 26.6% |
| 2-Person Household | 856 | 42.9% |
| 3-Person Household | 140 | 7.0% |
| 4+ Person Household | 467 | 23.4% |
| Total Housing Units | 1,994 | 100.0% |
Occupancy by Ownership by Household Size in Gladstone
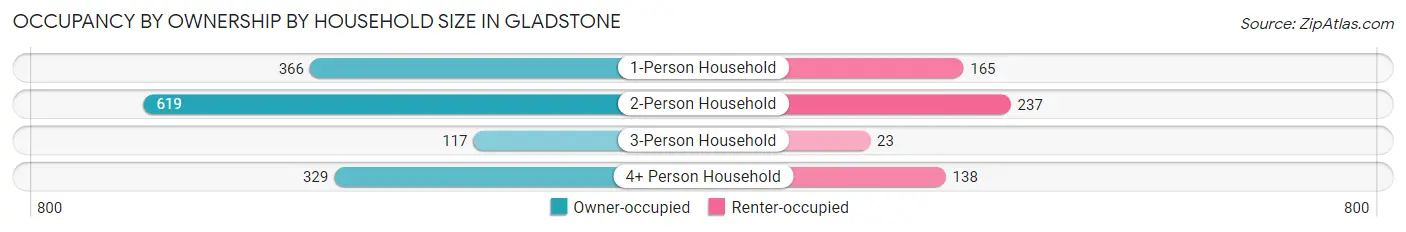
| Household Size | Owner-occupied | Renter-occupied |
| 1-Person Household | 366 (68.9%) | 165 (31.1%) |
| 2-Person Household | 619 (72.3%) | 237 (27.7%) |
| 3-Person Household | 117 (83.6%) | 23 (16.4%) |
| 4+ Person Household | 329 (70.5%) | 138 (29.5%) |
| Total Housing Units | 1,431 (71.8%) | 563 (28.2%) |
Occupancy by Educational Attainment in Gladstone
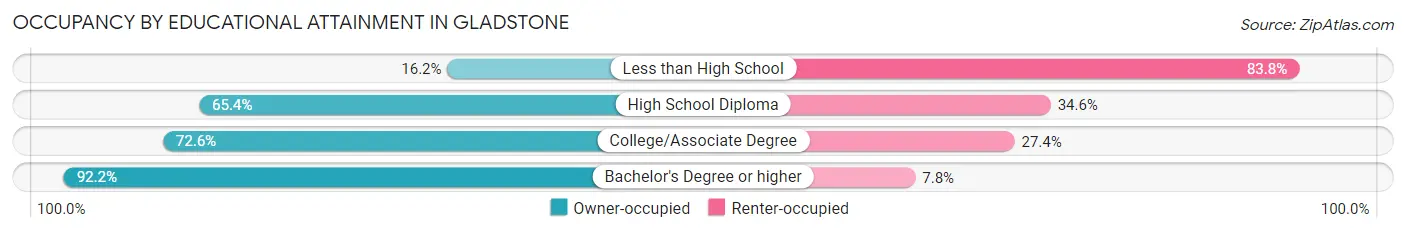
| Household Size | Owner-occupied | Renter-occupied |
| Less than High School | 11 (16.2%) | 57 (83.8%) |
| High School Diploma | 465 (65.4%) | 246 (34.6%) |
| College/Associate Degree | 611 (72.6%) | 231 (27.4%) |
| Bachelor's Degree or higher | 344 (92.2%) | 29 (7.8%) |
Occupancy by Age of Householder in Gladstone
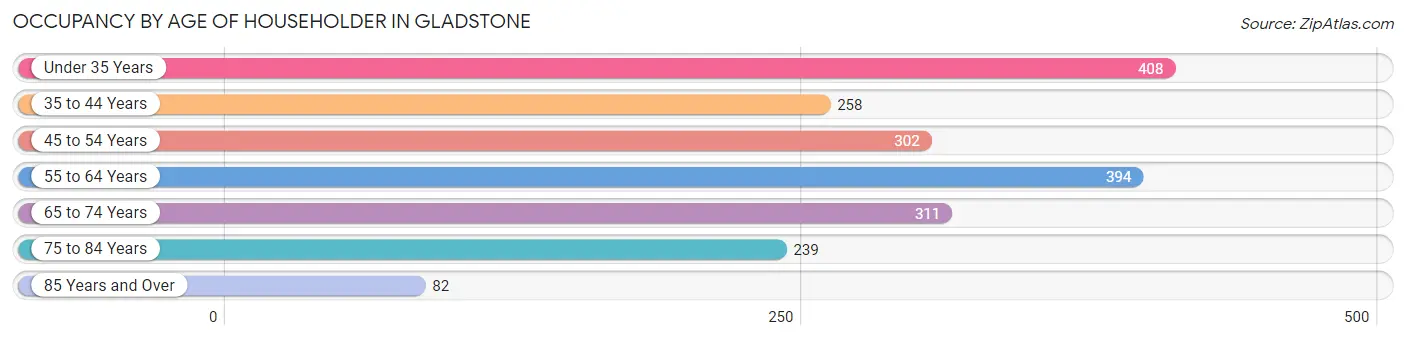
| Age Bracket | # Households | % Households |
| Under 35 Years | 408 | 20.5% |
| 35 to 44 Years | 258 | 12.9% |
| 45 to 54 Years | 302 | 15.1% |
| 55 to 64 Years | 394 | 19.8% |
| 65 to 74 Years | 311 | 15.6% |
| 75 to 84 Years | 239 | 12.0% |
| 85 Years and Over | 82 | 4.1% |
| Total | 1,994 | 100.0% |
Housing Finances in Gladstone
Median Income by Occupancy in Gladstone
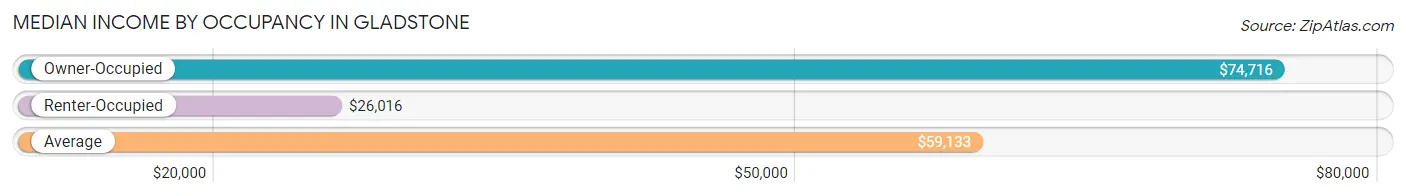
| Occupancy Type | # Households | Median Income |
| Owner-Occupied | 1,431 (71.8%) | $74,716 |
| Renter-Occupied | 563 (28.2%) | $26,016 |
| Average | 1,994 (100.0%) | $59,133 |
Occupancy by Householder Income Bracket in Gladstone
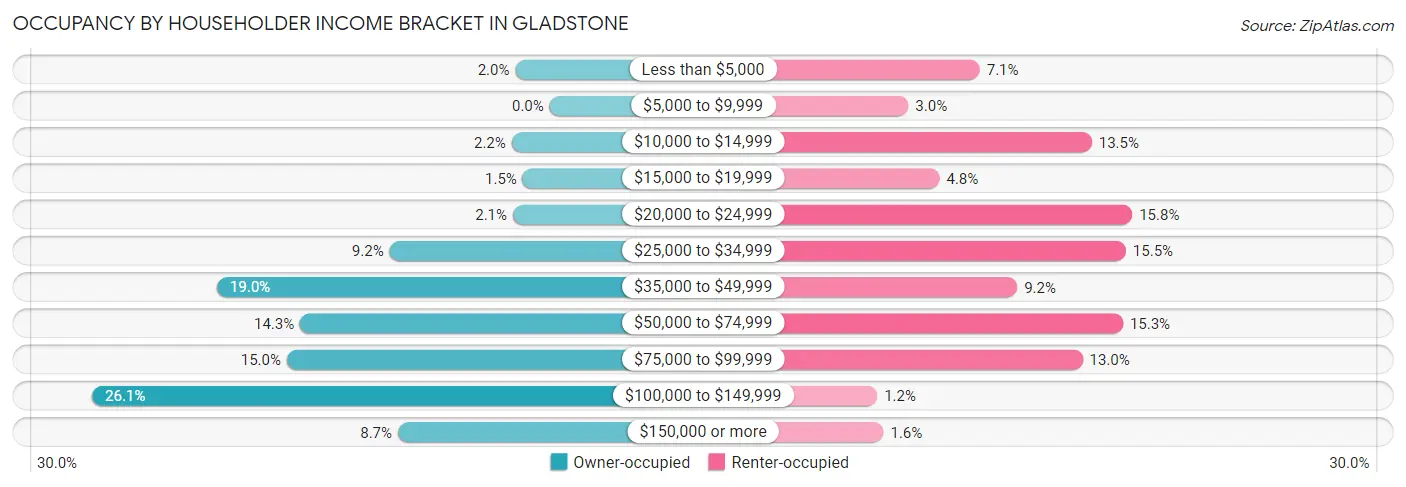
| Income Bracket | Owner-occupied | Renter-occupied |
| Less than $5,000 | 28 (2.0%) | 40 (7.1%) |
| $5,000 to $9,999 | 0 (0.0%) | 17 (3.0%) |
| $10,000 to $14,999 | 31 (2.2%) | 76 (13.5%) |
| $15,000 to $19,999 | 22 (1.5%) | 27 (4.8%) |
| $20,000 to $24,999 | 30 (2.1%) | 89 (15.8%) |
| $25,000 to $34,999 | 131 (9.1%) | 87 (15.4%) |
| $35,000 to $49,999 | 272 (19.0%) | 52 (9.2%) |
| $50,000 to $74,999 | 204 (14.3%) | 86 (15.3%) |
| $75,000 to $99,999 | 215 (15.0%) | 73 (13.0%) |
| $100,000 to $149,999 | 374 (26.1%) | 7 (1.2%) |
| $150,000 or more | 124 (8.7%) | 9 (1.6%) |
| Total | 1,431 (100.0%) | 563 (100.0%) |
Monthly Housing Cost Tiers in Gladstone
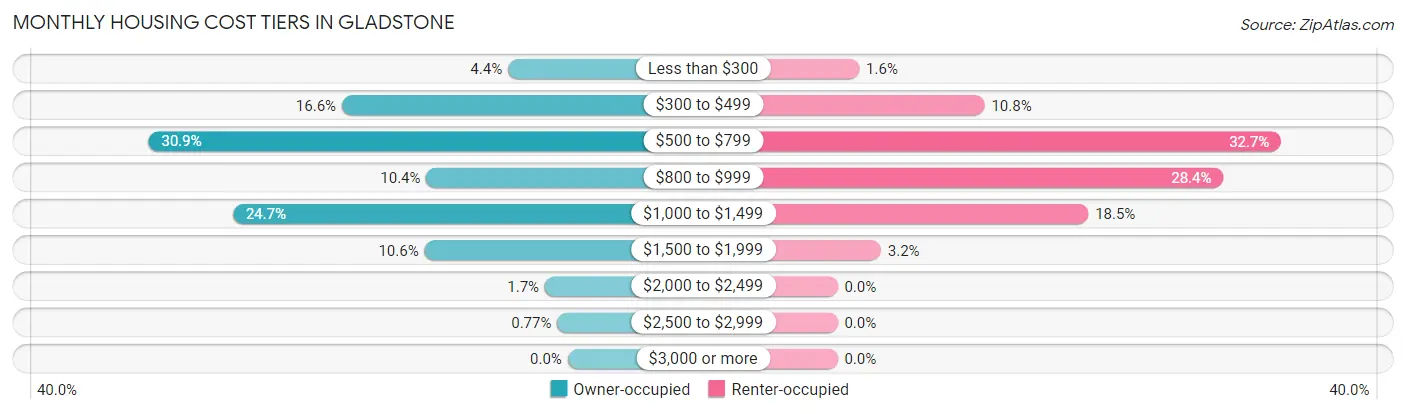
| Monthly Cost | Owner-occupied | Renter-occupied |
| Less than $300 | 63 (4.4%) | 9 (1.6%) |
| $300 to $499 | 238 (16.6%) | 61 (10.8%) |
| $500 to $799 | 442 (30.9%) | 184 (32.7%) |
| $800 to $999 | 149 (10.4%) | 160 (28.4%) |
| $1,000 to $1,499 | 353 (24.7%) | 104 (18.5%) |
| $1,500 to $1,999 | 151 (10.5%) | 18 (3.2%) |
| $2,000 to $2,499 | 24 (1.7%) | 0 (0.0%) |
| $2,500 to $2,999 | 11 (0.8%) | 0 (0.0%) |
| $3,000 or more | 0 (0.0%) | 0 (0.0%) |
| Total | 1,431 (100.0%) | 563 (100.0%) |
Physical Housing Characteristics in Gladstone
Housing Structures in Gladstone
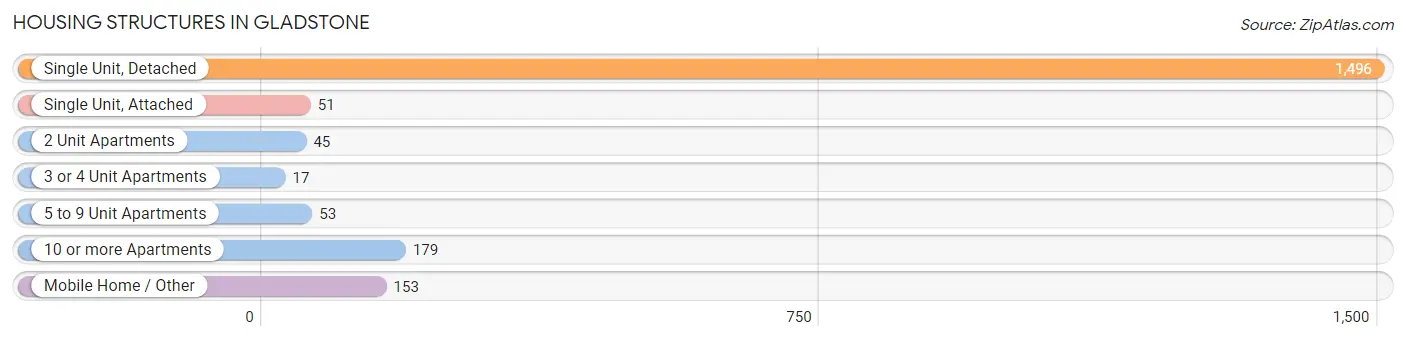
| Structure Type | # Housing Units | % Housing Units |
| Single Unit, Detached | 1,496 | 75.0% |
| Single Unit, Attached | 51 | 2.6% |
| 2 Unit Apartments | 45 | 2.3% |
| 3 or 4 Unit Apartments | 17 | 0.9% |
| 5 to 9 Unit Apartments | 53 | 2.7% |
| 10 or more Apartments | 179 | 9.0% |
| Mobile Home / Other | 153 | 7.7% |
| Total | 1,994 | 100.0% |
Housing Structures by Occupancy in Gladstone
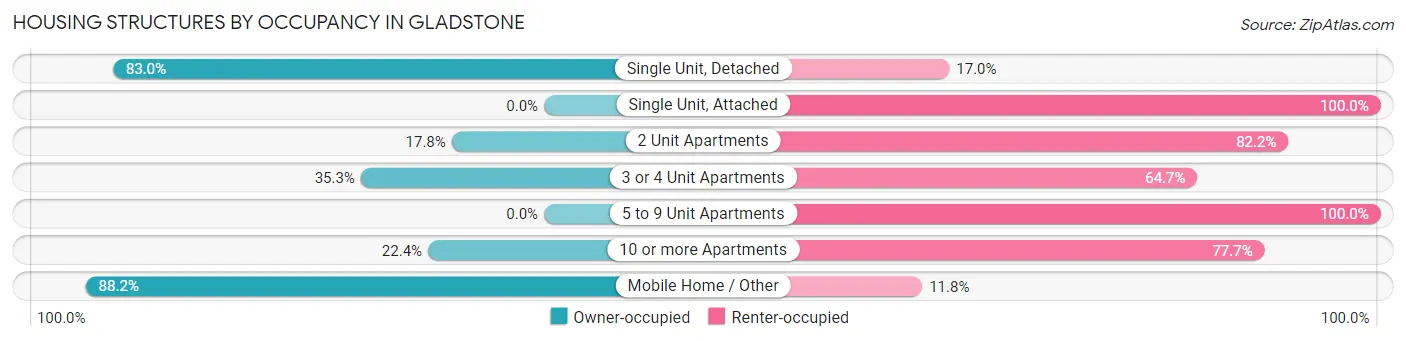
| Structure Type | Owner-occupied | Renter-occupied |
| Single Unit, Detached | 1,242 (83.0%) | 254 (17.0%) |
| Single Unit, Attached | 0 (0.0%) | 51 (100.0%) |
| 2 Unit Apartments | 8 (17.8%) | 37 (82.2%) |
| 3 or 4 Unit Apartments | 6 (35.3%) | 11 (64.7%) |
| 5 to 9 Unit Apartments | 0 (0.0%) | 53 (100.0%) |
| 10 or more Apartments | 40 (22.4%) | 139 (77.6%) |
| Mobile Home / Other | 135 (88.2%) | 18 (11.8%) |
| Total | 1,431 (71.8%) | 563 (28.2%) |
Housing Structures by Number of Rooms in Gladstone
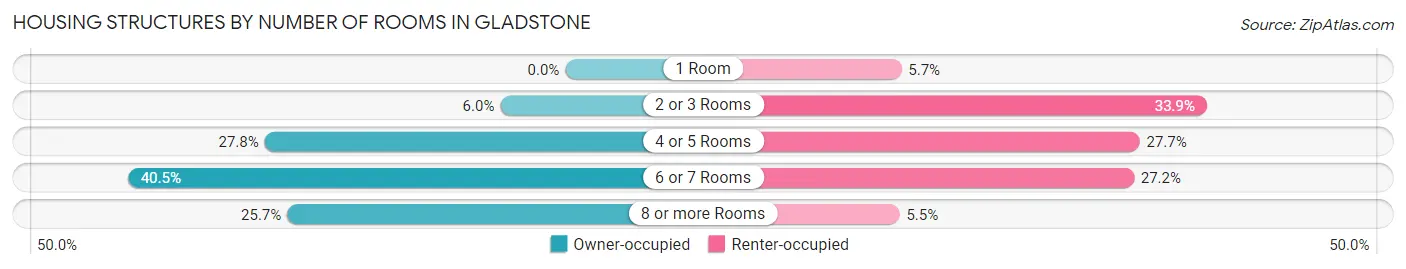
| Number of Rooms | Owner-occupied | Renter-occupied |
| 1 Room | 0 (0.0%) | 32 (5.7%) |
| 2 or 3 Rooms | 86 (6.0%) | 191 (33.9%) |
| 4 or 5 Rooms | 398 (27.8%) | 156 (27.7%) |
| 6 or 7 Rooms | 579 (40.5%) | 153 (27.2%) |
| 8 or more Rooms | 368 (25.7%) | 31 (5.5%) |
| Total | 1,431 (100.0%) | 563 (100.0%) |
Housing Structure by Heating Type in Gladstone
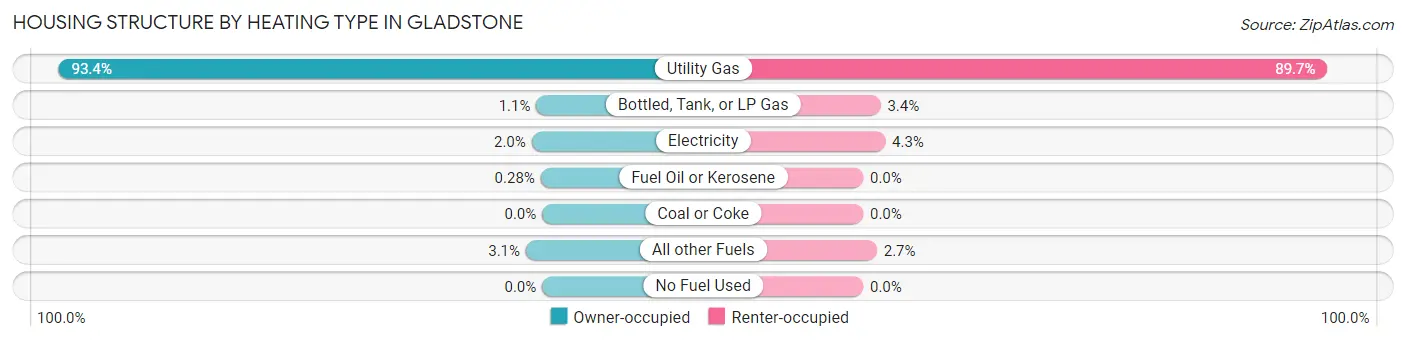
| Heating Type | Owner-occupied | Renter-occupied |
| Utility Gas | 1,337 (93.4%) | 505 (89.7%) |
| Bottled, Tank, or LP Gas | 16 (1.1%) | 19 (3.4%) |
| Electricity | 29 (2.0%) | 24 (4.3%) |
| Fuel Oil or Kerosene | 4 (0.3%) | 0 (0.0%) |
| Coal or Coke | 0 (0.0%) | 0 (0.0%) |
| All other Fuels | 45 (3.1%) | 15 (2.7%) |
| No Fuel Used | 0 (0.0%) | 0 (0.0%) |
| Total | 1,431 (100.0%) | 563 (100.0%) |
Household Vehicle Usage in Gladstone
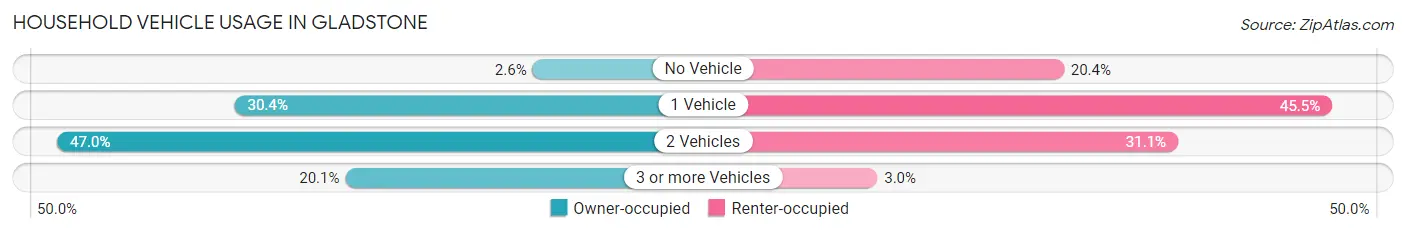
| Vehicles per Household | Owner-occupied | Renter-occupied |
| No Vehicle | 37 (2.6%) | 115 (20.4%) |
| 1 Vehicle | 435 (30.4%) | 256 (45.5%) |
| 2 Vehicles | 672 (47.0%) | 175 (31.1%) |
| 3 or more Vehicles | 287 (20.1%) | 17 (3.0%) |
| Total | 1,431 (100.0%) | 563 (100.0%) |
Real Estate & Mortgages in Gladstone
Real Estate and Mortgage Overview in Gladstone
| Characteristic | Without Mortgage | With Mortgage |
| Housing Units | 580 | 851 |
| Median Property Value | $107,600 | $114,400 |
| Median Household Income | $68,750 | $57 |
| Monthly Housing Costs | $497 | $0 |
| Real Estate Taxes | $1,821 | $82 |
Property Value by Mortgage Status in Gladstone
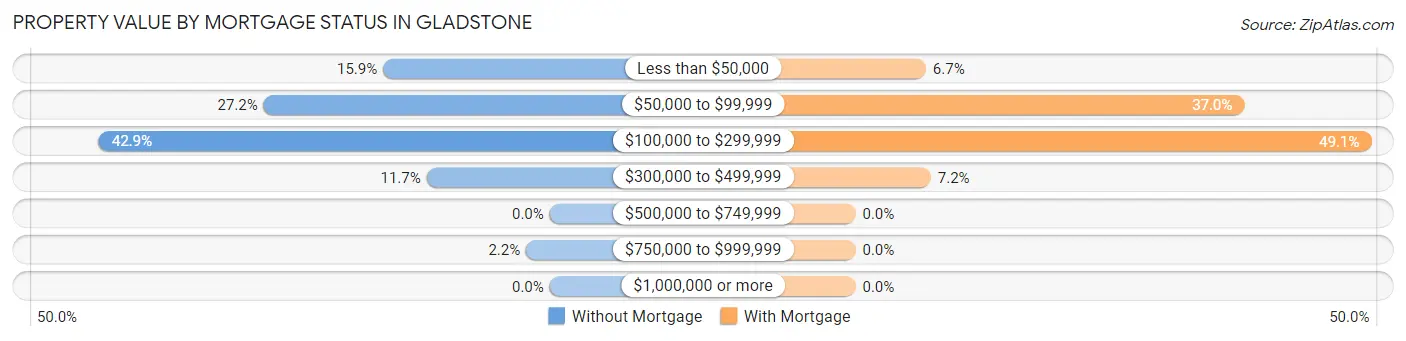
| Property Value | Without Mortgage | With Mortgage |
| Less than $50,000 | 92 (15.9%) | 57 (6.7%) |
| $50,000 to $99,999 | 158 (27.2%) | 315 (37.0%) |
| $100,000 to $299,999 | 249 (42.9%) | 418 (49.1%) |
| $300,000 to $499,999 | 68 (11.7%) | 61 (7.2%) |
| $500,000 to $749,999 | 0 (0.0%) | 0 (0.0%) |
| $750,000 to $999,999 | 13 (2.2%) | 0 (0.0%) |
| $1,000,000 or more | 0 (0.0%) | 0 (0.0%) |
| Total | 580 (100.0%) | 851 (100.0%) |
Household Income by Mortgage Status in Gladstone
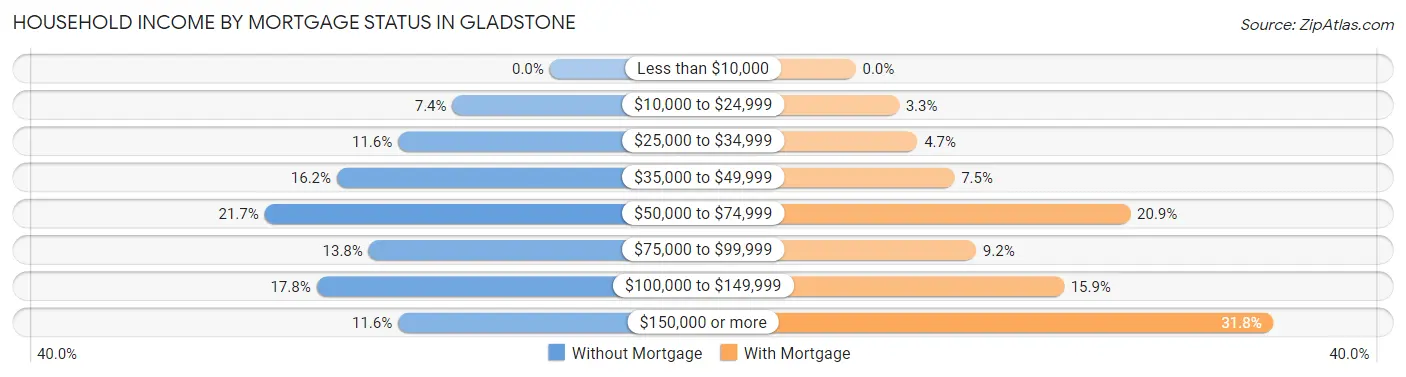
| Household Income | Without Mortgage | With Mortgage |
| Less than $10,000 | 0 (0.0%) | 0 (0.0%) |
| $10,000 to $24,999 | 43 (7.4%) | 28 (3.3%) |
| $25,000 to $34,999 | 67 (11.6%) | 40 (4.7%) |
| $35,000 to $49,999 | 94 (16.2%) | 64 (7.5%) |
| $50,000 to $74,999 | 126 (21.7%) | 178 (20.9%) |
| $75,000 to $99,999 | 80 (13.8%) | 78 (9.2%) |
| $100,000 to $149,999 | 103 (17.8%) | 135 (15.9%) |
| $150,000 or more | 67 (11.6%) | 271 (31.8%) |
| Total | 580 (100.0%) | 851 (100.0%) |
Property Value to Household Income Ratio in Gladstone
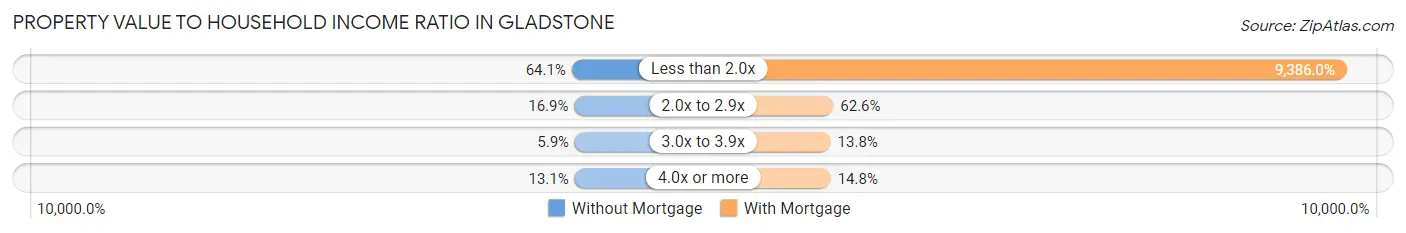
| Value-to-Income Ratio | Without Mortgage | With Mortgage |
| Less than 2.0x | 372 (64.1%) | 79,875 (9,386.0%) |
| 2.0x to 2.9x | 98 (16.9%) | 533 (62.6%) |
| 3.0x to 3.9x | 34 (5.9%) | 117 (13.8%) |
| 4.0x or more | 76 (13.1%) | 126 (14.8%) |
| Total | 580 (100.0%) | 851 (100.0%) |
Real Estate Taxes by Mortgage Status in Gladstone
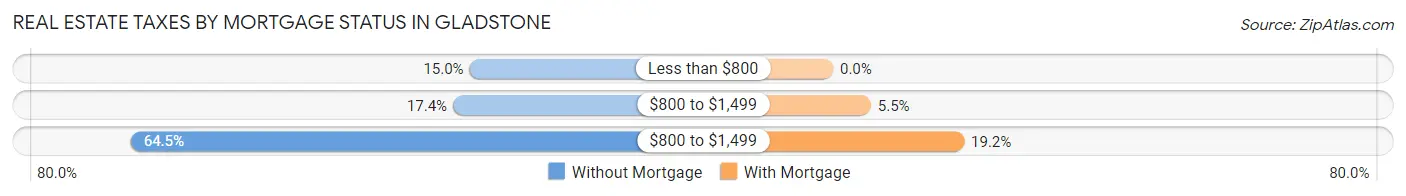
| Property Taxes | Without Mortgage | With Mortgage |
| Less than $800 | 87 (15.0%) | 0 (0.0%) |
| $800 to $1,499 | 101 (17.4%) | 47 (5.5%) |
| $800 to $1,499 | 374 (64.5%) | 163 (19.2%) |
| Total | 580 (100.0%) | 851 (100.0%) |
Health & Disability in Gladstone
Health Insurance Coverage by Age in Gladstone
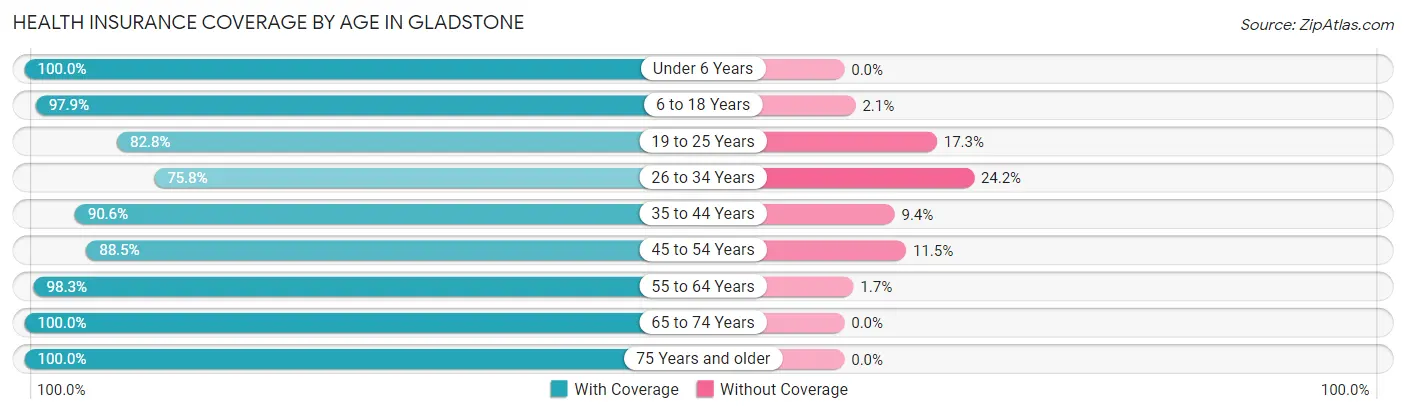
| Age Bracket | With Coverage | Without Coverage |
| Under 6 Years | 337 (100.0%) | 0 (0.0%) |
| 6 to 18 Years | 941 (97.9%) | 20 (2.1%) |
| 19 to 25 Years | 379 (82.8%) | 79 (17.2%) |
| 26 to 34 Years | 464 (75.8%) | 148 (24.2%) |
| 35 to 44 Years | 532 (90.6%) | 55 (9.4%) |
| 45 to 54 Years | 515 (88.5%) | 67 (11.5%) |
| 55 to 64 Years | 694 (98.3%) | 12 (1.7%) |
| 65 to 74 Years | 533 (100.0%) | 0 (0.0%) |
| 75 Years and older | 445 (100.0%) | 0 (0.0%) |
| Total | 4,840 (92.7%) | 381 (7.3%) |
Health Insurance Coverage by Citizenship Status in Gladstone
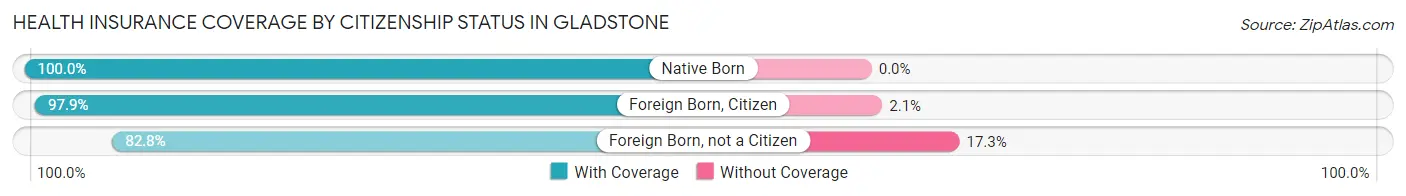
| Citizenship Status | With Coverage | Without Coverage |
| Native Born | 337 (100.0%) | 0 (0.0%) |
| Foreign Born, Citizen | 941 (97.9%) | 20 (2.1%) |
| Foreign Born, not a Citizen | 379 (82.8%) | 79 (17.2%) |
Health Insurance Coverage by Household Income in Gladstone
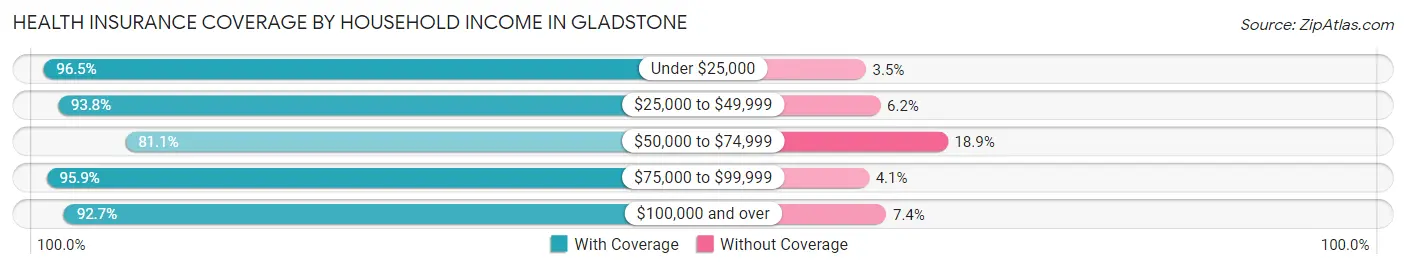
| Household Income | With Coverage | Without Coverage |
| Under $25,000 | 631 (96.5%) | 23 (3.5%) |
| $25,000 to $49,999 | 932 (93.8%) | 62 (6.2%) |
| $50,000 to $74,999 | 456 (81.1%) | 106 (18.9%) |
| $75,000 to $99,999 | 866 (95.9%) | 37 (4.1%) |
| $100,000 and over | 1,930 (92.6%) | 153 (7.3%) |
Public vs Private Health Insurance Coverage by Age in Gladstone
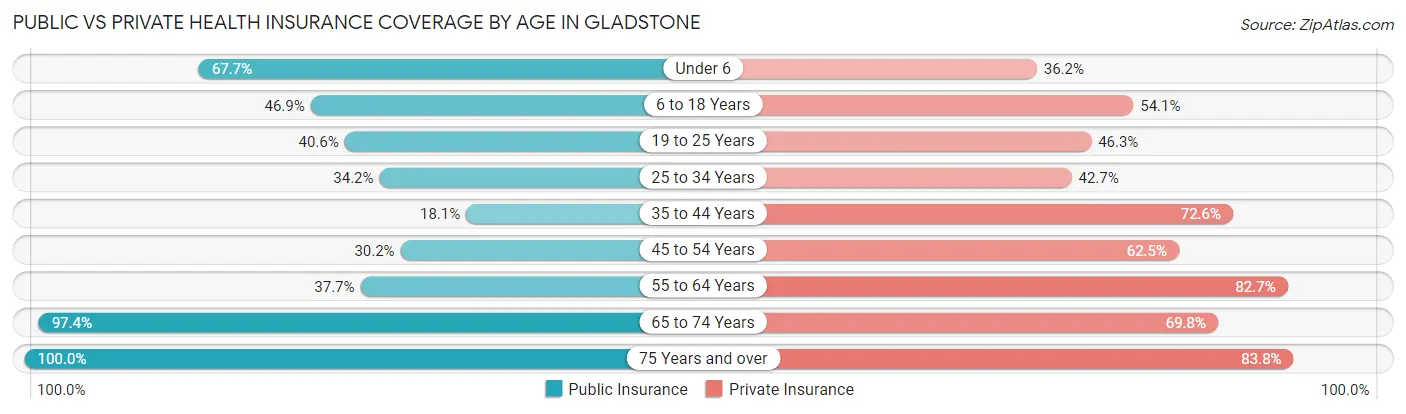
| Age Bracket | Public Insurance | Private Insurance |
| Under 6 | 228 (67.7%) | 122 (36.2%) |
| 6 to 18 Years | 451 (46.9%) | 520 (54.1%) |
| 19 to 25 Years | 186 (40.6%) | 212 (46.3%) |
| 25 to 34 Years | 209 (34.2%) | 261 (42.6%) |
| 35 to 44 Years | 106 (18.1%) | 426 (72.6%) |
| 45 to 54 Years | 176 (30.2%) | 364 (62.5%) |
| 55 to 64 Years | 266 (37.7%) | 584 (82.7%) |
| 65 to 74 Years | 519 (97.4%) | 372 (69.8%) |
| 75 Years and over | 445 (100.0%) | 373 (83.8%) |
| Total | 2,586 (49.5%) | 3,234 (61.9%) |
Disability Status by Sex by Age in Gladstone
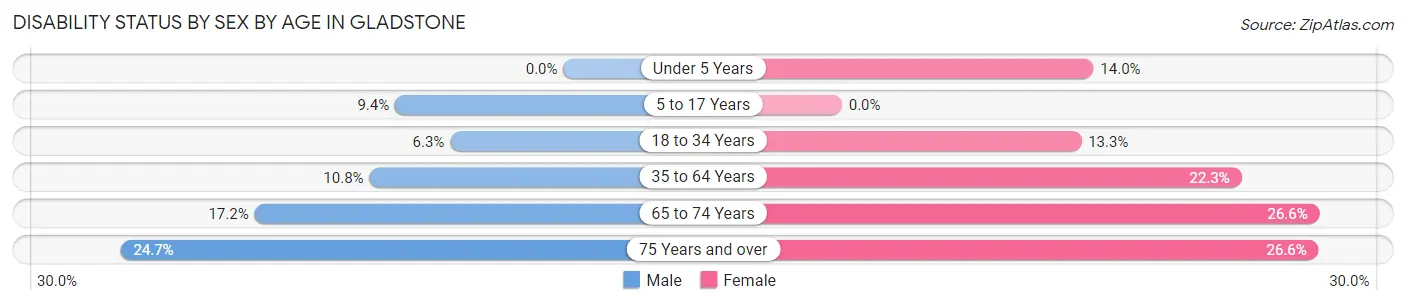
| Age Bracket | Male | Female |
| Under 5 Years | 0 (0.0%) | 22 (14.0%) |
| 5 to 17 Years | 52 (9.4%) | 0 (0.0%) |
| 18 to 34 Years | 39 (6.3%) | 64 (13.3%) |
| 35 to 64 Years | 105 (10.8%) | 201 (22.3%) |
| 65 to 74 Years | 27 (17.2%) | 100 (26.6%) |
| 75 Years and over | 54 (24.7%) | 60 (26.6%) |
Disability Class by Sex by Age in Gladstone
Disability Class: Hearing Difficulty
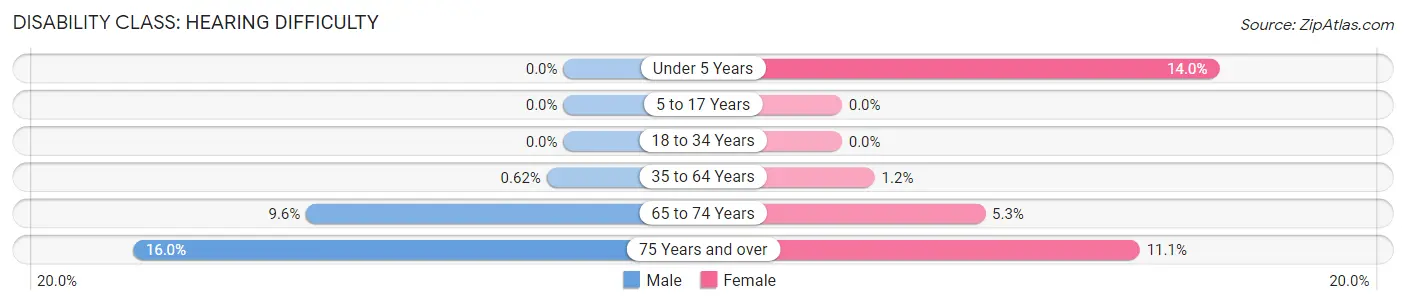
| Age Bracket | Male | Female |
| Under 5 Years | 0 (0.0%) | 22 (14.0%) |
| 5 to 17 Years | 0 (0.0%) | 0 (0.0%) |
| 18 to 34 Years | 0 (0.0%) | 0 (0.0%) |
| 35 to 64 Years | 6 (0.6%) | 11 (1.2%) |
| 65 to 74 Years | 15 (9.6%) | 20 (5.3%) |
| 75 Years and over | 35 (16.0%) | 25 (11.1%) |
Disability Class: Vision Difficulty
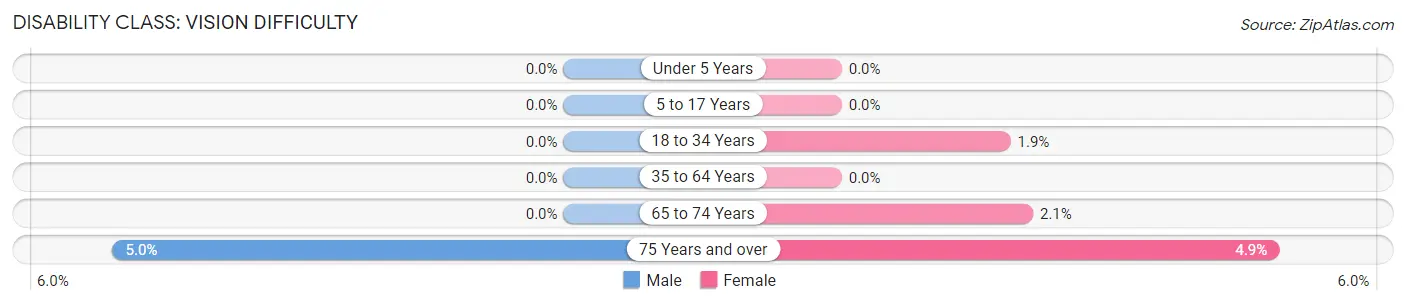
| Age Bracket | Male | Female |
| Under 5 Years | 0 (0.0%) | 0 (0.0%) |
| 5 to 17 Years | 0 (0.0%) | 0 (0.0%) |
| 18 to 34 Years | 0 (0.0%) | 9 (1.9%) |
| 35 to 64 Years | 0 (0.0%) | 0 (0.0%) |
| 65 to 74 Years | 0 (0.0%) | 8 (2.1%) |
| 75 Years and over | 11 (5.0%) | 11 (4.9%) |
Disability Class: Cognitive Difficulty
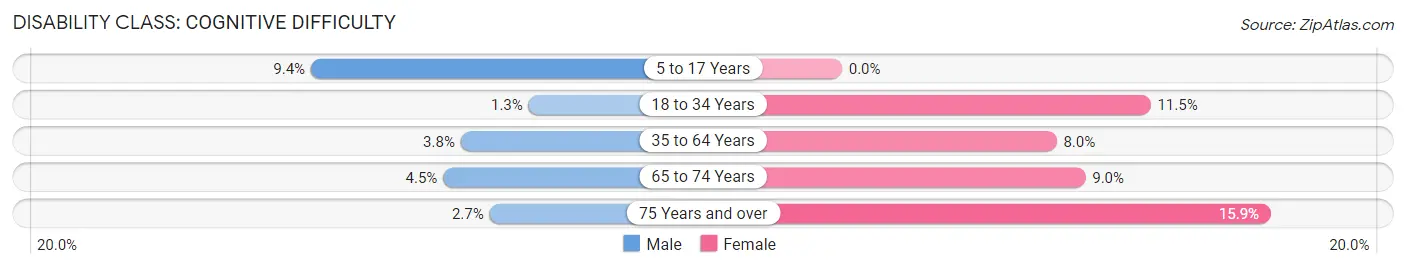
| Age Bracket | Male | Female |
| 5 to 17 Years | 52 (9.4%) | 0 (0.0%) |
| 18 to 34 Years | 8 (1.3%) | 55 (11.5%) |
| 35 to 64 Years | 37 (3.8%) | 72 (8.0%) |
| 65 to 74 Years | 7 (4.5%) | 34 (9.0%) |
| 75 Years and over | 6 (2.7%) | 36 (15.9%) |
Disability Class: Ambulatory Difficulty
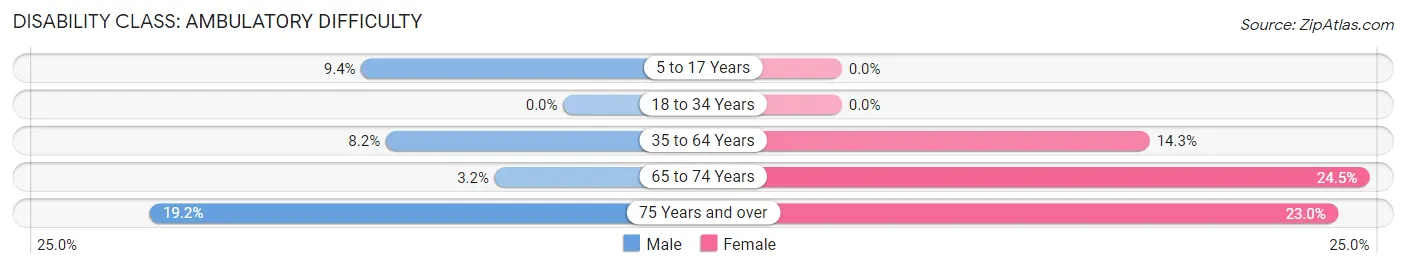
| Age Bracket | Male | Female |
| 5 to 17 Years | 52 (9.4%) | 0 (0.0%) |
| 18 to 34 Years | 0 (0.0%) | 0 (0.0%) |
| 35 to 64 Years | 80 (8.2%) | 129 (14.3%) |
| 65 to 74 Years | 5 (3.2%) | 92 (24.5%) |
| 75 Years and over | 42 (19.2%) | 52 (23.0%) |
Disability Class: Self-Care Difficulty
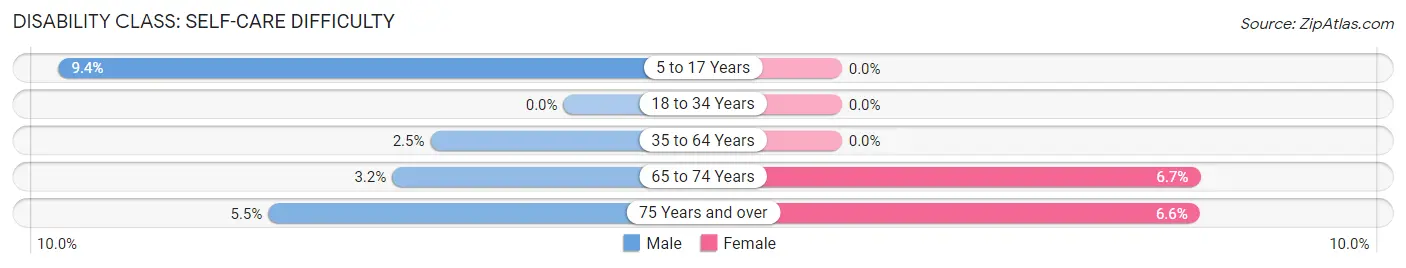
| Age Bracket | Male | Female |
| 5 to 17 Years | 52 (9.4%) | 0 (0.0%) |
| 18 to 34 Years | 0 (0.0%) | 0 (0.0%) |
| 35 to 64 Years | 24 (2.5%) | 0 (0.0%) |
| 65 to 74 Years | 5 (3.2%) | 25 (6.7%) |
| 75 Years and over | 12 (5.5%) | 15 (6.6%) |
Technology Access in Gladstone
Computing Device Access in Gladstone
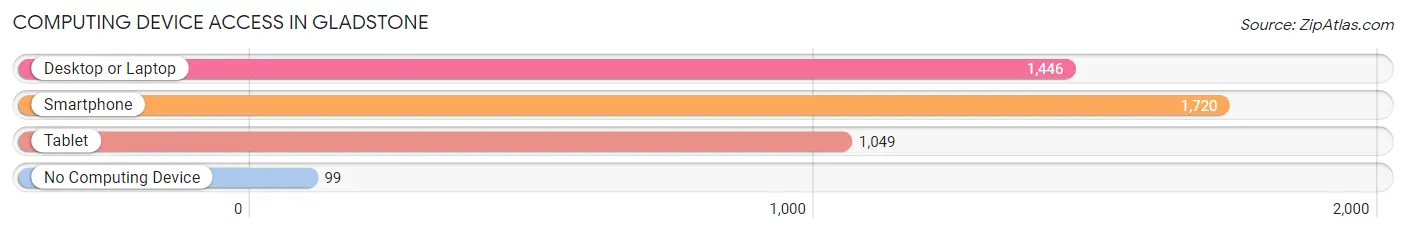
| Device Type | # Households | % Households |
| Desktop or Laptop | 1,446 | 72.5% |
| Smartphone | 1,720 | 86.3% |
| Tablet | 1,049 | 52.6% |
| No Computing Device | 99 | 5.0% |
| Total | 1,994 | 100.0% |
Internet Access in Gladstone
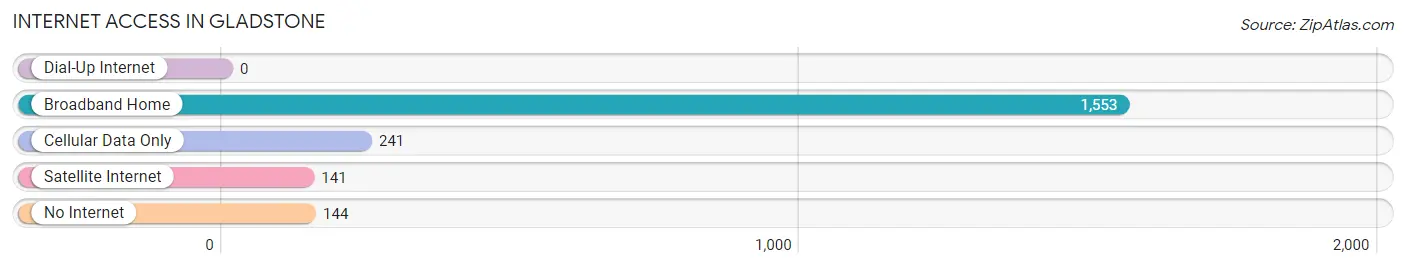
| Internet Type | # Households | % Households |
| Dial-Up Internet | 0 | 0.0% |
| Broadband Home | 1,553 | 77.9% |
| Cellular Data Only | 241 | 12.1% |
| Satellite Internet | 141 | 7.1% |
| No Internet | 144 | 7.2% |
| Total | 1,994 | 100.0% |
Gladstone Summary
Gladstone, Michigan is a small city located in the Upper Peninsula of Michigan. It is situated on the shores of Lake Michigan and is part of the Escanaba Metropolitan Statistical Area. The city has a population of 5,719 people, according to the 2010 census.
History
Gladstone was founded in 1887 by a group of Swedish immigrants. The city was named after the Swedish city of Gladstone, which was the hometown of the immigrants. The city was incorporated in 1891 and was the first city in Delta County.
Gladstone was a major lumbering center in the late 19th and early 20th centuries. The city was home to several sawmills and lumber companies, which provided employment for many of the city’s residents. The lumber industry declined in the 1920s, and the city’s economy shifted to tourism and recreation.
Geography
Gladstone is located in the Upper Peninsula of Michigan, on the shores of Lake Michigan. The city is situated on the Escanaba River, which flows into the lake. The city is surrounded by forests and is home to several parks and recreational areas.
The city has a total area of 4.2 square miles, of which 0.2 square miles is water. The city has a humid continental climate, with cold winters and warm summers.
Economy
Gladstone’s economy is largely based on tourism and recreation. The city is home to several parks and recreational areas, including the Gladstone Beach Park, the Gladstone Marina, and the Gladstone Golf Course. The city is also home to several restaurants, bars, and shops.
The city is also home to several manufacturing companies, including a paper mill, a steel mill, and a wood products plant. The city is also home to several healthcare facilities, including a hospital and several clinics.
Demographics
Gladstone has a population of 5,719 people, according to the 2010 census. The city has a median household income of $37,945 and a median family income of $45,945. The city has a poverty rate of 16.3%, and the unemployment rate is 6.2%.
The city is predominantly white, with 91.3% of the population identifying as white. The city also has a small Hispanic population, with 4.2% of the population identifying as Hispanic or Latino. The city also has a small African American population, with 1.2% of the population identifying as African American.
Conclusion
Gladstone, Michigan is a small city located in the Upper Peninsula of Michigan. It is situated on the shores of Lake Michigan and is part of the Escanaba Metropolitan Statistical Area. The city has a population of 5,719 people, according to the 2010 census. The city’s economy is largely based on tourism and recreation, and it is home to several manufacturing companies, healthcare facilities, and parks and recreational areas. The city is predominantly white, with 91.3% of the population identifying as white. The city also has a small Hispanic population, with 4.2% of the population identifying as Hispanic or Latino.
Common Questions
What is Per Capita Income in Gladstone?
Per Capita income in Gladstone is $27,496.
What is the Median Family Income in Gladstone?
Median Family Income in Gladstone is $79,420.
What is the Median Household income in Gladstone?
Median Household Income in Gladstone is $59,133.
What is Income or Wage Gap in Gladstone?
Income or Wage Gap in Gladstone is 56.5%.
Women in Gladstone earn 43.5 cents for every dollar earned by a man.
What is Family Income Deficit in Gladstone?
Family Income Deficit in Gladstone is $10,285.
Families that are below poverty line in Gladstone earn $10,285 less on average than the poverty threshold level.
What is Inequality or Gini Index in Gladstone?
Inequality or Gini Index in Gladstone is 0.39.
What is the Total Population of Gladstone?
Total Population of Gladstone is 5,231.
What is the Total Male Population of Gladstone?
Total Male Population of Gladstone is 2,640.
What is the Total Female Population of Gladstone?
Total Female Population of Gladstone is 2,591.
What is the Ratio of Males per 100 Females in Gladstone?
There are 101.89 Males per 100 Females in Gladstone.
What is the Ratio of Females per 100 Males in Gladstone?
There are 98.14 Females per 100 Males in Gladstone.
What is the Median Population Age in Gladstone?
Median Population Age in Gladstone is 40.5 Years.
What is the Average Family Size in Gladstone
Average Family Size in Gladstone is 3.1 People.
What is the Average Household Size in Gladstone
Average Household Size in Gladstone is 2.6 People.
How Large is the Labor Force in Gladstone?
There are 2,316 People in the Labor Forcein in Gladstone.
What is the Percentage of People in the Labor Force in Gladstone?
54.8% of People are in the Labor Force in Gladstone.
What is the Unemployment Rate in Gladstone?
Unemployment Rate in Gladstone is 3.8%.