Brownlee Park, MI Map & Demographics
Brownlee Park Map
Brownlee Park Overview
$19,643
PER CAPITA INCOME
$44,032
AVG FAMILY INCOME
$38,698
AVG HOUSEHOLD INCOME
21.7%
WAGE / INCOME GAP [ % ]
78.3¢/ $1
WAGE / INCOME GAP [ $ ]
0.39
INEQUALITY / GINI INDEX
1,931
TOTAL POPULATION
1,262
MALE POPULATION
669
FEMALE POPULATION
188.64
MALES / 100 FEMALES
53.01
FEMALES / 100 MALES
41.4
MEDIAN AGE
3.3
AVG FAMILY SIZE
2.8
AVG HOUSEHOLD SIZE
862
LABOR FORCE [ PEOPLE ]
55.1%
PERCENT IN LABOR FORCE
2.2%
UNEMPLOYMENT RATE
Income in Brownlee Park
Income Overview in Brownlee Park
Per Capita Income in Brownlee Park is $19,643, while median incomes of families and households are $44,032 and $38,698 respectively.
| Characteristic | Number | Measure |
| Per Capita Income | 1,931 | $19,643 |
| Median Family Income | 466 | $44,032 |
| Mean Family Income | 466 | $58,762 |
| Median Household Income | 697 | $38,698 |
| Mean Household Income | 697 | $51,043 |
| Income Deficit | 466 | $0 |
| Wage / Income Gap (%) | 1,931 | 21.72% |
| Wage / Income Gap ($) | 1,931 | 78.28¢ per $1 |
| Gini / Inequality Index | 1,931 | 0.39 |
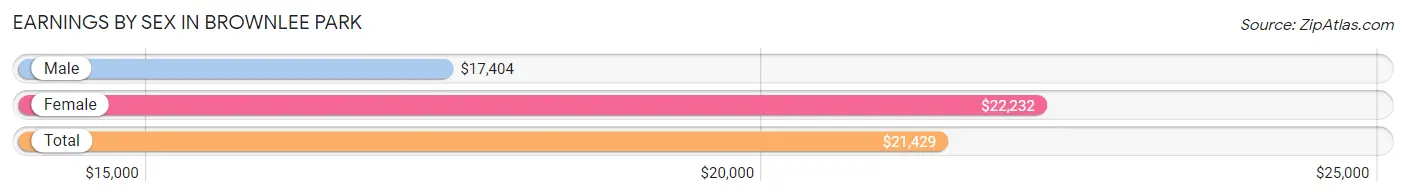
Earnings by Sex in Brownlee Park
Average Earnings in Brownlee Park are $21,429, $17,404 for men and $22,232 for women, a difference of 21.7%.
| Sex | Number | Average Earnings |
| Male | 551 (62.9%) | $17,404 |
| Female | 325 (37.1%) | $22,232 |
| Total | 876 (100.0%) | $21,429 |
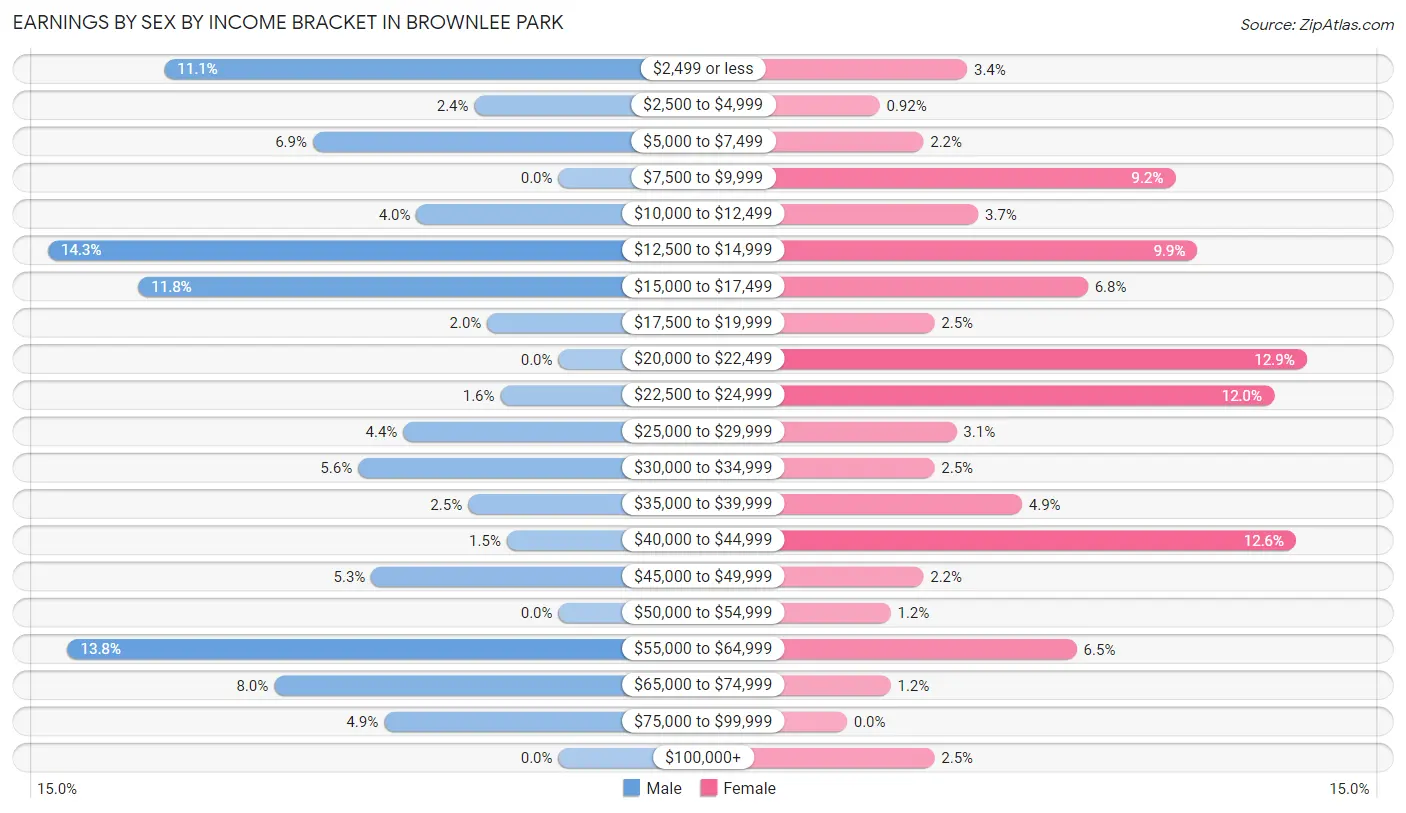
Earnings by Sex by Income Bracket in Brownlee Park
The most common earnings brackets in Brownlee Park are $12,500 to $14,999 for men (79 | 14.3%) and $20,000 to $22,499 for women (42 | 12.9%).
| Income | Male | Female |
| $2,499 or less | 61 (11.1%) | 11 (3.4%) |
| $2,500 to $4,999 | 13 (2.4%) | 3 (0.9%) |
| $5,000 to $7,499 | 38 (6.9%) | 7 (2.1%) |
| $7,500 to $9,999 | 0 (0.0%) | 30 (9.2%) |
| $10,000 to $12,499 | 22 (4.0%) | 12 (3.7%) |
| $12,500 to $14,999 | 79 (14.3%) | 32 (9.9%) |
| $15,000 to $17,499 | 65 (11.8%) | 22 (6.8%) |
| $17,500 to $19,999 | 11 (2.0%) | 8 (2.5%) |
| $20,000 to $22,499 | 0 (0.0%) | 42 (12.9%) |
| $22,500 to $24,999 | 9 (1.6%) | 39 (12.0%) |
| $25,000 to $29,999 | 24 (4.4%) | 10 (3.1%) |
| $30,000 to $34,999 | 31 (5.6%) | 8 (2.5%) |
| $35,000 to $39,999 | 14 (2.5%) | 16 (4.9%) |
| $40,000 to $44,999 | 8 (1.5%) | 41 (12.6%) |
| $45,000 to $49,999 | 29 (5.3%) | 7 (2.1%) |
| $50,000 to $54,999 | 0 (0.0%) | 4 (1.2%) |
| $55,000 to $64,999 | 76 (13.8%) | 21 (6.5%) |
| $65,000 to $74,999 | 44 (8.0%) | 4 (1.2%) |
| $75,000 to $99,999 | 27 (4.9%) | 0 (0.0%) |
| $100,000+ | 0 (0.0%) | 8 (2.5%) |
| Total | 551 (100.0%) | 325 (100.0%) |
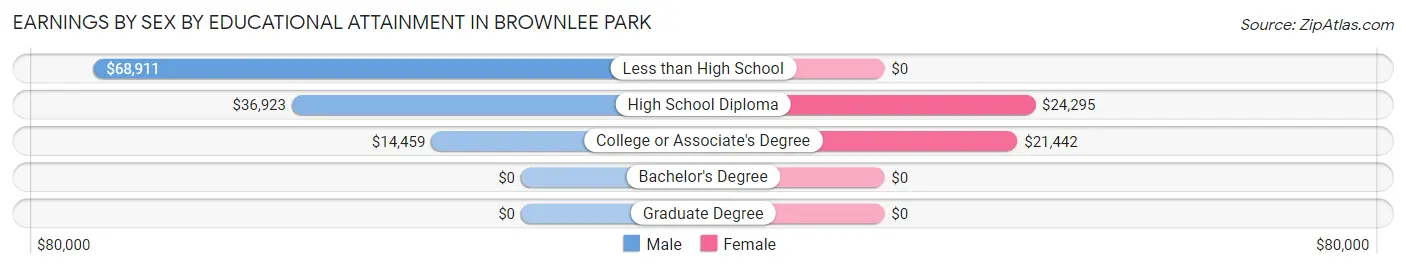
Earnings by Sex by Educational Attainment in Brownlee Park
Average earnings in Brownlee Park are $34,113 for men and $23,654 for women, a difference of 30.7%. Men with an educational attainment of less than high school enjoy the highest average annual earnings of $68,911, while those with college or associate's degree education earn the least with $14,459. Women with an educational attainment of high school diploma earn the most with the average annual earnings of $24,295, while those with college or associate's degree education have the smallest earnings of $21,442.
| Educational Attainment | Male Income | Female Income |
| Less than High School | $68,911 | $0 |
| High School Diploma | $36,923 | $24,295 |
| College or Associate's Degree | $14,459 | $21,442 |
| Bachelor's Degree | - | - |
| Graduate Degree | - | - |
| Total | $34,113 | $23,654 |
Family Income in Brownlee Park
Family Income Brackets in Brownlee Park
According to the Brownlee Park family income data, there are 100 families falling into the $75,000 to $99,999 income range, which is the most common income bracket and makes up 21.5% of all families. Conversely, the $200,000+ income bracket is the least frequent group with only 7 families (1.5%) belonging to this category.
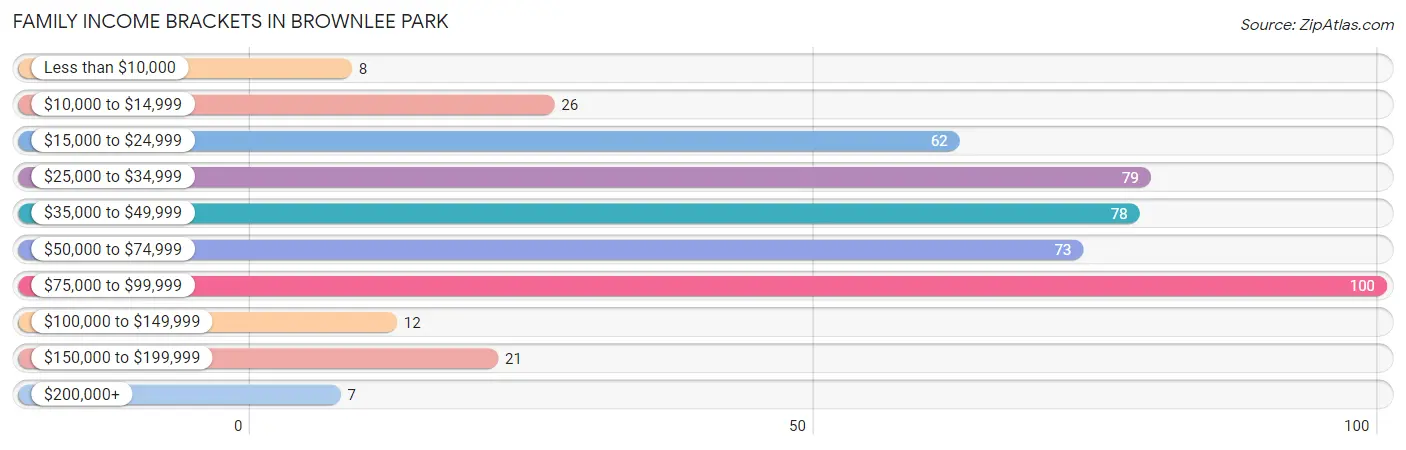
| Income Bracket | # Families | % Families |
| Less than $10,000 | 8 | 1.7% |
| $10,000 to $14,999 | 26 | 5.6% |
| $15,000 to $24,999 | 62 | 13.3% |
| $25,000 to $34,999 | 79 | 17.0% |
| $35,000 to $49,999 | 78 | 16.7% |
| $50,000 to $74,999 | 73 | 15.7% |
| $75,000 to $99,999 | 100 | 21.5% |
| $100,000 to $149,999 | 12 | 2.6% |
| $150,000 to $199,999 | 21 | 4.5% |
| $200,000+ | 7 | 1.5% |
Family Income by Famaliy Size in Brownlee Park
3-person families (137 | 29.4%) account for the highest median family income in Brownlee Park with $73,047 per family, while 3-person families (137 | 29.4%) have the highest median income of $24,349 per family member.
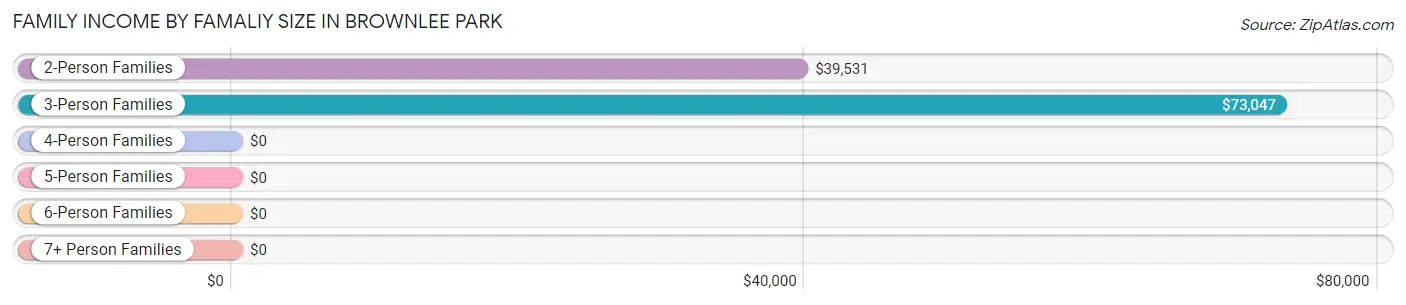
| Income Bracket | # Families | Median Income |
| 2-Person Families | 237 (50.9%) | $39,531 |
| 3-Person Families | 137 (29.4%) | $73,047 |
| 4-Person Families | 54 (11.6%) | $0 |
| 5-Person Families | 14 (3.0%) | $0 |
| 6-Person Families | 24 (5.1%) | $0 |
| 7+ Person Families | 0 (0.0%) | $0 |
| Total | 466 (100.0%) | $44,032 |
Family Income by Number of Earners in Brownlee Park
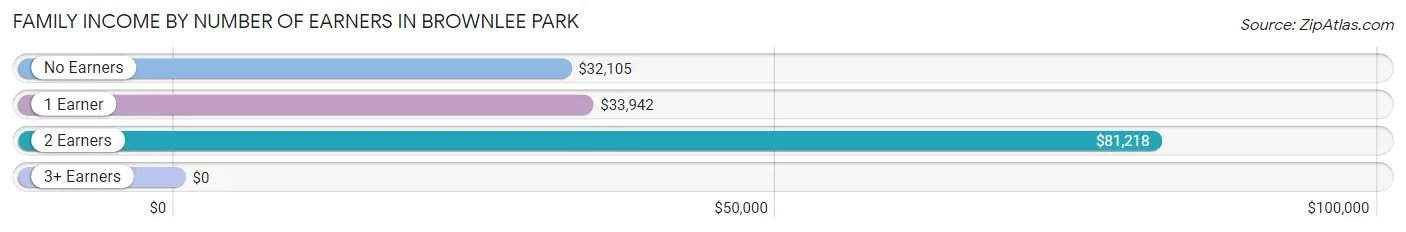
| Number of Earners | # Families | Median Income |
| No Earners | 110 (23.6%) | $32,105 |
| 1 Earner | 145 (31.1%) | $33,942 |
| 2 Earners | 186 (39.9%) | $81,218 |
| 3+ Earners | 25 (5.4%) | $0 |
| Total | 466 (100.0%) | $44,032 |
Household Income in Brownlee Park
Household Income Brackets in Brownlee Park
With 137 households falling in the category, the $15,000 to $24,999 income range is the most frequent in Brownlee Park, accounting for 19.7% of all households. In contrast, only 7 households (1.0%) fall into the $200,000+ income bracket, making it the least populous group.
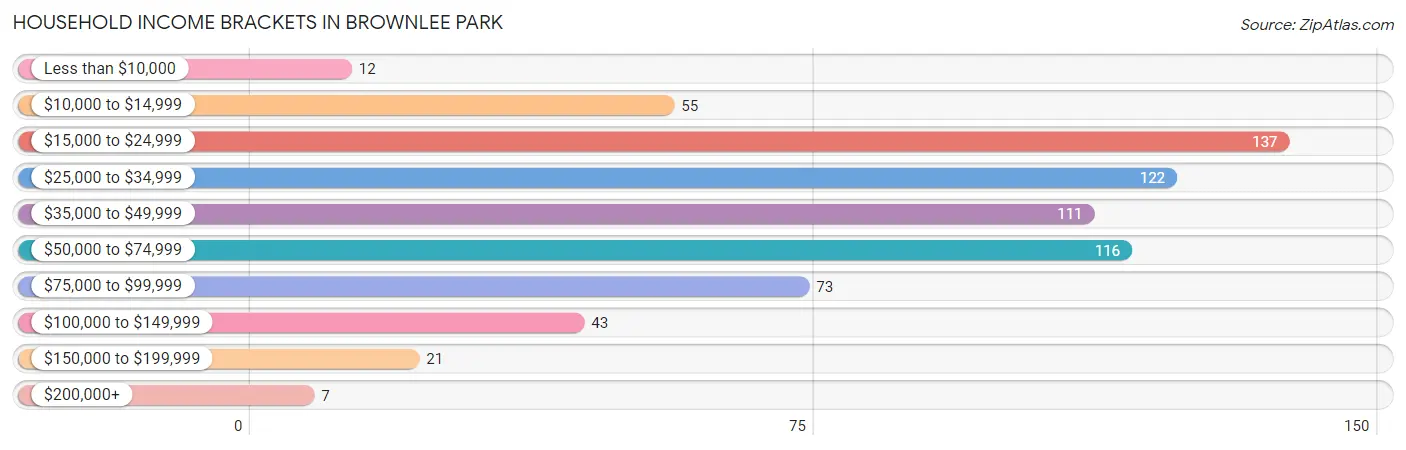
| Income Bracket | # Households | % Households |
| Less than $10,000 | 12 | 1.7% |
| $10,000 to $14,999 | 55 | 7.9% |
| $15,000 to $24,999 | 137 | 19.7% |
| $25,000 to $34,999 | 122 | 17.5% |
| $35,000 to $49,999 | 111 | 15.9% |
| $50,000 to $74,999 | 116 | 16.6% |
| $75,000 to $99,999 | 73 | 10.5% |
| $100,000 to $149,999 | 43 | 6.2% |
| $150,000 to $199,999 | 21 | 3.0% |
| $200,000+ | 7 | 1.0% |
Household Income by Householder Age in Brownlee Park
The median household income in Brownlee Park is $38,698, with the highest median household income of $58,021 found in the 45 to 64 years age bracket for the primary householder. A total of 259 households (37.2%) fall into this category. Meanwhile, the 15 to 24 years age bracket for the primary householder has the lowest median household income of $0, with 34 households (4.9%) in this group.
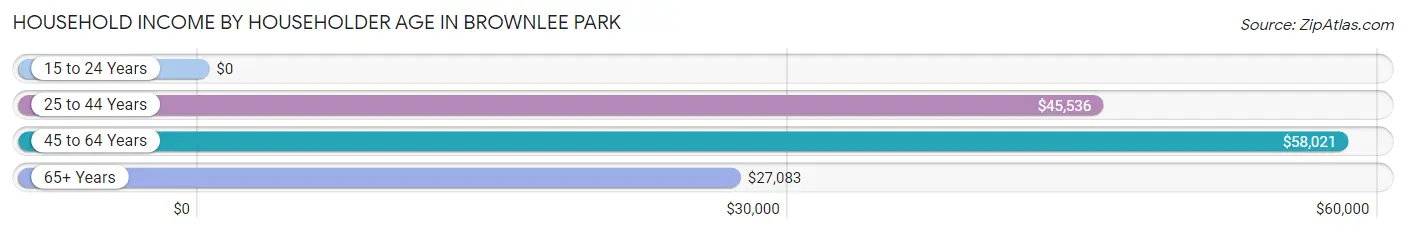
| Income Bracket | # Households | Median Income |
| 15 to 24 Years | 34 (4.9%) | $0 |
| 25 to 44 Years | 219 (31.4%) | $45,536 |
| 45 to 64 Years | 259 (37.2%) | $58,021 |
| 65+ Years | 185 (26.5%) | $27,083 |
| Total | 697 (100.0%) | $38,698 |
Poverty in Brownlee Park
Income Below Poverty by Sex and Age in Brownlee Park
With 26.9% poverty level for males and 21.2% for females among the residents of Brownlee Park, under 5 year old males and 18 to 24 year old females are the most vulnerable to poverty, with 33 males (63.5%) and 29 females (64.4%) in their respective age groups living below the poverty level.
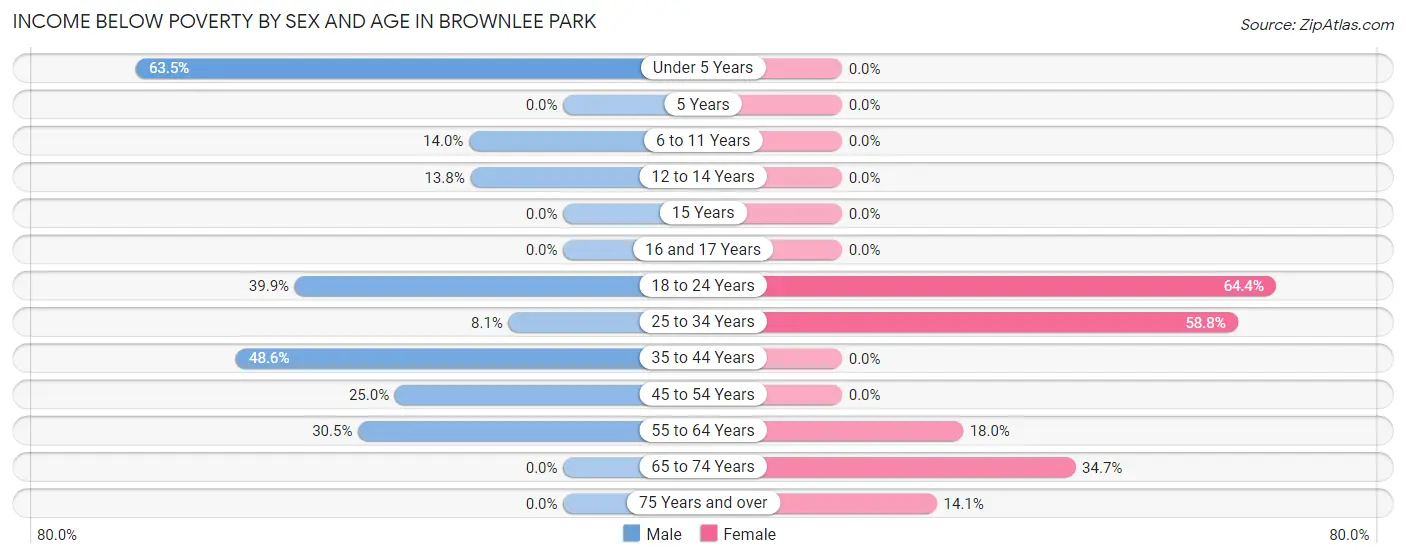
| Age Bracket | Male | Female |
| Under 5 Years | 33 (63.5%) | 0 (0.0%) |
| 5 Years | 0 (0.0%) | 0 (0.0%) |
| 6 to 11 Years | 20 (14.0%) | 0 (0.0%) |
| 12 to 14 Years | 8 (13.8%) | 0 (0.0%) |
| 15 Years | 0 (0.0%) | 0 (0.0%) |
| 16 and 17 Years | 0 (0.0%) | 0 (0.0%) |
| 18 to 24 Years | 59 (39.9%) | 29 (64.4%) |
| 25 to 34 Years | 13 (8.1%) | 47 (58.8%) |
| 35 to 44 Years | 138 (48.6%) | 0 (0.0%) |
| 45 to 54 Years | 22 (25.0%) | 0 (0.0%) |
| 55 to 64 Years | 46 (30.5%) | 21 (17.9%) |
| 65 to 74 Years | 0 (0.0%) | 35 (34.6%) |
| 75 Years and over | 0 (0.0%) | 10 (14.1%) |
| Total | 339 (26.9%) | 142 (21.2%) |
Income Above Poverty by Sex and Age in Brownlee Park
According to the poverty statistics in Brownlee Park, males aged 5 years and females aged under 5 years are the age groups that are most secure financially, with 100.0% of males and 100.0% of females in these age groups living above the poverty line.
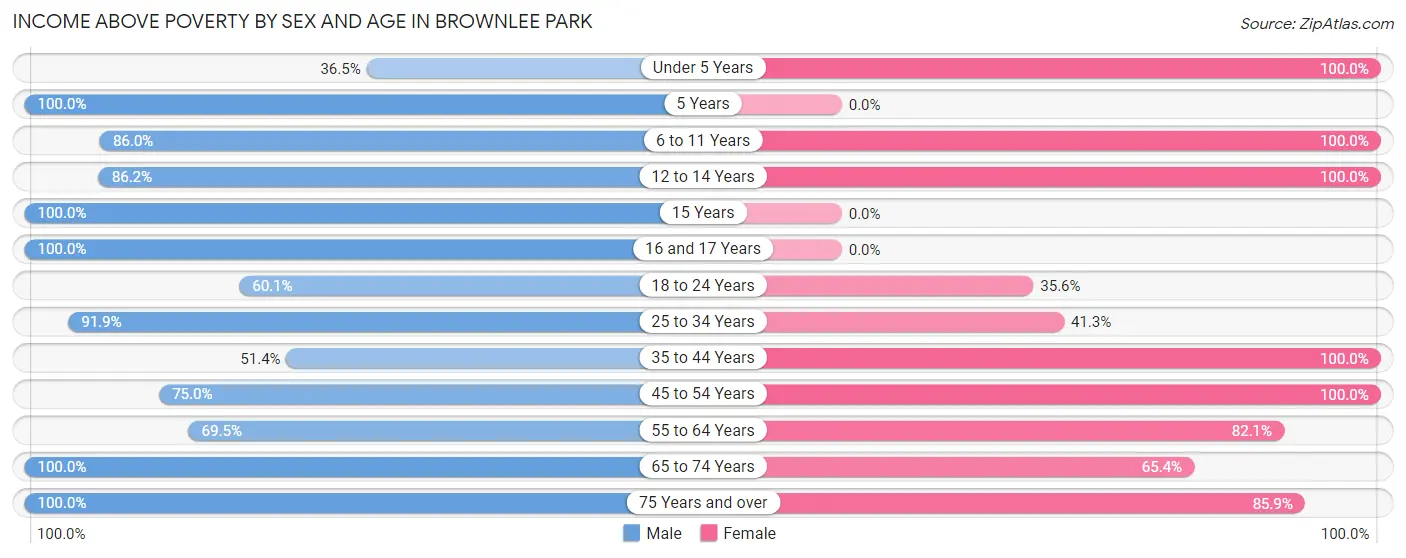
| Age Bracket | Male | Female |
| Under 5 Years | 19 (36.5%) | 2 (100.0%) |
| 5 Years | 15 (100.0%) | 0 (0.0%) |
| 6 to 11 Years | 123 (86.0%) | 6 (100.0%) |
| 12 to 14 Years | 50 (86.2%) | 76 (100.0%) |
| 15 Years | 15 (100.0%) | 0 (0.0%) |
| 16 and 17 Years | 29 (100.0%) | 0 (0.0%) |
| 18 to 24 Years | 89 (60.1%) | 16 (35.6%) |
| 25 to 34 Years | 147 (91.9%) | 33 (41.2%) |
| 35 to 44 Years | 146 (51.4%) | 113 (100.0%) |
| 45 to 54 Years | 66 (75.0%) | 58 (100.0%) |
| 55 to 64 Years | 105 (69.5%) | 96 (82.1%) |
| 65 to 74 Years | 88 (100.0%) | 66 (65.3%) |
| 75 Years and over | 31 (100.0%) | 61 (85.9%) |
| Total | 923 (73.1%) | 527 (78.8%) |
Income Below Poverty Among Married-Couple Families in Brownlee Park
The poverty statistics for married-couple families in Brownlee Park show that 22.6% or 52 of the total 230 families live below the poverty line. Families with 1 or 2 children have the highest poverty rate of 30.4%, comprising of 21 families. On the other hand, families with 3 or 4 children have the lowest poverty rate of 0.0%, which includes 0 families.
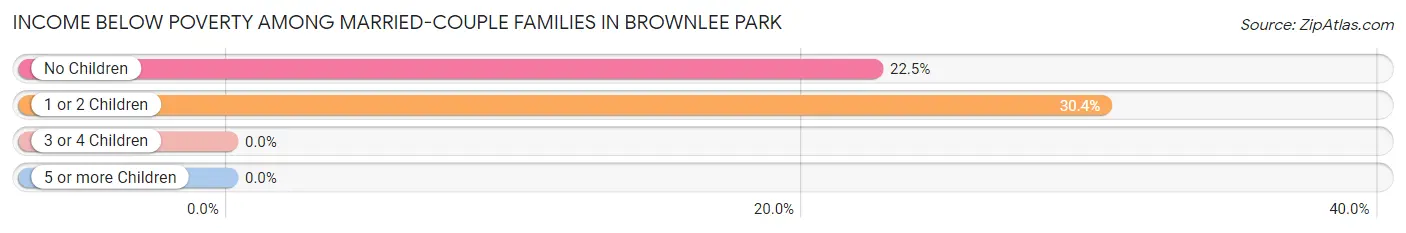
| Children | Above Poverty | Below Poverty |
| No Children | 107 (77.5%) | 31 (22.5%) |
| 1 or 2 Children | 48 (69.6%) | 21 (30.4%) |
| 3 or 4 Children | 23 (100.0%) | 0 (0.0%) |
| 5 or more Children | 0 (0.0%) | 0 (0.0%) |
| Total | 178 (77.4%) | 52 (22.6%) |
Income Below Poverty Among Single-Parent Households in Brownlee Park
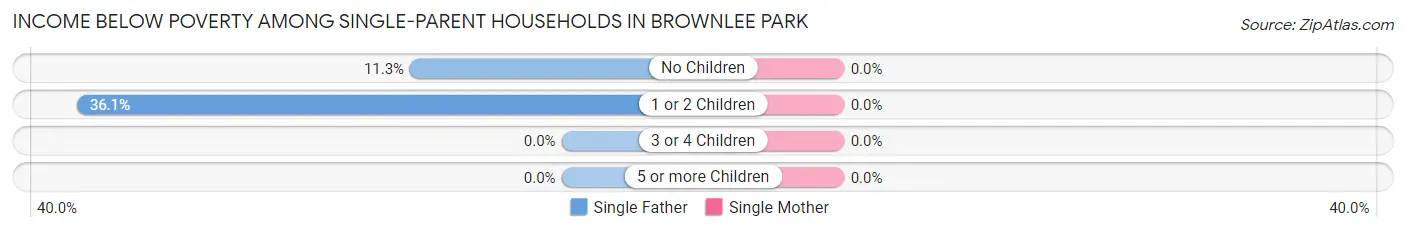
| Children | Single Father | Single Mother |
| No Children | 14 (11.3%) | 0 (0.0%) |
| 1 or 2 Children | 13 (36.1%) | 0 (0.0%) |
| 3 or 4 Children | 0 (0.0%) | 0 (0.0%) |
| 5 or more Children | 0 (0.0%) | 0 (0.0%) |
| Total | 27 (16.9%) | 0 (0.0%) |
Income Below Poverty Among Married-Couple vs Single-Parent Households in Brownlee Park
The poverty data for Brownlee Park shows that 52 of the married-couple family households (22.6%) and 27 of the single-parent households (11.4%) are living below the poverty level. Within the married-couple family households, those with 1 or 2 children have the highest poverty rate, with 21 households (30.4%) falling below the poverty line. Among the single-parent households, those with 1 or 2 children have the highest poverty rate, with 13 household (25.5%) living below poverty.
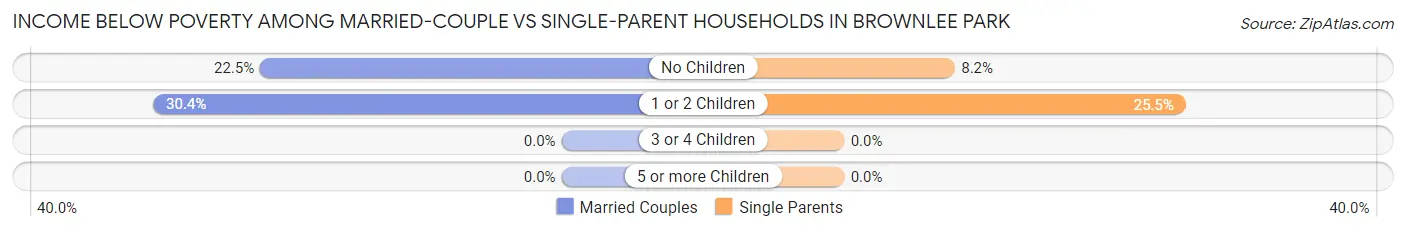
| Children | Married-Couple Families | Single-Parent Households |
| No Children | 31 (22.5%) | 14 (8.2%) |
| 1 or 2 Children | 21 (30.4%) | 13 (25.5%) |
| 3 or 4 Children | 0 (0.0%) | 0 (0.0%) |
| 5 or more Children | 0 (0.0%) | 0 (0.0%) |
| Total | 52 (22.6%) | 27 (11.4%) |
Race in Brownlee Park
The most populous races in Brownlee Park are White / Caucasian (1,809 | 93.7%), Black / African American (70 | 3.6%), and Two or more Races (52 | 2.7%).
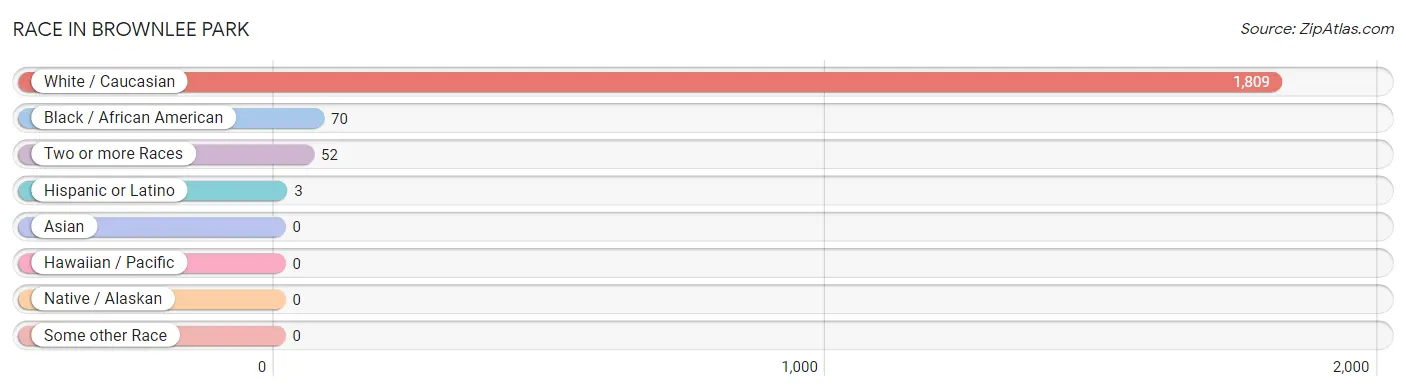
| Race | # Population | % Population |
| Asian | 0 | 0.0% |
| Black / African American | 70 | 3.6% |
| Hawaiian / Pacific | 0 | 0.0% |
| Hispanic or Latino | 3 | 0.2% |
| Native / Alaskan | 0 | 0.0% |
| White / Caucasian | 1,809 | 93.7% |
| Two or more Races | 52 | 2.7% |
| Some other Race | 0 | 0.0% |
| Total | 1,931 | 100.0% |
Ancestry in Brownlee Park
The most populous ancestries reported in Brownlee Park are American (237 | 12.3%), German (228 | 11.8%), English (210 | 10.9%), Scottish (99 | 5.1%), and Irish (83 | 4.3%), together accounting for 44.4% of all Brownlee Park residents.
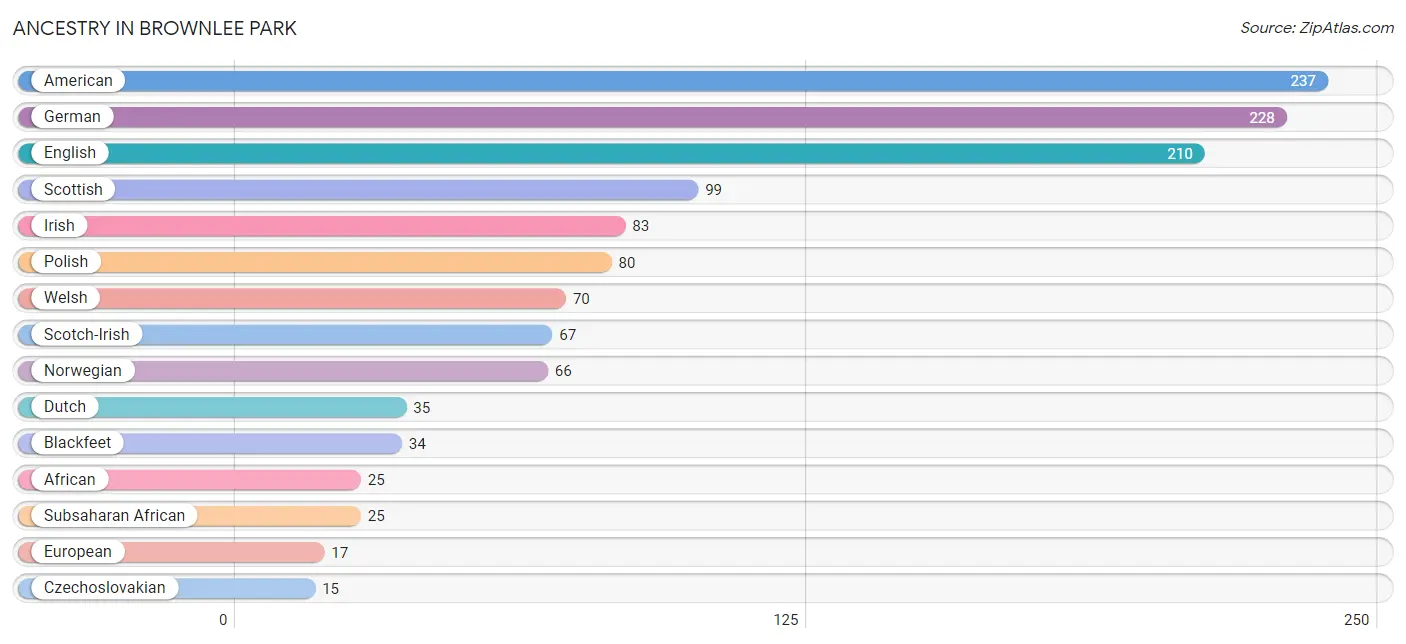
| Ancestry | # Population | % Population |
| African | 25 | 1.3% |
| American | 237 | 12.3% |
| Blackfeet | 34 | 1.8% |
| Cherokee | 3 | 0.2% |
| Czechoslovakian | 15 | 0.8% |
| Danish | 4 | 0.2% |
| Dutch | 35 | 1.8% |
| English | 210 | 10.9% |
| European | 17 | 0.9% |
| French Canadian | 8 | 0.4% |
| German | 228 | 11.8% |
| Irish | 83 | 4.3% |
| Italian | 2 | 0.1% |
| Mexican | 3 | 0.2% |
| Norwegian | 66 | 3.4% |
| Polish | 80 | 4.1% |
| Scotch-Irish | 67 | 3.5% |
| Scottish | 99 | 5.1% |
| Subsaharan African | 25 | 1.3% |
| Swedish | 12 | 0.6% |
| Ukrainian | 8 | 0.4% |
| Welsh | 70 | 3.6% | View All 22 Rows |
Immigrants in Brownlee Park

| Immigration Origin | # Population | % Population | View All 0 Rows |
Sex and Age in Brownlee Park
Sex and Age in Brownlee Park
The most populous age groups in Brownlee Park are 40 to 44 Years (254 | 20.1%) for men and 65 to 69 Years (85 | 12.7%) for women.
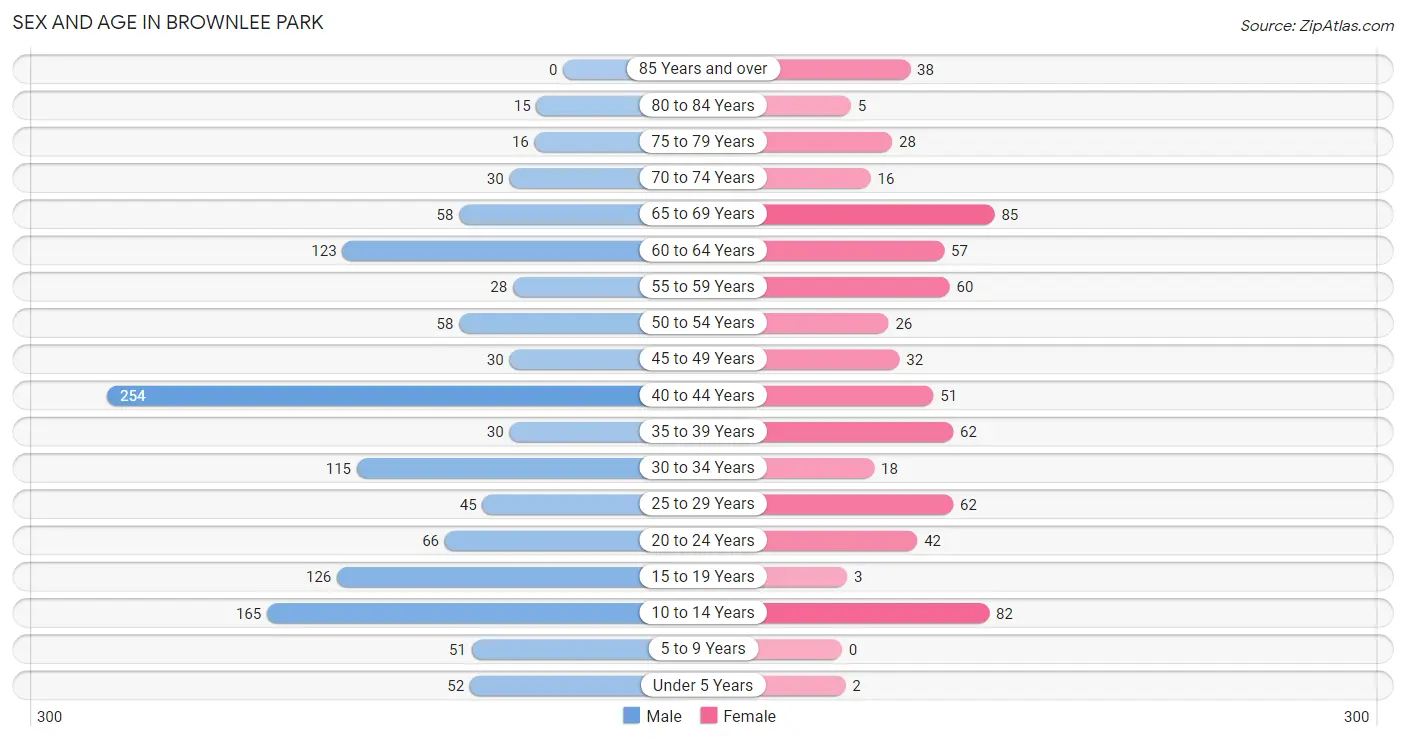
| Age Bracket | Male | Female |
| Under 5 Years | 52 (4.1%) | 2 (0.3%) |
| 5 to 9 Years | 51 (4.0%) | 0 (0.0%) |
| 10 to 14 Years | 165 (13.1%) | 82 (12.3%) |
| 15 to 19 Years | 126 (10.0%) | 3 (0.4%) |
| 20 to 24 Years | 66 (5.2%) | 42 (6.3%) |
| 25 to 29 Years | 45 (3.6%) | 62 (9.3%) |
| 30 to 34 Years | 115 (9.1%) | 18 (2.7%) |
| 35 to 39 Years | 30 (2.4%) | 62 (9.3%) |
| 40 to 44 Years | 254 (20.1%) | 51 (7.6%) |
| 45 to 49 Years | 30 (2.4%) | 32 (4.8%) |
| 50 to 54 Years | 58 (4.6%) | 26 (3.9%) |
| 55 to 59 Years | 28 (2.2%) | 60 (9.0%) |
| 60 to 64 Years | 123 (9.8%) | 57 (8.5%) |
| 65 to 69 Years | 58 (4.6%) | 85 (12.7%) |
| 70 to 74 Years | 30 (2.4%) | 16 (2.4%) |
| 75 to 79 Years | 16 (1.3%) | 28 (4.2%) |
| 80 to 84 Years | 15 (1.2%) | 5 (0.7%) |
| 85 Years and over | 0 (0.0%) | 38 (5.7%) |
| Total | 1,262 (100.0%) | 669 (100.0%) |
Families and Households in Brownlee Park
Median Family Size in Brownlee Park
The median family size in Brownlee Park is 3.30 persons per family, with married-couple families (230 | 49.4%) accounting for the largest median family size of 3.69 persons per family. On the other hand, single male/father families (160 | 34.3%) represent the smallest median family size with 2.88 persons per family.
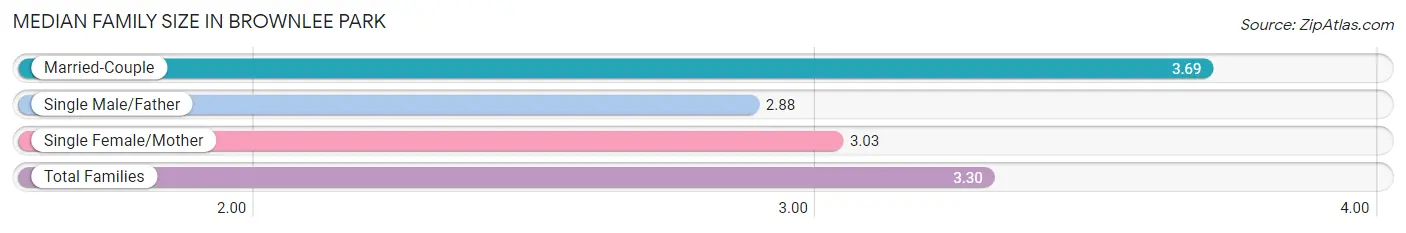
| Family Type | # Families | Family Size |
| Married-Couple | 230 (49.4%) | 3.69 |
| Single Male/Father | 160 (34.3%) | 2.88 |
| Single Female/Mother | 76 (16.3%) | 3.03 |
| Total Families | 466 (100.0%) | 3.30 |
Median Household Size in Brownlee Park
The median household size in Brownlee Park is 2.76 persons per household, with married-couple households (230 | 33.0%) accounting for the largest median household size of 3.69 persons per household. non-family households (231 | 33.1%) represent the smallest median household size with 1.27 persons per household.
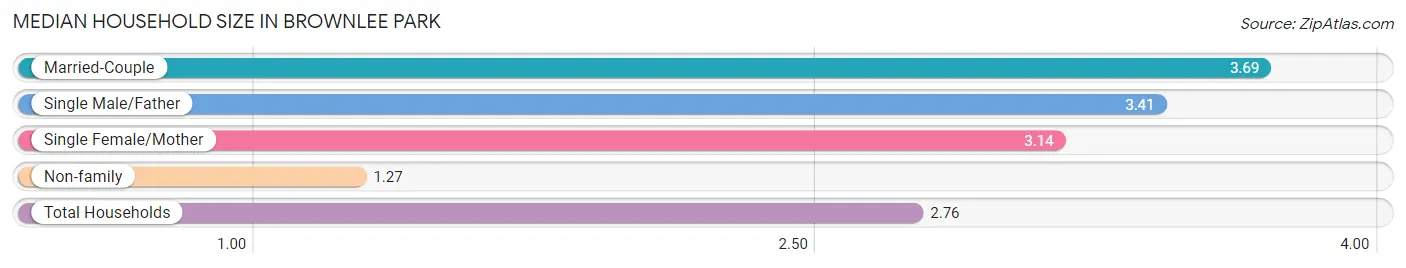
| Household Type | # Households | Household Size |
| Married-Couple | 230 (33.0%) | 3.69 |
| Single Male/Father | 160 (23.0%) | 3.41 |
| Single Female/Mother | 76 (10.9%) | 3.14 |
| Non-family | 231 (33.1%) | 1.27 |
| Total Households | 697 (100.0%) | 2.76 |
Household Size by Marriage Status in Brownlee Park
Out of a total of 697 households in Brownlee Park, 466 (66.9%) are family households, while 231 (33.1%) are nonfamily households. The most numerous type of family households are 3-person households, comprising 191, and the most common type of nonfamily households are 1-person households, comprising 185.
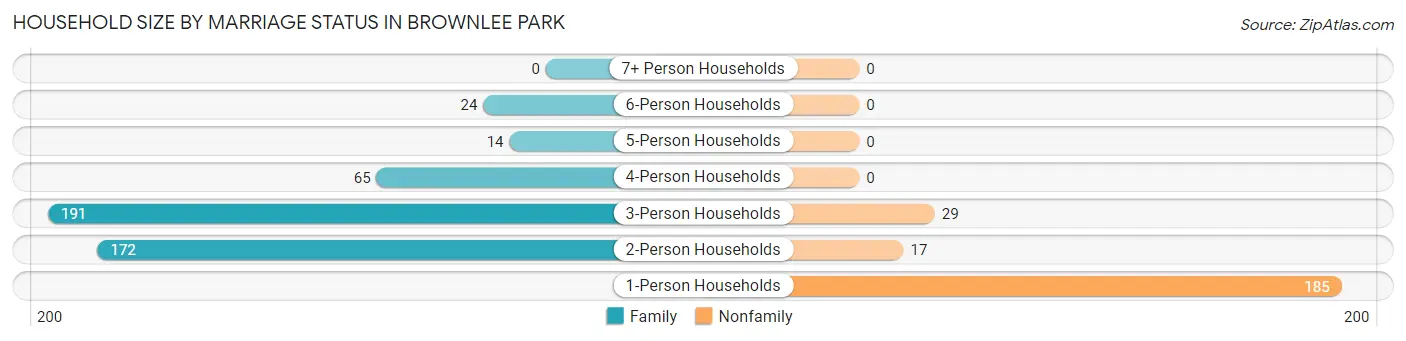
| Household Size | Family Households | Nonfamily Households |
| 1-Person Households | - | 185 (26.5%) |
| 2-Person Households | 172 (24.7%) | 17 (2.4%) |
| 3-Person Households | 191 (27.4%) | 29 (4.2%) |
| 4-Person Households | 65 (9.3%) | 0 (0.0%) |
| 5-Person Households | 14 (2.0%) | 0 (0.0%) |
| 6-Person Households | 24 (3.4%) | 0 (0.0%) |
| 7+ Person Households | 0 (0.0%) | 0 (0.0%) |
| Total | 466 (66.9%) | 231 (33.1%) |
Female Fertility in Brownlee Park
Fertility by Age in Brownlee Park
Average fertility rate in Brownlee Park is 37.0 births per 1,000 women. Women in the age bracket of 20 to 34 years have the highest fertility rate with 82.0 births per 1,000 women. Women in the age bracket of 20 to 34 years acount for 100.0% of all women with births.
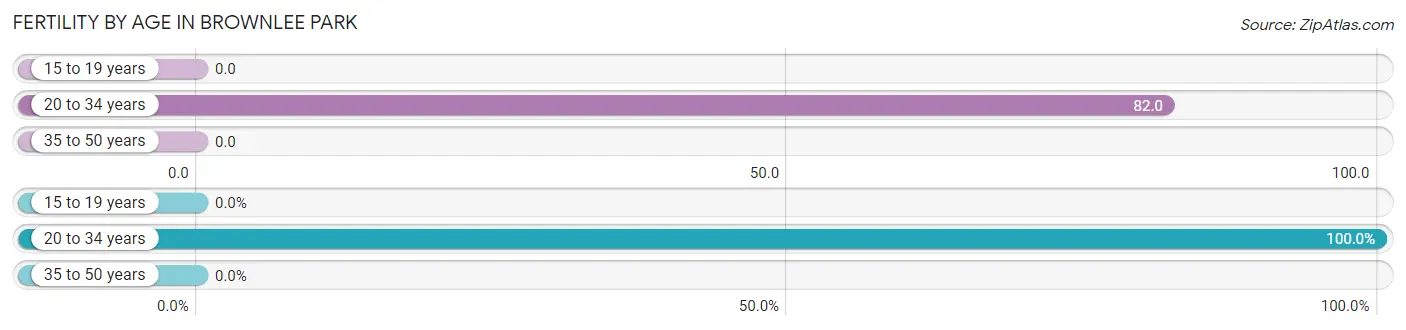
| Age Bracket | Women with Births | Births / 1,000 Women |
| 15 to 19 years | 0 (0.0%) | 0.0 |
| 20 to 34 years | 10 (100.0%) | 82.0 |
| 35 to 50 years | 0 (0.0%) | 0.0 |
| Total | 10 (100.0%) | 37.0 |
Fertility by Age by Marriage Status in Brownlee Park
50.0% of women with births (10) in Brownlee Park are married. The highest percentage of unmarried women with births falls into 20 to 34 years age bracket with 50.0% of them unmarried at the time of birth, while the lowest percentage of unmarried women with births belong to 20 to 34 years age bracket with 50.0% of them unmarried.
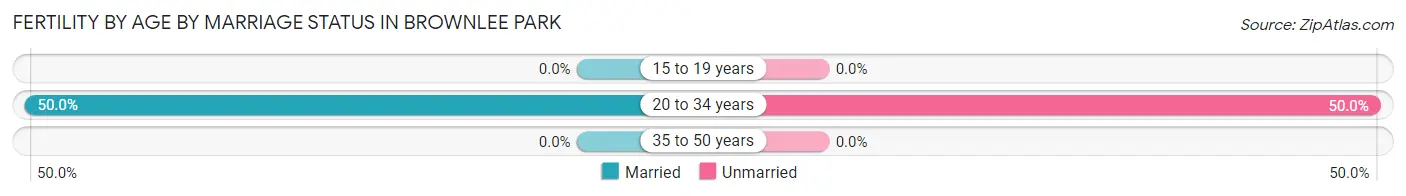
| Age Bracket | Married | Unmarried |
| 15 to 19 years | 0 (0.0%) | 0 (0.0%) |
| 20 to 34 years | 5 (50.0%) | 5 (50.0%) |
| 35 to 50 years | 0 (0.0%) | 0 (0.0%) |
| Total | 5 (50.0%) | 5 (50.0%) |
Fertility by Education in Brownlee Park
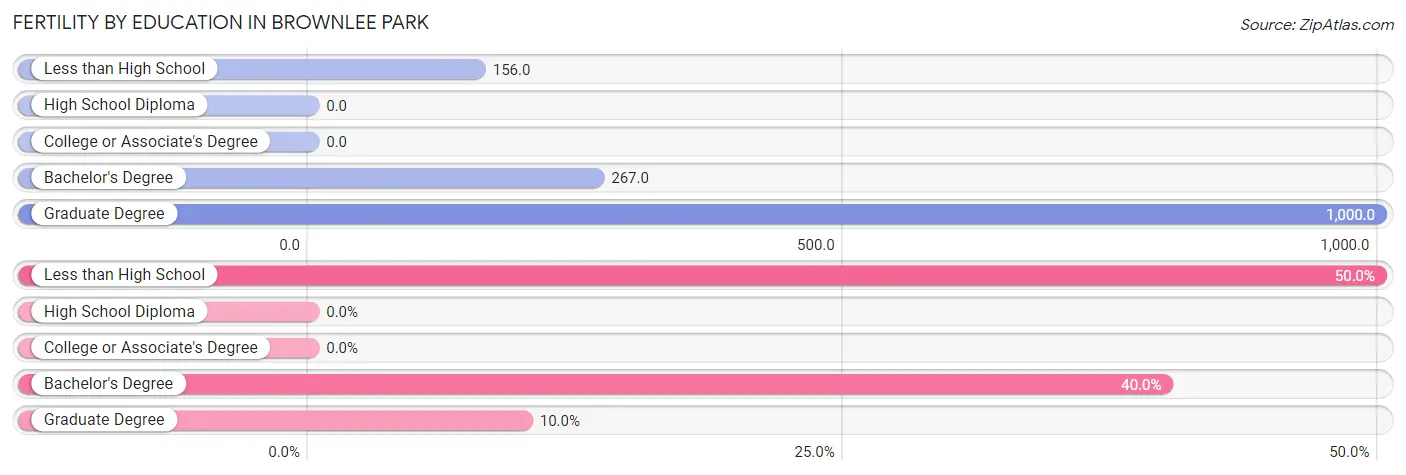
| Educational Attainment | Women with Births | Births / 1,000 Women |
| Less than High School | 5 (50.0%) | 156.0 |
| High School Diploma | 0 (0.0%) | 0.0 |
| College or Associate's Degree | 0 (0.0%) | 0.0 |
| Bachelor's Degree | 4 (40.0%) | 267.0 |
| Graduate Degree | 1 (10.0%) | 1,000.0 |
| Total | 10 (100.0%) | 37.0 |
Fertility by Education by Marriage Status in Brownlee Park
50.0% of women with births in Brownlee Park are unmarried. Women with the educational attainment of bachelor's degree are most likely to be married with 100.0% of them married at childbirth, while women with the educational attainment of less than high school are least likely to be married with 100.0% of them unmarried at childbirth.
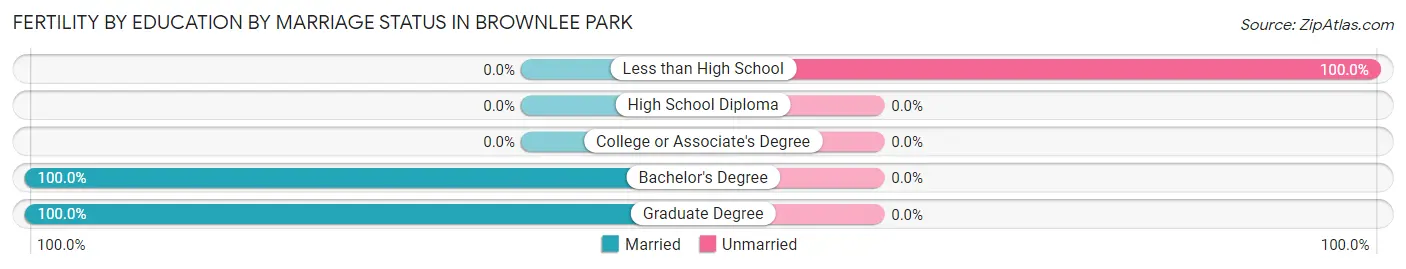
| Educational Attainment | Married | Unmarried |
| Less than High School | 0 (0.0%) | 5 (100.0%) |
| High School Diploma | 0 (0.0%) | 0 (0.0%) |
| College or Associate's Degree | 0 (0.0%) | 0 (0.0%) |
| Bachelor's Degree | 4 (100.0%) | 0 (0.0%) |
| Graduate Degree | 1 (100.0%) | 0 (0.0%) |
| Total | 5 (50.0%) | 5 (50.0%) |
Employment Characteristics in Brownlee Park
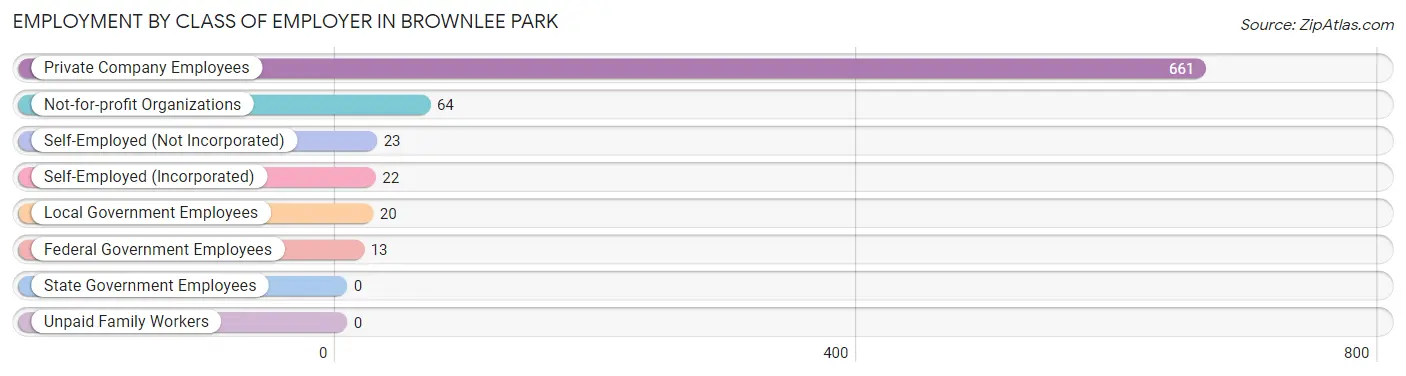
Employment by Class of Employer in Brownlee Park
Among the 803 employed individuals in Brownlee Park, private company employees (661 | 82.3%), not-for-profit organizations (64 | 8.0%), and self-employed (not incorporated) (23 | 2.9%) make up the most common classes of employment.
| Employer Class | # Employees | % Employees |
| Private Company Employees | 661 | 82.3% |
| Self-Employed (Incorporated) | 22 | 2.7% |
| Self-Employed (Not Incorporated) | 23 | 2.9% |
| Not-for-profit Organizations | 64 | 8.0% |
| Local Government Employees | 20 | 2.5% |
| State Government Employees | 0 | 0.0% |
| Federal Government Employees | 13 | 1.6% |
| Unpaid Family Workers | 0 | 0.0% |
| Total | 803 | 100.0% |
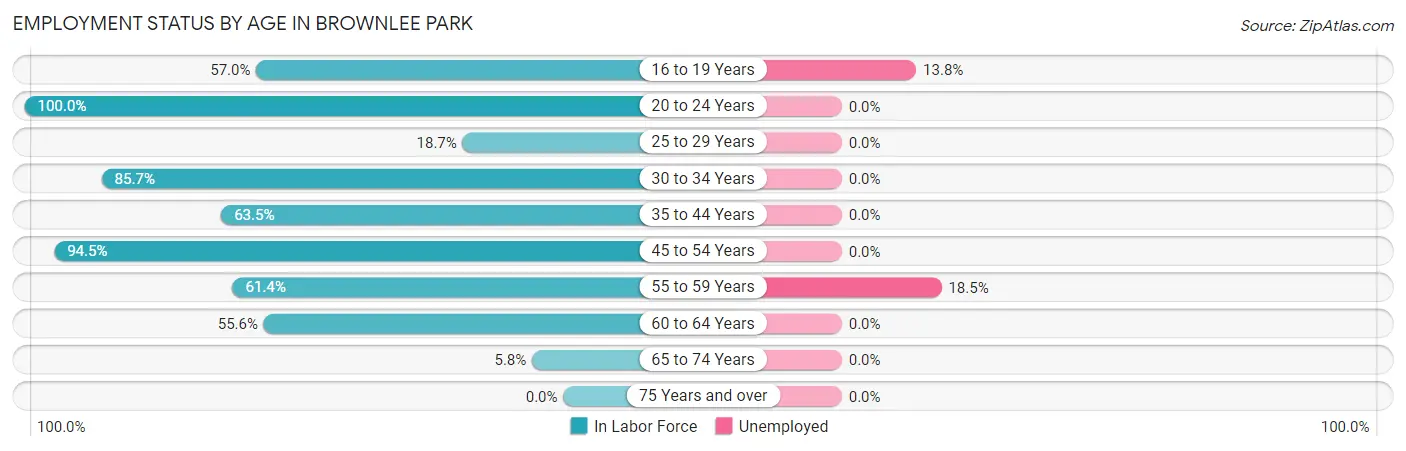
Employment Status by Age in Brownlee Park
According to the labor force statistics for Brownlee Park, out of the total population over 16 years of age (1,564), 55.1% or 862 individuals are in the labor force, with 2.2% or 19 of them unemployed. The age group with the highest labor force participation rate is 20 to 24 years, with 100.0% or 108 individuals in the labor force. Within the labor force, the 55 to 59 years age range has the highest percentage of unemployed individuals, with 18.5% or 10 of them being unemployed.
| Age Bracket | In Labor Force | Unemployed |
| 16 to 19 Years | 65 (57.0%) | 9 (13.8%) |
| 20 to 24 Years | 108 (100.0%) | 0 (0.0%) |
| 25 to 29 Years | 20 (18.7%) | 0 (0.0%) |
| 30 to 34 Years | 114 (85.7%) | 0 (0.0%) |
| 35 to 44 Years | 252 (63.5%) | 0 (0.0%) |
| 45 to 54 Years | 138 (94.5%) | 0 (0.0%) |
| 55 to 59 Years | 54 (61.4%) | 10 (18.5%) |
| 60 to 64 Years | 100 (55.6%) | 0 (0.0%) |
| 65 to 74 Years | 11 (5.8%) | 0 (0.0%) |
| 75 Years and over | 0 (0.0%) | 0 (0.0%) |
| Total | 862 (55.1%) | 19 (2.2%) |
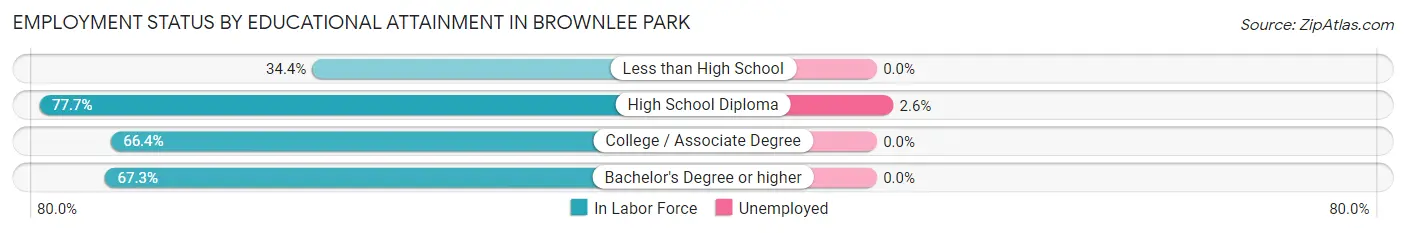
Employment Status by Educational Attainment in Brownlee Park
According to labor force statistics for Brownlee Park, 64.5% of individuals (678) out of the total population between 25 and 64 years of age (1,051) are in the labor force, with 1.5% or 10 of them being unemployed. The group with the highest labor force participation rate are those with the educational attainment of high school diploma, with 77.7% or 390 individuals in the labor force. Within the labor force, individuals with high school diploma education have the highest percentage of unemployment, with 2.6% or 10 of them being unemployed.
| Educational Attainment | In Labor Force | Unemployed |
| Less than High School | 83 (34.4%) | 0 (0.0%) |
| High School Diploma | 390 (77.7%) | 13 (2.6%) |
| College / Associate Degree | 168 (66.4%) | 0 (0.0%) |
| Bachelor's Degree or higher | 37 (67.3%) | 0 (0.0%) |
| Total | 678 (64.5%) | 16 (1.5%) |
Employment Occupations by Sex in Brownlee Park
Management, Business, Science and Arts Occupations
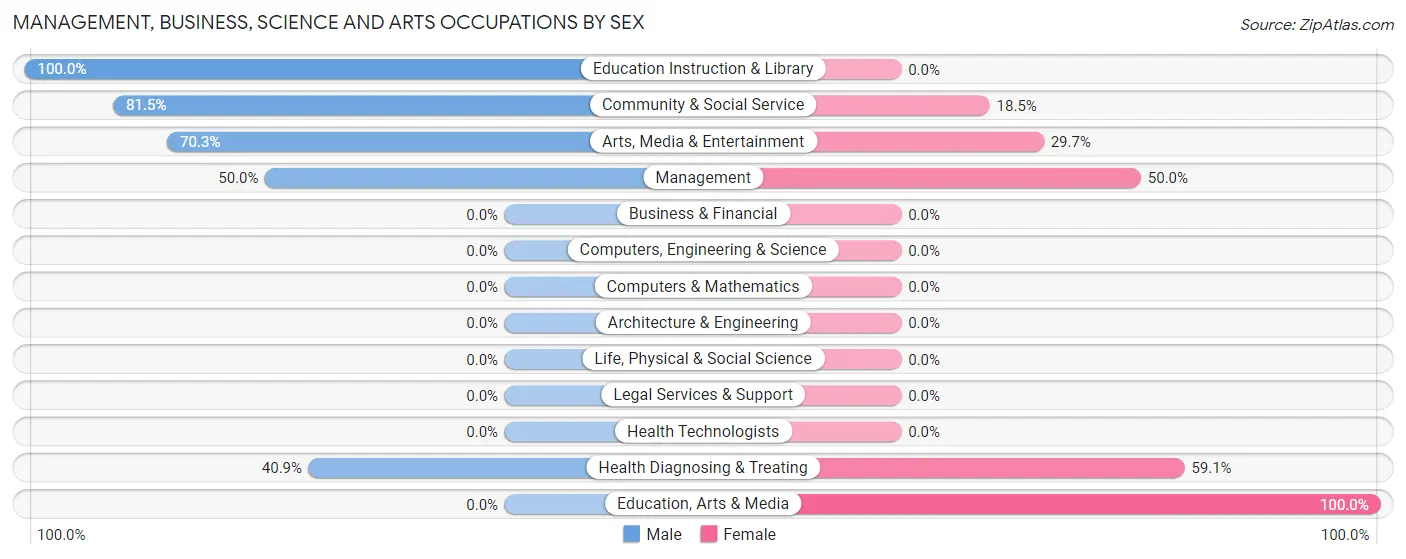
The most common Management, Business, Science and Arts occupations in Brownlee Park are Community & Social Service (65 | 7.7%), Arts, Media & Entertainment (37 | 4.4%), Education Instruction & Library (27 | 3.2%), Health Diagnosing & Treating (22 | 2.6%), and Management (18 | 2.1%).
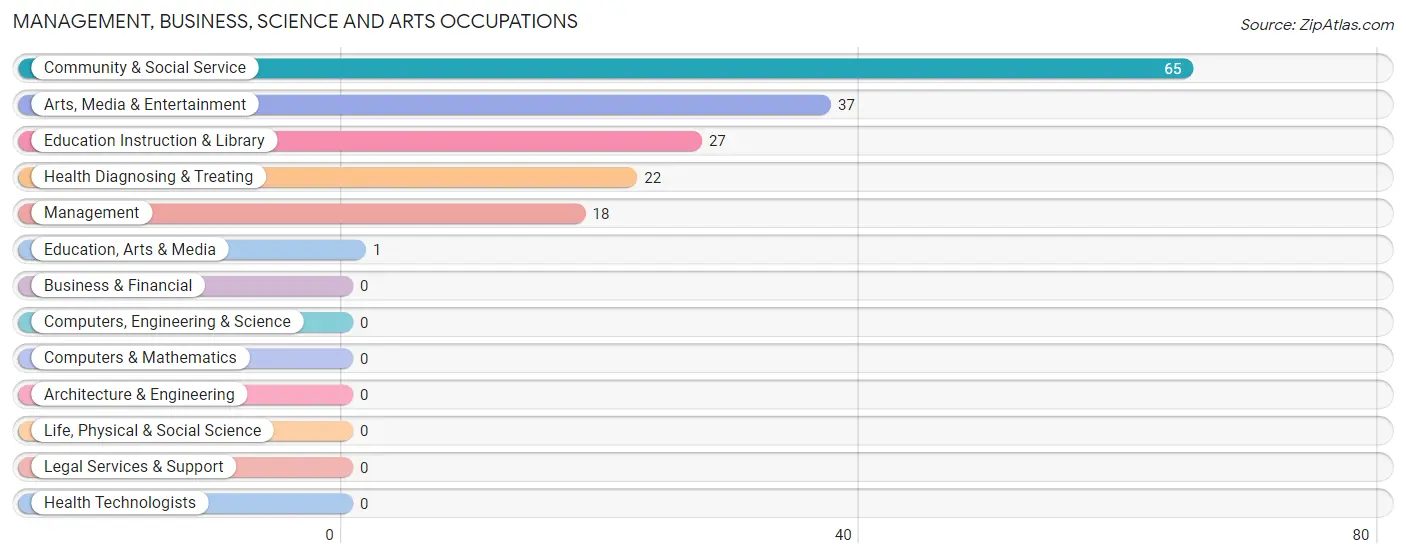
Management, Business, Science and Arts Occupations by Sex
Within the Management, Business, Science and Arts occupations in Brownlee Park, the most male-oriented occupations are Education Instruction & Library (100.0%), Community & Social Service (81.5%), and Arts, Media & Entertainment (70.3%), while the most female-oriented occupations are Education, Arts & Media (100.0%), Health Diagnosing & Treating (59.1%), and Management (50.0%).
| Occupation | Male | Female |
| Management | 9 (50.0%) | 9 (50.0%) |
| Business & Financial | 0 (0.0%) | 0 (0.0%) |
| Computers, Engineering & Science | 0 (0.0%) | 0 (0.0%) |
| Computers & Mathematics | 0 (0.0%) | 0 (0.0%) |
| Architecture & Engineering | 0 (0.0%) | 0 (0.0%) |
| Life, Physical & Social Science | 0 (0.0%) | 0 (0.0%) |
| Community & Social Service | 53 (81.5%) | 12 (18.5%) |
| Education, Arts & Media | 0 (0.0%) | 1 (100.0%) |
| Legal Services & Support | 0 (0.0%) | 0 (0.0%) |
| Education Instruction & Library | 27 (100.0%) | 0 (0.0%) |
| Arts, Media & Entertainment | 26 (70.3%) | 11 (29.7%) |
| Health Diagnosing & Treating | 9 (40.9%) | 13 (59.1%) |
| Health Technologists | 0 (0.0%) | 0 (0.0%) |
| Total (Category) | 71 (67.6%) | 34 (32.4%) |
| Total (Overall) | 518 (61.5%) | 325 (38.6%) |
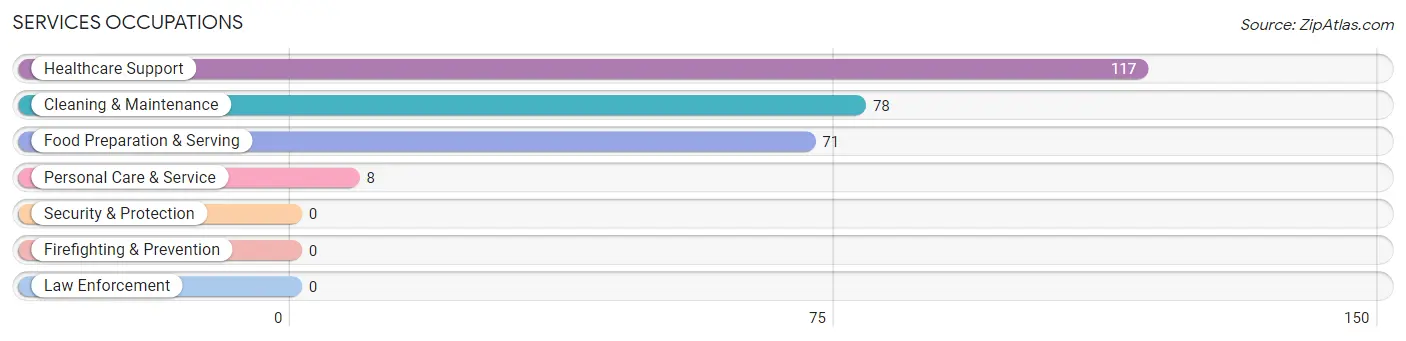
Services Occupations
The most common Services occupations in Brownlee Park are Healthcare Support (117 | 13.9%), Cleaning & Maintenance (78 | 9.2%), Food Preparation & Serving (71 | 8.4%), and Personal Care & Service (8 | 0.9%).
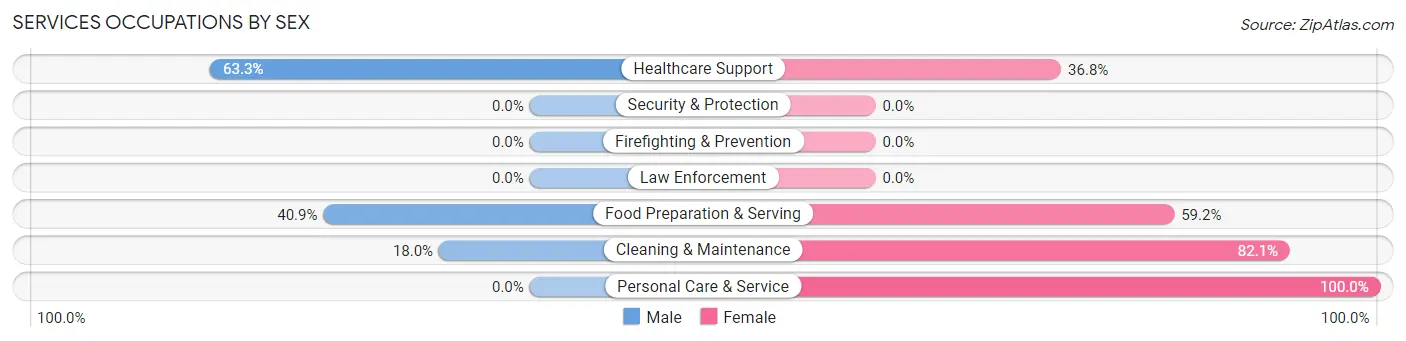
Services Occupations by Sex
Within the Services occupations in Brownlee Park, the most male-oriented occupations are Healthcare Support (63.2%), Food Preparation & Serving (40.8%), and Cleaning & Maintenance (17.9%), while the most female-oriented occupations are Personal Care & Service (100.0%), Cleaning & Maintenance (82.1%), and Food Preparation & Serving (59.2%).
| Occupation | Male | Female |
| Healthcare Support | 74 (63.2%) | 43 (36.7%) |
| Security & Protection | 0 (0.0%) | 0 (0.0%) |
| Firefighting & Prevention | 0 (0.0%) | 0 (0.0%) |
| Law Enforcement | 0 (0.0%) | 0 (0.0%) |
| Food Preparation & Serving | 29 (40.8%) | 42 (59.2%) |
| Cleaning & Maintenance | 14 (17.9%) | 64 (82.1%) |
| Personal Care & Service | 0 (0.0%) | 8 (100.0%) |
| Total (Category) | 117 (42.7%) | 157 (57.3%) |
| Total (Overall) | 518 (61.5%) | 325 (38.6%) |
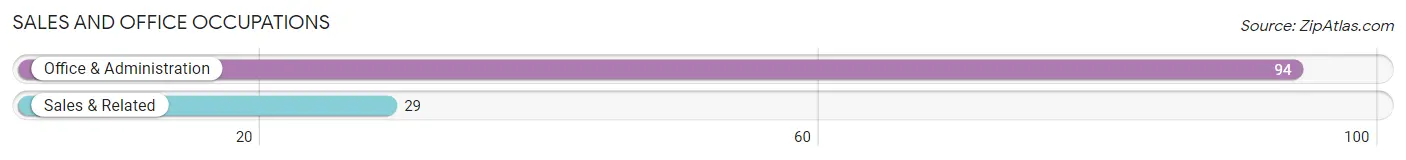
Sales and Office Occupations
The most common Sales and Office occupations in Brownlee Park are Office & Administration (94 | 11.2%), and Sales & Related (29 | 3.4%).
Sales and Office Occupations by Sex
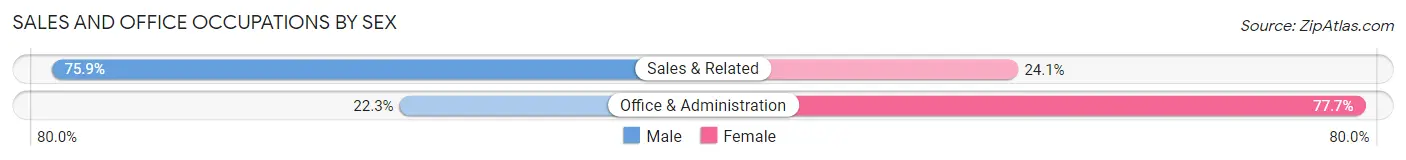
| Occupation | Male | Female |
| Sales & Related | 22 (75.9%) | 7 (24.1%) |
| Office & Administration | 21 (22.3%) | 73 (77.7%) |
| Total (Category) | 43 (35.0%) | 80 (65.0%) |
| Total (Overall) | 518 (61.5%) | 325 (38.6%) |
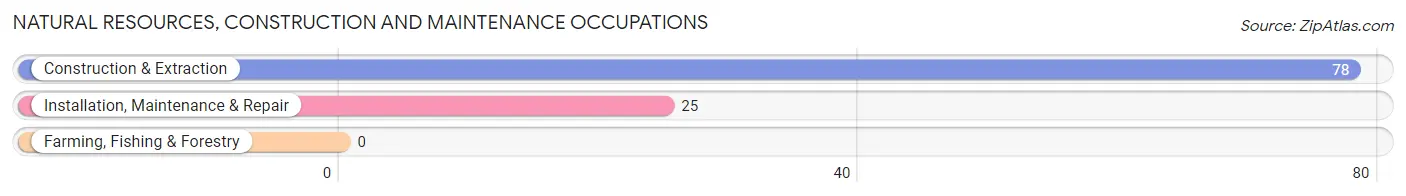
Natural Resources, Construction and Maintenance Occupations
The most common Natural Resources, Construction and Maintenance occupations in Brownlee Park are Construction & Extraction (78 | 9.2%), and Installation, Maintenance & Repair (25 | 3.0%).
Natural Resources, Construction and Maintenance Occupations by Sex
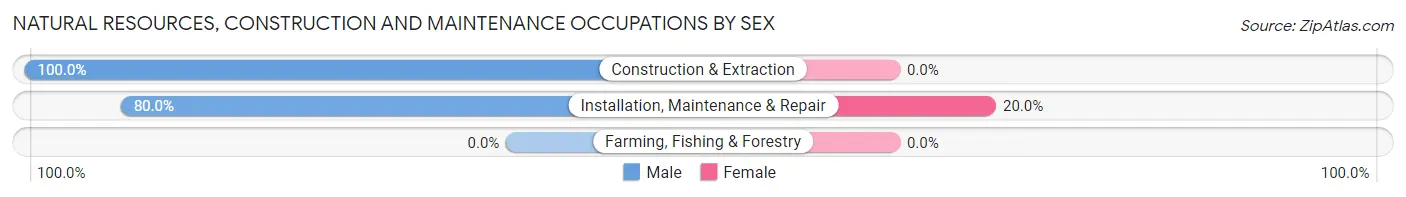
| Occupation | Male | Female |
| Farming, Fishing & Forestry | 0 (0.0%) | 0 (0.0%) |
| Construction & Extraction | 78 (100.0%) | 0 (0.0%) |
| Installation, Maintenance & Repair | 20 (80.0%) | 5 (20.0%) |
| Total (Category) | 98 (95.2%) | 5 (4.9%) |
| Total (Overall) | 518 (61.5%) | 325 (38.6%) |
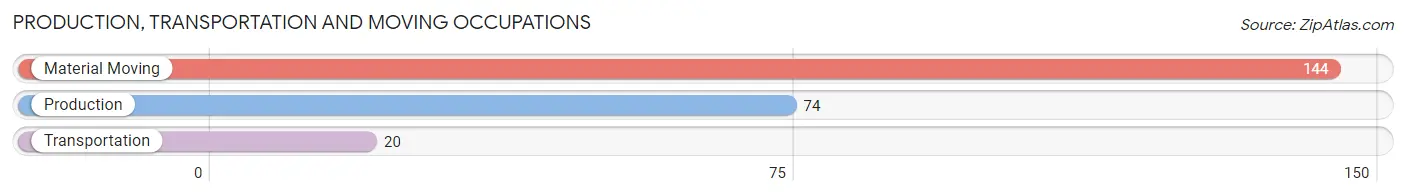
Production, Transportation and Moving Occupations
The most common Production, Transportation and Moving occupations in Brownlee Park are Material Moving (144 | 17.1%), Production (74 | 8.8%), and Transportation (20 | 2.4%).
Production, Transportation and Moving Occupations by Sex
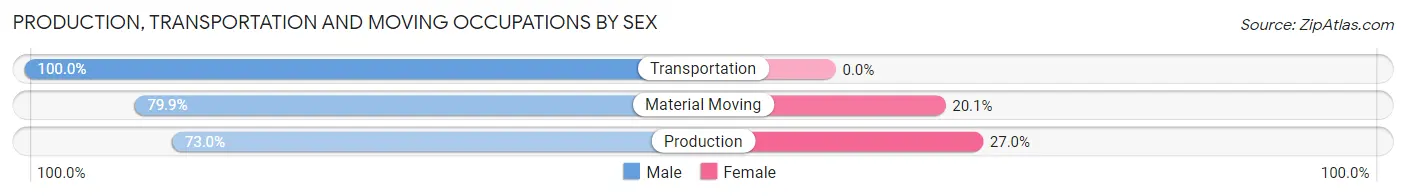
| Occupation | Male | Female |
| Production | 54 (73.0%) | 20 (27.0%) |
| Transportation | 20 (100.0%) | 0 (0.0%) |
| Material Moving | 115 (79.9%) | 29 (20.1%) |
| Total (Category) | 189 (79.4%) | 49 (20.6%) |
| Total (Overall) | 518 (61.5%) | 325 (38.6%) |
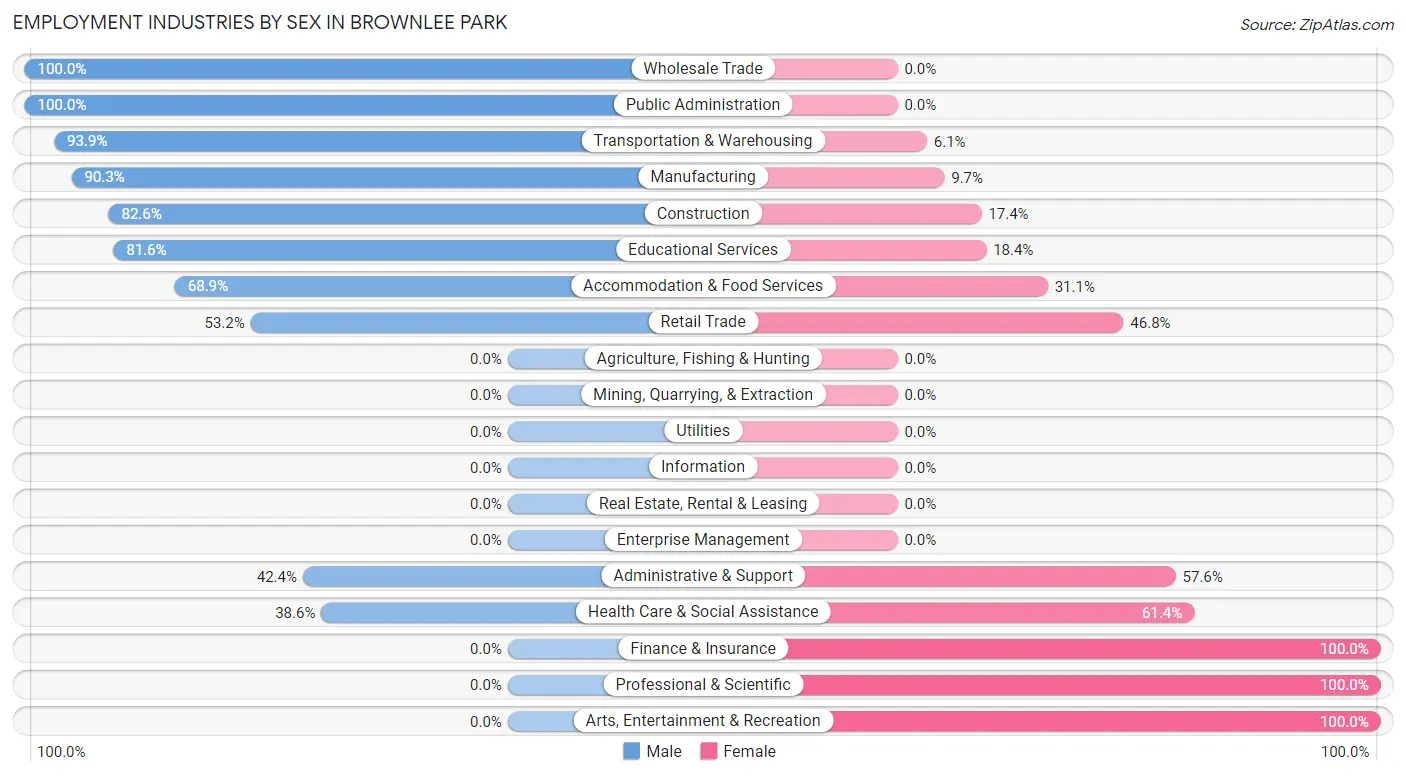
Employment Industries by Sex in Brownlee Park
Employment Industries in Brownlee Park
The major employment industries in Brownlee Park include Health Care & Social Assistance (215 | 25.5%), Manufacturing (165 | 19.6%), Transportation & Warehousing (82 | 9.7%), Construction (69 | 8.2%), and Retail Trade (62 | 7.3%).

Employment Industries by Sex in Brownlee Park
The Brownlee Park industries that see more men than women are Wholesale Trade (100.0%), Public Administration (100.0%), and Transportation & Warehousing (93.9%), whereas the industries that tend to have a higher number of women are Finance & Insurance (100.0%), Professional & Scientific (100.0%), and Arts, Entertainment & Recreation (100.0%).
| Industry | Male | Female |
| Agriculture, Fishing & Hunting | 0 (0.0%) | 0 (0.0%) |
| Mining, Quarrying, & Extraction | 0 (0.0%) | 0 (0.0%) |
| Construction | 57 (82.6%) | 12 (17.4%) |
| Manufacturing | 149 (90.3%) | 16 (9.7%) |
| Wholesale Trade | 8 (100.0%) | 0 (0.0%) |
| Retail Trade | 33 (53.2%) | 29 (46.8%) |
| Transportation & Warehousing | 77 (93.9%) | 5 (6.1%) |
| Utilities | 0 (0.0%) | 0 (0.0%) |
| Information | 0 (0.0%) | 0 (0.0%) |
| Finance & Insurance | 0 (0.0%) | 13 (100.0%) |
| Real Estate, Rental & Leasing | 0 (0.0%) | 0 (0.0%) |
| Professional & Scientific | 0 (0.0%) | 7 (100.0%) |
| Enterprise Management | 0 (0.0%) | 0 (0.0%) |
| Administrative & Support | 14 (42.4%) | 19 (57.6%) |
| Educational Services | 40 (81.6%) | 9 (18.4%) |
| Health Care & Social Assistance | 83 (38.6%) | 132 (61.4%) |
| Arts, Entertainment & Recreation | 0 (0.0%) | 30 (100.0%) |
| Accommodation & Food Services | 31 (68.9%) | 14 (31.1%) |
| Public Administration | 13 (100.0%) | 0 (0.0%) |
| Total | 518 (61.5%) | 325 (38.6%) |
Education in Brownlee Park
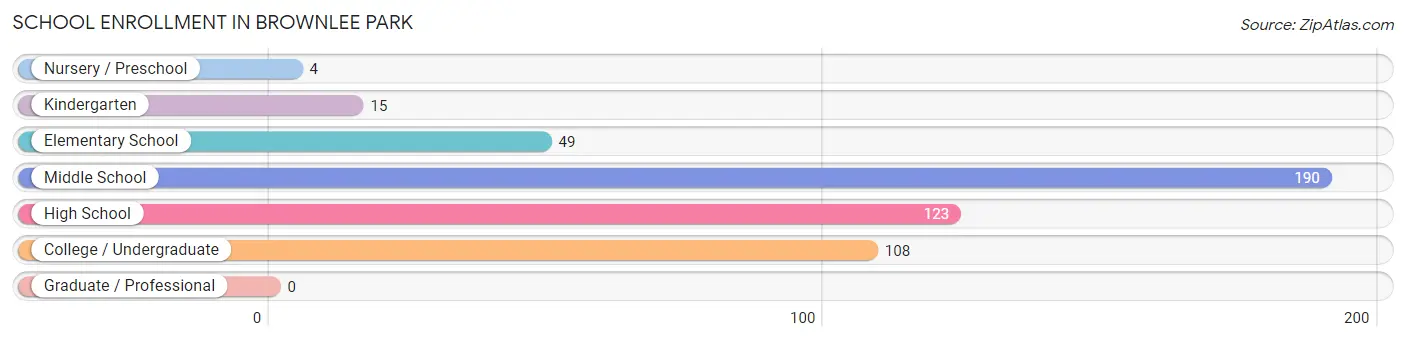
School Enrollment in Brownlee Park
The most common levels of schooling among the 489 students in Brownlee Park are middle school (190 | 38.9%), high school (123 | 25.2%), and college / undergraduate (108 | 22.1%).
| School Level | # Students | % Students |
| Nursery / Preschool | 4 | 0.8% |
| Kindergarten | 15 | 3.1% |
| Elementary School | 49 | 10.0% |
| Middle School | 190 | 38.9% |
| High School | 123 | 25.2% |
| College / Undergraduate | 108 | 22.1% |
| Graduate / Professional | 0 | 0.0% |
| Total | 489 | 100.0% |
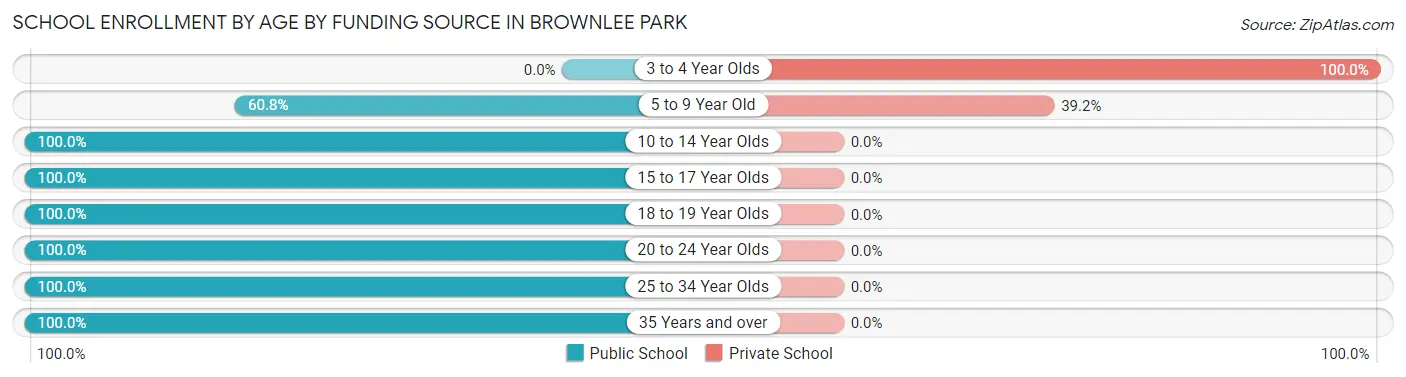
School Enrollment by Age by Funding Source in Brownlee Park
Out of a total of 489 students who are enrolled in schools in Brownlee Park, 24 (4.9%) attend a private institution, while the remaining 465 (95.1%) are enrolled in public schools. The age group of 3 to 4 year olds has the highest likelihood of being enrolled in private schools, with 4 (100.0% in the age bracket) enrolled. Conversely, the age group of 10 to 14 year olds has the lowest likelihood of being enrolled in a private school, with 247 (100.0% in the age bracket) attending a public institution.
| Age Bracket | Public School | Private School |
| 3 to 4 Year Olds | 0 (0.0%) | 4 (100.0%) |
| 5 to 9 Year Old | 31 (60.8%) | 20 (39.2%) |
| 10 to 14 Year Olds | 247 (100.0%) | 0 (0.0%) |
| 15 to 17 Year Olds | 44 (100.0%) | 0 (0.0%) |
| 18 to 19 Year Olds | 54 (100.0%) | 0 (0.0%) |
| 20 to 24 Year Olds | 34 (100.0%) | 0 (0.0%) |
| 25 to 34 Year Olds | 36 (100.0%) | 0 (0.0%) |
| 35 Years and over | 19 (100.0%) | 0 (0.0%) |
| Total | 465 (95.1%) | 24 (4.9%) |
Educational Attainment by Field of Study in Brownlee Park
Science & technology (16 | 24.6%), engineering (11 | 16.9%), education (10 | 15.4%), liberal arts & history (10 | 15.4%), and arts & humanities (10 | 15.4%) are the most common fields of study among 65 individuals in Brownlee Park who have obtained a bachelor's degree or higher.
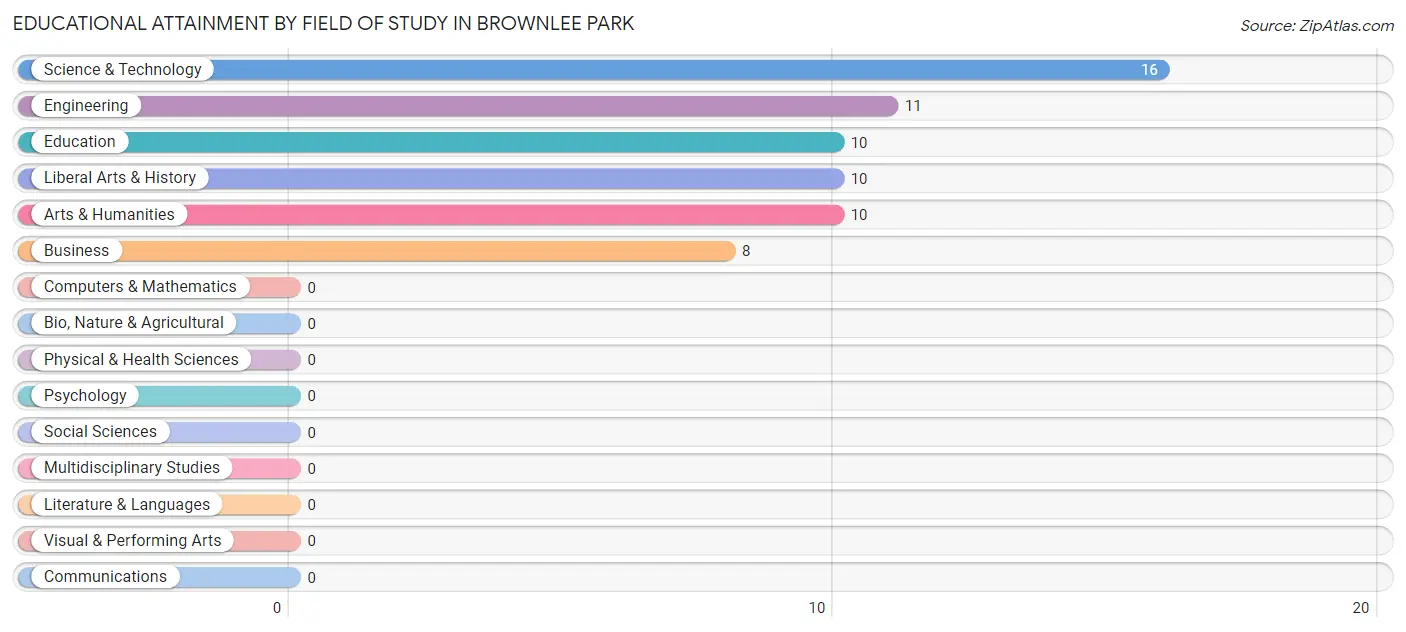
| Field of Study | # Graduates | % Graduates |
| Computers & Mathematics | 0 | 0.0% |
| Bio, Nature & Agricultural | 0 | 0.0% |
| Physical & Health Sciences | 0 | 0.0% |
| Psychology | 0 | 0.0% |
| Social Sciences | 0 | 0.0% |
| Engineering | 11 | 16.9% |
| Multidisciplinary Studies | 0 | 0.0% |
| Science & Technology | 16 | 24.6% |
| Business | 8 | 12.3% |
| Education | 10 | 15.4% |
| Literature & Languages | 0 | 0.0% |
| Liberal Arts & History | 10 | 15.4% |
| Visual & Performing Arts | 0 | 0.0% |
| Communications | 0 | 0.0% |
| Arts & Humanities | 10 | 15.4% |
| Total | 65 | 100.0% |
Transportation & Commute in Brownlee Park
Vehicle Availability by Sex in Brownlee Park
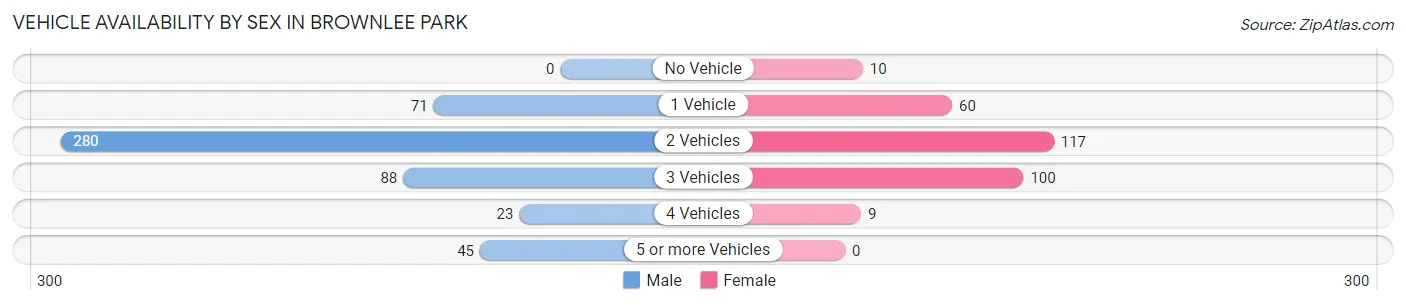
The most prevalent vehicle ownership categories in Brownlee Park are males with 2 vehicles (280, accounting for 55.2%) and females with 2 vehicles (117, making up 94.6%).
| Vehicles Available | Male | Female |
| No Vehicle | 0 (0.0%) | 10 (3.4%) |
| 1 Vehicle | 71 (14.0%) | 60 (20.3%) |
| 2 Vehicles | 280 (55.2%) | 117 (39.5%) |
| 3 Vehicles | 88 (17.4%) | 100 (33.8%) |
| 4 Vehicles | 23 (4.5%) | 9 (3.0%) |
| 5 or more Vehicles | 45 (8.9%) | 0 (0.0%) |
| Total | 507 (100.0%) | 296 (100.0%) |
Commute Time in Brownlee Park
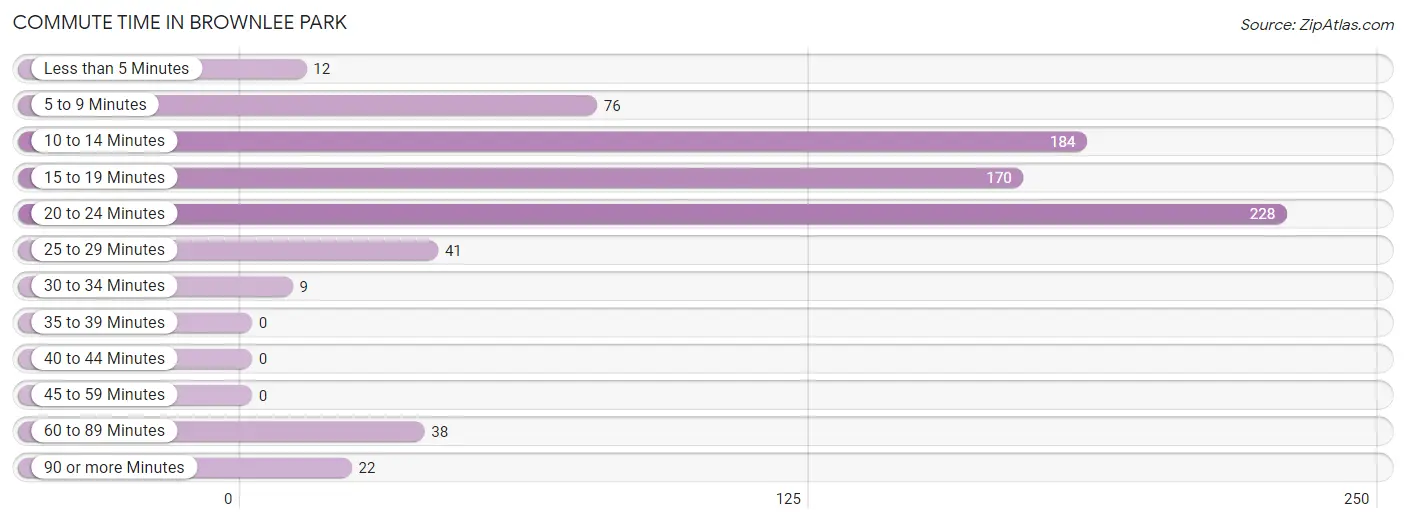
The most frequently occuring commute durations in Brownlee Park are 20 to 24 minutes (228 commuters, 29.2%), 10 to 14 minutes (184 commuters, 23.6%), and 15 to 19 minutes (170 commuters, 21.8%).
| Commute Time | # Commuters | % Commuters |
| Less than 5 Minutes | 12 | 1.5% |
| 5 to 9 Minutes | 76 | 9.7% |
| 10 to 14 Minutes | 184 | 23.6% |
| 15 to 19 Minutes | 170 | 21.8% |
| 20 to 24 Minutes | 228 | 29.2% |
| 25 to 29 Minutes | 41 | 5.3% |
| 30 to 34 Minutes | 9 | 1.1% |
| 35 to 39 Minutes | 0 | 0.0% |
| 40 to 44 Minutes | 0 | 0.0% |
| 45 to 59 Minutes | 0 | 0.0% |
| 60 to 89 Minutes | 38 | 4.9% |
| 90 or more Minutes | 22 | 2.8% |
Commute Time by Sex in Brownlee Park
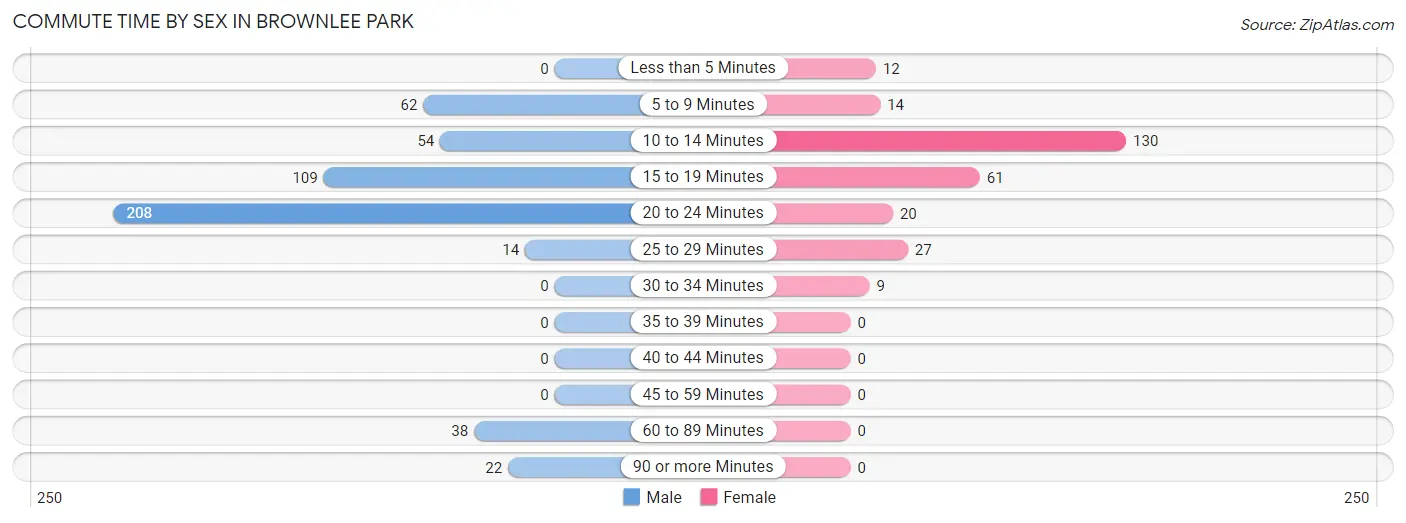
The most common commute times in Brownlee Park are 20 to 24 minutes (208 commuters, 41.0%) for males and 10 to 14 minutes (130 commuters, 47.6%) for females.
| Commute Time | Male | Female |
| Less than 5 Minutes | 0 (0.0%) | 12 (4.4%) |
| 5 to 9 Minutes | 62 (12.2%) | 14 (5.1%) |
| 10 to 14 Minutes | 54 (10.6%) | 130 (47.6%) |
| 15 to 19 Minutes | 109 (21.5%) | 61 (22.3%) |
| 20 to 24 Minutes | 208 (41.0%) | 20 (7.3%) |
| 25 to 29 Minutes | 14 (2.8%) | 27 (9.9%) |
| 30 to 34 Minutes | 0 (0.0%) | 9 (3.3%) |
| 35 to 39 Minutes | 0 (0.0%) | 0 (0.0%) |
| 40 to 44 Minutes | 0 (0.0%) | 0 (0.0%) |
| 45 to 59 Minutes | 0 (0.0%) | 0 (0.0%) |
| 60 to 89 Minutes | 38 (7.5%) | 0 (0.0%) |
| 90 or more Minutes | 22 (4.3%) | 0 (0.0%) |
Time of Departure to Work by Sex in Brownlee Park
The most frequent times of departure to work in Brownlee Park are 4:00 PM to 11:59 PM (163, 32.2%) for males and 6:00 AM to 6:29 AM (61, 22.3%) for females.
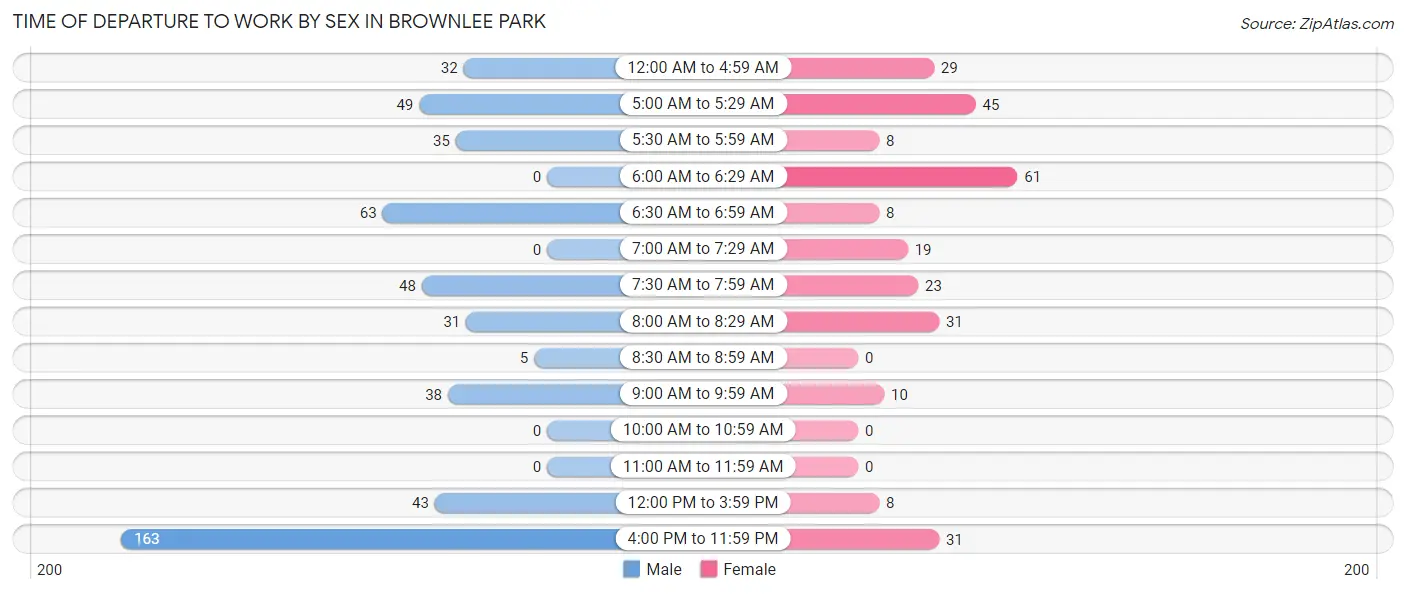
| Time of Departure | Male | Female |
| 12:00 AM to 4:59 AM | 32 (6.3%) | 29 (10.6%) |
| 5:00 AM to 5:29 AM | 49 (9.7%) | 45 (16.5%) |
| 5:30 AM to 5:59 AM | 35 (6.9%) | 8 (2.9%) |
| 6:00 AM to 6:29 AM | 0 (0.0%) | 61 (22.3%) |
| 6:30 AM to 6:59 AM | 63 (12.4%) | 8 (2.9%) |
| 7:00 AM to 7:29 AM | 0 (0.0%) | 19 (7.0%) |
| 7:30 AM to 7:59 AM | 48 (9.5%) | 23 (8.4%) |
| 8:00 AM to 8:29 AM | 31 (6.1%) | 31 (11.4%) |
| 8:30 AM to 8:59 AM | 5 (1.0%) | 0 (0.0%) |
| 9:00 AM to 9:59 AM | 38 (7.5%) | 10 (3.7%) |
| 10:00 AM to 10:59 AM | 0 (0.0%) | 0 (0.0%) |
| 11:00 AM to 11:59 AM | 0 (0.0%) | 0 (0.0%) |
| 12:00 PM to 3:59 PM | 43 (8.5%) | 8 (2.9%) |
| 4:00 PM to 11:59 PM | 163 (32.2%) | 31 (11.4%) |
| Total | 507 (100.0%) | 273 (100.0%) |
Housing Occupancy in Brownlee Park
Occupancy by Ownership in Brownlee Park
Of the total 697 dwellings in Brownlee Park, owner-occupied units account for 508 (72.9%), while renter-occupied units make up 189 (27.1%).
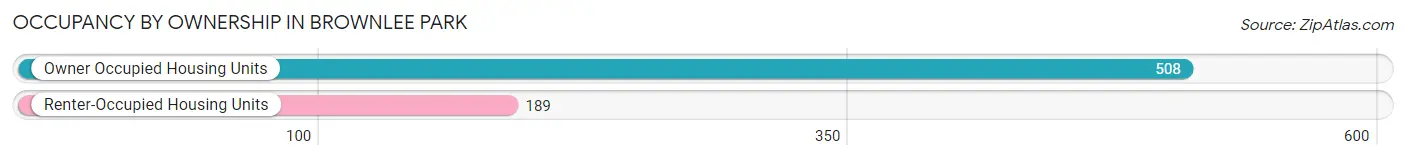
| Occupancy | # Housing Units | % Housing Units |
| Owner Occupied Housing Units | 508 | 72.9% |
| Renter-Occupied Housing Units | 189 | 27.1% |
| Total Occupied Housing Units | 697 | 100.0% |
Occupancy by Household Size in Brownlee Park
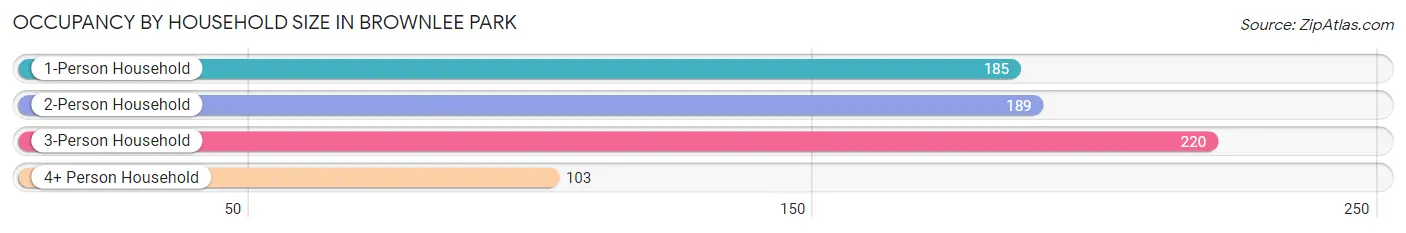
| Household Size | # Housing Units | % Housing Units |
| 1-Person Household | 185 | 26.5% |
| 2-Person Household | 189 | 27.1% |
| 3-Person Household | 220 | 31.6% |
| 4+ Person Household | 103 | 14.8% |
| Total Housing Units | 697 | 100.0% |
Occupancy by Ownership by Household Size in Brownlee Park
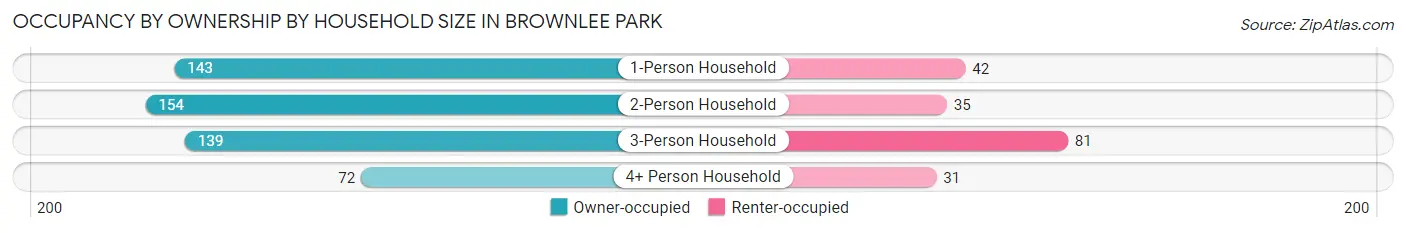
| Household Size | Owner-occupied | Renter-occupied |
| 1-Person Household | 143 (77.3%) | 42 (22.7%) |
| 2-Person Household | 154 (81.5%) | 35 (18.5%) |
| 3-Person Household | 139 (63.2%) | 81 (36.8%) |
| 4+ Person Household | 72 (69.9%) | 31 (30.1%) |
| Total Housing Units | 508 (72.9%) | 189 (27.1%) |
Occupancy by Educational Attainment in Brownlee Park
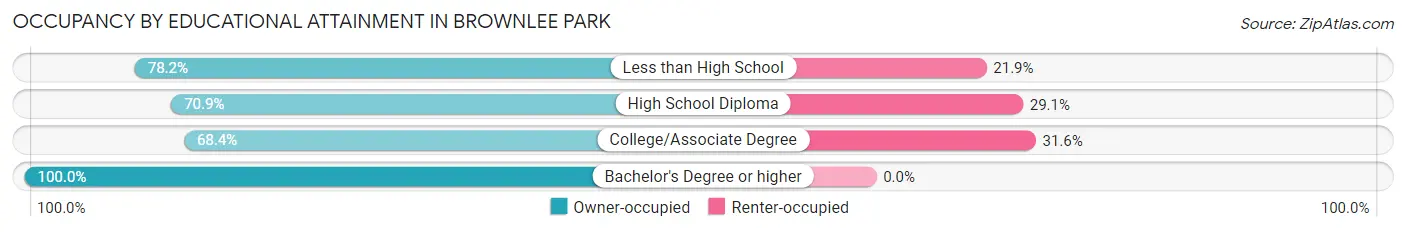
| Household Size | Owner-occupied | Renter-occupied |
| Less than High School | 93 (78.1%) | 26 (21.8%) |
| High School Diploma | 205 (70.9%) | 84 (29.1%) |
| College/Associate Degree | 171 (68.4%) | 79 (31.6%) |
| Bachelor's Degree or higher | 39 (100.0%) | 0 (0.0%) |
Occupancy by Age of Householder in Brownlee Park
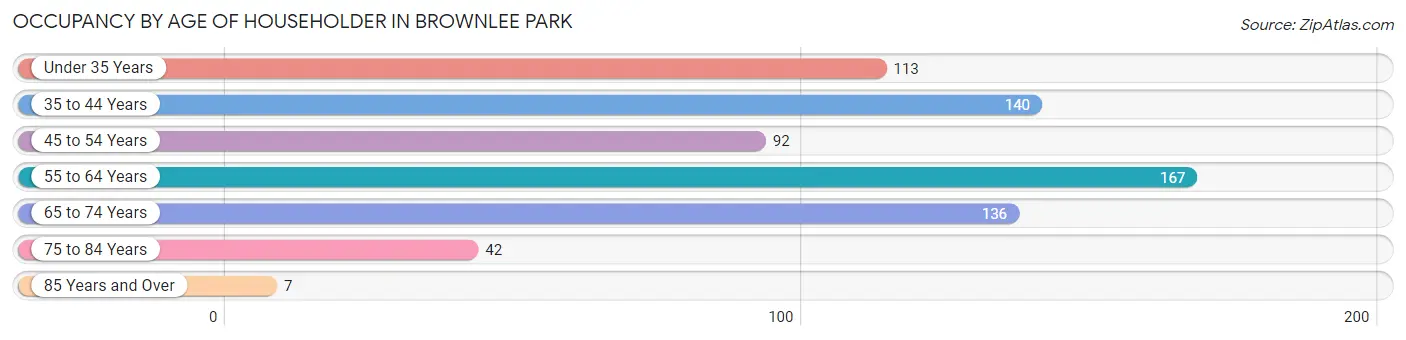
| Age Bracket | # Households | % Households |
| Under 35 Years | 113 | 16.2% |
| 35 to 44 Years | 140 | 20.1% |
| 45 to 54 Years | 92 | 13.2% |
| 55 to 64 Years | 167 | 24.0% |
| 65 to 74 Years | 136 | 19.5% |
| 75 to 84 Years | 42 | 6.0% |
| 85 Years and Over | 7 | 1.0% |
| Total | 697 | 100.0% |
Housing Finances in Brownlee Park
Median Income by Occupancy in Brownlee Park
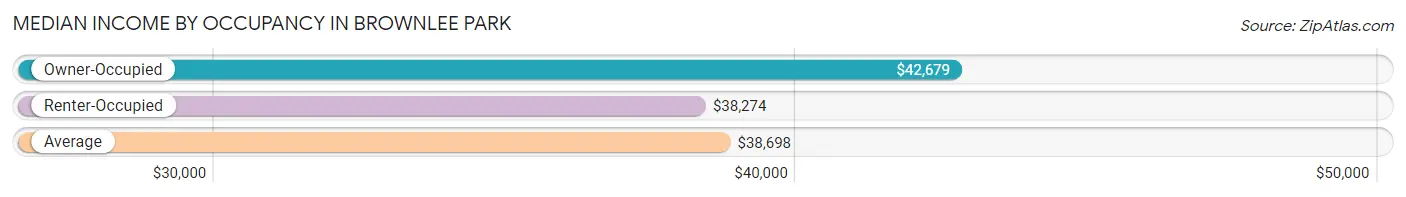
| Occupancy Type | # Households | Median Income |
| Owner-Occupied | 508 (72.9%) | $42,679 |
| Renter-Occupied | 189 (27.1%) | $38,274 |
| Average | 697 (100.0%) | $38,698 |
Occupancy by Householder Income Bracket in Brownlee Park
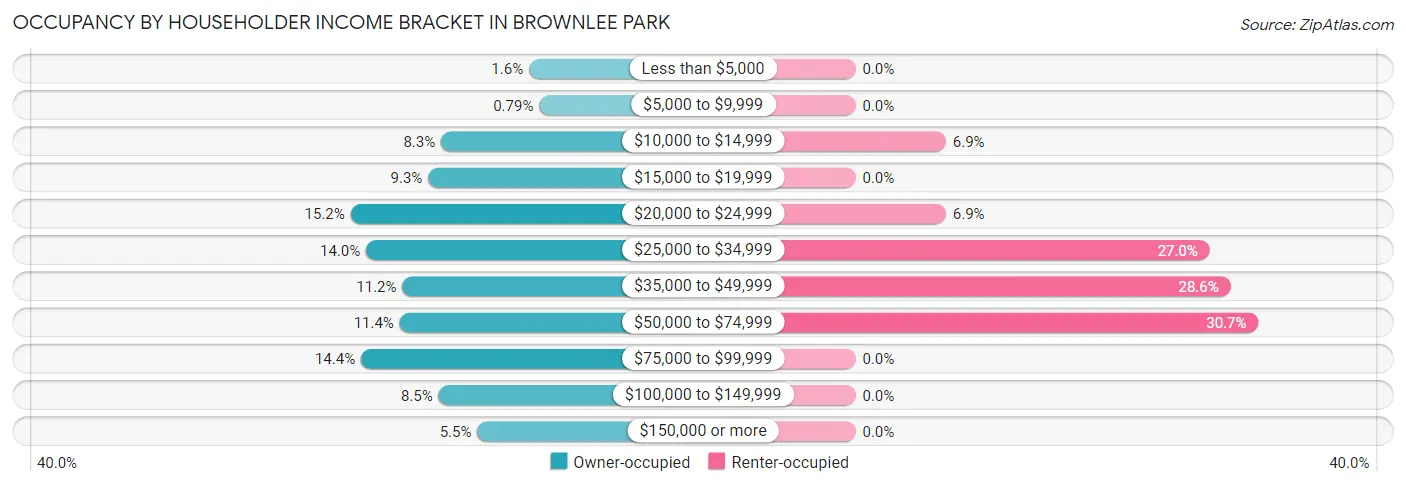
| Income Bracket | Owner-occupied | Renter-occupied |
| Less than $5,000 | 8 (1.6%) | 0 (0.0%) |
| $5,000 to $9,999 | 4 (0.8%) | 0 (0.0%) |
| $10,000 to $14,999 | 42 (8.3%) | 13 (6.9%) |
| $15,000 to $19,999 | 47 (9.2%) | 0 (0.0%) |
| $20,000 to $24,999 | 77 (15.2%) | 13 (6.9%) |
| $25,000 to $34,999 | 71 (14.0%) | 51 (27.0%) |
| $35,000 to $49,999 | 57 (11.2%) | 54 (28.6%) |
| $50,000 to $74,999 | 58 (11.4%) | 58 (30.7%) |
| $75,000 to $99,999 | 73 (14.4%) | 0 (0.0%) |
| $100,000 to $149,999 | 43 (8.5%) | 0 (0.0%) |
| $150,000 or more | 28 (5.5%) | 0 (0.0%) |
| Total | 508 (100.0%) | 189 (100.0%) |
Monthly Housing Cost Tiers in Brownlee Park
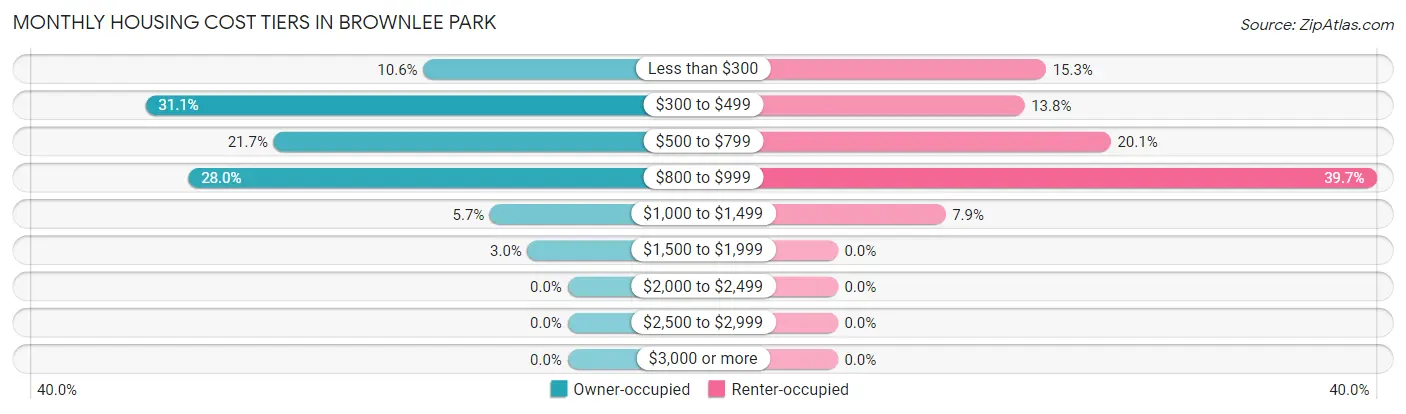
| Monthly Cost | Owner-occupied | Renter-occupied |
| Less than $300 | 54 (10.6%) | 29 (15.3%) |
| $300 to $499 | 158 (31.1%) | 26 (13.8%) |
| $500 to $799 | 110 (21.6%) | 38 (20.1%) |
| $800 to $999 | 142 (28.0%) | 75 (39.7%) |
| $1,000 to $1,499 | 29 (5.7%) | 15 (7.9%) |
| $1,500 to $1,999 | 15 (2.9%) | 0 (0.0%) |
| $2,000 to $2,499 | 0 (0.0%) | 0 (0.0%) |
| $2,500 to $2,999 | 0 (0.0%) | 0 (0.0%) |
| $3,000 or more | 0 (0.0%) | 0 (0.0%) |
| Total | 508 (100.0%) | 189 (100.0%) |
Physical Housing Characteristics in Brownlee Park
Housing Structures in Brownlee Park
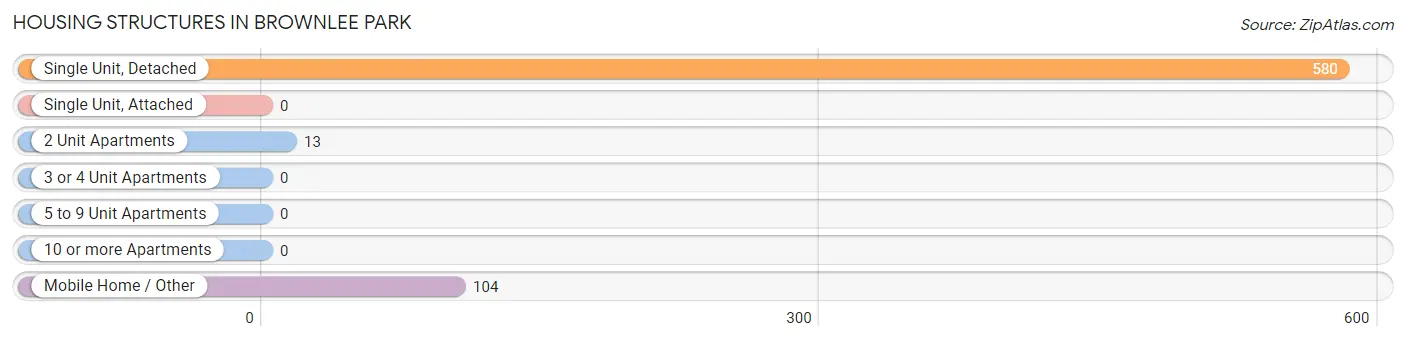
| Structure Type | # Housing Units | % Housing Units |
| Single Unit, Detached | 580 | 83.2% |
| Single Unit, Attached | 0 | 0.0% |
| 2 Unit Apartments | 13 | 1.9% |
| 3 or 4 Unit Apartments | 0 | 0.0% |
| 5 to 9 Unit Apartments | 0 | 0.0% |
| 10 or more Apartments | 0 | 0.0% |
| Mobile Home / Other | 104 | 14.9% |
| Total | 697 | 100.0% |
Housing Structures by Occupancy in Brownlee Park
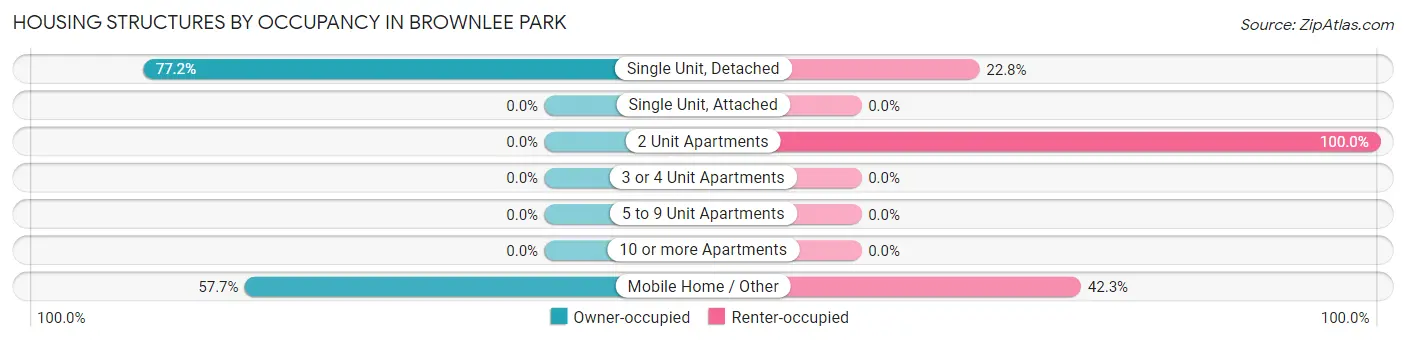
| Structure Type | Owner-occupied | Renter-occupied |
| Single Unit, Detached | 448 (77.2%) | 132 (22.8%) |
| Single Unit, Attached | 0 (0.0%) | 0 (0.0%) |
| 2 Unit Apartments | 0 (0.0%) | 13 (100.0%) |
| 3 or 4 Unit Apartments | 0 (0.0%) | 0 (0.0%) |
| 5 to 9 Unit Apartments | 0 (0.0%) | 0 (0.0%) |
| 10 or more Apartments | 0 (0.0%) | 0 (0.0%) |
| Mobile Home / Other | 60 (57.7%) | 44 (42.3%) |
| Total | 508 (72.9%) | 189 (27.1%) |
Housing Structures by Number of Rooms in Brownlee Park
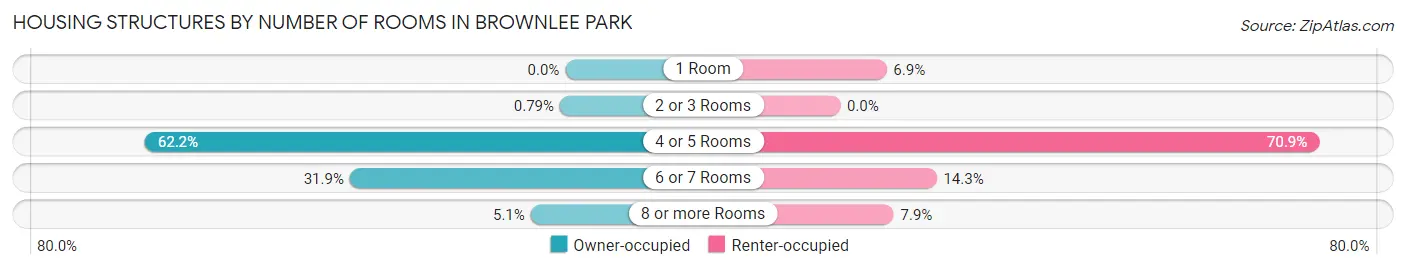
| Number of Rooms | Owner-occupied | Renter-occupied |
| 1 Room | 0 (0.0%) | 13 (6.9%) |
| 2 or 3 Rooms | 4 (0.8%) | 0 (0.0%) |
| 4 or 5 Rooms | 316 (62.2%) | 134 (70.9%) |
| 6 or 7 Rooms | 162 (31.9%) | 27 (14.3%) |
| 8 or more Rooms | 26 (5.1%) | 15 (7.9%) |
| Total | 508 (100.0%) | 189 (100.0%) |
Housing Structure by Heating Type in Brownlee Park
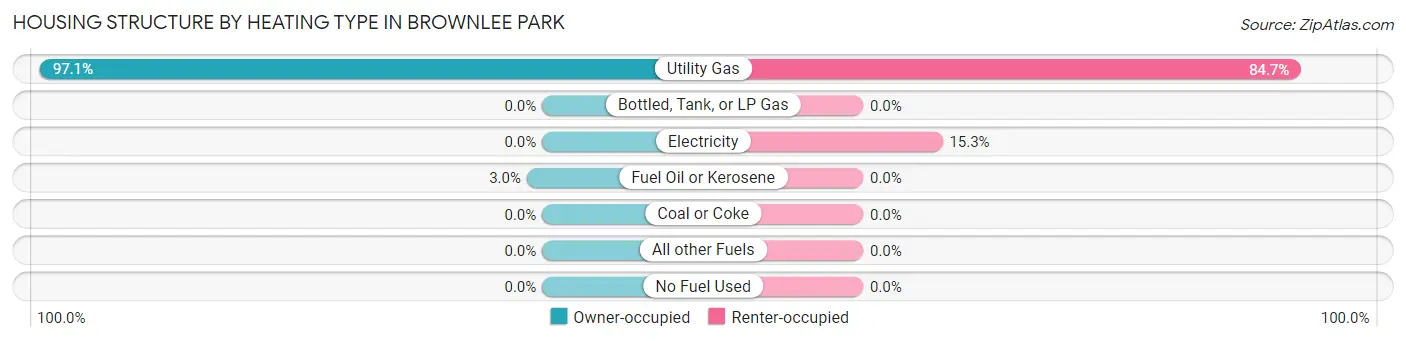
| Heating Type | Owner-occupied | Renter-occupied |
| Utility Gas | 493 (97.1%) | 160 (84.7%) |
| Bottled, Tank, or LP Gas | 0 (0.0%) | 0 (0.0%) |
| Electricity | 0 (0.0%) | 29 (15.3%) |
| Fuel Oil or Kerosene | 15 (2.9%) | 0 (0.0%) |
| Coal or Coke | 0 (0.0%) | 0 (0.0%) |
| All other Fuels | 0 (0.0%) | 0 (0.0%) |
| No Fuel Used | 0 (0.0%) | 0 (0.0%) |
| Total | 508 (100.0%) | 189 (100.0%) |
Household Vehicle Usage in Brownlee Park
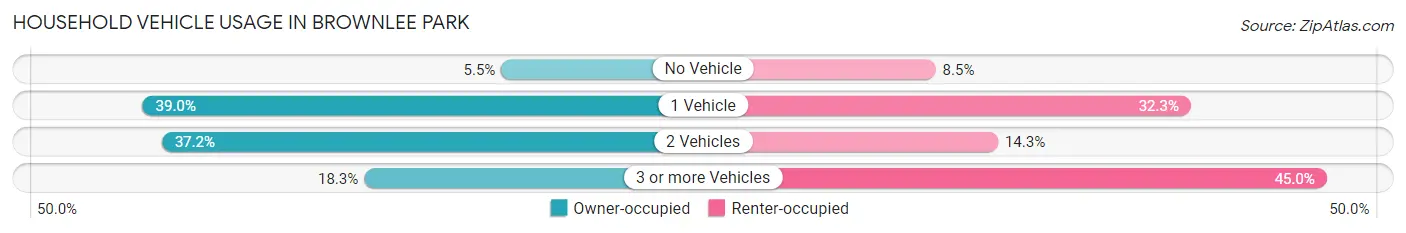
| Vehicles per Household | Owner-occupied | Renter-occupied |
| No Vehicle | 28 (5.5%) | 16 (8.5%) |
| 1 Vehicle | 198 (39.0%) | 61 (32.3%) |
| 2 Vehicles | 189 (37.2%) | 27 (14.3%) |
| 3 or more Vehicles | 93 (18.3%) | 85 (45.0%) |
| Total | 508 (100.0%) | 189 (100.0%) |
Real Estate & Mortgages in Brownlee Park
Real Estate and Mortgage Overview in Brownlee Park
| Characteristic | Without Mortgage | With Mortgage |
| Housing Units | 222 | 286 |
| Median Property Value | $45,100 | $75,500 |
| Median Household Income | - | - |
| Monthly Housing Costs | $386 | $0 |
| Real Estate Taxes | $955 | $3 |
Property Value by Mortgage Status in Brownlee Park
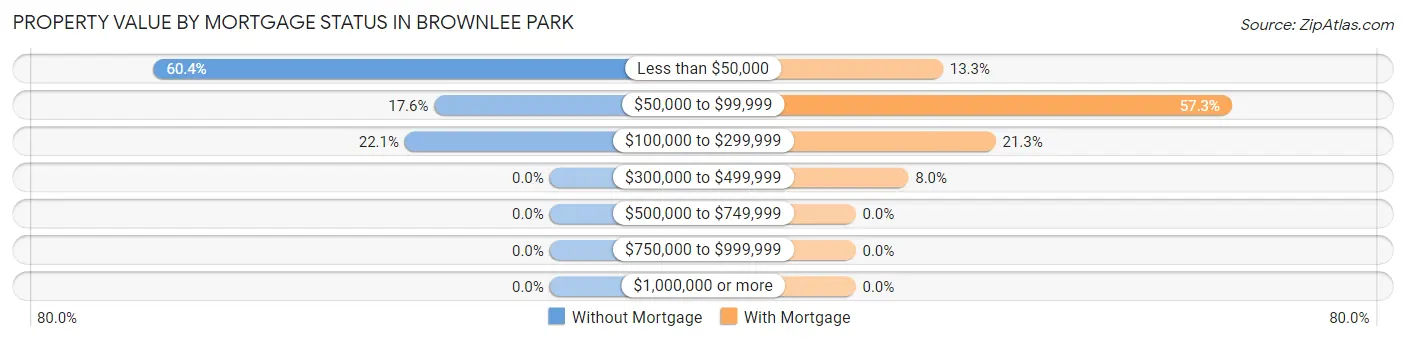
| Property Value | Without Mortgage | With Mortgage |
| Less than $50,000 | 134 (60.4%) | 38 (13.3%) |
| $50,000 to $99,999 | 39 (17.6%) | 164 (57.3%) |
| $100,000 to $299,999 | 49 (22.1%) | 61 (21.3%) |
| $300,000 to $499,999 | 0 (0.0%) | 23 (8.0%) |
| $500,000 to $749,999 | 0 (0.0%) | 0 (0.0%) |
| $750,000 to $999,999 | 0 (0.0%) | 0 (0.0%) |
| $1,000,000 or more | 0 (0.0%) | 0 (0.0%) |
| Total | 222 (100.0%) | 286 (100.0%) |
Household Income by Mortgage Status in Brownlee Park
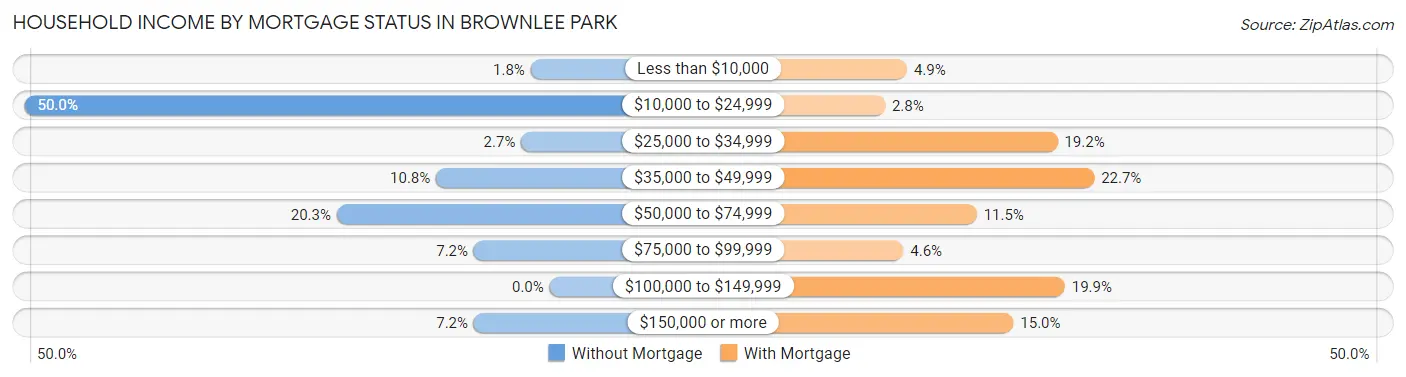
| Household Income | Without Mortgage | With Mortgage |
| Less than $10,000 | 4 (1.8%) | 14 (4.9%) |
| $10,000 to $24,999 | 111 (50.0%) | 8 (2.8%) |
| $25,000 to $34,999 | 6 (2.7%) | 55 (19.2%) |
| $35,000 to $49,999 | 24 (10.8%) | 65 (22.7%) |
| $50,000 to $74,999 | 45 (20.3%) | 33 (11.5%) |
| $75,000 to $99,999 | 16 (7.2%) | 13 (4.5%) |
| $100,000 to $149,999 | 0 (0.0%) | 57 (19.9%) |
| $150,000 or more | 16 (7.2%) | 43 (15.0%) |
| Total | 222 (100.0%) | 286 (100.0%) |
Property Value to Household Income Ratio in Brownlee Park
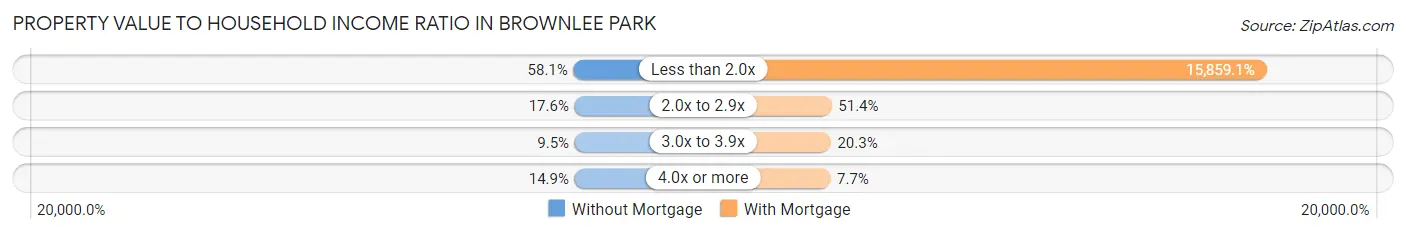
| Value-to-Income Ratio | Without Mortgage | With Mortgage |
| Less than 2.0x | 129 (58.1%) | 45,357 (15,859.1%) |
| 2.0x to 2.9x | 39 (17.6%) | 147 (51.4%) |
| 3.0x to 3.9x | 21 (9.5%) | 58 (20.3%) |
| 4.0x or more | 33 (14.9%) | 22 (7.7%) |
| Total | 222 (100.0%) | 286 (100.0%) |
Real Estate Taxes by Mortgage Status in Brownlee Park
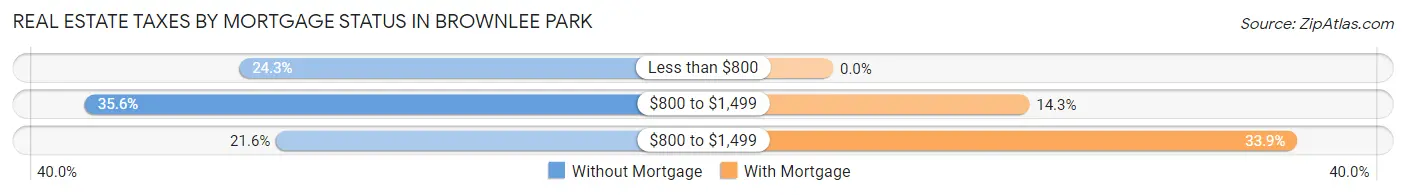
| Property Taxes | Without Mortgage | With Mortgage |
| Less than $800 | 54 (24.3%) | 0 (0.0%) |
| $800 to $1,499 | 79 (35.6%) | 41 (14.3%) |
| $800 to $1,499 | 48 (21.6%) | 97 (33.9%) |
| Total | 222 (100.0%) | 286 (100.0%) |
Health & Disability in Brownlee Park
Health Insurance Coverage by Age in Brownlee Park
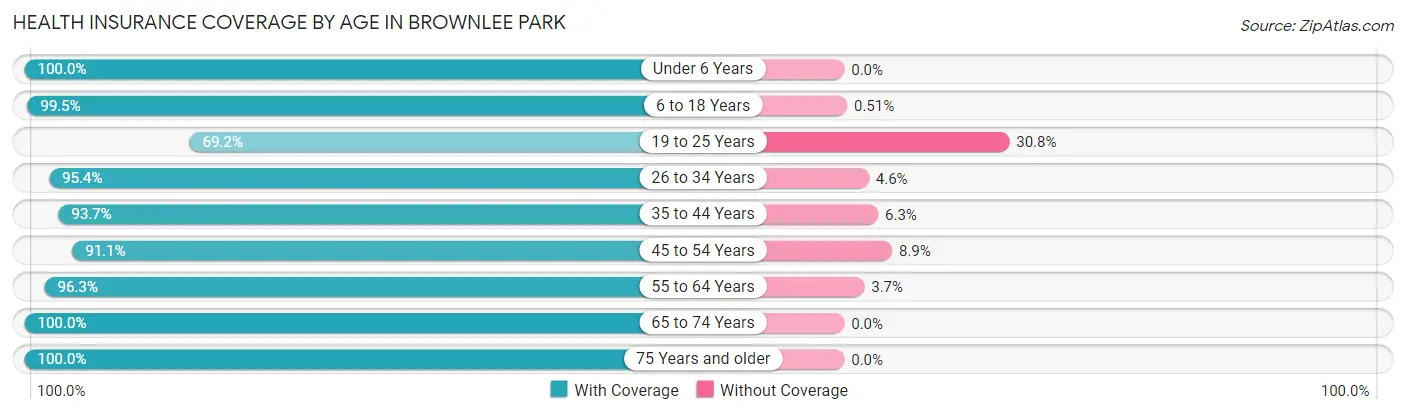
| Age Bracket | With Coverage | Without Coverage |
| Under 6 Years | 69 (100.0%) | 0 (0.0%) |
| 6 to 18 Years | 388 (99.5%) | 2 (0.5%) |
| 19 to 25 Years | 90 (69.2%) | 40 (30.8%) |
| 26 to 34 Years | 229 (95.4%) | 11 (4.6%) |
| 35 to 44 Years | 372 (93.7%) | 25 (6.3%) |
| 45 to 54 Years | 133 (91.1%) | 13 (8.9%) |
| 55 to 64 Years | 258 (96.3%) | 10 (3.7%) |
| 65 to 74 Years | 189 (100.0%) | 0 (0.0%) |
| 75 Years and older | 102 (100.0%) | 0 (0.0%) |
| Total | 1,830 (94.8%) | 101 (5.2%) |
Health Insurance Coverage by Citizenship Status in Brownlee Park
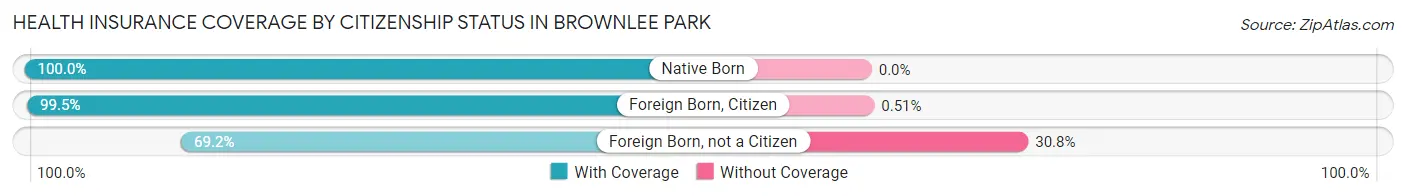
| Citizenship Status | With Coverage | Without Coverage |
| Native Born | 69 (100.0%) | 0 (0.0%) |
| Foreign Born, Citizen | 388 (99.5%) | 2 (0.5%) |
| Foreign Born, not a Citizen | 90 (69.2%) | 40 (30.8%) |
Health Insurance Coverage by Household Income in Brownlee Park
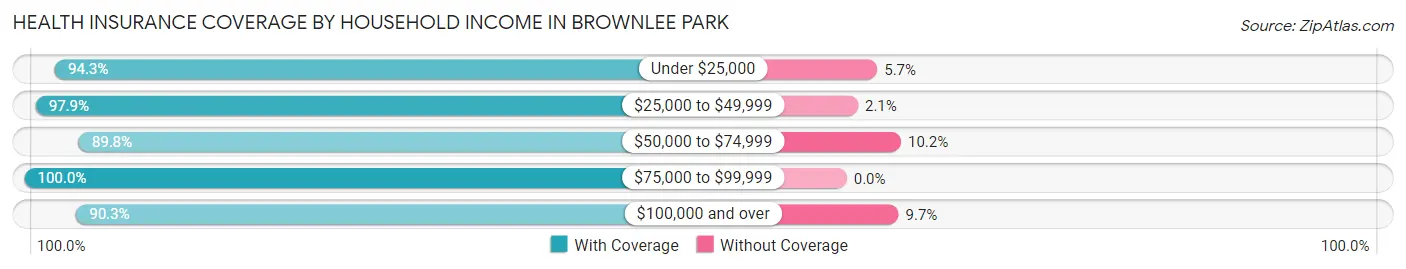
| Household Income | With Coverage | Without Coverage |
| Under $25,000 | 429 (94.3%) | 26 (5.7%) |
| $25,000 to $49,999 | 604 (97.9%) | 13 (2.1%) |
| $50,000 to $74,999 | 318 (89.8%) | 36 (10.2%) |
| $75,000 to $99,999 | 231 (100.0%) | 0 (0.0%) |
| $100,000 and over | 242 (90.3%) | 26 (9.7%) |
Public vs Private Health Insurance Coverage by Age in Brownlee Park
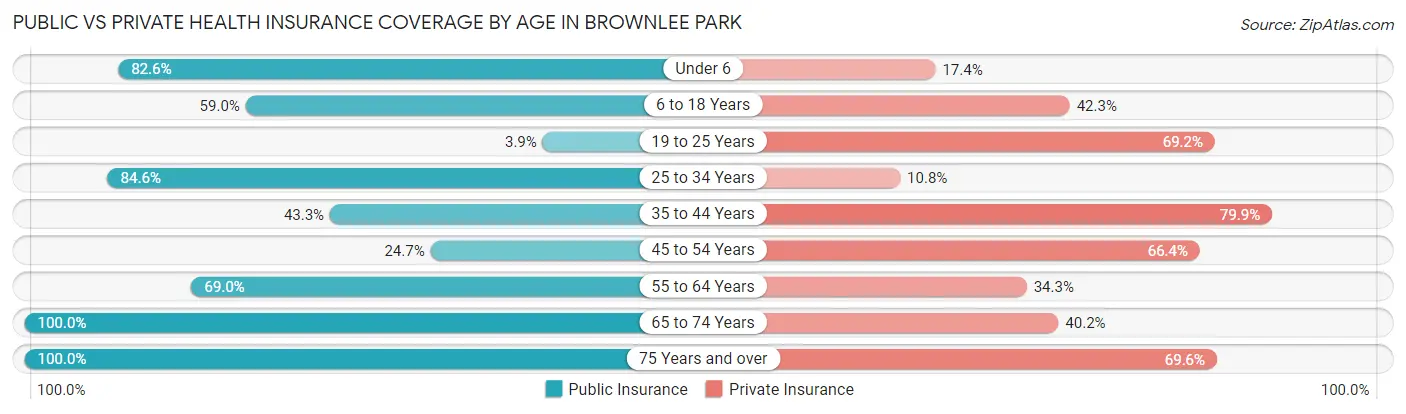
| Age Bracket | Public Insurance | Private Insurance |
| Under 6 | 57 (82.6%) | 12 (17.4%) |
| 6 to 18 Years | 230 (59.0%) | 165 (42.3%) |
| 19 to 25 Years | 5 (3.8%) | 90 (69.2%) |
| 25 to 34 Years | 203 (84.6%) | 26 (10.8%) |
| 35 to 44 Years | 172 (43.3%) | 317 (79.8%) |
| 45 to 54 Years | 36 (24.7%) | 97 (66.4%) |
| 55 to 64 Years | 185 (69.0%) | 92 (34.3%) |
| 65 to 74 Years | 189 (100.0%) | 76 (40.2%) |
| 75 Years and over | 102 (100.0%) | 71 (69.6%) |
| Total | 1,179 (61.1%) | 946 (49.0%) |
Disability Status by Sex by Age in Brownlee Park
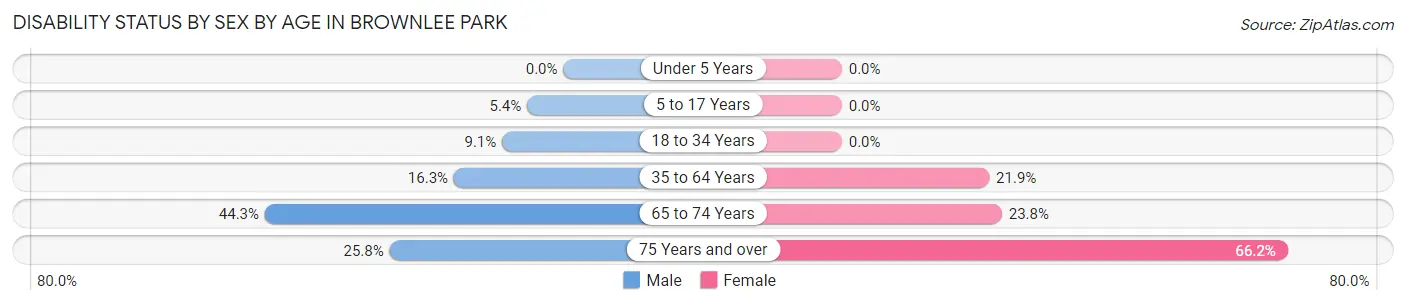
| Age Bracket | Male | Female |
| Under 5 Years | 0 (0.0%) | 0 (0.0%) |
| 5 to 17 Years | 14 (5.4%) | 0 (0.0%) |
| 18 to 34 Years | 28 (9.1%) | 0 (0.0%) |
| 35 to 64 Years | 85 (16.3%) | 63 (21.9%) |
| 65 to 74 Years | 39 (44.3%) | 24 (23.8%) |
| 75 Years and over | 8 (25.8%) | 47 (66.2%) |
Disability Class by Sex by Age in Brownlee Park
Disability Class: Hearing Difficulty
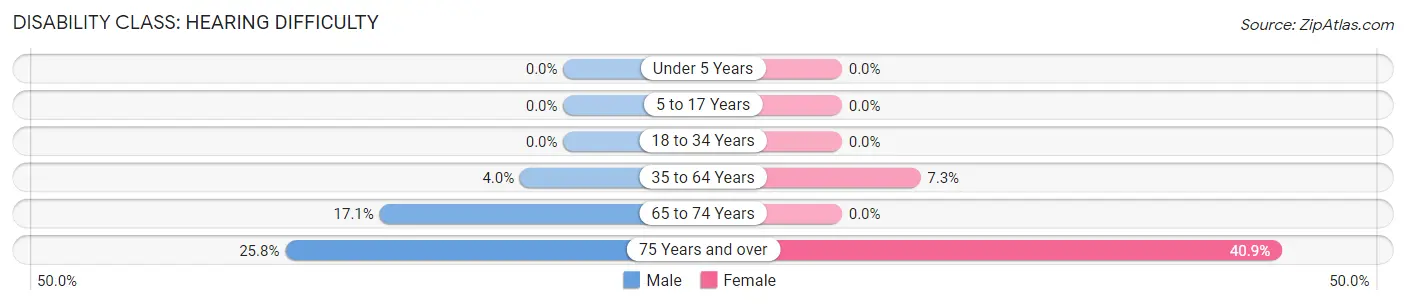
| Age Bracket | Male | Female |
| Under 5 Years | 0 (0.0%) | 0 (0.0%) |
| 5 to 17 Years | 0 (0.0%) | 0 (0.0%) |
| 18 to 34 Years | 0 (0.0%) | 0 (0.0%) |
| 35 to 64 Years | 21 (4.0%) | 21 (7.3%) |
| 65 to 74 Years | 15 (17.1%) | 0 (0.0%) |
| 75 Years and over | 8 (25.8%) | 29 (40.8%) |
Disability Class: Vision Difficulty
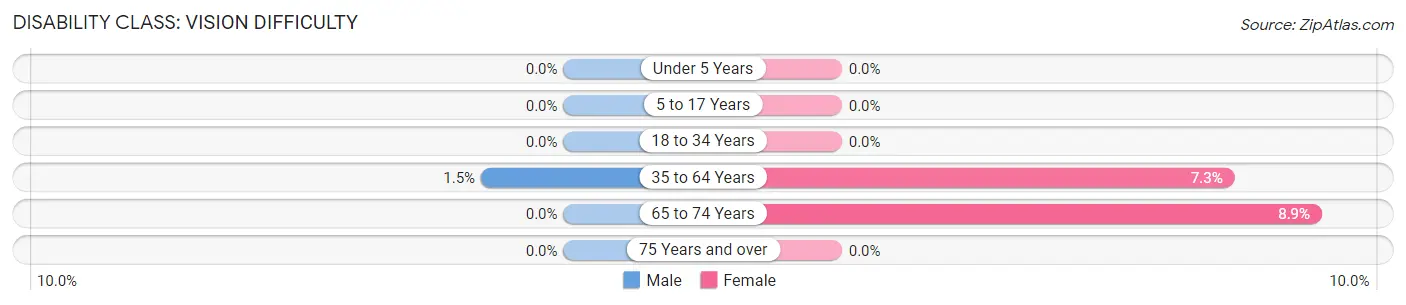
| Age Bracket | Male | Female |
| Under 5 Years | 0 (0.0%) | 0 (0.0%) |
| 5 to 17 Years | 0 (0.0%) | 0 (0.0%) |
| 18 to 34 Years | 0 (0.0%) | 0 (0.0%) |
| 35 to 64 Years | 8 (1.5%) | 21 (7.3%) |
| 65 to 74 Years | 0 (0.0%) | 9 (8.9%) |
| 75 Years and over | 0 (0.0%) | 0 (0.0%) |
Disability Class: Cognitive Difficulty
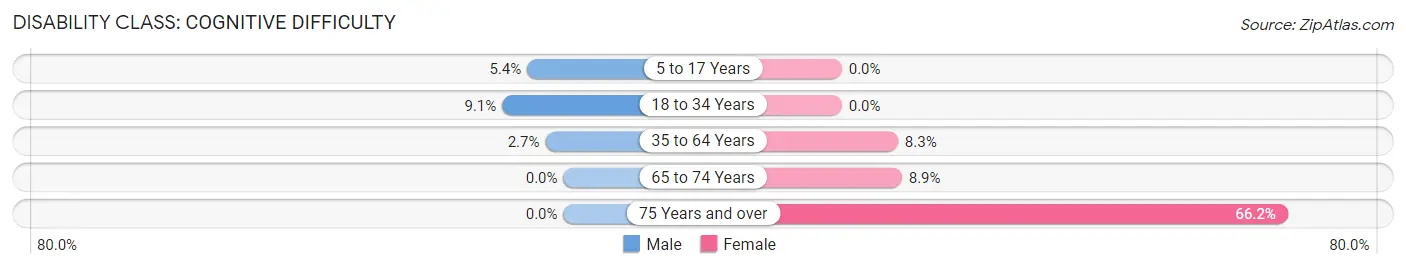
| Age Bracket | Male | Female |
| 5 to 17 Years | 14 (5.4%) | 0 (0.0%) |
| 18 to 34 Years | 28 (9.1%) | 0 (0.0%) |
| 35 to 64 Years | 14 (2.7%) | 24 (8.3%) |
| 65 to 74 Years | 0 (0.0%) | 9 (8.9%) |
| 75 Years and over | 0 (0.0%) | 47 (66.2%) |
Disability Class: Ambulatory Difficulty
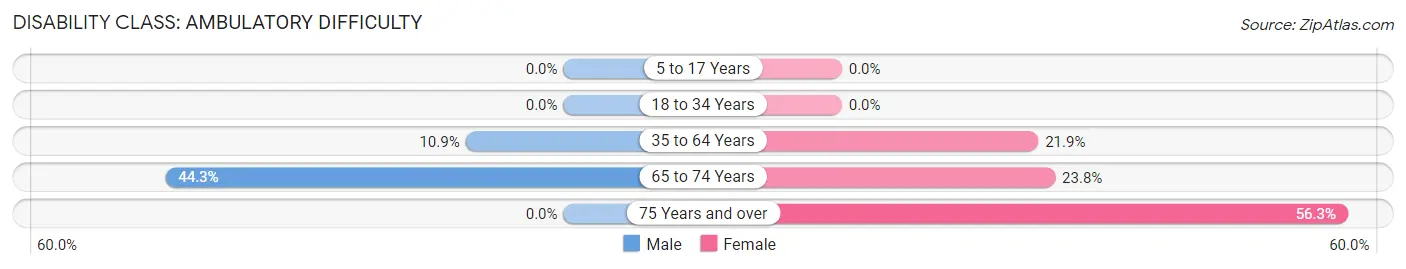
| Age Bracket | Male | Female |
| 5 to 17 Years | 0 (0.0%) | 0 (0.0%) |
| 18 to 34 Years | 0 (0.0%) | 0 (0.0%) |
| 35 to 64 Years | 57 (10.9%) | 63 (21.9%) |
| 65 to 74 Years | 39 (44.3%) | 24 (23.8%) |
| 75 Years and over | 0 (0.0%) | 40 (56.3%) |
Disability Class: Self-Care Difficulty
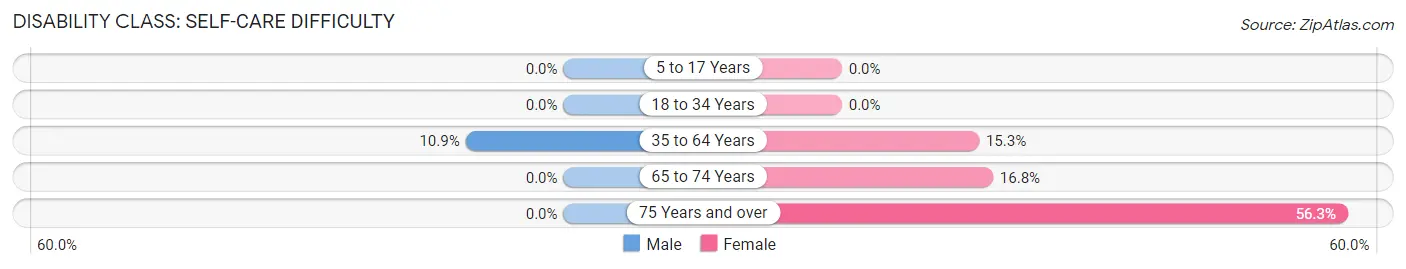
| Age Bracket | Male | Female |
| 5 to 17 Years | 0 (0.0%) | 0 (0.0%) |
| 18 to 34 Years | 0 (0.0%) | 0 (0.0%) |
| 35 to 64 Years | 57 (10.9%) | 44 (15.3%) |
| 65 to 74 Years | 0 (0.0%) | 17 (16.8%) |
| 75 Years and over | 0 (0.0%) | 40 (56.3%) |
Technology Access in Brownlee Park
Computing Device Access in Brownlee Park
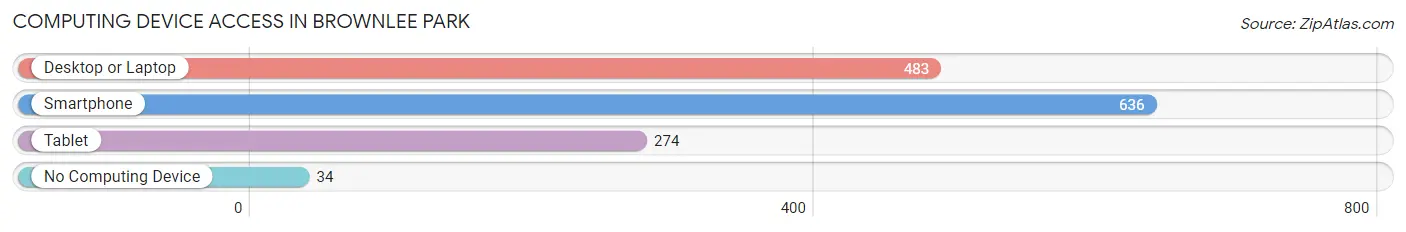
| Device Type | # Households | % Households |
| Desktop or Laptop | 483 | 69.3% |
| Smartphone | 636 | 91.2% |
| Tablet | 274 | 39.3% |
| No Computing Device | 34 | 4.9% |
| Total | 697 | 100.0% |
Internet Access in Brownlee Park
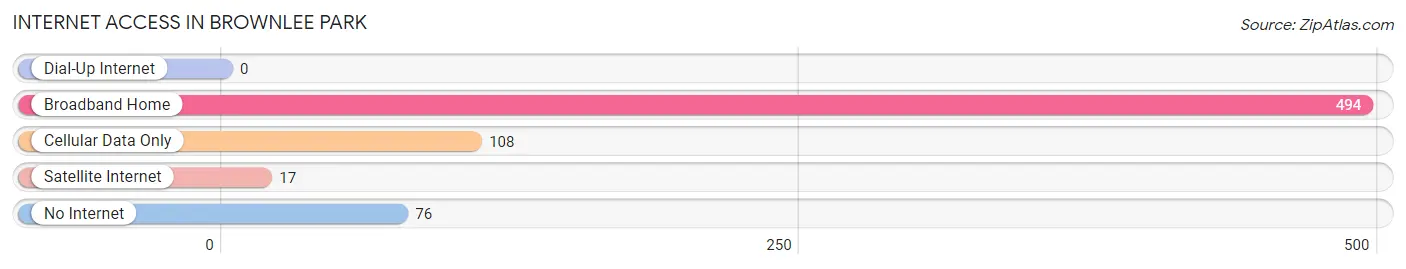
| Internet Type | # Households | % Households |
| Dial-Up Internet | 0 | 0.0% |
| Broadband Home | 494 | 70.9% |
| Cellular Data Only | 108 | 15.5% |
| Satellite Internet | 17 | 2.4% |
| No Internet | 76 | 10.9% |
| Total | 697 | 100.0% |
Brownlee Park Summary
Brownlee Park is a small community located in the Upper Peninsula of Michigan. It is situated in the western part of the state, near the border with Wisconsin. The population of Brownlee Park is estimated to be around 500 people.
History
Brownlee Park was founded in 1887 by William Brownlee, a lumberman from Wisconsin. He purchased the land from the local Native American tribes and began to develop the area. The first settlers were mostly lumberjacks and farmers. The town was named after William Brownlee and was incorporated in 1891.
The town grew slowly but steadily over the years. In the early 1900s, the town was home to a number of businesses, including a sawmill, a general store, a blacksmith shop, and a hotel. The town also had a post office, a school, and a church.
In the 1920s, the town began to decline as the lumber industry in the area began to decline. The population of the town decreased and many of the businesses closed. In the 1950s, the town was revitalized when a new highway was built through the area. This allowed for easier access to the town and helped to attract new businesses and residents.
Geography
Brownlee Park is located in the western part of the Upper Peninsula of Michigan. It is situated in the Menominee River Valley, near the border with Wisconsin. The town is surrounded by forests and is located near several lakes, including Lake Michigan. The town is located about 30 miles from the city of Escanaba.
The climate in Brownlee Park is typical of the Upper Peninsula, with cold winters and warm summers. The average temperature in the winter is around 20 degrees Fahrenheit, while the average temperature in the summer is around 70 degrees Fahrenheit.
Economy
The economy of Brownlee Park is largely based on tourism. The town is home to several resorts and campgrounds, which attract visitors from all over the country. The town is also home to several small businesses, including restaurants, shops, and a grocery store.
The town is also home to a number of manufacturing businesses, including a furniture factory and a paper mill. These businesses provide employment for many of the town’s residents.
Demographics
The population of Brownlee Park is estimated to be around 500 people. The town is predominantly white, with a small percentage of African Americans and Native Americans. The median household income in the town is around $35,000. The town has a high rate of poverty, with around 25% of the population living below the poverty line.
Common Questions
What is Per Capita Income in Brownlee Park?
Per Capita income in Brownlee Park is $19,643.
What is the Median Family Income in Brownlee Park?
Median Family Income in Brownlee Park is $44,032.
What is the Median Household income in Brownlee Park?
Median Household Income in Brownlee Park is $38,698.
What is Income or Wage Gap in Brownlee Park?
Income or Wage Gap in Brownlee Park is 21.7%.
Women in Brownlee Park earn 78.3 cents for every dollar earned by a man.
What is Inequality or Gini Index in Brownlee Park?
Inequality or Gini Index in Brownlee Park is 0.39.
What is the Total Population of Brownlee Park?
Total Population of Brownlee Park is 1,931.
What is the Total Male Population of Brownlee Park?
Total Male Population of Brownlee Park is 1,262.
What is the Total Female Population of Brownlee Park?
Total Female Population of Brownlee Park is 669.
What is the Ratio of Males per 100 Females in Brownlee Park?
There are 188.64 Males per 100 Females in Brownlee Park.
What is the Ratio of Females per 100 Males in Brownlee Park?
There are 53.01 Females per 100 Males in Brownlee Park.
What is the Median Population Age in Brownlee Park?
Median Population Age in Brownlee Park is 41.4 Years.
What is the Average Family Size in Brownlee Park
Average Family Size in Brownlee Park is 3.3 People.
What is the Average Household Size in Brownlee Park
Average Household Size in Brownlee Park is 2.8 People.
How Large is the Labor Force in Brownlee Park?
There are 862 People in the Labor Forcein in Brownlee Park.
What is the Percentage of People in the Labor Force in Brownlee Park?
55.1% of People are in the Labor Force in Brownlee Park.
What is the Unemployment Rate in Brownlee Park?
Unemployment Rate in Brownlee Park is 2.2%.