Stony Point, MI Map & Demographics
Stony Point Map
Stony Point Overview
$27,909
PER CAPITA INCOME
$68,028
AVG FAMILY INCOME
$65,240
AVG HOUSEHOLD INCOME
78.9%
WAGE / INCOME GAP [ % ]
21.1¢/ $1
WAGE / INCOME GAP [ $ ]
0.44
INEQUALITY / GINI INDEX
1,875
TOTAL POPULATION
915
MALE POPULATION
960
FEMALE POPULATION
95.31
MALES / 100 FEMALES
104.92
FEMALES / 100 MALES
37.9
MEDIAN AGE
3.4
AVG FAMILY SIZE
2.8
AVG HOUSEHOLD SIZE
813
LABOR FORCE [ PEOPLE ]
59.9%
PERCENT IN LABOR FORCE
6.8%
UNEMPLOYMENT RATE
Income in Stony Point
Income Overview in Stony Point
Per Capita Income in Stony Point is $27,909, while median incomes of families and households are $68,028 and $65,240 respectively.
| Characteristic | Number | Measure |
| Per Capita Income | 1,875 | $27,909 |
| Median Family Income | 477 | $68,028 |
| Mean Family Income | 477 | $91,630 |
| Median Household Income | 674 | $65,240 |
| Mean Household Income | 674 | $77,046 |
| Income Deficit | 477 | $0 |
| Wage / Income Gap (%) | 1,875 | 78.92% |
| Wage / Income Gap ($) | 1,875 | 21.08¢ per $1 |
| Gini / Inequality Index | 1,875 | 0.44 |
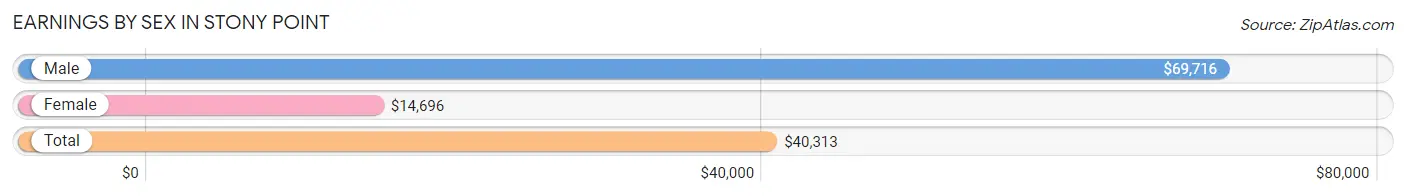
Earnings by Sex in Stony Point
Average Earnings in Stony Point are $40,313, $69,716 for men and $14,696 for women, a difference of 78.9%.
| Sex | Number | Average Earnings |
| Male | 327 (37.9%) | $69,716 |
| Female | 537 (62.2%) | $14,696 |
| Total | 864 (100.0%) | $40,313 |
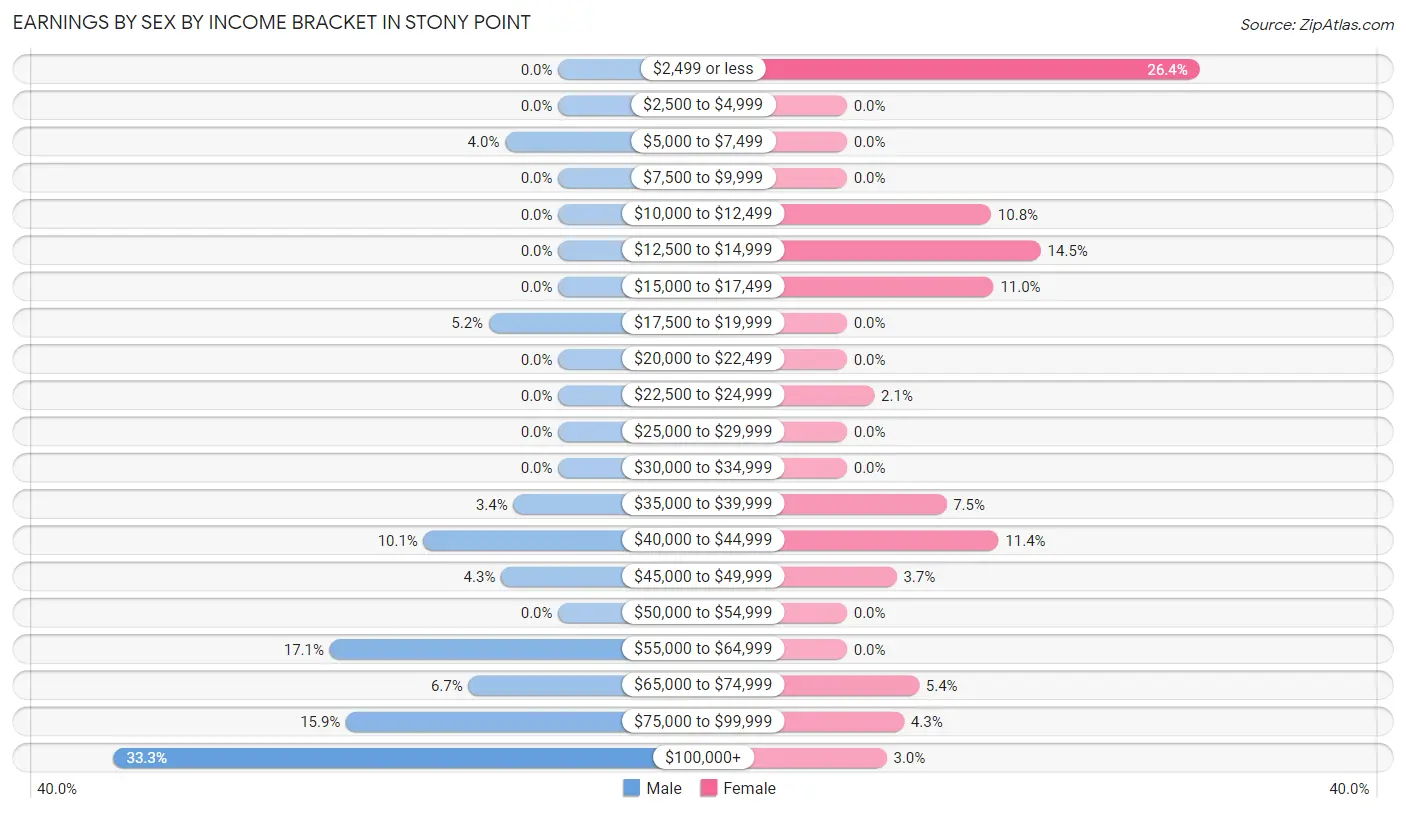
Earnings by Sex by Income Bracket in Stony Point
The most common earnings brackets in Stony Point are $100,000+ for men (109 | 33.3%) and $2,499 or less for women (142 | 26.4%).
| Income | Male | Female |
| $2,499 or less | 0 (0.0%) | 142 (26.4%) |
| $2,500 to $4,999 | 0 (0.0%) | 0 (0.0%) |
| $5,000 to $7,499 | 13 (4.0%) | 0 (0.0%) |
| $7,500 to $9,999 | 0 (0.0%) | 0 (0.0%) |
| $10,000 to $12,499 | 0 (0.0%) | 58 (10.8%) |
| $12,500 to $14,999 | 0 (0.0%) | 78 (14.5%) |
| $15,000 to $17,499 | 0 (0.0%) | 59 (11.0%) |
| $17,500 to $19,999 | 17 (5.2%) | 0 (0.0%) |
| $20,000 to $22,499 | 0 (0.0%) | 0 (0.0%) |
| $22,500 to $24,999 | 0 (0.0%) | 11 (2.1%) |
| $25,000 to $29,999 | 0 (0.0%) | 0 (0.0%) |
| $30,000 to $34,999 | 0 (0.0%) | 0 (0.0%) |
| $35,000 to $39,999 | 11 (3.4%) | 40 (7.4%) |
| $40,000 to $44,999 | 33 (10.1%) | 61 (11.4%) |
| $45,000 to $49,999 | 14 (4.3%) | 20 (3.7%) |
| $50,000 to $54,999 | 0 (0.0%) | 0 (0.0%) |
| $55,000 to $64,999 | 56 (17.1%) | 0 (0.0%) |
| $65,000 to $74,999 | 22 (6.7%) | 29 (5.4%) |
| $75,000 to $99,999 | 52 (15.9%) | 23 (4.3%) |
| $100,000+ | 109 (33.3%) | 16 (3.0%) |
| Total | 327 (100.0%) | 537 (100.0%) |
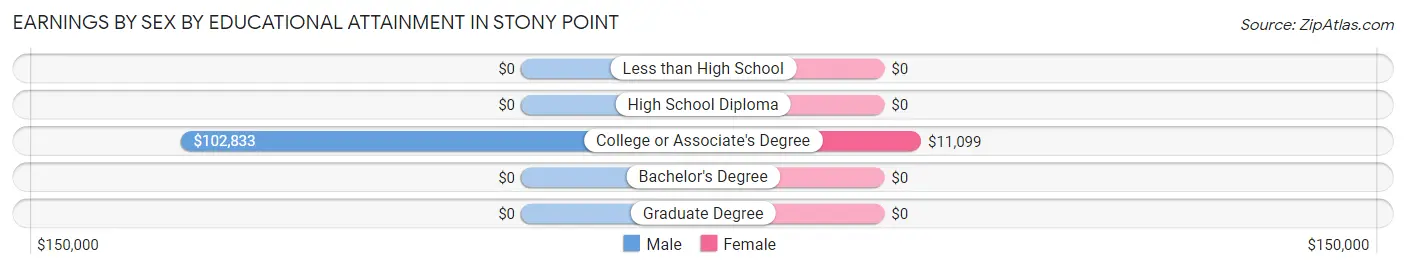
Earnings by Sex by Educational Attainment in Stony Point
| Educational Attainment | Male Income | Female Income |
| Less than High School | - | - |
| High School Diploma | - | - |
| College or Associate's Degree | $102,833 | $11,099 |
| Bachelor's Degree | - | - |
| Graduate Degree | - | - |
| Total | $69,716 | $0 |
Family Income in Stony Point
Family Income Brackets in Stony Point
According to the Stony Point family income data, there are 185 families falling into the $50,000 to $74,999 income range, which is the most common income bracket and makes up 38.8% of all families.
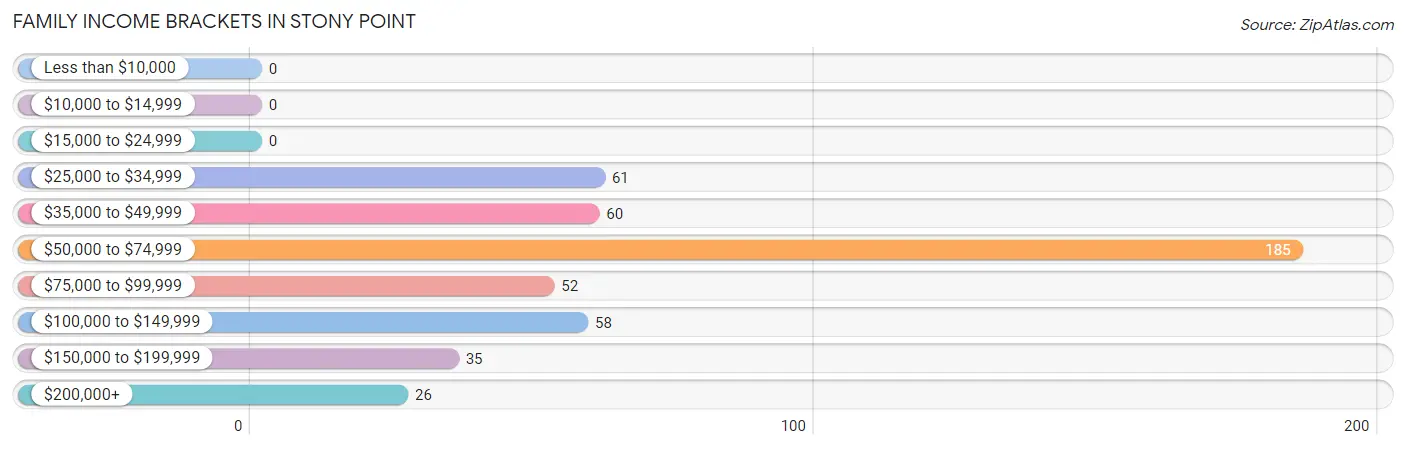
| Income Bracket | # Families | % Families |
| Less than $10,000 | 0 | 0.0% |
| $10,000 to $14,999 | 0 | 0.0% |
| $15,000 to $24,999 | 0 | 0.0% |
| $25,000 to $34,999 | 61 | 12.8% |
| $35,000 to $49,999 | 60 | 12.6% |
| $50,000 to $74,999 | 185 | 38.8% |
| $75,000 to $99,999 | 52 | 10.9% |
| $100,000 to $149,999 | 58 | 12.2% |
| $150,000 to $199,999 | 35 | 7.3% |
| $200,000+ | 26 | 5.5% |
Family Income by Famaliy Size in Stony Point
4-person families (41 | 8.6%) account for the highest median family income in Stony Point with $250,001 per family, while 4-person families (41 | 8.6%) have the highest median income of $62,500 per family member.
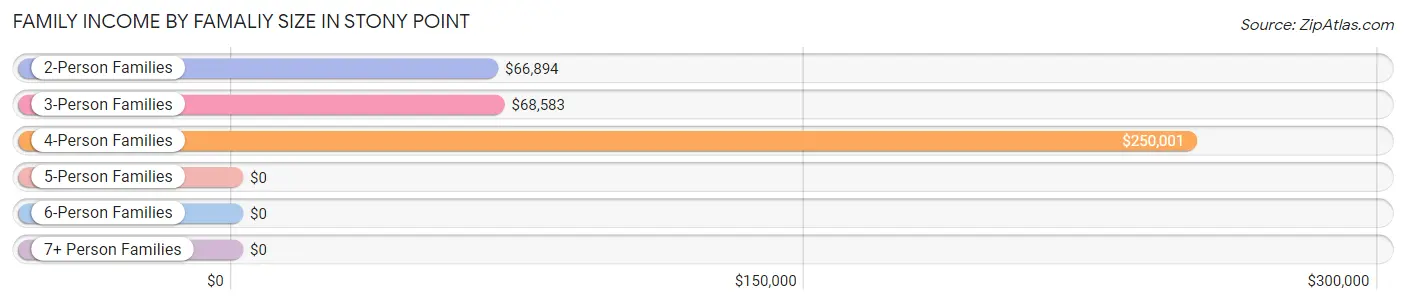
| Income Bracket | # Families | Median Income |
| 2-Person Families | 204 (42.8%) | $66,894 |
| 3-Person Families | 115 (24.1%) | $68,583 |
| 4-Person Families | 41 (8.6%) | $250,001 |
| 5-Person Families | 83 (17.4%) | $0 |
| 6-Person Families | 34 (7.1%) | $0 |
| 7+ Person Families | 0 (0.0%) | $0 |
| Total | 477 (100.0%) | $68,028 |
Family Income by Number of Earners in Stony Point
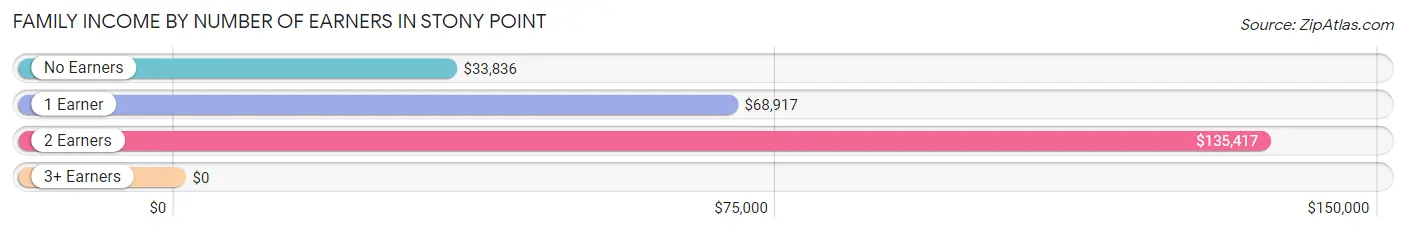
| Number of Earners | # Families | Median Income |
| No Earners | 95 (19.9%) | $33,836 |
| 1 Earner | 175 (36.7%) | $68,917 |
| 2 Earners | 175 (36.7%) | $135,417 |
| 3+ Earners | 32 (6.7%) | $0 |
| Total | 477 (100.0%) | $68,028 |
Household Income in Stony Point
Household Income Brackets in Stony Point
With 194 households falling in the category, the $50,000 to $74,999 income range is the most frequent in Stony Point, accounting for 28.8% of all households. In contrast, only 23 households (3.4%) fall into the $15,000 to $24,999 income bracket, making it the least populous group.
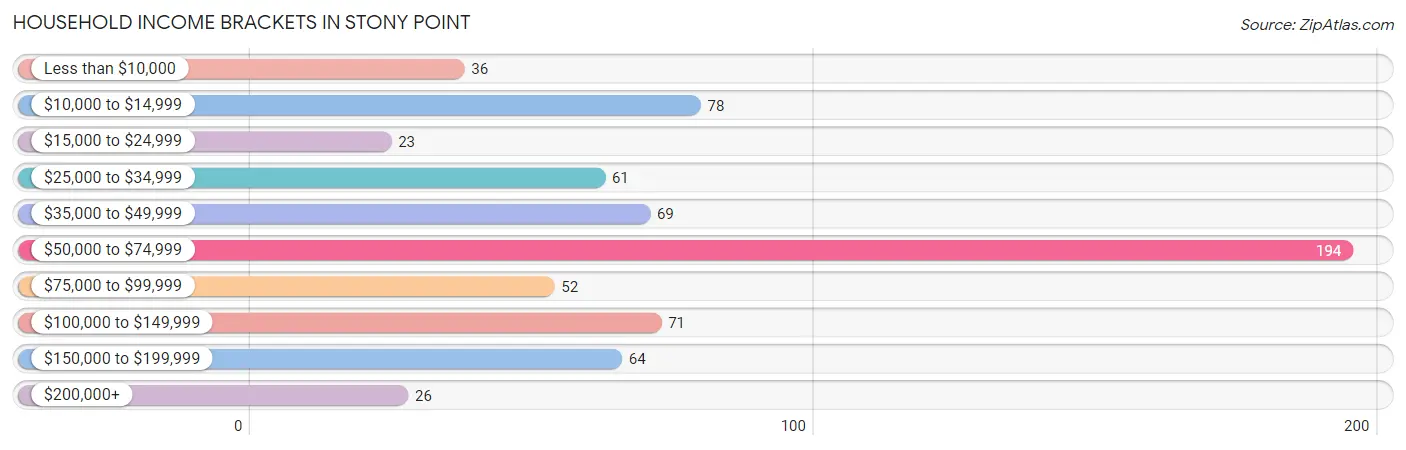
| Income Bracket | # Households | % Households |
| Less than $10,000 | 36 | 5.3% |
| $10,000 to $14,999 | 78 | 11.6% |
| $15,000 to $24,999 | 23 | 3.4% |
| $25,000 to $34,999 | 61 | 9.1% |
| $35,000 to $49,999 | 69 | 10.2% |
| $50,000 to $74,999 | 194 | 28.8% |
| $75,000 to $99,999 | 52 | 7.7% |
| $100,000 to $149,999 | 71 | 10.5% |
| $150,000 to $199,999 | 64 | 9.5% |
| $200,000+ | 26 | 3.9% |
Household Income by Householder Age in Stony Point
The median household income in Stony Point is $65,240, with the highest median household income of $65,265 found in the 45 to 64 years age bracket for the primary householder. A total of 359 households (53.3%) fall into this category. Meanwhile, the 15 to 24 years age bracket for the primary householder has the lowest median household income of $0, with 10 households (1.5%) in this group.
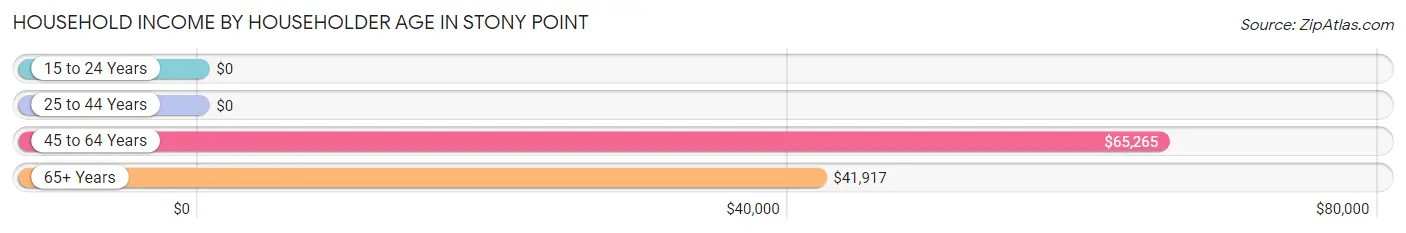
| Income Bracket | # Households | Median Income |
| 15 to 24 Years | 10 (1.5%) | $0 |
| 25 to 44 Years | 204 (30.3%) | $0 |
| 45 to 64 Years | 359 (53.3%) | $65,265 |
| 65+ Years | 101 (15.0%) | $41,917 |
| Total | 674 (100.0%) | $65,240 |
Poverty in Stony Point
Income Below Poverty by Sex and Age in Stony Point
With 8.8% poverty level for males and 26.1% for females among the residents of Stony Point, 18 to 24 year old males and 15 year old females are the most vulnerable to poverty, with 10 males (50.0%) and 35 females (100.0%) in their respective age groups living below the poverty level.
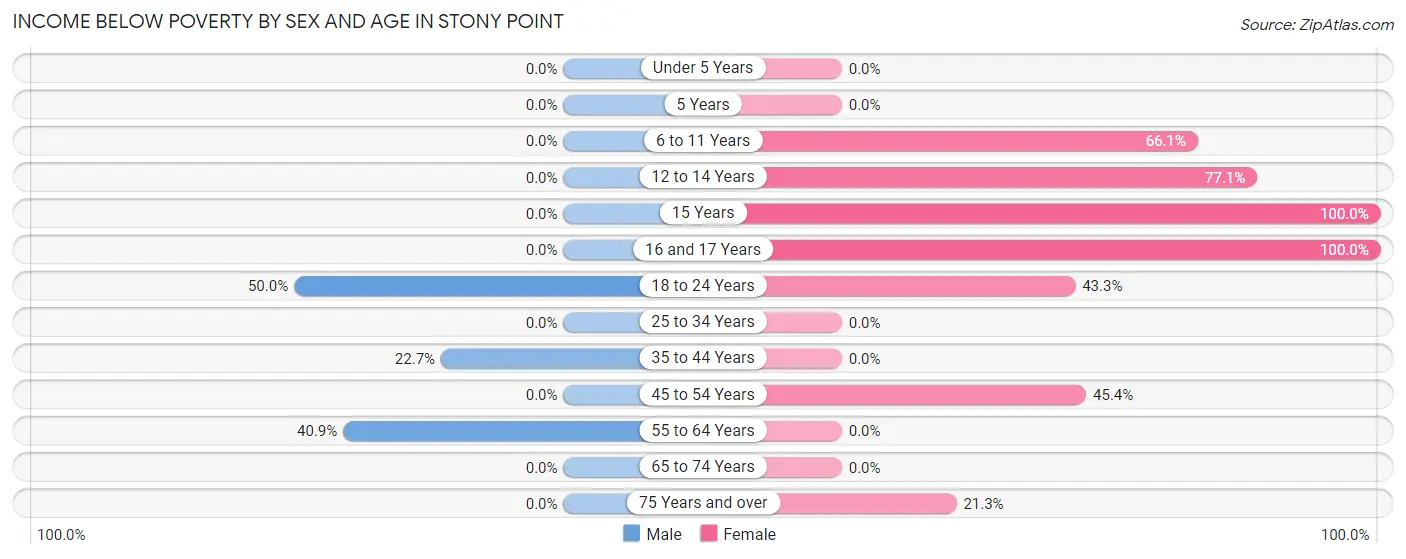
| Age Bracket | Male | Female |
| Under 5 Years | 0 (0.0%) | 0 (0.0%) |
| 5 Years | 0 (0.0%) | 0 (0.0%) |
| 6 to 11 Years | 0 (0.0%) | 37 (66.1%) |
| 12 to 14 Years | 0 (0.0%) | 37 (77.1%) |
| 15 Years | 0 (0.0%) | 35 (100.0%) |
| 16 and 17 Years | 0 (0.0%) | 11 (100.0%) |
| 18 to 24 Years | 10 (50.0%) | 39 (43.3%) |
| 25 to 34 Years | 0 (0.0%) | 0 (0.0%) |
| 35 to 44 Years | 15 (22.7%) | 0 (0.0%) |
| 45 to 54 Years | 0 (0.0%) | 78 (45.4%) |
| 55 to 64 Years | 56 (40.9%) | 0 (0.0%) |
| 65 to 74 Years | 0 (0.0%) | 0 (0.0%) |
| 75 Years and over | 0 (0.0%) | 10 (21.3%) |
| Total | 81 (8.8%) | 247 (26.1%) |
Income Above Poverty by Sex and Age in Stony Point
According to the poverty statistics in Stony Point, males aged under 5 years and females aged 25 to 34 years are the age groups that are most secure financially, with 100.0% of males and 100.0% of females in these age groups living above the poverty line.
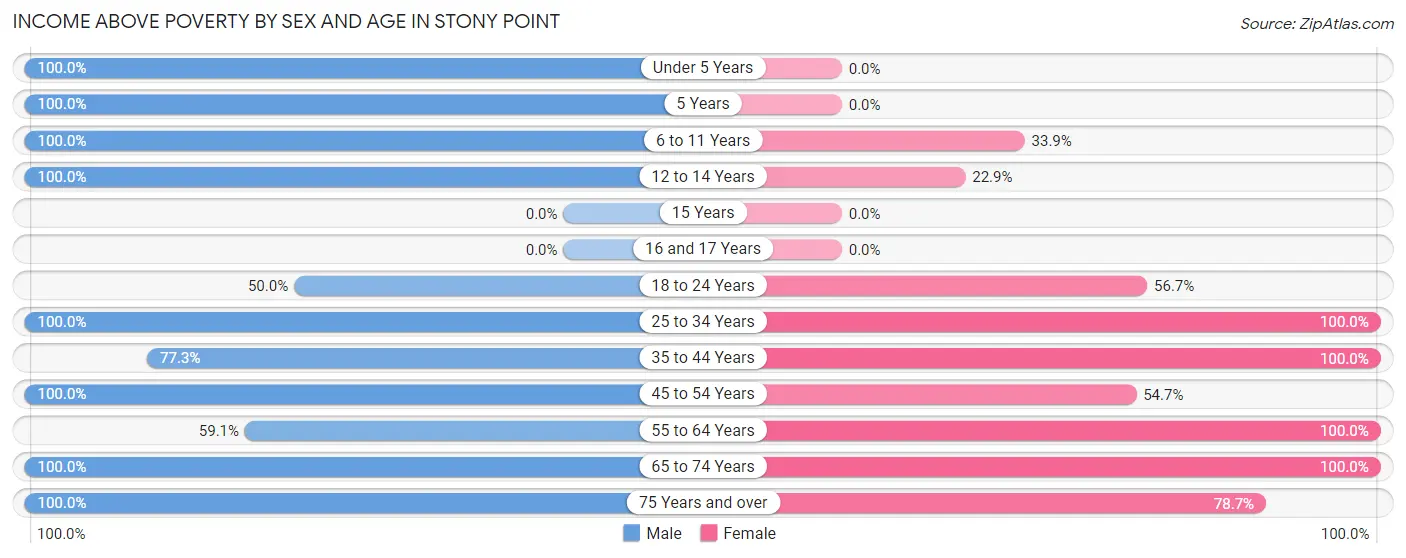
| Age Bracket | Male | Female |
| Under 5 Years | 50 (100.0%) | 0 (0.0%) |
| 5 Years | 54 (100.0%) | 0 (0.0%) |
| 6 to 11 Years | 253 (100.0%) | 19 (33.9%) |
| 12 to 14 Years | 9 (100.0%) | 11 (22.9%) |
| 15 Years | 0 (0.0%) | 0 (0.0%) |
| 16 and 17 Years | 0 (0.0%) | 0 (0.0%) |
| 18 to 24 Years | 10 (50.0%) | 51 (56.7%) |
| 25 to 34 Years | 74 (100.0%) | 120 (100.0%) |
| 35 to 44 Years | 51 (77.3%) | 154 (100.0%) |
| 45 to 54 Years | 177 (100.0%) | 94 (54.6%) |
| 55 to 64 Years | 81 (59.1%) | 161 (100.0%) |
| 65 to 74 Years | 25 (100.0%) | 54 (100.0%) |
| 75 Years and over | 50 (100.0%) | 37 (78.7%) |
| Total | 834 (91.1%) | 701 (74.0%) |
Income Below Poverty Among Married-Couple Families in Stony Point
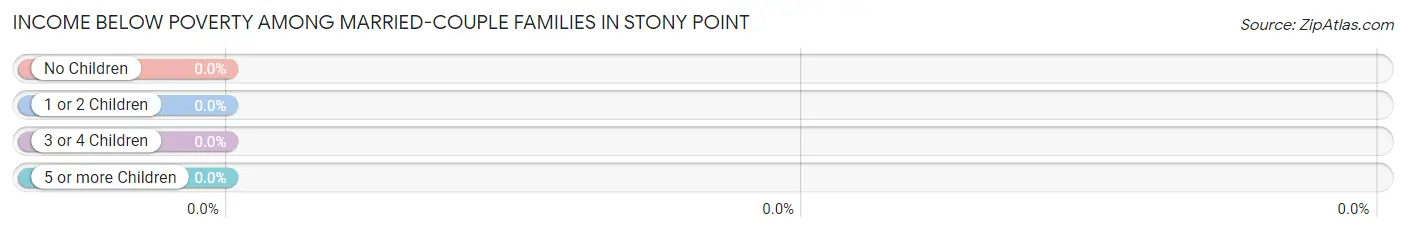
| Children | Above Poverty | Below Poverty |
| No Children | 202 (100.0%) | 0 (0.0%) |
| 1 or 2 Children | 94 (100.0%) | 0 (0.0%) |
| 3 or 4 Children | 85 (100.0%) | 0 (0.0%) |
| 5 or more Children | 0 (0.0%) | 0 (0.0%) |
| Total | 381 (100.0%) | 0 (0.0%) |
Income Below Poverty Among Single-Parent Households in Stony Point
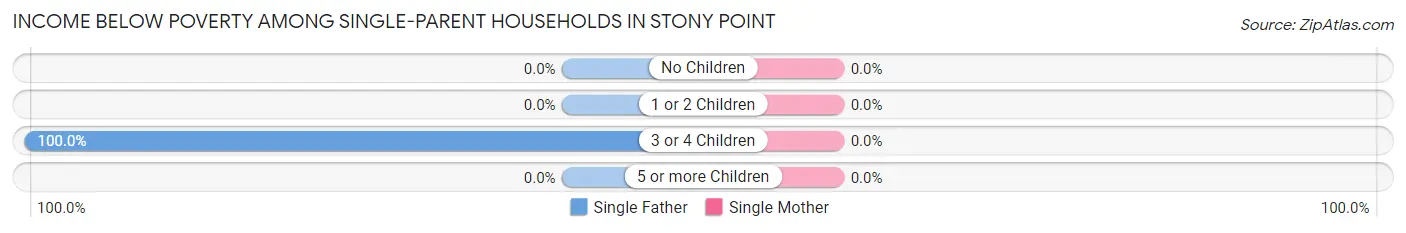
| Children | Single Father | Single Mother |
| No Children | 0 (0.0%) | 0 (0.0%) |
| 1 or 2 Children | 0 (0.0%) | 0 (0.0%) |
| 3 or 4 Children | 32 (100.0%) | 0 (0.0%) |
| 5 or more Children | 0 (0.0%) | 0 (0.0%) |
| Total | 32 (100.0%) | 0 (0.0%) |
Income Below Poverty Among Married-Couple vs Single-Parent Households in Stony Point
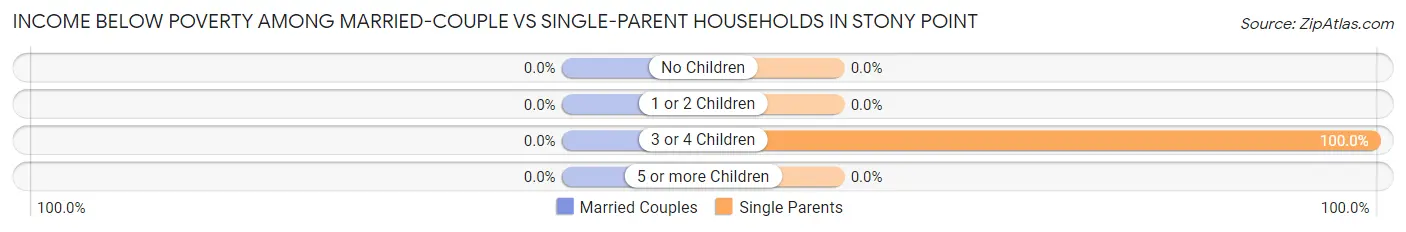
| Children | Married-Couple Families | Single-Parent Households |
| No Children | 0 (0.0%) | 0 (0.0%) |
| 1 or 2 Children | 0 (0.0%) | 0 (0.0%) |
| 3 or 4 Children | 0 (0.0%) | 32 (100.0%) |
| 5 or more Children | 0 (0.0%) | 0 (0.0%) |
| Total | 0 (0.0%) | 32 (33.3%) |
Race in Stony Point
The most populous races in Stony Point are White / Caucasian (1,555 | 82.9%), Black / African American (225 | 12.0%), and Hispanic or Latino (95 | 5.1%).
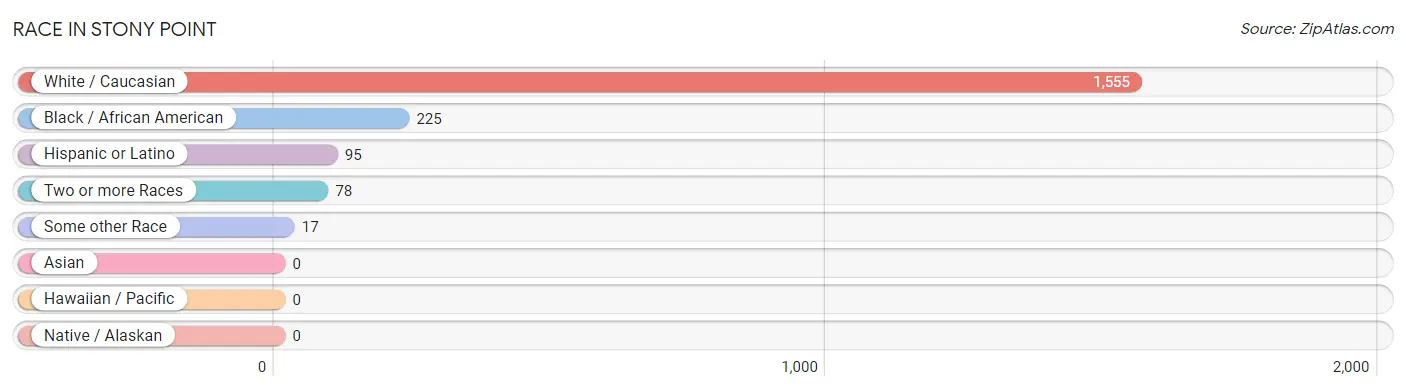
| Race | # Population | % Population |
| Asian | 0 | 0.0% |
| Black / African American | 225 | 12.0% |
| Hawaiian / Pacific | 0 | 0.0% |
| Hispanic or Latino | 95 | 5.1% |
| Native / Alaskan | 0 | 0.0% |
| White / Caucasian | 1,555 | 82.9% |
| Two or more Races | 78 | 4.2% |
| Some other Race | 17 | 0.9% |
| Total | 1,875 | 100.0% |
Ancestry in Stony Point
The most populous ancestries reported in Stony Point are Polish (322 | 17.2%), English (296 | 15.8%), American (260 | 13.9%), Nigerian (225 | 12.0%), and Subsaharan African (225 | 12.0%), together accounting for 70.8% of all Stony Point residents.
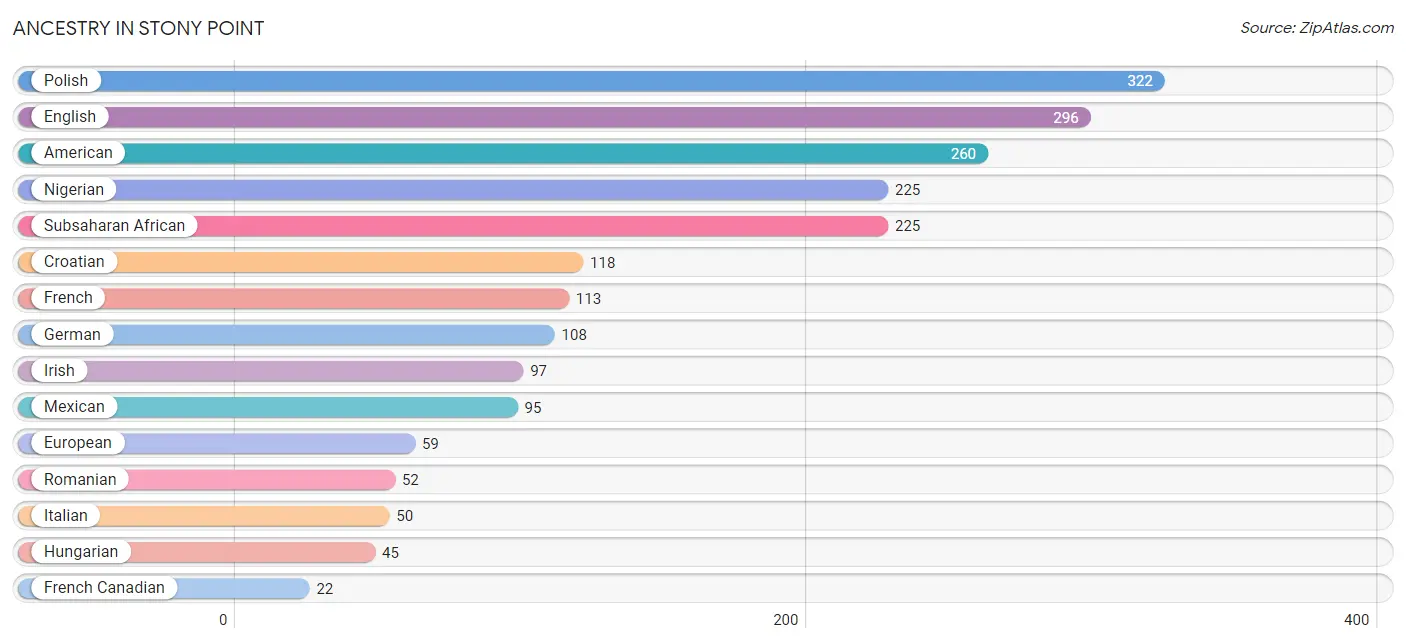
| Ancestry | # Population | % Population |
| American | 260 | 13.9% |
| Belgian | 5 | 0.3% |
| Croatian | 118 | 6.3% |
| English | 296 | 15.8% |
| European | 59 | 3.2% |
| French | 113 | 6.0% |
| French Canadian | 22 | 1.2% |
| German | 108 | 5.8% |
| Greek | 14 | 0.7% |
| Hungarian | 45 | 2.4% |
| Irish | 97 | 5.2% |
| Italian | 50 | 2.7% |
| Mexican | 95 | 5.1% |
| Nigerian | 225 | 12.0% |
| Northern European | 17 | 0.9% |
| Polish | 322 | 17.2% |
| Romanian | 52 | 2.8% |
| Slovak | 9 | 0.5% |
| Subsaharan African | 225 | 12.0% | View All 19 Rows |
Immigrants in Stony Point
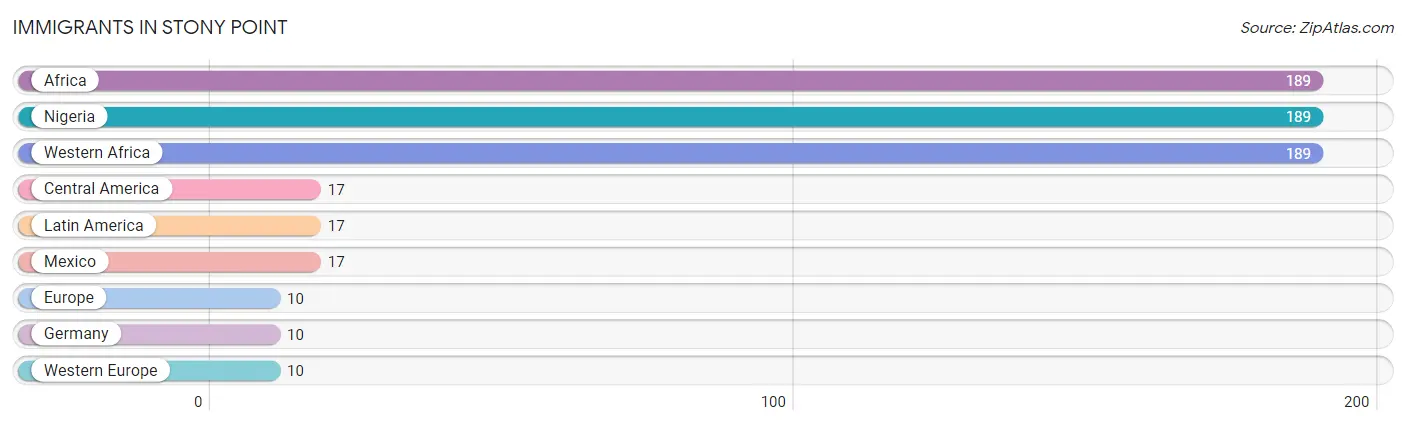
The most numerous immigrant groups reported in Stony Point came from Africa (189 | 10.1%), Nigeria (189 | 10.1%), Western Africa (189 | 10.1%), Central America (17 | 0.9%), and Latin America (17 | 0.9%), together accounting for 32.1% of all Stony Point residents.
| Immigration Origin | # Population | % Population |
| Africa | 189 | 10.1% |
| Central America | 17 | 0.9% |
| Europe | 10 | 0.5% |
| Germany | 10 | 0.5% |
| Latin America | 17 | 0.9% |
| Mexico | 17 | 0.9% |
| Nigeria | 189 | 10.1% |
| Western Africa | 189 | 10.1% |
| Western Europe | 10 | 0.5% | View All 9 Rows |
Sex and Age in Stony Point
Sex and Age in Stony Point
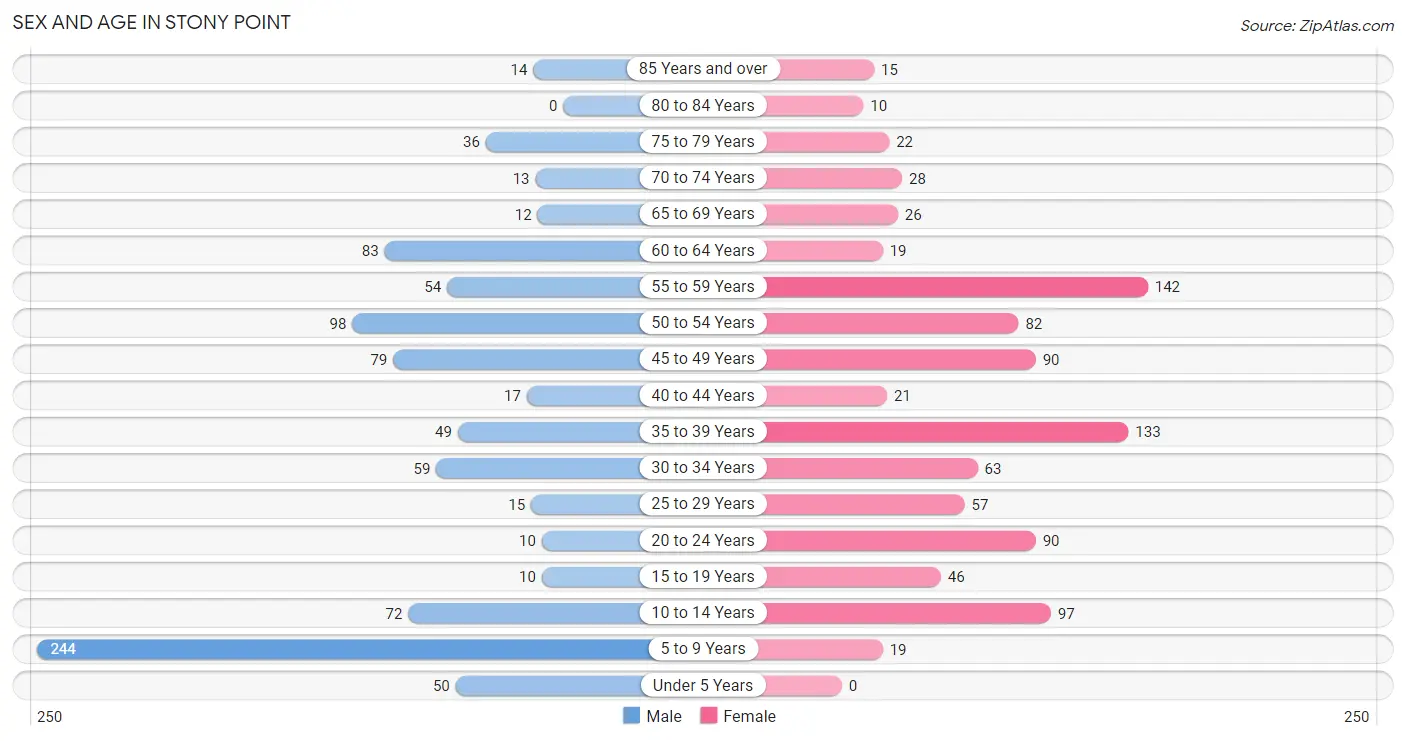
The most populous age groups in Stony Point are 5 to 9 Years (244 | 26.7%) for men and 55 to 59 Years (142 | 14.8%) for women.
| Age Bracket | Male | Female |
| Under 5 Years | 50 (5.5%) | 0 (0.0%) |
| 5 to 9 Years | 244 (26.7%) | 19 (2.0%) |
| 10 to 14 Years | 72 (7.9%) | 97 (10.1%) |
| 15 to 19 Years | 10 (1.1%) | 46 (4.8%) |
| 20 to 24 Years | 10 (1.1%) | 90 (9.4%) |
| 25 to 29 Years | 15 (1.6%) | 57 (5.9%) |
| 30 to 34 Years | 59 (6.5%) | 63 (6.6%) |
| 35 to 39 Years | 49 (5.4%) | 133 (13.9%) |
| 40 to 44 Years | 17 (1.9%) | 21 (2.2%) |
| 45 to 49 Years | 79 (8.6%) | 90 (9.4%) |
| 50 to 54 Years | 98 (10.7%) | 82 (8.5%) |
| 55 to 59 Years | 54 (5.9%) | 142 (14.8%) |
| 60 to 64 Years | 83 (9.1%) | 19 (2.0%) |
| 65 to 69 Years | 12 (1.3%) | 26 (2.7%) |
| 70 to 74 Years | 13 (1.4%) | 28 (2.9%) |
| 75 to 79 Years | 36 (3.9%) | 22 (2.3%) |
| 80 to 84 Years | 0 (0.0%) | 10 (1.0%) |
| 85 Years and over | 14 (1.5%) | 15 (1.6%) |
| Total | 915 (100.0%) | 960 (100.0%) |
Families and Households in Stony Point
Median Family Size in Stony Point
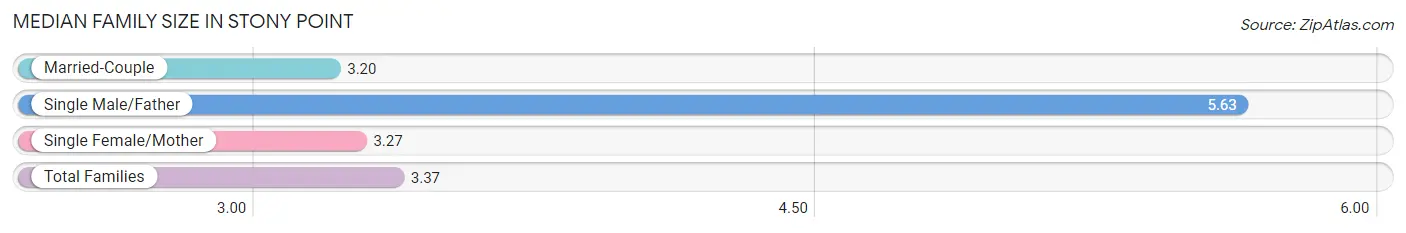
The median family size in Stony Point is 3.37 persons per family, with single male/father families (32 | 6.7%) accounting for the largest median family size of 5.63 persons per family. On the other hand, married-couple families (381 | 79.9%) represent the smallest median family size with 3.20 persons per family.
| Family Type | # Families | Family Size |
| Married-Couple | 381 (79.9%) | 3.20 |
| Single Male/Father | 32 (6.7%) | 5.63 |
| Single Female/Mother | 64 (13.4%) | 3.27 |
| Total Families | 477 (100.0%) | 3.37 |
Median Household Size in Stony Point
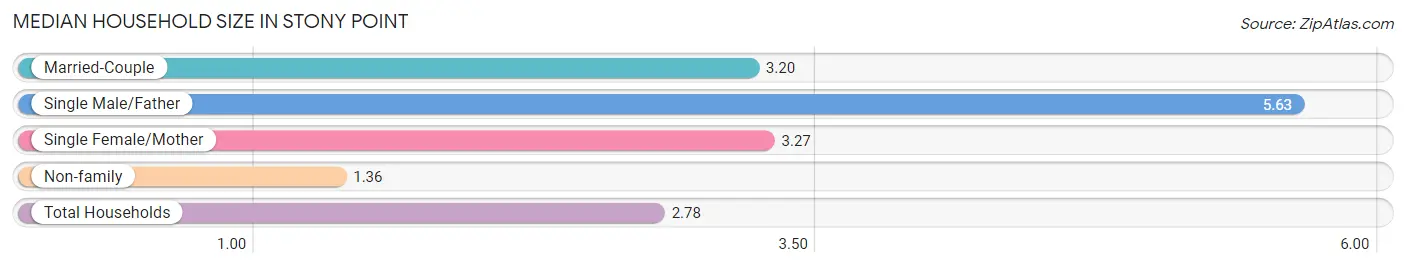
The median household size in Stony Point is 2.78 persons per household, with single male/father households (32 | 4.8%) accounting for the largest median household size of 5.63 persons per household. non-family households (197 | 29.2%) represent the smallest median household size with 1.36 persons per household.
| Household Type | # Households | Household Size |
| Married-Couple | 381 (56.5%) | 3.20 |
| Single Male/Father | 32 (4.8%) | 5.63 |
| Single Female/Mother | 64 (9.5%) | 3.27 |
| Non-family | 197 (29.2%) | 1.36 |
| Total Households | 674 (100.0%) | 2.78 |
Household Size by Marriage Status in Stony Point
Out of a total of 674 households in Stony Point, 477 (70.8%) are family households, while 197 (29.2%) are nonfamily households. The most numerous type of family households are 2-person households, comprising 204, and the most common type of nonfamily households are 1-person households, comprising 145.
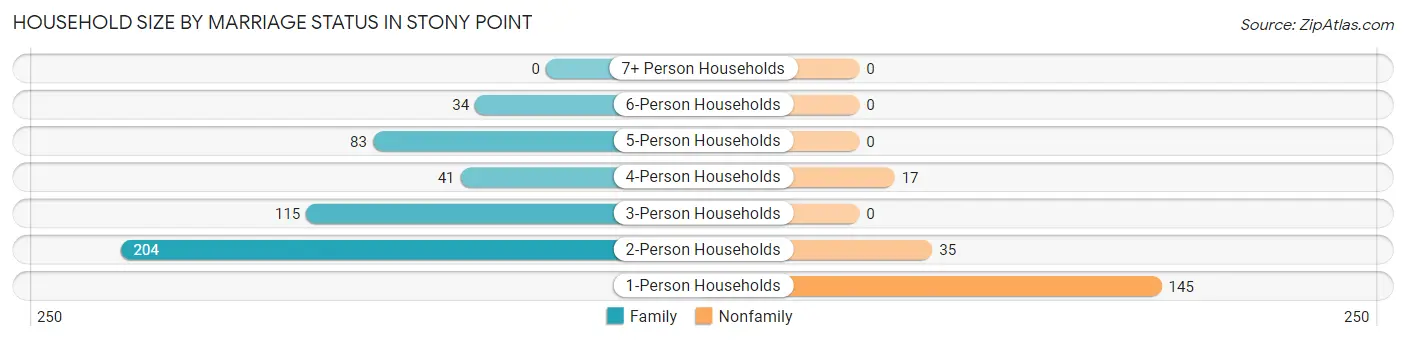
| Household Size | Family Households | Nonfamily Households |
| 1-Person Households | - | 145 (21.5%) |
| 2-Person Households | 204 (30.3%) | 35 (5.2%) |
| 3-Person Households | 115 (17.1%) | 0 (0.0%) |
| 4-Person Households | 41 (6.1%) | 17 (2.5%) |
| 5-Person Households | 83 (12.3%) | 0 (0.0%) |
| 6-Person Households | 34 (5.0%) | 0 (0.0%) |
| 7+ Person Households | 0 (0.0%) | 0 (0.0%) |
| Total | 477 (70.8%) | 197 (29.2%) |
Female Fertility in Stony Point
Fertility by Age in Stony Point
Average fertility rate in Stony Point is 122.0 births per 1,000 women. Women in the age bracket of 35 to 50 years have the highest fertility rate with 250.0 births per 1,000 women. Women in the age bracket of 35 to 50 years acount for 100.0% of all women with births.
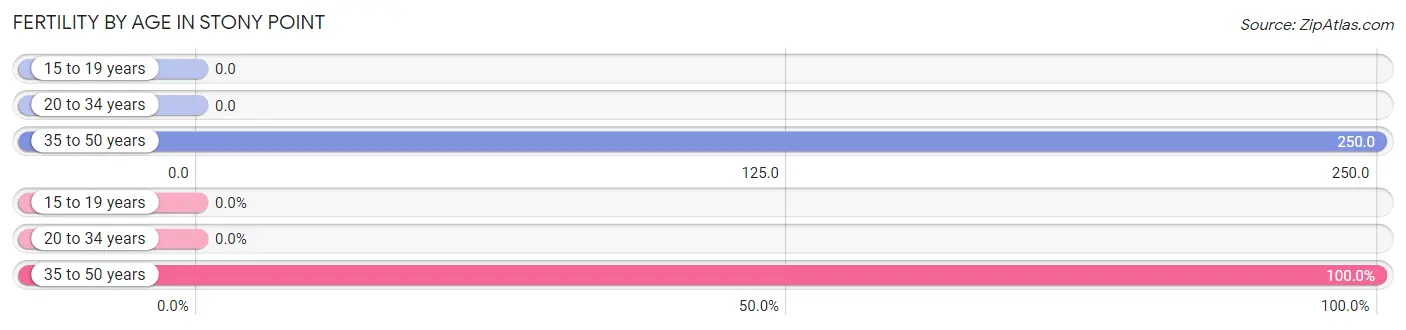
| Age Bracket | Women with Births | Births / 1,000 Women |
| 15 to 19 years | 0 (0.0%) | 0.0 |
| 20 to 34 years | 0 (0.0%) | 0.0 |
| 35 to 50 years | 61 (100.0%) | 250.0 |
| Total | 61 (100.0%) | 122.0 |
Fertility by Age by Marriage Status in Stony Point
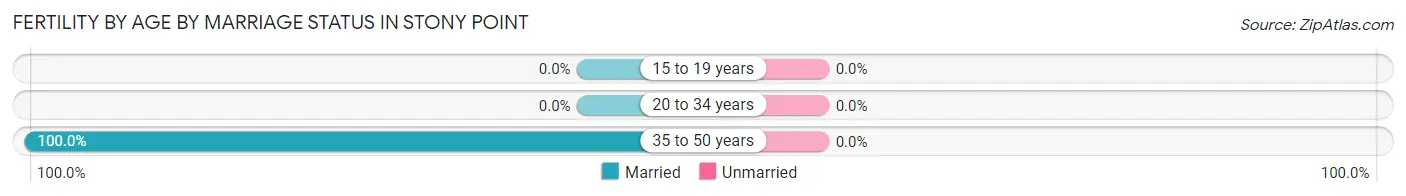
| Age Bracket | Married | Unmarried |
| 15 to 19 years | 0 (0.0%) | 0 (0.0%) |
| 20 to 34 years | 0 (0.0%) | 0 (0.0%) |
| 35 to 50 years | 61 (100.0%) | 0 (0.0%) |
| Total | 61 (100.0%) | 0 (0.0%) |
Fertility by Education in Stony Point
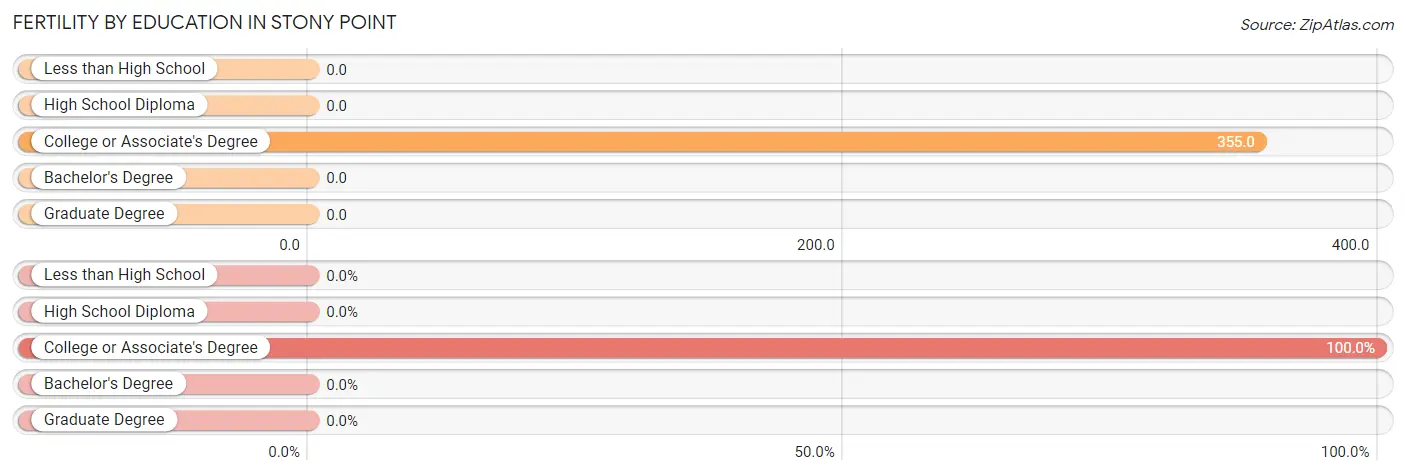
| Educational Attainment | Women with Births | Births / 1,000 Women |
| Less than High School | 0 (0.0%) | 0.0 |
| High School Diploma | 0 (0.0%) | 0.0 |
| College or Associate's Degree | 61 (100.0%) | 355.0 |
| Bachelor's Degree | 0 (0.0%) | 0.0 |
| Graduate Degree | 0 (0.0%) | 0.0 |
| Total | 61 (100.0%) | 122.0 |
Fertility by Education by Marriage Status in Stony Point
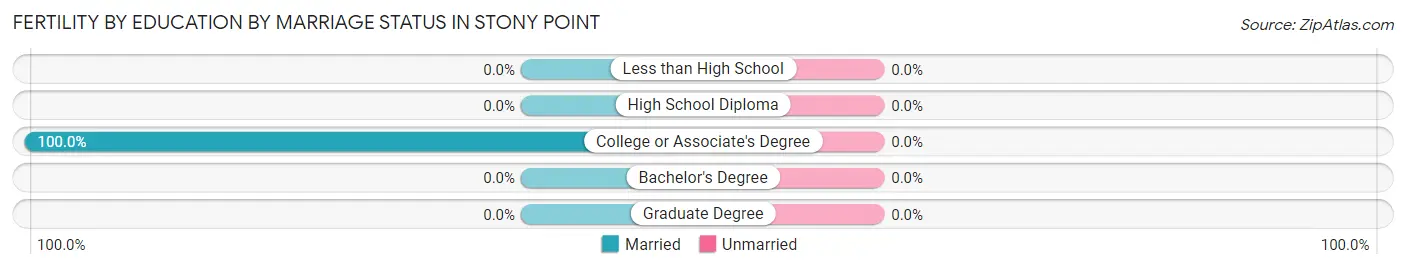
| Educational Attainment | Married | Unmarried |
| Less than High School | 0 (0.0%) | 0 (0.0%) |
| High School Diploma | 0 (0.0%) | 0 (0.0%) |
| College or Associate's Degree | 61 (100.0%) | 0 (0.0%) |
| Bachelor's Degree | 0 (0.0%) | 0 (0.0%) |
| Graduate Degree | 0 (0.0%) | 0 (0.0%) |
| Total | 61 (100.0%) | 0 (0.0%) |
Employment Characteristics in Stony Point
Employment by Class of Employer in Stony Point
Among the 742 employed individuals in Stony Point, private company employees (624 | 84.1%), not-for-profit organizations (58 | 7.8%), and local government employees (30 | 4.0%) make up the most common classes of employment.
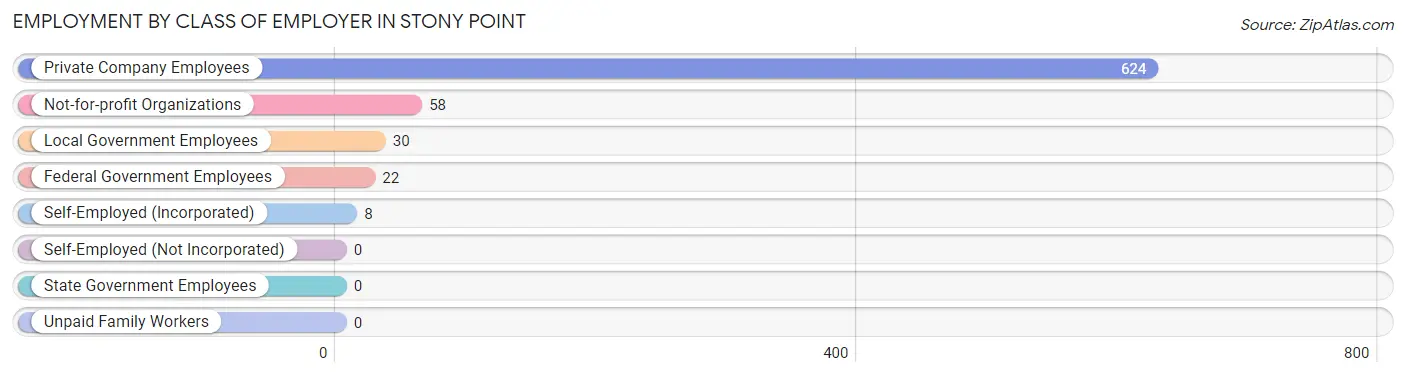
| Employer Class | # Employees | % Employees |
| Private Company Employees | 624 | 84.1% |
| Self-Employed (Incorporated) | 8 | 1.1% |
| Self-Employed (Not Incorporated) | 0 | 0.0% |
| Not-for-profit Organizations | 58 | 7.8% |
| Local Government Employees | 30 | 4.0% |
| State Government Employees | 0 | 0.0% |
| Federal Government Employees | 22 | 3.0% |
| Unpaid Family Workers | 0 | 0.0% |
| Total | 742 | 100.0% |
Employment Status by Age in Stony Point
According to the labor force statistics for Stony Point, out of the total population over 16 years of age (1,358), 59.9% or 813 individuals are in the labor force, with 6.8% or 55 of them unemployed. The age group with the highest labor force participation rate is 25 to 29 years, with 100.0% or 72 individuals in the labor force. Within the labor force, the 20 to 24 years age range has the highest percentage of unemployed individuals, with 50.0% or 10 of them being unemployed.
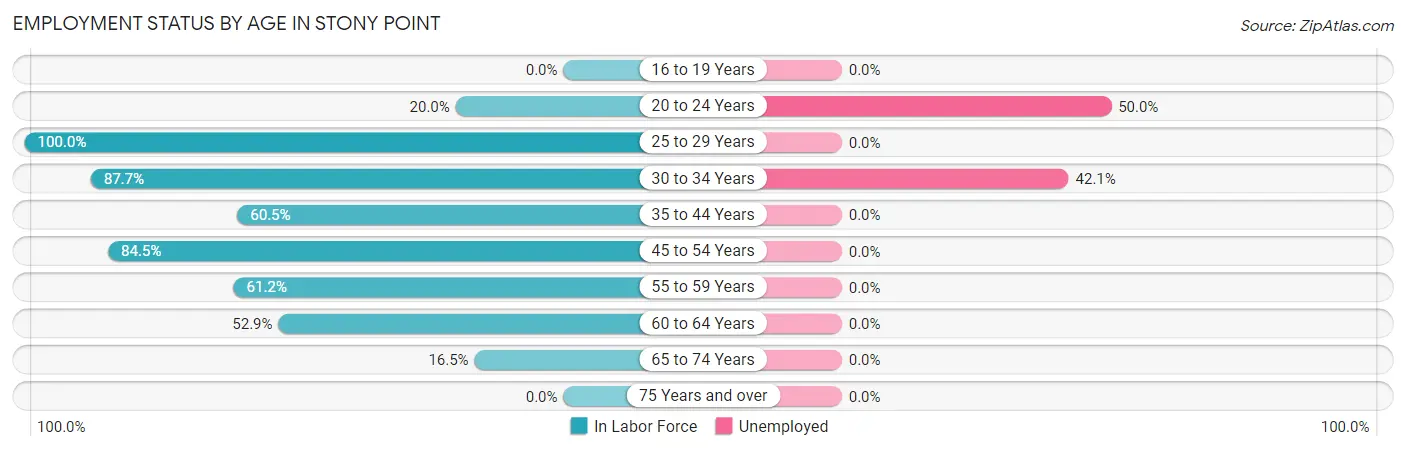
| Age Bracket | In Labor Force | Unemployed |
| 16 to 19 Years | 0 (0.0%) | 0 (0.0%) |
| 20 to 24 Years | 20 (20.0%) | 10 (50.0%) |
| 25 to 29 Years | 72 (100.0%) | 0 (0.0%) |
| 30 to 34 Years | 107 (87.7%) | 45 (42.1%) |
| 35 to 44 Years | 133 (60.5%) | 0 (0.0%) |
| 45 to 54 Years | 295 (84.5%) | 0 (0.0%) |
| 55 to 59 Years | 120 (61.2%) | 0 (0.0%) |
| 60 to 64 Years | 54 (52.9%) | 0 (0.0%) |
| 65 to 74 Years | 13 (16.5%) | 0 (0.0%) |
| 75 Years and over | 0 (0.0%) | 0 (0.0%) |
| Total | 813 (59.9%) | 55 (6.8%) |
Employment Status by Educational Attainment in Stony Point
According to labor force statistics for Stony Point, 73.6% of individuals (781) out of the total population between 25 and 64 years of age (1,061) are in the labor force, with 5.8% or 45 of them being unemployed. The group with the highest labor force participation rate are those with the educational attainment of high school diploma, with 84.7% or 355 individuals in the labor force. Within the labor force, individuals with high school diploma education have the highest percentage of unemployment, with 12.7% or 45 of them being unemployed.
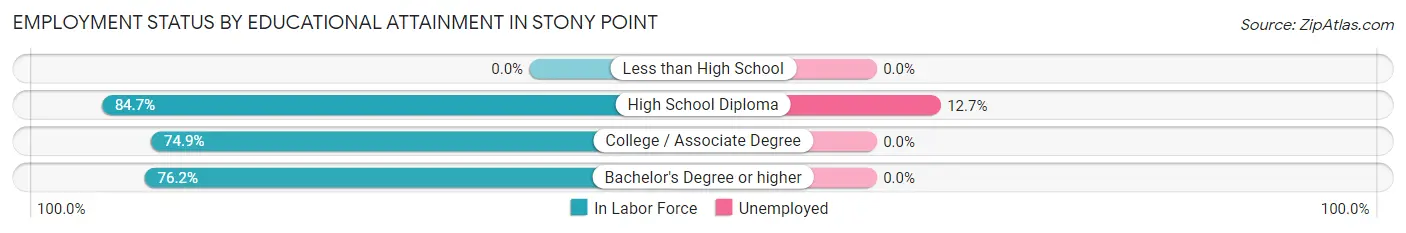
| Educational Attainment | In Labor Force | Unemployed |
| Less than High School | 0 (0.0%) | 0 (0.0%) |
| High School Diploma | 355 (84.7%) | 53 (12.7%) |
| College / Associate Degree | 314 (74.9%) | 0 (0.0%) |
| Bachelor's Degree or higher | 112 (76.2%) | 0 (0.0%) |
| Total | 781 (73.6%) | 62 (5.8%) |
Employment Occupations by Sex in Stony Point
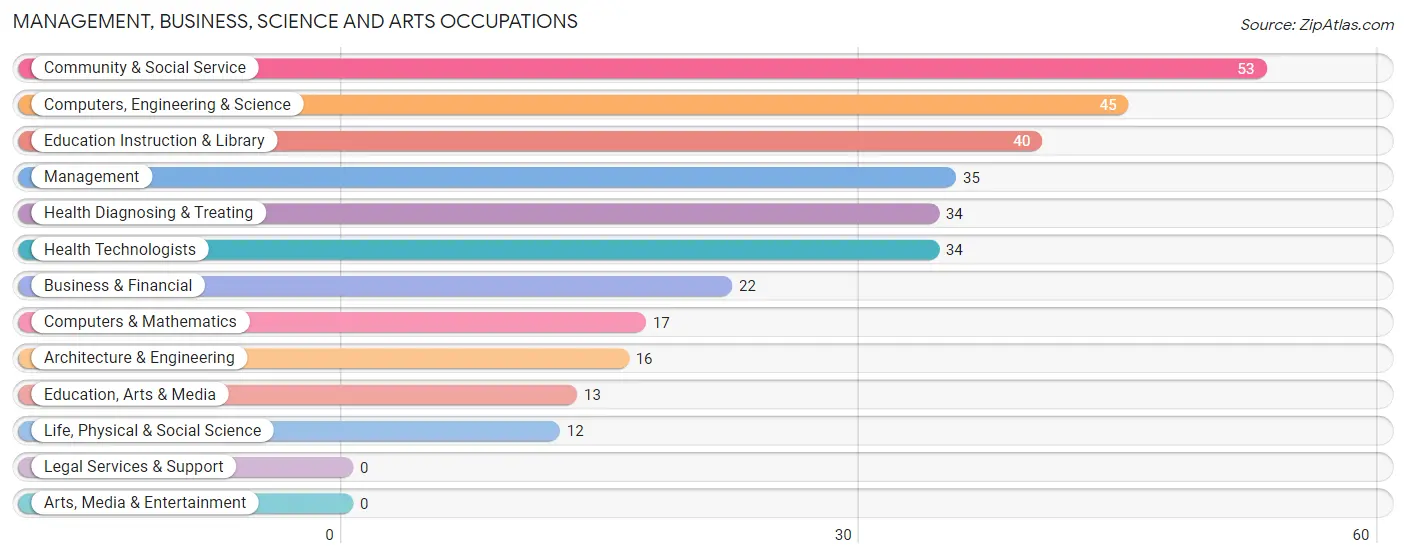
Management, Business, Science and Arts Occupations
The most common Management, Business, Science and Arts occupations in Stony Point are Community & Social Service (53 | 7.0%), Computers, Engineering & Science (45 | 5.9%), Education Instruction & Library (40 | 5.3%), Management (35 | 4.6%), and Health Diagnosing & Treating (34 | 4.5%).
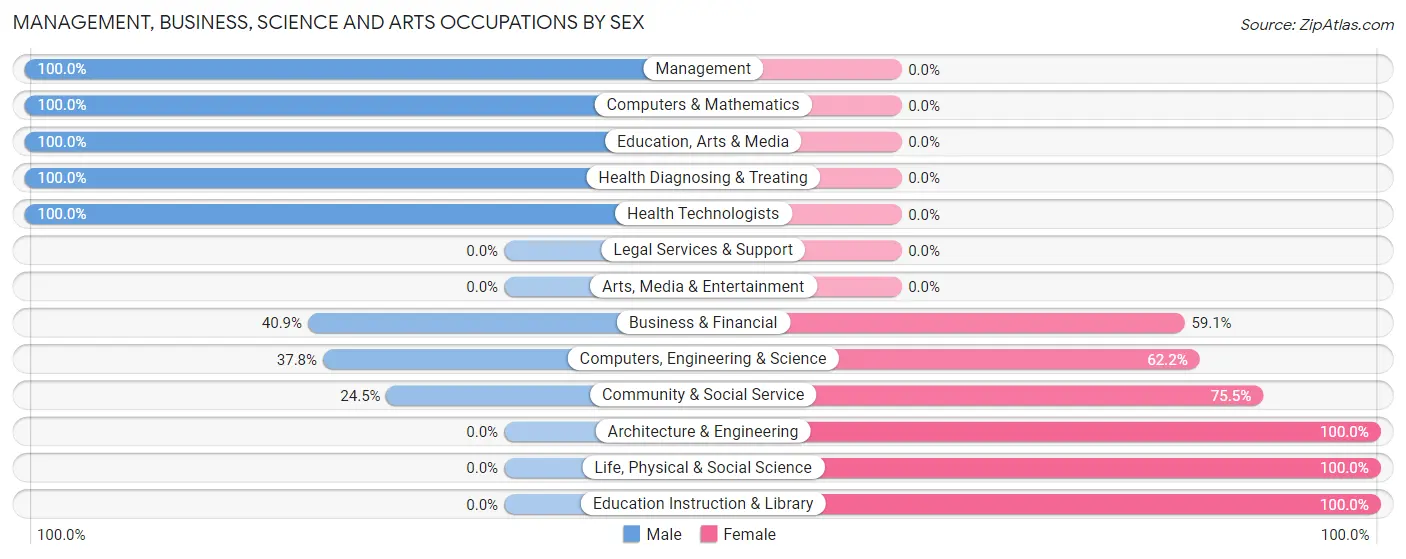
Management, Business, Science and Arts Occupations by Sex
Within the Management, Business, Science and Arts occupations in Stony Point, the most male-oriented occupations are Management (100.0%), Computers & Mathematics (100.0%), and Education, Arts & Media (100.0%), while the most female-oriented occupations are Architecture & Engineering (100.0%), Life, Physical & Social Science (100.0%), and Education Instruction & Library (100.0%).
| Occupation | Male | Female |
| Management | 35 (100.0%) | 0 (0.0%) |
| Business & Financial | 9 (40.9%) | 13 (59.1%) |
| Computers, Engineering & Science | 17 (37.8%) | 28 (62.2%) |
| Computers & Mathematics | 17 (100.0%) | 0 (0.0%) |
| Architecture & Engineering | 0 (0.0%) | 16 (100.0%) |
| Life, Physical & Social Science | 0 (0.0%) | 12 (100.0%) |
| Community & Social Service | 13 (24.5%) | 40 (75.5%) |
| Education, Arts & Media | 13 (100.0%) | 0 (0.0%) |
| Legal Services & Support | 0 (0.0%) | 0 (0.0%) |
| Education Instruction & Library | 0 (0.0%) | 40 (100.0%) |
| Arts, Media & Entertainment | 0 (0.0%) | 0 (0.0%) |
| Health Diagnosing & Treating | 34 (100.0%) | 0 (0.0%) |
| Health Technologists | 34 (100.0%) | 0 (0.0%) |
| Total (Category) | 108 (57.1%) | 81 (42.9%) |
| Total (Overall) | 327 (43.1%) | 432 (56.9%) |
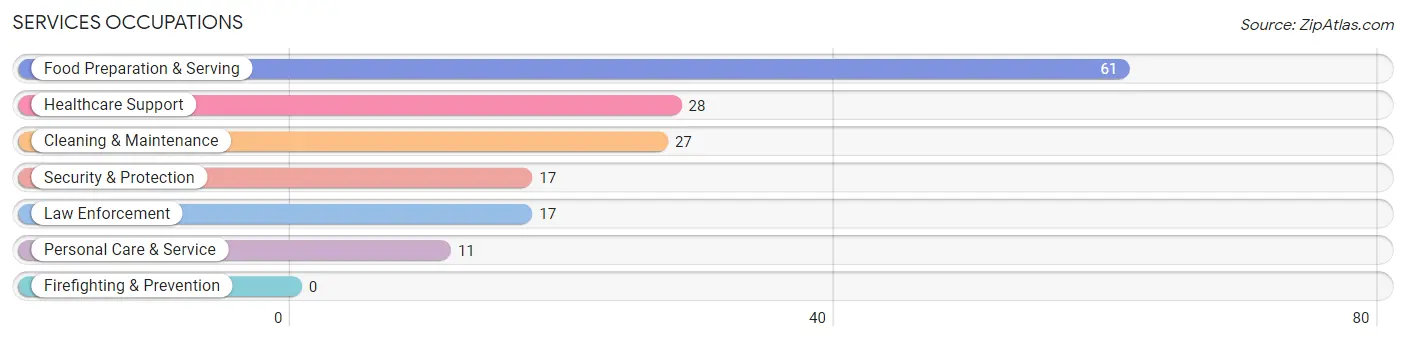
Services Occupations
The most common Services occupations in Stony Point are Food Preparation & Serving (61 | 8.0%), Healthcare Support (28 | 3.7%), Cleaning & Maintenance (27 | 3.6%), Security & Protection (17 | 2.2%), and Law Enforcement (17 | 2.2%).
Services Occupations by Sex
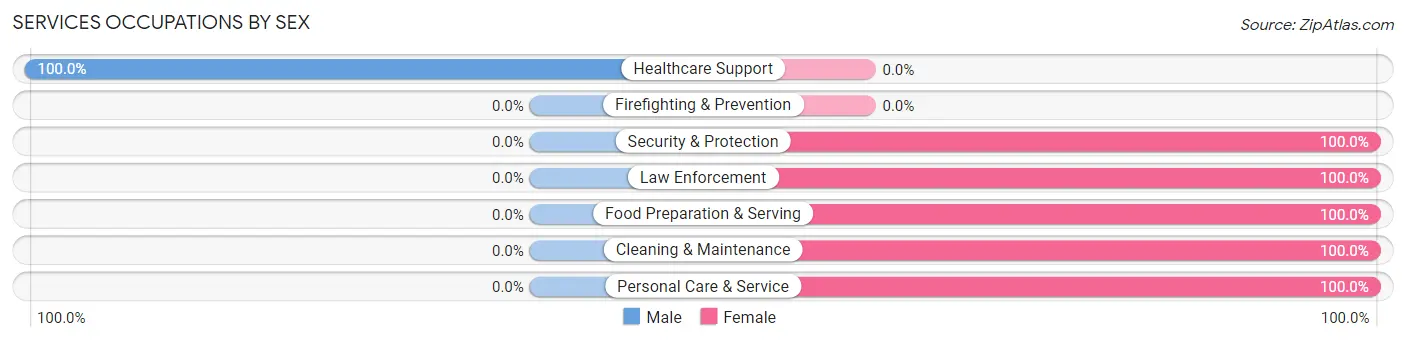
| Occupation | Male | Female |
| Healthcare Support | 28 (100.0%) | 0 (0.0%) |
| Security & Protection | 0 (0.0%) | 17 (100.0%) |
| Firefighting & Prevention | 0 (0.0%) | 0 (0.0%) |
| Law Enforcement | 0 (0.0%) | 17 (100.0%) |
| Food Preparation & Serving | 0 (0.0%) | 61 (100.0%) |
| Cleaning & Maintenance | 0 (0.0%) | 27 (100.0%) |
| Personal Care & Service | 0 (0.0%) | 11 (100.0%) |
| Total (Category) | 28 (19.4%) | 116 (80.6%) |
| Total (Overall) | 327 (43.1%) | 432 (56.9%) |
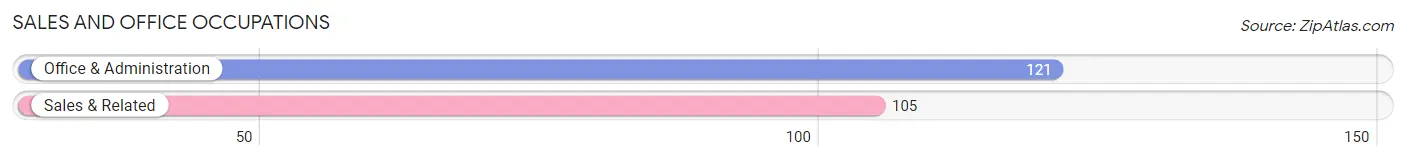
Sales and Office Occupations
The most common Sales and Office occupations in Stony Point are Office & Administration (121 | 15.9%), and Sales & Related (105 | 13.8%).
Sales and Office Occupations by Sex
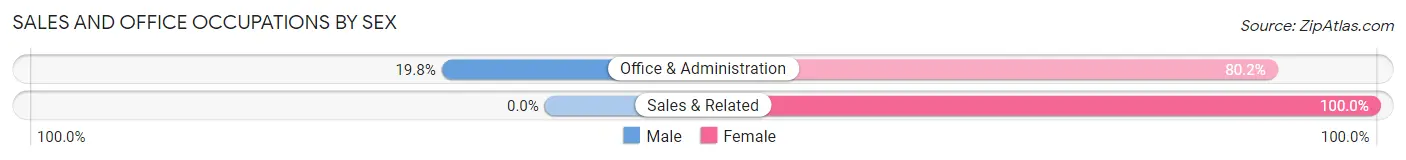
| Occupation | Male | Female |
| Sales & Related | 0 (0.0%) | 105 (100.0%) |
| Office & Administration | 24 (19.8%) | 97 (80.2%) |
| Total (Category) | 24 (10.6%) | 202 (89.4%) |
| Total (Overall) | 327 (43.1%) | 432 (56.9%) |
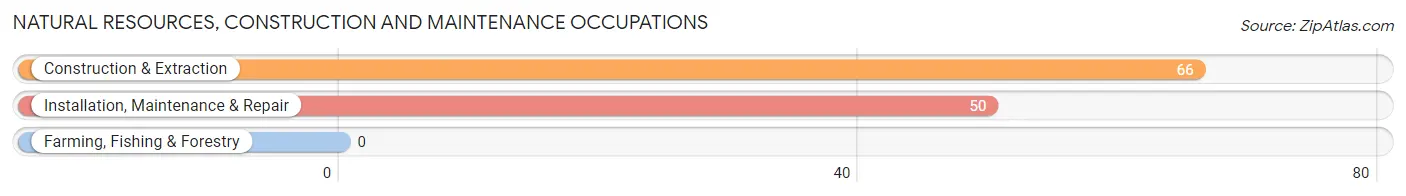
Natural Resources, Construction and Maintenance Occupations
The most common Natural Resources, Construction and Maintenance occupations in Stony Point are Construction & Extraction (66 | 8.7%), and Installation, Maintenance & Repair (50 | 6.6%).
Natural Resources, Construction and Maintenance Occupations by Sex
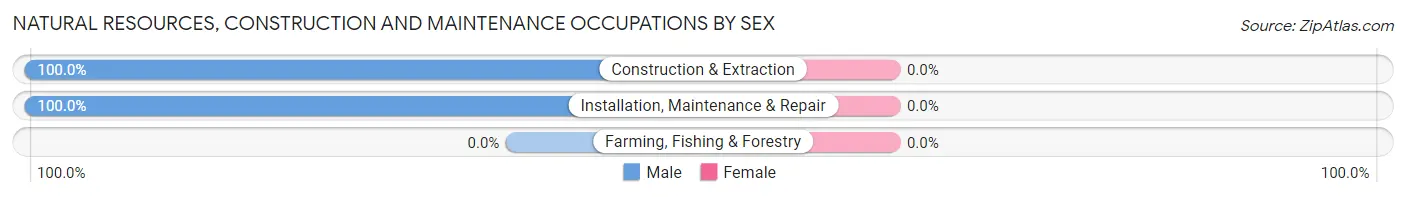
| Occupation | Male | Female |
| Farming, Fishing & Forestry | 0 (0.0%) | 0 (0.0%) |
| Construction & Extraction | 66 (100.0%) | 0 (0.0%) |
| Installation, Maintenance & Repair | 50 (100.0%) | 0 (0.0%) |
| Total (Category) | 116 (100.0%) | 0 (0.0%) |
| Total (Overall) | 327 (43.1%) | 432 (56.9%) |
Production, Transportation and Moving Occupations
The most common Production, Transportation and Moving occupations in Stony Point are Production (71 | 9.3%), and Transportation (13 | 1.7%).
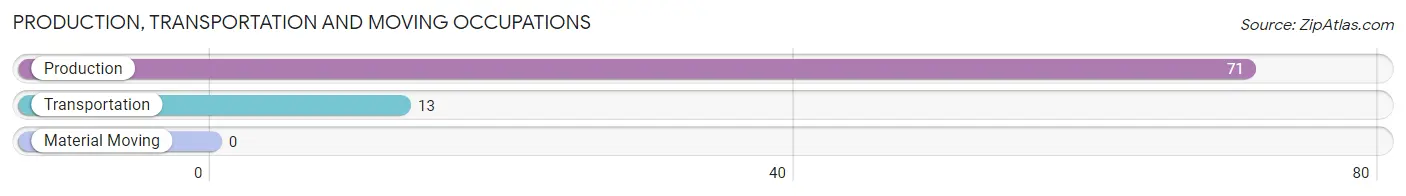
Production, Transportation and Moving Occupations by Sex
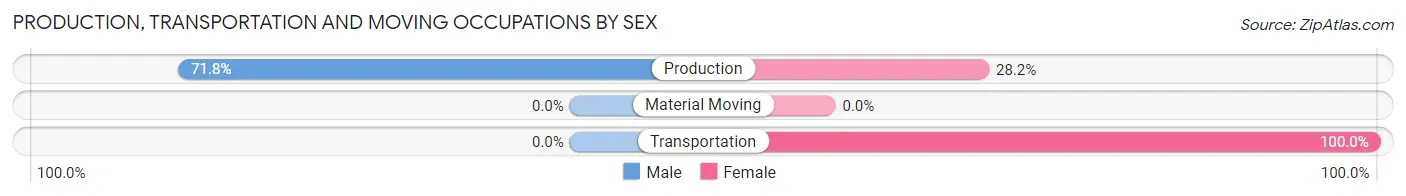
| Occupation | Male | Female |
| Production | 51 (71.8%) | 20 (28.2%) |
| Transportation | 0 (0.0%) | 13 (100.0%) |
| Material Moving | 0 (0.0%) | 0 (0.0%) |
| Total (Category) | 51 (60.7%) | 33 (39.3%) |
| Total (Overall) | 327 (43.1%) | 432 (56.9%) |
Employment Industries by Sex in Stony Point
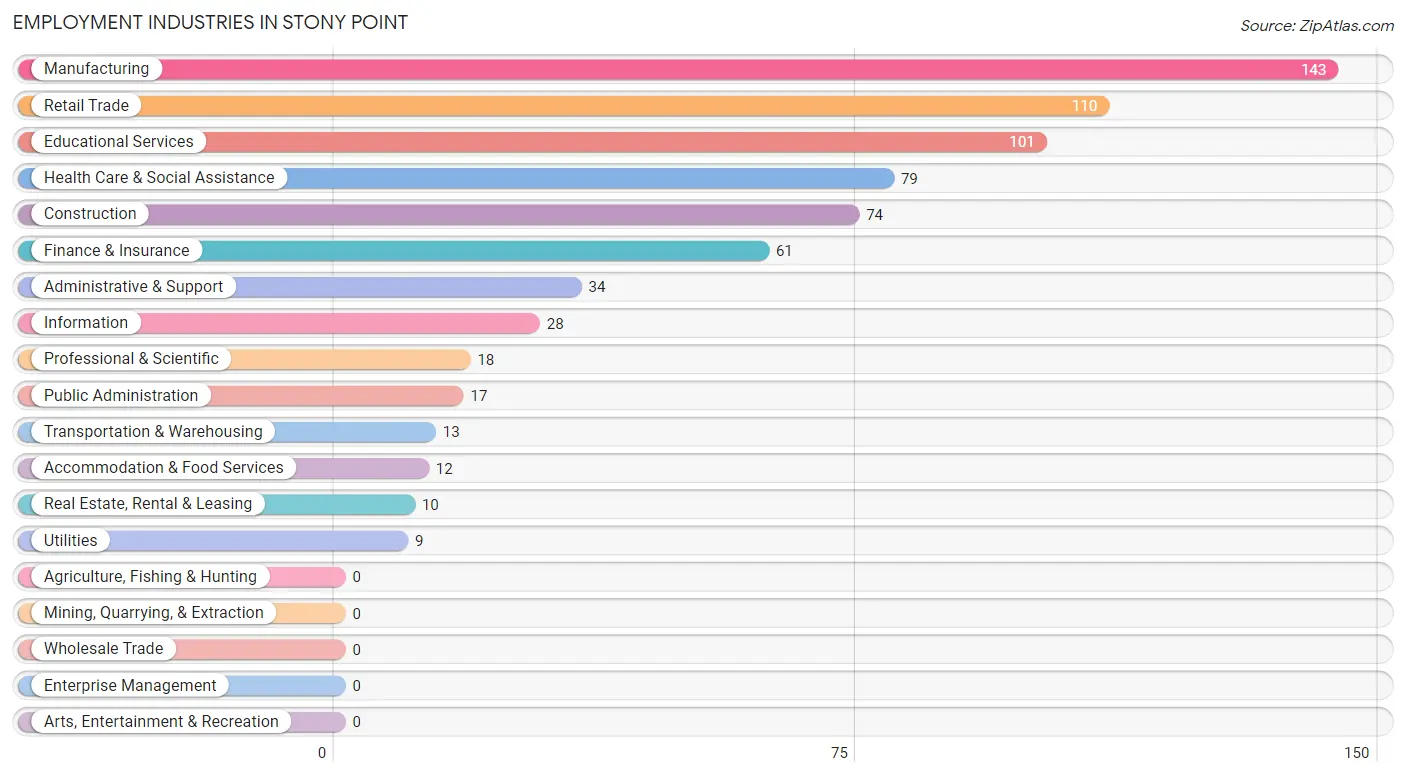
Employment Industries in Stony Point
The major employment industries in Stony Point include Manufacturing (143 | 18.8%), Retail Trade (110 | 14.5%), Educational Services (101 | 13.3%), Health Care & Social Assistance (79 | 10.4%), and Construction (74 | 9.8%).
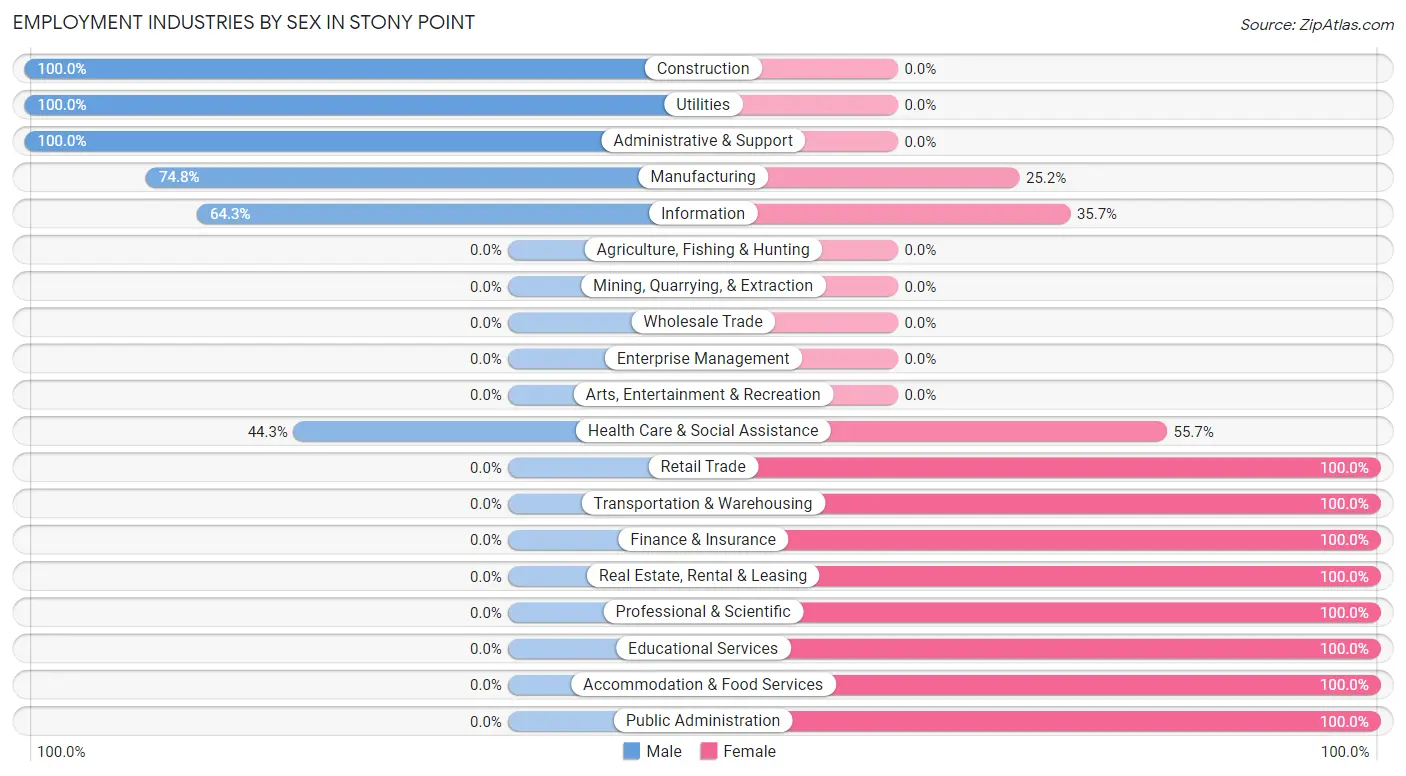
Employment Industries by Sex in Stony Point
The Stony Point industries that see more men than women are Construction (100.0%), Utilities (100.0%), and Administrative & Support (100.0%), whereas the industries that tend to have a higher number of women are Retail Trade (100.0%), Transportation & Warehousing (100.0%), and Finance & Insurance (100.0%).
| Industry | Male | Female |
| Agriculture, Fishing & Hunting | 0 (0.0%) | 0 (0.0%) |
| Mining, Quarrying, & Extraction | 0 (0.0%) | 0 (0.0%) |
| Construction | 74 (100.0%) | 0 (0.0%) |
| Manufacturing | 107 (74.8%) | 36 (25.2%) |
| Wholesale Trade | 0 (0.0%) | 0 (0.0%) |
| Retail Trade | 0 (0.0%) | 110 (100.0%) |
| Transportation & Warehousing | 0 (0.0%) | 13 (100.0%) |
| Utilities | 9 (100.0%) | 0 (0.0%) |
| Information | 18 (64.3%) | 10 (35.7%) |
| Finance & Insurance | 0 (0.0%) | 61 (100.0%) |
| Real Estate, Rental & Leasing | 0 (0.0%) | 10 (100.0%) |
| Professional & Scientific | 0 (0.0%) | 18 (100.0%) |
| Enterprise Management | 0 (0.0%) | 0 (0.0%) |
| Administrative & Support | 34 (100.0%) | 0 (0.0%) |
| Educational Services | 0 (0.0%) | 101 (100.0%) |
| Health Care & Social Assistance | 35 (44.3%) | 44 (55.7%) |
| Arts, Entertainment & Recreation | 0 (0.0%) | 0 (0.0%) |
| Accommodation & Food Services | 0 (0.0%) | 12 (100.0%) |
| Public Administration | 0 (0.0%) | 17 (100.0%) |
| Total | 327 (43.1%) | 432 (56.9%) |
Education in Stony Point
School Enrollment in Stony Point
The most common levels of schooling among the 529 students in Stony Point are college / undergraduate (149 | 28.2%), middle school (147 | 27.8%), and kindergarten (61 | 11.5%).
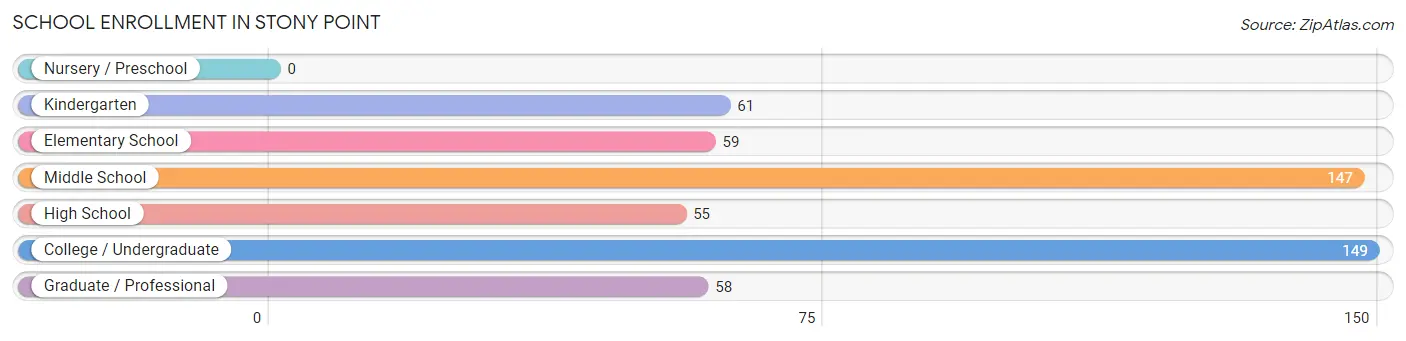
| School Level | # Students | % Students |
| Nursery / Preschool | 0 | 0.0% |
| Kindergarten | 61 | 11.5% |
| Elementary School | 59 | 11.2% |
| Middle School | 147 | 27.8% |
| High School | 55 | 10.4% |
| College / Undergraduate | 149 | 28.2% |
| Graduate / Professional | 58 | 11.0% |
| Total | 529 | 100.0% |
School Enrollment by Age by Funding Source in Stony Point
Out of a total of 529 students who are enrolled in schools in Stony Point, 116 (21.9%) attend a private institution, while the remaining 413 (78.1%) are enrolled in public schools. The age group of 35 years and over has the highest likelihood of being enrolled in private schools, with 95 (100.0% in the age bracket) enrolled. Conversely, the age group of 15 to 17 year olds has the lowest likelihood of being enrolled in a private school, with 46 (100.0% in the age bracket) attending a public institution.
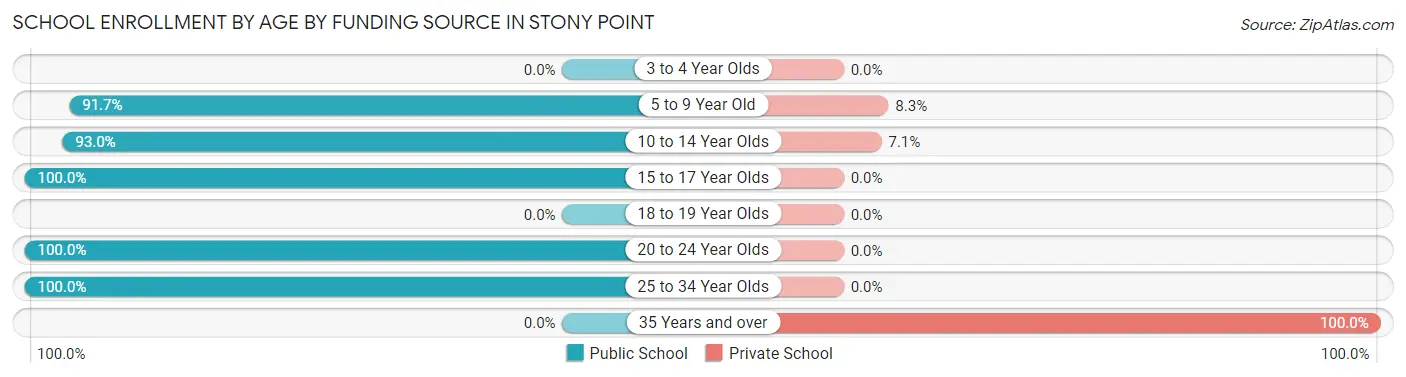
| Age Bracket | Public School | Private School |
| 3 to 4 Year Olds | 0 (0.0%) | 0 (0.0%) |
| 5 to 9 Year Old | 110 (91.7%) | 10 (8.3%) |
| 10 to 14 Year Olds | 145 (92.9%) | 11 (7.0%) |
| 15 to 17 Year Olds | 46 (100.0%) | 0 (0.0%) |
| 18 to 19 Year Olds | 0 (0.0%) | 0 (0.0%) |
| 20 to 24 Year Olds | 80 (100.0%) | 0 (0.0%) |
| 25 to 34 Year Olds | 32 (100.0%) | 0 (0.0%) |
| 35 Years and over | 0 (0.0%) | 95 (100.0%) |
| Total | 413 (78.1%) | 116 (21.9%) |
Educational Attainment by Field of Study in Stony Point
Education (49 | 26.8%), engineering (31 | 16.9%), communications (27 | 14.7%), business (18 | 9.8%), and liberal arts & history (17 | 9.3%) are the most common fields of study among 183 individuals in Stony Point who have obtained a bachelor's degree or higher.
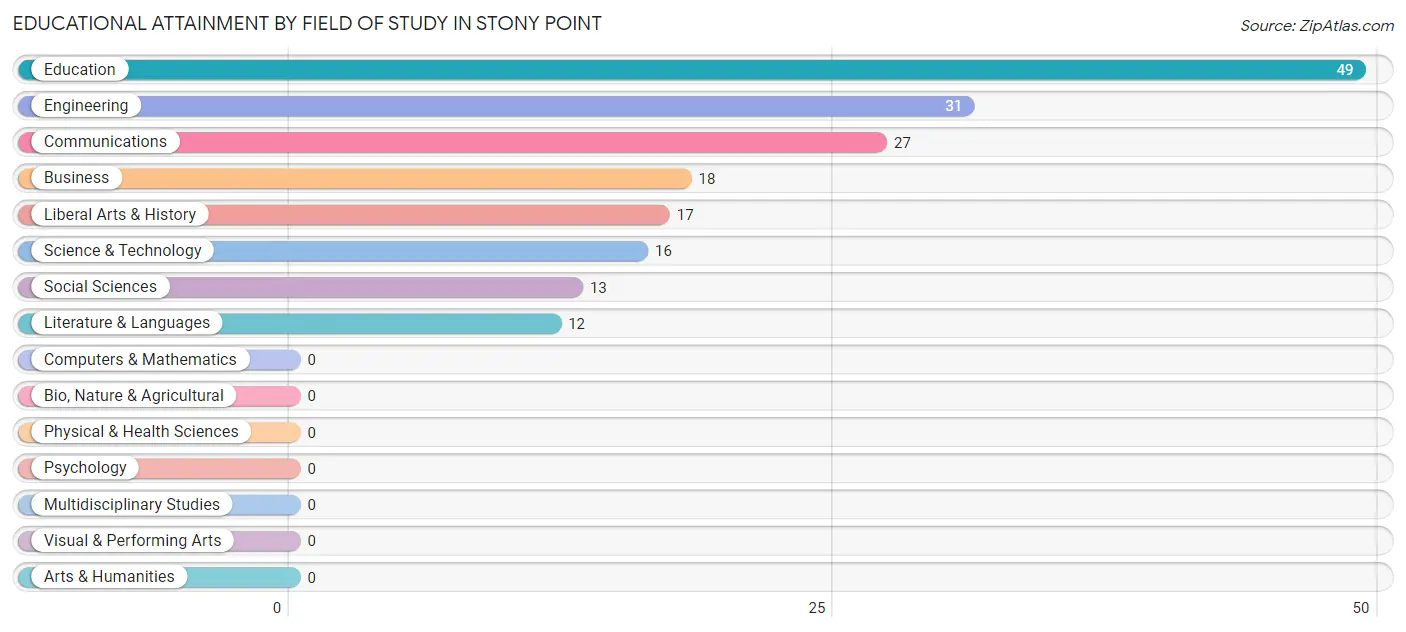
| Field of Study | # Graduates | % Graduates |
| Computers & Mathematics | 0 | 0.0% |
| Bio, Nature & Agricultural | 0 | 0.0% |
| Physical & Health Sciences | 0 | 0.0% |
| Psychology | 0 | 0.0% |
| Social Sciences | 13 | 7.1% |
| Engineering | 31 | 16.9% |
| Multidisciplinary Studies | 0 | 0.0% |
| Science & Technology | 16 | 8.7% |
| Business | 18 | 9.8% |
| Education | 49 | 26.8% |
| Literature & Languages | 12 | 6.6% |
| Liberal Arts & History | 17 | 9.3% |
| Visual & Performing Arts | 0 | 0.0% |
| Communications | 27 | 14.7% |
| Arts & Humanities | 0 | 0.0% |
| Total | 183 | 100.0% |
Transportation & Commute in Stony Point
Vehicle Availability by Sex in Stony Point
The most prevalent vehicle ownership categories in Stony Point are males with 2 vehicles (214, accounting for 65.4%) and females with 2 vehicles (137, making up 51.6%).
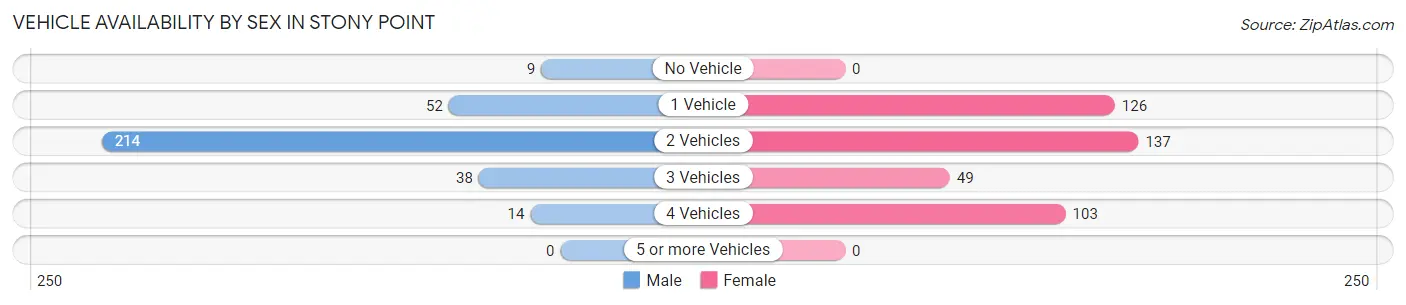
| Vehicles Available | Male | Female |
| No Vehicle | 9 (2.8%) | 0 (0.0%) |
| 1 Vehicle | 52 (15.9%) | 126 (30.4%) |
| 2 Vehicles | 214 (65.4%) | 137 (33.0%) |
| 3 Vehicles | 38 (11.6%) | 49 (11.8%) |
| 4 Vehicles | 14 (4.3%) | 103 (24.8%) |
| 5 or more Vehicles | 0 (0.0%) | 0 (0.0%) |
| Total | 327 (100.0%) | 415 (100.0%) |
Commute Time in Stony Point
The most frequently occuring commute durations in Stony Point are 60 to 89 minutes (158 commuters, 22.7%), 15 to 19 minutes (114 commuters, 16.4%), and 30 to 34 minutes (110 commuters, 15.8%).
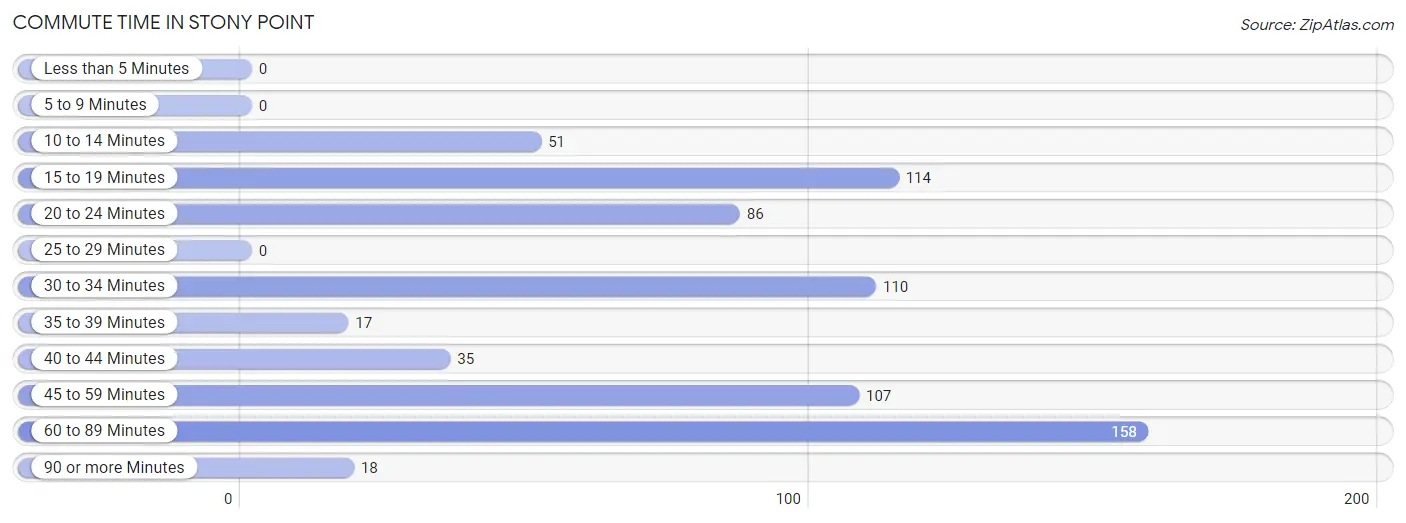
| Commute Time | # Commuters | % Commuters |
| Less than 5 Minutes | 0 | 0.0% |
| 5 to 9 Minutes | 0 | 0.0% |
| 10 to 14 Minutes | 51 | 7.3% |
| 15 to 19 Minutes | 114 | 16.4% |
| 20 to 24 Minutes | 86 | 12.4% |
| 25 to 29 Minutes | 0 | 0.0% |
| 30 to 34 Minutes | 110 | 15.8% |
| 35 to 39 Minutes | 17 | 2.4% |
| 40 to 44 Minutes | 35 | 5.0% |
| 45 to 59 Minutes | 107 | 15.4% |
| 60 to 89 Minutes | 158 | 22.7% |
| 90 or more Minutes | 18 | 2.6% |
Commute Time by Sex in Stony Point
The most common commute times in Stony Point are 45 to 59 minutes (107 commuters, 35.1%) for males and 60 to 89 minutes (158 commuters, 40.4%) for females.
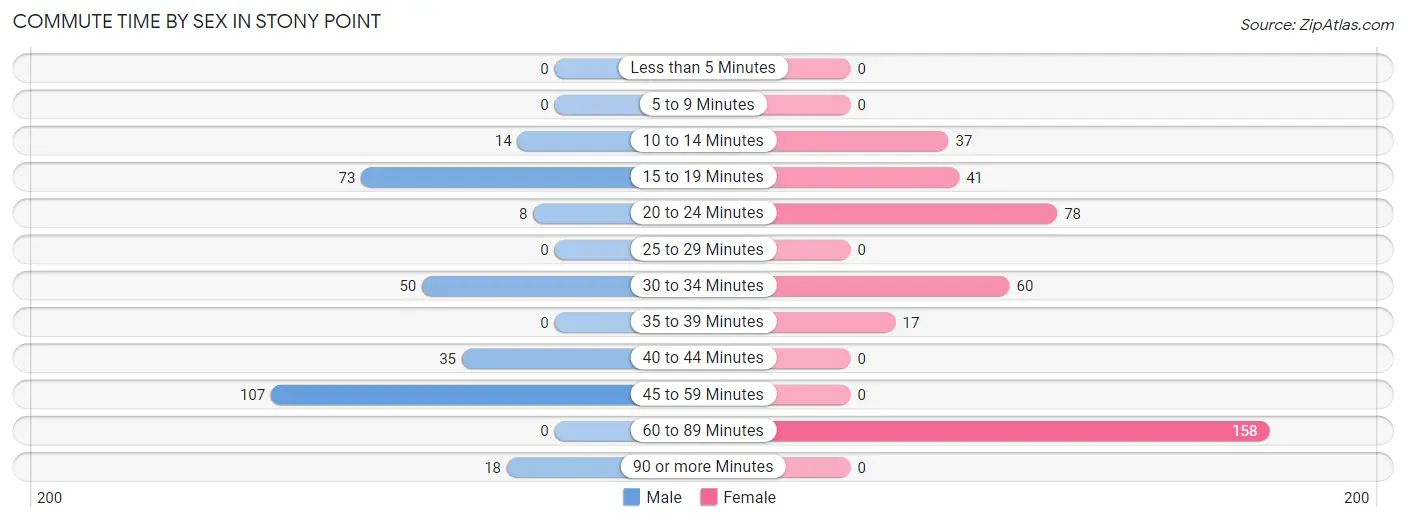
| Commute Time | Male | Female |
| Less than 5 Minutes | 0 (0.0%) | 0 (0.0%) |
| 5 to 9 Minutes | 0 (0.0%) | 0 (0.0%) |
| 10 to 14 Minutes | 14 (4.6%) | 37 (9.5%) |
| 15 to 19 Minutes | 73 (23.9%) | 41 (10.5%) |
| 20 to 24 Minutes | 8 (2.6%) | 78 (20.0%) |
| 25 to 29 Minutes | 0 (0.0%) | 0 (0.0%) |
| 30 to 34 Minutes | 50 (16.4%) | 60 (15.3%) |
| 35 to 39 Minutes | 0 (0.0%) | 17 (4.3%) |
| 40 to 44 Minutes | 35 (11.5%) | 0 (0.0%) |
| 45 to 59 Minutes | 107 (35.1%) | 0 (0.0%) |
| 60 to 89 Minutes | 0 (0.0%) | 158 (40.4%) |
| 90 or more Minutes | 18 (5.9%) | 0 (0.0%) |
Time of Departure to Work by Sex in Stony Point
The most frequent times of departure to work in Stony Point are 4:00 PM to 11:59 PM (84, 27.5%) for males and 9:00 AM to 9:59 AM (87, 22.3%) for females.
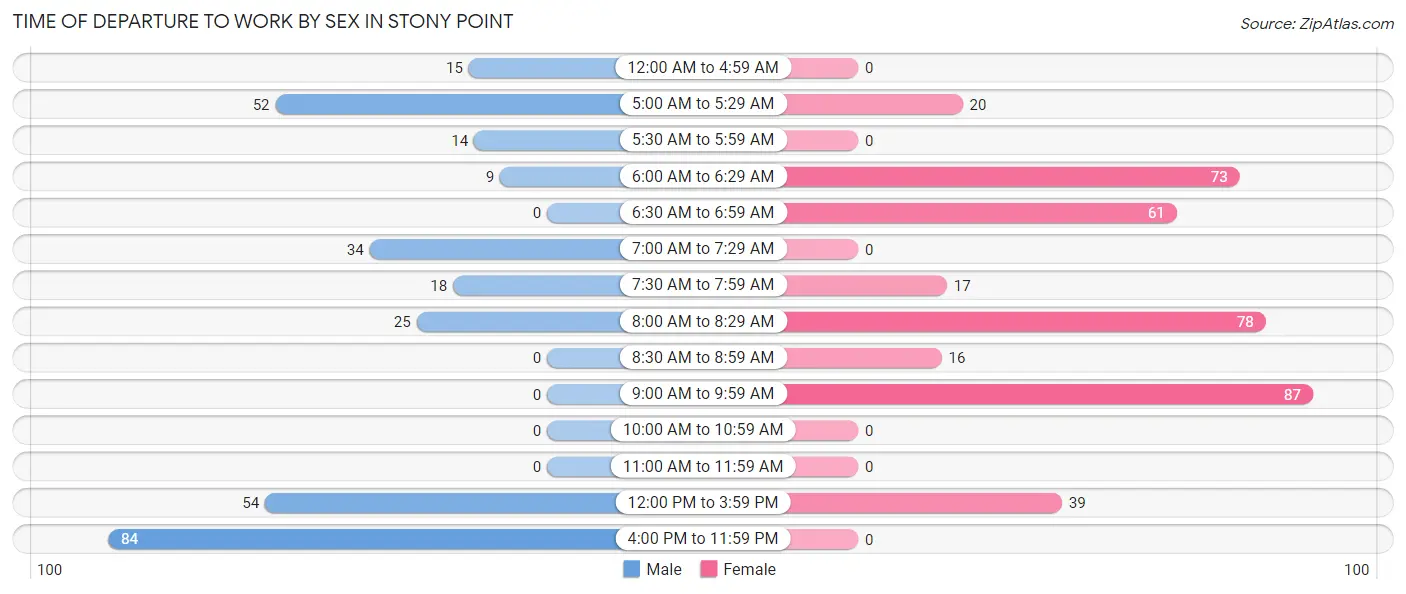
| Time of Departure | Male | Female |
| 12:00 AM to 4:59 AM | 15 (4.9%) | 0 (0.0%) |
| 5:00 AM to 5:29 AM | 52 (17.1%) | 20 (5.1%) |
| 5:30 AM to 5:59 AM | 14 (4.6%) | 0 (0.0%) |
| 6:00 AM to 6:29 AM | 9 (2.9%) | 73 (18.7%) |
| 6:30 AM to 6:59 AM | 0 (0.0%) | 61 (15.6%) |
| 7:00 AM to 7:29 AM | 34 (11.2%) | 0 (0.0%) |
| 7:30 AM to 7:59 AM | 18 (5.9%) | 17 (4.3%) |
| 8:00 AM to 8:29 AM | 25 (8.2%) | 78 (20.0%) |
| 8:30 AM to 8:59 AM | 0 (0.0%) | 16 (4.1%) |
| 9:00 AM to 9:59 AM | 0 (0.0%) | 87 (22.3%) |
| 10:00 AM to 10:59 AM | 0 (0.0%) | 0 (0.0%) |
| 11:00 AM to 11:59 AM | 0 (0.0%) | 0 (0.0%) |
| 12:00 PM to 3:59 PM | 54 (17.7%) | 39 (10.0%) |
| 4:00 PM to 11:59 PM | 84 (27.5%) | 0 (0.0%) |
| Total | 305 (100.0%) | 391 (100.0%) |
Housing Occupancy in Stony Point
Occupancy by Ownership in Stony Point
Of the total 674 dwellings in Stony Point, owner-occupied units account for 462 (68.5%), while renter-occupied units make up 212 (31.5%).
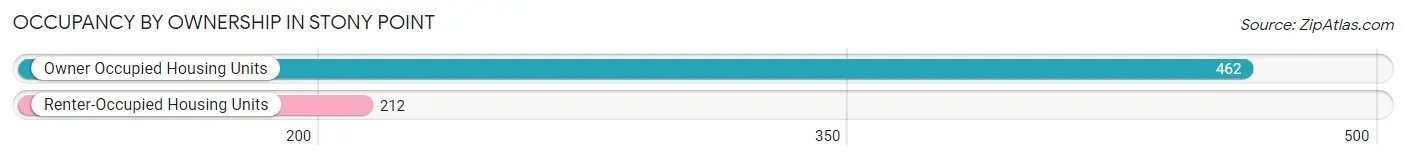
| Occupancy | # Housing Units | % Housing Units |
| Owner Occupied Housing Units | 462 | 68.5% |
| Renter-Occupied Housing Units | 212 | 31.5% |
| Total Occupied Housing Units | 674 | 100.0% |
Occupancy by Household Size in Stony Point
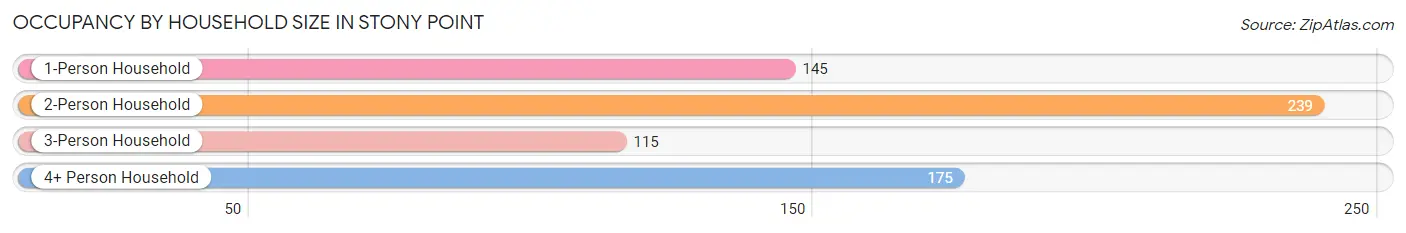
| Household Size | # Housing Units | % Housing Units |
| 1-Person Household | 145 | 21.5% |
| 2-Person Household | 239 | 35.5% |
| 3-Person Household | 115 | 17.1% |
| 4+ Person Household | 175 | 26.0% |
| Total Housing Units | 674 | 100.0% |
Occupancy by Ownership by Household Size in Stony Point
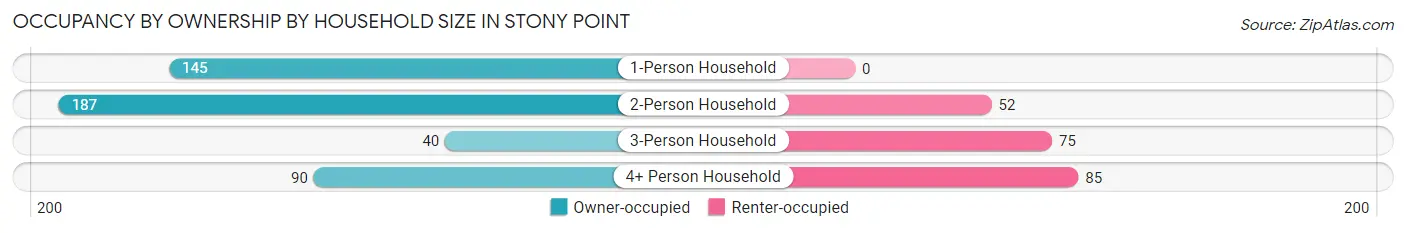
| Household Size | Owner-occupied | Renter-occupied |
| 1-Person Household | 145 (100.0%) | 0 (0.0%) |
| 2-Person Household | 187 (78.2%) | 52 (21.8%) |
| 3-Person Household | 40 (34.8%) | 75 (65.2%) |
| 4+ Person Household | 90 (51.4%) | 85 (48.6%) |
| Total Housing Units | 462 (68.5%) | 212 (31.5%) |
Occupancy by Educational Attainment in Stony Point
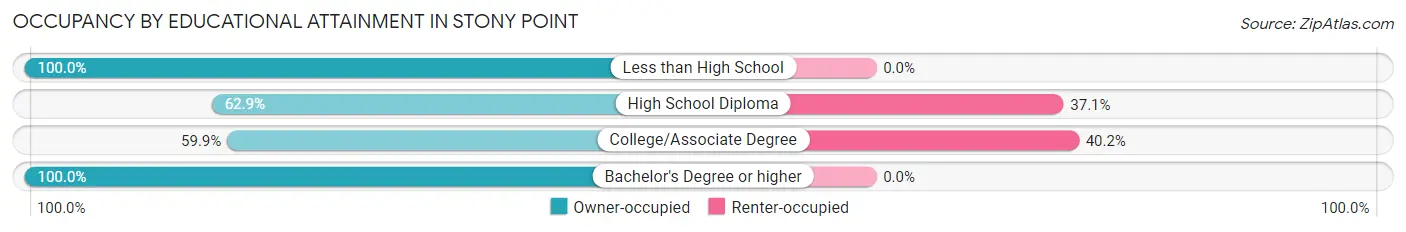
| Household Size | Owner-occupied | Renter-occupied |
| Less than High School | 32 (100.0%) | 0 (0.0%) |
| High School Diploma | 183 (62.9%) | 108 (37.1%) |
| College/Associate Degree | 155 (59.9%) | 104 (40.2%) |
| Bachelor's Degree or higher | 92 (100.0%) | 0 (0.0%) |
Occupancy by Age of Householder in Stony Point
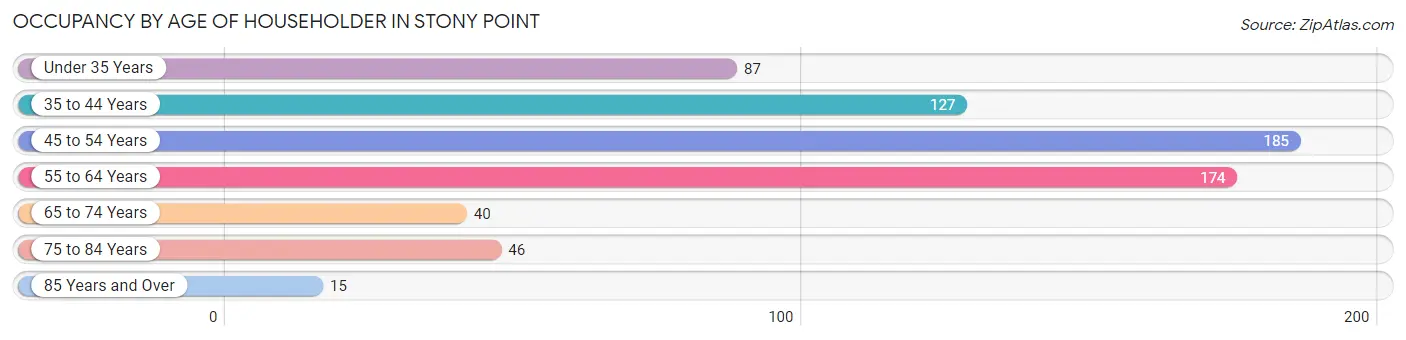
| Age Bracket | # Households | % Households |
| Under 35 Years | 87 | 12.9% |
| 35 to 44 Years | 127 | 18.8% |
| 45 to 54 Years | 185 | 27.5% |
| 55 to 64 Years | 174 | 25.8% |
| 65 to 74 Years | 40 | 5.9% |
| 75 to 84 Years | 46 | 6.8% |
| 85 Years and Over | 15 | 2.2% |
| Total | 674 | 100.0% |
Housing Finances in Stony Point
Median Income by Occupancy in Stony Point
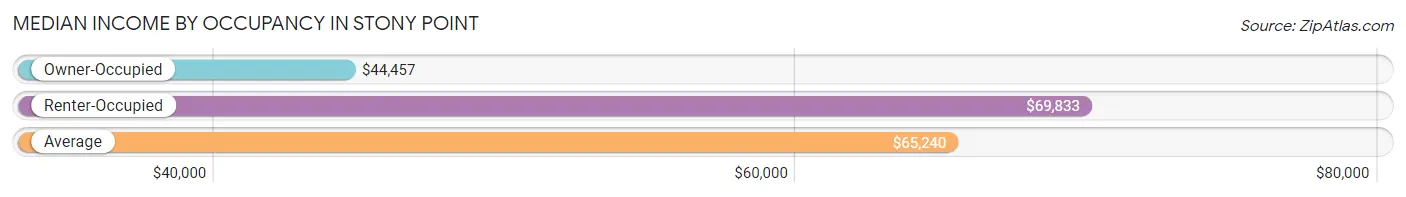
| Occupancy Type | # Households | Median Income |
| Owner-Occupied | 462 (68.5%) | $44,457 |
| Renter-Occupied | 212 (31.5%) | $69,833 |
| Average | 674 (100.0%) | $65,240 |
Occupancy by Householder Income Bracket in Stony Point
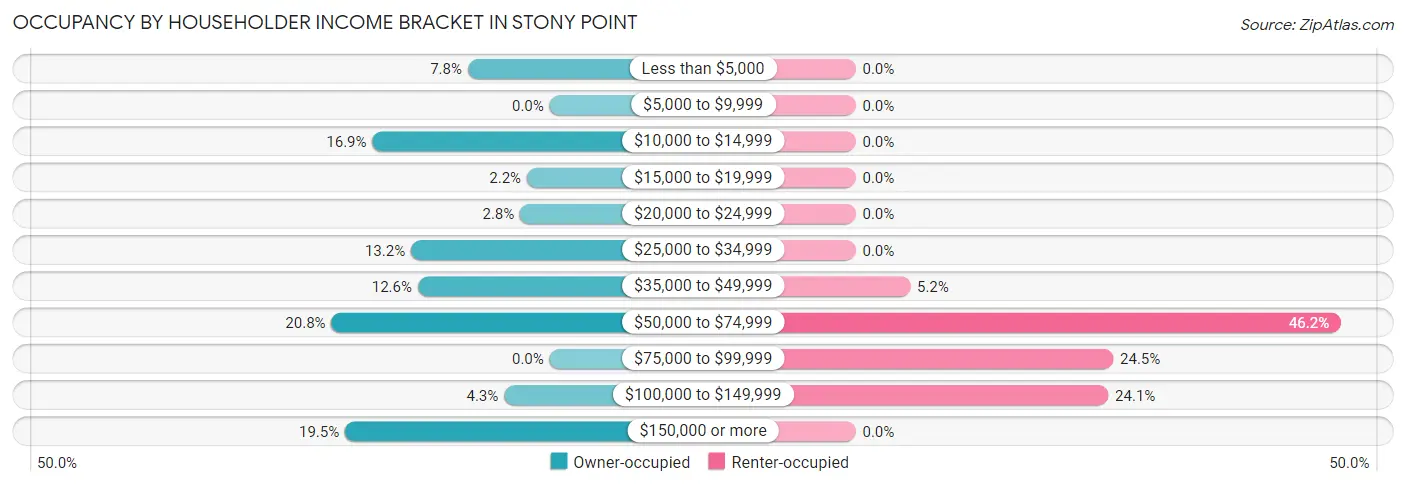
| Income Bracket | Owner-occupied | Renter-occupied |
| Less than $5,000 | 36 (7.8%) | 0 (0.0%) |
| $5,000 to $9,999 | 0 (0.0%) | 0 (0.0%) |
| $10,000 to $14,999 | 78 (16.9%) | 0 (0.0%) |
| $15,000 to $19,999 | 10 (2.2%) | 0 (0.0%) |
| $20,000 to $24,999 | 13 (2.8%) | 0 (0.0%) |
| $25,000 to $34,999 | 61 (13.2%) | 0 (0.0%) |
| $35,000 to $49,999 | 58 (12.6%) | 11 (5.2%) |
| $50,000 to $74,999 | 96 (20.8%) | 98 (46.2%) |
| $75,000 to $99,999 | 0 (0.0%) | 52 (24.5%) |
| $100,000 to $149,999 | 20 (4.3%) | 51 (24.1%) |
| $150,000 or more | 90 (19.5%) | 0 (0.0%) |
| Total | 462 (100.0%) | 212 (100.0%) |
Monthly Housing Cost Tiers in Stony Point
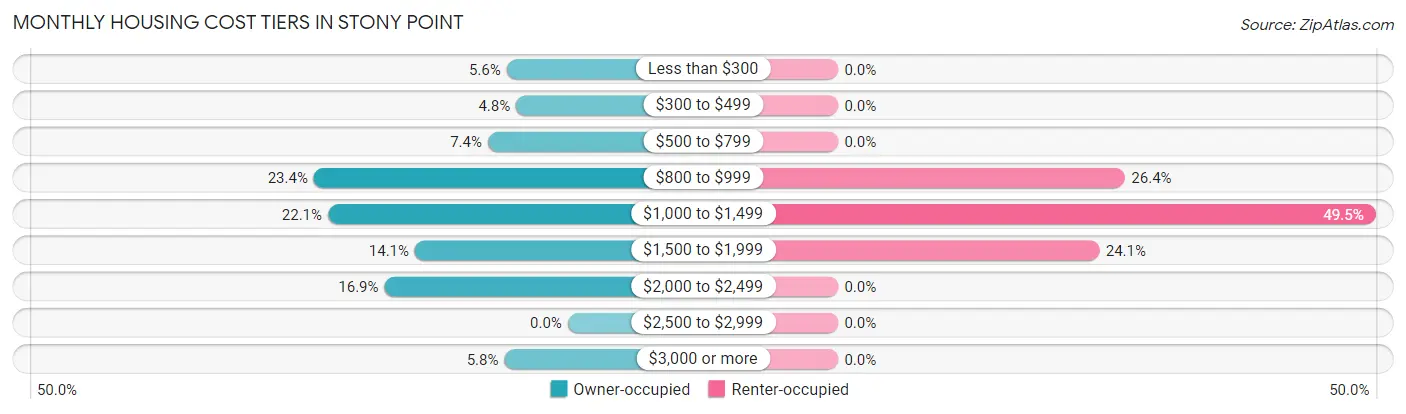
| Monthly Cost | Owner-occupied | Renter-occupied |
| Less than $300 | 26 (5.6%) | 0 (0.0%) |
| $300 to $499 | 22 (4.8%) | 0 (0.0%) |
| $500 to $799 | 34 (7.4%) | 0 (0.0%) |
| $800 to $999 | 108 (23.4%) | 56 (26.4%) |
| $1,000 to $1,499 | 102 (22.1%) | 105 (49.5%) |
| $1,500 to $1,999 | 65 (14.1%) | 51 (24.1%) |
| $2,000 to $2,499 | 78 (16.9%) | 0 (0.0%) |
| $2,500 to $2,999 | 0 (0.0%) | 0 (0.0%) |
| $3,000 or more | 27 (5.8%) | 0 (0.0%) |
| Total | 462 (100.0%) | 212 (100.0%) |
Physical Housing Characteristics in Stony Point
Housing Structures in Stony Point
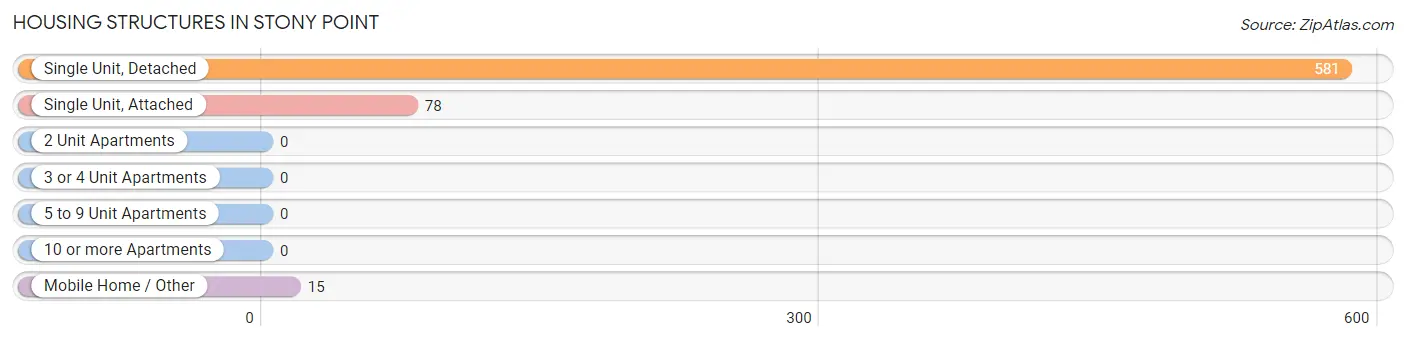
| Structure Type | # Housing Units | % Housing Units |
| Single Unit, Detached | 581 | 86.2% |
| Single Unit, Attached | 78 | 11.6% |
| 2 Unit Apartments | 0 | 0.0% |
| 3 or 4 Unit Apartments | 0 | 0.0% |
| 5 to 9 Unit Apartments | 0 | 0.0% |
| 10 or more Apartments | 0 | 0.0% |
| Mobile Home / Other | 15 | 2.2% |
| Total | 674 | 100.0% |
Housing Structures by Occupancy in Stony Point
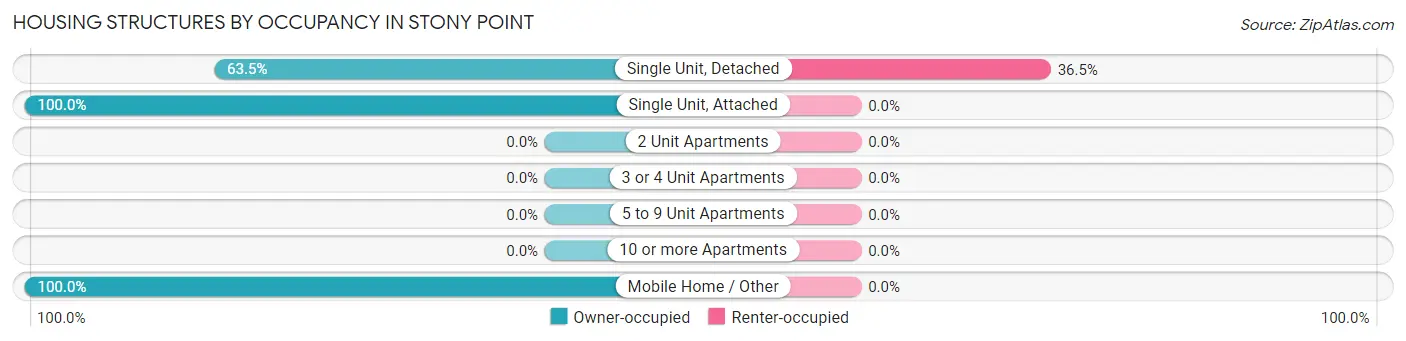
| Structure Type | Owner-occupied | Renter-occupied |
| Single Unit, Detached | 369 (63.5%) | 212 (36.5%) |
| Single Unit, Attached | 78 (100.0%) | 0 (0.0%) |
| 2 Unit Apartments | 0 (0.0%) | 0 (0.0%) |
| 3 or 4 Unit Apartments | 0 (0.0%) | 0 (0.0%) |
| 5 to 9 Unit Apartments | 0 (0.0%) | 0 (0.0%) |
| 10 or more Apartments | 0 (0.0%) | 0 (0.0%) |
| Mobile Home / Other | 15 (100.0%) | 0 (0.0%) |
| Total | 462 (68.5%) | 212 (31.5%) |
Housing Structures by Number of Rooms in Stony Point
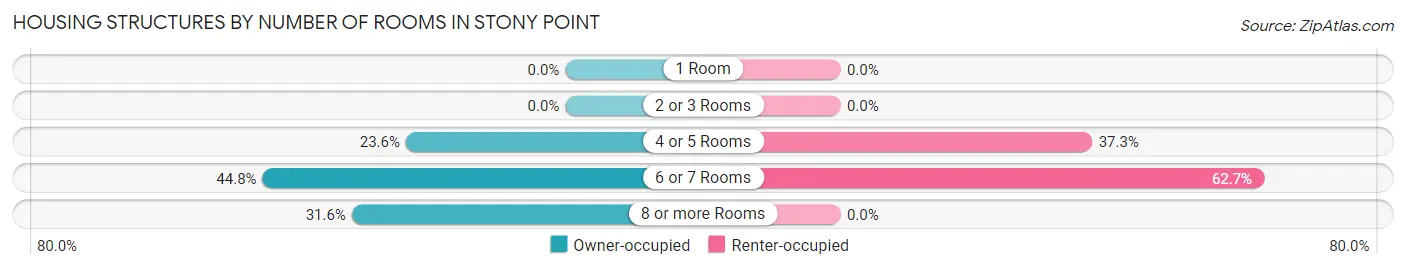
| Number of Rooms | Owner-occupied | Renter-occupied |
| 1 Room | 0 (0.0%) | 0 (0.0%) |
| 2 or 3 Rooms | 0 (0.0%) | 0 (0.0%) |
| 4 or 5 Rooms | 109 (23.6%) | 79 (37.3%) |
| 6 or 7 Rooms | 207 (44.8%) | 133 (62.7%) |
| 8 or more Rooms | 146 (31.6%) | 0 (0.0%) |
| Total | 462 (100.0%) | 212 (100.0%) |
Housing Structure by Heating Type in Stony Point
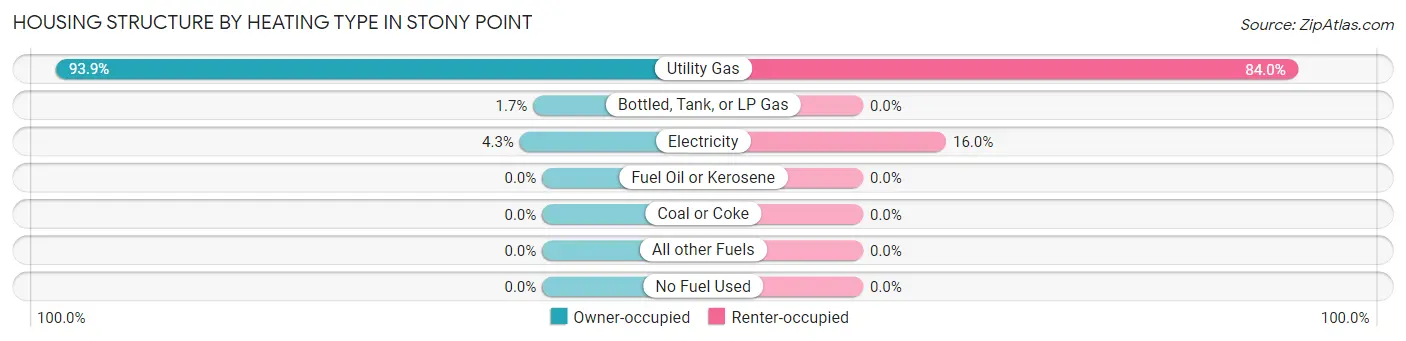
| Heating Type | Owner-occupied | Renter-occupied |
| Utility Gas | 434 (93.9%) | 178 (84.0%) |
| Bottled, Tank, or LP Gas | 8 (1.7%) | 0 (0.0%) |
| Electricity | 20 (4.3%) | 34 (16.0%) |
| Fuel Oil or Kerosene | 0 (0.0%) | 0 (0.0%) |
| Coal or Coke | 0 (0.0%) | 0 (0.0%) |
| All other Fuels | 0 (0.0%) | 0 (0.0%) |
| No Fuel Used | 0 (0.0%) | 0 (0.0%) |
| Total | 462 (100.0%) | 212 (100.0%) |
Household Vehicle Usage in Stony Point
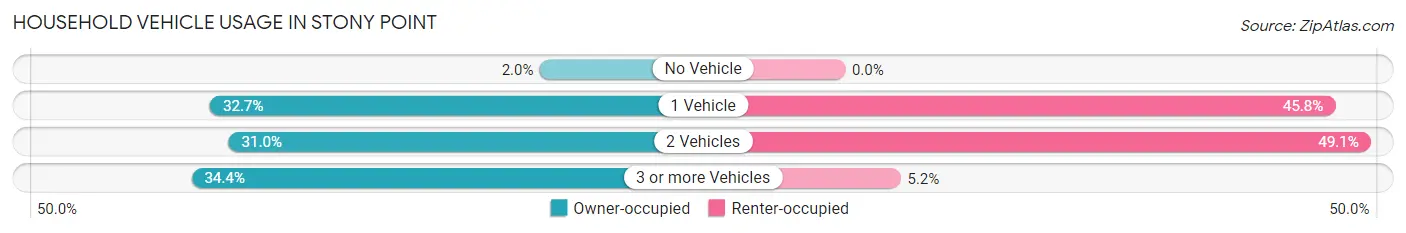
| Vehicles per Household | Owner-occupied | Renter-occupied |
| No Vehicle | 9 (1.9%) | 0 (0.0%) |
| 1 Vehicle | 151 (32.7%) | 97 (45.8%) |
| 2 Vehicles | 143 (30.9%) | 104 (49.1%) |
| 3 or more Vehicles | 159 (34.4%) | 11 (5.2%) |
| Total | 462 (100.0%) | 212 (100.0%) |
Real Estate & Mortgages in Stony Point
Real Estate and Mortgage Overview in Stony Point
| Characteristic | Without Mortgage | With Mortgage |
| Housing Units | 135 | 327 |
| Median Property Value | $280,900 | $186,100 |
| Median Household Income | $42,417 | $78 |
| Monthly Housing Costs | $817 | $27 |
| Real Estate Taxes | $3,339 | $0 |
Property Value by Mortgage Status in Stony Point
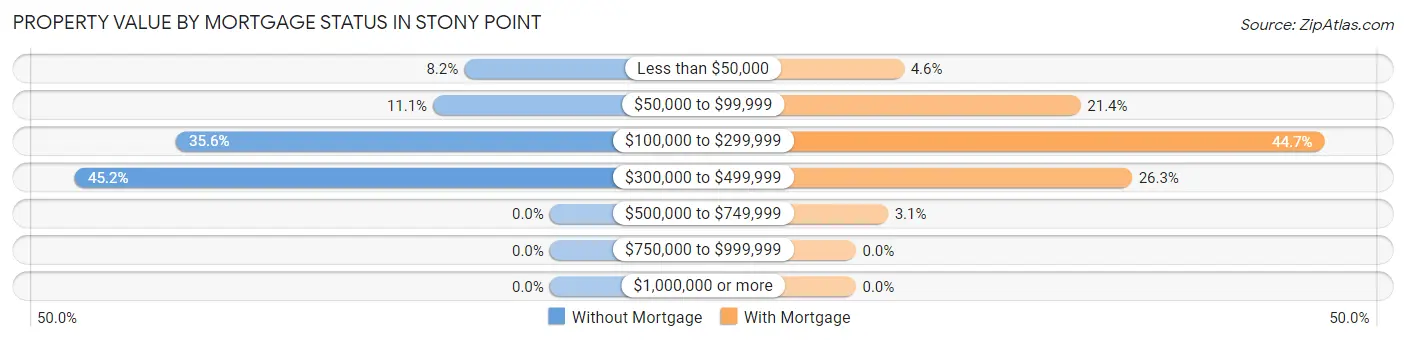
| Property Value | Without Mortgage | With Mortgage |
| Less than $50,000 | 11 (8.2%) | 15 (4.6%) |
| $50,000 to $99,999 | 15 (11.1%) | 70 (21.4%) |
| $100,000 to $299,999 | 48 (35.6%) | 146 (44.7%) |
| $300,000 to $499,999 | 61 (45.2%) | 86 (26.3%) |
| $500,000 to $749,999 | 0 (0.0%) | 10 (3.1%) |
| $750,000 to $999,999 | 0 (0.0%) | 0 (0.0%) |
| $1,000,000 or more | 0 (0.0%) | 0 (0.0%) |
| Total | 135 (100.0%) | 327 (100.0%) |
Household Income by Mortgage Status in Stony Point
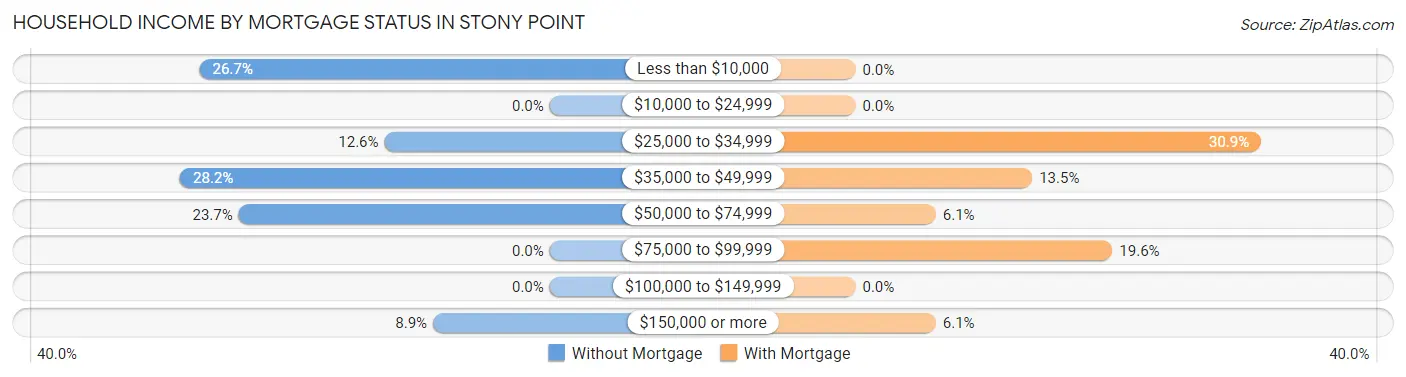
| Household Income | Without Mortgage | With Mortgage |
| Less than $10,000 | 36 (26.7%) | 0 (0.0%) |
| $10,000 to $24,999 | 0 (0.0%) | 0 (0.0%) |
| $25,000 to $34,999 | 17 (12.6%) | 101 (30.9%) |
| $35,000 to $49,999 | 38 (28.1%) | 44 (13.5%) |
| $50,000 to $74,999 | 32 (23.7%) | 20 (6.1%) |
| $75,000 to $99,999 | 0 (0.0%) | 64 (19.6%) |
| $100,000 to $149,999 | 0 (0.0%) | 0 (0.0%) |
| $150,000 or more | 12 (8.9%) | 20 (6.1%) |
| Total | 135 (100.0%) | 327 (100.0%) |
Property Value to Household Income Ratio in Stony Point
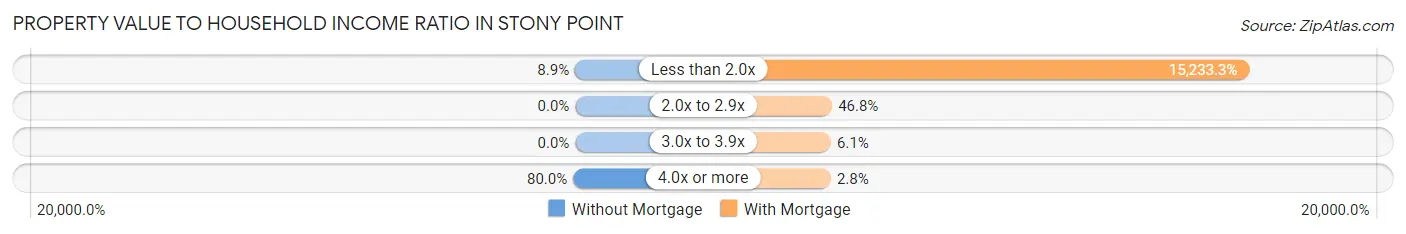
| Value-to-Income Ratio | Without Mortgage | With Mortgage |
| Less than 2.0x | 12 (8.9%) | 49,813 (15,233.3%) |
| 2.0x to 2.9x | 0 (0.0%) | 153 (46.8%) |
| 3.0x to 3.9x | 0 (0.0%) | 20 (6.1%) |
| 4.0x or more | 108 (80.0%) | 9 (2.8%) |
| Total | 135 (100.0%) | 327 (100.0%) |
Real Estate Taxes by Mortgage Status in Stony Point
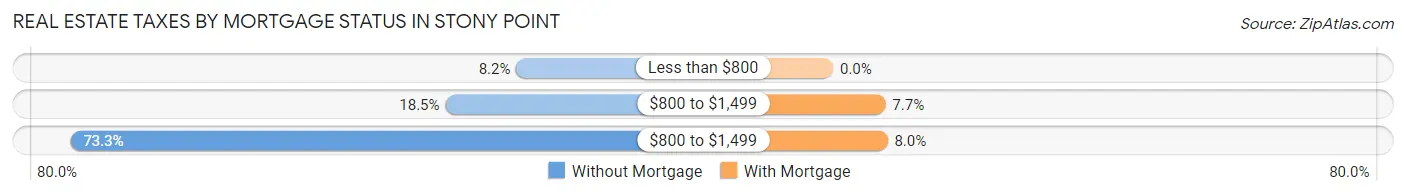
| Property Taxes | Without Mortgage | With Mortgage |
| Less than $800 | 11 (8.2%) | 0 (0.0%) |
| $800 to $1,499 | 25 (18.5%) | 25 (7.6%) |
| $800 to $1,499 | 99 (73.3%) | 26 (8.0%) |
| Total | 135 (100.0%) | 327 (100.0%) |
Health & Disability in Stony Point
Health Insurance Coverage by Age in Stony Point
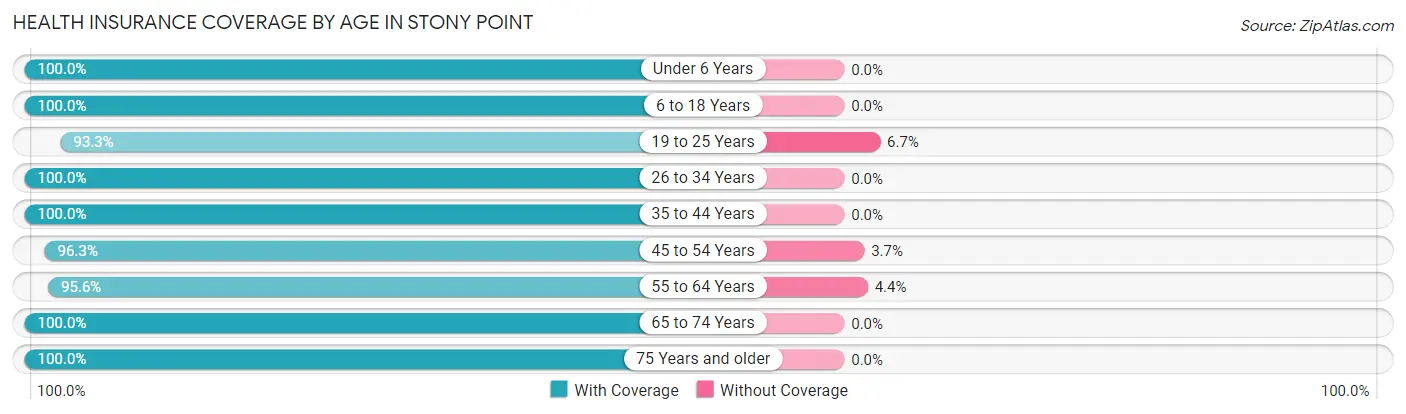
| Age Bracket | With Coverage | Without Coverage |
| Under 6 Years | 104 (100.0%) | 0 (0.0%) |
| 6 to 18 Years | 424 (100.0%) | 0 (0.0%) |
| 19 to 25 Years | 140 (93.3%) | 10 (6.7%) |
| 26 to 34 Years | 154 (100.0%) | 0 (0.0%) |
| 35 to 44 Years | 220 (100.0%) | 0 (0.0%) |
| 45 to 54 Years | 336 (96.3%) | 13 (3.7%) |
| 55 to 64 Years | 285 (95.6%) | 13 (4.4%) |
| 65 to 74 Years | 79 (100.0%) | 0 (0.0%) |
| 75 Years and older | 97 (100.0%) | 0 (0.0%) |
| Total | 1,839 (98.1%) | 36 (1.9%) |
Health Insurance Coverage by Citizenship Status in Stony Point
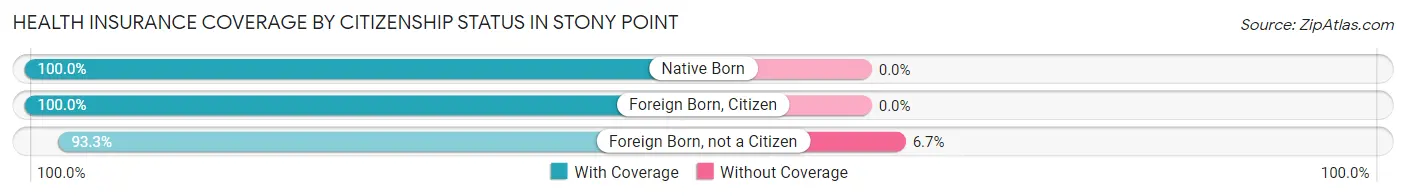
| Citizenship Status | With Coverage | Without Coverage |
| Native Born | 104 (100.0%) | 0 (0.0%) |
| Foreign Born, Citizen | 424 (100.0%) | 0 (0.0%) |
| Foreign Born, not a Citizen | 140 (93.3%) | 10 (6.7%) |
Health Insurance Coverage by Household Income in Stony Point
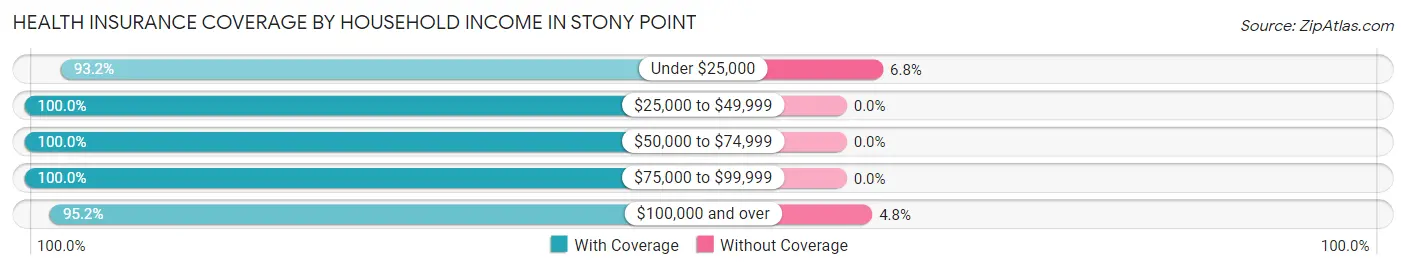
| Household Income | With Coverage | Without Coverage |
| Under $25,000 | 137 (93.2%) | 10 (6.8%) |
| $25,000 to $49,999 | 403 (100.0%) | 0 (0.0%) |
| $50,000 to $74,999 | 673 (100.0%) | 0 (0.0%) |
| $75,000 to $99,999 | 106 (100.0%) | 0 (0.0%) |
| $100,000 and over | 520 (95.2%) | 26 (4.8%) |
Public vs Private Health Insurance Coverage by Age in Stony Point
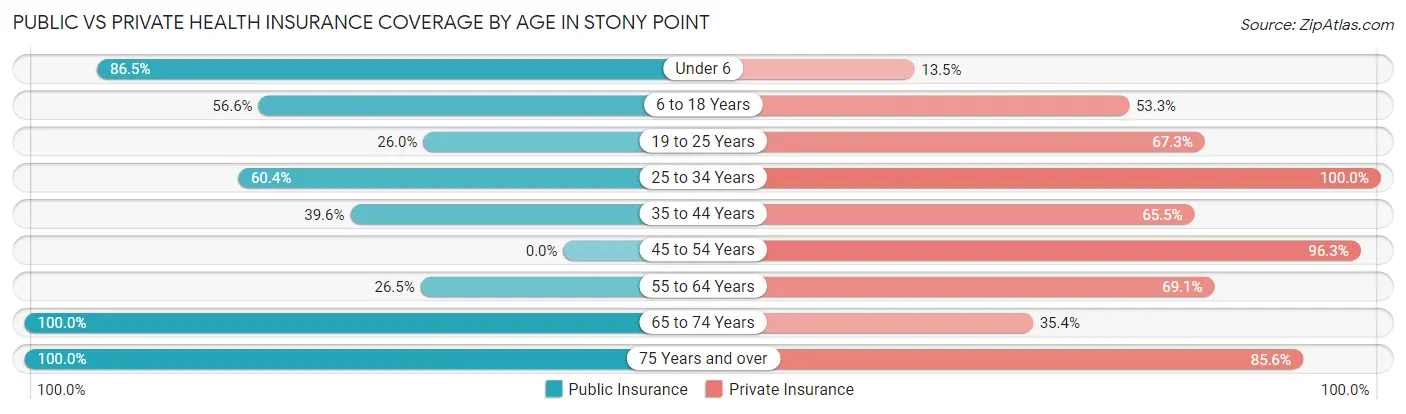
| Age Bracket | Public Insurance | Private Insurance |
| Under 6 | 90 (86.5%) | 14 (13.5%) |
| 6 to 18 Years | 240 (56.6%) | 226 (53.3%) |
| 19 to 25 Years | 39 (26.0%) | 101 (67.3%) |
| 25 to 34 Years | 93 (60.4%) | 154 (100.0%) |
| 35 to 44 Years | 87 (39.6%) | 144 (65.4%) |
| 45 to 54 Years | 0 (0.0%) | 336 (96.3%) |
| 55 to 64 Years | 79 (26.5%) | 206 (69.1%) |
| 65 to 74 Years | 79 (100.0%) | 28 (35.4%) |
| 75 Years and over | 97 (100.0%) | 83 (85.6%) |
| Total | 804 (42.9%) | 1,292 (68.9%) |
Disability Status by Sex by Age in Stony Point
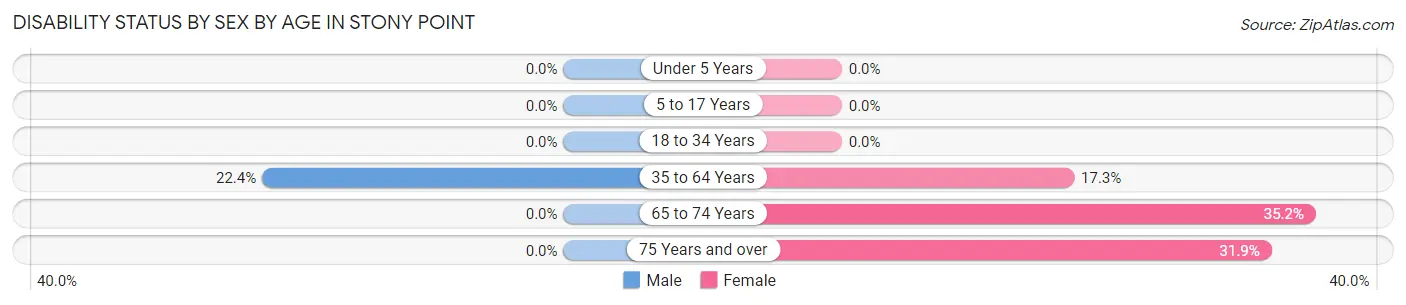
| Age Bracket | Male | Female |
| Under 5 Years | 0 (0.0%) | 0 (0.0%) |
| 5 to 17 Years | 0 (0.0%) | 0 (0.0%) |
| 18 to 34 Years | 0 (0.0%) | 0 (0.0%) |
| 35 to 64 Years | 85 (22.4%) | 84 (17.2%) |
| 65 to 74 Years | 0 (0.0%) | 19 (35.2%) |
| 75 Years and over | 0 (0.0%) | 15 (31.9%) |
Disability Class by Sex by Age in Stony Point
Disability Class: Hearing Difficulty
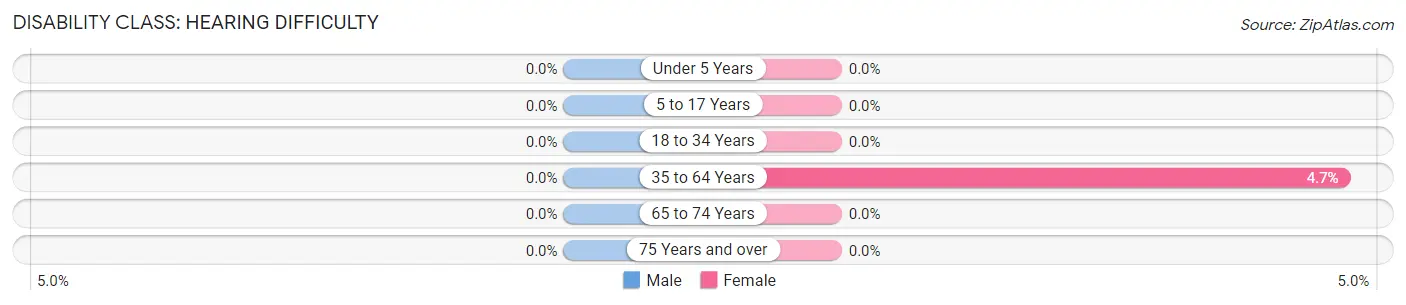
| Age Bracket | Male | Female |
| Under 5 Years | 0 (0.0%) | 0 (0.0%) |
| 5 to 17 Years | 0 (0.0%) | 0 (0.0%) |
| 18 to 34 Years | 0 (0.0%) | 0 (0.0%) |
| 35 to 64 Years | 0 (0.0%) | 23 (4.7%) |
| 65 to 74 Years | 0 (0.0%) | 0 (0.0%) |
| 75 Years and over | 0 (0.0%) | 0 (0.0%) |
Disability Class: Vision Difficulty
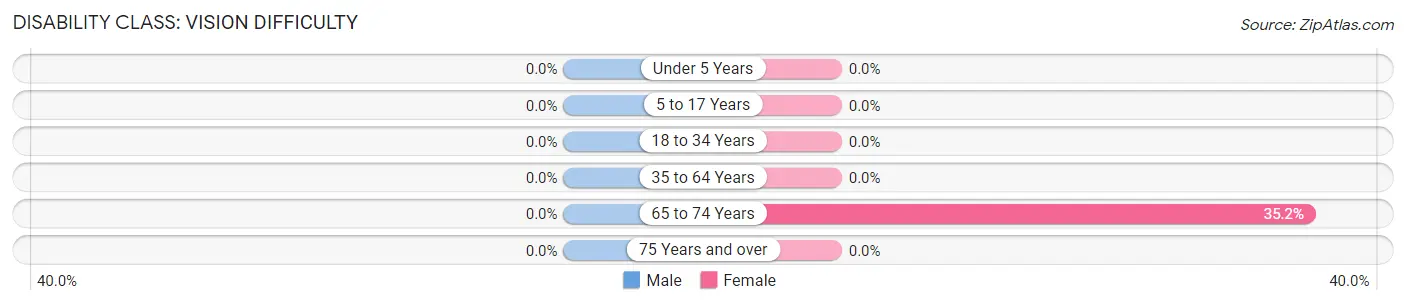
| Age Bracket | Male | Female |
| Under 5 Years | 0 (0.0%) | 0 (0.0%) |
| 5 to 17 Years | 0 (0.0%) | 0 (0.0%) |
| 18 to 34 Years | 0 (0.0%) | 0 (0.0%) |
| 35 to 64 Years | 0 (0.0%) | 0 (0.0%) |
| 65 to 74 Years | 0 (0.0%) | 19 (35.2%) |
| 75 Years and over | 0 (0.0%) | 0 (0.0%) |
Disability Class: Cognitive Difficulty
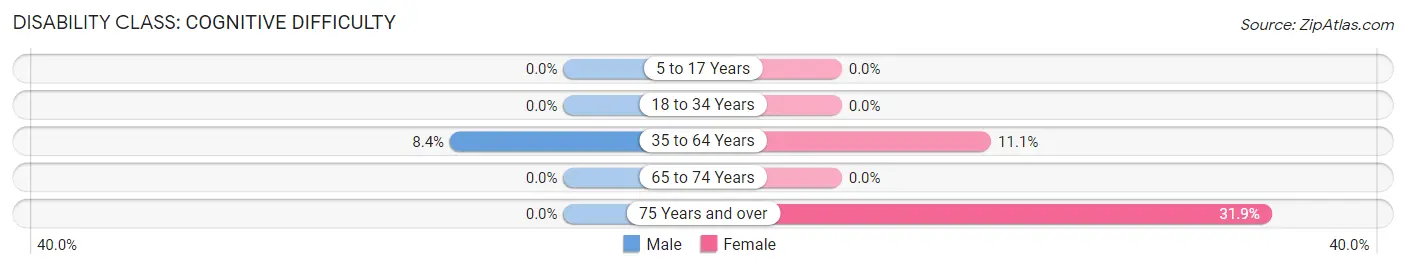
| Age Bracket | Male | Female |
| 5 to 17 Years | 0 (0.0%) | 0 (0.0%) |
| 18 to 34 Years | 0 (0.0%) | 0 (0.0%) |
| 35 to 64 Years | 32 (8.4%) | 54 (11.1%) |
| 65 to 74 Years | 0 (0.0%) | 0 (0.0%) |
| 75 Years and over | 0 (0.0%) | 15 (31.9%) |
Disability Class: Ambulatory Difficulty
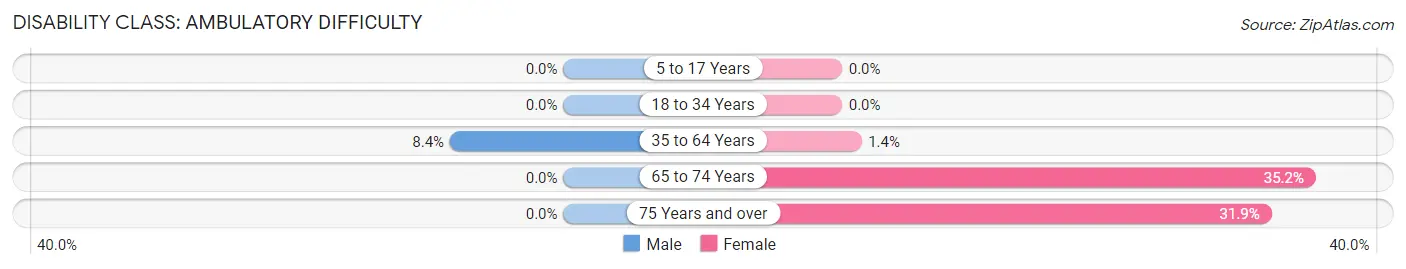
| Age Bracket | Male | Female |
| 5 to 17 Years | 0 (0.0%) | 0 (0.0%) |
| 18 to 34 Years | 0 (0.0%) | 0 (0.0%) |
| 35 to 64 Years | 32 (8.4%) | 7 (1.4%) |
| 65 to 74 Years | 0 (0.0%) | 19 (35.2%) |
| 75 Years and over | 0 (0.0%) | 15 (31.9%) |
Disability Class: Self-Care Difficulty
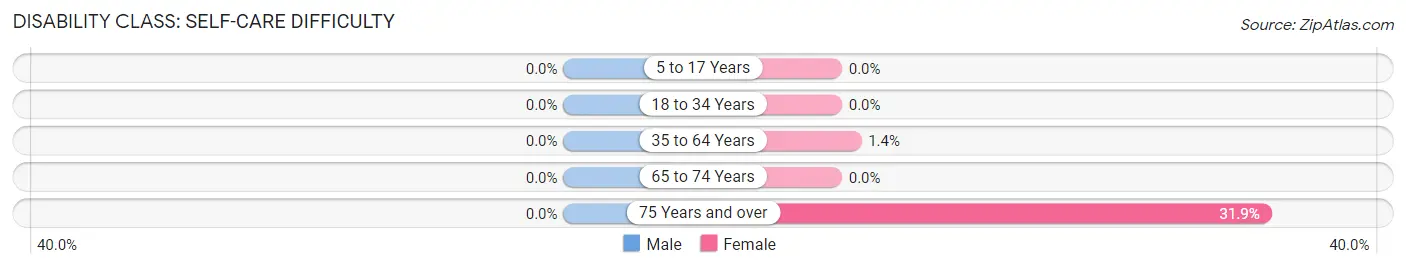
| Age Bracket | Male | Female |
| 5 to 17 Years | 0 (0.0%) | 0 (0.0%) |
| 18 to 34 Years | 0 (0.0%) | 0 (0.0%) |
| 35 to 64 Years | 0 (0.0%) | 7 (1.4%) |
| 65 to 74 Years | 0 (0.0%) | 0 (0.0%) |
| 75 Years and over | 0 (0.0%) | 15 (31.9%) |
Technology Access in Stony Point
Computing Device Access in Stony Point
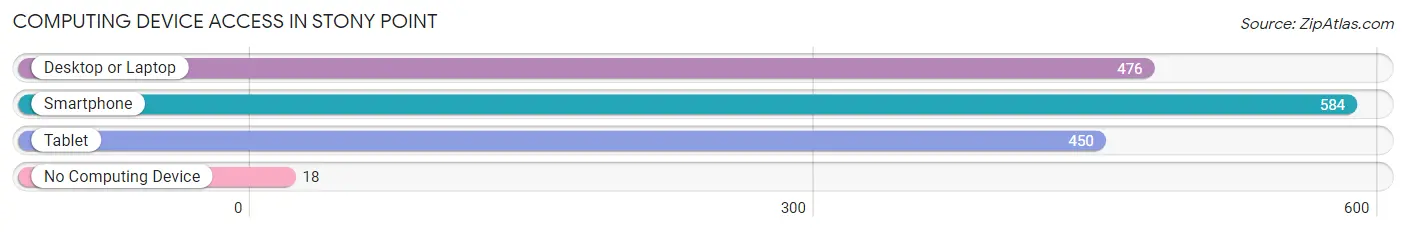
| Device Type | # Households | % Households |
| Desktop or Laptop | 476 | 70.6% |
| Smartphone | 584 | 86.7% |
| Tablet | 450 | 66.8% |
| No Computing Device | 18 | 2.7% |
| Total | 674 | 100.0% |
Internet Access in Stony Point
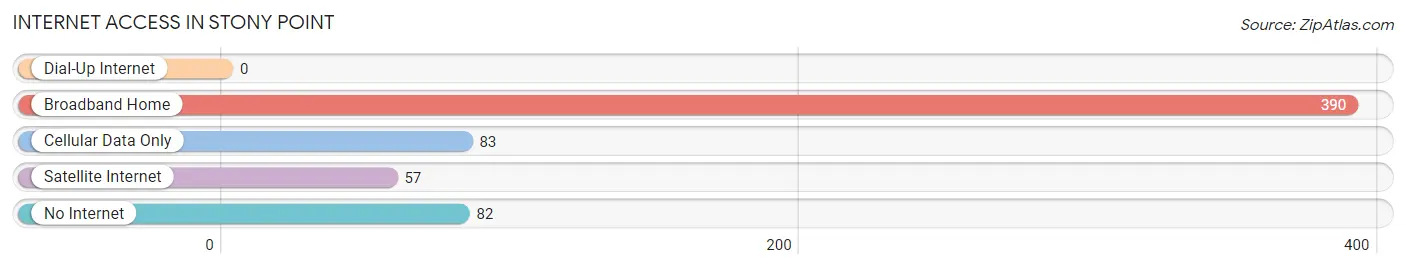
| Internet Type | # Households | % Households |
| Dial-Up Internet | 0 | 0.0% |
| Broadband Home | 390 | 57.9% |
| Cellular Data Only | 83 | 12.3% |
| Satellite Internet | 57 | 8.5% |
| No Internet | 82 | 12.2% |
| Total | 674 | 100.0% |
Stony Point Summary
Stony Point is a small unincorporated community located in the Upper Peninsula of Michigan, in the county of Chippewa. It is situated on the south shore of Lake Superior, approximately 20 miles east of Sault Ste. Marie. The population of Stony Point was estimated to be around 200 people in 2020.
History
Stony Point was first settled in the late 1800s by a group of Finnish immigrants. The area was originally known as “Kivimaa”, which translates to “stone land” in Finnish. The settlers were attracted to the area due to its abundance of natural resources, including timber and fish. The first permanent settlement was established in 1887, and the community was officially incorporated in 1895.
The early settlers of Stony Point were primarily involved in the logging and fishing industries. The logging industry was particularly important to the local economy, as the area was home to a large number of white pine trees. The timber was harvested and shipped to other parts of the country, providing a steady source of income for the community.
In the early 1900s, Stony Point began to experience a decline in its logging industry due to the depletion of the white pine trees. This led to a shift in the local economy, as the community began to focus more on fishing and tourism. The area is now home to a number of small businesses, including restaurants, lodging, and retail stores.
Geography
Stony Point is located on the south shore of Lake Superior, approximately 20 miles east of Sault Ste. Marie. The community is situated on a peninsula, surrounded by the lake on three sides. The area is characterized by rolling hills, dense forests, and rocky shorelines.
The climate in Stony Point is classified as humid continental, with warm summers and cold winters. The average temperature in the summer is around 70°F, while the average temperature in the winter is around 20°F. The area receives an average of 40 inches of precipitation per year, with most of it falling in the form of snow.
Economy
The economy of Stony Point is largely based on tourism and fishing. The area is home to a number of small businesses, including restaurants, lodging, and retail stores. The local fishing industry is also an important part of the economy, as the area is home to a variety of fish species, including lake trout, whitefish, and walleye.
The area is also home to a number of outdoor recreation opportunities, including hiking, camping, and boating. The nearby Tahquamenon Falls State Park is a popular destination for visitors, as it offers a variety of activities, including fishing, hiking, and camping.
Demographics
The population of Stony Point was estimated to be around 200 people in 2020. The majority of the population is of Finnish descent, with a small number of other ethnicities represented. The median age of the population is around 45 years old, and the median household income is around $40,000.
The area is served by a number of public schools, including Stony Point Elementary School and Stony Point High School. The community is also home to a number of churches, including the Stony Point Lutheran Church and the Stony Point United Methodist Church.
Conclusion
Stony Point is a small unincorporated community located in the Upper Peninsula of Michigan, in the county of Chippewa. It is situated on the south shore of Lake Superior, approximately 20 miles east of Sault Ste. Marie. The population of Stony Point was estimated to be around 200 people in 2020. The economy of Stony Point is largely based on tourism and fishing, and the area is home to a number of small businesses, including restaurants, lodging, and retail stores. The majority of the population is of Finnish descent, with a small number of other ethnicities represented. The area is served by a number of public schools, and is home to a number of churches.
Common Questions
What is Per Capita Income in Stony Point?
Per Capita income in Stony Point is $27,909.
What is the Median Family Income in Stony Point?
Median Family Income in Stony Point is $68,028.
What is the Median Household income in Stony Point?
Median Household Income in Stony Point is $65,240.
What is Income or Wage Gap in Stony Point?
Income or Wage Gap in Stony Point is 78.9%.
Women in Stony Point earn 21.1 cents for every dollar earned by a man.
What is Inequality or Gini Index in Stony Point?
Inequality or Gini Index in Stony Point is 0.44.
What is the Total Population of Stony Point?
Total Population of Stony Point is 1,875.
What is the Total Male Population of Stony Point?
Total Male Population of Stony Point is 915.
What is the Total Female Population of Stony Point?
Total Female Population of Stony Point is 960.
What is the Ratio of Males per 100 Females in Stony Point?
There are 95.31 Males per 100 Females in Stony Point.
What is the Ratio of Females per 100 Males in Stony Point?
There are 104.92 Females per 100 Males in Stony Point.
What is the Median Population Age in Stony Point?
Median Population Age in Stony Point is 37.9 Years.
What is the Average Family Size in Stony Point
Average Family Size in Stony Point is 3.4 People.
What is the Average Household Size in Stony Point
Average Household Size in Stony Point is 2.8 People.
How Large is the Labor Force in Stony Point?
There are 813 People in the Labor Forcein in Stony Point.
What is the Percentage of People in the Labor Force in Stony Point?
59.9% of People are in the Labor Force in Stony Point.
What is the Unemployment Rate in Stony Point?
Unemployment Rate in Stony Point is 6.8%.