Rockwood, MI Map & Demographics
Rockwood Map
Rockwood Overview
$35,720
PER CAPITA INCOME
$100,015
AVG FAMILY INCOME
$93,036
AVG HOUSEHOLD INCOME
41.0%
WAGE / INCOME GAP [ % ]
59.0¢/ $1
WAGE / INCOME GAP [ $ ]
0.33
INEQUALITY / GINI INDEX
3,232
TOTAL POPULATION
1,548
MALE POPULATION
1,684
FEMALE POPULATION
91.92
MALES / 100 FEMALES
108.79
FEMALES / 100 MALES
42.1
MEDIAN AGE
3.1
AVG FAMILY SIZE
2.6
AVG HOUSEHOLD SIZE
1,524
LABOR FORCE [ PEOPLE ]
60.7%
PERCENT IN LABOR FORCE
3.3%
UNEMPLOYMENT RATE
Rockwood Zip Codes
Rockwood Area Codes
Income in Rockwood
Income Overview in Rockwood
Per Capita Income in Rockwood is $35,720, while median incomes of families and households are $100,015 and $93,036 respectively.
| Characteristic | Number | Measure |
| Per Capita Income | 3,232 | $35,720 |
| Median Family Income | 823 | $100,015 |
| Mean Family Income | 823 | $101,074 |
| Median Household Income | 1,244 | $93,036 |
| Mean Household Income | 1,244 | $90,918 |
| Income Deficit | 823 | $0 |
| Wage / Income Gap (%) | 3,232 | 40.98% |
| Wage / Income Gap ($) | 3,232 | 59.02¢ per $1 |
| Gini / Inequality Index | 3,232 | 0.33 |
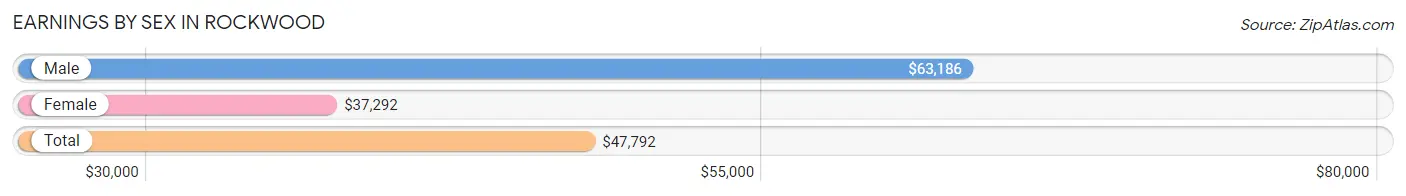
Earnings by Sex in Rockwood
Average Earnings in Rockwood are $47,792, $63,186 for men and $37,292 for women, a difference of 41.0%.
| Sex | Number | Average Earnings |
| Male | 862 (54.6%) | $63,186 |
| Female | 718 (45.4%) | $37,292 |
| Total | 1,580 (100.0%) | $47,792 |
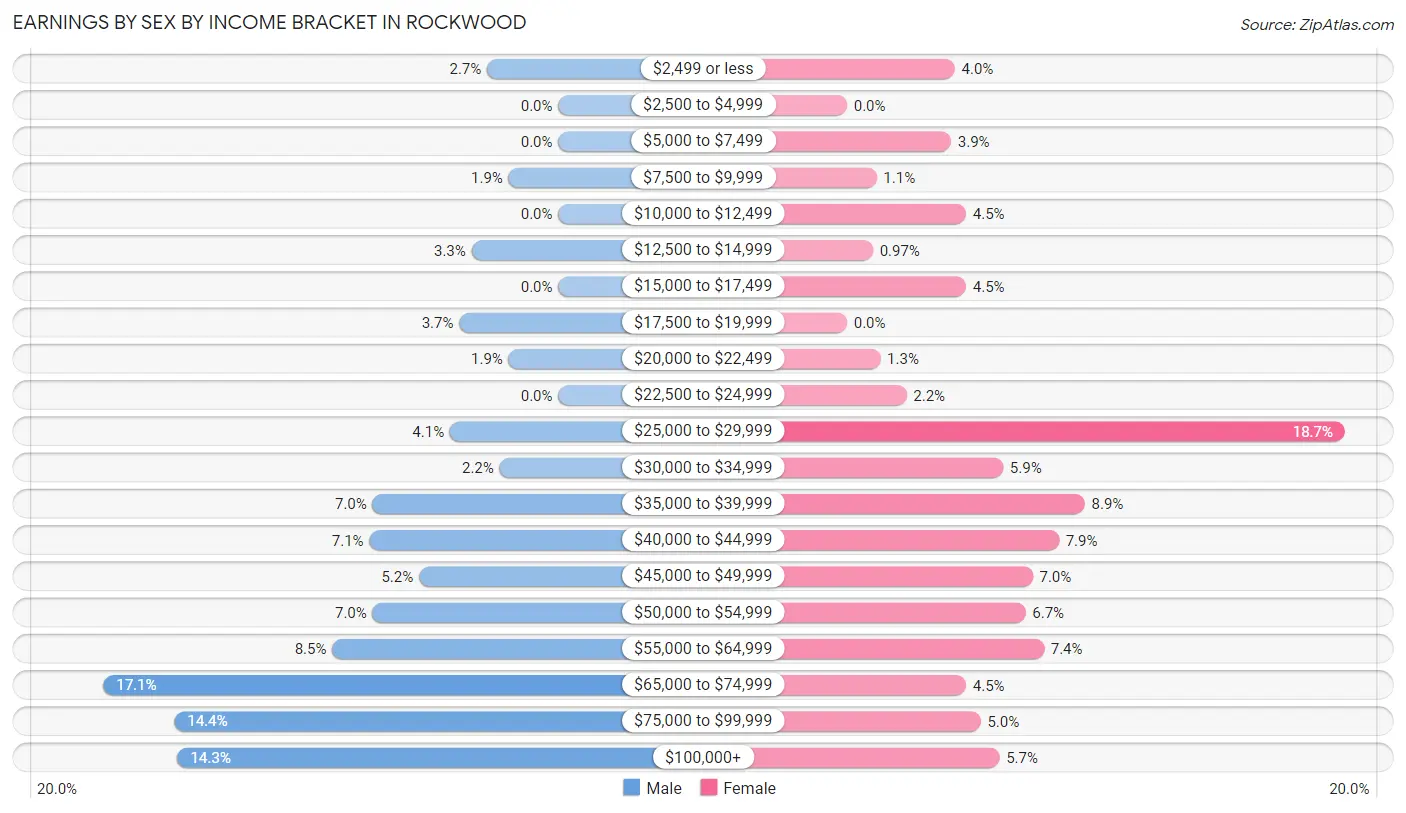
Earnings by Sex by Income Bracket in Rockwood
The most common earnings brackets in Rockwood are $65,000 to $74,999 for men (147 | 17.1%) and $25,000 to $29,999 for women (134 | 18.7%).
| Income | Male | Female |
| $2,499 or less | 23 (2.7%) | 29 (4.0%) |
| $2,500 to $4,999 | 0 (0.0%) | 0 (0.0%) |
| $5,000 to $7,499 | 0 (0.0%) | 28 (3.9%) |
| $7,500 to $9,999 | 16 (1.9%) | 8 (1.1%) |
| $10,000 to $12,499 | 0 (0.0%) | 32 (4.5%) |
| $12,500 to $14,999 | 28 (3.3%) | 7 (1.0%) |
| $15,000 to $17,499 | 0 (0.0%) | 32 (4.5%) |
| $17,500 to $19,999 | 32 (3.7%) | 0 (0.0%) |
| $20,000 to $22,499 | 16 (1.9%) | 9 (1.3%) |
| $22,500 to $24,999 | 0 (0.0%) | 16 (2.2%) |
| $25,000 to $29,999 | 35 (4.1%) | 134 (18.7%) |
| $30,000 to $34,999 | 19 (2.2%) | 42 (5.9%) |
| $35,000 to $39,999 | 60 (7.0%) | 64 (8.9%) |
| $40,000 to $44,999 | 61 (7.1%) | 57 (7.9%) |
| $45,000 to $49,999 | 45 (5.2%) | 50 (7.0%) |
| $50,000 to $54,999 | 60 (7.0%) | 48 (6.7%) |
| $55,000 to $64,999 | 73 (8.5%) | 53 (7.4%) |
| $65,000 to $74,999 | 147 (17.1%) | 32 (4.5%) |
| $75,000 to $99,999 | 124 (14.4%) | 36 (5.0%) |
| $100,000+ | 123 (14.3%) | 41 (5.7%) |
| Total | 862 (100.0%) | 718 (100.0%) |
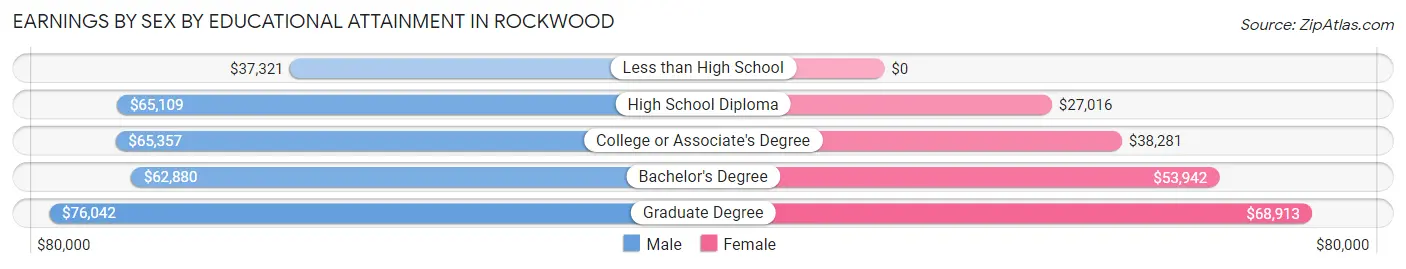
Earnings by Sex by Educational Attainment in Rockwood
Average earnings in Rockwood are $65,000 for men and $38,969 for women, a difference of 40.1%. Men with an educational attainment of graduate degree enjoy the highest average annual earnings of $76,042, while those with less than high school education earn the least with $37,321. Women with an educational attainment of graduate degree earn the most with the average annual earnings of $68,913, while those with high school diploma education have the smallest earnings of $27,016.
| Educational Attainment | Male Income | Female Income |
| Less than High School | $37,321 | $0 |
| High School Diploma | $65,109 | $27,016 |
| College or Associate's Degree | $65,357 | $38,281 |
| Bachelor's Degree | $62,880 | $53,942 |
| Graduate Degree | $76,042 | $68,913 |
| Total | $65,000 | $38,969 |
Family Income in Rockwood
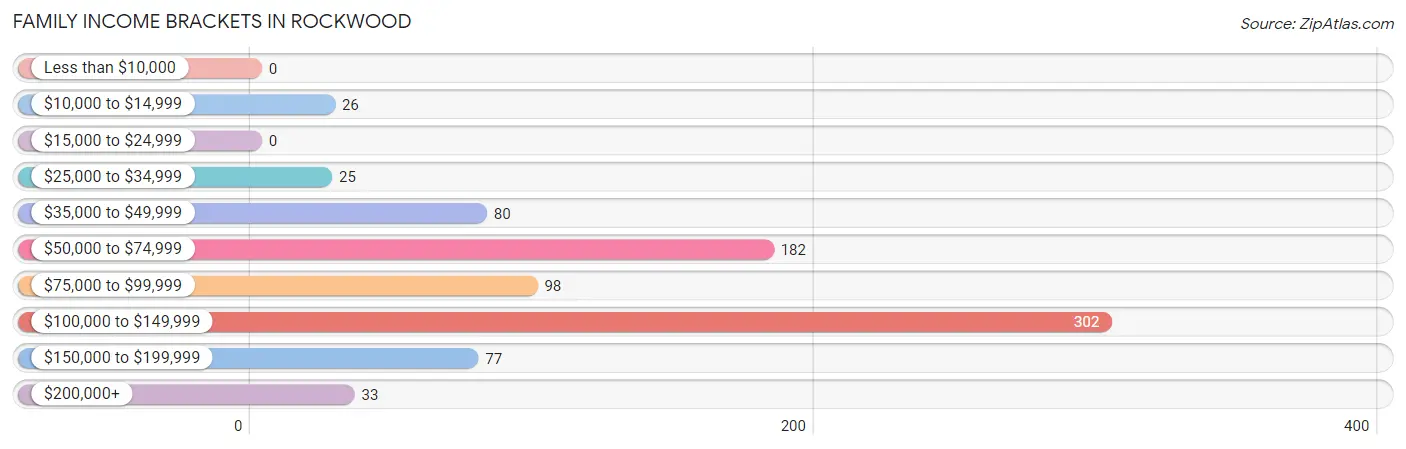
Family Income Brackets in Rockwood
According to the Rockwood family income data, there are 302 families falling into the $100,000 to $149,999 income range, which is the most common income bracket and makes up 36.7% of all families.
| Income Bracket | # Families | % Families |
| Less than $10,000 | 0 | 0.0% |
| $10,000 to $14,999 | 26 | 3.2% |
| $15,000 to $24,999 | 0 | 0.0% |
| $25,000 to $34,999 | 25 | 3.0% |
| $35,000 to $49,999 | 80 | 9.7% |
| $50,000 to $74,999 | 182 | 22.1% |
| $75,000 to $99,999 | 98 | 11.9% |
| $100,000 to $149,999 | 302 | 36.7% |
| $150,000 to $199,999 | 77 | 9.4% |
| $200,000+ | 33 | 4.0% |
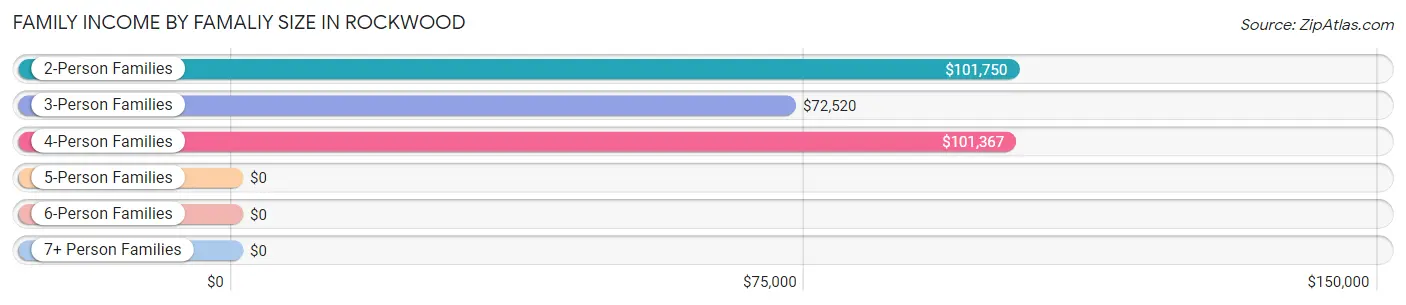
Family Income by Famaliy Size in Rockwood
2-person families (380 | 46.2%) account for the highest median family income in Rockwood with $101,750 per family, while 2-person families (380 | 46.2%) have the highest median income of $50,875 per family member.
| Income Bracket | # Families | Median Income |
| 2-Person Families | 380 (46.2%) | $101,750 |
| 3-Person Families | 257 (31.2%) | $72,520 |
| 4-Person Families | 127 (15.4%) | $101,367 |
| 5-Person Families | 40 (4.9%) | $0 |
| 6-Person Families | 6 (0.7%) | $0 |
| 7+ Person Families | 13 (1.6%) | $0 |
| Total | 823 (100.0%) | $100,015 |
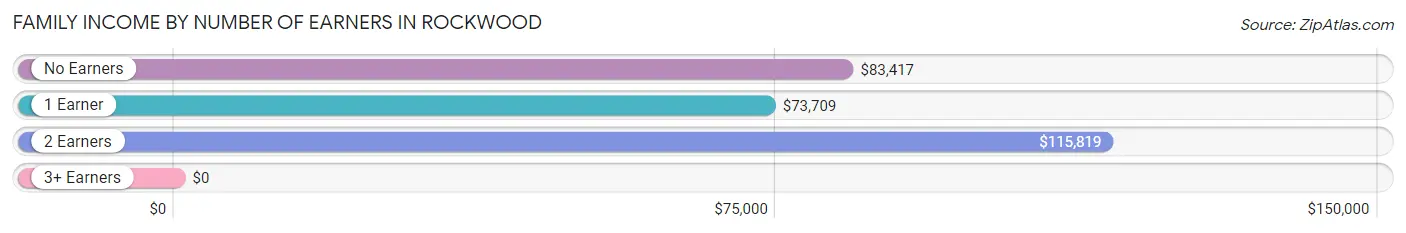
Family Income by Number of Earners in Rockwood
| Number of Earners | # Families | Median Income |
| No Earners | 103 (12.5%) | $83,417 |
| 1 Earner | 325 (39.5%) | $73,709 |
| 2 Earners | 363 (44.1%) | $115,819 |
| 3+ Earners | 32 (3.9%) | $0 |
| Total | 823 (100.0%) | $100,015 |
Household Income in Rockwood
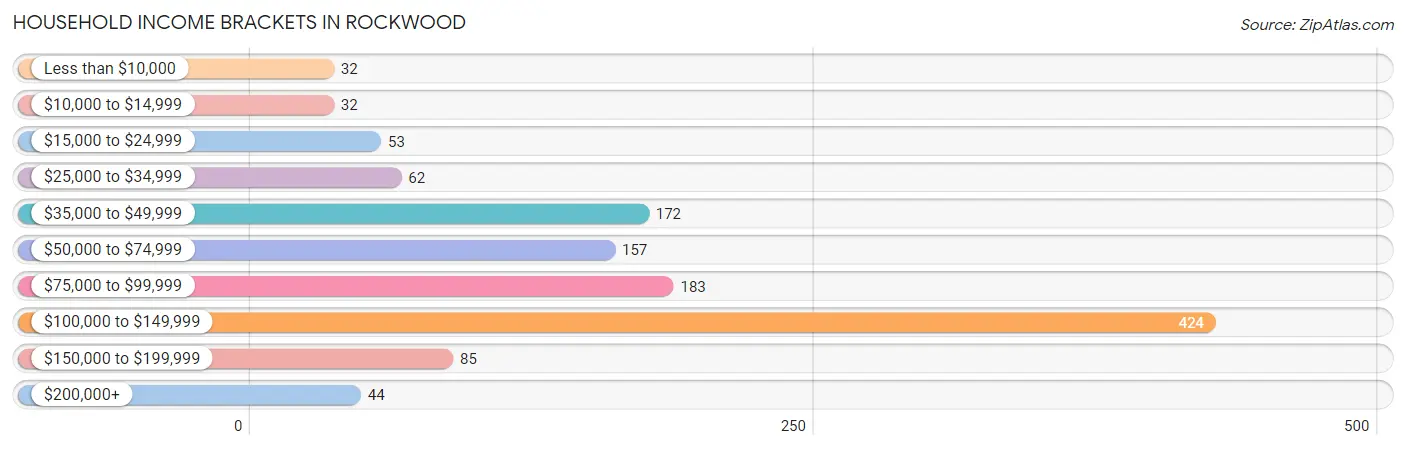
Household Income Brackets in Rockwood
With 424 households falling in the category, the $100,000 to $149,999 income range is the most frequent in Rockwood, accounting for 34.1% of all households. In contrast, only 32 households (2.6%) fall into the less than $10,000 income bracket, making it the least populous group.
| Income Bracket | # Households | % Households |
| Less than $10,000 | 32 | 2.6% |
| $10,000 to $14,999 | 32 | 2.6% |
| $15,000 to $24,999 | 53 | 4.3% |
| $25,000 to $34,999 | 62 | 5.0% |
| $35,000 to $49,999 | 172 | 13.8% |
| $50,000 to $74,999 | 157 | 12.6% |
| $75,000 to $99,999 | 183 | 14.7% |
| $100,000 to $149,999 | 424 | 34.1% |
| $150,000 to $199,999 | 85 | 6.8% |
| $200,000+ | 44 | 3.5% |
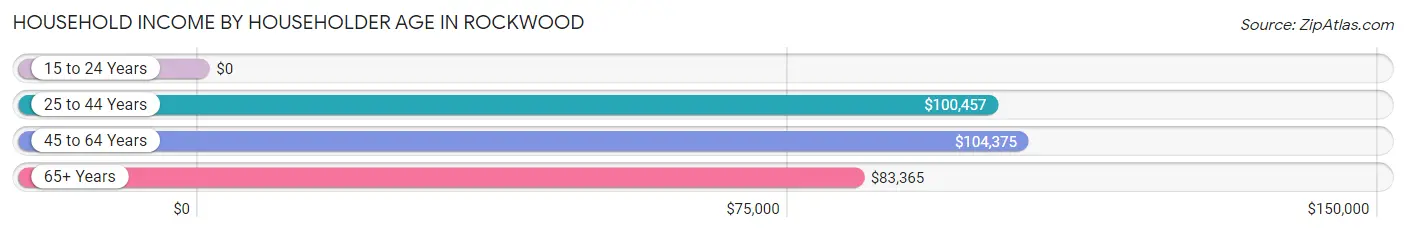
Household Income by Householder Age in Rockwood
The median household income in Rockwood is $93,036, with the highest median household income of $104,375 found in the 45 to 64 years age bracket for the primary householder. A total of 449 households (36.1%) fall into this category. Meanwhile, the 15 to 24 years age bracket for the primary householder has the lowest median household income of $0, with 16 households (1.3%) in this group.
| Income Bracket | # Households | Median Income |
| 15 to 24 Years | 16 (1.3%) | $0 |
| 25 to 44 Years | 354 (28.5%) | $100,457 |
| 45 to 64 Years | 449 (36.1%) | $104,375 |
| 65+ Years | 425 (34.2%) | $83,365 |
| Total | 1,244 (100.0%) | $93,036 |
Poverty in Rockwood
Income Below Poverty by Sex and Age in Rockwood
With 3.4% poverty level for males and 17.3% for females among the residents of Rockwood, 65 to 74 year old males and 18 to 24 year old females are the most vulnerable to poverty, with 22 males (13.5%) and 27 females (52.9%) in their respective age groups living below the poverty level.
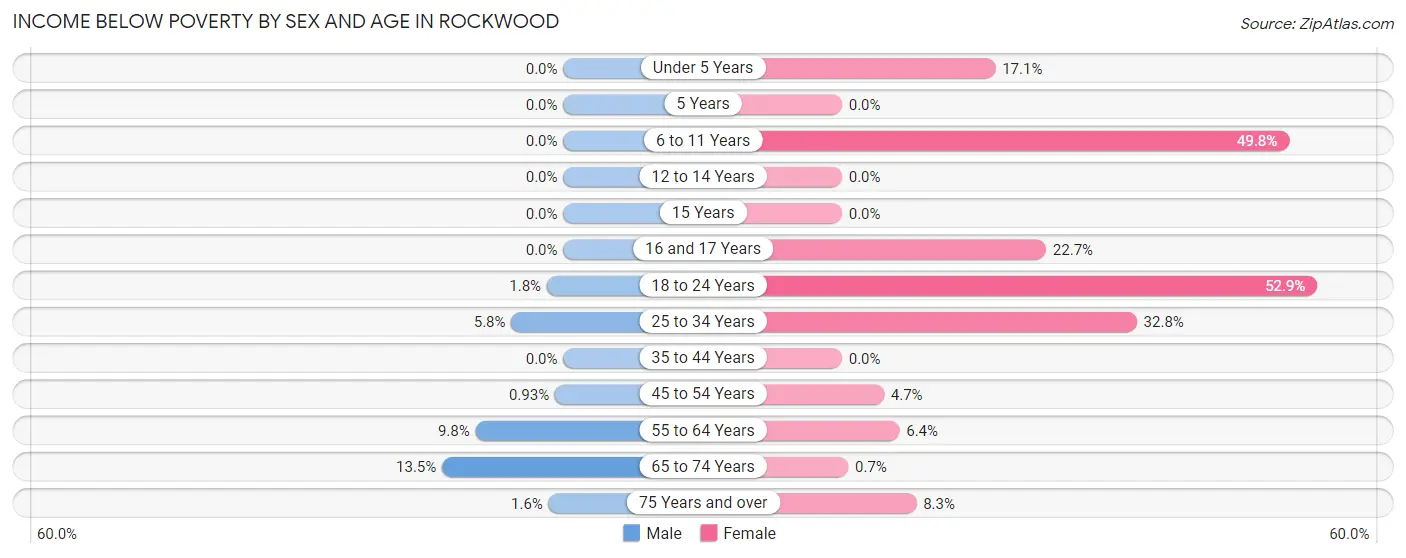
| Age Bracket | Male | Female |
| Under 5 Years | 0 (0.0%) | 20 (17.1%) |
| 5 Years | 0 (0.0%) | 0 (0.0%) |
| 6 to 11 Years | 0 (0.0%) | 129 (49.8%) |
| 12 to 14 Years | 0 (0.0%) | 0 (0.0%) |
| 15 Years | 0 (0.0%) | 0 (0.0%) |
| 16 and 17 Years | 0 (0.0%) | 10 (22.7%) |
| 18 to 24 Years | 2 (1.8%) | 27 (52.9%) |
| 25 to 34 Years | 7 (5.8%) | 66 (32.8%) |
| 35 to 44 Years | 0 (0.0%) | 0 (0.0%) |
| 45 to 54 Years | 2 (0.9%) | 11 (4.7%) |
| 55 to 64 Years | 18 (9.8%) | 13 (6.4%) |
| 65 to 74 Years | 22 (13.5%) | 1 (0.7%) |
| 75 Years and over | 2 (1.6%) | 15 (8.3%) |
| Total | 53 (3.4%) | 292 (17.3%) |
Income Above Poverty by Sex and Age in Rockwood
According to the poverty statistics in Rockwood, males aged under 5 years and females aged 5 years are the age groups that are most secure financially, with 100.0% of males and 100.0% of females in these age groups living above the poverty line.
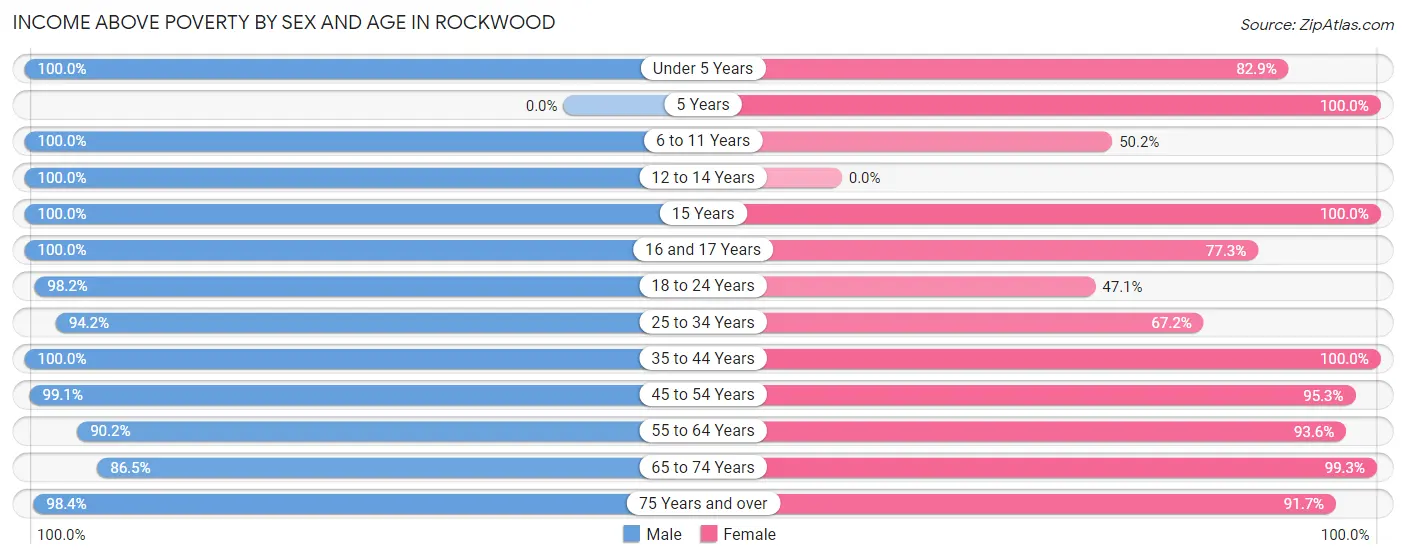
| Age Bracket | Male | Female |
| Under 5 Years | 33 (100.0%) | 97 (82.9%) |
| 5 Years | 0 (0.0%) | 25 (100.0%) |
| 6 to 11 Years | 68 (100.0%) | 130 (50.2%) |
| 12 to 14 Years | 138 (100.0%) | 0 (0.0%) |
| 15 Years | 51 (100.0%) | 30 (100.0%) |
| 16 and 17 Years | 17 (100.0%) | 34 (77.3%) |
| 18 to 24 Years | 107 (98.2%) | 24 (47.1%) |
| 25 to 34 Years | 114 (94.2%) | 135 (67.2%) |
| 35 to 44 Years | 325 (100.0%) | 196 (100.0%) |
| 45 to 54 Years | 214 (99.1%) | 224 (95.3%) |
| 55 to 64 Years | 166 (90.2%) | 190 (93.6%) |
| 65 to 74 Years | 141 (86.5%) | 141 (99.3%) |
| 75 Years and over | 121 (98.4%) | 166 (91.7%) |
| Total | 1,495 (96.6%) | 1,392 (82.7%) |
Income Below Poverty Among Married-Couple Families in Rockwood
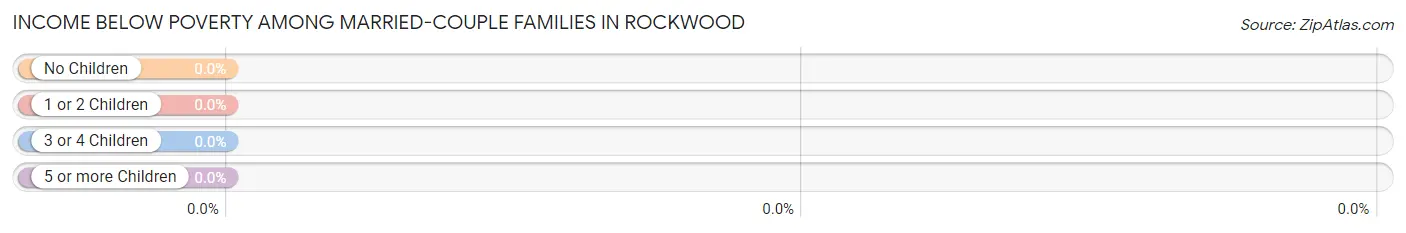
| Children | Above Poverty | Below Poverty |
| No Children | 374 (100.0%) | 0 (0.0%) |
| 1 or 2 Children | 186 (100.0%) | 0 (0.0%) |
| 3 or 4 Children | 13 (100.0%) | 0 (0.0%) |
| 5 or more Children | 0 (0.0%) | 0 (0.0%) |
| Total | 573 (100.0%) | 0 (0.0%) |
Income Below Poverty Among Single-Parent Households in Rockwood
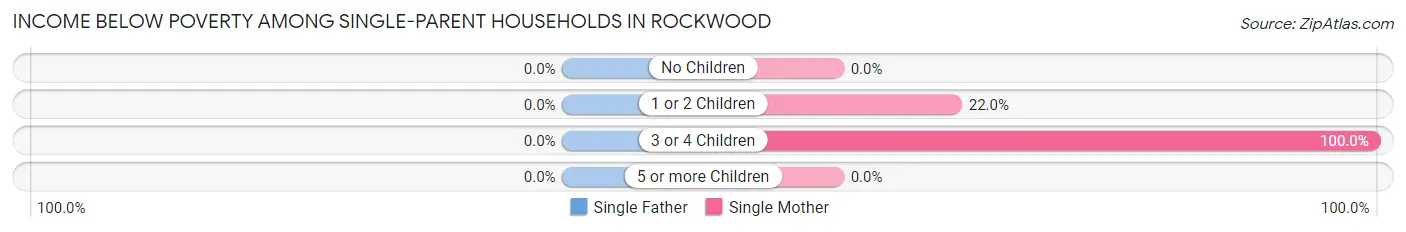
| Children | Single Father | Single Mother |
| No Children | 0 (0.0%) | 0 (0.0%) |
| 1 or 2 Children | 0 (0.0%) | 11 (22.0%) |
| 3 or 4 Children | 0 (0.0%) | 15 (100.0%) |
| 5 or more Children | 0 (0.0%) | 0 (0.0%) |
| Total | 0 (0.0%) | 26 (27.4%) |
Income Below Poverty Among Married-Couple vs Single-Parent Households in Rockwood
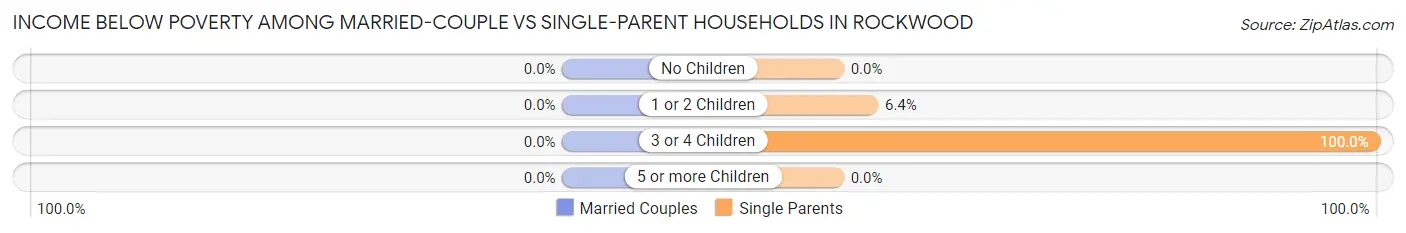
| Children | Married-Couple Families | Single-Parent Households |
| No Children | 0 (0.0%) | 0 (0.0%) |
| 1 or 2 Children | 0 (0.0%) | 11 (6.4%) |
| 3 or 4 Children | 0 (0.0%) | 15 (100.0%) |
| 5 or more Children | 0 (0.0%) | 0 (0.0%) |
| Total | 0 (0.0%) | 26 (10.4%) |
Race in Rockwood
The most populous races in Rockwood are White / Caucasian (2,825 | 87.4%), Two or more Races (403 | 12.5%), and Hispanic or Latino (220 | 6.8%).
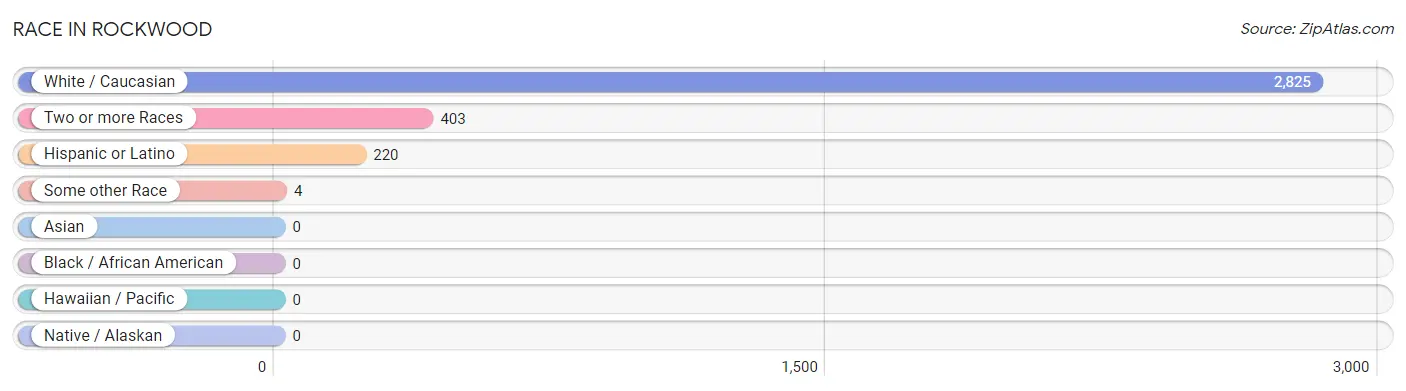
| Race | # Population | % Population |
| Asian | 0 | 0.0% |
| Black / African American | 0 | 0.0% |
| Hawaiian / Pacific | 0 | 0.0% |
| Hispanic or Latino | 220 | 6.8% |
| Native / Alaskan | 0 | 0.0% |
| White / Caucasian | 2,825 | 87.4% |
| Two or more Races | 403 | 12.5% |
| Some other Race | 4 | 0.1% |
| Total | 3,232 | 100.0% |
Ancestry in Rockwood
The most populous ancestries reported in Rockwood are German (736 | 22.8%), Irish (435 | 13.5%), Polish (347 | 10.7%), English (323 | 10.0%), and Mexican (220 | 6.8%), together accounting for 63.8% of all Rockwood residents.
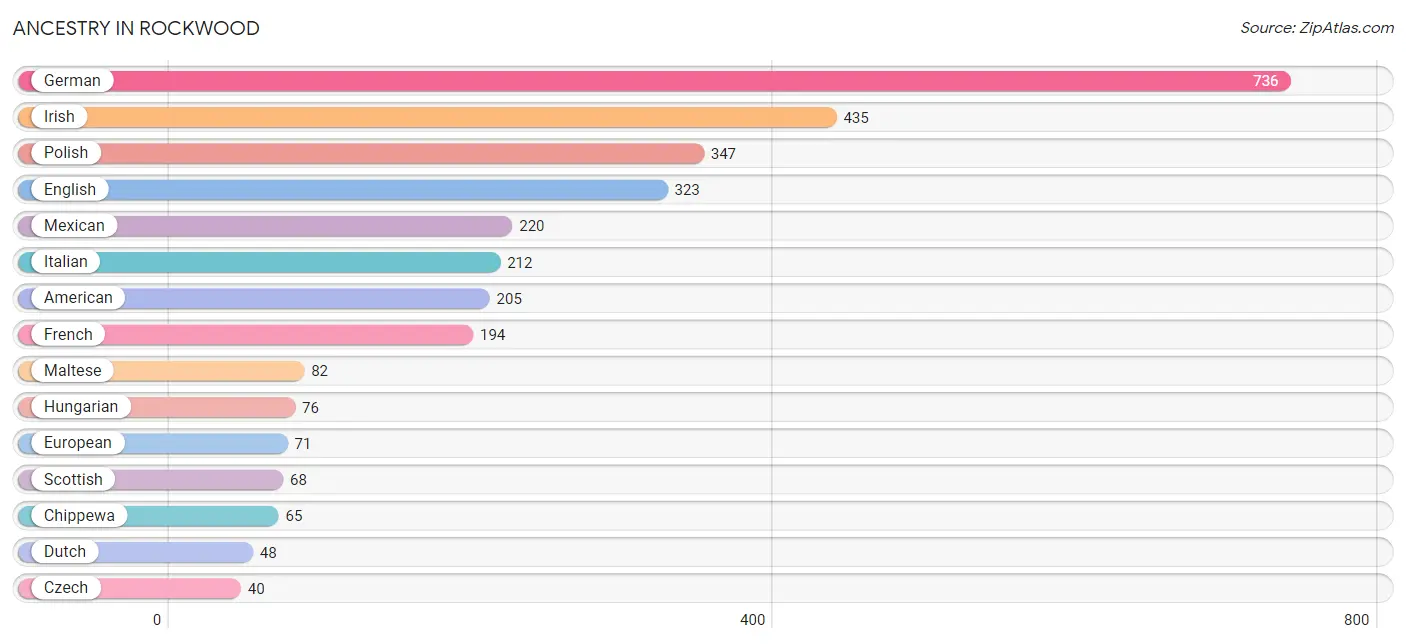
| Ancestry | # Population | % Population |
| American | 205 | 6.3% |
| Apache | 22 | 0.7% |
| Burmese | 8 | 0.3% |
| Canadian | 11 | 0.3% |
| Cherokee | 38 | 1.2% |
| Chippewa | 65 | 2.0% |
| Czech | 40 | 1.2% |
| Czechoslovakian | 7 | 0.2% |
| Danish | 9 | 0.3% |
| Dutch | 48 | 1.5% |
| English | 323 | 10.0% |
| European | 71 | 2.2% |
| Finnish | 11 | 0.3% |
| French | 194 | 6.0% |
| French Canadian | 34 | 1.1% |
| German | 736 | 22.8% |
| Greek | 9 | 0.3% |
| Hungarian | 76 | 2.4% |
| Irish | 435 | 13.5% |
| Italian | 212 | 6.6% |
| Maltese | 82 | 2.5% |
| Mexican | 220 | 6.8% |
| Polish | 347 | 10.7% |
| Russian | 26 | 0.8% |
| Scotch-Irish | 7 | 0.2% |
| Scottish | 68 | 2.1% |
| Swedish | 26 | 0.8% |
| Swiss | 24 | 0.7% |
| Welsh | 9 | 0.3% | View All 29 Rows |
Immigrants in Rockwood
The most numerous immigrant groups reported in Rockwood came from Europe (23 | 0.7%), Southern Europe (23 | 0.7%), Canada (10 | 0.3%), and Italy (8 | 0.3%), together accounting for 2.0% of all Rockwood residents.
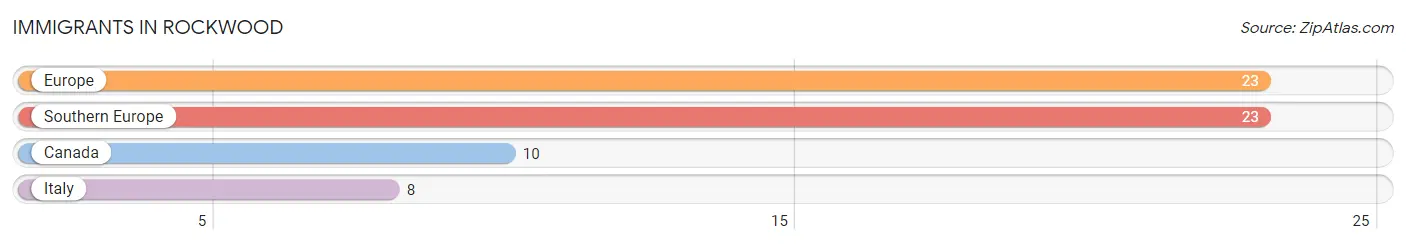
| Immigration Origin | # Population | % Population |
| Canada | 10 | 0.3% |
| Europe | 23 | 0.7% |
| Italy | 8 | 0.3% |
| Southern Europe | 23 | 0.7% | View All 4 Rows |
Sex and Age in Rockwood
Sex and Age in Rockwood
The most populous age groups in Rockwood are 40 to 44 Years (169 | 10.9%) for men and 5 to 9 Years (255 | 15.1%) for women.
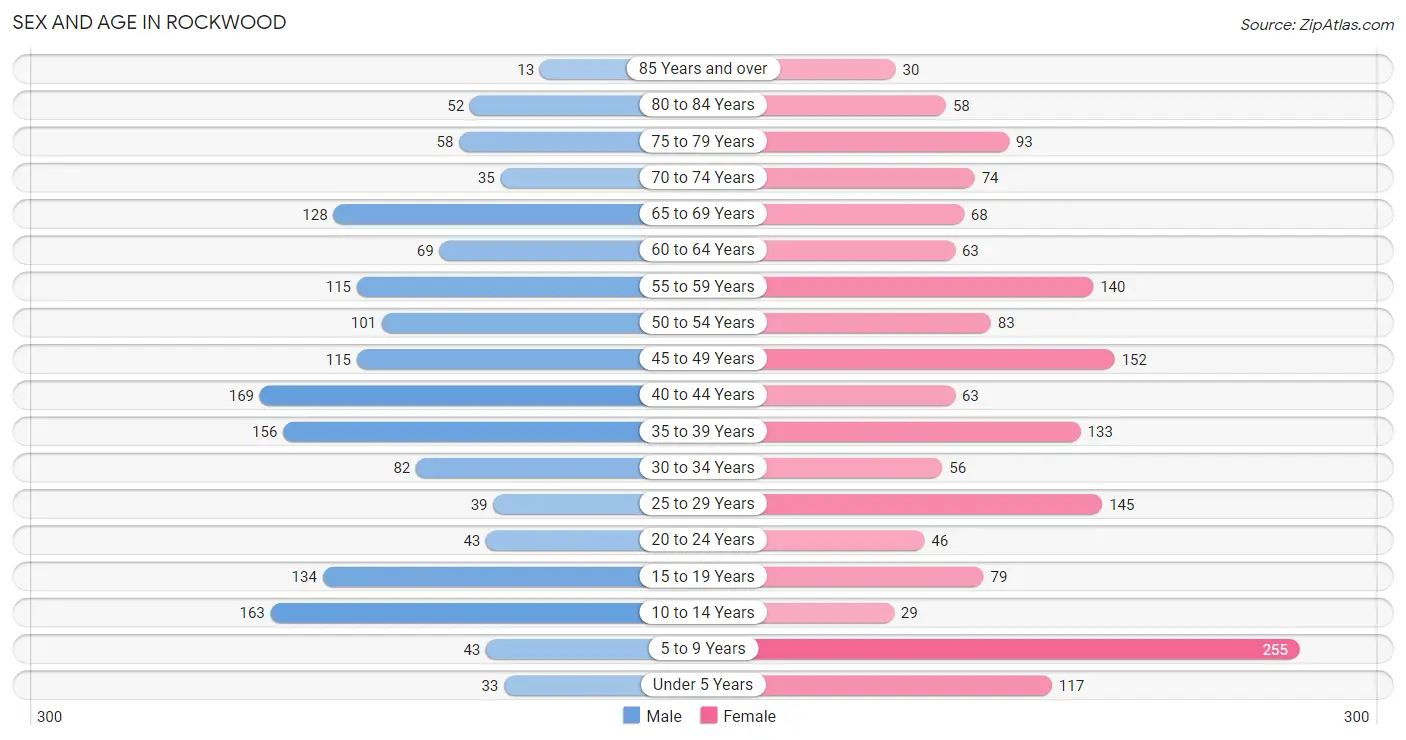
| Age Bracket | Male | Female |
| Under 5 Years | 33 (2.1%) | 117 (7.0%) |
| 5 to 9 Years | 43 (2.8%) | 255 (15.1%) |
| 10 to 14 Years | 163 (10.5%) | 29 (1.7%) |
| 15 to 19 Years | 134 (8.7%) | 79 (4.7%) |
| 20 to 24 Years | 43 (2.8%) | 46 (2.7%) |
| 25 to 29 Years | 39 (2.5%) | 145 (8.6%) |
| 30 to 34 Years | 82 (5.3%) | 56 (3.3%) |
| 35 to 39 Years | 156 (10.1%) | 133 (7.9%) |
| 40 to 44 Years | 169 (10.9%) | 63 (3.7%) |
| 45 to 49 Years | 115 (7.4%) | 152 (9.0%) |
| 50 to 54 Years | 101 (6.5%) | 83 (4.9%) |
| 55 to 59 Years | 115 (7.4%) | 140 (8.3%) |
| 60 to 64 Years | 69 (4.5%) | 63 (3.7%) |
| 65 to 69 Years | 128 (8.3%) | 68 (4.0%) |
| 70 to 74 Years | 35 (2.3%) | 74 (4.4%) |
| 75 to 79 Years | 58 (3.7%) | 93 (5.5%) |
| 80 to 84 Years | 52 (3.4%) | 58 (3.4%) |
| 85 Years and over | 13 (0.8%) | 30 (1.8%) |
| Total | 1,548 (100.0%) | 1,684 (100.0%) |
Families and Households in Rockwood
Median Family Size in Rockwood
The median family size in Rockwood is 3.15 persons per family, with single female/mother families (95 | 11.5%) accounting for the largest median family size of 4.74 persons per family. On the other hand, married-couple families (573 | 69.6%) represent the smallest median family size with 2.94 persons per family.
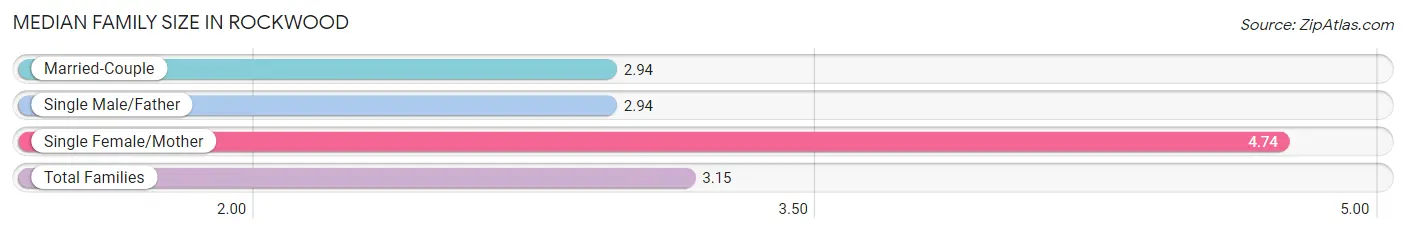
| Family Type | # Families | Family Size |
| Married-Couple | 573 (69.6%) | 2.94 |
| Single Male/Father | 155 (18.8%) | 2.94 |
| Single Female/Mother | 95 (11.5%) | 4.74 |
| Total Families | 823 (100.0%) | 3.15 |
Median Household Size in Rockwood
The median household size in Rockwood is 2.58 persons per household, with single female/mother households (95 | 7.6%) accounting for the largest median household size of 4.95 persons per household. non-family households (421 | 33.8%) represent the smallest median household size with 1.11 persons per household.
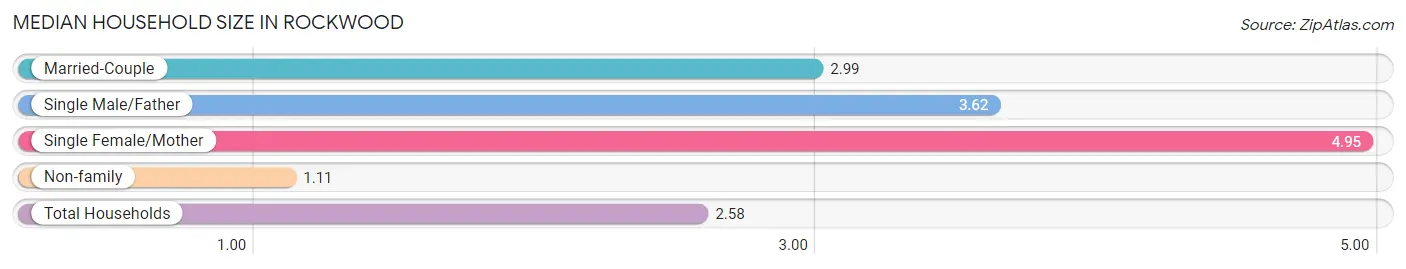
| Household Type | # Households | Household Size |
| Married-Couple | 573 (46.1%) | 2.99 |
| Single Male/Father | 155 (12.5%) | 3.62 |
| Single Female/Mother | 95 (7.6%) | 4.95 |
| Non-family | 421 (33.8%) | 1.11 |
| Total Households | 1,244 (100.0%) | 2.58 |
Household Size by Marriage Status in Rockwood
Out of a total of 1,244 households in Rockwood, 823 (66.2%) are family households, while 421 (33.8%) are nonfamily households. The most numerous type of family households are 2-person households, comprising 347, and the most common type of nonfamily households are 1-person households, comprising 374.
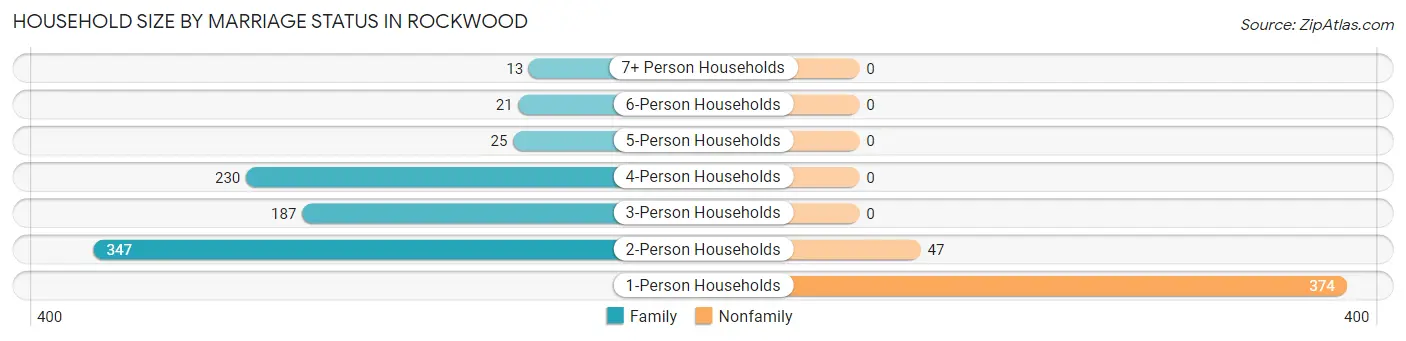
| Household Size | Family Households | Nonfamily Households |
| 1-Person Households | - | 374 (30.1%) |
| 2-Person Households | 347 (27.9%) | 47 (3.8%) |
| 3-Person Households | 187 (15.0%) | 0 (0.0%) |
| 4-Person Households | 230 (18.5%) | 0 (0.0%) |
| 5-Person Households | 25 (2.0%) | 0 (0.0%) |
| 6-Person Households | 21 (1.7%) | 0 (0.0%) |
| 7+ Person Households | 13 (1.1%) | 0 (0.0%) |
| Total | 823 (66.2%) | 421 (33.8%) |
Female Fertility in Rockwood
Fertility by Age in Rockwood
Average fertility rate in Rockwood is 104.0 births per 1,000 women. Women in the age bracket of 20 to 34 years have the highest fertility rate with 267.0 births per 1,000 women. Women in the age bracket of 20 to 34 years acount for 88.0% of all women with births.
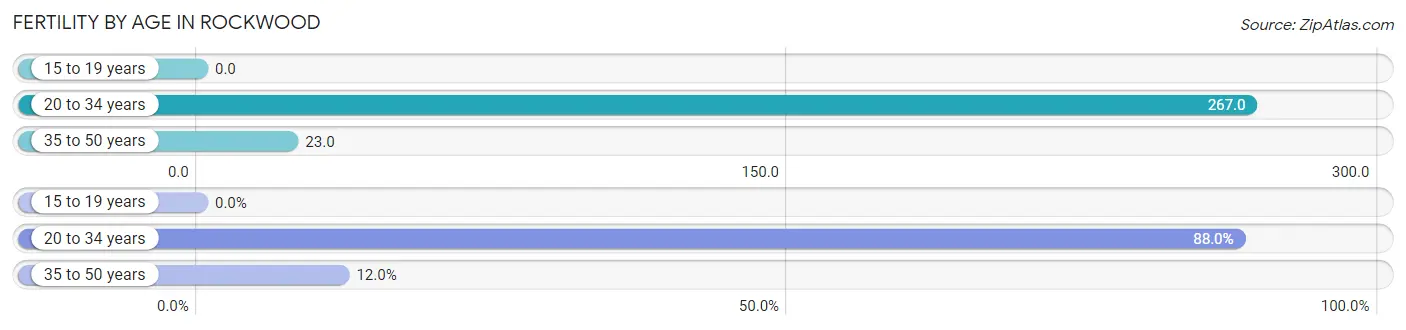
| Age Bracket | Women with Births | Births / 1,000 Women |
| 15 to 19 years | 0 (0.0%) | 0.0 |
| 20 to 34 years | 66 (88.0%) | 267.0 |
| 35 to 50 years | 9 (12.0%) | 23.0 |
| Total | 75 (100.0%) | 104.0 |
Fertility by Age by Marriage Status in Rockwood
12.0% of women with births (75) in Rockwood are married. The highest percentage of unmarried women with births falls into 20 to 34 years age bracket with 100.0% of them unmarried at the time of birth, while the lowest percentage of unmarried women with births belong to 35 to 50 years age bracket with 0.0% of them unmarried.
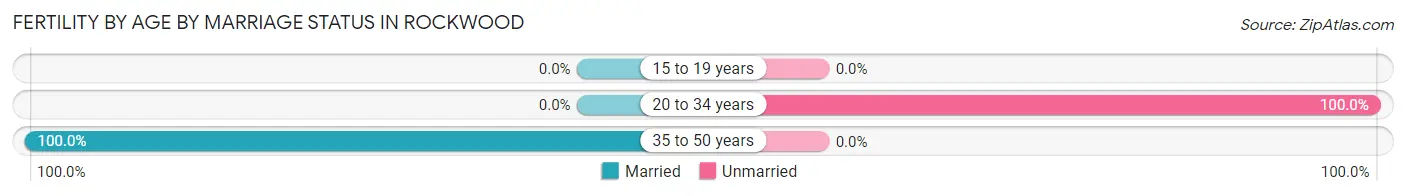
| Age Bracket | Married | Unmarried |
| 15 to 19 years | 0 (0.0%) | 0 (0.0%) |
| 20 to 34 years | 0 (0.0%) | 66 (100.0%) |
| 35 to 50 years | 9 (100.0%) | 0 (0.0%) |
| Total | 9 (12.0%) | 66 (88.0%) |
Fertility by Education in Rockwood
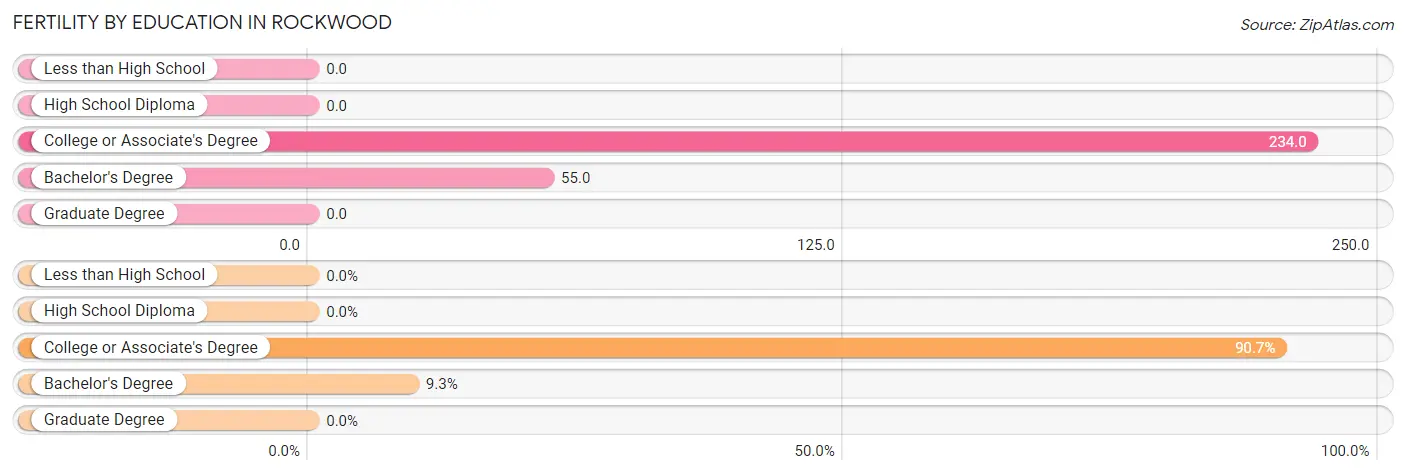
| Educational Attainment | Women with Births | Births / 1,000 Women |
| Less than High School | 0 (0.0%) | 0.0 |
| High School Diploma | 0 (0.0%) | 0.0 |
| College or Associate's Degree | 68 (90.7%) | 234.0 |
| Bachelor's Degree | 7 (9.3%) | 55.0 |
| Graduate Degree | 0 (0.0%) | 0.0 |
| Total | 75 (100.0%) | 104.0 |
Fertility by Education by Marriage Status in Rockwood
88.0% of women with births in Rockwood are unmarried. Women with the educational attainment of college or associate's degree are most likely to be married with 13.2% of them married at childbirth, while women with the educational attainment of bachelor's degree are least likely to be married with 100.0% of them unmarried at childbirth.
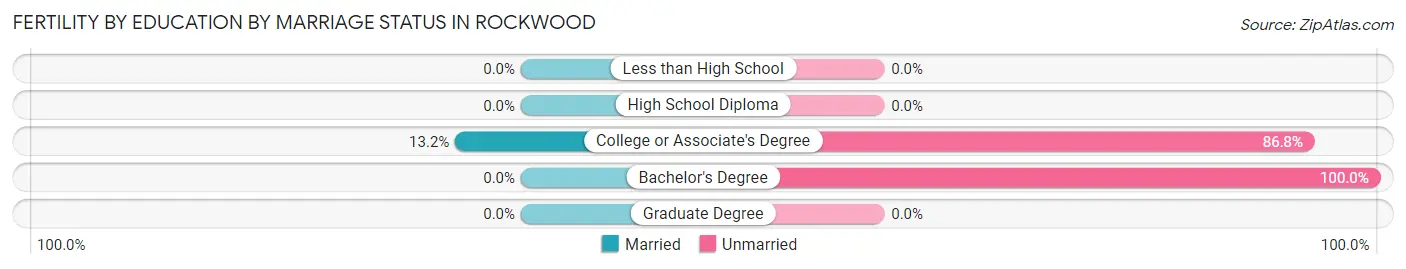
| Educational Attainment | Married | Unmarried |
| Less than High School | 0 (0.0%) | 0 (0.0%) |
| High School Diploma | 0 (0.0%) | 0 (0.0%) |
| College or Associate's Degree | 9 (13.2%) | 59 (86.8%) |
| Bachelor's Degree | 0 (0.0%) | 7 (100.0%) |
| Graduate Degree | 0 (0.0%) | 0 (0.0%) |
| Total | 9 (12.0%) | 66 (88.0%) |
Employment Characteristics in Rockwood
Employment by Class of Employer in Rockwood
Among the 1,461 employed individuals in Rockwood, private company employees (965 | 66.0%), not-for-profit organizations (230 | 15.7%), and state government employees (114 | 7.8%) make up the most common classes of employment.
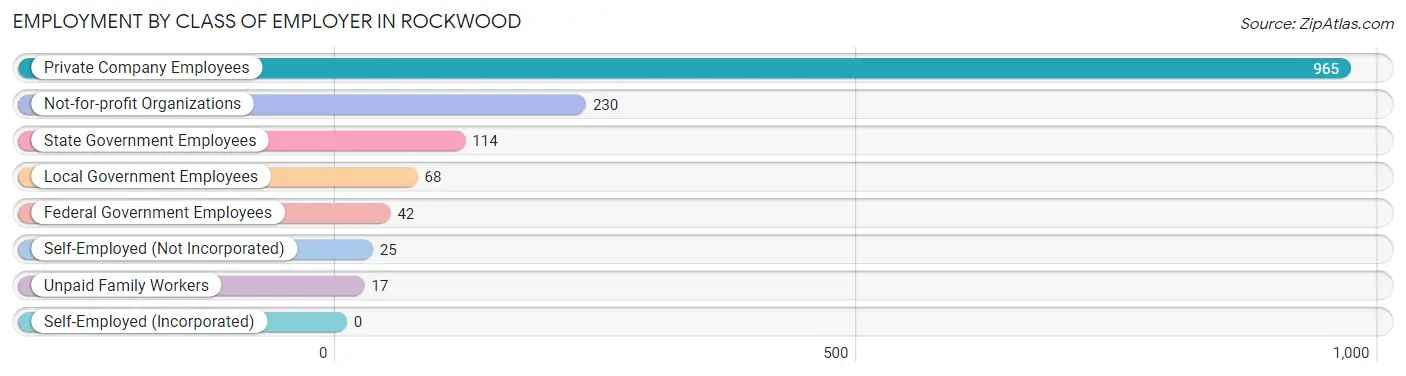
| Employer Class | # Employees | % Employees |
| Private Company Employees | 965 | 66.0% |
| Self-Employed (Incorporated) | 0 | 0.0% |
| Self-Employed (Not Incorporated) | 25 | 1.7% |
| Not-for-profit Organizations | 230 | 15.7% |
| Local Government Employees | 68 | 4.6% |
| State Government Employees | 114 | 7.8% |
| Federal Government Employees | 42 | 2.9% |
| Unpaid Family Workers | 17 | 1.2% |
| Total | 1,461 | 100.0% |
Employment Status by Age in Rockwood
According to the labor force statistics for Rockwood, out of the total population over 16 years of age (2,511), 60.7% or 1,524 individuals are in the labor force, with 3.3% or 50 of them unemployed. The age group with the highest labor force participation rate is 35 to 44 years, with 95.8% or 499 individuals in the labor force. Within the labor force, the 16 to 19 years age range has the highest percentage of unemployed individuals, with 48.0% or 12 of them being unemployed.
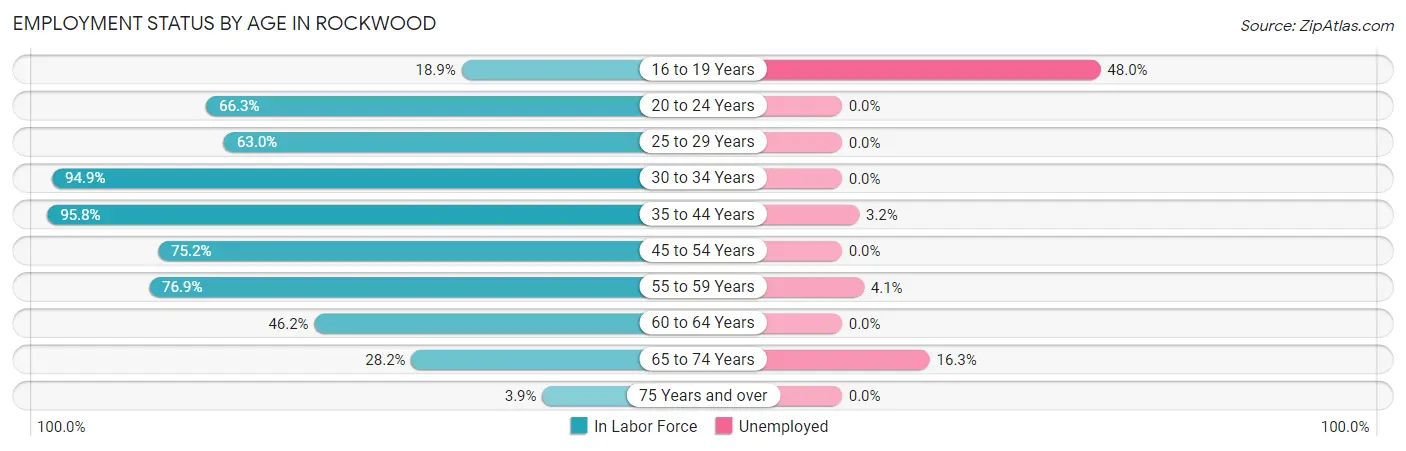
| Age Bracket | In Labor Force | Unemployed |
| 16 to 19 Years | 25 (18.9%) | 12 (48.0%) |
| 20 to 24 Years | 59 (66.3%) | 0 (0.0%) |
| 25 to 29 Years | 116 (63.0%) | 0 (0.0%) |
| 30 to 34 Years | 131 (94.9%) | 0 (0.0%) |
| 35 to 44 Years | 499 (95.8%) | 16 (3.2%) |
| 45 to 54 Years | 339 (75.2%) | 0 (0.0%) |
| 55 to 59 Years | 196 (76.9%) | 8 (4.1%) |
| 60 to 64 Years | 61 (46.2%) | 0 (0.0%) |
| 65 to 74 Years | 86 (28.2%) | 14 (16.3%) |
| 75 Years and over | 12 (3.9%) | 0 (0.0%) |
| Total | 1,524 (60.7%) | 50 (3.3%) |
Employment Status by Educational Attainment in Rockwood
According to labor force statistics for Rockwood, 79.8% of individuals (1,341) out of the total population between 25 and 64 years of age (1,681) are in the labor force, with 1.8% or 24 of them being unemployed. The group with the highest labor force participation rate are those with the educational attainment of bachelor's degree or higher, with 91.1% or 398 individuals in the labor force. Within the labor force, individuals with high school diploma education have the highest percentage of unemployment, with 3.8% or 16 of them being unemployed.
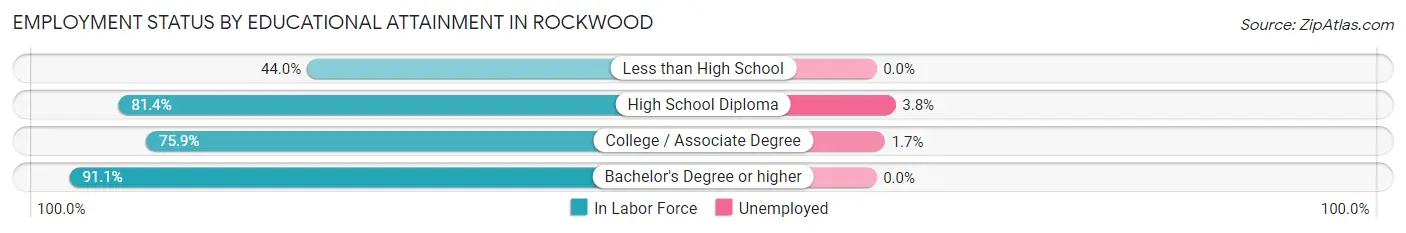
| Educational Attainment | In Labor Force | Unemployed |
| Less than High School | 40 (44.0%) | 0 (0.0%) |
| High School Diploma | 424 (81.4%) | 20 (3.8%) |
| College / Associate Degree | 480 (75.9%) | 11 (1.7%) |
| Bachelor's Degree or higher | 398 (91.1%) | 0 (0.0%) |
| Total | 1,341 (79.8%) | 30 (1.8%) |
Employment Occupations by Sex in Rockwood
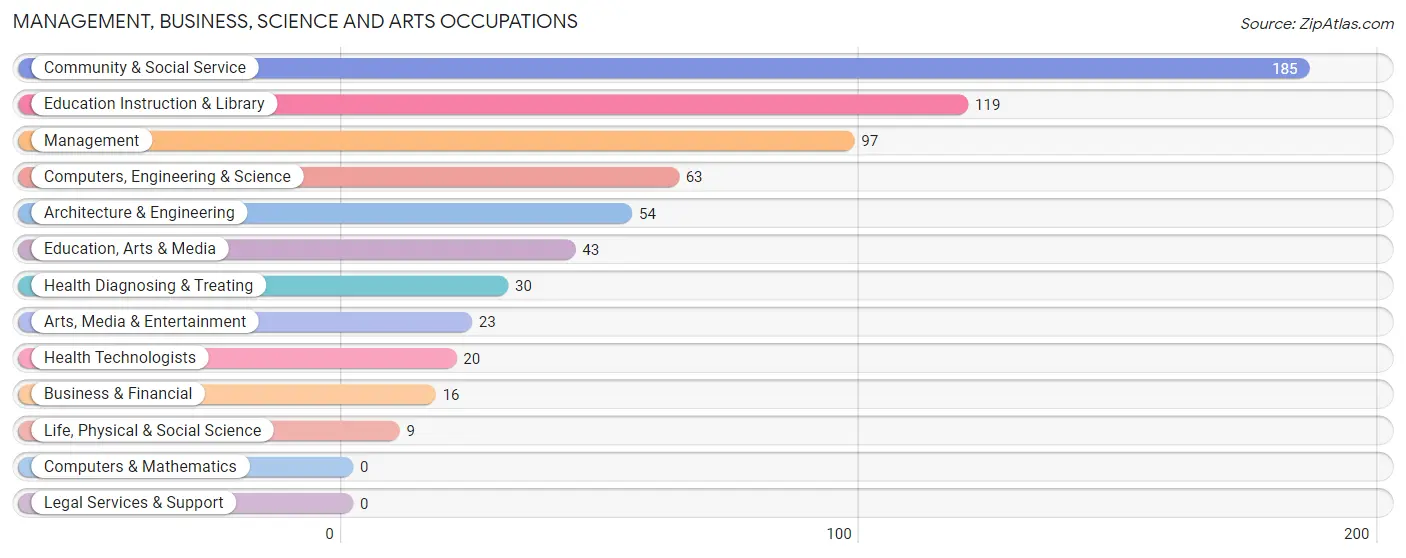
Management, Business, Science and Arts Occupations
The most common Management, Business, Science and Arts occupations in Rockwood are Community & Social Service (185 | 12.6%), Education Instruction & Library (119 | 8.1%), Management (97 | 6.6%), Computers, Engineering & Science (63 | 4.3%), and Architecture & Engineering (54 | 3.7%).
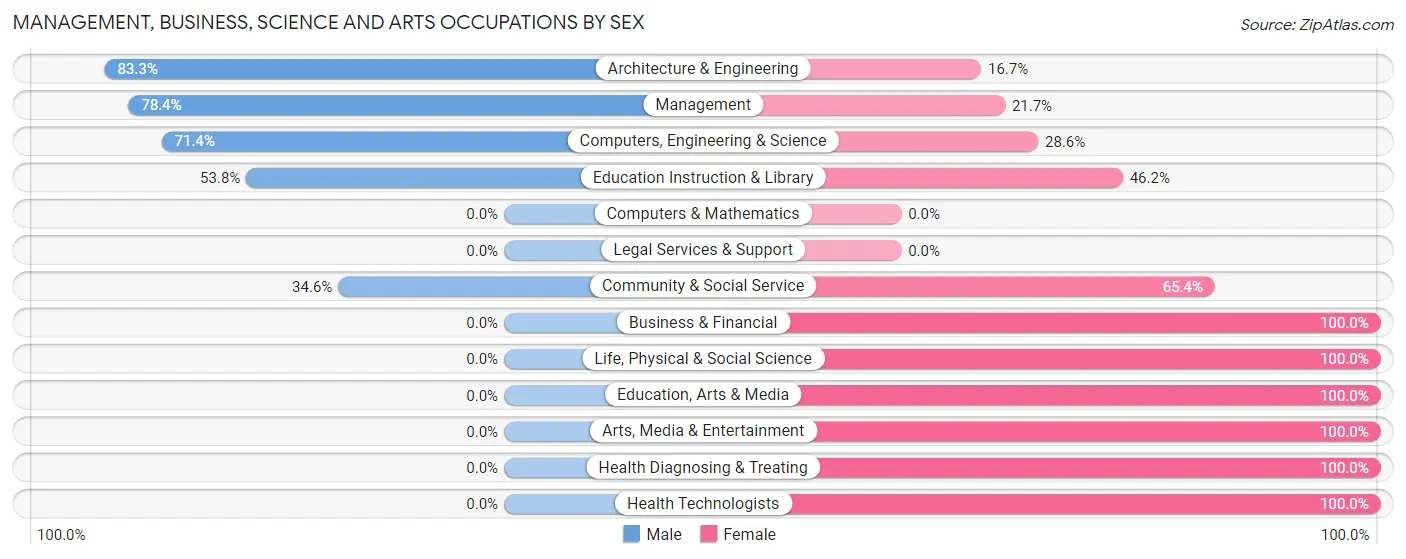
Management, Business, Science and Arts Occupations by Sex
Within the Management, Business, Science and Arts occupations in Rockwood, the most male-oriented occupations are Architecture & Engineering (83.3%), Management (78.3%), and Computers, Engineering & Science (71.4%), while the most female-oriented occupations are Business & Financial (100.0%), Life, Physical & Social Science (100.0%), and Education, Arts & Media (100.0%).
| Occupation | Male | Female |
| Management | 76 (78.3%) | 21 (21.6%) |
| Business & Financial | 0 (0.0%) | 16 (100.0%) |
| Computers, Engineering & Science | 45 (71.4%) | 18 (28.6%) |
| Computers & Mathematics | 0 (0.0%) | 0 (0.0%) |
| Architecture & Engineering | 45 (83.3%) | 9 (16.7%) |
| Life, Physical & Social Science | 0 (0.0%) | 9 (100.0%) |
| Community & Social Service | 64 (34.6%) | 121 (65.4%) |
| Education, Arts & Media | 0 (0.0%) | 43 (100.0%) |
| Legal Services & Support | 0 (0.0%) | 0 (0.0%) |
| Education Instruction & Library | 64 (53.8%) | 55 (46.2%) |
| Arts, Media & Entertainment | 0 (0.0%) | 23 (100.0%) |
| Health Diagnosing & Treating | 0 (0.0%) | 30 (100.0%) |
| Health Technologists | 0 (0.0%) | 20 (100.0%) |
| Total (Category) | 185 (47.3%) | 206 (52.7%) |
| Total (Overall) | 801 (54.3%) | 673 (45.7%) |
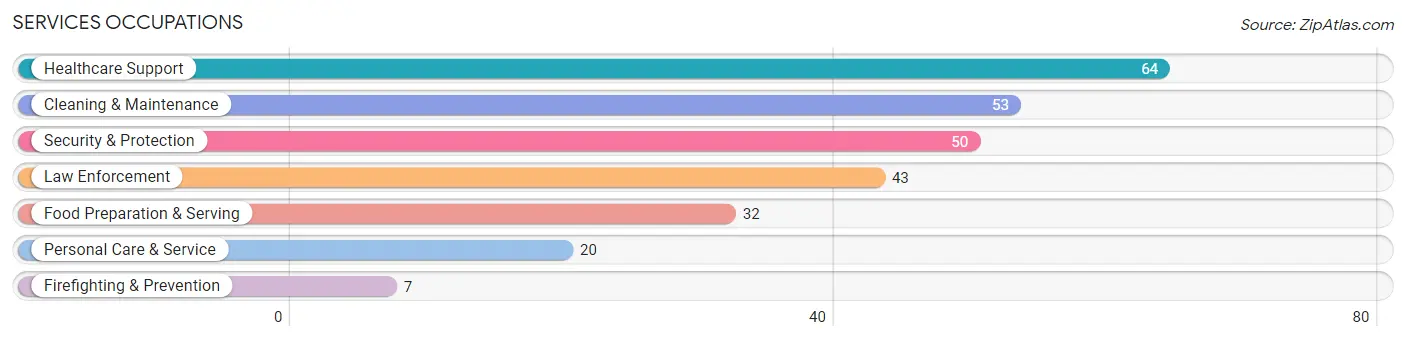
Services Occupations
The most common Services occupations in Rockwood are Healthcare Support (64 | 4.3%), Cleaning & Maintenance (53 | 3.6%), Security & Protection (50 | 3.4%), Law Enforcement (43 | 2.9%), and Food Preparation & Serving (32 | 2.2%).
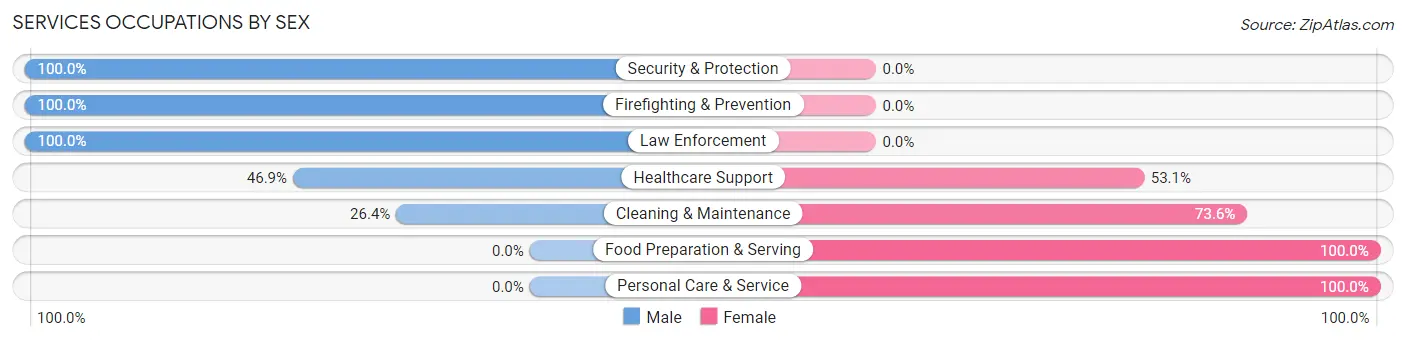
Services Occupations by Sex
Within the Services occupations in Rockwood, the most male-oriented occupations are Security & Protection (100.0%), Firefighting & Prevention (100.0%), and Law Enforcement (100.0%), while the most female-oriented occupations are Food Preparation & Serving (100.0%), Personal Care & Service (100.0%), and Cleaning & Maintenance (73.6%).
| Occupation | Male | Female |
| Healthcare Support | 30 (46.9%) | 34 (53.1%) |
| Security & Protection | 50 (100.0%) | 0 (0.0%) |
| Firefighting & Prevention | 7 (100.0%) | 0 (0.0%) |
| Law Enforcement | 43 (100.0%) | 0 (0.0%) |
| Food Preparation & Serving | 0 (0.0%) | 32 (100.0%) |
| Cleaning & Maintenance | 14 (26.4%) | 39 (73.6%) |
| Personal Care & Service | 0 (0.0%) | 20 (100.0%) |
| Total (Category) | 94 (42.9%) | 125 (57.1%) |
| Total (Overall) | 801 (54.3%) | 673 (45.7%) |
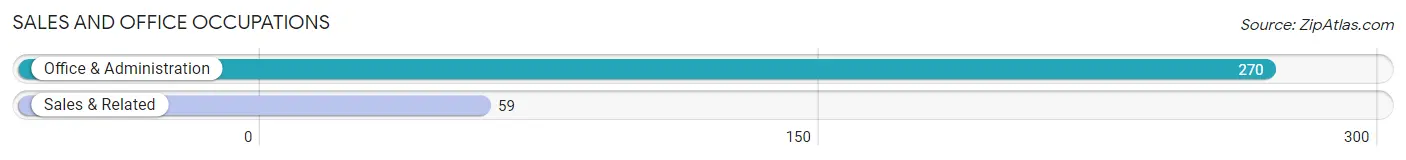
Sales and Office Occupations
The most common Sales and Office occupations in Rockwood are Office & Administration (270 | 18.3%), and Sales & Related (59 | 4.0%).
Sales and Office Occupations by Sex
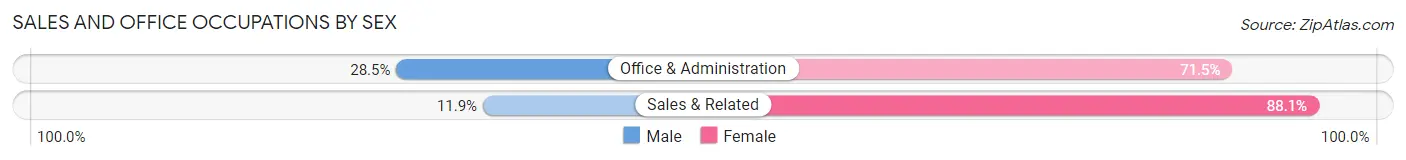
| Occupation | Male | Female |
| Sales & Related | 7 (11.9%) | 52 (88.1%) |
| Office & Administration | 77 (28.5%) | 193 (71.5%) |
| Total (Category) | 84 (25.5%) | 245 (74.5%) |
| Total (Overall) | 801 (54.3%) | 673 (45.7%) |
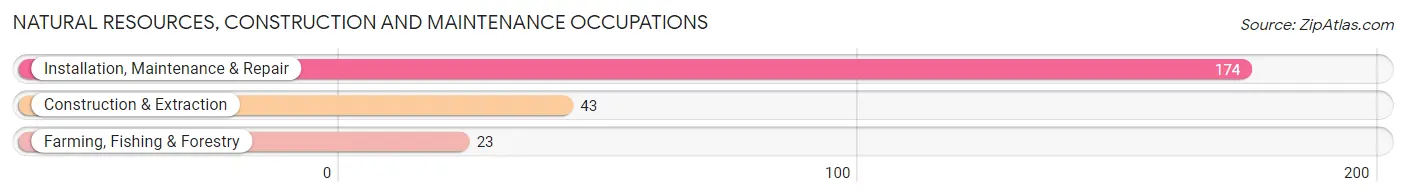
Natural Resources, Construction and Maintenance Occupations
The most common Natural Resources, Construction and Maintenance occupations in Rockwood are Installation, Maintenance & Repair (174 | 11.8%), Construction & Extraction (43 | 2.9%), and Farming, Fishing & Forestry (23 | 1.6%).
Natural Resources, Construction and Maintenance Occupations by Sex
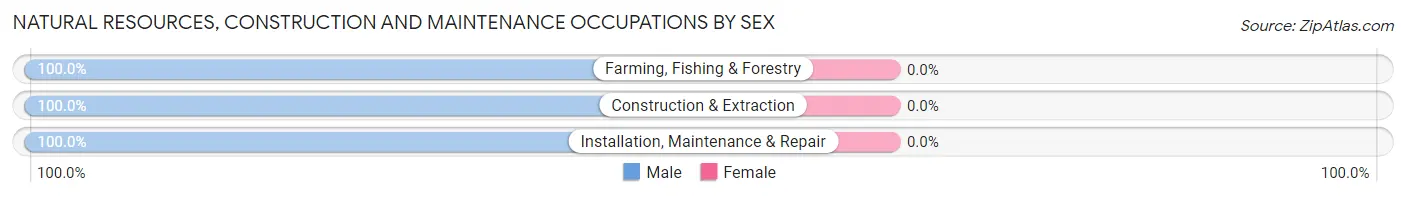
| Occupation | Male | Female |
| Farming, Fishing & Forestry | 23 (100.0%) | 0 (0.0%) |
| Construction & Extraction | 43 (100.0%) | 0 (0.0%) |
| Installation, Maintenance & Repair | 174 (100.0%) | 0 (0.0%) |
| Total (Category) | 240 (100.0%) | 0 (0.0%) |
| Total (Overall) | 801 (54.3%) | 673 (45.7%) |
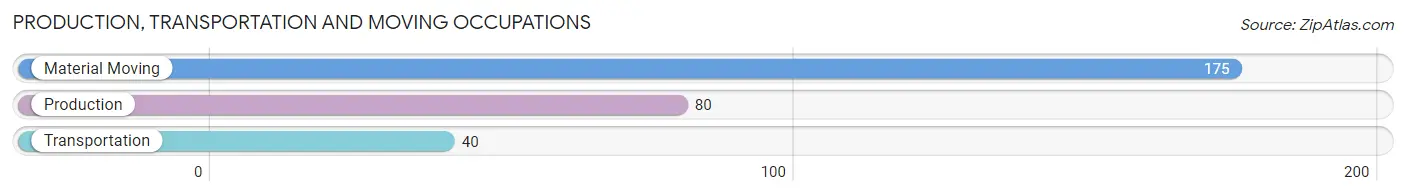
Production, Transportation and Moving Occupations
The most common Production, Transportation and Moving occupations in Rockwood are Material Moving (175 | 11.9%), Production (80 | 5.4%), and Transportation (40 | 2.7%).
Production, Transportation and Moving Occupations by Sex
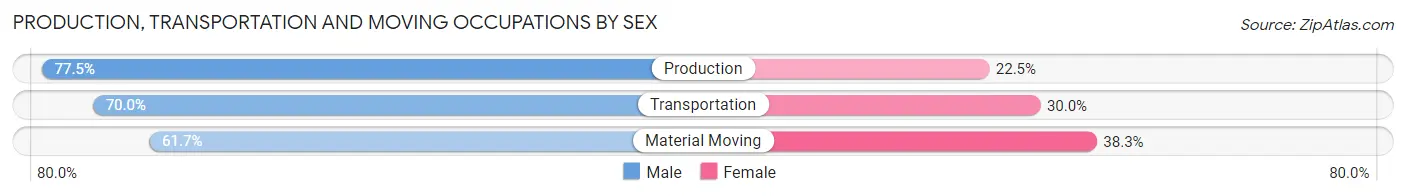
| Occupation | Male | Female |
| Production | 62 (77.5%) | 18 (22.5%) |
| Transportation | 28 (70.0%) | 12 (30.0%) |
| Material Moving | 108 (61.7%) | 67 (38.3%) |
| Total (Category) | 198 (67.1%) | 97 (32.9%) |
| Total (Overall) | 801 (54.3%) | 673 (45.7%) |
Employment Industries by Sex in Rockwood
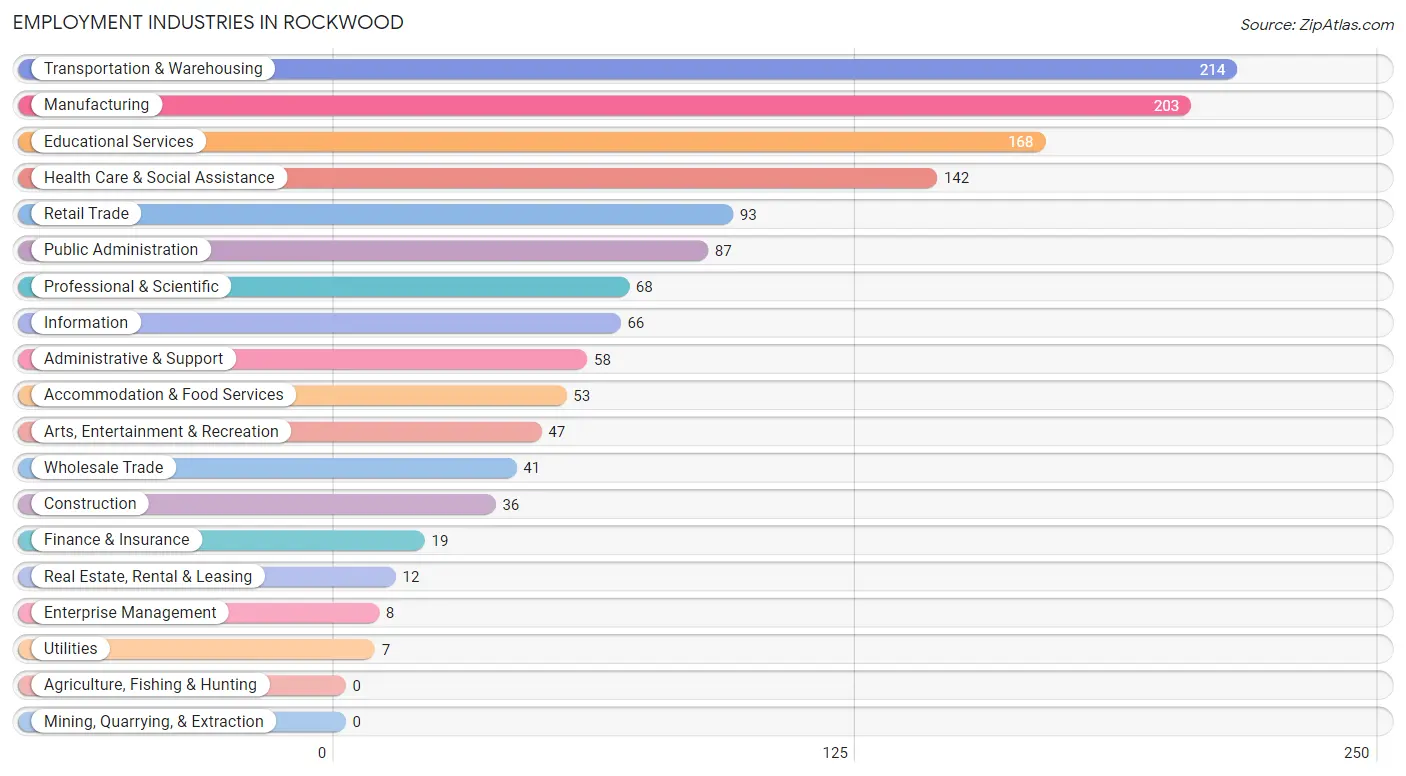
Employment Industries in Rockwood
The major employment industries in Rockwood include Transportation & Warehousing (214 | 14.5%), Manufacturing (203 | 13.8%), Educational Services (168 | 11.4%), Health Care & Social Assistance (142 | 9.6%), and Retail Trade (93 | 6.3%).
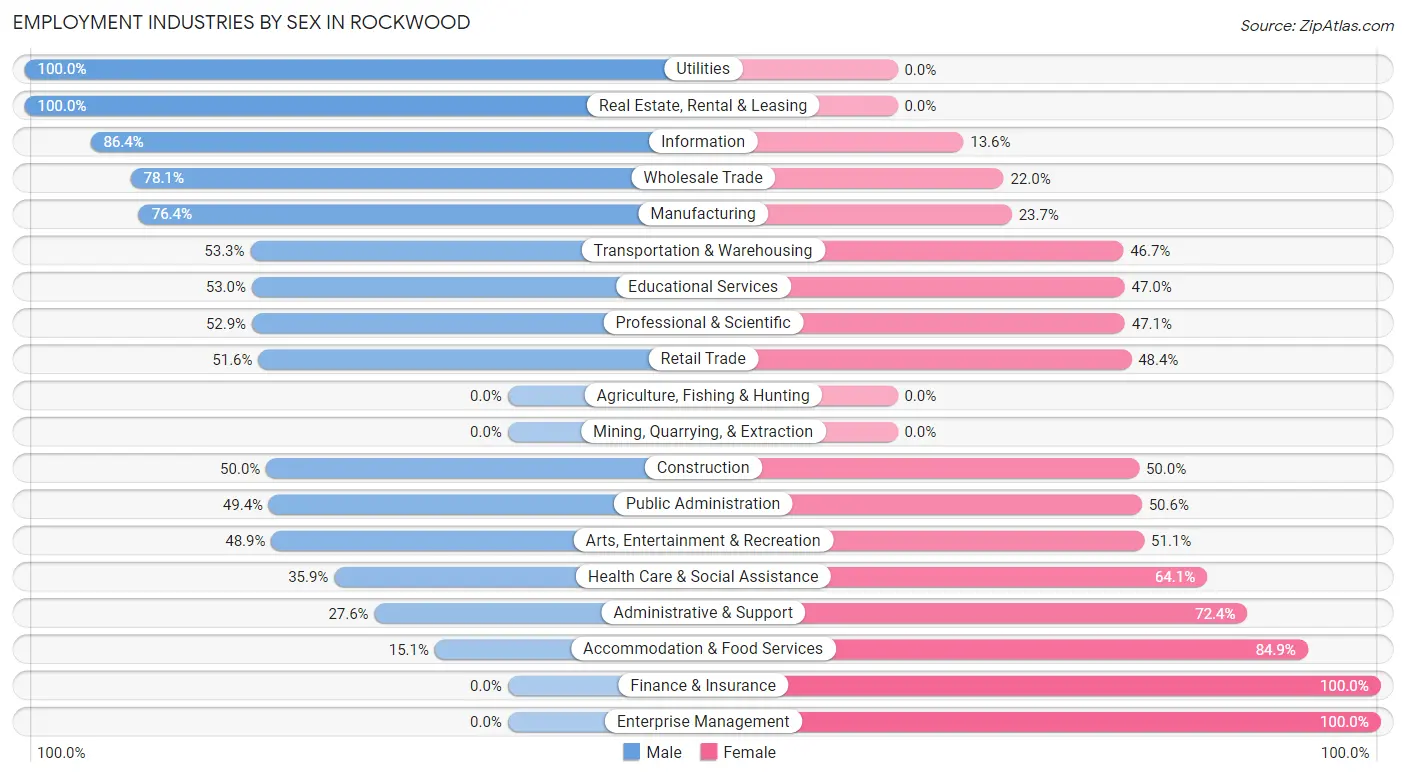
Employment Industries by Sex in Rockwood
The Rockwood industries that see more men than women are Utilities (100.0%), Real Estate, Rental & Leasing (100.0%), and Information (86.4%), whereas the industries that tend to have a higher number of women are Finance & Insurance (100.0%), Enterprise Management (100.0%), and Accommodation & Food Services (84.9%).
| Industry | Male | Female |
| Agriculture, Fishing & Hunting | 0 (0.0%) | 0 (0.0%) |
| Mining, Quarrying, & Extraction | 0 (0.0%) | 0 (0.0%) |
| Construction | 18 (50.0%) | 18 (50.0%) |
| Manufacturing | 155 (76.3%) | 48 (23.6%) |
| Wholesale Trade | 32 (78.0%) | 9 (22.0%) |
| Retail Trade | 48 (51.6%) | 45 (48.4%) |
| Transportation & Warehousing | 114 (53.3%) | 100 (46.7%) |
| Utilities | 7 (100.0%) | 0 (0.0%) |
| Information | 57 (86.4%) | 9 (13.6%) |
| Finance & Insurance | 0 (0.0%) | 19 (100.0%) |
| Real Estate, Rental & Leasing | 12 (100.0%) | 0 (0.0%) |
| Professional & Scientific | 36 (52.9%) | 32 (47.1%) |
| Enterprise Management | 0 (0.0%) | 8 (100.0%) |
| Administrative & Support | 16 (27.6%) | 42 (72.4%) |
| Educational Services | 89 (53.0%) | 79 (47.0%) |
| Health Care & Social Assistance | 51 (35.9%) | 91 (64.1%) |
| Arts, Entertainment & Recreation | 23 (48.9%) | 24 (51.1%) |
| Accommodation & Food Services | 8 (15.1%) | 45 (84.9%) |
| Public Administration | 43 (49.4%) | 44 (50.6%) |
| Total | 801 (54.3%) | 673 (45.7%) |
Education in Rockwood
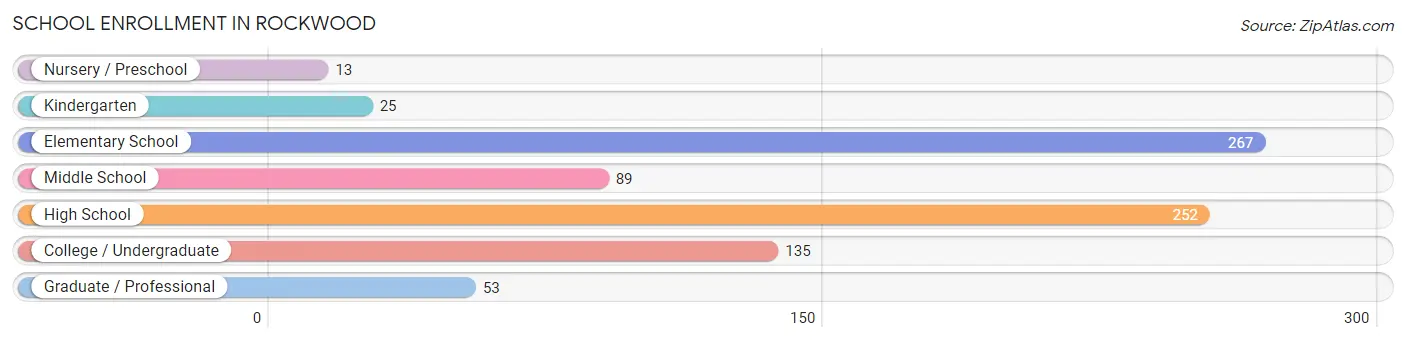
School Enrollment in Rockwood
The most common levels of schooling among the 834 students in Rockwood are elementary school (267 | 32.0%), high school (252 | 30.2%), and college / undergraduate (135 | 16.2%).
| School Level | # Students | % Students |
| Nursery / Preschool | 13 | 1.6% |
| Kindergarten | 25 | 3.0% |
| Elementary School | 267 | 32.0% |
| Middle School | 89 | 10.7% |
| High School | 252 | 30.2% |
| College / Undergraduate | 135 | 16.2% |
| Graduate / Professional | 53 | 6.4% |
| Total | 834 | 100.0% |
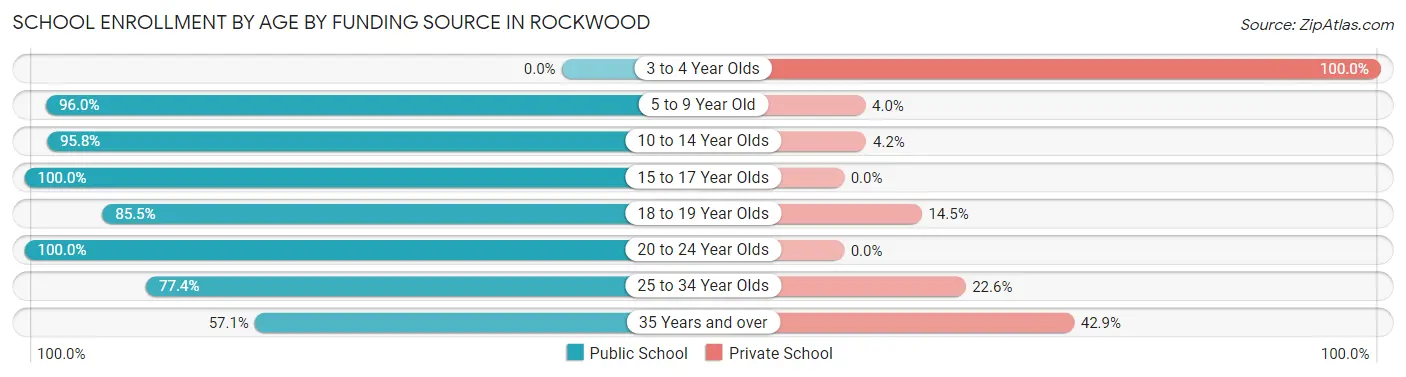
School Enrollment by Age by Funding Source in Rockwood
Out of a total of 834 students who are enrolled in schools in Rockwood, 72 (8.6%) attend a private institution, while the remaining 762 (91.4%) are enrolled in public schools. The age group of 3 to 4 year olds has the highest likelihood of being enrolled in private schools, with 13 (100.0% in the age bracket) enrolled. Conversely, the age group of 15 to 17 year olds has the lowest likelihood of being enrolled in a private school, with 142 (100.0% in the age bracket) attending a public institution.
| Age Bracket | Public School | Private School |
| 3 to 4 Year Olds | 0 (0.0%) | 13 (100.0%) |
| 5 to 9 Year Old | 265 (96.0%) | 11 (4.0%) |
| 10 to 14 Year Olds | 184 (95.8%) | 8 (4.2%) |
| 15 to 17 Year Olds | 142 (100.0%) | 0 (0.0%) |
| 18 to 19 Year Olds | 59 (85.5%) | 10 (14.5%) |
| 20 to 24 Year Olds | 22 (100.0%) | 0 (0.0%) |
| 25 to 34 Year Olds | 82 (77.4%) | 24 (22.6%) |
| 35 Years and over | 8 (57.1%) | 6 (42.9%) |
| Total | 762 (91.4%) | 72 (8.6%) |
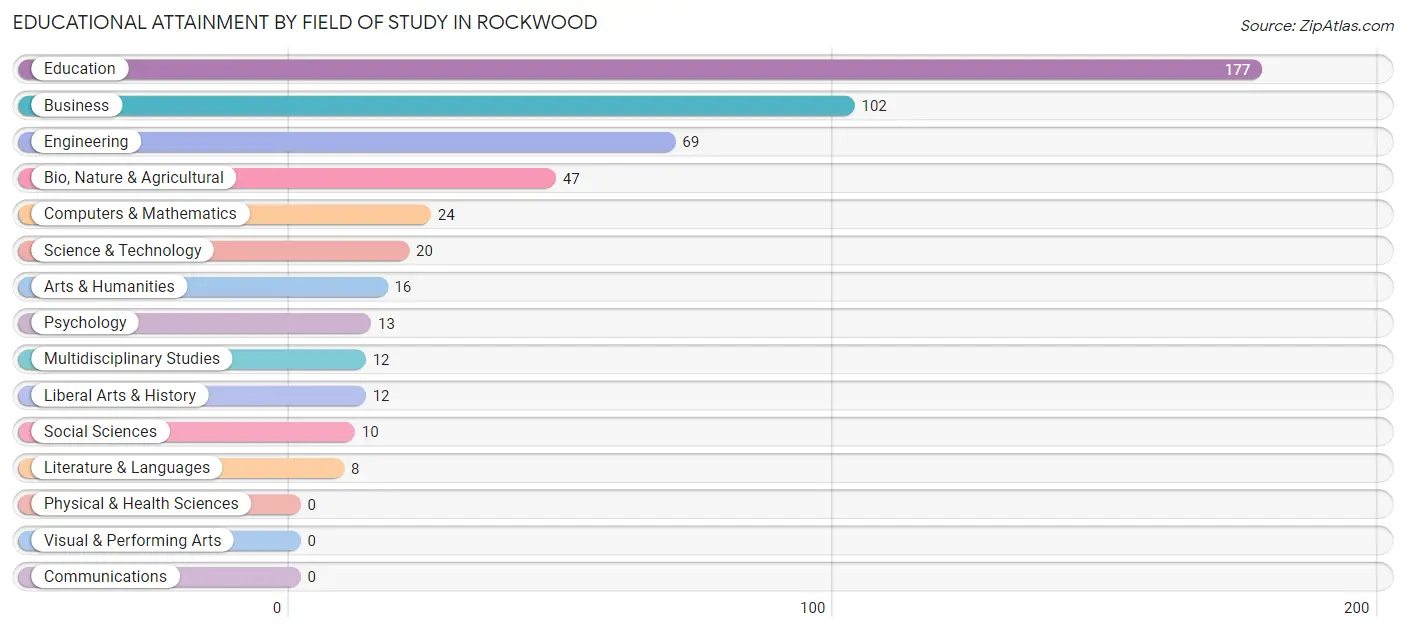
Educational Attainment by Field of Study in Rockwood
Education (177 | 34.7%), business (102 | 20.0%), engineering (69 | 13.5%), bio, nature & agricultural (47 | 9.2%), and computers & mathematics (24 | 4.7%) are the most common fields of study among 510 individuals in Rockwood who have obtained a bachelor's degree or higher.
| Field of Study | # Graduates | % Graduates |
| Computers & Mathematics | 24 | 4.7% |
| Bio, Nature & Agricultural | 47 | 9.2% |
| Physical & Health Sciences | 0 | 0.0% |
| Psychology | 13 | 2.5% |
| Social Sciences | 10 | 2.0% |
| Engineering | 69 | 13.5% |
| Multidisciplinary Studies | 12 | 2.4% |
| Science & Technology | 20 | 3.9% |
| Business | 102 | 20.0% |
| Education | 177 | 34.7% |
| Literature & Languages | 8 | 1.6% |
| Liberal Arts & History | 12 | 2.4% |
| Visual & Performing Arts | 0 | 0.0% |
| Communications | 0 | 0.0% |
| Arts & Humanities | 16 | 3.1% |
| Total | 510 | 100.0% |
Transportation & Commute in Rockwood
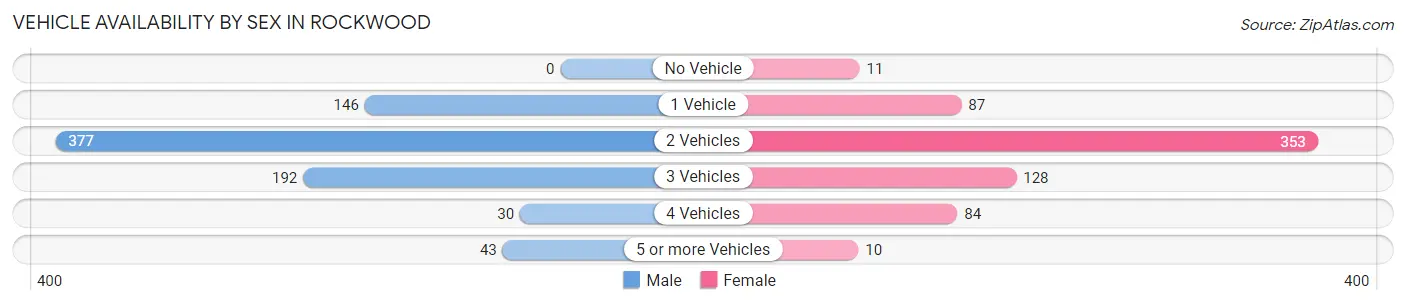
Vehicle Availability by Sex in Rockwood
The most prevalent vehicle ownership categories in Rockwood are males with 2 vehicles (377, accounting for 47.8%) and females with 2 vehicles (353, making up 56.0%).
| Vehicles Available | Male | Female |
| No Vehicle | 0 (0.0%) | 11 (1.6%) |
| 1 Vehicle | 146 (18.5%) | 87 (12.9%) |
| 2 Vehicles | 377 (47.8%) | 353 (52.4%) |
| 3 Vehicles | 192 (24.4%) | 128 (19.0%) |
| 4 Vehicles | 30 (3.8%) | 84 (12.5%) |
| 5 or more Vehicles | 43 (5.5%) | 10 (1.5%) |
| Total | 788 (100.0%) | 673 (100.0%) |
Commute Time in Rockwood
The most frequently occuring commute durations in Rockwood are 30 to 34 minutes (221 commuters, 15.7%), 15 to 19 minutes (211 commuters, 15.0%), and 45 to 59 minutes (211 commuters, 15.0%).
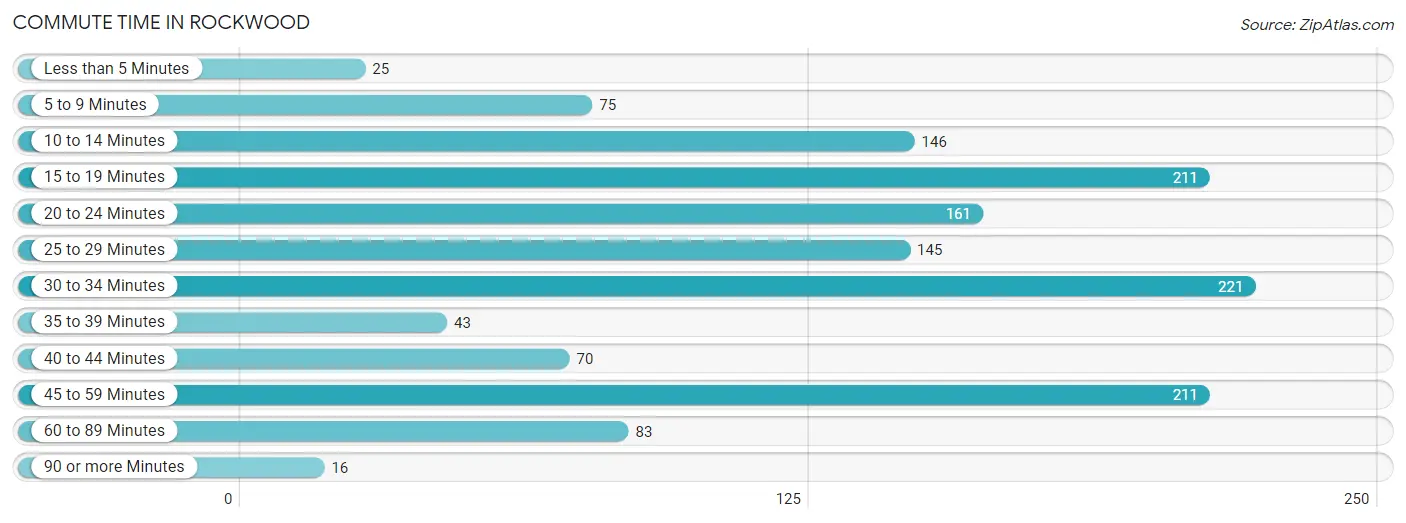
| Commute Time | # Commuters | % Commuters |
| Less than 5 Minutes | 25 | 1.8% |
| 5 to 9 Minutes | 75 | 5.3% |
| 10 to 14 Minutes | 146 | 10.4% |
| 15 to 19 Minutes | 211 | 15.0% |
| 20 to 24 Minutes | 161 | 11.4% |
| 25 to 29 Minutes | 145 | 10.3% |
| 30 to 34 Minutes | 221 | 15.7% |
| 35 to 39 Minutes | 43 | 3.1% |
| 40 to 44 Minutes | 70 | 5.0% |
| 45 to 59 Minutes | 211 | 15.0% |
| 60 to 89 Minutes | 83 | 5.9% |
| 90 or more Minutes | 16 | 1.1% |
Commute Time by Sex in Rockwood
The most common commute times in Rockwood are 45 to 59 minutes (133 commuters, 17.9%) for males and 30 to 34 minutes (124 commuters, 18.6%) for females.
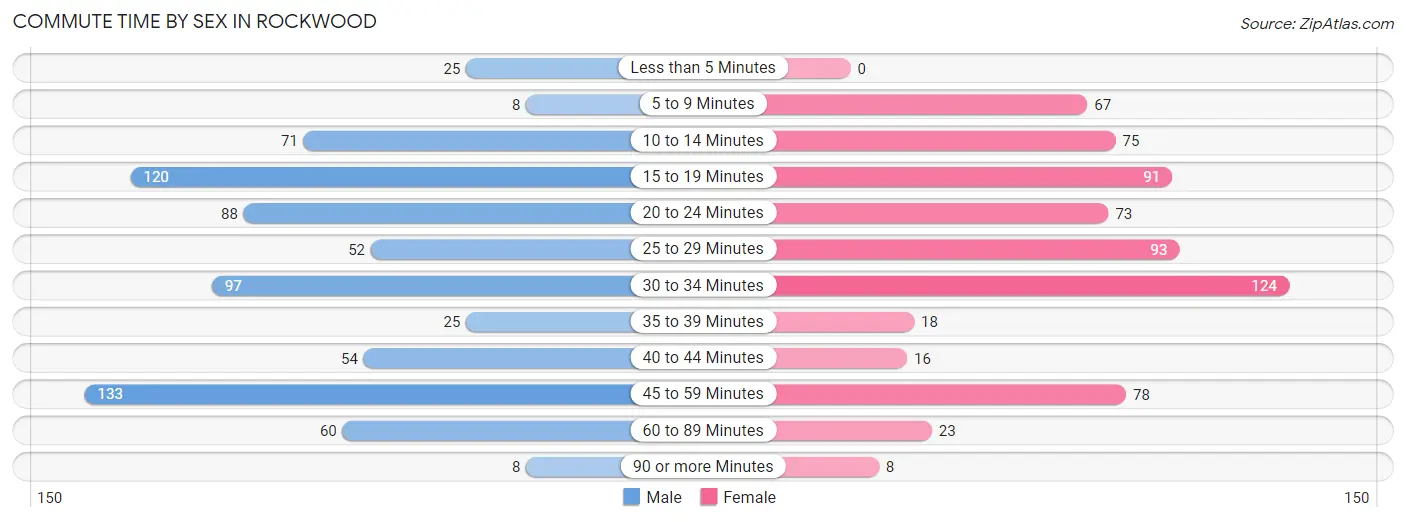
| Commute Time | Male | Female |
| Less than 5 Minutes | 25 (3.4%) | 0 (0.0%) |
| 5 to 9 Minutes | 8 (1.1%) | 67 (10.1%) |
| 10 to 14 Minutes | 71 (9.6%) | 75 (11.3%) |
| 15 to 19 Minutes | 120 (16.2%) | 91 (13.7%) |
| 20 to 24 Minutes | 88 (11.9%) | 73 (11.0%) |
| 25 to 29 Minutes | 52 (7.0%) | 93 (14.0%) |
| 30 to 34 Minutes | 97 (13.1%) | 124 (18.6%) |
| 35 to 39 Minutes | 25 (3.4%) | 18 (2.7%) |
| 40 to 44 Minutes | 54 (7.3%) | 16 (2.4%) |
| 45 to 59 Minutes | 133 (17.9%) | 78 (11.7%) |
| 60 to 89 Minutes | 60 (8.1%) | 23 (3.5%) |
| 90 or more Minutes | 8 (1.1%) | 8 (1.2%) |
Time of Departure to Work by Sex in Rockwood
The most frequent times of departure to work in Rockwood are 7:00 AM to 7:29 AM (134, 18.1%) for males and 7:00 AM to 7:29 AM (133, 20.0%) for females.
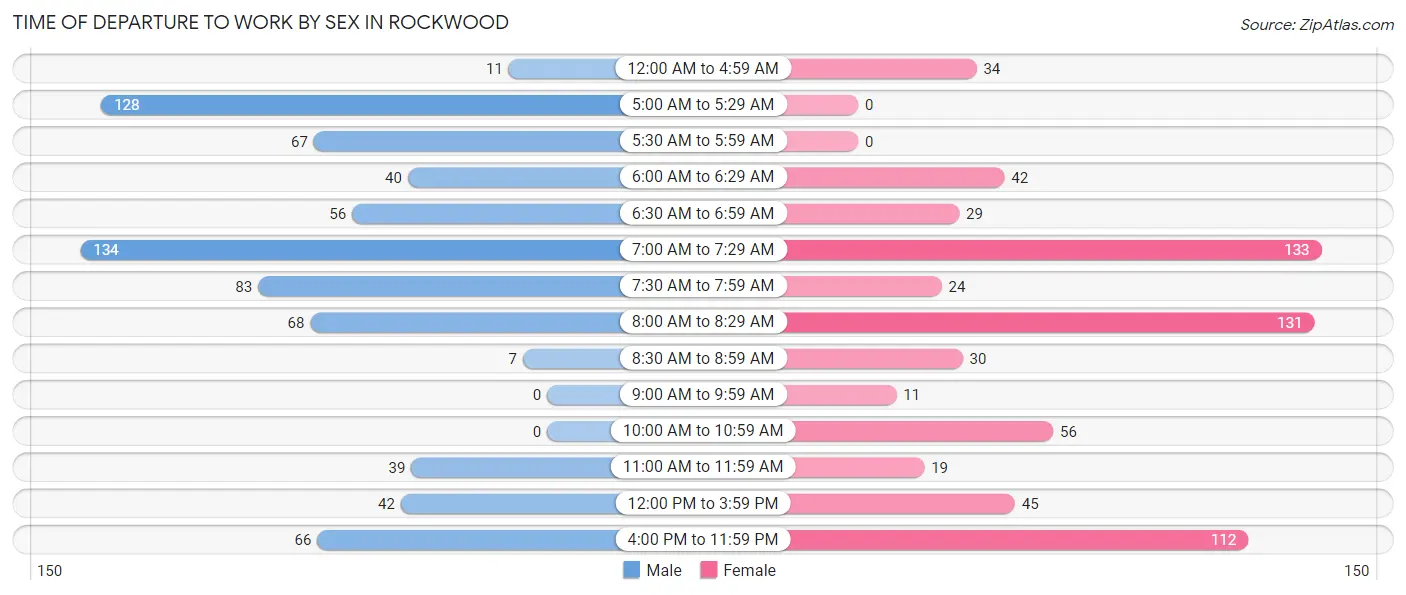
| Time of Departure | Male | Female |
| 12:00 AM to 4:59 AM | 11 (1.5%) | 34 (5.1%) |
| 5:00 AM to 5:29 AM | 128 (17.3%) | 0 (0.0%) |
| 5:30 AM to 5:59 AM | 67 (9.0%) | 0 (0.0%) |
| 6:00 AM to 6:29 AM | 40 (5.4%) | 42 (6.3%) |
| 6:30 AM to 6:59 AM | 56 (7.6%) | 29 (4.3%) |
| 7:00 AM to 7:29 AM | 134 (18.1%) | 133 (20.0%) |
| 7:30 AM to 7:59 AM | 83 (11.2%) | 24 (3.6%) |
| 8:00 AM to 8:29 AM | 68 (9.2%) | 131 (19.7%) |
| 8:30 AM to 8:59 AM | 7 (0.9%) | 30 (4.5%) |
| 9:00 AM to 9:59 AM | 0 (0.0%) | 11 (1.7%) |
| 10:00 AM to 10:59 AM | 0 (0.0%) | 56 (8.4%) |
| 11:00 AM to 11:59 AM | 39 (5.3%) | 19 (2.9%) |
| 12:00 PM to 3:59 PM | 42 (5.7%) | 45 (6.8%) |
| 4:00 PM to 11:59 PM | 66 (8.9%) | 112 (16.8%) |
| Total | 741 (100.0%) | 666 (100.0%) |
Housing Occupancy in Rockwood
Occupancy by Ownership in Rockwood
Of the total 1,244 dwellings in Rockwood, owner-occupied units account for 1,002 (80.5%), while renter-occupied units make up 242 (19.5%).
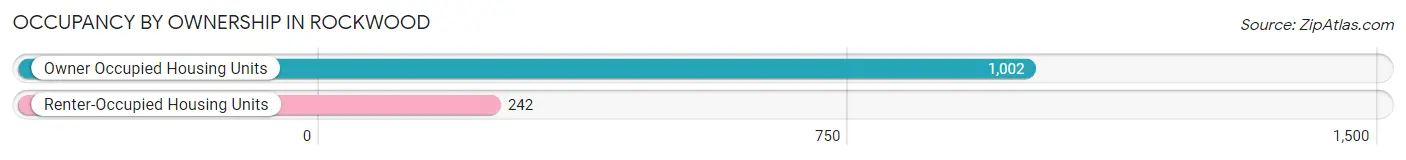
| Occupancy | # Housing Units | % Housing Units |
| Owner Occupied Housing Units | 1,002 | 80.5% |
| Renter-Occupied Housing Units | 242 | 19.5% |
| Total Occupied Housing Units | 1,244 | 100.0% |
Occupancy by Household Size in Rockwood
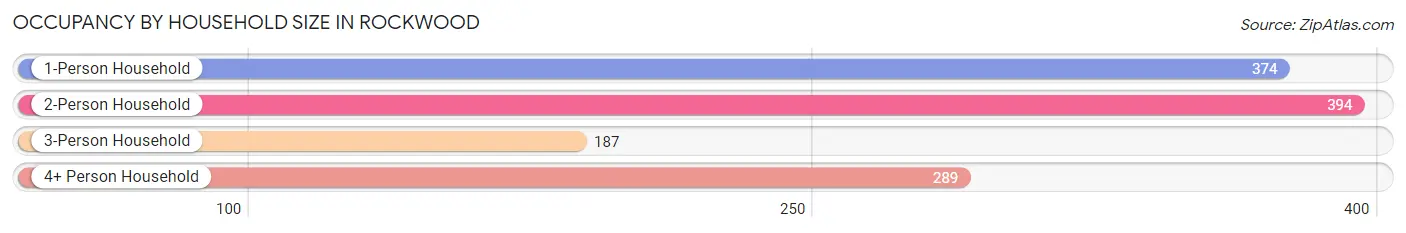
| Household Size | # Housing Units | % Housing Units |
| 1-Person Household | 374 | 30.1% |
| 2-Person Household | 394 | 31.7% |
| 3-Person Household | 187 | 15.0% |
| 4+ Person Household | 289 | 23.2% |
| Total Housing Units | 1,244 | 100.0% |
Occupancy by Ownership by Household Size in Rockwood
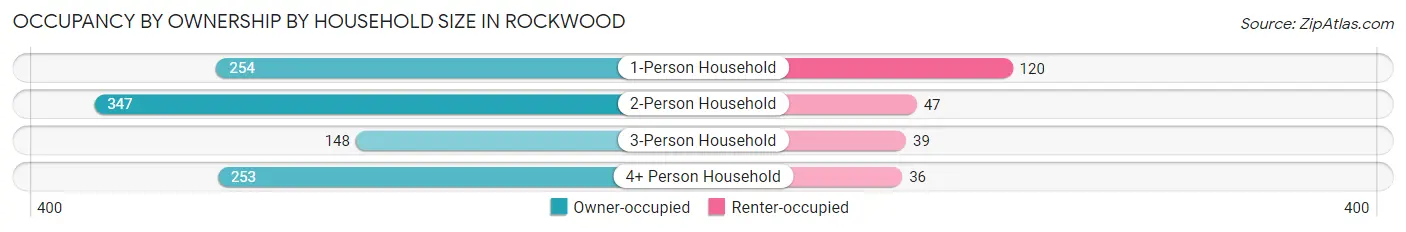
| Household Size | Owner-occupied | Renter-occupied |
| 1-Person Household | 254 (67.9%) | 120 (32.1%) |
| 2-Person Household | 347 (88.1%) | 47 (11.9%) |
| 3-Person Household | 148 (79.1%) | 39 (20.9%) |
| 4+ Person Household | 253 (87.5%) | 36 (12.5%) |
| Total Housing Units | 1,002 (80.5%) | 242 (19.5%) |
Occupancy by Educational Attainment in Rockwood
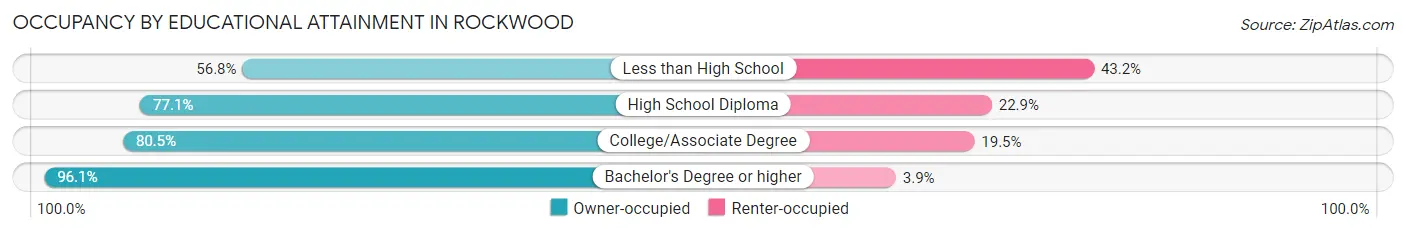
| Household Size | Owner-occupied | Renter-occupied |
| Less than High School | 50 (56.8%) | 38 (43.2%) |
| High School Diploma | 333 (77.1%) | 99 (22.9%) |
| College/Associate Degree | 397 (80.5%) | 96 (19.5%) |
| Bachelor's Degree or higher | 222 (96.1%) | 9 (3.9%) |
Occupancy by Age of Householder in Rockwood
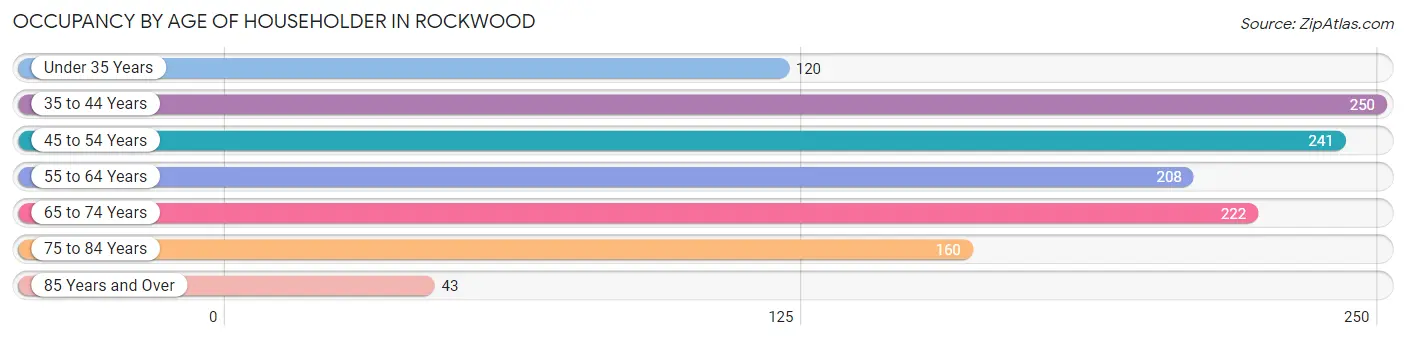
| Age Bracket | # Households | % Households |
| Under 35 Years | 120 | 9.7% |
| 35 to 44 Years | 250 | 20.1% |
| 45 to 54 Years | 241 | 19.4% |
| 55 to 64 Years | 208 | 16.7% |
| 65 to 74 Years | 222 | 17.8% |
| 75 to 84 Years | 160 | 12.9% |
| 85 Years and Over | 43 | 3.5% |
| Total | 1,244 | 100.0% |
Housing Finances in Rockwood
Median Income by Occupancy in Rockwood
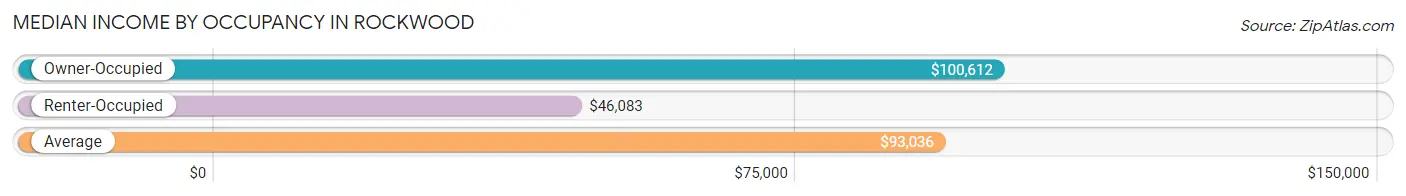
| Occupancy Type | # Households | Median Income |
| Owner-Occupied | 1,002 (80.5%) | $100,612 |
| Renter-Occupied | 242 (19.5%) | $46,083 |
| Average | 1,244 (100.0%) | $93,036 |
Occupancy by Householder Income Bracket in Rockwood
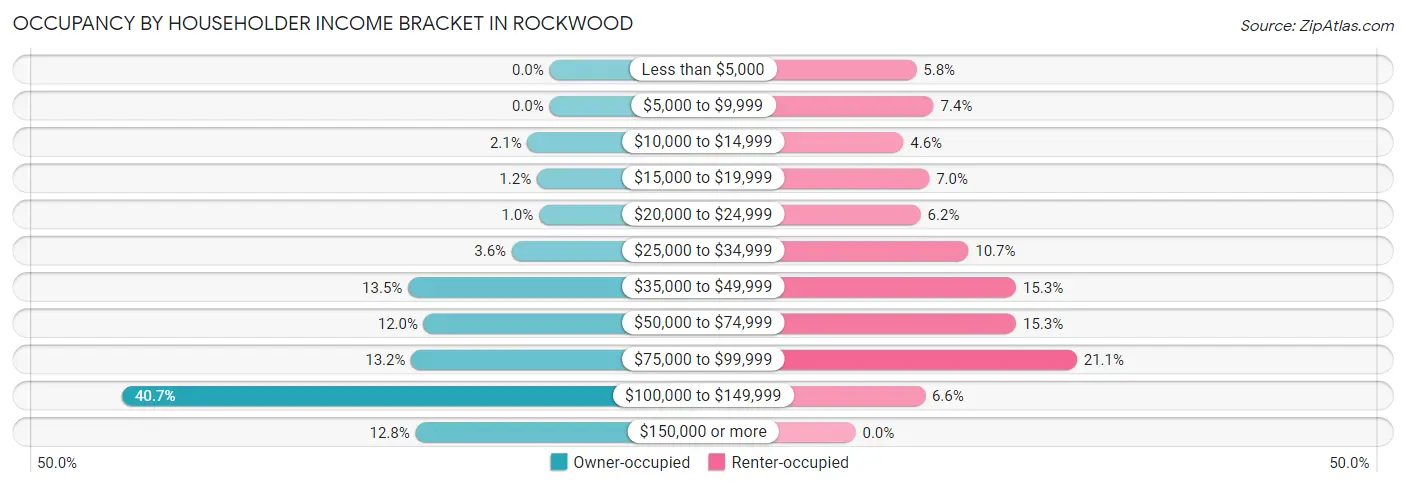
| Income Bracket | Owner-occupied | Renter-occupied |
| Less than $5,000 | 0 (0.0%) | 14 (5.8%) |
| $5,000 to $9,999 | 0 (0.0%) | 18 (7.4%) |
| $10,000 to $14,999 | 21 (2.1%) | 11 (4.5%) |
| $15,000 to $19,999 | 12 (1.2%) | 17 (7.0%) |
| $20,000 to $24,999 | 10 (1.0%) | 15 (6.2%) |
| $25,000 to $34,999 | 36 (3.6%) | 26 (10.7%) |
| $35,000 to $49,999 | 135 (13.5%) | 37 (15.3%) |
| $50,000 to $74,999 | 120 (12.0%) | 37 (15.3%) |
| $75,000 to $99,999 | 132 (13.2%) | 51 (21.1%) |
| $100,000 to $149,999 | 408 (40.7%) | 16 (6.6%) |
| $150,000 or more | 128 (12.8%) | 0 (0.0%) |
| Total | 1,002 (100.0%) | 242 (100.0%) |
Monthly Housing Cost Tiers in Rockwood
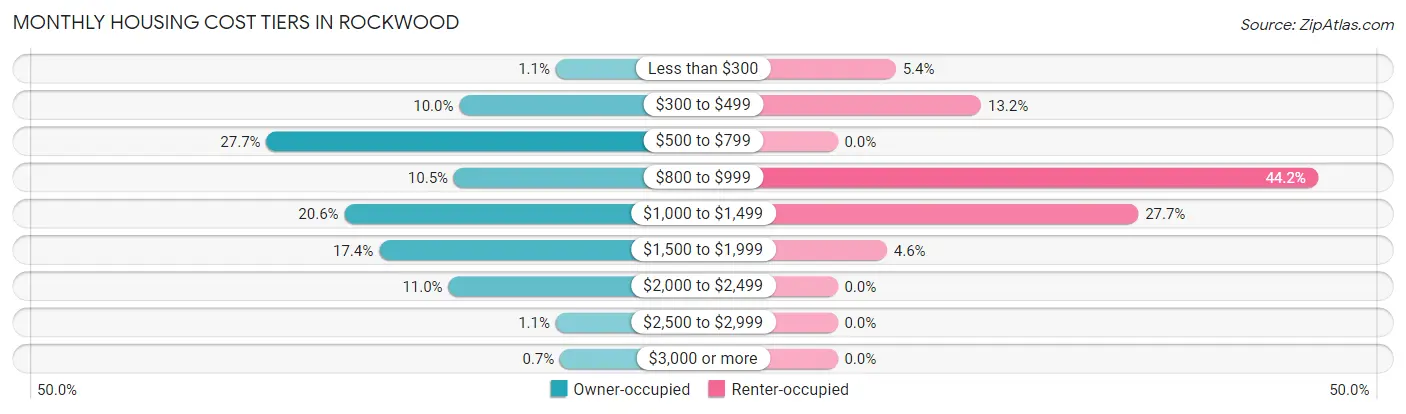
| Monthly Cost | Owner-occupied | Renter-occupied |
| Less than $300 | 11 (1.1%) | 13 (5.4%) |
| $300 to $499 | 100 (10.0%) | 32 (13.2%) |
| $500 to $799 | 278 (27.7%) | 0 (0.0%) |
| $800 to $999 | 105 (10.5%) | 107 (44.2%) |
| $1,000 to $1,499 | 206 (20.6%) | 67 (27.7%) |
| $1,500 to $1,999 | 174 (17.4%) | 11 (4.5%) |
| $2,000 to $2,499 | 110 (11.0%) | 0 (0.0%) |
| $2,500 to $2,999 | 11 (1.1%) | 0 (0.0%) |
| $3,000 or more | 7 (0.7%) | 0 (0.0%) |
| Total | 1,002 (100.0%) | 242 (100.0%) |
Physical Housing Characteristics in Rockwood
Housing Structures in Rockwood
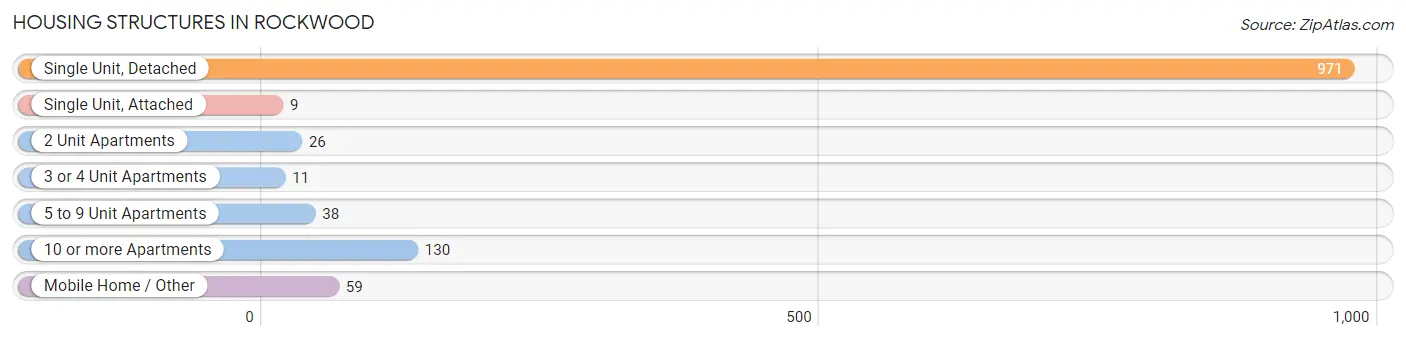
| Structure Type | # Housing Units | % Housing Units |
| Single Unit, Detached | 971 | 78.0% |
| Single Unit, Attached | 9 | 0.7% |
| 2 Unit Apartments | 26 | 2.1% |
| 3 or 4 Unit Apartments | 11 | 0.9% |
| 5 to 9 Unit Apartments | 38 | 3.0% |
| 10 or more Apartments | 130 | 10.4% |
| Mobile Home / Other | 59 | 4.7% |
| Total | 1,244 | 100.0% |
Housing Structures by Occupancy in Rockwood
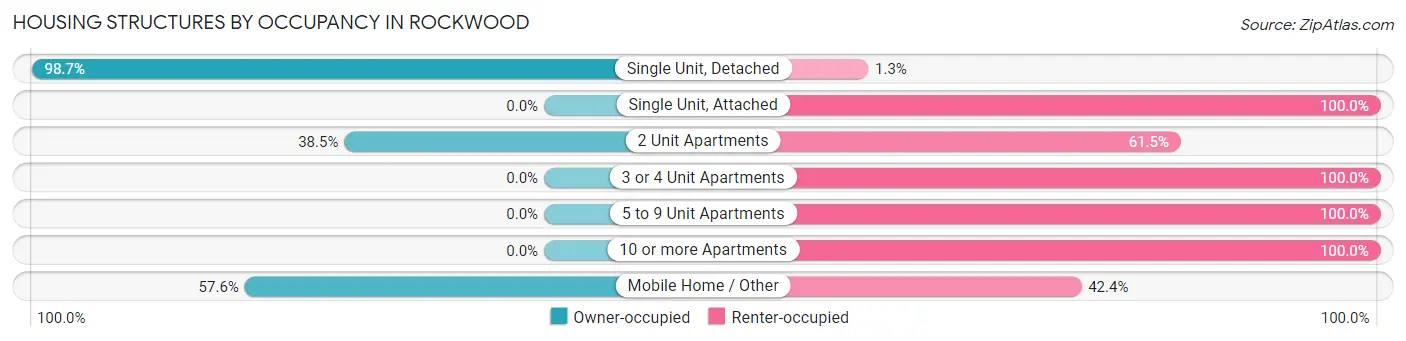
| Structure Type | Owner-occupied | Renter-occupied |
| Single Unit, Detached | 958 (98.7%) | 13 (1.3%) |
| Single Unit, Attached | 0 (0.0%) | 9 (100.0%) |
| 2 Unit Apartments | 10 (38.5%) | 16 (61.5%) |
| 3 or 4 Unit Apartments | 0 (0.0%) | 11 (100.0%) |
| 5 to 9 Unit Apartments | 0 (0.0%) | 38 (100.0%) |
| 10 or more Apartments | 0 (0.0%) | 130 (100.0%) |
| Mobile Home / Other | 34 (57.6%) | 25 (42.4%) |
| Total | 1,002 (80.5%) | 242 (19.5%) |
Housing Structures by Number of Rooms in Rockwood
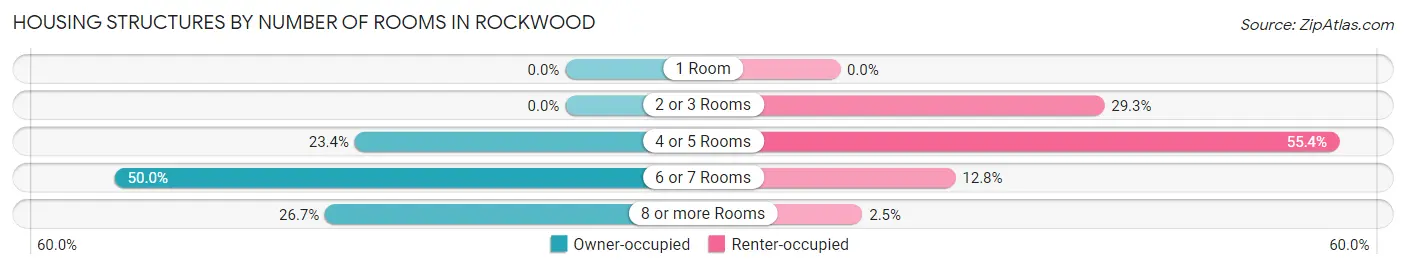
| Number of Rooms | Owner-occupied | Renter-occupied |
| 1 Room | 0 (0.0%) | 0 (0.0%) |
| 2 or 3 Rooms | 0 (0.0%) | 71 (29.3%) |
| 4 or 5 Rooms | 234 (23.4%) | 134 (55.4%) |
| 6 or 7 Rooms | 501 (50.0%) | 31 (12.8%) |
| 8 or more Rooms | 267 (26.7%) | 6 (2.5%) |
| Total | 1,002 (100.0%) | 242 (100.0%) |
Housing Structure by Heating Type in Rockwood
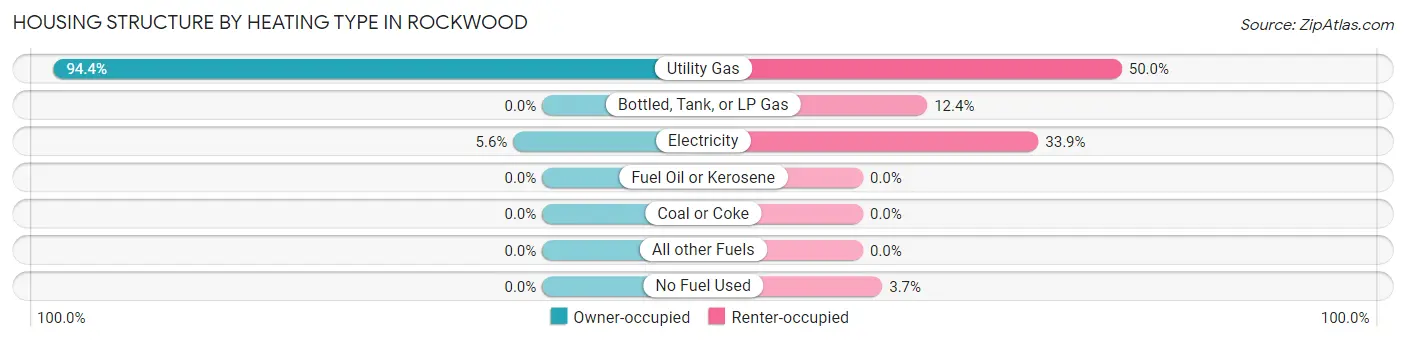
| Heating Type | Owner-occupied | Renter-occupied |
| Utility Gas | 946 (94.4%) | 121 (50.0%) |
| Bottled, Tank, or LP Gas | 0 (0.0%) | 30 (12.4%) |
| Electricity | 56 (5.6%) | 82 (33.9%) |
| Fuel Oil or Kerosene | 0 (0.0%) | 0 (0.0%) |
| Coal or Coke | 0 (0.0%) | 0 (0.0%) |
| All other Fuels | 0 (0.0%) | 0 (0.0%) |
| No Fuel Used | 0 (0.0%) | 9 (3.7%) |
| Total | 1,002 (100.0%) | 242 (100.0%) |
Household Vehicle Usage in Rockwood
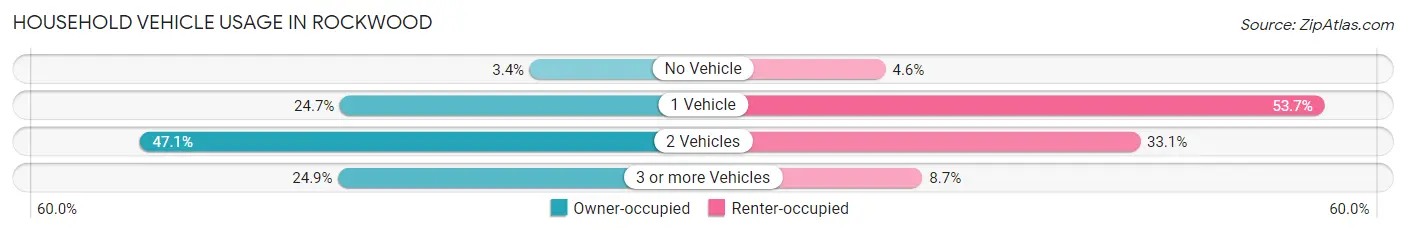
| Vehicles per Household | Owner-occupied | Renter-occupied |
| No Vehicle | 34 (3.4%) | 11 (4.5%) |
| 1 Vehicle | 247 (24.6%) | 130 (53.7%) |
| 2 Vehicles | 472 (47.1%) | 80 (33.1%) |
| 3 or more Vehicles | 249 (24.8%) | 21 (8.7%) |
| Total | 1,002 (100.0%) | 242 (100.0%) |
Real Estate & Mortgages in Rockwood
Real Estate and Mortgage Overview in Rockwood
| Characteristic | Without Mortgage | With Mortgage |
| Housing Units | 406 | 596 |
| Median Property Value | $172,400 | $186,700 |
| Median Household Income | $100,399 | $68 |
| Monthly Housing Costs | $595 | $7 |
| Real Estate Taxes | $3,329 | $41 |
Property Value by Mortgage Status in Rockwood
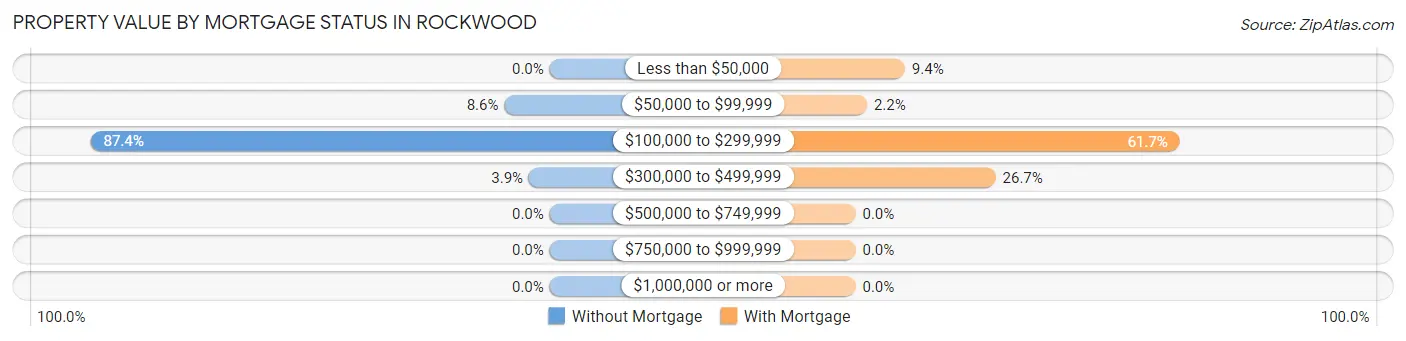
| Property Value | Without Mortgage | With Mortgage |
| Less than $50,000 | 0 (0.0%) | 56 (9.4%) |
| $50,000 to $99,999 | 35 (8.6%) | 13 (2.2%) |
| $100,000 to $299,999 | 355 (87.4%) | 368 (61.7%) |
| $300,000 to $499,999 | 16 (3.9%) | 159 (26.7%) |
| $500,000 to $749,999 | 0 (0.0%) | 0 (0.0%) |
| $750,000 to $999,999 | 0 (0.0%) | 0 (0.0%) |
| $1,000,000 or more | 0 (0.0%) | 0 (0.0%) |
| Total | 406 (100.0%) | 596 (100.0%) |
Household Income by Mortgage Status in Rockwood
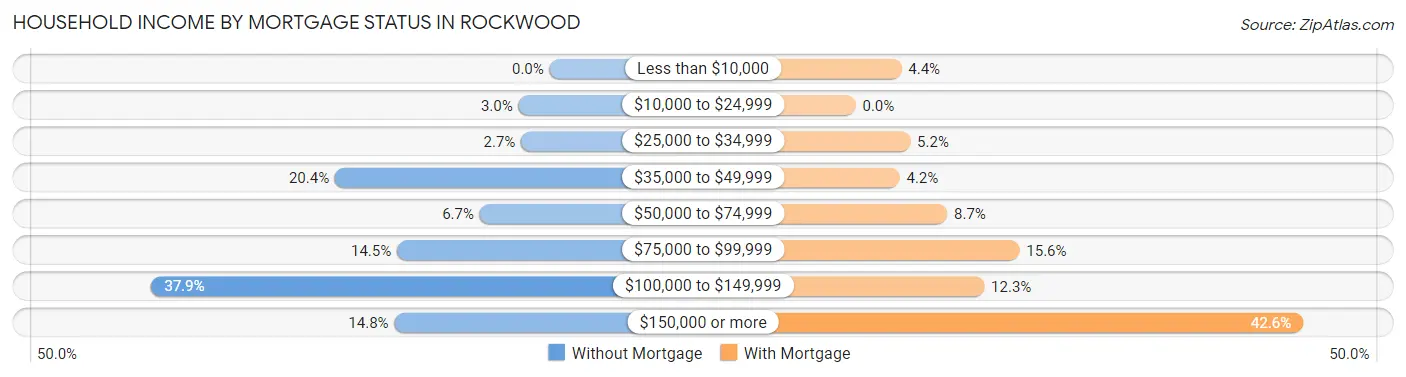
| Household Income | Without Mortgage | With Mortgage |
| Less than $10,000 | 0 (0.0%) | 26 (4.4%) |
| $10,000 to $24,999 | 12 (3.0%) | 0 (0.0%) |
| $25,000 to $34,999 | 11 (2.7%) | 31 (5.2%) |
| $35,000 to $49,999 | 83 (20.4%) | 25 (4.2%) |
| $50,000 to $74,999 | 27 (6.7%) | 52 (8.7%) |
| $75,000 to $99,999 | 59 (14.5%) | 93 (15.6%) |
| $100,000 to $149,999 | 154 (37.9%) | 73 (12.2%) |
| $150,000 or more | 60 (14.8%) | 254 (42.6%) |
| Total | 406 (100.0%) | 596 (100.0%) |
Property Value to Household Income Ratio in Rockwood
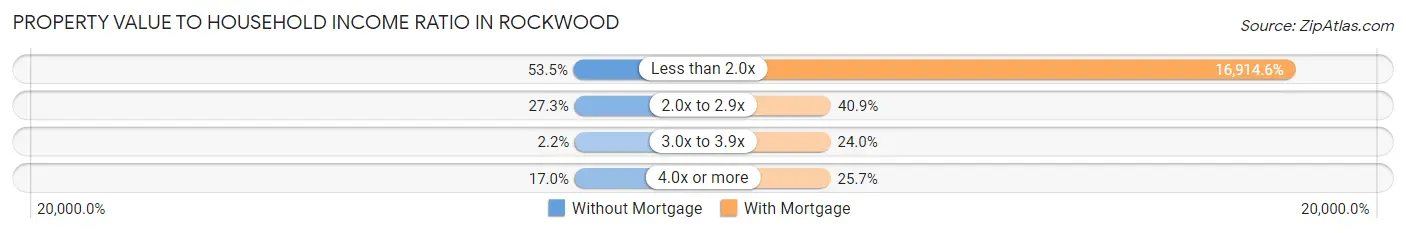
| Value-to-Income Ratio | Without Mortgage | With Mortgage |
| Less than 2.0x | 217 (53.4%) | 100,811 (16,914.6%) |
| 2.0x to 2.9x | 111 (27.3%) | 244 (40.9%) |
| 3.0x to 3.9x | 9 (2.2%) | 143 (24.0%) |
| 4.0x or more | 69 (17.0%) | 153 (25.7%) |
| Total | 406 (100.0%) | 596 (100.0%) |
Real Estate Taxes by Mortgage Status in Rockwood
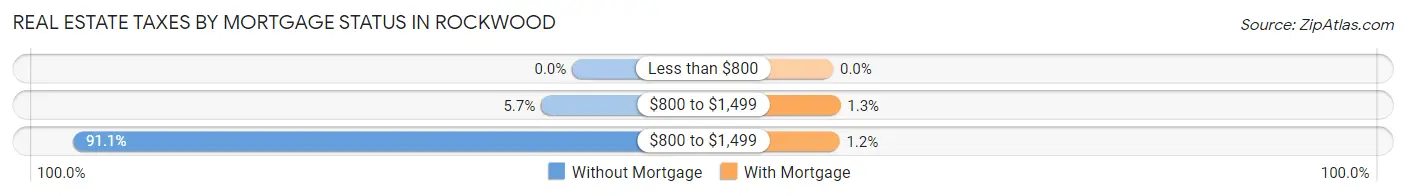
| Property Taxes | Without Mortgage | With Mortgage |
| Less than $800 | 0 (0.0%) | 0 (0.0%) |
| $800 to $1,499 | 23 (5.7%) | 8 (1.3%) |
| $800 to $1,499 | 370 (91.1%) | 7 (1.2%) |
| Total | 406 (100.0%) | 596 (100.0%) |
Health & Disability in Rockwood
Health Insurance Coverage by Age in Rockwood
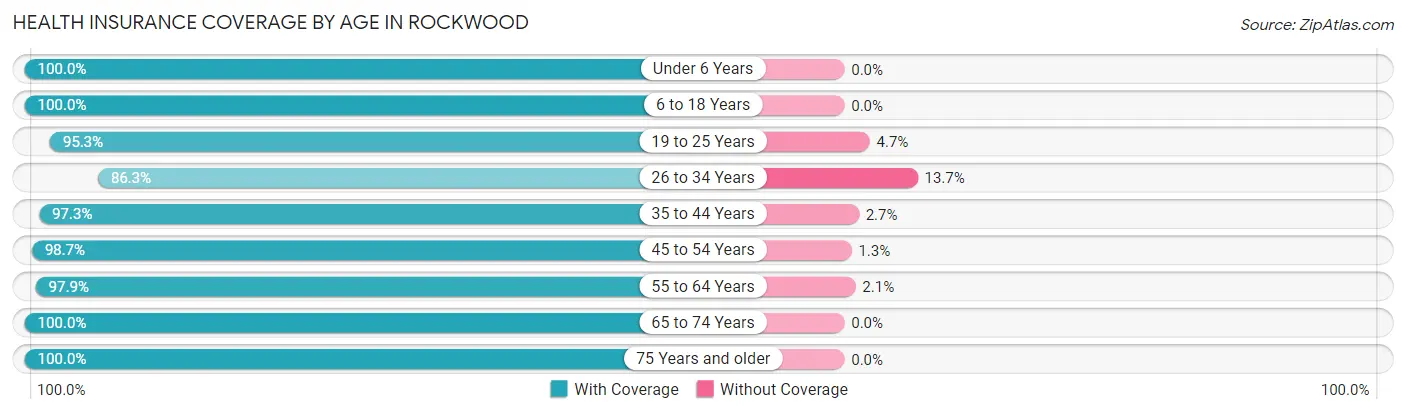
| Age Bracket | With Coverage | Without Coverage |
| Under 6 Years | 175 (100.0%) | 0 (0.0%) |
| 6 to 18 Years | 661 (100.0%) | 0 (0.0%) |
| 19 to 25 Years | 101 (95.3%) | 5 (4.7%) |
| 26 to 34 Years | 278 (86.3%) | 44 (13.7%) |
| 35 to 44 Years | 507 (97.3%) | 14 (2.7%) |
| 45 to 54 Years | 445 (98.7%) | 6 (1.3%) |
| 55 to 64 Years | 379 (97.9%) | 8 (2.1%) |
| 65 to 74 Years | 305 (100.0%) | 0 (0.0%) |
| 75 Years and older | 304 (100.0%) | 0 (0.0%) |
| Total | 3,155 (97.6%) | 77 (2.4%) |
Health Insurance Coverage by Citizenship Status in Rockwood
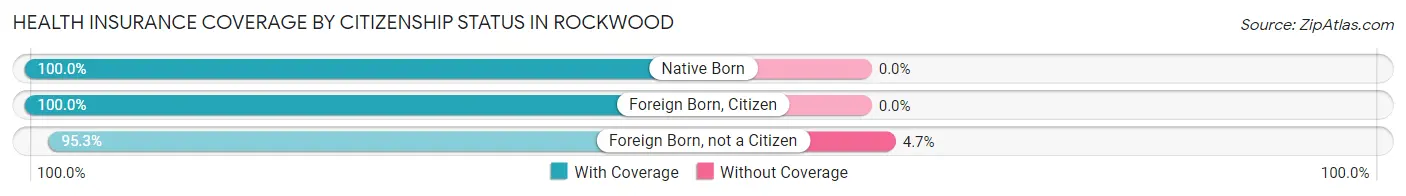
| Citizenship Status | With Coverage | Without Coverage |
| Native Born | 175 (100.0%) | 0 (0.0%) |
| Foreign Born, Citizen | 661 (100.0%) | 0 (0.0%) |
| Foreign Born, not a Citizen | 101 (95.3%) | 5 (4.7%) |
Health Insurance Coverage by Household Income in Rockwood
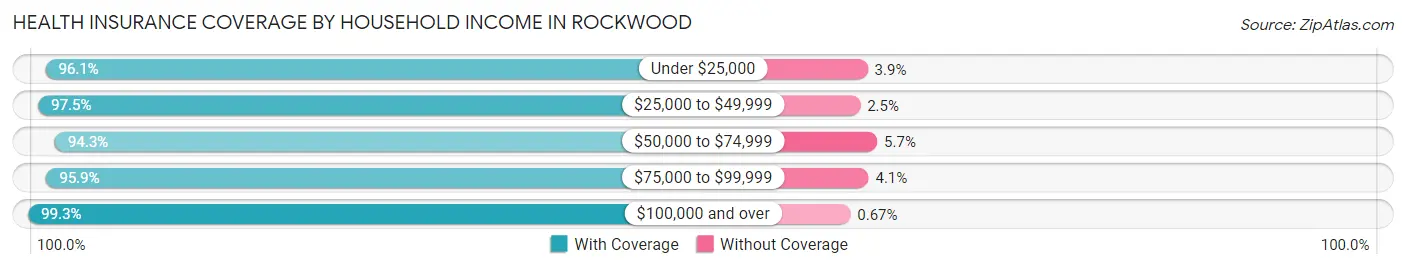
| Household Income | With Coverage | Without Coverage |
| Under $25,000 | 123 (96.1%) | 5 (3.9%) |
| $25,000 to $49,999 | 426 (97.5%) | 11 (2.5%) |
| $50,000 to $74,999 | 564 (94.3%) | 34 (5.7%) |
| $75,000 to $99,999 | 377 (95.9%) | 16 (4.1%) |
| $100,000 and over | 1,643 (99.3%) | 11 (0.7%) |
Public vs Private Health Insurance Coverage by Age in Rockwood
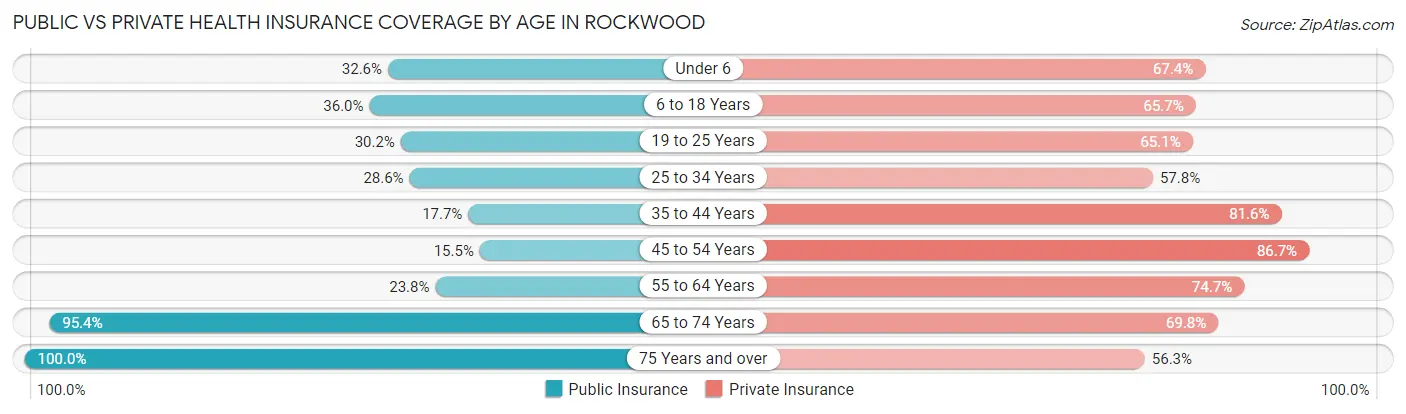
| Age Bracket | Public Insurance | Private Insurance |
| Under 6 | 57 (32.6%) | 118 (67.4%) |
| 6 to 18 Years | 238 (36.0%) | 434 (65.7%) |
| 19 to 25 Years | 32 (30.2%) | 69 (65.1%) |
| 25 to 34 Years | 92 (28.6%) | 186 (57.8%) |
| 35 to 44 Years | 92 (17.7%) | 425 (81.6%) |
| 45 to 54 Years | 70 (15.5%) | 391 (86.7%) |
| 55 to 64 Years | 92 (23.8%) | 289 (74.7%) |
| 65 to 74 Years | 291 (95.4%) | 213 (69.8%) |
| 75 Years and over | 304 (100.0%) | 171 (56.2%) |
| Total | 1,268 (39.2%) | 2,296 (71.0%) |
Disability Status by Sex by Age in Rockwood
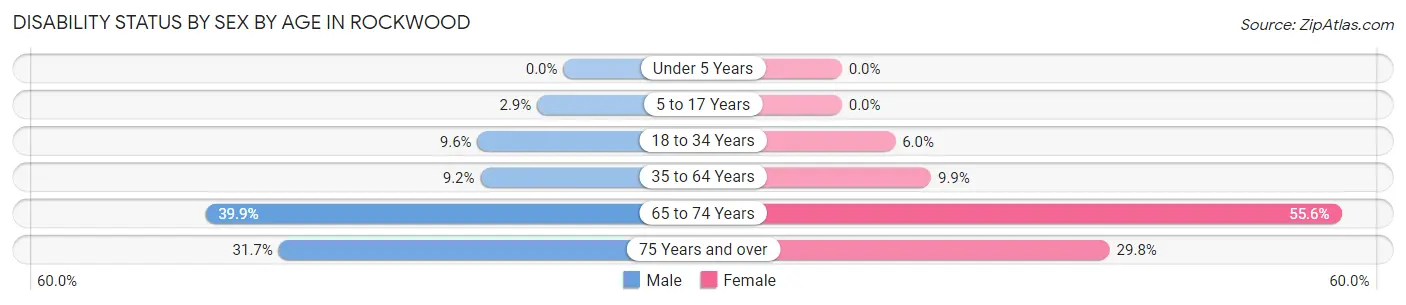
| Age Bracket | Male | Female |
| Under 5 Years | 0 (0.0%) | 0 (0.0%) |
| 5 to 17 Years | 8 (2.9%) | 0 (0.0%) |
| 18 to 34 Years | 22 (9.6%) | 15 (5.9%) |
| 35 to 64 Years | 67 (9.2%) | 63 (9.9%) |
| 65 to 74 Years | 65 (39.9%) | 79 (55.6%) |
| 75 Years and over | 39 (31.7%) | 54 (29.8%) |
Disability Class by Sex by Age in Rockwood
Disability Class: Hearing Difficulty
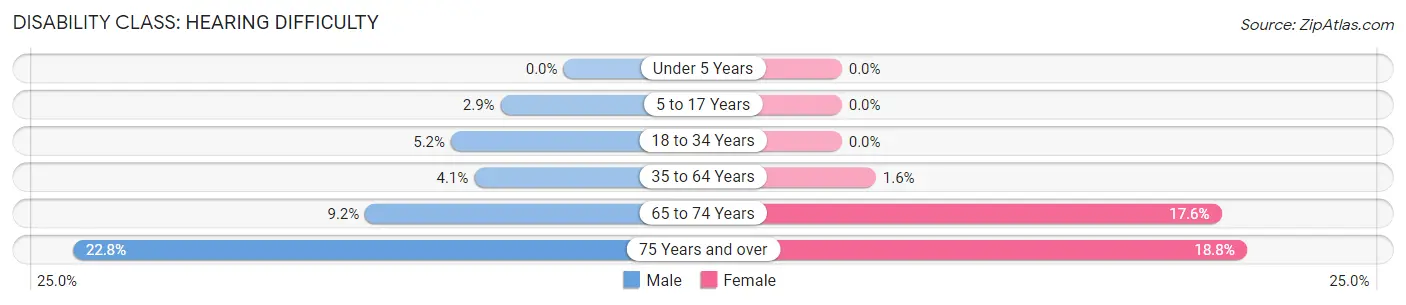
| Age Bracket | Male | Female |
| Under 5 Years | 0 (0.0%) | 0 (0.0%) |
| 5 to 17 Years | 8 (2.9%) | 0 (0.0%) |
| 18 to 34 Years | 12 (5.2%) | 0 (0.0%) |
| 35 to 64 Years | 30 (4.1%) | 10 (1.6%) |
| 65 to 74 Years | 15 (9.2%) | 25 (17.6%) |
| 75 Years and over | 28 (22.8%) | 34 (18.8%) |
Disability Class: Vision Difficulty
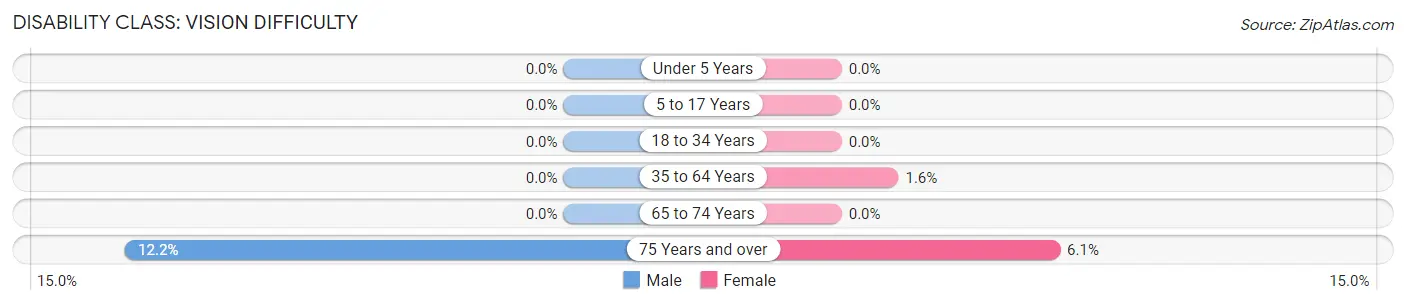
| Age Bracket | Male | Female |
| Under 5 Years | 0 (0.0%) | 0 (0.0%) |
| 5 to 17 Years | 0 (0.0%) | 0 (0.0%) |
| 18 to 34 Years | 0 (0.0%) | 0 (0.0%) |
| 35 to 64 Years | 0 (0.0%) | 10 (1.6%) |
| 65 to 74 Years | 0 (0.0%) | 0 (0.0%) |
| 75 Years and over | 15 (12.2%) | 11 (6.1%) |
Disability Class: Cognitive Difficulty
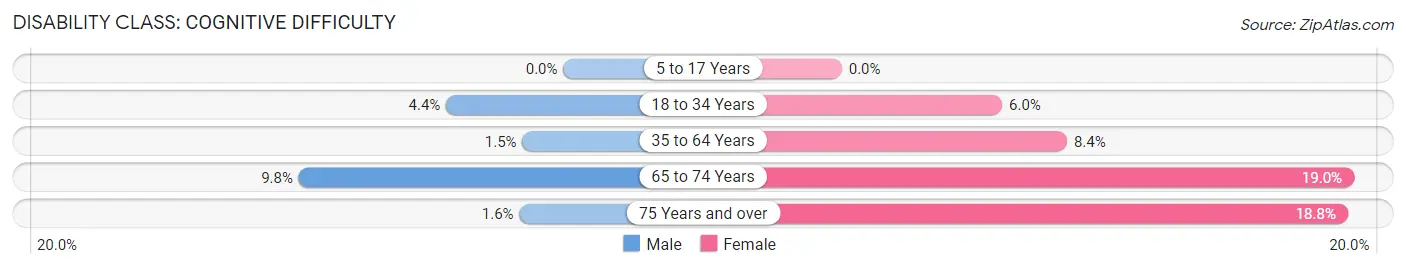
| Age Bracket | Male | Female |
| 5 to 17 Years | 0 (0.0%) | 0 (0.0%) |
| 18 to 34 Years | 10 (4.3%) | 15 (5.9%) |
| 35 to 64 Years | 11 (1.5%) | 53 (8.4%) |
| 65 to 74 Years | 16 (9.8%) | 27 (19.0%) |
| 75 Years and over | 2 (1.6%) | 34 (18.8%) |
Disability Class: Ambulatory Difficulty
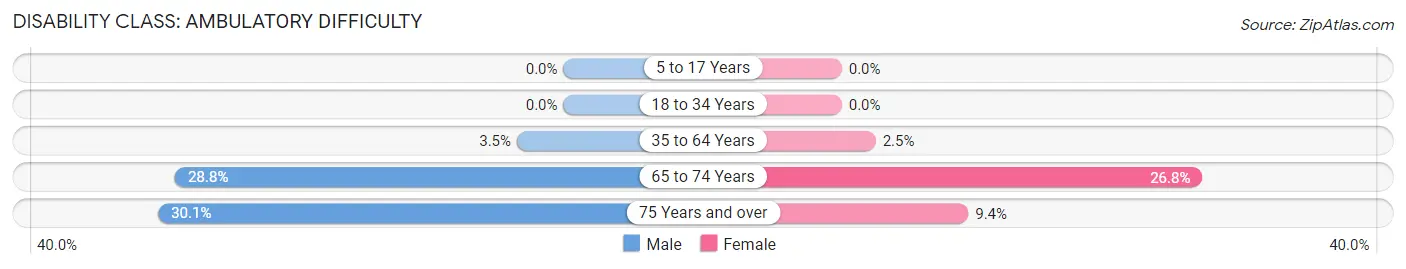
| Age Bracket | Male | Female |
| 5 to 17 Years | 0 (0.0%) | 0 (0.0%) |
| 18 to 34 Years | 0 (0.0%) | 0 (0.0%) |
| 35 to 64 Years | 25 (3.5%) | 16 (2.5%) |
| 65 to 74 Years | 47 (28.8%) | 38 (26.8%) |
| 75 Years and over | 37 (30.1%) | 17 (9.4%) |
Disability Class: Self-Care Difficulty
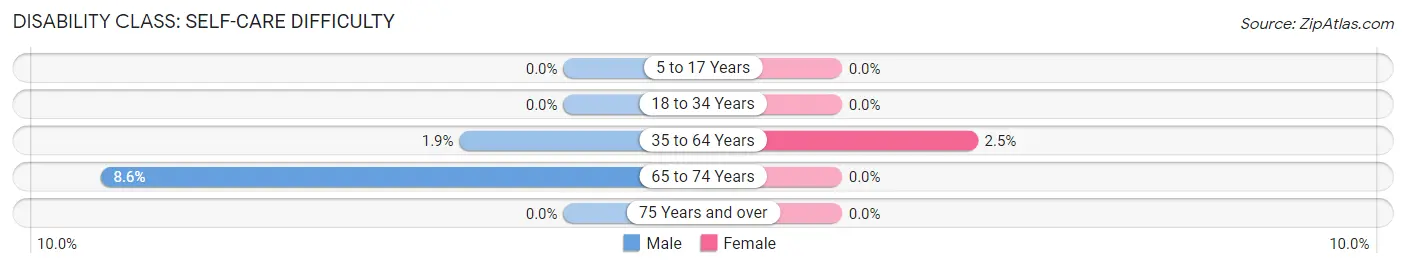
| Age Bracket | Male | Female |
| 5 to 17 Years | 0 (0.0%) | 0 (0.0%) |
| 18 to 34 Years | 0 (0.0%) | 0 (0.0%) |
| 35 to 64 Years | 14 (1.9%) | 16 (2.5%) |
| 65 to 74 Years | 14 (8.6%) | 0 (0.0%) |
| 75 Years and over | 0 (0.0%) | 0 (0.0%) |
Technology Access in Rockwood
Computing Device Access in Rockwood
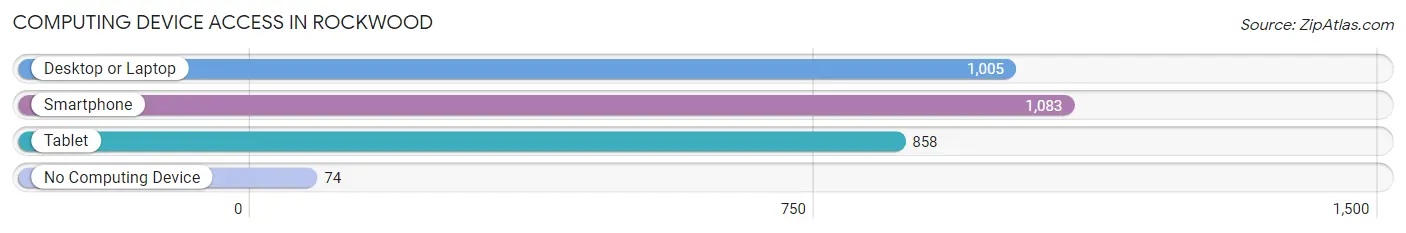
| Device Type | # Households | % Households |
| Desktop or Laptop | 1,005 | 80.8% |
| Smartphone | 1,083 | 87.1% |
| Tablet | 858 | 69.0% |
| No Computing Device | 74 | 5.9% |
| Total | 1,244 | 100.0% |
Internet Access in Rockwood
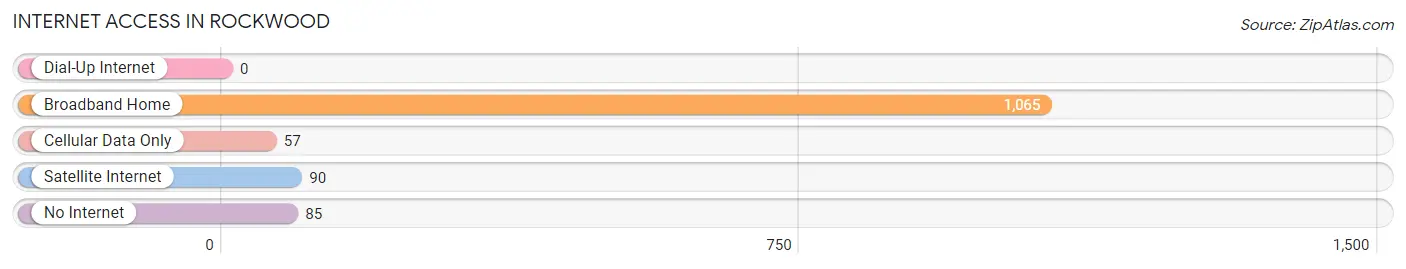
| Internet Type | # Households | % Households |
| Dial-Up Internet | 0 | 0.0% |
| Broadband Home | 1,065 | 85.6% |
| Cellular Data Only | 57 | 4.6% |
| Satellite Internet | 90 | 7.2% |
| No Internet | 85 | 6.8% |
| Total | 1,244 | 100.0% |
Rockwood Summary
Wood, MI is a small city located in the southeastern corner of Michigan. It is situated in the heart of the Great Lakes region and is part of the Detroit metropolitan area. The city has a population of approximately 8,000 people and is the county seat of Oakland County.
History
The area that is now Rockwood was first settled in the early 1800s by settlers from New England. The first settlers were primarily farmers and the area was known as the Rockwood Settlement. The settlement was named after the rocky terrain of the area. In 1827, the settlement was incorporated as the Village of Rockwood.
In the late 1800s, the village began to grow and develop. The village was connected to the rest of the state by the Detroit, Grand Haven and Milwaukee Railroad. This allowed for the growth of industry in the area. The village was also home to several mills and factories.
In the early 1900s, the village was renamed the City of Rockwood. The city continued to grow and develop throughout the 20th century. In the 1950s, the city was connected to the rest of the state by the Interstate Highway System. This allowed for the growth of the city and the surrounding area.
Geography
Rockwood is located in the southeastern corner of Michigan. It is situated in the heart of the Great Lakes region and is part of the Detroit metropolitan area. The city is located on the Huron River and is surrounded by several lakes, including Lake Erie, Lake St. Clair, and Lake Huron. The city is also located near several state parks, including the Rockwood State Park and the Rockwood Nature Preserve.
The city has a total area of 4.2 square miles, of which 4.1 square miles is land and 0.1 square miles is water. The city has a humid continental climate, with cold winters and warm summers.
Economy
Rockwood’s economy is largely based on manufacturing and retail. The city is home to several factories and mills, including the Rockwood Manufacturing Company, which produces automotive parts. The city is also home to several retail stores, including a Walmart Supercenter and a Target.
The city is also home to several small businesses, including restaurants, bars, and shops. The city is also home to several medical facilities, including a hospital and several clinics.
Demographics
As of the 2010 census, the population of Rockwood was 8,000. The racial makeup of the city was 87.3% White, 8.2% African American, 0.7% Native American, 0.7% Asian, 0.2% Pacific Islander, and 2.1% from other races. Hispanic or Latino of any race were 3.2% of the population.
The median income for a household in the city was $45,000, and the median income for a family was $50,000. The per capita income for the city was $20,000. About 11.3% of families and 14.2% of the population were below the poverty line, including 18.2% of those under age 18 and 8.3% of those age 65 or over.
Common Questions
What is Per Capita Income in Rockwood?
Per Capita income in Rockwood is $35,720.
What is the Median Family Income in Rockwood?
Median Family Income in Rockwood is $100,015.
What is the Median Household income in Rockwood?
Median Household Income in Rockwood is $93,036.
What is Income or Wage Gap in Rockwood?
Income or Wage Gap in Rockwood is 41.0%.
Women in Rockwood earn 59.0 cents for every dollar earned by a man.
What is Inequality or Gini Index in Rockwood?
Inequality or Gini Index in Rockwood is 0.33.
What is the Total Population of Rockwood?
Total Population of Rockwood is 3,232.
What is the Total Male Population of Rockwood?
Total Male Population of Rockwood is 1,548.
What is the Total Female Population of Rockwood?
Total Female Population of Rockwood is 1,684.
What is the Ratio of Males per 100 Females in Rockwood?
There are 91.92 Males per 100 Females in Rockwood.
What is the Ratio of Females per 100 Males in Rockwood?
There are 108.79 Females per 100 Males in Rockwood.
What is the Median Population Age in Rockwood?
Median Population Age in Rockwood is 42.1 Years.
What is the Average Family Size in Rockwood
Average Family Size in Rockwood is 3.1 People.
What is the Average Household Size in Rockwood
Average Household Size in Rockwood is 2.6 People.
How Large is the Labor Force in Rockwood?
There are 1,524 People in the Labor Forcein in Rockwood.
What is the Percentage of People in the Labor Force in Rockwood?
60.7% of People are in the Labor Force in Rockwood.
What is the Unemployment Rate in Rockwood?
Unemployment Rate in Rockwood is 3.3%.