Zip Codes with the Highest Percentage of Population Employed in Computer & Mathematics in Utica, MI
RELATED REPORTS & OPTIONS
Computer & Mathematics
Utica
Compare Zip Codes
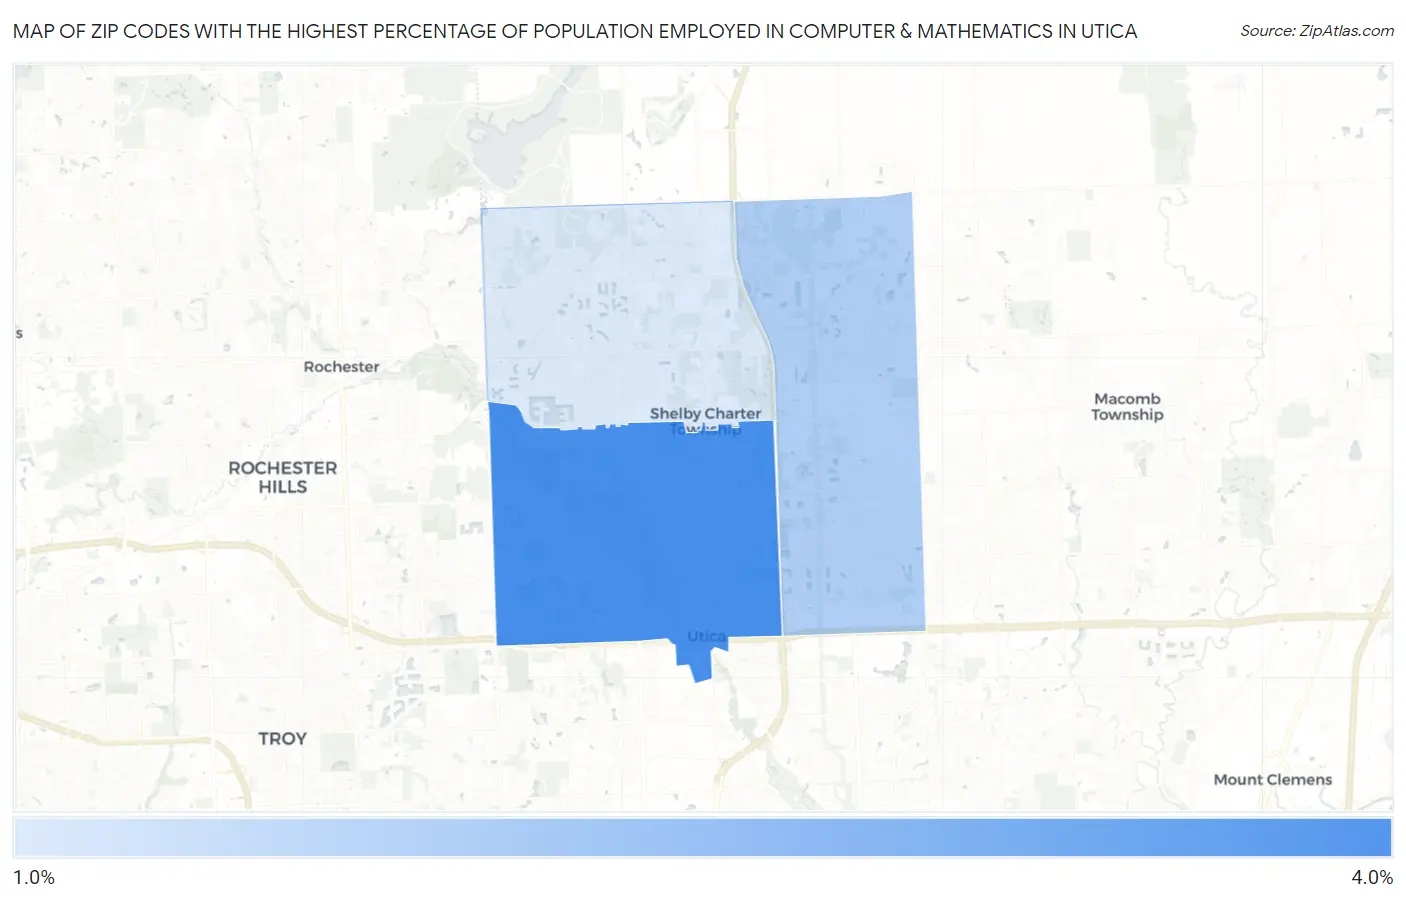
Map of Zip Codes with the Highest Percentage of Population Employed in Computer & Mathematics in Utica
2.0%
3.8%
Zip Codes with the Highest Percentage of Population Employed in Computer & Mathematics in Utica, MI
| Zip Code | % Employed | vs State | vs National | |
| 1. | 48317 | 3.8% | 2.9%(+0.924)#129 | 3.5%(+0.325)#5,359 |
| 2. | 48315 | 2.6% | 2.9%(-0.370)#269 | 3.5%(-0.969)#9,402 |
| 3. | 48316 | 2.0% | 2.9%(-0.928)#363 | 3.5%(-1.53)#11,810 |
1
Common Questions
What are the Top Zip Codes with the Highest Percentage of Population Employed in Computer & Mathematics in Utica, MI?
Top Zip Codes with the Highest Percentage of Population Employed in Computer & Mathematics in Utica, MI are:
What zip code has the Highest Percentage of Population Employed in Computer & Mathematics in Utica, MI?
48317 has the Highest Percentage of Population Employed in Computer & Mathematics in Utica, MI with 3.8%.
What is the Percentage of Population Employed in Computer & Mathematics in Utica, MI?
Percentage of Population Employed in Computer & Mathematics in Utica is 2.2%.
What is the Percentage of Population Employed in Computer & Mathematics in Michigan?
Percentage of Population Employed in Computer & Mathematics in Michigan is 2.9%.
What is the Percentage of Population Employed in Computer & Mathematics in the United States?
Percentage of Population Employed in Computer & Mathematics in the United States is 3.5%.