Zip Codes with the Highest Percentage of Population Employed in Computer & Mathematics in Southfield, MI
RELATED REPORTS & OPTIONS
Computer & Mathematics
Southfield
Compare Zip Codes
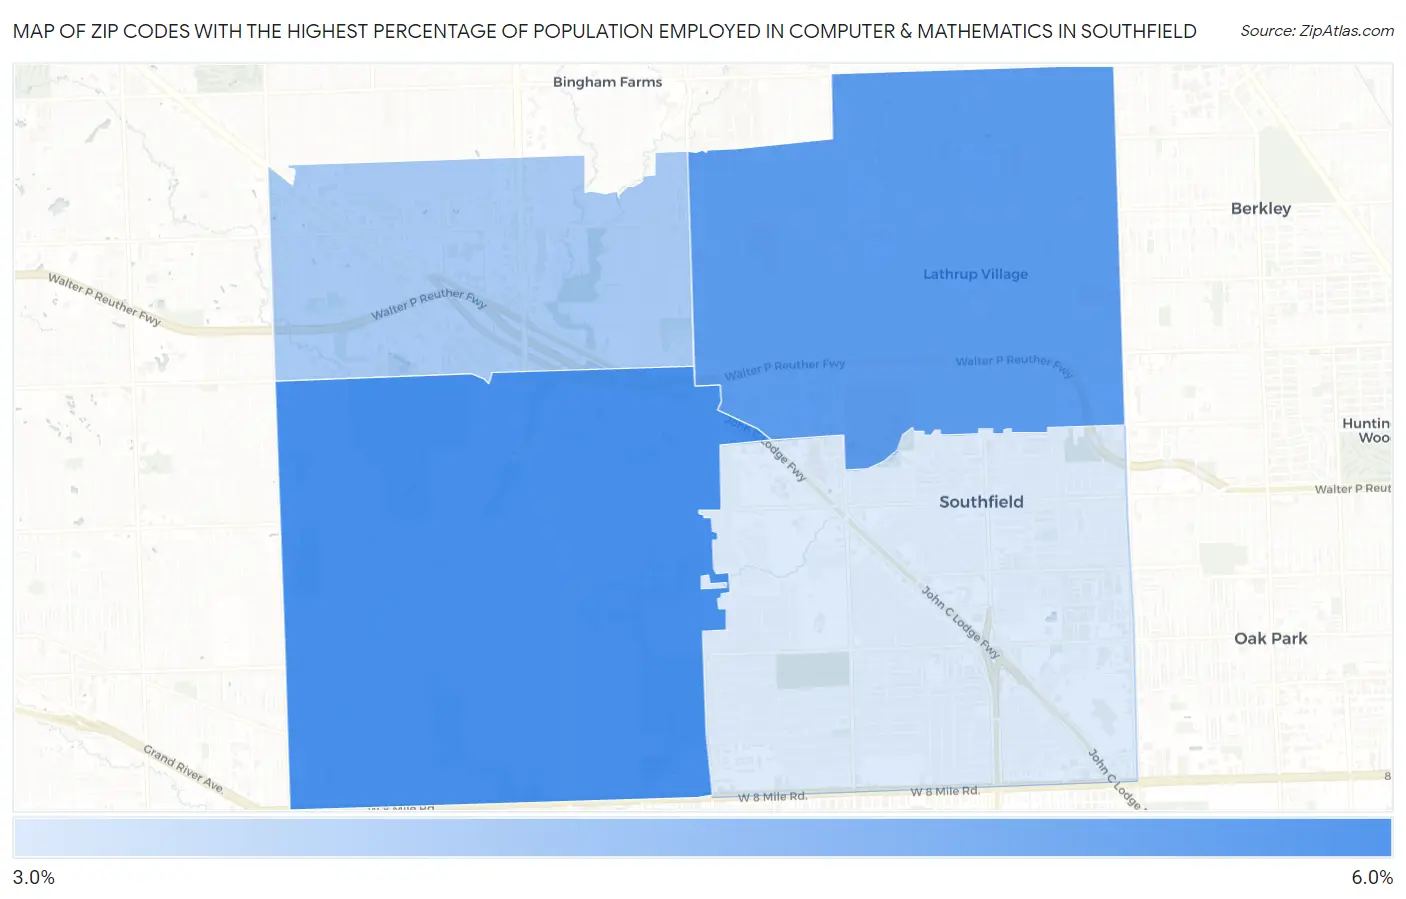
Map of Zip Codes with the Highest Percentage of Population Employed in Computer & Mathematics in Southfield
3.4%
5.3%
Zip Codes with the Highest Percentage of Population Employed in Computer & Mathematics in Southfield, MI
| Zip Code | % Employed | vs State | vs National | |
| 1. | 48033 | 5.3% | 2.9%(+2.38)#56 | 3.5%(+1.78)#2,996 |
| 2. | 48076 | 5.0% | 2.9%(+2.12)#67 | 3.5%(+1.52)#3,308 |
| 3. | 48034 | 4.0% | 2.9%(+1.12)#115 | 3.5%(+0.525)#4,925 |
| 4. | 48075 | 3.4% | 2.9%(+0.425)#170 | 3.5%(-0.175)#6,623 |
1
Common Questions
What are the Top 3 Zip Codes with the Highest Percentage of Population Employed in Computer & Mathematics in Southfield, MI?
Top 3 Zip Codes with the Highest Percentage of Population Employed in Computer & Mathematics in Southfield, MI are:
What zip code has the Highest Percentage of Population Employed in Computer & Mathematics in Southfield, MI?
48033 has the Highest Percentage of Population Employed in Computer & Mathematics in Southfield, MI with 5.3%.
What is the Percentage of Population Employed in Computer & Mathematics in Southfield, MI?
Percentage of Population Employed in Computer & Mathematics in Southfield is 4.2%.
What is the Percentage of Population Employed in Computer & Mathematics in Michigan?
Percentage of Population Employed in Computer & Mathematics in Michigan is 2.9%.
What is the Percentage of Population Employed in Computer & Mathematics in the United States?
Percentage of Population Employed in Computer & Mathematics in the United States is 3.5%.