Walkerville, MI Map & Demographics
Walkerville Map
Walkerville Overview
$15,622
PER CAPITA INCOME
$33,958
AVG FAMILY INCOME
$31,625
AVG HOUSEHOLD INCOME
68.2%
WAGE / INCOME GAP [ % ]
31.8¢/ $1
WAGE / INCOME GAP [ $ ]
0.39
INEQUALITY / GINI INDEX
212
TOTAL POPULATION
105
MALE POPULATION
107
FEMALE POPULATION
98.13
MALES / 100 FEMALES
101.90
FEMALES / 100 MALES
37.1
MEDIAN AGE
3.7
AVG FAMILY SIZE
2.8
AVG HOUSEHOLD SIZE
75
LABOR FORCE [ PEOPLE ]
53.2%
PERCENT IN LABOR FORCE
Walkerville Zip Codes
Walkerville Area Codes
Income in Walkerville
Income Overview in Walkerville
Per Capita Income in Walkerville is $15,622, while median incomes of families and households are $33,958 and $31,625 respectively.
| Characteristic | Number | Measure |
| Per Capita Income | 212 | $15,622 |
| Median Family Income | 49 | $33,958 |
| Mean Family Income | 49 | $51,410 |
| Median Household Income | 75 | $31,625 |
| Mean Household Income | 75 | $41,259 |
| Income Deficit | 49 | $0 |
| Wage / Income Gap (%) | 212 | 68.20% |
| Wage / Income Gap ($) | 212 | 31.80¢ per $1 |
| Gini / Inequality Index | 212 | 0.39 |
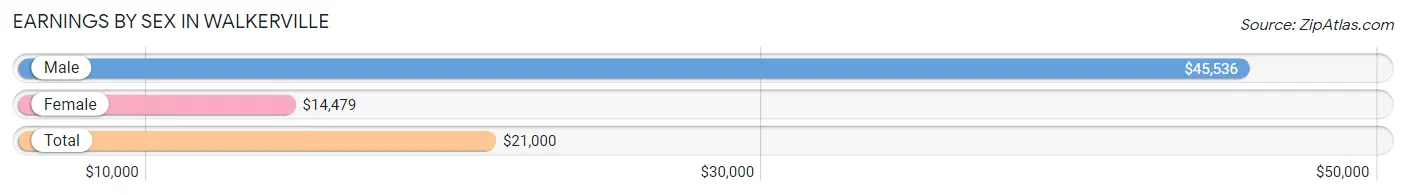
Earnings by Sex in Walkerville
Average Earnings in Walkerville are $21,000, $45,536 for men and $14,479 for women, a difference of 68.2%.
| Sex | Number | Average Earnings |
| Male | 31 (37.8%) | $45,536 |
| Female | 51 (62.2%) | $14,479 |
| Total | 82 (100.0%) | $21,000 |
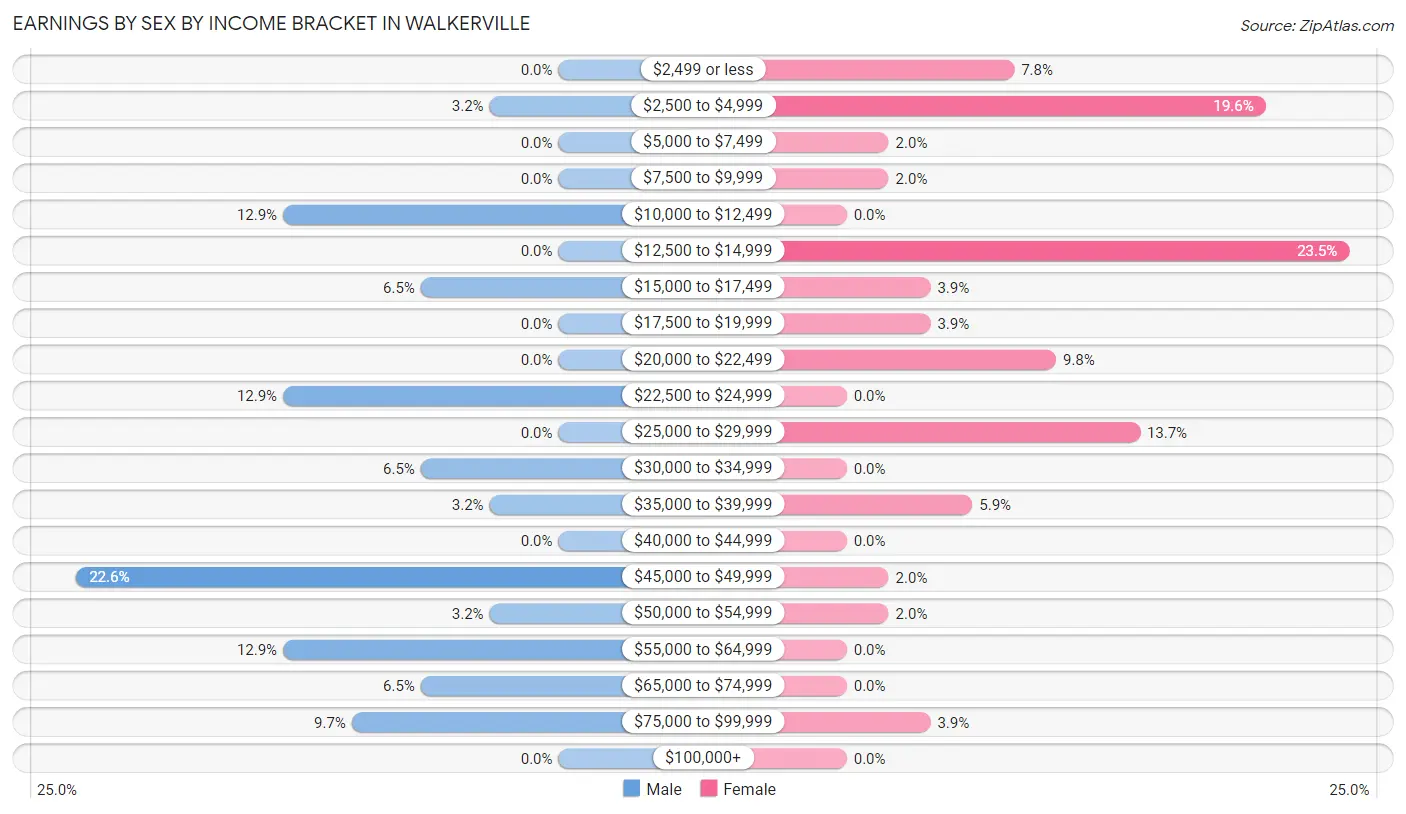
Earnings by Sex by Income Bracket in Walkerville
The most common earnings brackets in Walkerville are $45,000 to $49,999 for men (7 | 22.6%) and $12,500 to $14,999 for women (12 | 23.5%).
| Income | Male | Female |
| $2,499 or less | 0 (0.0%) | 4 (7.8%) |
| $2,500 to $4,999 | 1 (3.2%) | 10 (19.6%) |
| $5,000 to $7,499 | 0 (0.0%) | 1 (2.0%) |
| $7,500 to $9,999 | 0 (0.0%) | 1 (2.0%) |
| $10,000 to $12,499 | 4 (12.9%) | 0 (0.0%) |
| $12,500 to $14,999 | 0 (0.0%) | 12 (23.5%) |
| $15,000 to $17,499 | 2 (6.5%) | 2 (3.9%) |
| $17,500 to $19,999 | 0 (0.0%) | 2 (3.9%) |
| $20,000 to $22,499 | 0 (0.0%) | 5 (9.8%) |
| $22,500 to $24,999 | 4 (12.9%) | 0 (0.0%) |
| $25,000 to $29,999 | 0 (0.0%) | 7 (13.7%) |
| $30,000 to $34,999 | 2 (6.5%) | 0 (0.0%) |
| $35,000 to $39,999 | 1 (3.2%) | 3 (5.9%) |
| $40,000 to $44,999 | 0 (0.0%) | 0 (0.0%) |
| $45,000 to $49,999 | 7 (22.6%) | 1 (2.0%) |
| $50,000 to $54,999 | 1 (3.2%) | 1 (2.0%) |
| $55,000 to $64,999 | 4 (12.9%) | 0 (0.0%) |
| $65,000 to $74,999 | 2 (6.5%) | 0 (0.0%) |
| $75,000 to $99,999 | 3 (9.7%) | 2 (3.9%) |
| $100,000+ | 0 (0.0%) | 0 (0.0%) |
| Total | 31 (100.0%) | 51 (100.0%) |
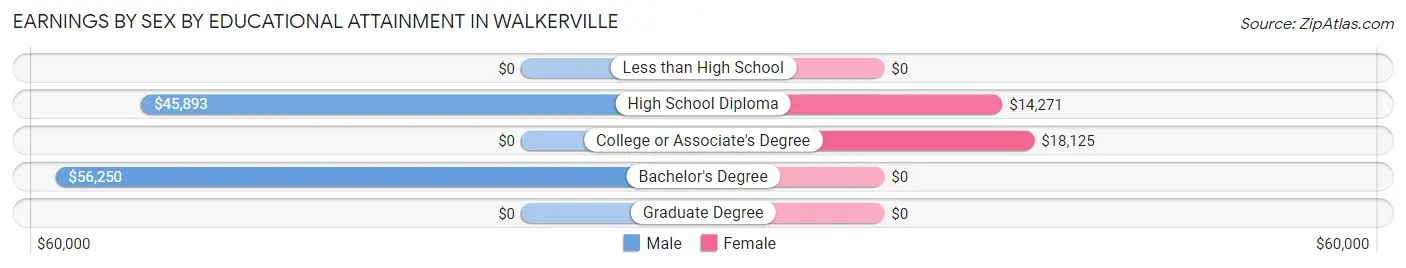
Earnings by Sex by Educational Attainment in Walkerville
Average earnings in Walkerville are $46,071 for men and $16,250 for women, a difference of 64.7%. Men with an educational attainment of bachelor's degree enjoy the highest average annual earnings of $56,250, while those with high school diploma education earn the least with $45,893. Women with an educational attainment of college or associate's degree earn the most with the average annual earnings of $18,125, while those with high school diploma education have the smallest earnings of $14,271.
| Educational Attainment | Male Income | Female Income |
| Less than High School | - | - |
| High School Diploma | $45,893 | $14,271 |
| College or Associate's Degree | - | - |
| Bachelor's Degree | $56,250 | $0 |
| Graduate Degree | - | - |
| Total | $46,071 | $16,250 |
Family Income in Walkerville
Family Income Brackets in Walkerville
According to the Walkerville family income data, there are 24 families falling into the $25,000 to $34,999 income range, which is the most common income bracket and makes up 49.0% of all families.
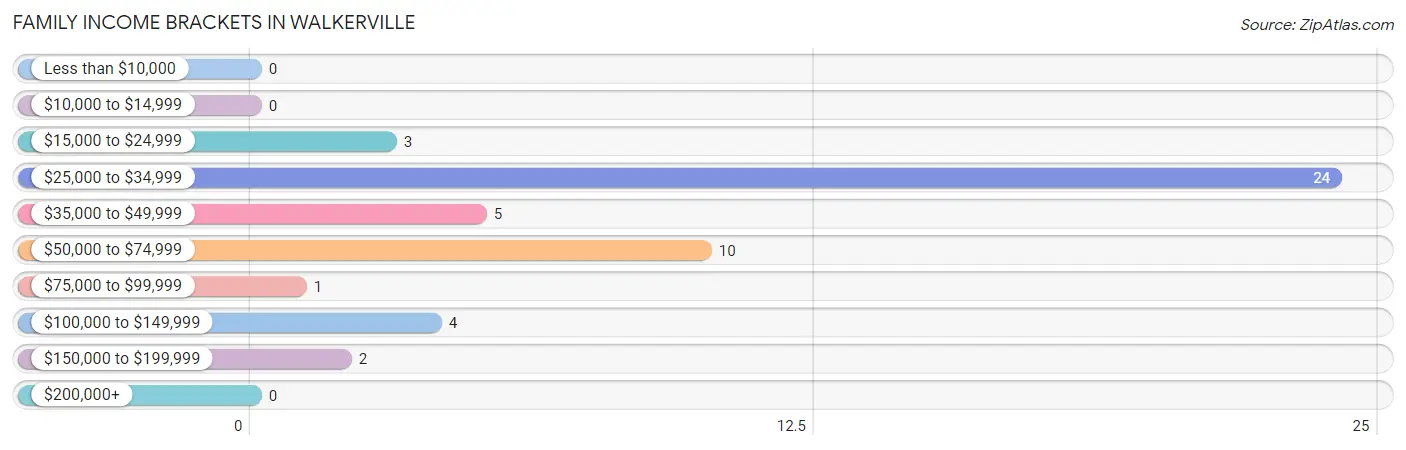
| Income Bracket | # Families | % Families |
| Less than $10,000 | 0 | 0.0% |
| $10,000 to $14,999 | 0 | 0.0% |
| $15,000 to $24,999 | 3 | 6.1% |
| $25,000 to $34,999 | 24 | 49.0% |
| $35,000 to $49,999 | 5 | 10.2% |
| $50,000 to $74,999 | 10 | 20.4% |
| $75,000 to $99,999 | 1 | 2.0% |
| $100,000 to $149,999 | 4 | 8.2% |
| $150,000 to $199,999 | 2 | 4.1% |
| $200,000+ | 0 | 0.0% |
Family Income by Famaliy Size in Walkerville
2-person families (19 | 38.8%) account for the highest median family income in Walkerville with $43,125 per family, while 2-person families (19 | 38.8%) have the highest median income of $21,562 per family member.
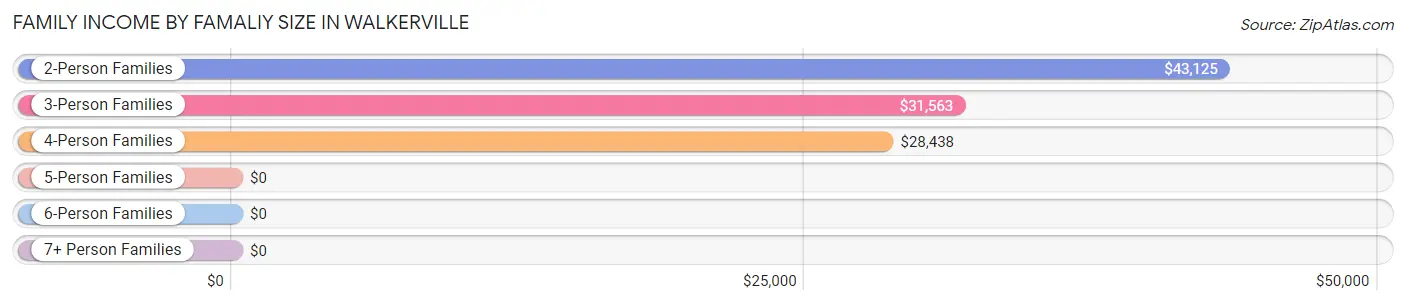
| Income Bracket | # Families | Median Income |
| 2-Person Families | 19 (38.8%) | $43,125 |
| 3-Person Families | 10 (20.4%) | $31,563 |
| 4-Person Families | 9 (18.4%) | $28,438 |
| 5-Person Families | 4 (8.2%) | $0 |
| 6-Person Families | 4 (8.2%) | $0 |
| 7+ Person Families | 3 (6.1%) | $0 |
| Total | 49 (100.0%) | $33,958 |
Family Income by Number of Earners in Walkerville
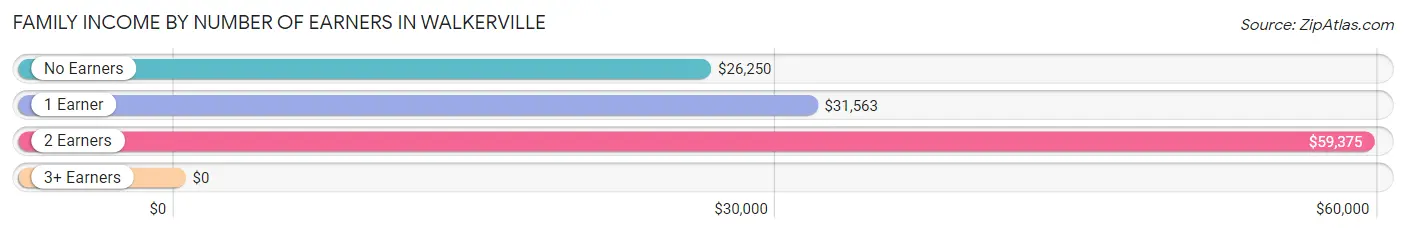
| Number of Earners | # Families | Median Income |
| No Earners | 6 (12.2%) | $26,250 |
| 1 Earner | 24 (49.0%) | $31,563 |
| 2 Earners | 16 (32.7%) | $59,375 |
| 3+ Earners | 3 (6.1%) | $0 |
| Total | 49 (100.0%) | $33,958 |
Household Income in Walkerville
Household Income Brackets in Walkerville
With 20 households falling in the category, the $25,000 to $34,999 income range is the most frequent in Walkerville, accounting for 26.7% of all households.
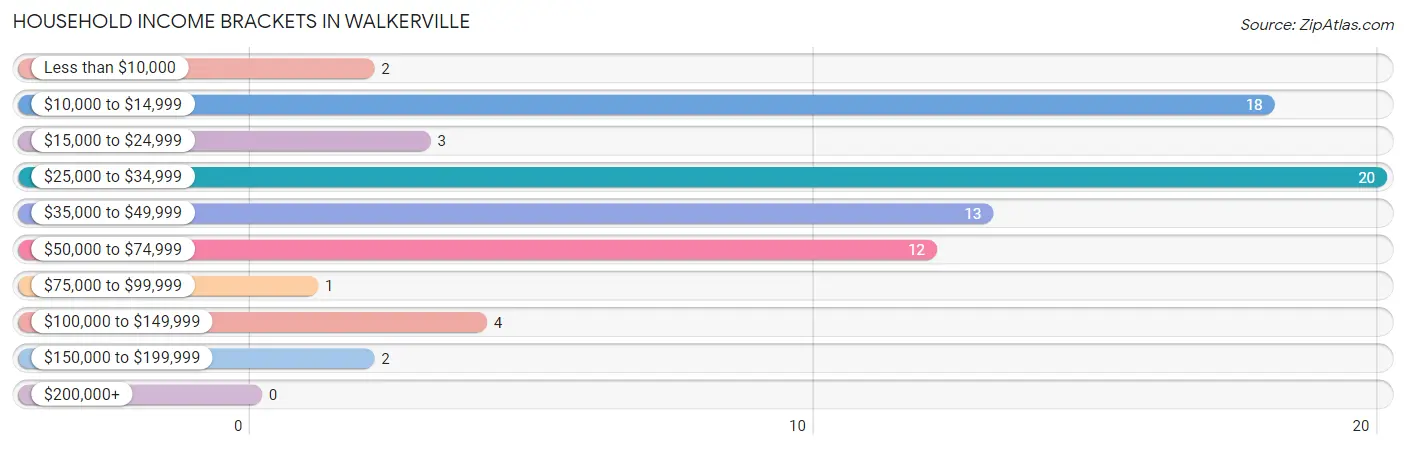
| Income Bracket | # Households | % Households |
| Less than $10,000 | 2 | 2.7% |
| $10,000 to $14,999 | 18 | 24.0% |
| $15,000 to $24,999 | 3 | 4.0% |
| $25,000 to $34,999 | 20 | 26.7% |
| $35,000 to $49,999 | 13 | 17.3% |
| $50,000 to $74,999 | 12 | 16.0% |
| $75,000 to $99,999 | 1 | 1.3% |
| $100,000 to $149,999 | 4 | 5.3% |
| $150,000 to $199,999 | 2 | 2.7% |
| $200,000+ | 0 | 0.0% |
Household Income by Householder Age in Walkerville
The median household income in Walkerville is $31,625, with the highest median household income of $46,250 found in the 65+ years age bracket for the primary householder. A total of 9 households (12.0%) fall into this category.
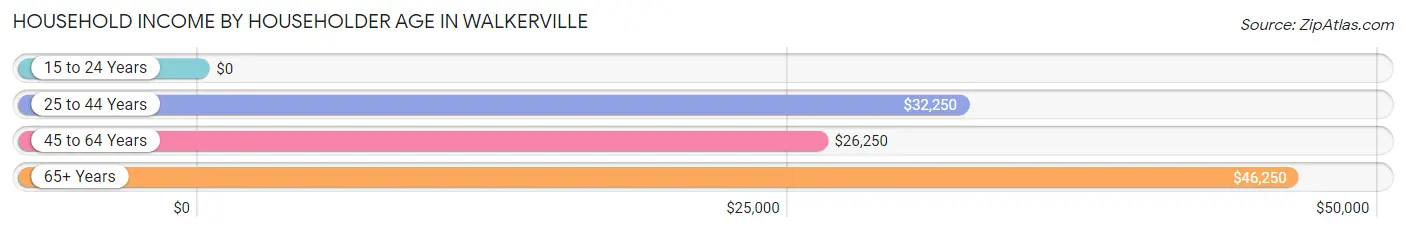
| Income Bracket | # Households | Median Income |
| 15 to 24 Years | 0 (0.0%) | $0 |
| 25 to 44 Years | 26 (34.7%) | $32,250 |
| 45 to 64 Years | 40 (53.3%) | $26,250 |
| 65+ Years | 9 (12.0%) | $46,250 |
| Total | 75 (100.0%) | $31,625 |
Poverty in Walkerville
Income Below Poverty by Sex and Age in Walkerville
With 33.3% poverty level for males and 40.2% for females among the residents of Walkerville, 5 year old males and 12 to 14 year old females are the most vulnerable to poverty, with 3 males (75.0%) and 5 females (100.0%) in their respective age groups living below the poverty level.
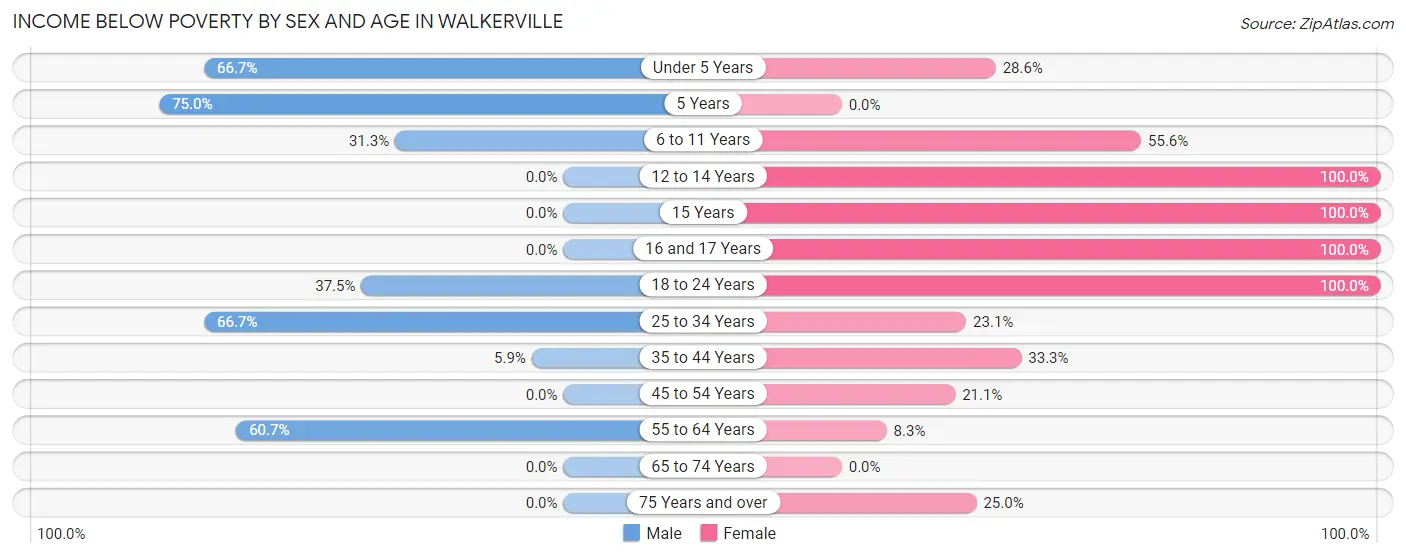
| Age Bracket | Male | Female |
| Under 5 Years | 4 (66.7%) | 2 (28.6%) |
| 5 Years | 3 (75.0%) | 0 (0.0%) |
| 6 to 11 Years | 5 (31.2%) | 15 (55.6%) |
| 12 to 14 Years | 0 (0.0%) | 5 (100.0%) |
| 15 Years | 0 (0.0%) | 3 (100.0%) |
| 16 and 17 Years | 0 (0.0%) | 3 (100.0%) |
| 18 to 24 Years | 3 (37.5%) | 4 (100.0%) |
| 25 to 34 Years | 2 (66.7%) | 3 (23.1%) |
| 35 to 44 Years | 1 (5.9%) | 2 (33.3%) |
| 45 to 54 Years | 0 (0.0%) | 4 (21.0%) |
| 55 to 64 Years | 17 (60.7%) | 1 (8.3%) |
| 65 to 74 Years | 0 (0.0%) | 0 (0.0%) |
| 75 Years and over | 0 (0.0%) | 1 (25.0%) |
| Total | 35 (33.3%) | 43 (40.2%) |
Income Above Poverty by Sex and Age in Walkerville
According to the poverty statistics in Walkerville, males aged 12 to 14 years and females aged 5 years are the age groups that are most secure financially, with 100.0% of males and 100.0% of females in these age groups living above the poverty line.
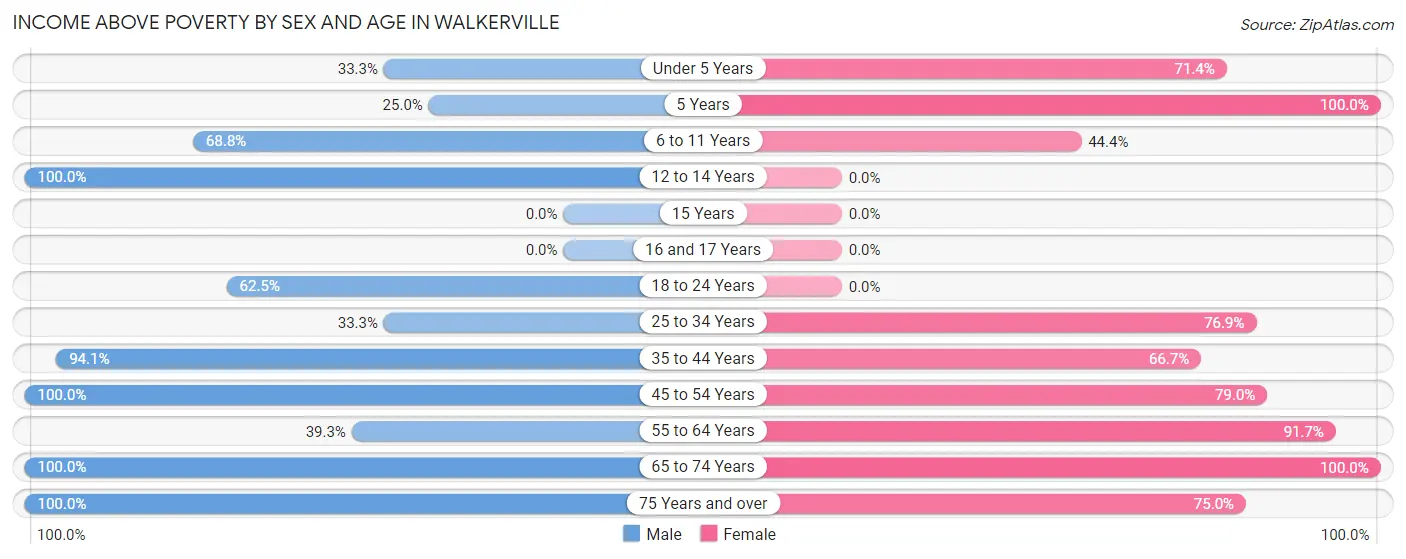
| Age Bracket | Male | Female |
| Under 5 Years | 2 (33.3%) | 5 (71.4%) |
| 5 Years | 1 (25.0%) | 1 (100.0%) |
| 6 to 11 Years | 11 (68.8%) | 12 (44.4%) |
| 12 to 14 Years | 2 (100.0%) | 0 (0.0%) |
| 15 Years | 0 (0.0%) | 0 (0.0%) |
| 16 and 17 Years | 0 (0.0%) | 0 (0.0%) |
| 18 to 24 Years | 5 (62.5%) | 0 (0.0%) |
| 25 to 34 Years | 1 (33.3%) | 10 (76.9%) |
| 35 to 44 Years | 16 (94.1%) | 4 (66.7%) |
| 45 to 54 Years | 11 (100.0%) | 15 (78.9%) |
| 55 to 64 Years | 11 (39.3%) | 11 (91.7%) |
| 65 to 74 Years | 7 (100.0%) | 3 (100.0%) |
| 75 Years and over | 3 (100.0%) | 3 (75.0%) |
| Total | 70 (66.7%) | 64 (59.8%) |
Income Below Poverty Among Married-Couple Families in Walkerville
The poverty statistics for married-couple families in Walkerville show that 6.5% or 2 of the total 31 families live below the poverty line. Families with 3 or 4 children have the highest poverty rate of 22.2%, comprising of 2 families. On the other hand, families with no children have the lowest poverty rate of 0.0%, which includes 0 families.
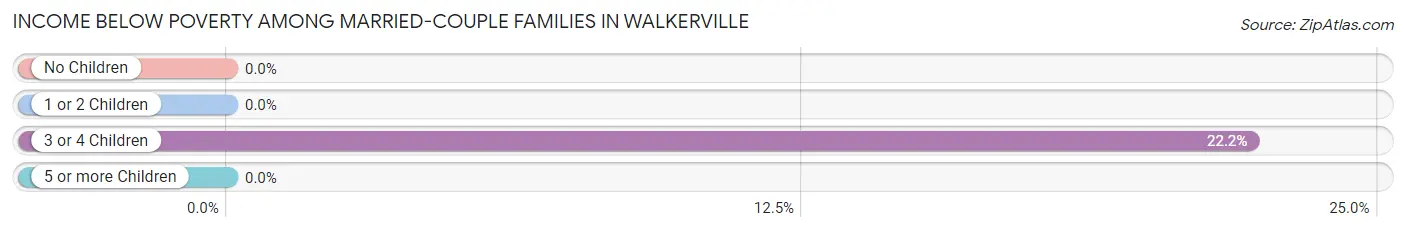
| Children | Above Poverty | Below Poverty |
| No Children | 20 (100.0%) | 0 (0.0%) |
| 1 or 2 Children | 2 (100.0%) | 0 (0.0%) |
| 3 or 4 Children | 7 (77.8%) | 2 (22.2%) |
| 5 or more Children | 0 (0.0%) | 0 (0.0%) |
| Total | 29 (93.5%) | 2 (6.5%) |
Income Below Poverty Among Single-Parent Households in Walkerville
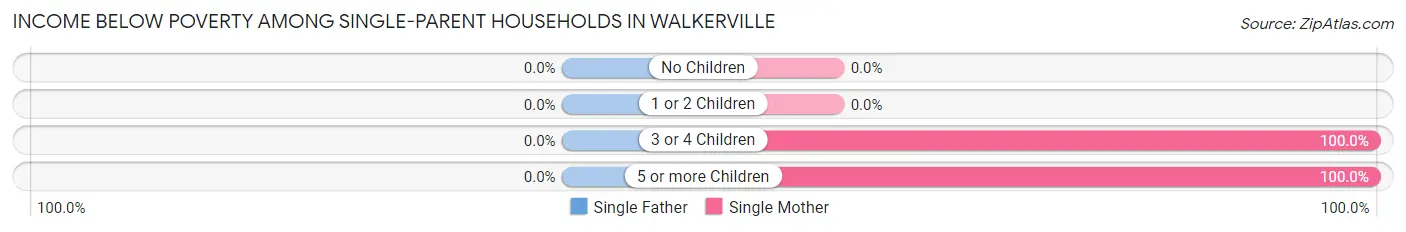
| Children | Single Father | Single Mother |
| No Children | 0 (0.0%) | 0 (0.0%) |
| 1 or 2 Children | 0 (0.0%) | 0 (0.0%) |
| 3 or 4 Children | 0 (0.0%) | 7 (100.0%) |
| 5 or more Children | 0 (0.0%) | 2 (100.0%) |
| Total | 0 (0.0%) | 9 (69.2%) |
Income Below Poverty Among Married-Couple vs Single-Parent Households in Walkerville
The poverty data for Walkerville shows that 2 of the married-couple family households (6.5%) and 9 of the single-parent households (50.0%) are living below the poverty level. Within the married-couple family households, those with 3 or 4 children have the highest poverty rate, with 2 households (22.2%) falling below the poverty line. Among the single-parent households, those with 3 or 4 children have the highest poverty rate, with 7 household (100.0%) living below poverty.
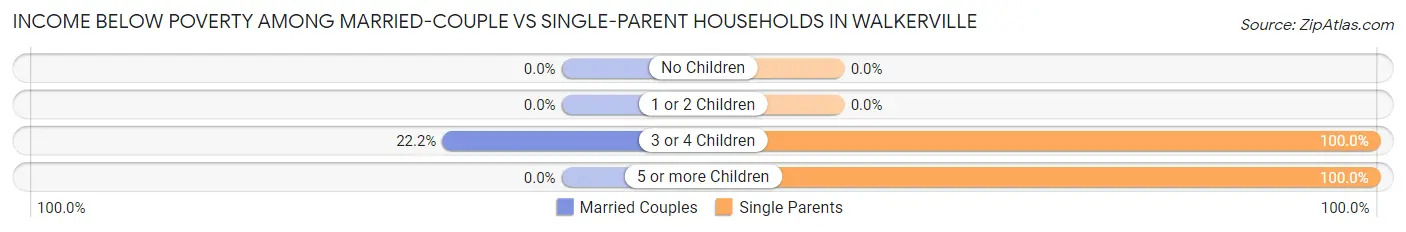
| Children | Married-Couple Families | Single-Parent Households |
| No Children | 0 (0.0%) | 0 (0.0%) |
| 1 or 2 Children | 0 (0.0%) | 0 (0.0%) |
| 3 or 4 Children | 2 (22.2%) | 7 (100.0%) |
| 5 or more Children | 0 (0.0%) | 2 (100.0%) |
| Total | 2 (6.5%) | 9 (50.0%) |
Race in Walkerville
The most populous races in Walkerville are White / Caucasian (183 | 86.3%), Hispanic or Latino (26 | 12.3%), and Some other Race (18 | 8.5%).
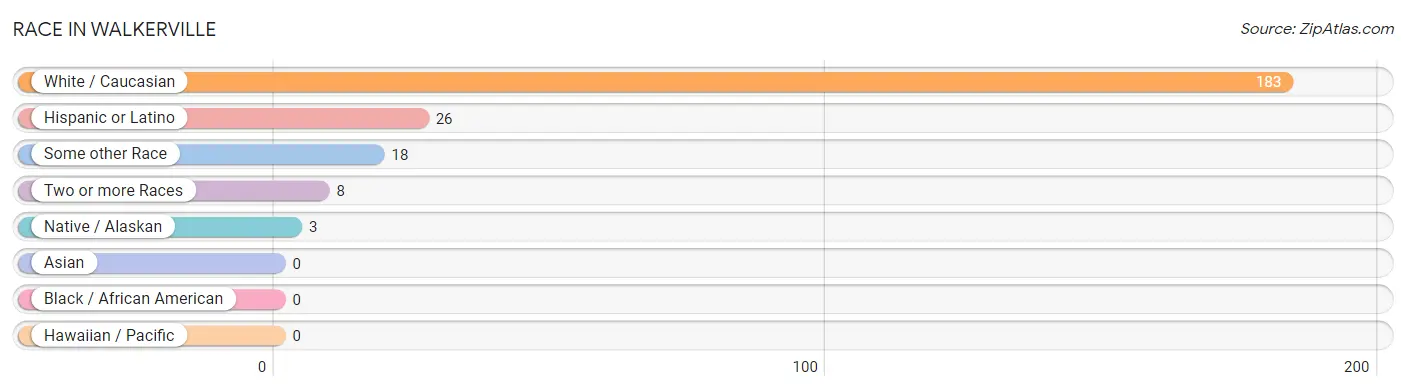
| Race | # Population | % Population |
| Asian | 0 | 0.0% |
| Black / African American | 0 | 0.0% |
| Hawaiian / Pacific | 0 | 0.0% |
| Hispanic or Latino | 26 | 12.3% |
| Native / Alaskan | 3 | 1.4% |
| White / Caucasian | 183 | 86.3% |
| Two or more Races | 8 | 3.8% |
| Some other Race | 18 | 8.5% |
| Total | 212 | 100.0% |
Ancestry in Walkerville
The most populous ancestries reported in Walkerville are Mexican (26 | 12.3%), English (25 | 11.8%), German (25 | 11.8%), American (12 | 5.7%), and Irish (12 | 5.7%), together accounting for 47.2% of all Walkerville residents.
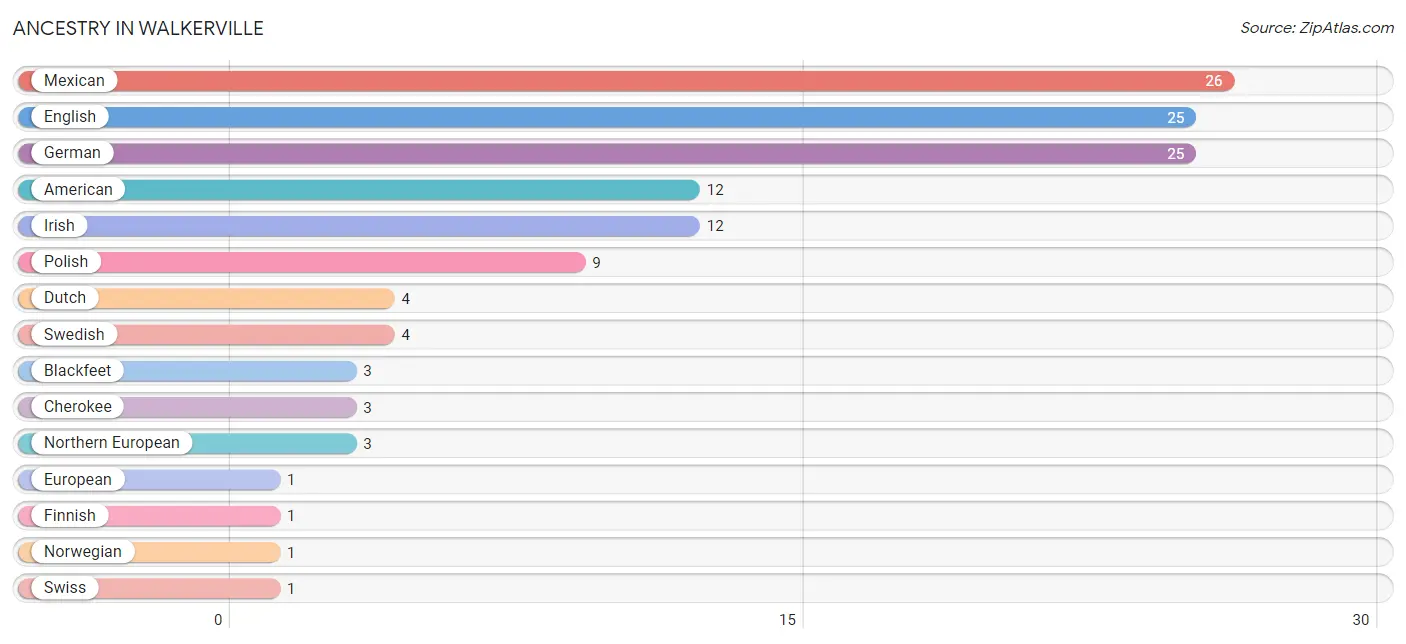
| Ancestry | # Population | % Population |
| American | 12 | 5.7% |
| Blackfeet | 3 | 1.4% |
| Cherokee | 3 | 1.4% |
| Dutch | 4 | 1.9% |
| English | 25 | 11.8% |
| European | 1 | 0.5% |
| Finnish | 1 | 0.5% |
| German | 25 | 11.8% |
| Irish | 12 | 5.7% |
| Mexican | 26 | 12.3% |
| Northern European | 3 | 1.4% |
| Norwegian | 1 | 0.5% |
| Polish | 9 | 4.3% |
| Swedish | 4 | 1.9% |
| Swiss | 1 | 0.5% | View All 15 Rows |
Immigrants in Walkerville
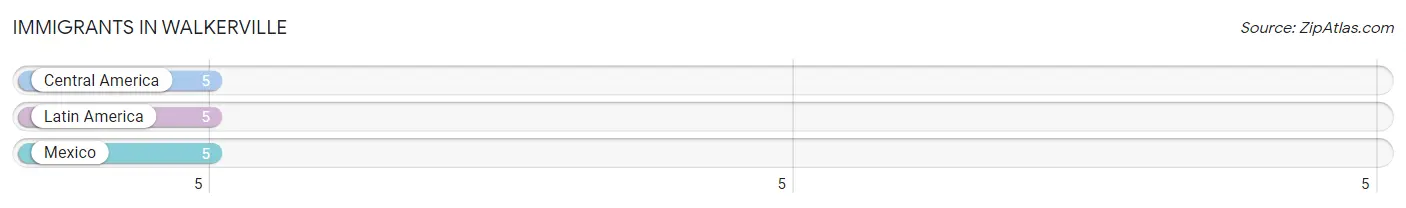
The most numerous immigrant groups reported in Walkerville came from Central America (5 | 2.4%), Latin America (5 | 2.4%), and Mexico (5 | 2.4%), together accounting for 7.1% of all Walkerville residents.
| Immigration Origin | # Population | % Population |
| Central America | 5 | 2.4% |
| Latin America | 5 | 2.4% |
| Mexico | 5 | 2.4% | View All 3 Rows |
Sex and Age in Walkerville
Sex and Age in Walkerville
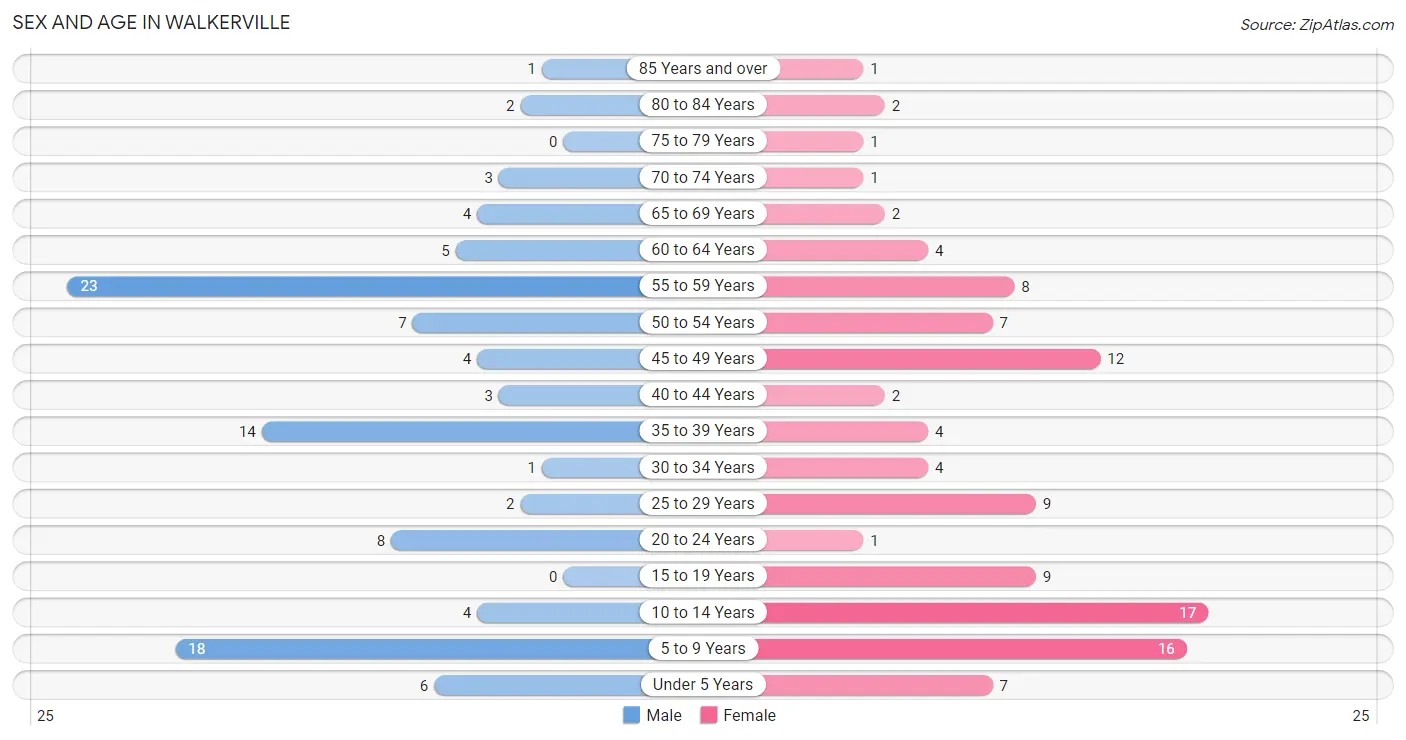
The most populous age groups in Walkerville are 55 to 59 Years (23 | 21.9%) for men and 10 to 14 Years (17 | 15.9%) for women.
| Age Bracket | Male | Female |
| Under 5 Years | 6 (5.7%) | 7 (6.5%) |
| 5 to 9 Years | 18 (17.1%) | 16 (14.9%) |
| 10 to 14 Years | 4 (3.8%) | 17 (15.9%) |
| 15 to 19 Years | 0 (0.0%) | 9 (8.4%) |
| 20 to 24 Years | 8 (7.6%) | 1 (0.9%) |
| 25 to 29 Years | 2 (1.9%) | 9 (8.4%) |
| 30 to 34 Years | 1 (0.9%) | 4 (3.7%) |
| 35 to 39 Years | 14 (13.3%) | 4 (3.7%) |
| 40 to 44 Years | 3 (2.9%) | 2 (1.9%) |
| 45 to 49 Years | 4 (3.8%) | 12 (11.2%) |
| 50 to 54 Years | 7 (6.7%) | 7 (6.5%) |
| 55 to 59 Years | 23 (21.9%) | 8 (7.5%) |
| 60 to 64 Years | 5 (4.8%) | 4 (3.7%) |
| 65 to 69 Years | 4 (3.8%) | 2 (1.9%) |
| 70 to 74 Years | 3 (2.9%) | 1 (0.9%) |
| 75 to 79 Years | 0 (0.0%) | 1 (0.9%) |
| 80 to 84 Years | 2 (1.9%) | 2 (1.9%) |
| 85 Years and over | 1 (0.9%) | 1 (0.9%) |
| Total | 105 (100.0%) | 107 (100.0%) |
Families and Households in Walkerville
Median Family Size in Walkerville
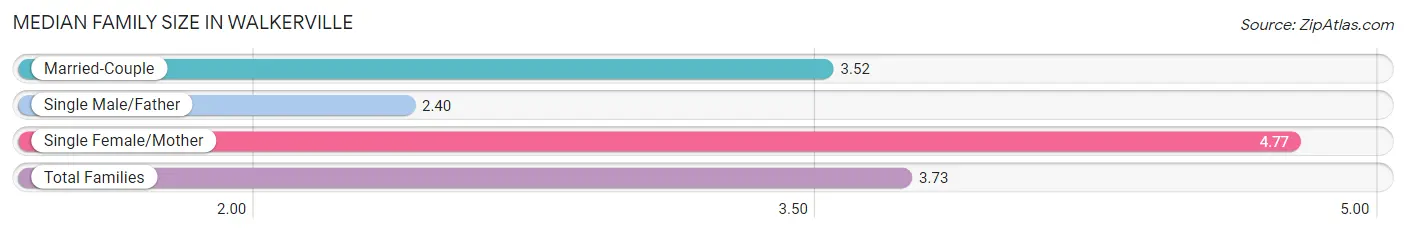
The median family size in Walkerville is 3.73 persons per family, with single female/mother families (13 | 26.5%) accounting for the largest median family size of 4.77 persons per family. On the other hand, single male/father families (5 | 10.2%) represent the smallest median family size with 2.40 persons per family.
| Family Type | # Families | Family Size |
| Married-Couple | 31 (63.3%) | 3.52 |
| Single Male/Father | 5 (10.2%) | 2.40 |
| Single Female/Mother | 13 (26.5%) | 4.77 |
| Total Families | 49 (100.0%) | 3.73 |
Median Household Size in Walkerville
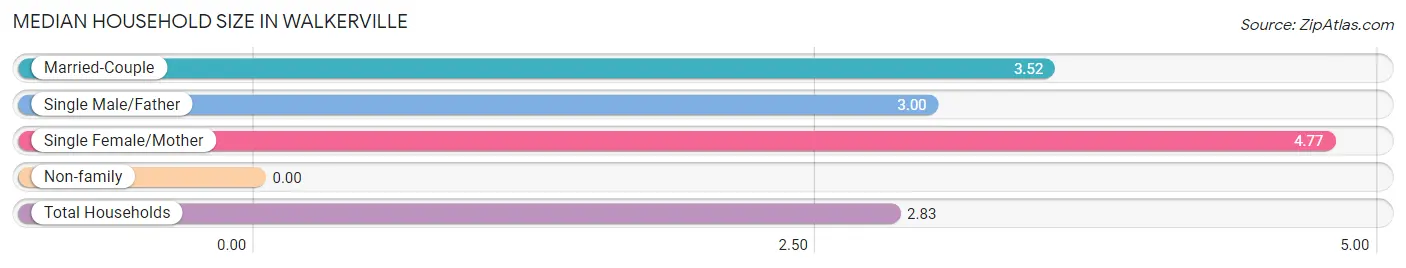
| Household Type | # Households | Household Size |
| Married-Couple | 31 (41.3%) | 3.52 |
| Single Male/Father | 5 (6.7%) | 3.00 |
| Single Female/Mother | 13 (17.3%) | 4.77 |
| Non-family | 26 (34.7%) | - |
| Total Households | 75 (100.0%) | 2.83 |
Household Size by Marriage Status in Walkerville
Out of a total of 75 households in Walkerville, 49 (65.3%) are family households, while 26 (34.7%) are nonfamily households. The most numerous type of family households are 2-person households, comprising 15, and the most common type of nonfamily households are 1-person households, comprising 26.
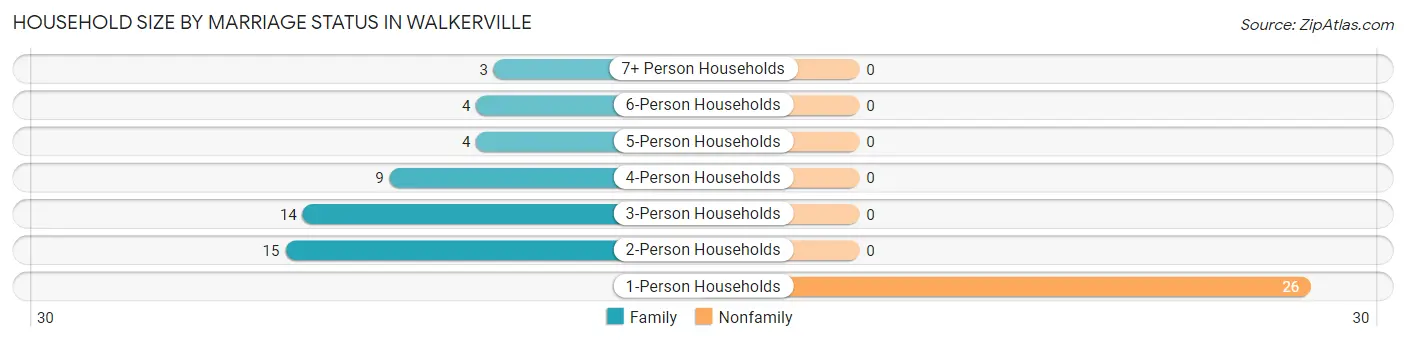
| Household Size | Family Households | Nonfamily Households |
| 1-Person Households | - | 26 (34.7%) |
| 2-Person Households | 15 (20.0%) | 0 (0.0%) |
| 3-Person Households | 14 (18.7%) | 0 (0.0%) |
| 4-Person Households | 9 (12.0%) | 0 (0.0%) |
| 5-Person Households | 4 (5.3%) | 0 (0.0%) |
| 6-Person Households | 4 (5.3%) | 0 (0.0%) |
| 7+ Person Households | 3 (4.0%) | 0 (0.0%) |
| Total | 49 (65.3%) | 26 (34.7%) |
Female Fertility in Walkerville
Fertility by Age in Walkerville
Average fertility rate in Walkerville is 24.0 births per 1,000 women. Women in the age bracket of 20 to 34 years have the highest fertility rate with 71.0 births per 1,000 women. Women in the age bracket of 20 to 34 years acount for 100.0% of all women with births.
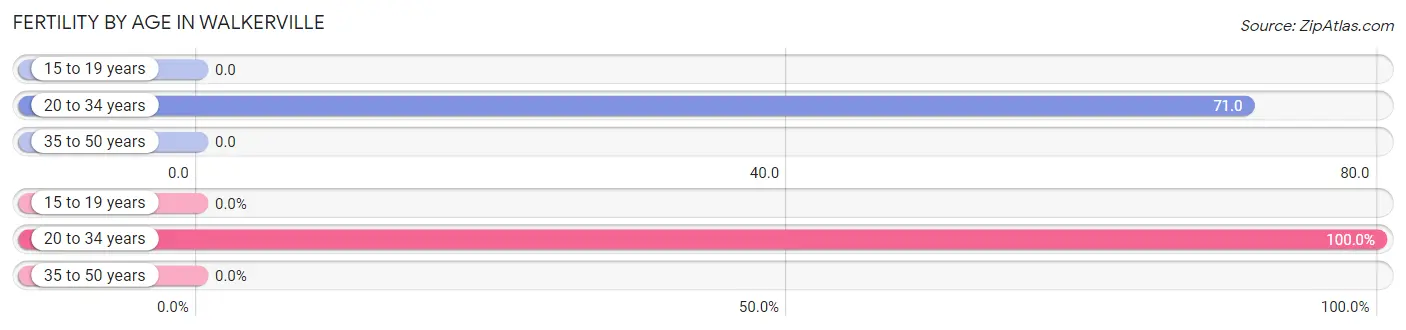
| Age Bracket | Women with Births | Births / 1,000 Women |
| 15 to 19 years | 0 (0.0%) | 0.0 |
| 20 to 34 years | 1 (100.0%) | 71.0 |
| 35 to 50 years | 0 (0.0%) | 0.0 |
| Total | 1 (100.0%) | 24.0 |
Fertility by Age by Marriage Status in Walkerville
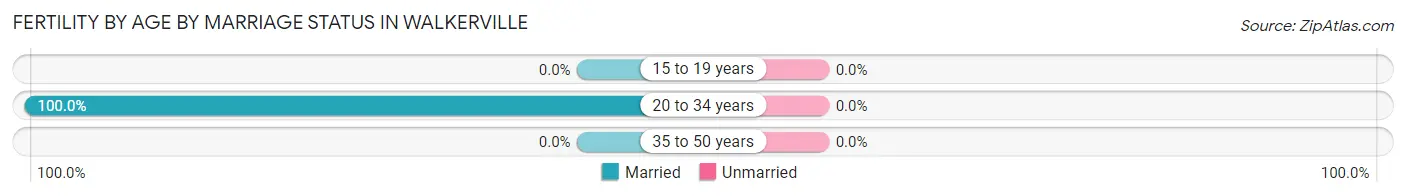
| Age Bracket | Married | Unmarried |
| 15 to 19 years | 0 (0.0%) | 0 (0.0%) |
| 20 to 34 years | 1 (100.0%) | 0 (0.0%) |
| 35 to 50 years | 0 (0.0%) | 0 (0.0%) |
| Total | 1 (100.0%) | 0 (0.0%) |
Fertility by Education in Walkerville
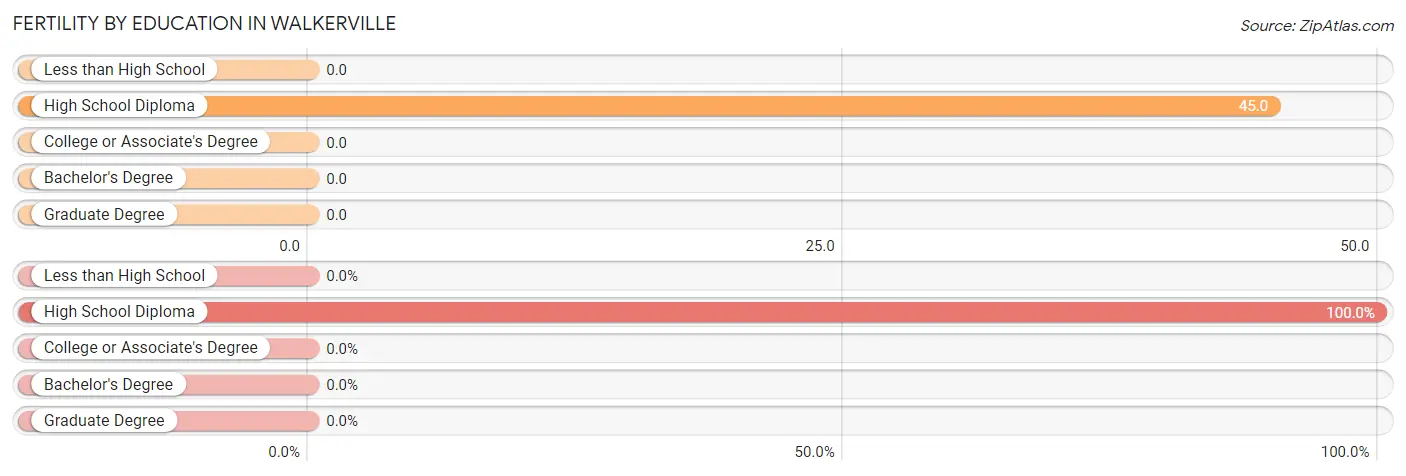
| Educational Attainment | Women with Births | Births / 1,000 Women |
| Less than High School | 0 (0.0%) | 0.0 |
| High School Diploma | 1 (100.0%) | 45.0 |
| College or Associate's Degree | 0 (0.0%) | 0.0 |
| Bachelor's Degree | 0 (0.0%) | 0.0 |
| Graduate Degree | 0 (0.0%) | 0.0 |
| Total | 1 (100.0%) | 24.0 |
Fertility by Education by Marriage Status in Walkerville
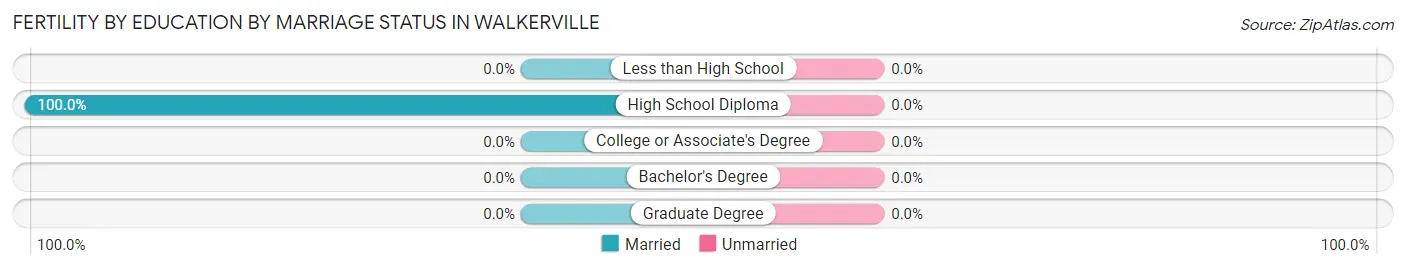
| Educational Attainment | Married | Unmarried |
| Less than High School | 0 (0.0%) | 0 (0.0%) |
| High School Diploma | 1 (100.0%) | 0 (0.0%) |
| College or Associate's Degree | 0 (0.0%) | 0 (0.0%) |
| Bachelor's Degree | 0 (0.0%) | 0 (0.0%) |
| Graduate Degree | 0 (0.0%) | 0 (0.0%) |
| Total | 1 (100.0%) | 0 (0.0%) |
Employment Characteristics in Walkerville
Employment by Class of Employer in Walkerville
Among the 75 employed individuals in Walkerville, private company employees (57 | 76.0%), local government employees (13 | 17.3%), and self-employed (incorporated) (3 | 4.0%) make up the most common classes of employment.
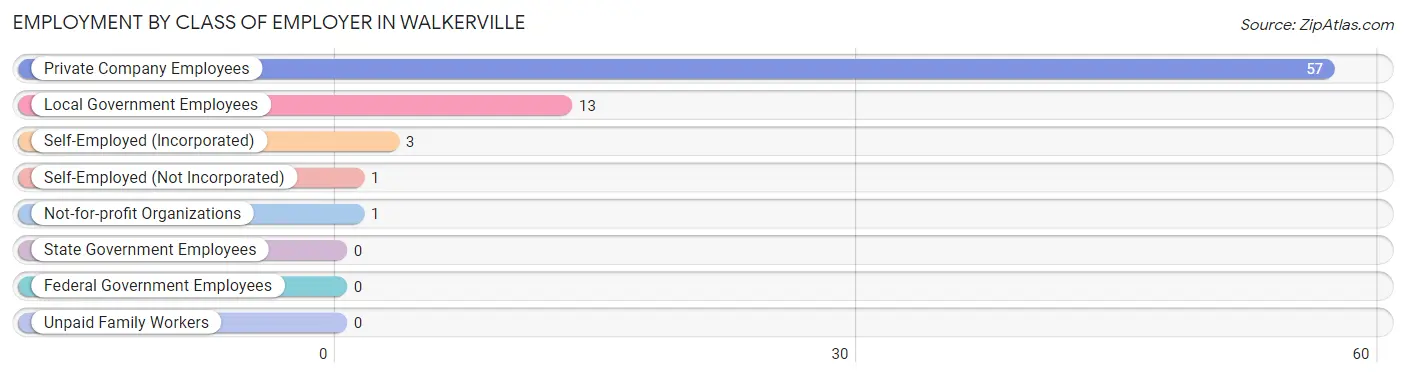
| Employer Class | # Employees | % Employees |
| Private Company Employees | 57 | 76.0% |
| Self-Employed (Incorporated) | 3 | 4.0% |
| Self-Employed (Not Incorporated) | 1 | 1.3% |
| Not-for-profit Organizations | 1 | 1.3% |
| Local Government Employees | 13 | 17.3% |
| State Government Employees | 0 | 0.0% |
| Federal Government Employees | 0 | 0.0% |
| Unpaid Family Workers | 0 | 0.0% |
| Total | 75 | 100.0% |
Employment Status by Age in Walkerville
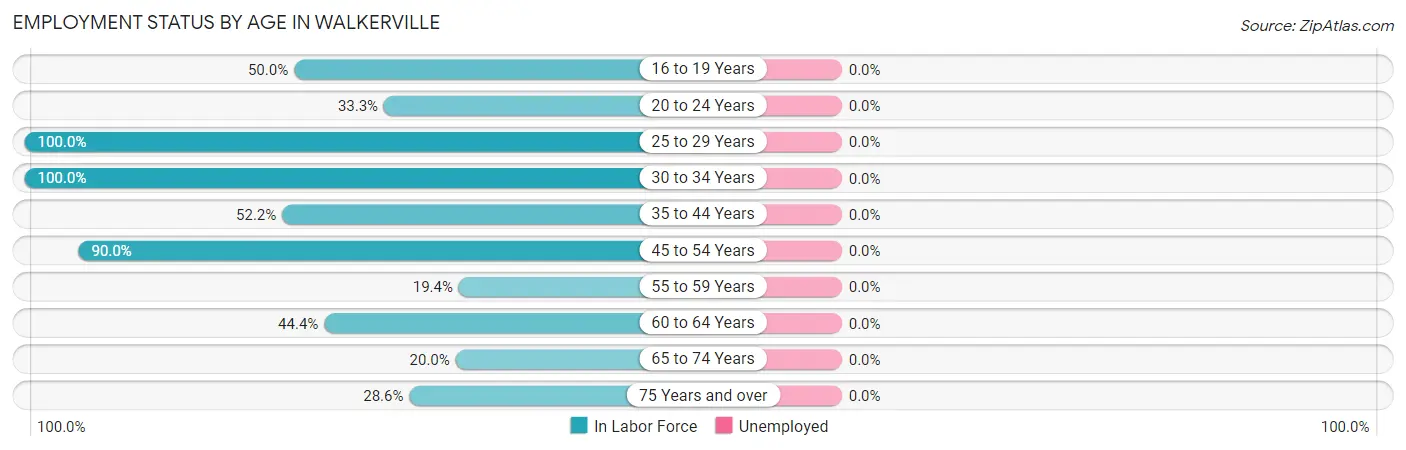
| Age Bracket | In Labor Force | Unemployed |
| 16 to 19 Years | 3 (50.0%) | 0 (0.0%) |
| 20 to 24 Years | 3 (33.3%) | 0 (0.0%) |
| 25 to 29 Years | 11 (100.0%) | 0 (0.0%) |
| 30 to 34 Years | 5 (100.0%) | 0 (0.0%) |
| 35 to 44 Years | 12 (52.2%) | 0 (0.0%) |
| 45 to 54 Years | 27 (90.0%) | 0 (0.0%) |
| 55 to 59 Years | 6 (19.4%) | 0 (0.0%) |
| 60 to 64 Years | 4 (44.4%) | 0 (0.0%) |
| 65 to 74 Years | 2 (20.0%) | 0 (0.0%) |
| 75 Years and over | 2 (28.6%) | 0 (0.0%) |
| Total | 75 (53.2%) | 0 (0.0%) |
Employment Status by Educational Attainment in Walkerville
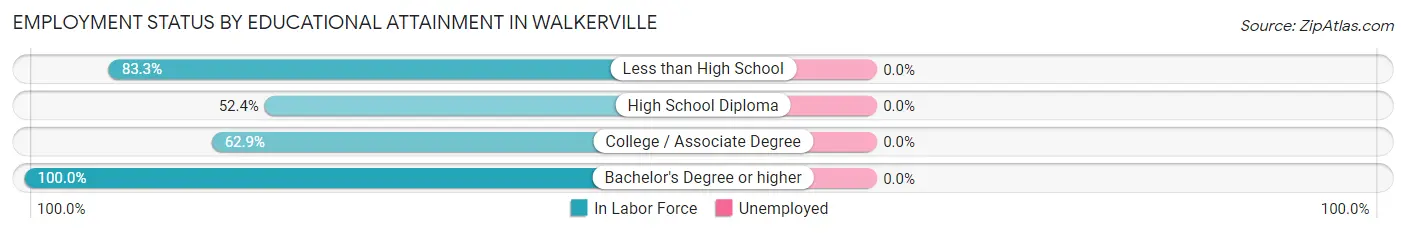
| Educational Attainment | In Labor Force | Unemployed |
| Less than High School | 5 (83.3%) | 0 (0.0%) |
| High School Diploma | 33 (52.4%) | 0 (0.0%) |
| College / Associate Degree | 22 (62.9%) | 0 (0.0%) |
| Bachelor's Degree or higher | 5 (100.0%) | 0 (0.0%) |
| Total | 65 (59.6%) | 0 (0.0%) |
Employment Occupations by Sex in Walkerville
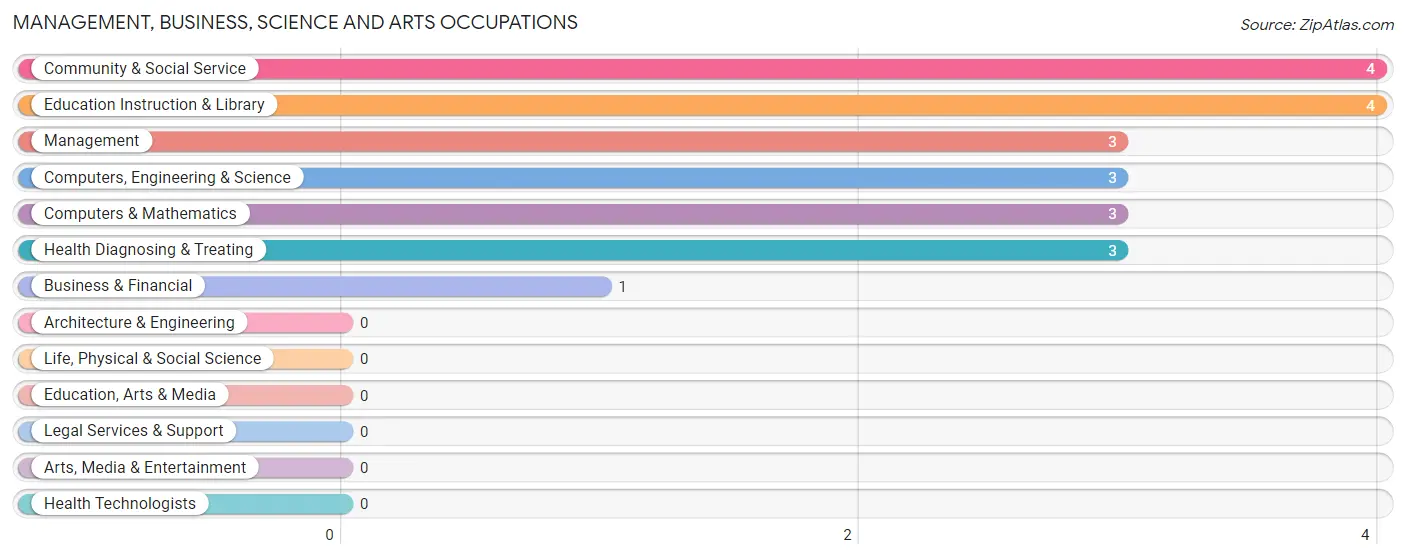
Management, Business, Science and Arts Occupations
The most common Management, Business, Science and Arts occupations in Walkerville are Community & Social Service (4 | 5.3%), Education Instruction & Library (4 | 5.3%), Management (3 | 4.0%), Computers, Engineering & Science (3 | 4.0%), and Computers & Mathematics (3 | 4.0%).
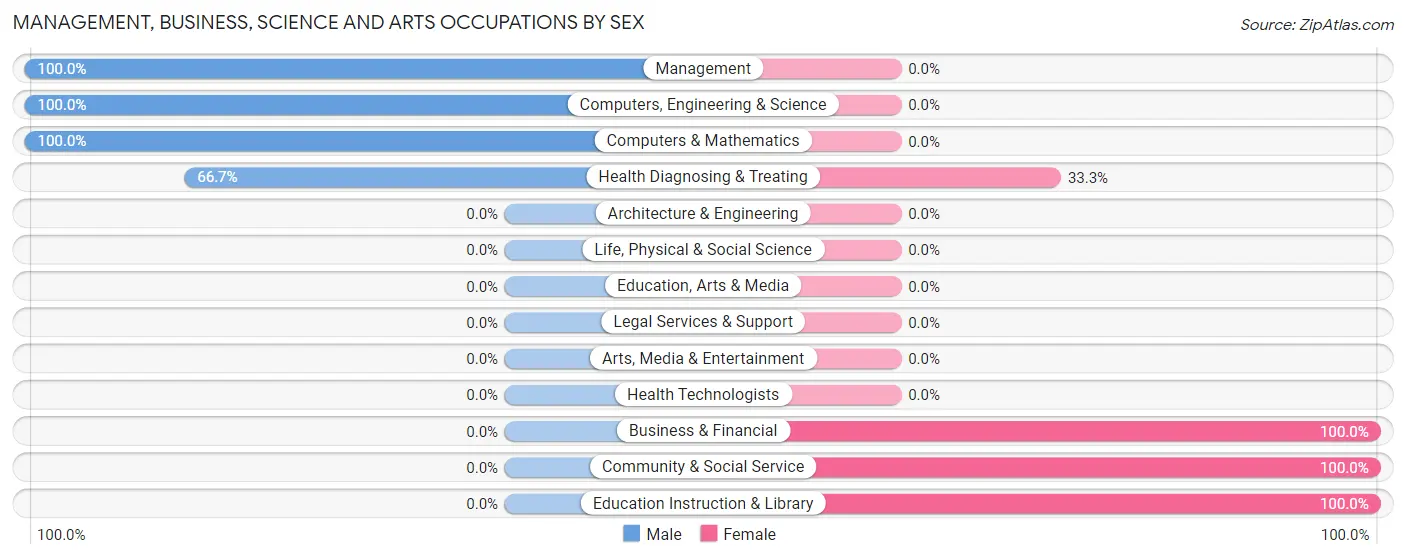
Management, Business, Science and Arts Occupations by Sex
Within the Management, Business, Science and Arts occupations in Walkerville, the most male-oriented occupations are Management (100.0%), Computers, Engineering & Science (100.0%), and Computers & Mathematics (100.0%), while the most female-oriented occupations are Business & Financial (100.0%), Community & Social Service (100.0%), and Education Instruction & Library (100.0%).
| Occupation | Male | Female |
| Management | 3 (100.0%) | 0 (0.0%) |
| Business & Financial | 0 (0.0%) | 1 (100.0%) |
| Computers, Engineering & Science | 3 (100.0%) | 0 (0.0%) |
| Computers & Mathematics | 3 (100.0%) | 0 (0.0%) |
| Architecture & Engineering | 0 (0.0%) | 0 (0.0%) |
| Life, Physical & Social Science | 0 (0.0%) | 0 (0.0%) |
| Community & Social Service | 0 (0.0%) | 4 (100.0%) |
| Education, Arts & Media | 0 (0.0%) | 0 (0.0%) |
| Legal Services & Support | 0 (0.0%) | 0 (0.0%) |
| Education Instruction & Library | 0 (0.0%) | 4 (100.0%) |
| Arts, Media & Entertainment | 0 (0.0%) | 0 (0.0%) |
| Health Diagnosing & Treating | 2 (66.7%) | 1 (33.3%) |
| Health Technologists | 0 (0.0%) | 0 (0.0%) |
| Total (Category) | 8 (57.1%) | 6 (42.9%) |
| Total (Overall) | 31 (41.3%) | 44 (58.7%) |
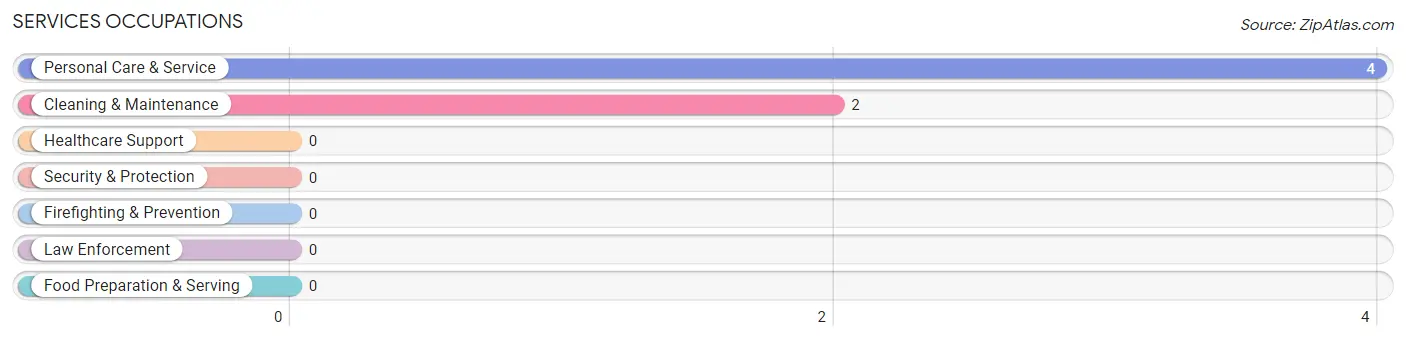
Services Occupations
The most common Services occupations in Walkerville are Personal Care & Service (4 | 5.3%), and Cleaning & Maintenance (2 | 2.7%).
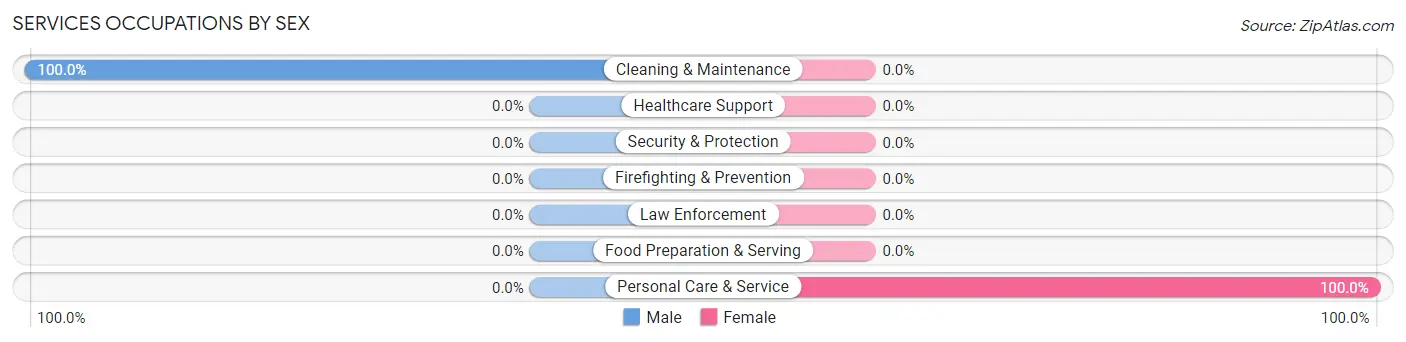
Services Occupations by Sex
| Occupation | Male | Female |
| Healthcare Support | 0 (0.0%) | 0 (0.0%) |
| Security & Protection | 0 (0.0%) | 0 (0.0%) |
| Firefighting & Prevention | 0 (0.0%) | 0 (0.0%) |
| Law Enforcement | 0 (0.0%) | 0 (0.0%) |
| Food Preparation & Serving | 0 (0.0%) | 0 (0.0%) |
| Cleaning & Maintenance | 2 (100.0%) | 0 (0.0%) |
| Personal Care & Service | 0 (0.0%) | 4 (100.0%) |
| Total (Category) | 2 (33.3%) | 4 (66.7%) |
| Total (Overall) | 31 (41.3%) | 44 (58.7%) |
Sales and Office Occupations
The most common Sales and Office occupations in Walkerville are Sales & Related (17 | 22.7%), and Office & Administration (7 | 9.3%).
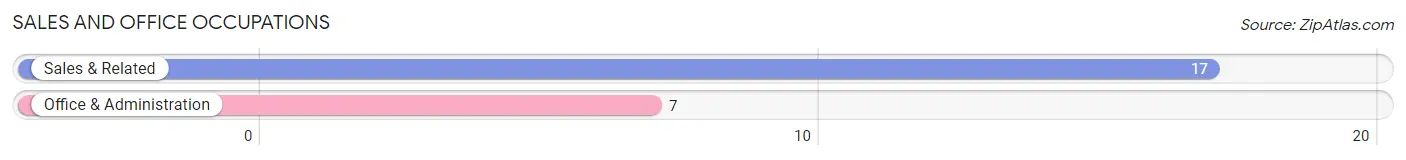
Sales and Office Occupations by Sex

| Occupation | Male | Female |
| Sales & Related | 0 (0.0%) | 17 (100.0%) |
| Office & Administration | 0 (0.0%) | 7 (100.0%) |
| Total (Category) | 0 (0.0%) | 24 (100.0%) |
| Total (Overall) | 31 (41.3%) | 44 (58.7%) |
Natural Resources, Construction and Maintenance Occupations
The most common Natural Resources, Construction and Maintenance occupations in Walkerville are Construction & Extraction (6 | 8.0%), and Farming, Fishing & Forestry (3 | 4.0%).
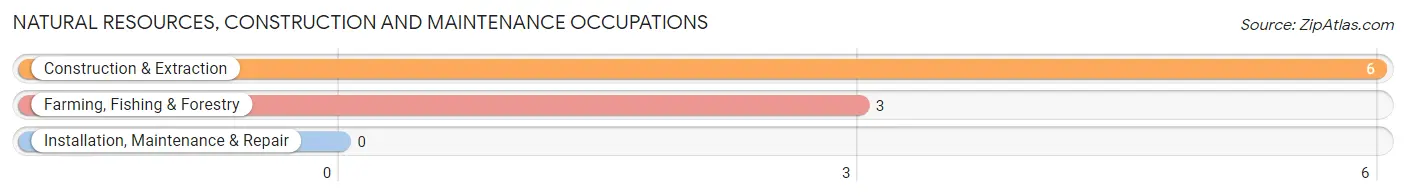
Natural Resources, Construction and Maintenance Occupations by Sex
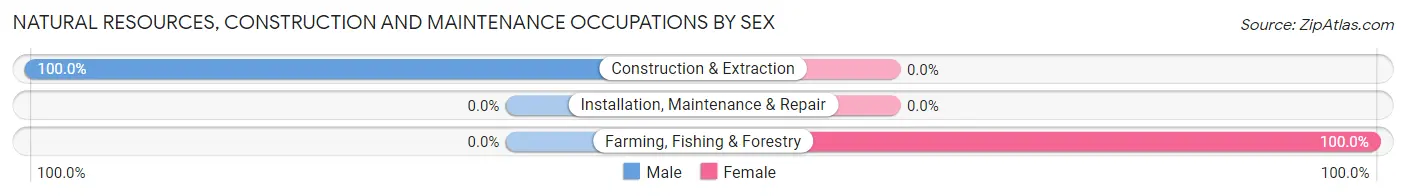
| Occupation | Male | Female |
| Farming, Fishing & Forestry | 0 (0.0%) | 3 (100.0%) |
| Construction & Extraction | 6 (100.0%) | 0 (0.0%) |
| Installation, Maintenance & Repair | 0 (0.0%) | 0 (0.0%) |
| Total (Category) | 6 (66.7%) | 3 (33.3%) |
| Total (Overall) | 31 (41.3%) | 44 (58.7%) |
Production, Transportation and Moving Occupations
The most common Production, Transportation and Moving occupations in Walkerville are Production (12 | 16.0%), and Material Moving (10 | 13.3%).
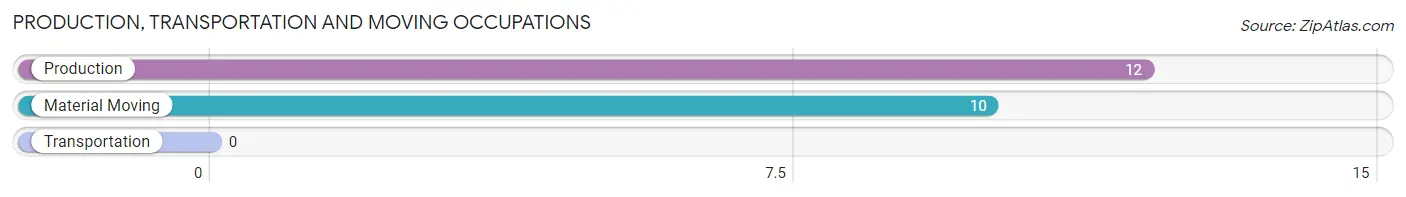
Production, Transportation and Moving Occupations by Sex
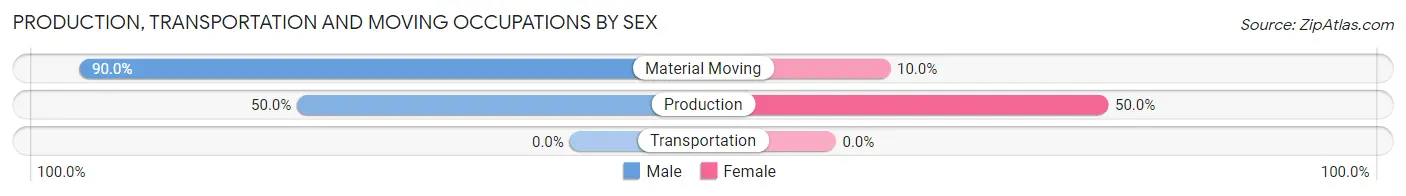
| Occupation | Male | Female |
| Production | 6 (50.0%) | 6 (50.0%) |
| Transportation | 0 (0.0%) | 0 (0.0%) |
| Material Moving | 9 (90.0%) | 1 (10.0%) |
| Total (Category) | 15 (68.2%) | 7 (31.8%) |
| Total (Overall) | 31 (41.3%) | 44 (58.7%) |
Employment Industries by Sex in Walkerville
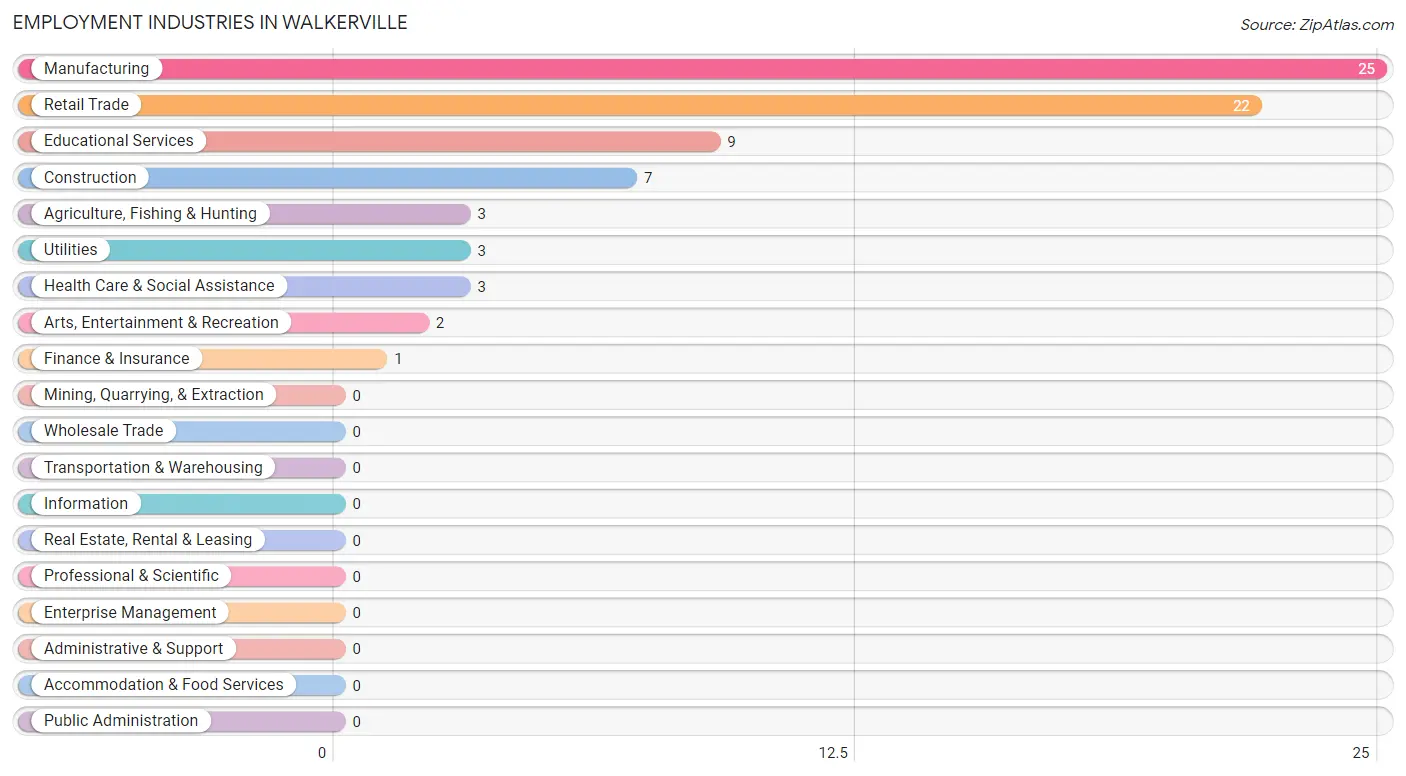
Employment Industries in Walkerville
The major employment industries in Walkerville include Manufacturing (25 | 33.3%), Retail Trade (22 | 29.3%), Educational Services (9 | 12.0%), Construction (7 | 9.3%), and Agriculture, Fishing & Hunting (3 | 4.0%).
Employment Industries by Sex in Walkerville
The Walkerville industries that see more men than women are Utilities (100.0%), Finance & Insurance (100.0%), and Arts, Entertainment & Recreation (100.0%), whereas the industries that tend to have a higher number of women are Agriculture, Fishing & Hunting (100.0%), Retail Trade (100.0%), and Educational Services (100.0%).
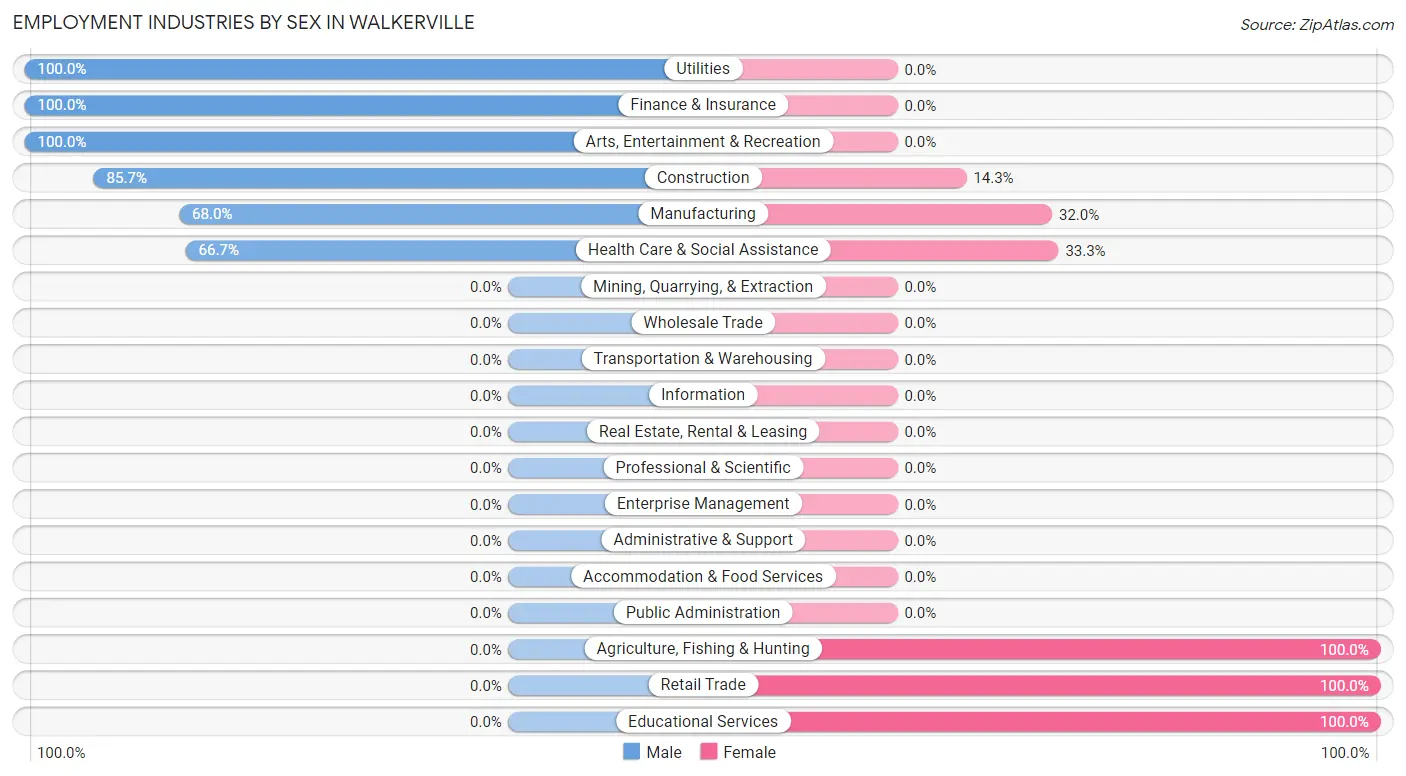
| Industry | Male | Female |
| Agriculture, Fishing & Hunting | 0 (0.0%) | 3 (100.0%) |
| Mining, Quarrying, & Extraction | 0 (0.0%) | 0 (0.0%) |
| Construction | 6 (85.7%) | 1 (14.3%) |
| Manufacturing | 17 (68.0%) | 8 (32.0%) |
| Wholesale Trade | 0 (0.0%) | 0 (0.0%) |
| Retail Trade | 0 (0.0%) | 22 (100.0%) |
| Transportation & Warehousing | 0 (0.0%) | 0 (0.0%) |
| Utilities | 3 (100.0%) | 0 (0.0%) |
| Information | 0 (0.0%) | 0 (0.0%) |
| Finance & Insurance | 1 (100.0%) | 0 (0.0%) |
| Real Estate, Rental & Leasing | 0 (0.0%) | 0 (0.0%) |
| Professional & Scientific | 0 (0.0%) | 0 (0.0%) |
| Enterprise Management | 0 (0.0%) | 0 (0.0%) |
| Administrative & Support | 0 (0.0%) | 0 (0.0%) |
| Educational Services | 0 (0.0%) | 9 (100.0%) |
| Health Care & Social Assistance | 2 (66.7%) | 1 (33.3%) |
| Arts, Entertainment & Recreation | 2 (100.0%) | 0 (0.0%) |
| Accommodation & Food Services | 0 (0.0%) | 0 (0.0%) |
| Public Administration | 0 (0.0%) | 0 (0.0%) |
| Total | 31 (41.3%) | 44 (58.7%) |
Education in Walkerville
School Enrollment in Walkerville
The most common levels of schooling among the 58 students in Walkerville are elementary school (32 | 55.2%), middle school (7 | 12.1%), and kindergarten (6 | 10.3%).
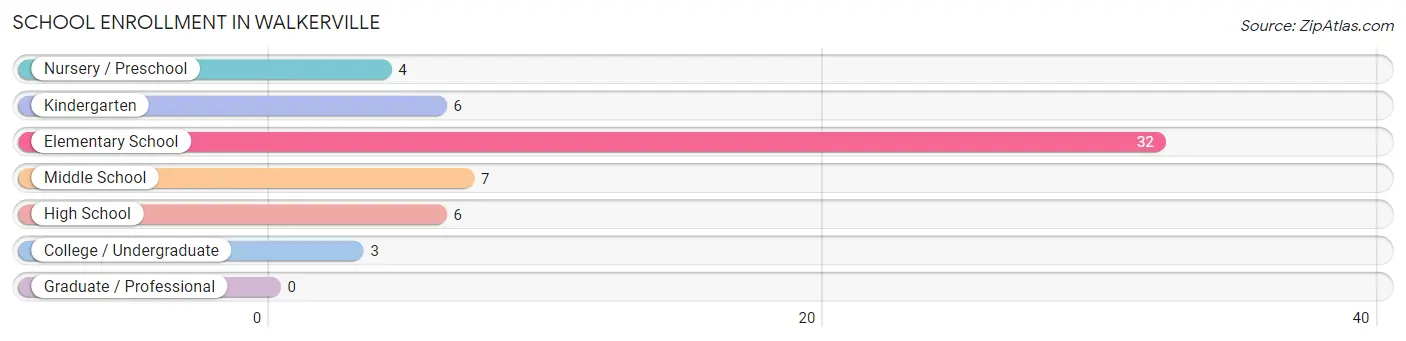
| School Level | # Students | % Students |
| Nursery / Preschool | 4 | 6.9% |
| Kindergarten | 6 | 10.3% |
| Elementary School | 32 | 55.2% |
| Middle School | 7 | 12.1% |
| High School | 6 | 10.3% |
| College / Undergraduate | 3 | 5.2% |
| Graduate / Professional | 0 | 0.0% |
| Total | 58 | 100.0% |
School Enrollment by Age by Funding Source in Walkerville
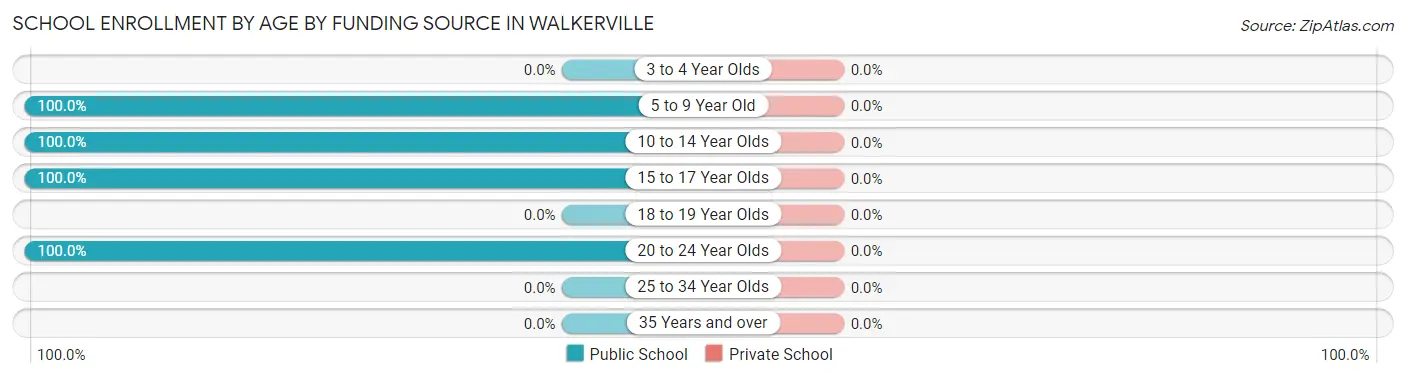
| Age Bracket | Public School | Private School |
| 3 to 4 Year Olds | 0 (0.0%) | 0 (0.0%) |
| 5 to 9 Year Old | 31 (100.0%) | 0 (0.0%) |
| 10 to 14 Year Olds | 18 (100.0%) | 0 (0.0%) |
| 15 to 17 Year Olds | 6 (100.0%) | 0 (0.0%) |
| 18 to 19 Year Olds | 0 (0.0%) | 0 (0.0%) |
| 20 to 24 Year Olds | 3 (100.0%) | 0 (0.0%) |
| 25 to 34 Year Olds | 0 (0.0%) | 0 (0.0%) |
| 35 Years and over | 0 (0.0%) | 0 (0.0%) |
| Total | 58 (100.0%) | 0 (0.0%) |
Educational Attainment by Field of Study in Walkerville
Physical & health sciences (2 | 40.0%), business (2 | 40.0%), and education (1 | 20.0%) are the most common fields of study among 5 individuals in Walkerville who have obtained a bachelor's degree or higher.
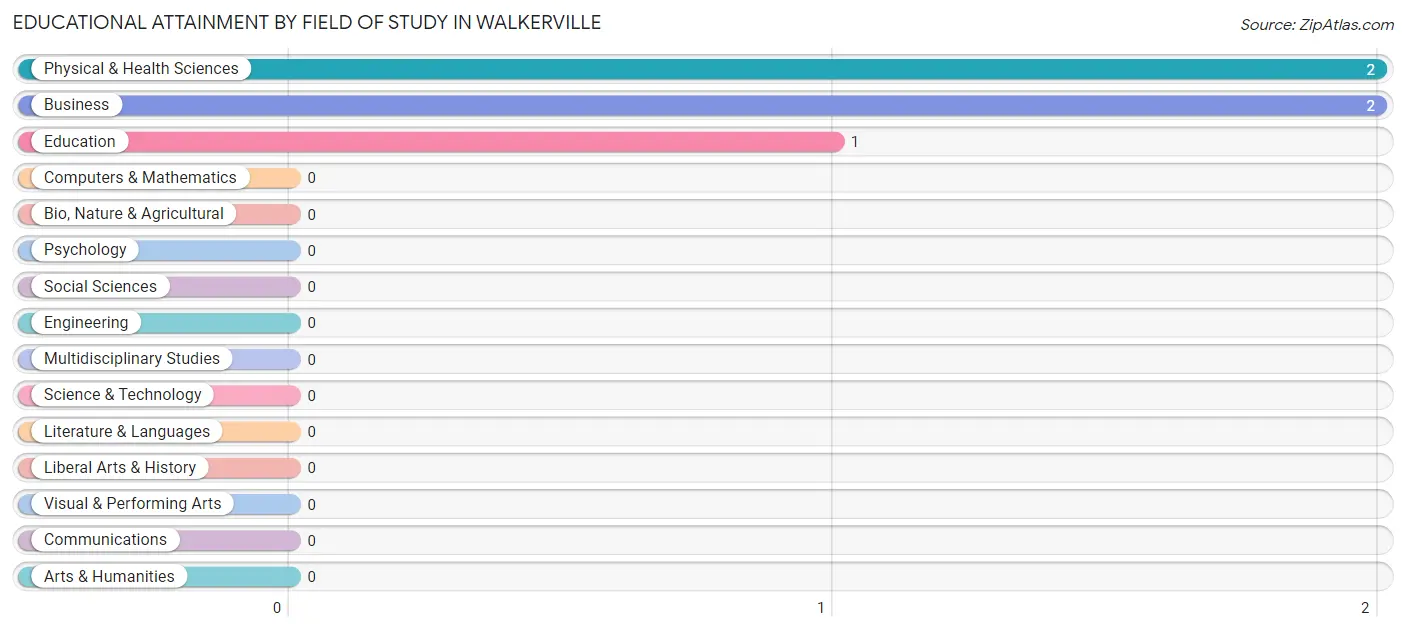
| Field of Study | # Graduates | % Graduates |
| Computers & Mathematics | 0 | 0.0% |
| Bio, Nature & Agricultural | 0 | 0.0% |
| Physical & Health Sciences | 2 | 40.0% |
| Psychology | 0 | 0.0% |
| Social Sciences | 0 | 0.0% |
| Engineering | 0 | 0.0% |
| Multidisciplinary Studies | 0 | 0.0% |
| Science & Technology | 0 | 0.0% |
| Business | 2 | 40.0% |
| Education | 1 | 20.0% |
| Literature & Languages | 0 | 0.0% |
| Liberal Arts & History | 0 | 0.0% |
| Visual & Performing Arts | 0 | 0.0% |
| Communications | 0 | 0.0% |
| Arts & Humanities | 0 | 0.0% |
| Total | 5 | 100.0% |
Transportation & Commute in Walkerville
Vehicle Availability by Sex in Walkerville
The most prevalent vehicle ownership categories in Walkerville are males with 2 vehicles (10, accounting for 32.3%) and females with 2 vehicles (17, making up 22.7%).
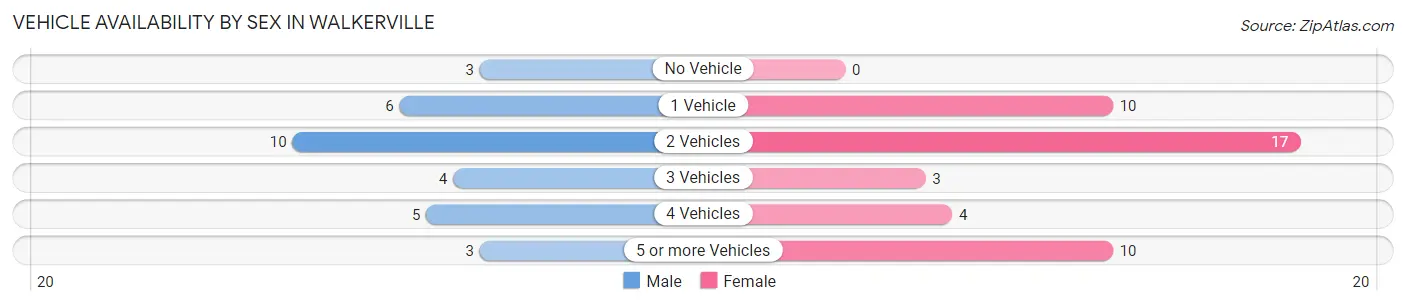
| Vehicles Available | Male | Female |
| No Vehicle | 3 (9.7%) | 0 (0.0%) |
| 1 Vehicle | 6 (19.4%) | 10 (22.7%) |
| 2 Vehicles | 10 (32.3%) | 17 (38.6%) |
| 3 Vehicles | 4 (12.9%) | 3 (6.8%) |
| 4 Vehicles | 5 (16.1%) | 4 (9.1%) |
| 5 or more Vehicles | 3 (9.7%) | 10 (22.7%) |
| Total | 31 (100.0%) | 44 (100.0%) |
Commute Time in Walkerville
The most frequently occuring commute durations in Walkerville are 5 to 9 minutes (21 commuters, 28.0%), 20 to 24 minutes (13 commuters, 17.3%), and 10 to 14 minutes (6 commuters, 8.0%).
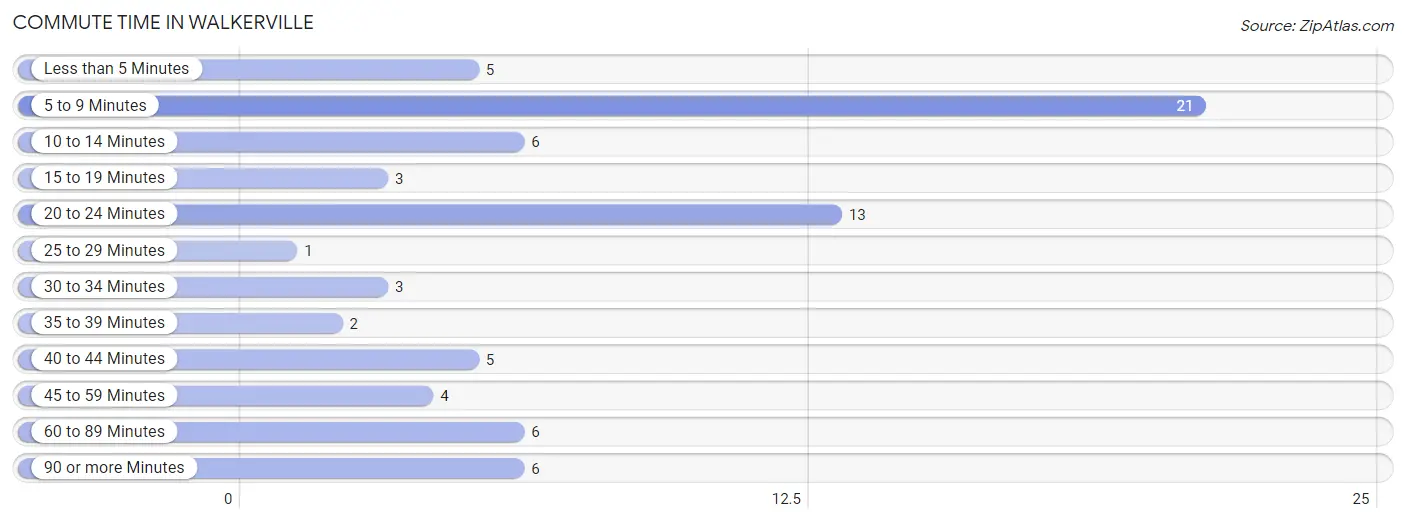
| Commute Time | # Commuters | % Commuters |
| Less than 5 Minutes | 5 | 6.7% |
| 5 to 9 Minutes | 21 | 28.0% |
| 10 to 14 Minutes | 6 | 8.0% |
| 15 to 19 Minutes | 3 | 4.0% |
| 20 to 24 Minutes | 13 | 17.3% |
| 25 to 29 Minutes | 1 | 1.3% |
| 30 to 34 Minutes | 3 | 4.0% |
| 35 to 39 Minutes | 2 | 2.7% |
| 40 to 44 Minutes | 5 | 6.7% |
| 45 to 59 Minutes | 4 | 5.3% |
| 60 to 89 Minutes | 6 | 8.0% |
| 90 or more Minutes | 6 | 8.0% |
Commute Time by Sex in Walkerville
The most common commute times in Walkerville are 60 to 89 minutes (6 commuters, 19.4%) for males and 5 to 9 minutes (17 commuters, 38.6%) for females.
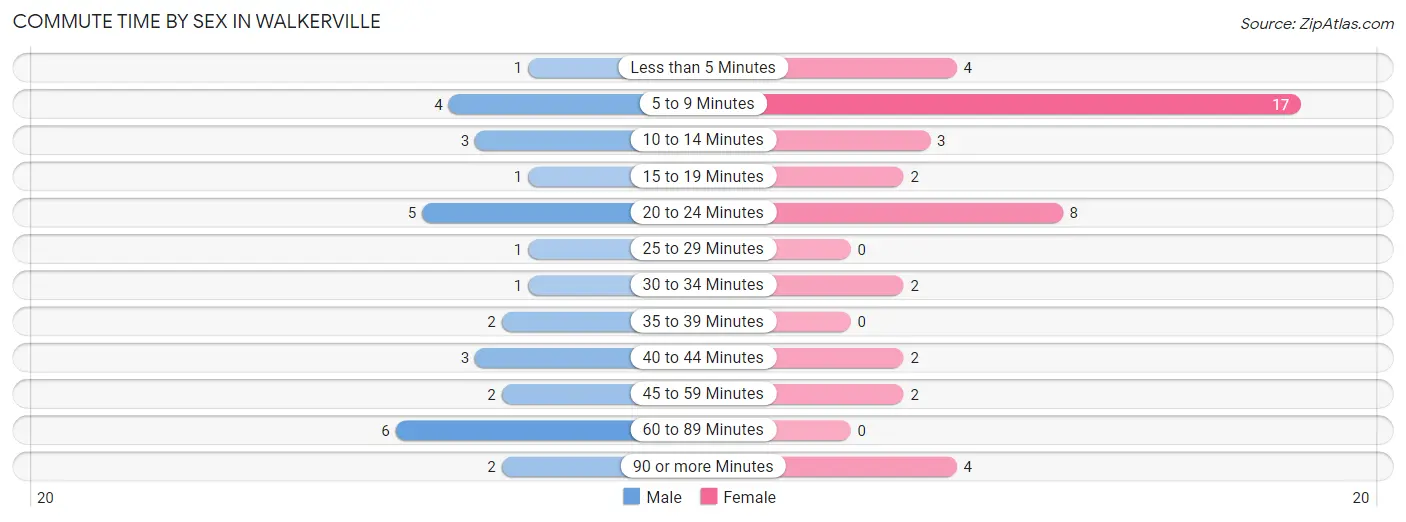
| Commute Time | Male | Female |
| Less than 5 Minutes | 1 (3.2%) | 4 (9.1%) |
| 5 to 9 Minutes | 4 (12.9%) | 17 (38.6%) |
| 10 to 14 Minutes | 3 (9.7%) | 3 (6.8%) |
| 15 to 19 Minutes | 1 (3.2%) | 2 (4.5%) |
| 20 to 24 Minutes | 5 (16.1%) | 8 (18.2%) |
| 25 to 29 Minutes | 1 (3.2%) | 0 (0.0%) |
| 30 to 34 Minutes | 1 (3.2%) | 2 (4.5%) |
| 35 to 39 Minutes | 2 (6.5%) | 0 (0.0%) |
| 40 to 44 Minutes | 3 (9.7%) | 2 (4.5%) |
| 45 to 59 Minutes | 2 (6.5%) | 2 (4.5%) |
| 60 to 89 Minutes | 6 (19.4%) | 0 (0.0%) |
| 90 or more Minutes | 2 (6.5%) | 4 (9.1%) |
Time of Departure to Work by Sex in Walkerville
The most frequent times of departure to work in Walkerville are 12:00 AM to 4:59 AM (9, 29.0%) for males and 6:00 AM to 6:29 AM (12, 27.3%) for females.
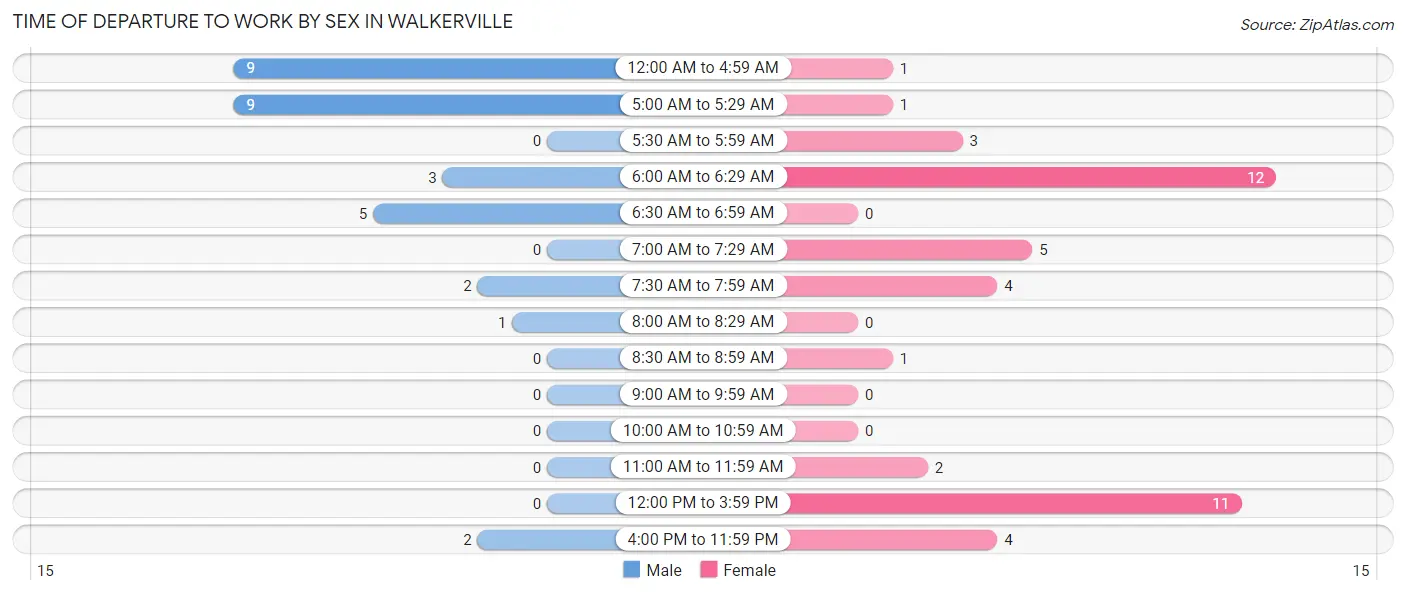
| Time of Departure | Male | Female |
| 12:00 AM to 4:59 AM | 9 (29.0%) | 1 (2.3%) |
| 5:00 AM to 5:29 AM | 9 (29.0%) | 1 (2.3%) |
| 5:30 AM to 5:59 AM | 0 (0.0%) | 3 (6.8%) |
| 6:00 AM to 6:29 AM | 3 (9.7%) | 12 (27.3%) |
| 6:30 AM to 6:59 AM | 5 (16.1%) | 0 (0.0%) |
| 7:00 AM to 7:29 AM | 0 (0.0%) | 5 (11.4%) |
| 7:30 AM to 7:59 AM | 2 (6.5%) | 4 (9.1%) |
| 8:00 AM to 8:29 AM | 1 (3.2%) | 0 (0.0%) |
| 8:30 AM to 8:59 AM | 0 (0.0%) | 1 (2.3%) |
| 9:00 AM to 9:59 AM | 0 (0.0%) | 0 (0.0%) |
| 10:00 AM to 10:59 AM | 0 (0.0%) | 0 (0.0%) |
| 11:00 AM to 11:59 AM | 0 (0.0%) | 2 (4.5%) |
| 12:00 PM to 3:59 PM | 0 (0.0%) | 11 (25.0%) |
| 4:00 PM to 11:59 PM | 2 (6.5%) | 4 (9.1%) |
| Total | 31 (100.0%) | 44 (100.0%) |
Housing Occupancy in Walkerville
Occupancy by Ownership in Walkerville
Of the total 75 dwellings in Walkerville, owner-occupied units account for 74 (98.7%), while renter-occupied units make up 1 (1.3%).
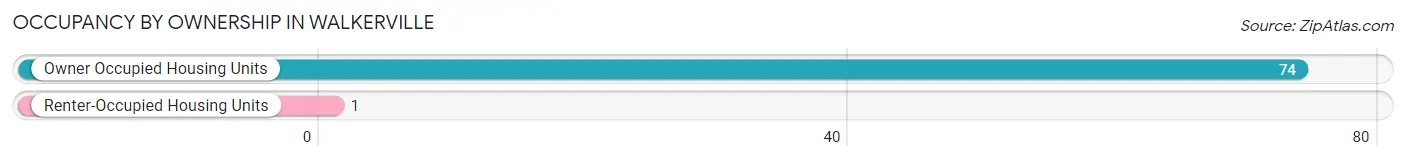
| Occupancy | # Housing Units | % Housing Units |
| Owner Occupied Housing Units | 74 | 98.7% |
| Renter-Occupied Housing Units | 1 | 1.3% |
| Total Occupied Housing Units | 75 | 100.0% |
Occupancy by Household Size in Walkerville
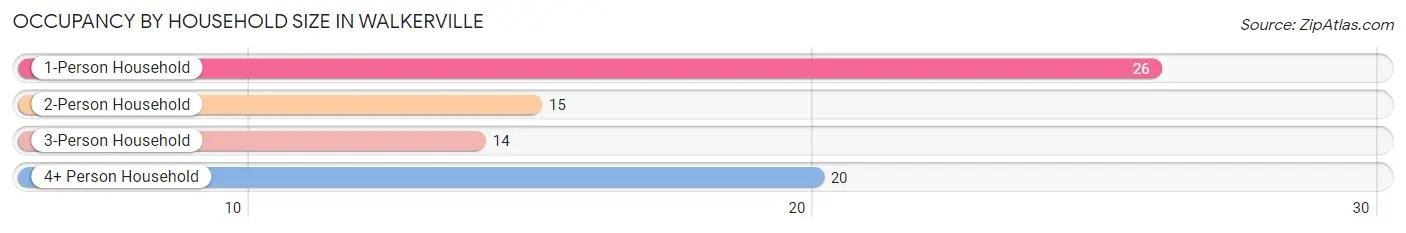
| Household Size | # Housing Units | % Housing Units |
| 1-Person Household | 26 | 34.7% |
| 2-Person Household | 15 | 20.0% |
| 3-Person Household | 14 | 18.7% |
| 4+ Person Household | 20 | 26.7% |
| Total Housing Units | 75 | 100.0% |
Occupancy by Ownership by Household Size in Walkerville
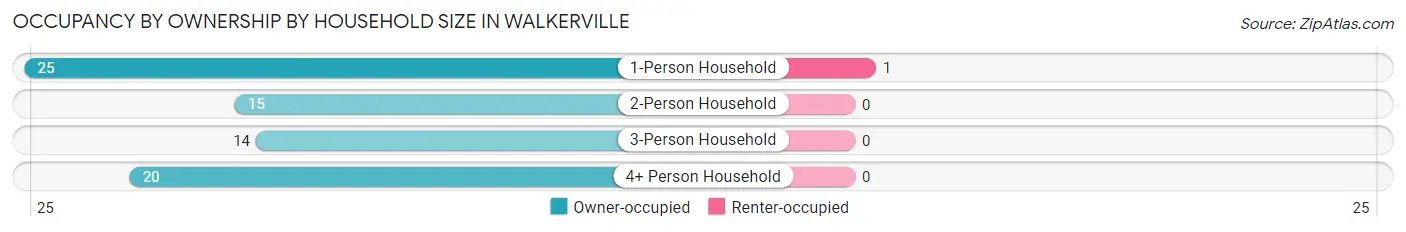
| Household Size | Owner-occupied | Renter-occupied |
| 1-Person Household | 25 (96.2%) | 1 (3.8%) |
| 2-Person Household | 15 (100.0%) | 0 (0.0%) |
| 3-Person Household | 14 (100.0%) | 0 (0.0%) |
| 4+ Person Household | 20 (100.0%) | 0 (0.0%) |
| Total Housing Units | 74 (98.7%) | 1 (1.3%) |
Occupancy by Educational Attainment in Walkerville
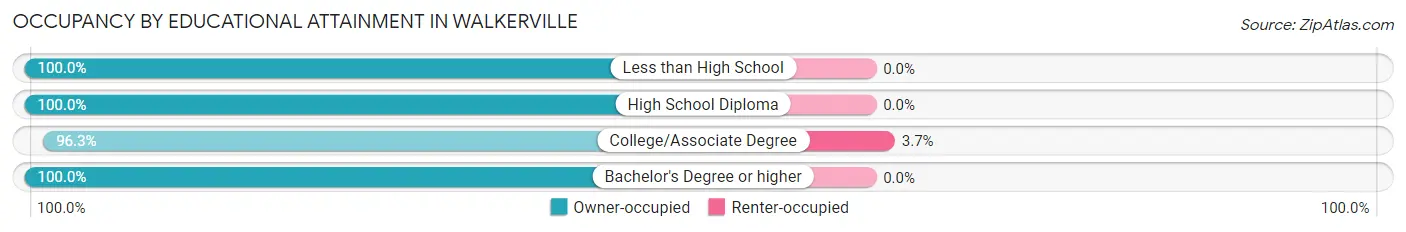
| Household Size | Owner-occupied | Renter-occupied |
| Less than High School | 7 (100.0%) | 0 (0.0%) |
| High School Diploma | 39 (100.0%) | 0 (0.0%) |
| College/Associate Degree | 26 (96.3%) | 1 (3.7%) |
| Bachelor's Degree or higher | 2 (100.0%) | 0 (0.0%) |
Occupancy by Age of Householder in Walkerville
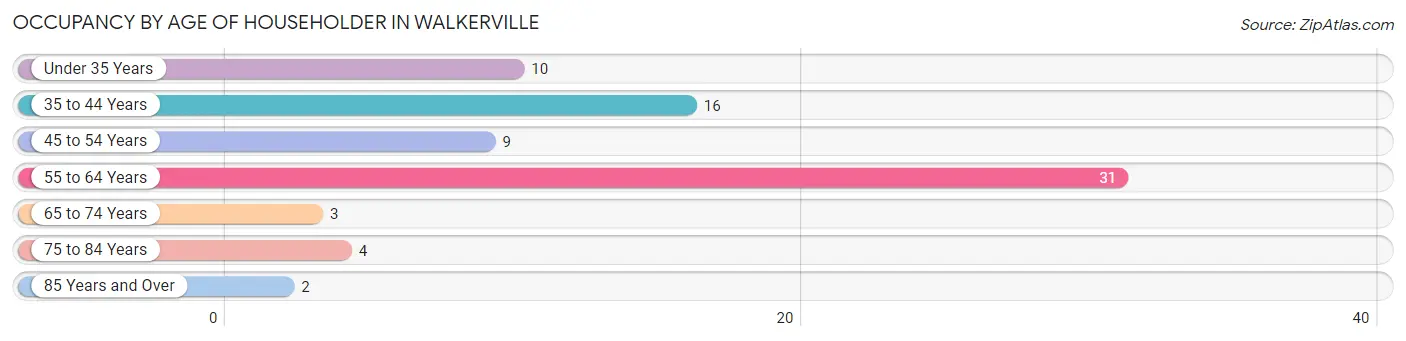
| Age Bracket | # Households | % Households |
| Under 35 Years | 10 | 13.3% |
| 35 to 44 Years | 16 | 21.3% |
| 45 to 54 Years | 9 | 12.0% |
| 55 to 64 Years | 31 | 41.3% |
| 65 to 74 Years | 3 | 4.0% |
| 75 to 84 Years | 4 | 5.3% |
| 85 Years and Over | 2 | 2.7% |
| Total | 75 | 100.0% |
Housing Finances in Walkerville
Median Income by Occupancy in Walkerville
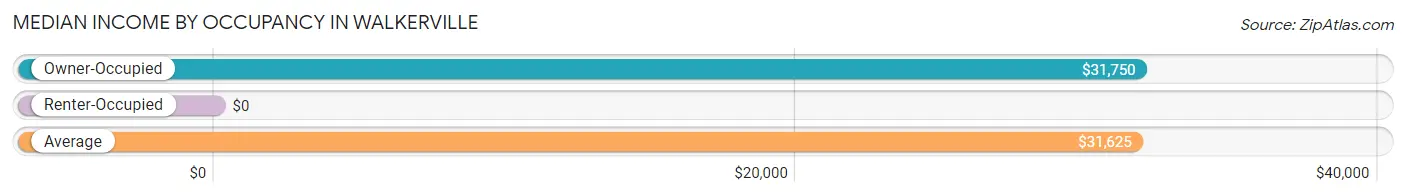
| Occupancy Type | # Households | Median Income |
| Owner-Occupied | 74 (98.7%) | $31,750 |
| Renter-Occupied | 1 (1.3%) | $0 |
| Average | 75 (100.0%) | $31,625 |
Occupancy by Householder Income Bracket in Walkerville
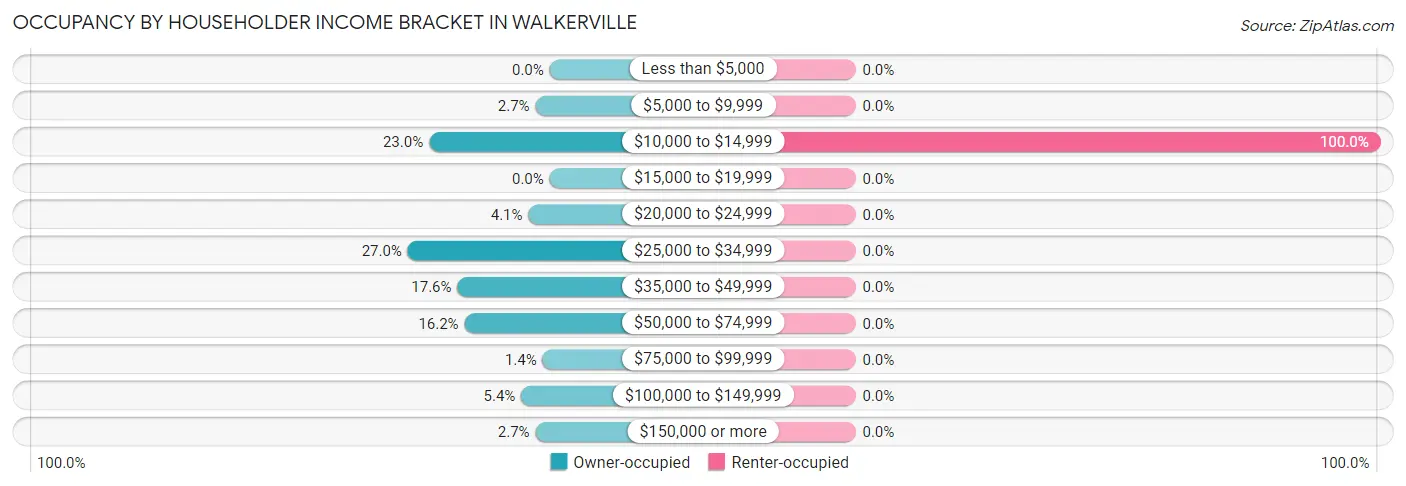
| Income Bracket | Owner-occupied | Renter-occupied |
| Less than $5,000 | 0 (0.0%) | 0 (0.0%) |
| $5,000 to $9,999 | 2 (2.7%) | 0 (0.0%) |
| $10,000 to $14,999 | 17 (23.0%) | 1 (100.0%) |
| $15,000 to $19,999 | 0 (0.0%) | 0 (0.0%) |
| $20,000 to $24,999 | 3 (4.1%) | 0 (0.0%) |
| $25,000 to $34,999 | 20 (27.0%) | 0 (0.0%) |
| $35,000 to $49,999 | 13 (17.6%) | 0 (0.0%) |
| $50,000 to $74,999 | 12 (16.2%) | 0 (0.0%) |
| $75,000 to $99,999 | 1 (1.3%) | 0 (0.0%) |
| $100,000 to $149,999 | 4 (5.4%) | 0 (0.0%) |
| $150,000 or more | 2 (2.7%) | 0 (0.0%) |
| Total | 74 (100.0%) | 1 (100.0%) |
Monthly Housing Cost Tiers in Walkerville
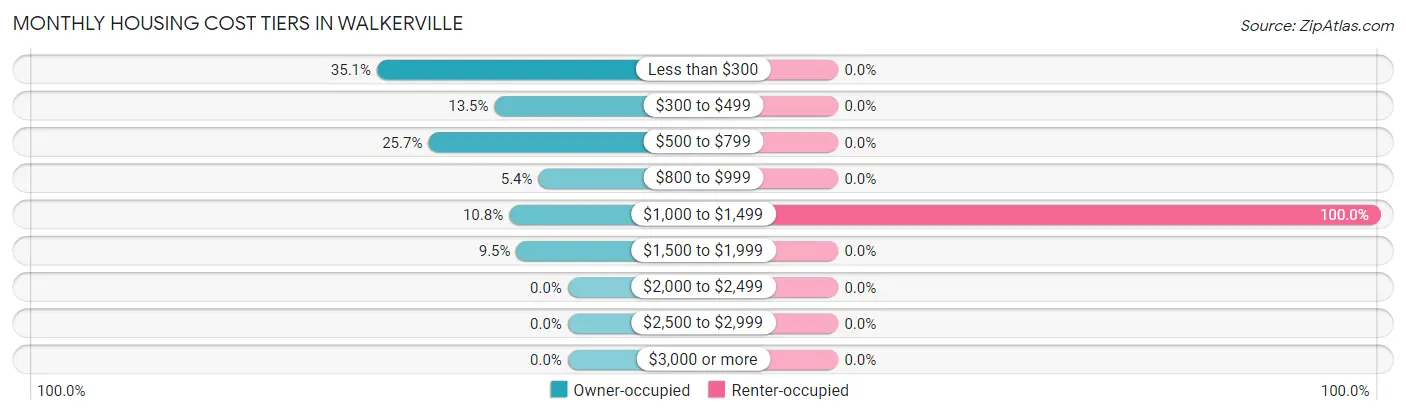
| Monthly Cost | Owner-occupied | Renter-occupied |
| Less than $300 | 26 (35.1%) | 0 (0.0%) |
| $300 to $499 | 10 (13.5%) | 0 (0.0%) |
| $500 to $799 | 19 (25.7%) | 0 (0.0%) |
| $800 to $999 | 4 (5.4%) | 0 (0.0%) |
| $1,000 to $1,499 | 8 (10.8%) | 1 (100.0%) |
| $1,500 to $1,999 | 7 (9.5%) | 0 (0.0%) |
| $2,000 to $2,499 | 0 (0.0%) | 0 (0.0%) |
| $2,500 to $2,999 | 0 (0.0%) | 0 (0.0%) |
| $3,000 or more | 0 (0.0%) | 0 (0.0%) |
| Total | 74 (100.0%) | 1 (100.0%) |
Physical Housing Characteristics in Walkerville
Housing Structures in Walkerville
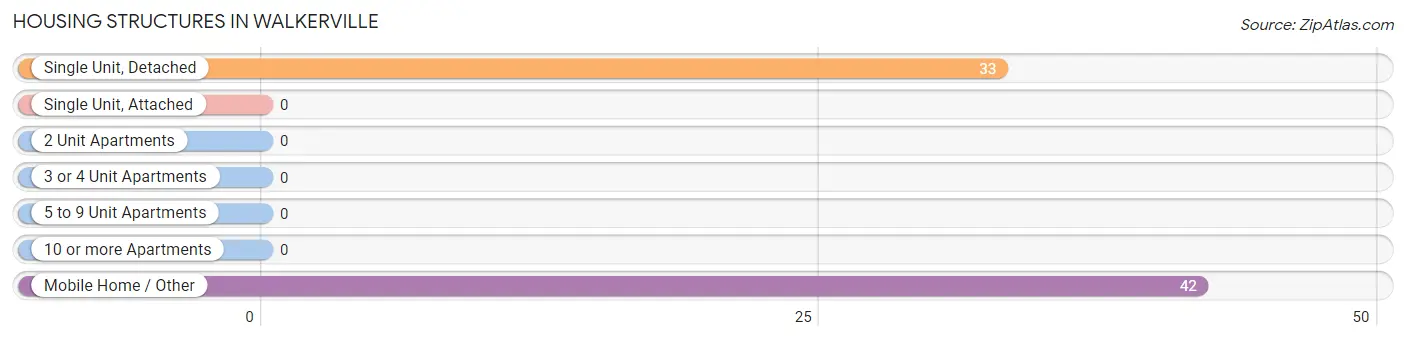
| Structure Type | # Housing Units | % Housing Units |
| Single Unit, Detached | 33 | 44.0% |
| Single Unit, Attached | 0 | 0.0% |
| 2 Unit Apartments | 0 | 0.0% |
| 3 or 4 Unit Apartments | 0 | 0.0% |
| 5 to 9 Unit Apartments | 0 | 0.0% |
| 10 or more Apartments | 0 | 0.0% |
| Mobile Home / Other | 42 | 56.0% |
| Total | 75 | 100.0% |
Housing Structures by Occupancy in Walkerville
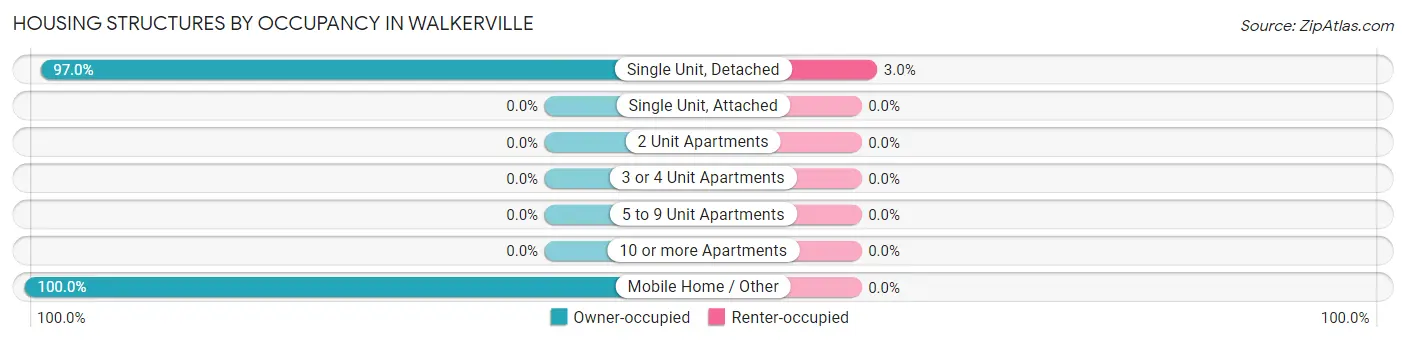
| Structure Type | Owner-occupied | Renter-occupied |
| Single Unit, Detached | 32 (97.0%) | 1 (3.0%) |
| Single Unit, Attached | 0 (0.0%) | 0 (0.0%) |
| 2 Unit Apartments | 0 (0.0%) | 0 (0.0%) |
| 3 or 4 Unit Apartments | 0 (0.0%) | 0 (0.0%) |
| 5 to 9 Unit Apartments | 0 (0.0%) | 0 (0.0%) |
| 10 or more Apartments | 0 (0.0%) | 0 (0.0%) |
| Mobile Home / Other | 42 (100.0%) | 0 (0.0%) |
| Total | 74 (98.7%) | 1 (1.3%) |
Housing Structures by Number of Rooms in Walkerville
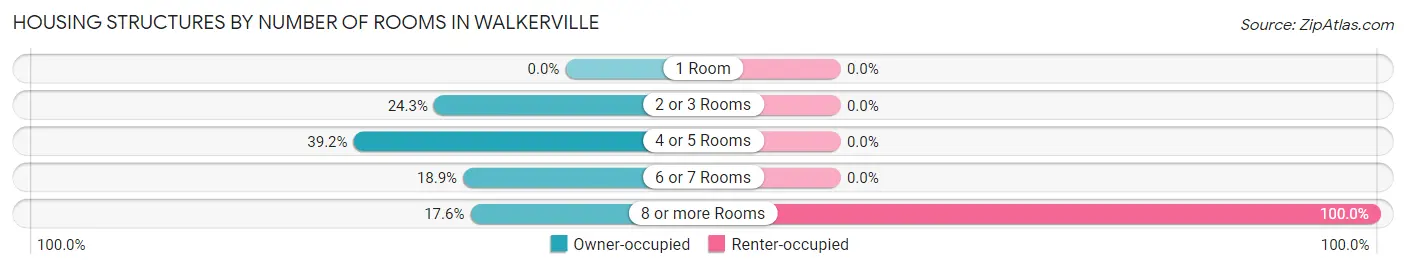
| Number of Rooms | Owner-occupied | Renter-occupied |
| 1 Room | 0 (0.0%) | 0 (0.0%) |
| 2 or 3 Rooms | 18 (24.3%) | 0 (0.0%) |
| 4 or 5 Rooms | 29 (39.2%) | 0 (0.0%) |
| 6 or 7 Rooms | 14 (18.9%) | 0 (0.0%) |
| 8 or more Rooms | 13 (17.6%) | 1 (100.0%) |
| Total | 74 (100.0%) | 1 (100.0%) |
Housing Structure by Heating Type in Walkerville
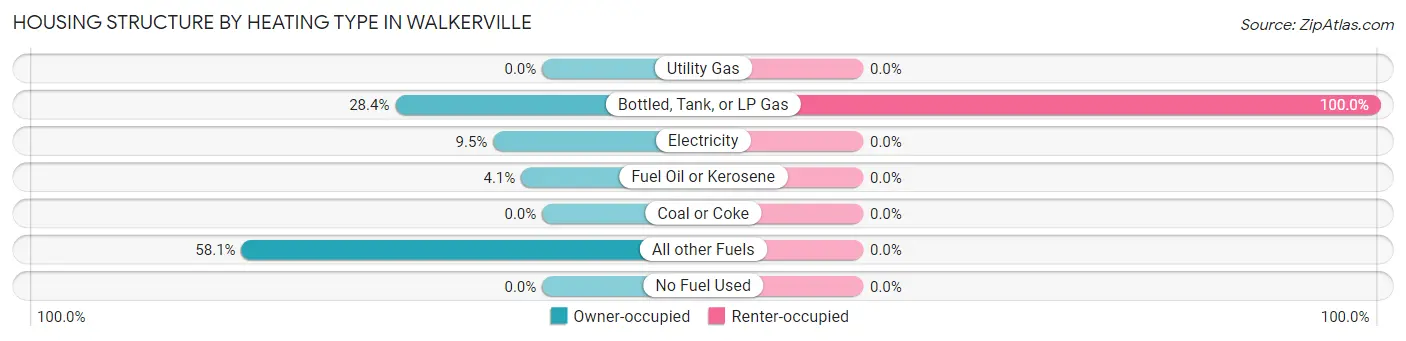
| Heating Type | Owner-occupied | Renter-occupied |
| Utility Gas | 0 (0.0%) | 0 (0.0%) |
| Bottled, Tank, or LP Gas | 21 (28.4%) | 1 (100.0%) |
| Electricity | 7 (9.5%) | 0 (0.0%) |
| Fuel Oil or Kerosene | 3 (4.1%) | 0 (0.0%) |
| Coal or Coke | 0 (0.0%) | 0 (0.0%) |
| All other Fuels | 43 (58.1%) | 0 (0.0%) |
| No Fuel Used | 0 (0.0%) | 0 (0.0%) |
| Total | 74 (100.0%) | 1 (100.0%) |
Household Vehicle Usage in Walkerville
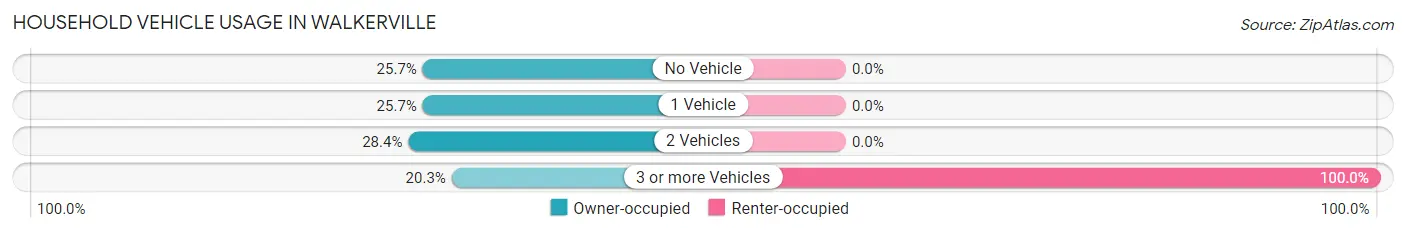
| Vehicles per Household | Owner-occupied | Renter-occupied |
| No Vehicle | 19 (25.7%) | 0 (0.0%) |
| 1 Vehicle | 19 (25.7%) | 0 (0.0%) |
| 2 Vehicles | 21 (28.4%) | 0 (0.0%) |
| 3 or more Vehicles | 15 (20.3%) | 1 (100.0%) |
| Total | 74 (100.0%) | 1 (100.0%) |
Real Estate & Mortgages in Walkerville
Real Estate and Mortgage Overview in Walkerville
| Characteristic | Without Mortgage | With Mortgage |
| Housing Units | 48 | 26 |
| Median Property Value | $52,000 | $93,800 |
| Median Household Income | $30,938 | $2 |
| Monthly Housing Costs | $290 | $0 |
| Real Estate Taxes | $850 | $0 |
Property Value by Mortgage Status in Walkerville
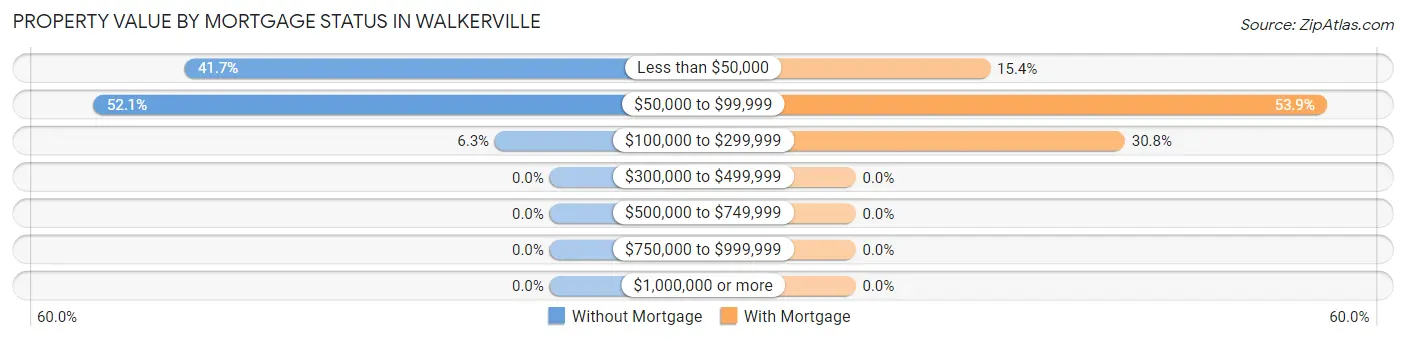
| Property Value | Without Mortgage | With Mortgage |
| Less than $50,000 | 20 (41.7%) | 4 (15.4%) |
| $50,000 to $99,999 | 25 (52.1%) | 14 (53.8%) |
| $100,000 to $299,999 | 3 (6.2%) | 8 (30.8%) |
| $300,000 to $499,999 | 0 (0.0%) | 0 (0.0%) |
| $500,000 to $749,999 | 0 (0.0%) | 0 (0.0%) |
| $750,000 to $999,999 | 0 (0.0%) | 0 (0.0%) |
| $1,000,000 or more | 0 (0.0%) | 0 (0.0%) |
| Total | 48 (100.0%) | 26 (100.0%) |
Household Income by Mortgage Status in Walkerville
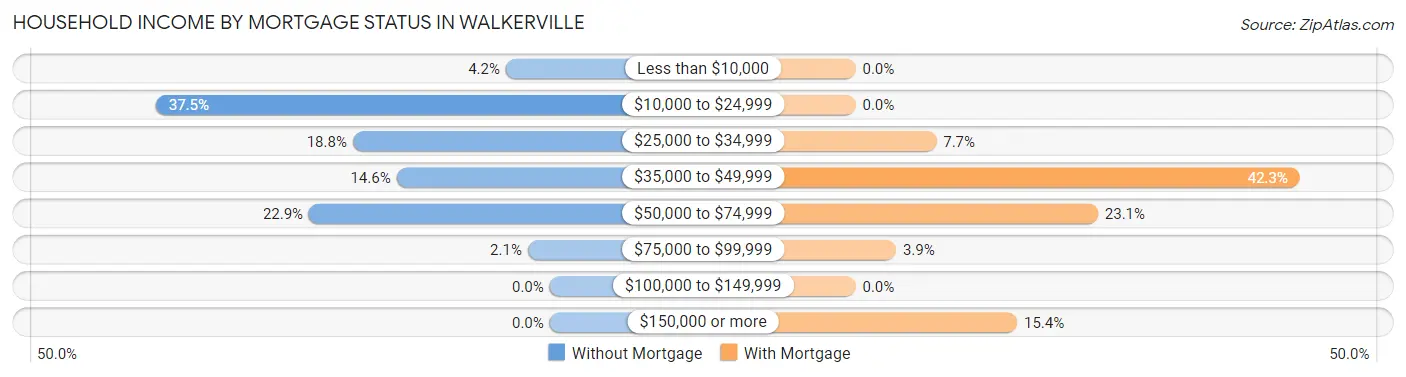
| Household Income | Without Mortgage | With Mortgage |
| Less than $10,000 | 2 (4.2%) | 0 (0.0%) |
| $10,000 to $24,999 | 18 (37.5%) | 0 (0.0%) |
| $25,000 to $34,999 | 9 (18.8%) | 2 (7.7%) |
| $35,000 to $49,999 | 7 (14.6%) | 11 (42.3%) |
| $50,000 to $74,999 | 11 (22.9%) | 6 (23.1%) |
| $75,000 to $99,999 | 1 (2.1%) | 1 (3.8%) |
| $100,000 to $149,999 | 0 (0.0%) | 0 (0.0%) |
| $150,000 or more | 0 (0.0%) | 4 (15.4%) |
| Total | 48 (100.0%) | 26 (100.0%) |
Property Value to Household Income Ratio in Walkerville
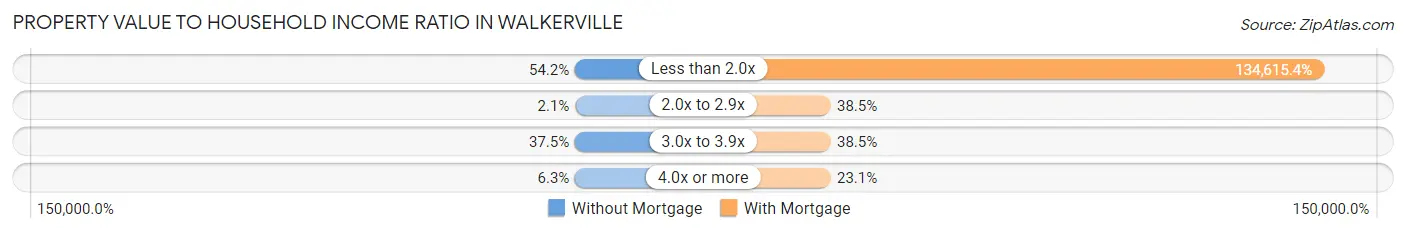
| Value-to-Income Ratio | Without Mortgage | With Mortgage |
| Less than 2.0x | 26 (54.2%) | 35,000 (134,615.4%) |
| 2.0x to 2.9x | 1 (2.1%) | 10 (38.5%) |
| 3.0x to 3.9x | 18 (37.5%) | 10 (38.5%) |
| 4.0x or more | 3 (6.2%) | 6 (23.1%) |
| Total | 48 (100.0%) | 26 (100.0%) |
Real Estate Taxes by Mortgage Status in Walkerville
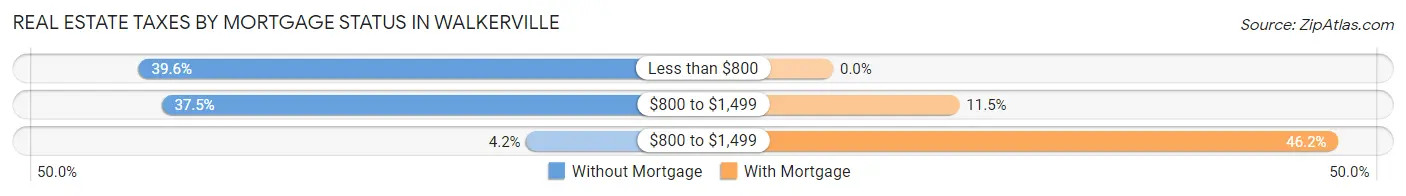
| Property Taxes | Without Mortgage | With Mortgage |
| Less than $800 | 19 (39.6%) | 0 (0.0%) |
| $800 to $1,499 | 18 (37.5%) | 3 (11.5%) |
| $800 to $1,499 | 2 (4.2%) | 12 (46.2%) |
| Total | 48 (100.0%) | 26 (100.0%) |
Health & Disability in Walkerville
Health Insurance Coverage by Age in Walkerville
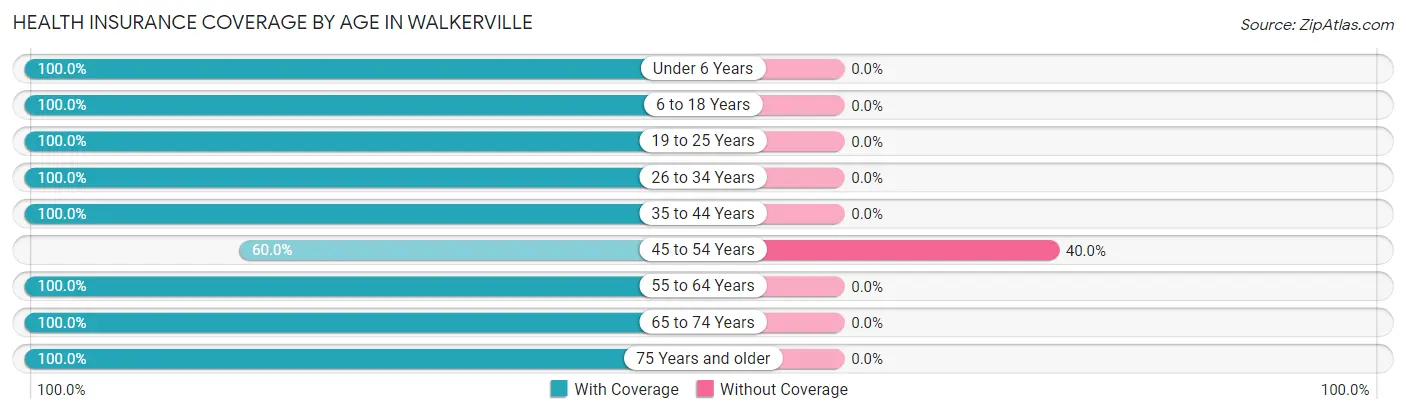
| Age Bracket | With Coverage | Without Coverage |
| Under 6 Years | 18 (100.0%) | 0 (0.0%) |
| 6 to 18 Years | 56 (100.0%) | 0 (0.0%) |
| 19 to 25 Years | 14 (100.0%) | 0 (0.0%) |
| 26 to 34 Years | 14 (100.0%) | 0 (0.0%) |
| 35 to 44 Years | 23 (100.0%) | 0 (0.0%) |
| 45 to 54 Years | 18 (60.0%) | 12 (40.0%) |
| 55 to 64 Years | 40 (100.0%) | 0 (0.0%) |
| 65 to 74 Years | 10 (100.0%) | 0 (0.0%) |
| 75 Years and older | 7 (100.0%) | 0 (0.0%) |
| Total | 200 (94.3%) | 12 (5.7%) |
Health Insurance Coverage by Citizenship Status in Walkerville

| Citizenship Status | With Coverage | Without Coverage |
| Native Born | 18 (100.0%) | 0 (0.0%) |
| Foreign Born, Citizen | 56 (100.0%) | 0 (0.0%) |
| Foreign Born, not a Citizen | 14 (100.0%) | 0 (0.0%) |
Health Insurance Coverage by Household Income in Walkerville
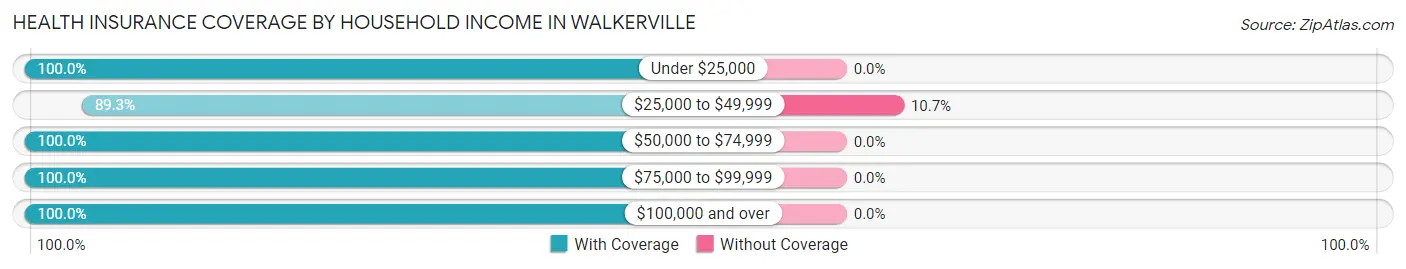
| Household Income | With Coverage | Without Coverage |
| Under $25,000 | 28 (100.0%) | 0 (0.0%) |
| $25,000 to $49,999 | 100 (89.3%) | 12 (10.7%) |
| $50,000 to $74,999 | 47 (100.0%) | 0 (0.0%) |
| $75,000 to $99,999 | 4 (100.0%) | 0 (0.0%) |
| $100,000 and over | 21 (100.0%) | 0 (0.0%) |
Public vs Private Health Insurance Coverage by Age in Walkerville
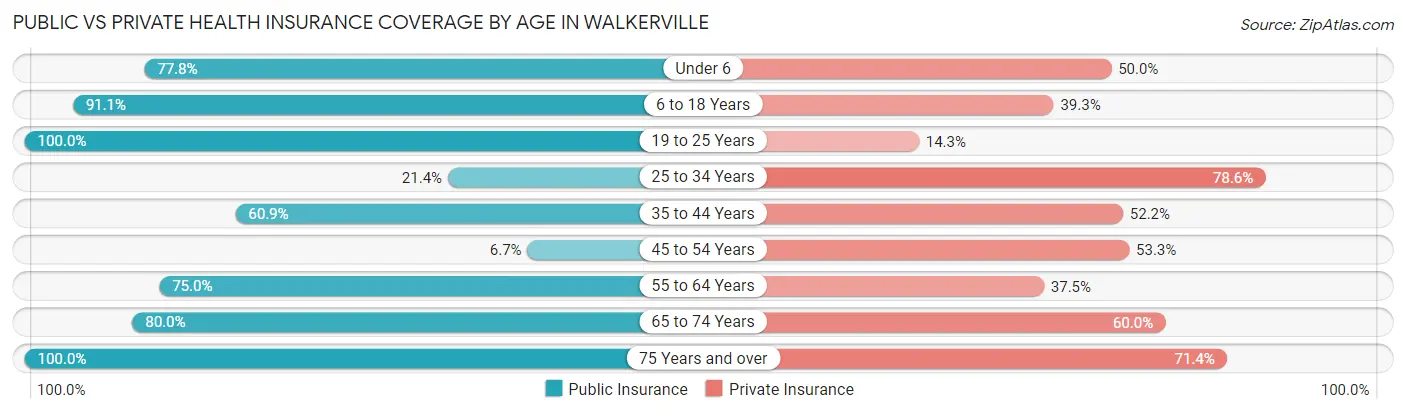
| Age Bracket | Public Insurance | Private Insurance |
| Under 6 | 14 (77.8%) | 9 (50.0%) |
| 6 to 18 Years | 51 (91.1%) | 22 (39.3%) |
| 19 to 25 Years | 14 (100.0%) | 2 (14.3%) |
| 25 to 34 Years | 3 (21.4%) | 11 (78.6%) |
| 35 to 44 Years | 14 (60.9%) | 12 (52.2%) |
| 45 to 54 Years | 2 (6.7%) | 16 (53.3%) |
| 55 to 64 Years | 30 (75.0%) | 15 (37.5%) |
| 65 to 74 Years | 8 (80.0%) | 6 (60.0%) |
| 75 Years and over | 7 (100.0%) | 5 (71.4%) |
| Total | 143 (67.4%) | 98 (46.2%) |
Disability Status by Sex by Age in Walkerville
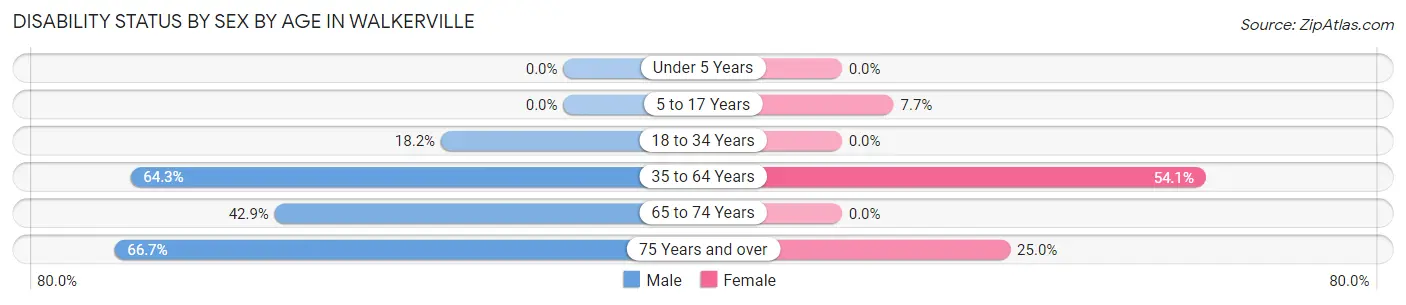
| Age Bracket | Male | Female |
| Under 5 Years | 0 (0.0%) | 0 (0.0%) |
| 5 to 17 Years | 0 (0.0%) | 3 (7.7%) |
| 18 to 34 Years | 2 (18.2%) | 0 (0.0%) |
| 35 to 64 Years | 36 (64.3%) | 20 (54.0%) |
| 65 to 74 Years | 3 (42.9%) | 0 (0.0%) |
| 75 Years and over | 2 (66.7%) | 1 (25.0%) |
Disability Class by Sex by Age in Walkerville
Disability Class: Hearing Difficulty
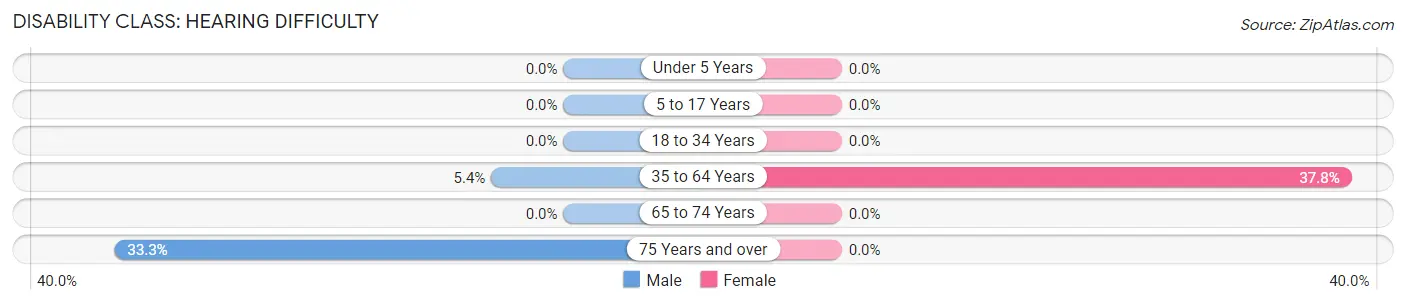
| Age Bracket | Male | Female |
| Under 5 Years | 0 (0.0%) | 0 (0.0%) |
| 5 to 17 Years | 0 (0.0%) | 0 (0.0%) |
| 18 to 34 Years | 0 (0.0%) | 0 (0.0%) |
| 35 to 64 Years | 3 (5.4%) | 14 (37.8%) |
| 65 to 74 Years | 0 (0.0%) | 0 (0.0%) |
| 75 Years and over | 1 (33.3%) | 0 (0.0%) |
Disability Class: Vision Difficulty
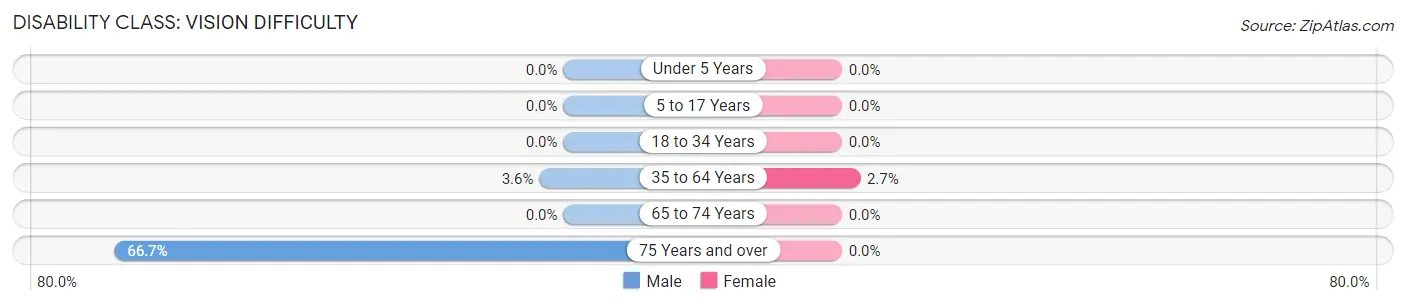
| Age Bracket | Male | Female |
| Under 5 Years | 0 (0.0%) | 0 (0.0%) |
| 5 to 17 Years | 0 (0.0%) | 0 (0.0%) |
| 18 to 34 Years | 0 (0.0%) | 0 (0.0%) |
| 35 to 64 Years | 2 (3.6%) | 1 (2.7%) |
| 65 to 74 Years | 0 (0.0%) | 0 (0.0%) |
| 75 Years and over | 2 (66.7%) | 0 (0.0%) |
Disability Class: Cognitive Difficulty
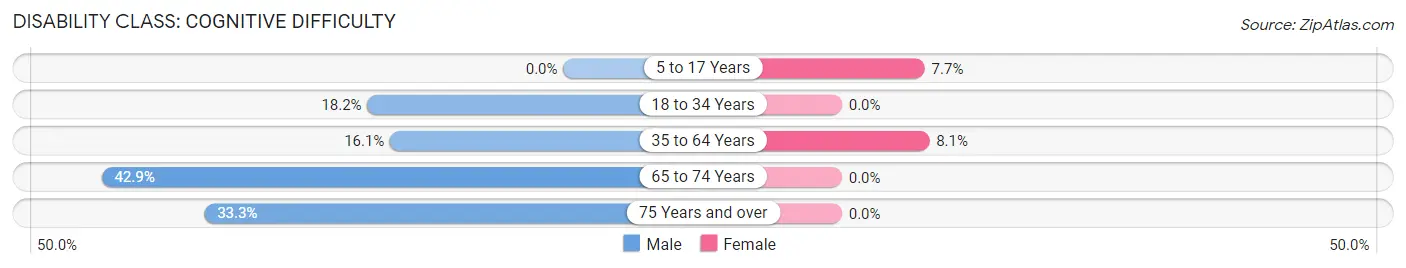
| Age Bracket | Male | Female |
| 5 to 17 Years | 0 (0.0%) | 3 (7.7%) |
| 18 to 34 Years | 2 (18.2%) | 0 (0.0%) |
| 35 to 64 Years | 9 (16.1%) | 3 (8.1%) |
| 65 to 74 Years | 3 (42.9%) | 0 (0.0%) |
| 75 Years and over | 1 (33.3%) | 0 (0.0%) |
Disability Class: Ambulatory Difficulty
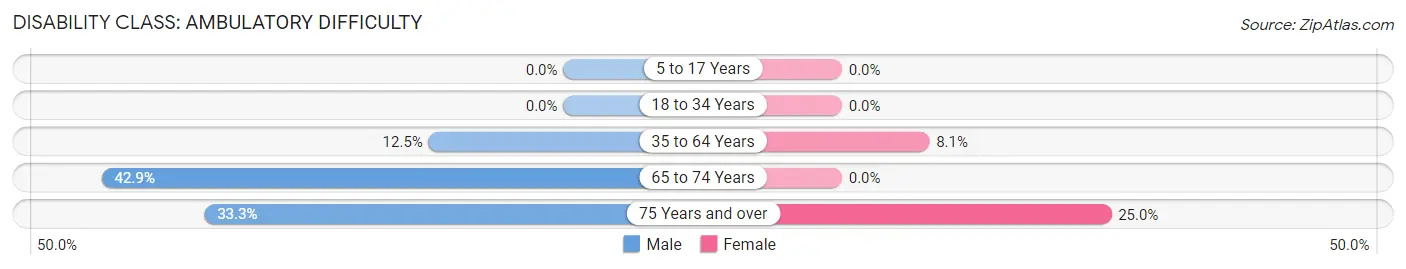
| Age Bracket | Male | Female |
| 5 to 17 Years | 0 (0.0%) | 0 (0.0%) |
| 18 to 34 Years | 0 (0.0%) | 0 (0.0%) |
| 35 to 64 Years | 7 (12.5%) | 3 (8.1%) |
| 65 to 74 Years | 3 (42.9%) | 0 (0.0%) |
| 75 Years and over | 1 (33.3%) | 1 (25.0%) |
Disability Class: Self-Care Difficulty
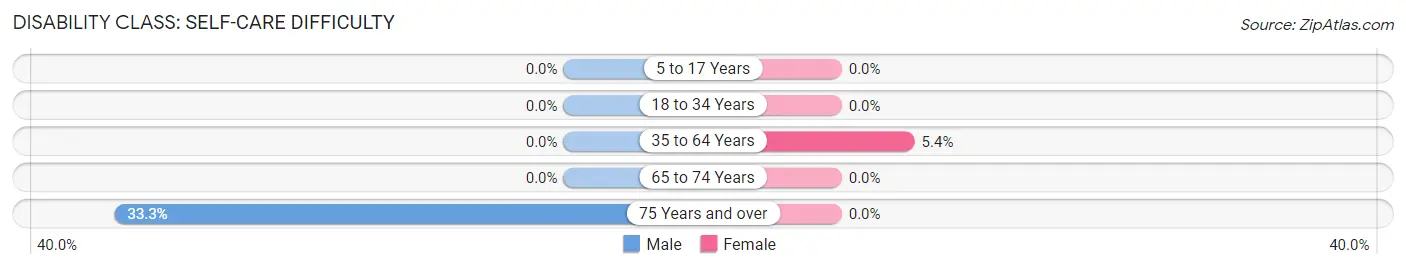
| Age Bracket | Male | Female |
| 5 to 17 Years | 0 (0.0%) | 0 (0.0%) |
| 18 to 34 Years | 0 (0.0%) | 0 (0.0%) |
| 35 to 64 Years | 0 (0.0%) | 2 (5.4%) |
| 65 to 74 Years | 0 (0.0%) | 0 (0.0%) |
| 75 Years and over | 1 (33.3%) | 0 (0.0%) |
Technology Access in Walkerville
Computing Device Access in Walkerville
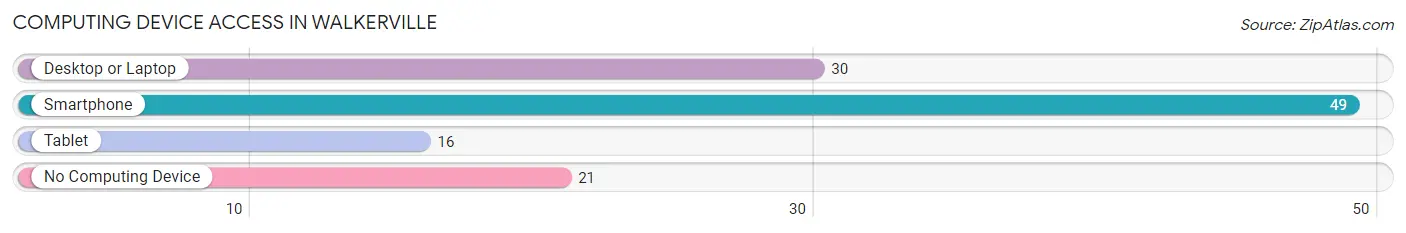
| Device Type | # Households | % Households |
| Desktop or Laptop | 30 | 40.0% |
| Smartphone | 49 | 65.3% |
| Tablet | 16 | 21.3% |
| No Computing Device | 21 | 28.0% |
| Total | 75 | 100.0% |
Internet Access in Walkerville
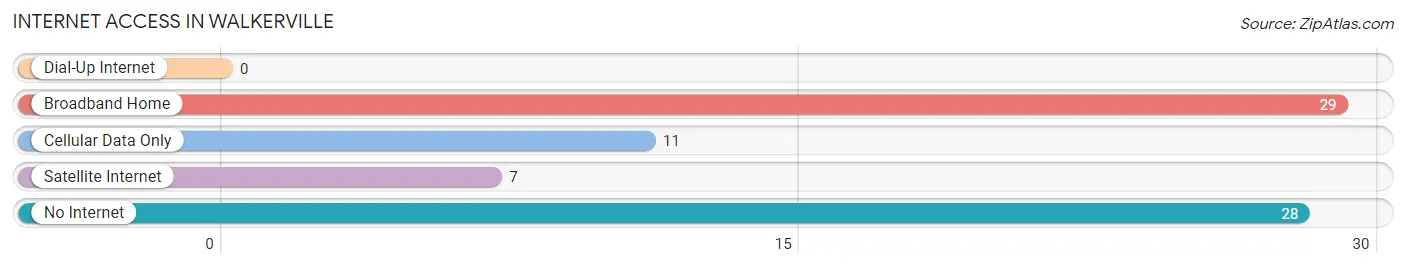
| Internet Type | # Households | % Households |
| Dial-Up Internet | 0 | 0.0% |
| Broadband Home | 29 | 38.7% |
| Cellular Data Only | 11 | 14.7% |
| Satellite Internet | 7 | 9.3% |
| No Internet | 28 | 37.3% |
| Total | 75 | 100.0% |
Walkerville Summary
History
Walkerville is a small town located in the state of Michigan, United States. It is situated in the northern part of the state, in the county of Oceana. The town was founded in 1871 by a group of settlers from the nearby town of Hart. The settlers were looking for a place to settle and start a new life, and they chose the area that is now known as Walkerville.
The town was named after the first settler, William Walker, who was a veteran of the Civil War. He was a farmer and a blacksmith, and he was the first to build a home in the area. The town grew slowly over the years, and by the early 1900s, it had become a thriving community.
The town was known for its lumber industry, and it was home to several sawmills and lumber yards. The town also had a thriving agricultural industry, and it was home to several farms and orchards. The town was also known for its brickyards, which produced bricks for the construction of homes and businesses.
The town was also home to several churches, including the First Presbyterian Church, which was founded in 1872. The town also had a school, which was built in 1876.
Geography
Walkerville is located in the northern part of Michigan, in the county of Oceana. It is situated on the shores of Lake Michigan, and it is bordered by the towns of Hart and Pentwater. The town is located about 25 miles from the city of Muskegon.
The town has a total area of 2.2 square miles, all of which is land. The town is located at an elevation of 645 feet above sea level. The town has a humid continental climate, with cold winters and warm summers.
Economy
The economy of Walkerville is largely based on agriculture and tourism. The town is home to several farms and orchards, which produce a variety of fruits and vegetables. The town is also home to several wineries, which produce a variety of wines.
The town is also home to several tourist attractions, including the Walkerville Lighthouse, which was built in 1873. The town is also home to several restaurants, shops, and other businesses.
Demographics
As of the 2010 census, the population of Walkerville was 1,845. The town has a population density of 830 people per square mile. The median age of the population is 43.7 years, and the median household income is $41,944.
The town is predominantly white, with 92.3% of the population being white. The town also has a small Hispanic population, with 4.2% of the population being Hispanic. The town also has a small African American population, with 1.2% of the population being African American.
Conclusion
Walkerville is a small town located in the northern part of Michigan. It was founded in 1871 by a group of settlers from the nearby town of Hart. The town has a population of 1,845, and it is predominantly white. The town is known for its lumber industry, agricultural industry, and brickyards. The town is also home to several tourist attractions, restaurants, and other businesses. The town has a humid continental climate, with cold winters and warm summers.
Common Questions
What is Per Capita Income in Walkerville?
Per Capita income in Walkerville is $15,622.
What is the Median Family Income in Walkerville?
Median Family Income in Walkerville is $33,958.
What is the Median Household income in Walkerville?
Median Household Income in Walkerville is $31,625.
What is Income or Wage Gap in Walkerville?
Income or Wage Gap in Walkerville is 68.2%.
Women in Walkerville earn 31.8 cents for every dollar earned by a man.
What is Inequality or Gini Index in Walkerville?
Inequality or Gini Index in Walkerville is 0.39.
What is the Total Population of Walkerville?
Total Population of Walkerville is 212.
What is the Total Male Population of Walkerville?
Total Male Population of Walkerville is 105.
What is the Total Female Population of Walkerville?
Total Female Population of Walkerville is 107.
What is the Ratio of Males per 100 Females in Walkerville?
There are 98.13 Males per 100 Females in Walkerville.
What is the Ratio of Females per 100 Males in Walkerville?
There are 101.90 Females per 100 Males in Walkerville.
What is the Median Population Age in Walkerville?
Median Population Age in Walkerville is 37.1 Years.
What is the Average Family Size in Walkerville
Average Family Size in Walkerville is 3.7 People.
What is the Average Household Size in Walkerville
Average Household Size in Walkerville is 2.8 People.
How Large is the Labor Force in Walkerville?
There are 75 People in the Labor Forcein in Walkerville.
What is the Percentage of People in the Labor Force in Walkerville?
53.2% of People are in the Labor Force in Walkerville.