Zip Codes with the Highest Percentage of Population Employed in Computer & Mathematics in Berrien Springs, MI
RELATED REPORTS & OPTIONS
Computer & Mathematics
Berrien Springs
Compare Zip Codes
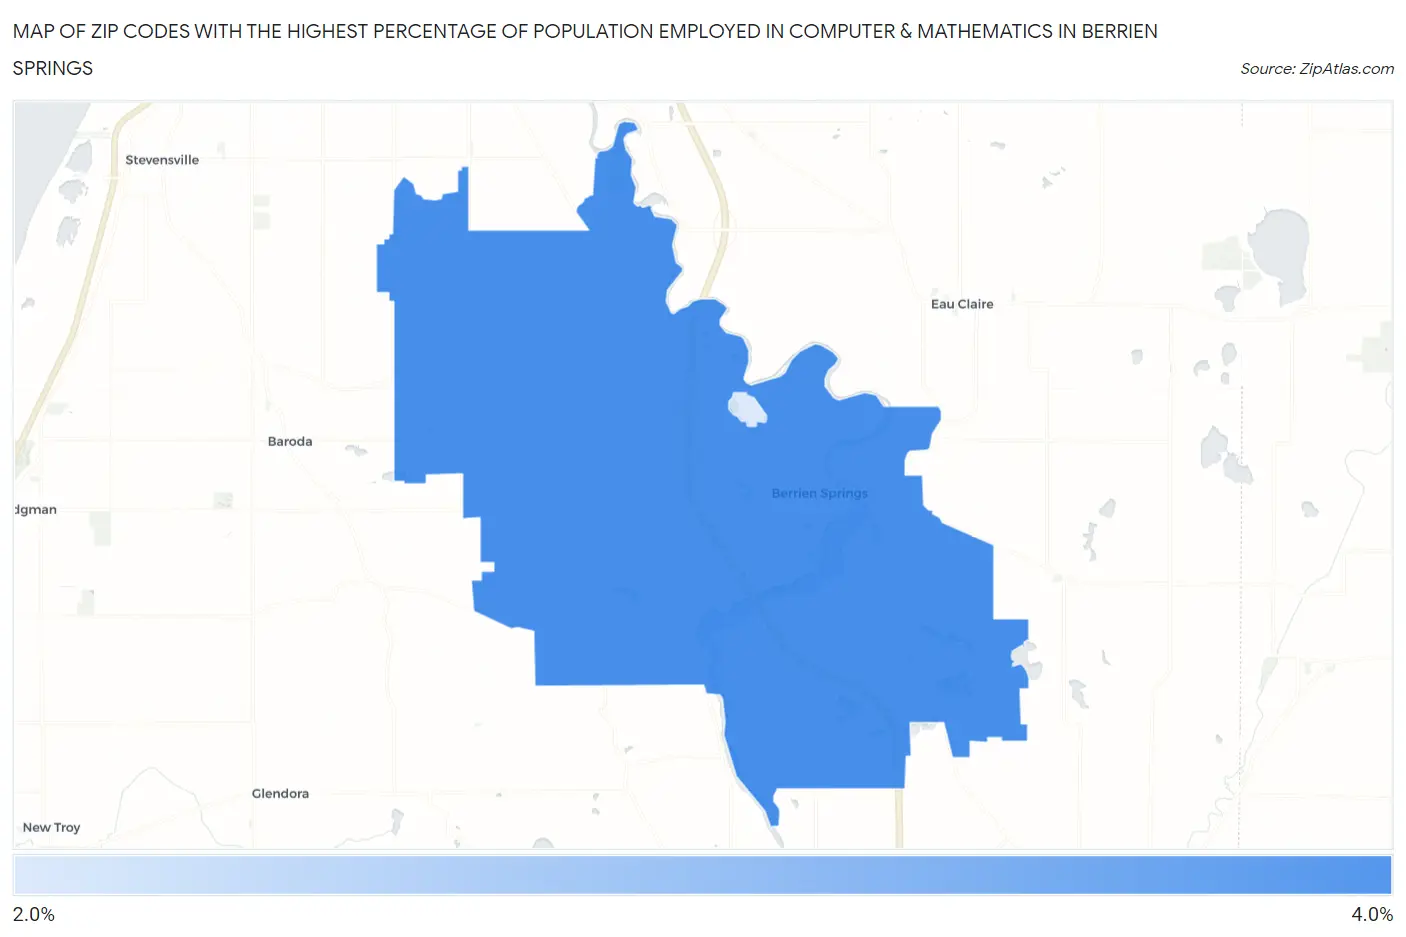
Map of Zip Codes with the Highest Percentage of Population Employed in Computer & Mathematics in Berrien Springs
2.3%
3.1%
Zip Codes with the Highest Percentage of Population Employed in Computer & Mathematics in Berrien Springs, MI
| Zip Code | % Employed | vs State | vs National | |
| 1. | 49103 | 3.1% | 2.9%(+0.131)#198 | 3.5%(-0.468)#7,540 |
| 2. | 49104 | 2.3% | 2.9%(-0.635)#319 | 3.5%(-1.23)#10,502 |
1
Common Questions
What are the Top Zip Codes with the Highest Percentage of Population Employed in Computer & Mathematics in Berrien Springs, MI?
Top Zip Codes with the Highest Percentage of Population Employed in Computer & Mathematics in Berrien Springs, MI are:
What zip code has the Highest Percentage of Population Employed in Computer & Mathematics in Berrien Springs, MI?
49103 has the Highest Percentage of Population Employed in Computer & Mathematics in Berrien Springs, MI with 3.1%.
What is the Percentage of Population Employed in Computer & Mathematics in Berrien Springs, MI?
Percentage of Population Employed in Computer & Mathematics in Berrien Springs is 2.7%.
What is the Percentage of Population Employed in Computer & Mathematics in Michigan?
Percentage of Population Employed in Computer & Mathematics in Michigan is 2.9%.
What is the Percentage of Population Employed in Computer & Mathematics in the United States?
Percentage of Population Employed in Computer & Mathematics in the United States is 3.5%.