Zip Codes with the Highest Percentage of Population Employed in Computer & Mathematics in Michigan
RELATED REPORTS & OPTIONS
Computer & Mathematics
Michigan
Compare Zip Codes
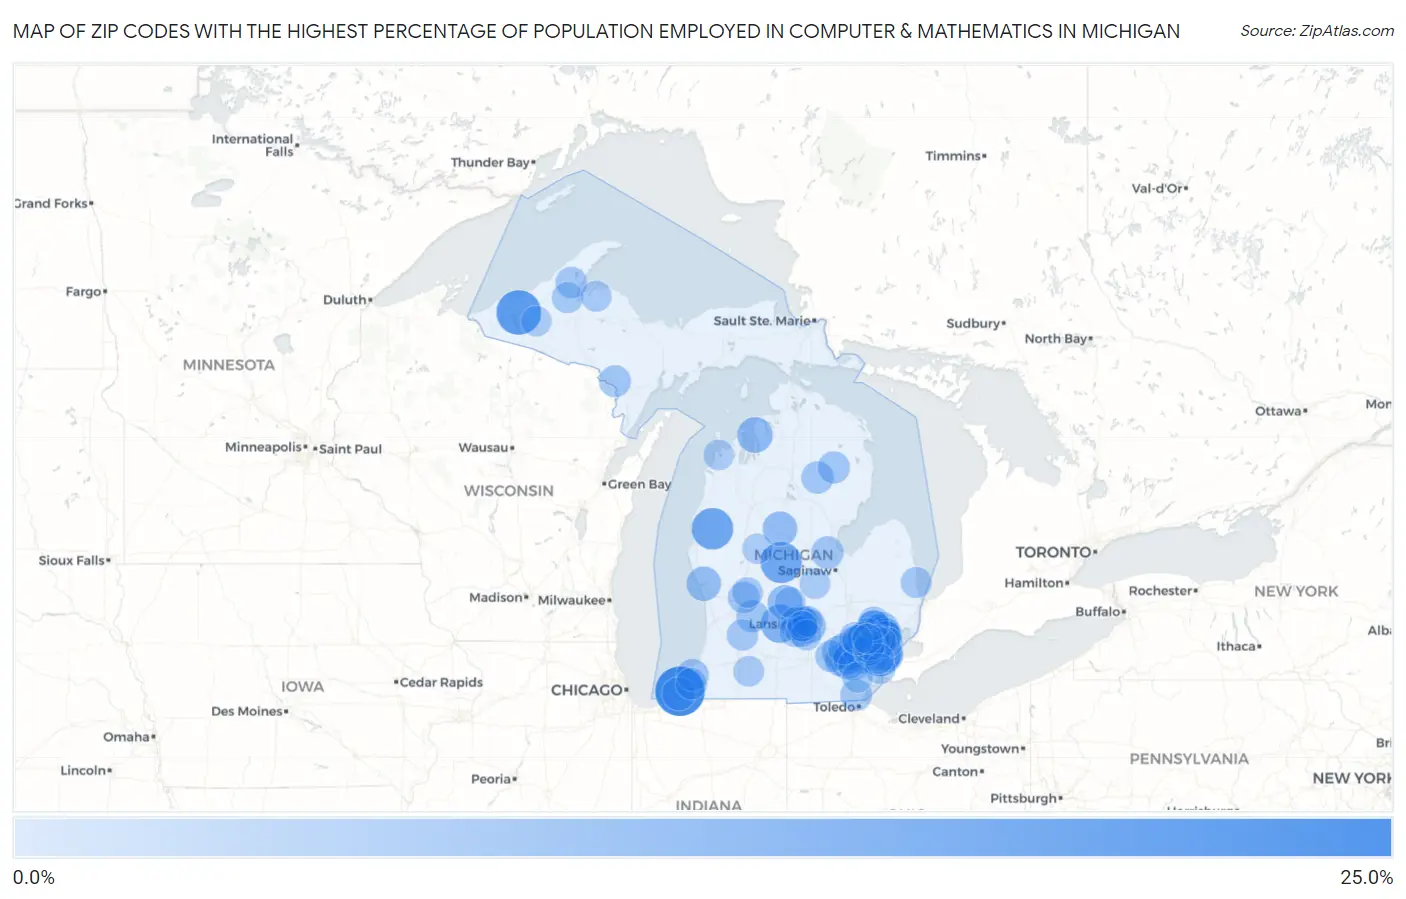
Map of Zip Codes with the Highest Percentage of Population Employed in Computer & Mathematics in Michigan
0.0%
25.0%
Zip Codes with the Highest Percentage of Population Employed in Computer & Mathematics in Michigan
| Zip Code | % Employed | vs State | vs National | |
| 1. | 49116 | 23.1% | 2.9%(+20.2)#1 | 3.5%(+19.6)#95 |
| 2. | 49910 | 18.2% | 2.9%(+15.3)#2 | 3.5%(+14.7)#171 |
| 3. | 48335 | 16.4% | 2.9%(+13.5)#3 | 3.5%(+12.9)#202 |
| 4. | 49458 | 15.0% | 2.9%(+12.1)#4 | 3.5%(+11.5)#255 |
| 5. | 48896 | 14.8% | 2.9%(+11.8)#5 | 3.5%(+11.2)#267 |
| 6. | 48120 | 13.8% | 2.9%(+10.9)#6 | 3.5%(+10.3)#318 |
| 7. | 48084 | 13.1% | 2.9%(+10.1)#7 | 3.5%(+9.53)#359 |
| 8. | 48861 | 11.8% | 2.9%(+8.90)#8 | 3.5%(+8.30)#460 |
| 9. | 48374 | 10.2% | 2.9%(+7.26)#9 | 3.5%(+6.66)#676 |
| 10. | 48933 | 10.1% | 2.9%(+7.17)#10 | 3.5%(+6.57)#694 |
| 11. | 48083 | 9.8% | 2.9%(+6.84)#11 | 3.5%(+6.24)#745 |
| 12. | 48326 | 9.3% | 2.9%(+6.35)#12 | 3.5%(+5.75)#841 |
| 13. | 49627 | 9.2% | 2.9%(+6.26)#13 | 3.5%(+5.66)#859 |
| 14. | 48069 | 8.9% | 2.9%(+5.98)#14 | 3.5%(+5.38)#924 |
| 15. | 48873 | 8.5% | 2.9%(+5.59)#15 | 3.5%(+4.99)#1,050 |
| 16. | 48098 | 8.5% | 2.9%(+5.53)#16 | 3.5%(+4.93)#1,067 |
| 17. | 48633 | 8.3% | 2.9%(+5.41)#17 | 3.5%(+4.81)#1,107 |
| 18. | 48375 | 8.3% | 2.9%(+5.38)#18 | 3.5%(+4.79)#1,116 |
| 19. | 48085 | 8.2% | 2.9%(+5.28)#19 | 3.5%(+4.68)#1,147 |
| 20. | 49440 | 8.2% | 2.9%(+5.26)#20 | 3.5%(+4.66)#1,154 |
| 21. | 48864 | 8.0% | 2.9%(+5.09)#21 | 3.5%(+4.49)#1,204 |
| 22. | 48226 | 7.8% | 2.9%(+4.92)#22 | 3.5%(+4.32)#1,260 |
| 23. | 48167 | 7.6% | 2.9%(+4.63)#23 | 3.5%(+4.03)#1,368 |
| 24. | 48377 | 7.5% | 2.9%(+4.57)#24 | 3.5%(+3.97)#1,389 |
| 25. | 48017 | 7.4% | 2.9%(+4.50)#25 | 3.5%(+3.91)#1,415 |
| 26. | 48130 | 7.2% | 2.9%(+4.29)#26 | 3.5%(+3.69)#1,500 |
| 27. | 49129 | 7.2% | 2.9%(+4.27)#27 | 3.5%(+3.67)#1,513 |
| 28. | 48108 | 7.2% | 2.9%(+4.24)#28 | 3.5%(+3.64)#1,530 |
| 29. | 48917 | 7.1% | 2.9%(+4.15)#29 | 3.5%(+3.55)#1,583 |
| 30. | 48307 | 7.0% | 2.9%(+4.12)#30 | 3.5%(+3.52)#1,595 |
| 31. | 48331 | 6.9% | 2.9%(+3.97)#31 | 3.5%(+3.37)#1,683 |
| 32. | 48103 | 6.8% | 2.9%(+3.91)#32 | 3.5%(+3.31)#1,718 |
| 33. | 48301 | 6.8% | 2.9%(+3.85)#33 | 3.5%(+3.26)#1,745 |
| 34. | 48201 | 6.6% | 2.9%(+3.63)#34 | 3.5%(+3.03)#1,886 |
| 35. | 48334 | 6.4% | 2.9%(+3.51)#35 | 3.5%(+2.91)#1,980 |
| 36. | 48611 | 6.3% | 2.9%(+3.40)#36 | 3.5%(+2.80)#2,055 |
| 37. | 48188 | 6.3% | 2.9%(+3.39)#37 | 3.5%(+2.79)#2,062 |
| 38. | 48636 | 6.2% | 2.9%(+3.27)#38 | 3.5%(+2.67)#2,145 |
| 39. | 49302 | 6.1% | 2.9%(+3.18)#39 | 3.5%(+2.58)#2,221 |
| 40. | 48187 | 6.1% | 2.9%(+3.18)#40 | 3.5%(+2.58)#2,222 |
| 41. | 48105 | 6.1% | 2.9%(+3.18)#41 | 3.5%(+2.58)#2,224 |
| 42. | 48621 | 6.0% | 2.9%(+3.11)#42 | 3.5%(+2.51)#2,287 |
| 43. | 49085 | 6.0% | 2.9%(+3.09)#43 | 3.5%(+2.49)#2,303 |
| 44. | 48220 | 5.9% | 2.9%(+3.02)#44 | 3.5%(+2.42)#2,364 |
| 45. | 49852 | 5.8% | 2.9%(+2.84)#45 | 3.5%(+2.24)#2,524 |
| 46. | 48177 | 5.8% | 2.9%(+2.83)#46 | 3.5%(+2.23)#2,533 |
| 47. | 48309 | 5.7% | 2.9%(+2.76)#47 | 3.5%(+2.16)#2,600 |
| 48. | 48118 | 5.7% | 2.9%(+2.76)#48 | 3.5%(+2.16)#2,605 |
| 49. | 49306 | 5.7% | 2.9%(+2.75)#49 | 3.5%(+2.15)#2,610 |
| 50. | 48360 | 5.5% | 2.9%(+2.59)#50 | 3.5%(+1.99)#2,774 |
| 51. | 48168 | 5.5% | 2.9%(+2.57)#51 | 3.5%(+1.97)#2,793 |
| 52. | 48165 | 5.4% | 2.9%(+2.52)#52 | 3.5%(+1.92)#2,844 |
| 53. | 49101 | 5.4% | 2.9%(+2.50)#53 | 3.5%(+1.90)#2,860 |
| 54. | 48072 | 5.4% | 2.9%(+2.50)#54 | 3.5%(+1.90)#2,873 |
| 55. | 48821 | 5.4% | 2.9%(+2.44)#55 | 3.5%(+1.84)#2,935 |
| 56. | 48033 | 5.3% | 2.9%(+2.38)#56 | 3.5%(+1.78)#2,996 |
| 57. | 49344 | 5.3% | 2.9%(+2.36)#57 | 3.5%(+1.76)#3,019 |
| 58. | 48073 | 5.3% | 2.9%(+2.36)#58 | 3.5%(+1.76)#3,021 |
| 59. | 49916 | 5.3% | 2.9%(+2.35)#59 | 3.5%(+1.75)#3,040 |
| 60. | 48071 | 5.2% | 2.9%(+2.31)#60 | 3.5%(+1.71)#3,083 |
| 61. | 48170 | 5.2% | 2.9%(+2.30)#61 | 3.5%(+1.70)#3,091 |
| 62. | 48842 | 5.1% | 2.9%(+2.20)#62 | 3.5%(+1.60)#3,201 |
| 63. | 48104 | 5.1% | 2.9%(+2.18)#63 | 3.5%(+1.58)#3,227 |
| 64. | 48912 | 5.1% | 2.9%(+2.15)#64 | 3.5%(+1.55)#3,267 |
| 65. | 48237 | 5.1% | 2.9%(+2.14)#65 | 3.5%(+1.54)#3,279 |
| 66. | 48324 | 5.1% | 2.9%(+2.13)#66 | 3.5%(+1.53)#3,290 |
| 67. | 48076 | 5.0% | 2.9%(+2.12)#67 | 3.5%(+1.52)#3,308 |
| 68. | 48128 | 5.0% | 2.9%(+2.10)#68 | 3.5%(+1.50)#3,332 |
| 69. | 49958 | 5.0% | 2.9%(+2.09)#69 | 3.5%(+1.49)#3,335 |
| 70. | 48189 | 5.0% | 2.9%(+2.07)#70 | 3.5%(+1.47)#3,363 |
| 71. | 48197 | 4.9% | 2.9%(+1.99)#71 | 3.5%(+1.39)#3,484 |
| 72. | 48450 | 4.9% | 2.9%(+1.94)#72 | 3.5%(+1.34)#3,548 |
| 73. | 48150 | 4.9% | 2.9%(+1.94)#73 | 3.5%(+1.34)#3,549 |
| 74. | 48314 | 4.9% | 2.9%(+1.93)#74 | 3.5%(+1.33)#3,567 |
| 75. | 48154 | 4.8% | 2.9%(+1.92)#75 | 3.5%(+1.32)#3,575 |
| 76. | 49962 | 4.8% | 2.9%(+1.84)#76 | 3.5%(+1.24)#3,697 |
| 77. | 48381 | 4.7% | 2.9%(+1.82)#77 | 3.5%(+1.22)#3,723 |
| 78. | 48310 | 4.7% | 2.9%(+1.81)#78 | 3.5%(+1.21)#3,736 |
| 79. | 48015 | 4.7% | 2.9%(+1.78)#79 | 3.5%(+1.18)#3,793 |
| 80. | 48823 | 4.7% | 2.9%(+1.76)#80 | 3.5%(+1.16)#3,808 |
| 81. | 48835 | 4.6% | 2.9%(+1.71)#81 | 3.5%(+1.11)#3,885 |
| 82. | 49341 | 4.6% | 2.9%(+1.69)#82 | 3.5%(+1.09)#3,921 |
| 83. | 48025 | 4.6% | 2.9%(+1.69)#83 | 3.5%(+1.09)#3,929 |
| 84. | 49097 | 4.6% | 2.9%(+1.68)#84 | 3.5%(+1.08)#3,937 |
| 85. | 48390 | 4.6% | 2.9%(+1.64)#85 | 3.5%(+1.04)#3,996 |
| 86. | 48067 | 4.5% | 2.9%(+1.58)#86 | 3.5%(+0.986)#4,062 |
| 87. | 49636 | 4.5% | 2.9%(+1.53)#87 | 3.5%(+0.931)#4,167 |
| 88. | 48854 | 4.4% | 2.9%(+1.52)#88 | 3.5%(+0.924)#4,180 |
| 89. | 48910 | 4.4% | 2.9%(+1.51)#89 | 3.5%(+0.911)#4,211 |
| 90. | 48152 | 4.4% | 2.9%(+1.50)#90 | 3.5%(+0.904)#4,222 |
| 91. | 48614 | 4.4% | 2.9%(+1.50)#91 | 3.5%(+0.900)#4,231 |
| 92. | 48336 | 4.4% | 2.9%(+1.50)#92 | 3.5%(+0.898)#4,233 |
| 93. | 49912 | 4.4% | 2.9%(+1.50)#93 | 3.5%(+0.897)#4,235 |
| 94. | 48359 | 4.4% | 2.9%(+1.44)#94 | 3.5%(+0.837)#4,326 |
| 95. | 48138 | 4.4% | 2.9%(+1.44)#95 | 3.5%(+0.836)#4,329 |
| 96. | 48159 | 4.4% | 2.9%(+1.43)#96 | 3.5%(+0.833)#4,333 |
| 97. | 48122 | 4.3% | 2.9%(+1.42)#97 | 3.5%(+0.819)#4,355 |
| 98. | 48393 | 4.3% | 2.9%(+1.40)#98 | 3.5%(+0.797)#4,389 |
| 99. | 49342 | 4.3% | 2.9%(+1.36)#99 | 3.5%(+0.765)#4,455 |
| 100. | 48322 | 4.3% | 2.9%(+1.35)#100 | 3.5%(+0.751)#4,471 |
Common Questions
What are the Top 10 Zip Codes with the Highest Percentage of Population Employed in Computer & Mathematics in Michigan?
Top 10 Zip Codes with the Highest Percentage of Population Employed in Computer & Mathematics in Michigan are:
What zip code has the Highest Percentage of Population Employed in Computer & Mathematics in Michigan?
49116 has the Highest Percentage of Population Employed in Computer & Mathematics in Michigan with 23.1%.
What is the Percentage of Population Employed in Computer & Mathematics in the State of Michigan?
Percentage of Population Employed in Computer & Mathematics in Michigan is 2.9%.
What is the Percentage of Population Employed in Computer & Mathematics in the United States?
Percentage of Population Employed in Computer & Mathematics in the United States is 3.5%.